Improving Materials Supply Processes to Assembly Lines Through Toyota Production System and Lean Manufacturing - a Case Study at TePe Munhygienprodukter AB A Master’s Thesis By Patrik Östlund Department of Industrial Management and Logistics Division of Engineering Logistics Faculty of Engineering – LTH Lund University 01-06-2020, Lund 2020

Welcome message from author
This document is posted to help you gain knowledge. Please leave a comment to let me know what you think about it! Share it to your friends and learn new things together.
Transcript
Improving Materials Supply Processes to Assembly Lines Through Toyota Production
System and Lean Manufacturing
- a Case Study at TePe Munhygienprodukter AB
A Master’s Thesis
By
Patrik Östlund
Department of Industrial Management and Logistics
Division of Engineering Logistics Faculty of Engineering – LTH
Lund University
01-06-2020, Lund
2020
Abstract
2
Abstract Improving Materials Supply Processes to Assembly Lines Through Toyota Production System and
Lean Manufacturing – a Case Study at TePe Munhygienprodukter AB
Patrik Östlund
Faculty of Engineering, LTH, Lund University, 2020
Supervisor: Professor Andreas Norrman
Purpose – TePe Munhygienprodukter AB (TePe) is moving the production facility designated their
toothbrushes as part of their expansion phase. Not only do they face challenges due to a two-floor
production, but also do they face efficiency and safety challenges in their materials flow. The purpose of this
paper is, therefore, to construct recommendations on improving TePe’s materials supply processes to
assembly lines through Toyota production system (TPS) and Lean manufacturing (Lean).
Design/methodology/approach – A constructive research approach is conducted to develop problem-
solving constructs for TePe in regards to abovementioned challenges. In addition, a dual case study is
conducted to find gaps between TePe’s actual and potential performance. A comprehensive theoretical
framework of TPS/Lean bridges case-specific practice and theory.
Findings – This research has found seven constructs for TePe to mitigate many of the challenges they face,
and improve their overall flow efficiency through TPS/Lean, namely: setup time and batch size reductions,
layout changes, and an implementation of a supermarket, a Kanban system, a 5S initiative and managerial
principles (i.e. Genchi genbutsu, Visual management, Kaizen, 5 Whys and a re-evaluation of strategies). The
company can save 0.74 MSEK yearly in inventory holding costs through a setup time and batch size
reduction with 57 and 50 per cent, respectively. The constructs provide a clean, structured replenishment
system, eliminating the problematic safety hazards altogether. There is also a chain of indirect benefits from
all seven constructs. Therefore, management is vital for building and fostering a new culture of continuous
improvements and employee engagement.
Originality/value – This paper contributes to both academia and practice by applying the constructive
research approach on materials flow, tailored for a manufacturing firm. Moreover, an explicit comparison of
Lean maturity models is conducted, by this paper’s author not found elsewhere, and a new TPS/Lean
maturity model is introduced.
Keywords Lean manufacturing, Toyota production system, Operations management, Flow efficiency,
Continuous improvements, Setup time reduction, Kanban system, Constructive research approach
Paper type Master’s thesis
Improving Materials Supply Processes to Assembly Lines
3
Sammanfattning
Förbättringar av materialförsörjningsprocesser till produktionslinor genom Toyotas
produktionssystem och Lean: En fallstudie hos TePe Munhygienprodukter AB
Patrik Östlund
Lunds tekniska högskola, Lunds universitet, 2020
Handledare: Professor Andreas Norrman
Syfte – TePe Munhygienprodukter AB (TePe) flyttar i nuläget sin produktion av tandborstar som en del av
en expansionsfas. De ser inte bara utmaningar i en ny tvåvåningsanläggning, utan också effektivitets- och
säkerhetsmässiga utmaningar i materialflödena. Syftet med det här examensarbetet är att skapa
rekommendationer som förbättrar TePe:s materialförsörjningsprocesser till produktionslinor genom Toyotas
produktionssystem (TPS) och Lean.
Metodologi – En konstruktiv forskningsmetodologi används för att utveckla problemlösande
rekommendationer gällande ovan nämnda tre utmaningar. En tvåfallsstudie genomförs också för att finna
förbättringspotential i TePe:s nuvarande materialflöden. Ett omfattande teoretiskt ramverk för TPS/Lean
länkar fallspecifik praktik med teori.
Resultat – Detta examensarbete ger sju rekommendationer på hur TePe kan mildra de utmaningar de står
inför, och samtidigt förbättra deras flödeseffektivitet genom TPS/Lean, vilka är: ställtids- och
satsstorleksreduktion, layoutförändringar, och implementering av ett materialtorg, ett kanbansystem, 5S och,
vad denna forskning kallar, ledningsprinciper (i.e. Genchi genbutsu, Kaizen, ”5 varför”, att leda visuellt och
en omvärdering av företagets strategier). TePe kan årligen spara 0.74 MSEK i lagerhållningskostnader om
man genomför förslaget på en 57-procentig ställtidsreduktion inklusive efterföljande 50-procentiga
satsstorleksreduktion. Rekommendationerna ger dessutom en strukturerad materialförsörjningspåfyllnad som
helt eliminerar företagets problematiska säkerhetsrisker. Dessutom sker en kedjereaktion av indirekta
fördelar genom implementering av alla sju rekommendationer. Ledningens engagemang är en nödvändighet
för att sedan främja en ny kultur byggd på kontinuerliga förbättringar och medarbetarintresse.
Originalitet – Detta examensarbete bidrar både akademiskt och praktiskt genom att tillämpa den
konstruktiva forskningsmetodologin på materialflöden, speciallt anpassat för ett tillverkningsföretag. En
jämförelse, som enligt min vetskap inte tidigare har genomförts, av fem mognadsmodeller för Lean-
implementering genomförs, varpå en ny mognadsmodell introduceras.
Nyckelord Lean tillverkning, Toyotas produktionssystem, Verksamhetsstyrning, Flödeseffektivitet,
Kontinuerliga förbättringar, Ställtidsreduktion, Kanbansystem, Konstruktiv forskningsmetodologi
Rapporttyp – Examensarbete
Acknowledgment
4
Acknowledgment
Throughout this Master’s thesis, many people have contributed in one way or the other. I would like
to direct a special thanks to those who have had greatest impact in the process up to this paper’s
final submission.
First of all, I would like to show my deepest gratitude to my supervisor at the Faculty of
Engineering, professor Andreas Norrman, who has contributed with insightful guidance, perpetually
demanding high standards. I will never forget his feedback sessions with comments in any free
space of the drafts. Honestly, as I write these paragraphs, there are still comments left to be
reviewed.
I would like to thank TePe Munhygienprodukter AB for giving me the opportunity to do this
research project with their guidance in their facilities. Especially thanks to my TePe supervisor,
Johannes Bergenwolf, for assisting the project. There are also many other employees I would like to
bring forward for contributing to a lighthearted atmosphere, always bringing a smile to my lips, and
valuable information sharing, but they are so many both within the warehouse and within the
production facility. Thank you all!
I would also like to recognize Lennart Danielsen, Lean coordinator at Nolato MediTech AB,
for his valuable participation in the cross-case analysis of this paper; the study visit was inspiring
with many interesting discussions about Lean.
Last but by no means least, I would like to thank my friend, and prior classmate, Jens
Sundgren, for worthwhile conversations in the early phases of this Master’s thesis; your interest in
my Master’s thesis is astonishing.
Finally, this research has verified certain personal statements while it has been conducted,
one of them being that nothing ever becomes perfect, another that no matter the planning, there is
always a hurry as deadline approaches.
Lund, June 2020
Patrik Östlund
Improving Materials Supply Processes to Assembly Lines
5
Table of Contents
Abstract ..................................................................................................................................... 2
Sammanfattning ....................................................................................................................... 3
Acknowledgment ...................................................................................................................... 4
Table of Contents ..................................................................................................................... 5
List of Tables .......................................................................................................................... 10
List of Figures ......................................................................................................................... 11
Abbreviations ......................................................................................................................... 14
Note to the Reader .................................................................................................................. 15
Chapter 1. Introduction ......................................................................................................... 161.1 Background ............................................................................................................................. 161.2 Company Description ............................................................................................................. 171.3 Product Description ............................................................................................................... 18
1.3.1 Toothbrushes ...................................................................................................................... 181.3.2 Interdental cleaning ........................................................................................................... 191.3.3 Special brushes .................................................................................................................. 19
1.4 Problem Description ............................................................................................................... 191.5 Research Purpose ................................................................................................................... 201.6 Focus and Delimitations ......................................................................................................... 201.7 Research Questions ................................................................................................................ 211.8 A Reader’s Guide ................................................................................................................... 21
Chapter 2. Theoretical Framework ...................................................................................... 232.1 Outline of Chapter .................................................................................................................. 232.2 Materials Supply Processes ................................................................................................... 252.3 Toyota Production System ..................................................................................................... 252.4 Muda ........................................................................................................................................ 262.5 Lean Manufacturing (or just Lean) ...................................................................................... 29
2.5.1 Industry appropriateness .................................................................................................... 302.5.2 Characteristics appropriateness ......................................................................................... 30
2.6 Kaizen ...................................................................................................................................... 312.7 People & Teamwork ............................................................................................................... 312.8 Just-in-Time (JIT) .................................................................................................................. 32
2.8.1 Continuous flow ................................................................................................................. 322.8.2 Pull system vs. push system ............................................................................................... 322.8.3 Kanban system ................................................................................................................... 332.8.4 Takt time ............................................................................................................................ 372.8.5 Single minute exchange of die (SMED) ............................................................................ 37
2.9 Jidoka ...................................................................................................................................... 392.9.1 Genchi genbutsu ................................................................................................................ 392.9.2 5 Whys ............................................................................................................................... 402.9.3 5S ....................................................................................................................................... 40
Table of Contents
6
2.9.4 Poka-yoke .......................................................................................................................... 412.9.5 Andon ................................................................................................................................ 42
2.10 Heijunka ................................................................................................................................ 422.11 Standardized Work .............................................................................................................. 432.12 Visual Management .............................................................................................................. 442.13 Process Mapping ................................................................................................................... 452.14 Visual Mapping Techniques ................................................................................................ 45
2.14.1 Value stream mapping (VSM) ......................................................................................... 502.14.2 Operation chart (also Time and motion chart) ................................................................. 542.14.3 String diagram (also Geographical flowchart or Spaghetti diagram) .............................. 552.14.4 Value vs. time graph (VTG) ............................................................................................ 56
2.15 Product Family Matrix ........................................................................................................ 562.16 Ishikawa Diagram ................................................................................................................ 572.17 Plan-Do-Check-Act (PDCA) ................................................................................................ 582.18 Process Capacity and Bottleneck Elimination ................................................................... 582.19 Flow Efficiency ..................................................................................................................... 602.20 Lean Implementation ........................................................................................................... 61
2.20.1 Critical success factors (CSFs) ........................................................................................ 622.20.2 Maturity models ............................................................................................................... 62
Chapter 3. Methodology and Approach .............................................................................. 673.1 Overall Research Approach .................................................................................................. 673.2 Research Approach ................................................................................................................ 683.3 Research Purpose ................................................................................................................... 693.4 Research Method .................................................................................................................... 703.5 Research Process .................................................................................................................... 72
3.5.1 Theory development .......................................................................................................... 733.5.2 Case selection .................................................................................................................... 773.5.3 Data collection protocol ..................................................................................................... 79
3.6 Data Collection ....................................................................................................................... 793.6.1 Principal company ............................................................................................................. 803.6.2 Case study company .......................................................................................................... 82
3.7 Analysis .................................................................................................................................... 833.7.1 Early step analysis ............................................................................................................. 833.7.2 Within-case analysis .......................................................................................................... 843.7.3 Cross-case analysis ............................................................................................................ 85
3.8 Contextual scheme of Master’s Thesis ................................................................................. 853.9 Research Design Quality ........................................................................................................ 86
3.9.1 Construct validity ............................................................................................................... 873.9.2 Internal validity .................................................................................................................. 883.9.3 External validity ................................................................................................................. 883.9.4 Reliability .......................................................................................................................... 883.9.5 Objectivity and ethical research ......................................................................................... 89
Chapter 4. Materials Supply Processes and Challenges at TePe ....................................... 904.1 Introduction ............................................................................................................................ 904.2 Sales Volumes and Product Selection ................................................................................... 904.3 Current Production Facility .................................................................................................. 914.4 Operations ............................................................................................................................... 93
4.4.1 Injection molding (PROD3) .............................................................................................. 93
Improving Materials Supply Processes to Assembly Lines
7
4.4.2 Intermediate storage (IS or TEPE3) .................................................................................. 944.4.3 Mixing ................................................................................................................................ 954.4.4 Assembly/packaging .......................................................................................................... 96
4.5 Visual Mapping Techniques .................................................................................................. 984.5.1 Value stream mapping ....................................................................................................... 984.5.2 Value vs. time graph ........................................................................................................ 1004.5.3 String diagram ................................................................................................................. 1004.5.4 Operation chart ................................................................................................................ 101
4.6 Challenges ............................................................................................................................. 1034.6.1 Efficiency ......................................................................................................................... 1044.6.2 Safety ............................................................................................................................... 1064.6.3 New production facility ................................................................................................... 1074.6.5 Prioritized challenges ....................................................................................................... 107
Chapter 5. TPS/Lean Implementation: Case Descriptions and Analyses ....................... 1095.1 TePe Munhygienprodukter AB ........................................................................................... 109
5.1.1 Strategy ............................................................................................................................ 1095.1.2 Characteristics .................................................................................................................. 1105.1.3 Implementation of Lean principles .................................................................................. 1115.1.4 Success factors ................................................................................................................. 1155.1.5 Challenges ........................................................................................................................ 115
5.2. Nolato MediTech ................................................................................................................. 1155.2.1 Strategy ............................................................................................................................ 1165.2.2 Characteristics .................................................................................................................. 1175.2.3 Implementation of Lean principles .................................................................................. 1195.2.4 Success factors ................................................................................................................. 1255.2.5 Challenges ........................................................................................................................ 1265.2.6 Nolato MediTech recommendations and journey ............................................................ 1265.2.7 Lean implementation process at Nolato .......................................................................... 127
Chapter 6. Cross-Case Analysis .......................................................................................... 1296.1 Gap analysis .......................................................................................................................... 129
6.1.1 Managerial principles ...................................................................................................... 1306.1.2 Production principles ....................................................................................................... 130
6.2 Strategy .................................................................................................................................. 1306.2.1 Efficiency ......................................................................................................................... 1306.2.2 Safety ............................................................................................................................... 1326.2.3 Prioritized challenges ....................................................................................................... 132
Chapter 7. Development of Constructs at TePe ................................................................ 1337.1 Structure ................................................................................................................................ 1337.2 Bottleneck Elimination ......................................................................................................... 133
7.2.1 Bottleneck identification .................................................................................................. 1347.2.2 Increasing bottleneck capacity ......................................................................................... 134
7.3 Setup Time Reduction .......................................................................................................... 1367.3.1 SMED analysis ................................................................................................................ 1367.3.2 Batch size reduction ......................................................................................................... 1387.3.3 Implementation ................................................................................................................ 139
7.4 Managerial Principles .......................................................................................................... 1397.4.1 Genchi genbutsu .............................................................................................................. 140
Table of Contents
8
7.4.2 Visual management ......................................................................................................... 1417.4.3 Kaizen .............................................................................................................................. 1417.4.4 5 Whys ............................................................................................................................. 1427.4.5 Re-evaluation of strategies .............................................................................................. 1427.4.6 Implementation ................................................................................................................ 143
7.5 New Production Facility ...................................................................................................... 1437.5.1 Relocation of mixing ....................................................................................................... 1447.5.2 Supermarket ..................................................................................................................... 1447.5.3 Implementation ................................................................................................................ 146
7.6 Kanban System ..................................................................................................................... 1467.6.1 Replenishment procedure ................................................................................................ 1477.6.2 Kanban cards ................................................................................................................... 1487.6.3 Kanban assumptions ........................................................................................................ 1487.6.4 Kanban planner ................................................................................................................ 1497.6.5 Implementation ................................................................................................................ 149
7.7 5S ............................................................................................................................................ 1507.7.1 Implementation ................................................................................................................ 150
Chapter 8. Recommendation of Constructs at TePe ........................................................ 1518.1 Evaluation of Constructs ..................................................................................................... 1518.2 Sensitivity Analysis ............................................................................................................... 152
8.2.1 Setup time and batch size reduction ................................................................................ 1528.2.2 Supermarket/Kanban ....................................................................................................... 1528.2.3 5S ..................................................................................................................................... 153
8.3 Recommendation of Constructs .......................................................................................... 1538.3.1 Priority ............................................................................................................................. 1538.3.2 Action .............................................................................................................................. 1538.3.3 Consider ........................................................................................................................... 154
8.4 Risk Assessment .................................................................................................................... 1548.4.1 Resistance to change ........................................................................................................ 1548.4.2 Sustaining constructs ....................................................................................................... 1548.4.3 Demand variability .......................................................................................................... 1558.4.4 New products ................................................................................................................... 155
Chapter 9. Conclusions ........................................................................................................ 1569.1 Conclusion ............................................................................................................................. 156
9.1.1 Research question one ..................................................................................................... 1579.1.2 Research question two ..................................................................................................... 1589.1.3 Research question three ................................................................................................... 158
9.2 Contribution .......................................................................................................................... 1599.3 Future development and research ...................................................................................... 160
9.3.1 TePe ................................................................................................................................. 1609.3.2 Academia ......................................................................................................................... 161
References ............................................................................................................................. 162
Appendices ............................................................................................................................ 171Appendix I: Workshop I ............................................................................................................ 171Appendix II: Workshop II ......................................................................................................... 174Appendix III: Case Study Protocol ........................................................................................... 176Appendix IV: Time Management ............................................................................................. 180
Improving Materials Supply Processes to Assembly Lines
9
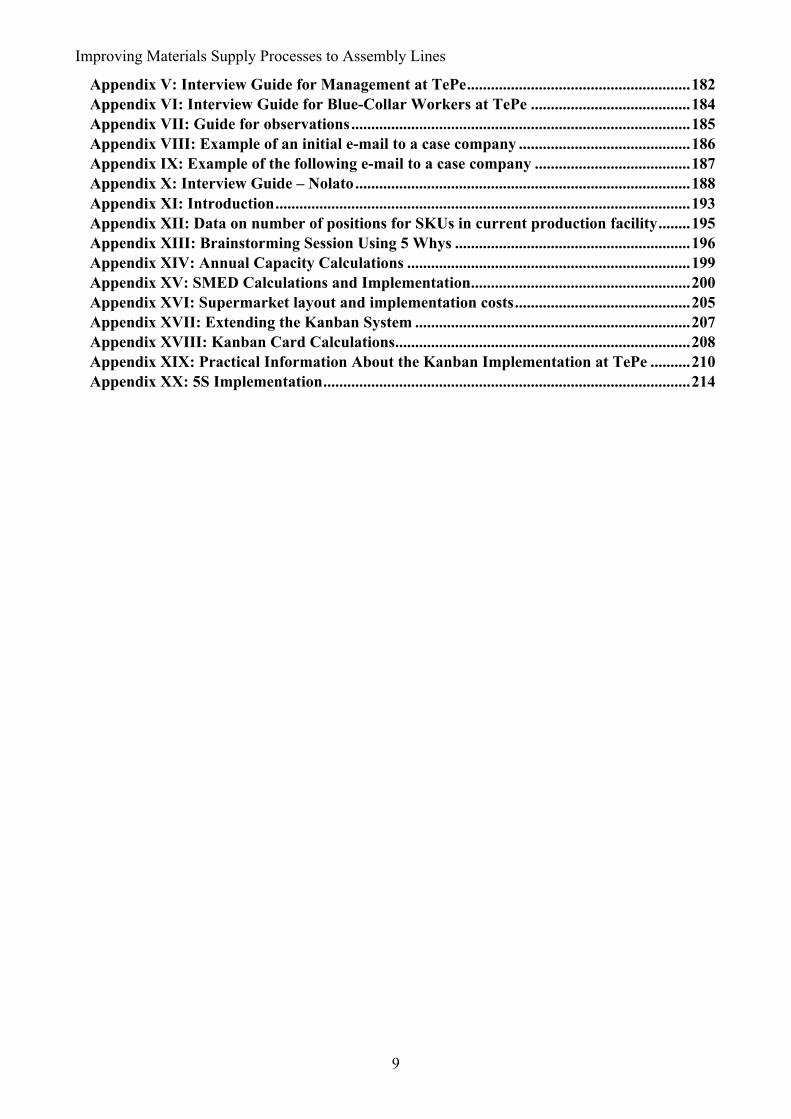
Appendix V: Interview Guide for Management at TePe ........................................................ 182Appendix VI: Interview Guide for Blue-Collar Workers at TePe ........................................ 184Appendix VII: Guide for observations ..................................................................................... 185Appendix VIII: Example of an initial e-mail to a case company ........................................... 186Appendix IX: Example of the following e-mail to a case company ....................................... 187Appendix X: Interview Guide – Nolato .................................................................................... 188Appendix XI: Introduction ........................................................................................................ 193Appendix XII: Data on number of positions for SKUs in current production facility ........ 195Appendix XIII: Brainstorming Session Using 5 Whys ........................................................... 196Appendix XIV: Annual Capacity Calculations ....................................................................... 199Appendix XV: SMED Calculations and Implementation ....................................................... 200Appendix XVI: Supermarket layout and implementation costs ............................................ 205Appendix XVII: Extending the Kanban System ..................................................................... 207Appendix XVIII: Kanban Card Calculations .......................................................................... 208Appendix XIX: Practical Information About the Kanban Implementation at TePe .......... 210Appendix XX: 5S Implementation ............................................................................................ 214
List of Tables
10
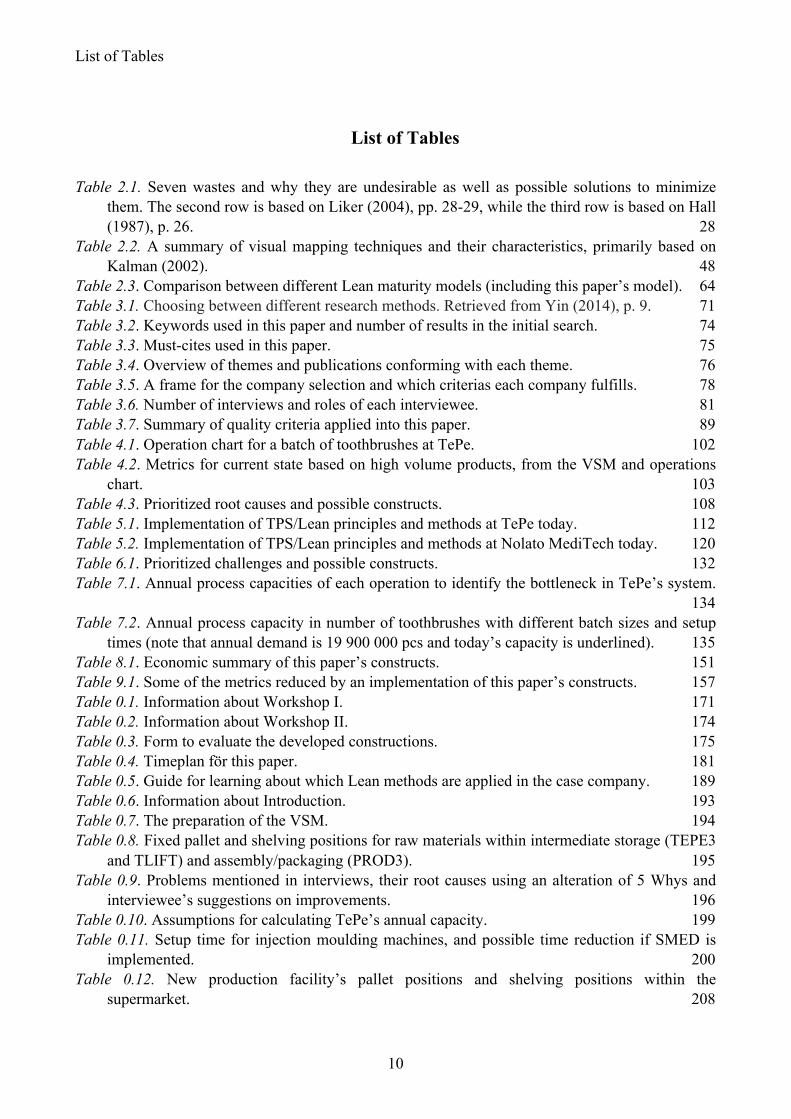
List of Tables
Table 2.1. Seven wastes and why they are undesirable as well as possible solutions to minimize them. The second row is based on Liker (2004), pp. 28-29, while the third row is based on Hall (1987), p. 26. 28
Table 2.2. A summary of visual mapping techniques and their characteristics, primarily based on Kalman (2002). 48
Table 2.3. Comparison between different Lean maturity models (including this paper’s model). 64Table 3.1. Choosing between different research methods. Retrieved from Yin (2014), p. 9. 71Table 3.2. Keywords used in this paper and number of results in the initial search. 74Table 3.3. Must-cites used in this paper. 75Table 3.4. Overview of themes and publications conforming with each theme. 76Table 3.5. A frame for the company selection and which criterias each company fulfills. 78Table 3.6. Number of interviews and roles of each interviewee. 81Table 3.7. Summary of quality criteria applied into this paper. 89Table 4.1. Operation chart for a batch of toothbrushes at TePe. 102Table 4.2. Metrics for current state based on high volume products, from the VSM and operations
chart. 103Table 4.3. Prioritized root causes and possible constructs. 108Table 5.1. Implementation of TPS/Lean principles and methods at TePe today. 112Table 5.2. Implementation of TPS/Lean principles and methods at Nolato MediTech today. 120Table 6.1. Prioritized challenges and possible constructs. 132Table 7.1. Annual process capacities of each operation to identify the bottleneck in TePe’s system.
134Table 7.2. Annual process capacity in number of toothbrushes with different batch sizes and setup
times (note that annual demand is 19 900 000 pcs and today’s capacity is underlined). 135Table 8.1. Economic summary of this paper’s constructs. 151Table 9.1. Some of the metrics reduced by an implementation of this paper’s constructs. 157Table 0.1. Information about Workshop I. 171Table 0.2. Information about Workshop II. 174Table 0.3. Form to evaluate the developed constructions. 175Table 0.4. Timeplan för this paper. 181Table 0.5. Guide for learning about which Lean methods are applied in the case company. 189Table 0.6. Information about Introduction. 193Table 0.7. The preparation of the VSM. 194Table 0.8. Fixed pallet and shelving positions for raw materials within intermediate storage (TEPE3
and TLIFT) and assembly/packaging (PROD3). 195Table 0.9. Problems mentioned in interviews, their root causes using an alteration of 5 Whys and
interviewee’s suggestions on improvements. 196Table 0.10. Assumptions for calculating TePe’s annual capacity. 199Table 0.11. Setup time for injection moulding machines, and possible time reduction if SMED is
implemented. 200Table 0.12. New production facility’s pallet positions and shelving positions within the
supermarket. 208
Improving Materials Supply Processes to Assembly Lines
11
List of Figures
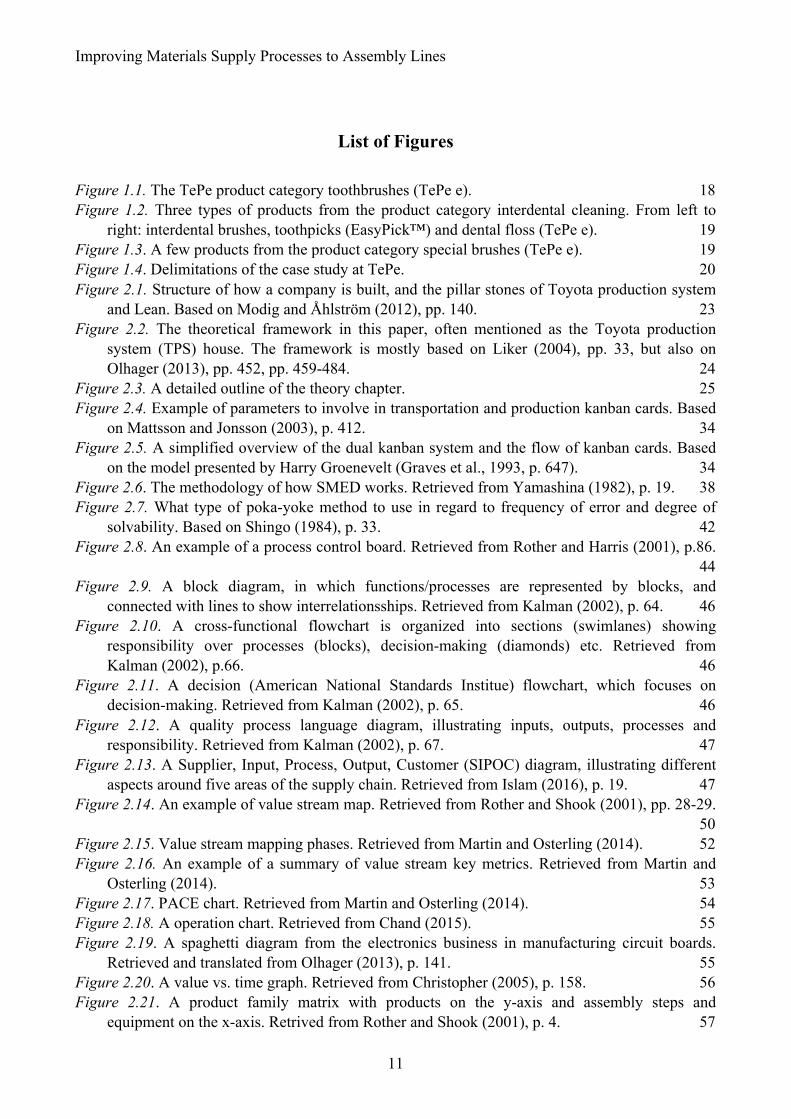
Figure 1.1. The TePe product category toothbrushes (TePe e). 18Figure 1.2. Three types of products from the product category interdental cleaning. From left to
right: interdental brushes, toothpicks (EasyPick™) and dental floss (TePe e). 19Figure 1.3. A few products from the product category special brushes (TePe e). 19Figure 1.4. Delimitations of the case study at TePe. 20Figure 2.1. Structure of how a company is built, and the pillar stones of Toyota production system
and Lean. Based on Modig and Åhlström (2012), pp. 140. 23Figure 2.2. The theoretical framework in this paper, often mentioned as the Toyota production
system (TPS) house. The framework is mostly based on Liker (2004), pp. 33, but also on Olhager (2013), pp. 452, pp. 459-484. 24
Figure 2.3. A detailed outline of the theory chapter. 25Figure 2.4. Example of parameters to involve in transportation and production kanban cards. Based
on Mattsson and Jonsson (2003), p. 412. 34Figure 2.5. A simplified overview of the dual kanban system and the flow of kanban cards. Based
on the model presented by Harry Groenevelt (Graves et al., 1993, p. 647). 34Figure 2.6. The methodology of how SMED works. Retrieved from Yamashina (1982), p. 19. 38Figure 2.7. What type of poka-yoke method to use in regard to frequency of error and degree of
solvability. Based on Shingo (1984), p. 33. 42Figure 2.8. An example of a process control board. Retrieved from Rother and Harris (2001), p.86.
44Figure 2.9. A block diagram, in which functions/processes are represented by blocks, and
connected with lines to show interrelationsships. Retrieved from Kalman (2002), p. 64. 46Figure 2.10. A cross-functional flowchart is organized into sections (swimlanes) showing
responsibility over processes (blocks), decision-making (diamonds) etc. Retrieved from Kalman (2002), p.66. 46
Figure 2.11. A decision (American National Standards Institue) flowchart, which focuses on decision-making. Retrieved from Kalman (2002), p. 65. 46
Figure 2.12. A quality process language diagram, illustrating inputs, outputs, processes and responsibility. Retrieved from Kalman (2002), p. 67. 47
Figure 2.13. A Supplier, Input, Process, Output, Customer (SIPOC) diagram, illustrating different aspects around five areas of the supply chain. Retrieved from Islam (2016), p. 19. 47
Figure 2.14. An example of value stream map. Retrieved from Rother and Shook (2001), pp. 28-29. 50
Figure 2.15. Value stream mapping phases. Retrieved from Martin and Osterling (2014). 52Figure 2.16. An example of a summary of value stream key metrics. Retrieved from Martin and
Osterling (2014). 53Figure 2.17. PACE chart. Retrieved from Martin and Osterling (2014). 54Figure 2.18. A operation chart. Retrieved from Chand (2015). 55Figure 2.19. A spaghetti diagram from the electronics business in manufacturing circuit boards.
Retrieved and translated from Olhager (2013), p. 141. 55Figure 2.20. A value vs. time graph. Retrieved from Christopher (2005), p. 158. 56Figure 2.21. A product family matrix with products on the y-axis and assembly steps and
equipment on the x-axis. Retrived from Rother and Shook (2001), p. 4. 57
List of Figures
12
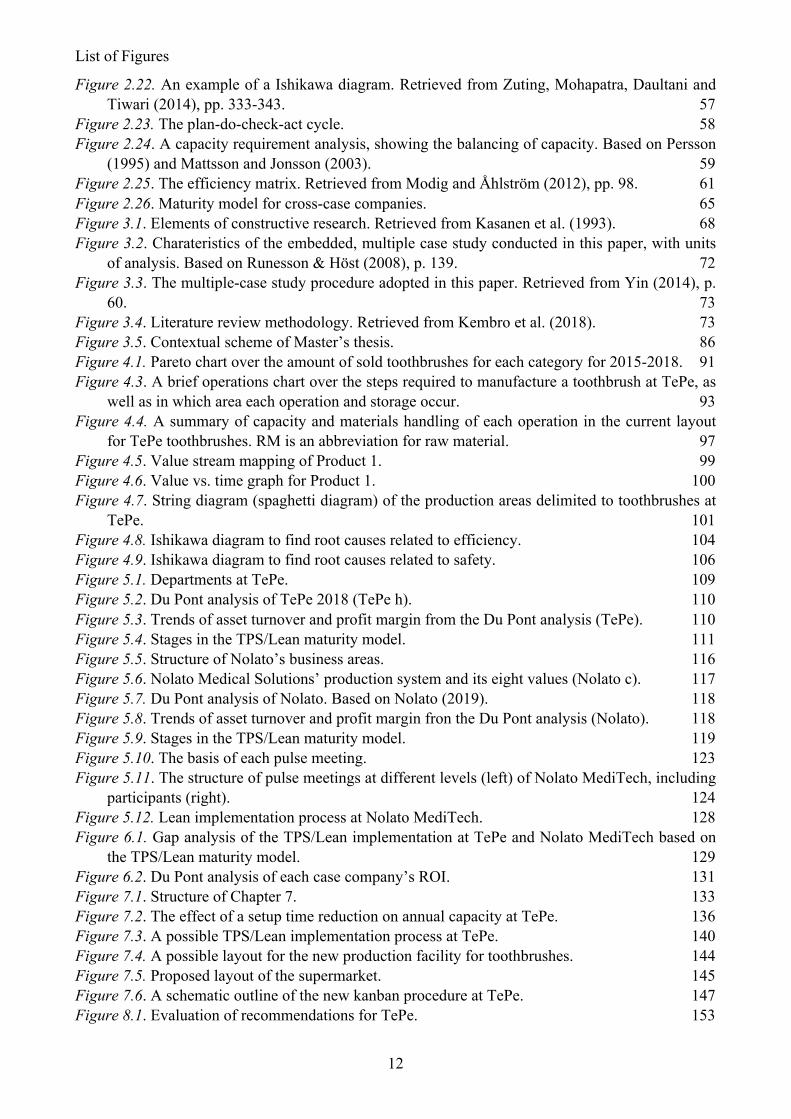
Figure 2.22. An example of a Ishikawa diagram. Retrieved from Zuting, Mohapatra, Daultani and Tiwari (2014), pp. 333-343. 57
Figure 2.23. The plan-do-check-act cycle. 58Figure 2.24. A capacity requirement analysis, showing the balancing of capacity. Based on Persson
(1995) and Mattsson and Jonsson (2003). 59Figure 2.25. The efficiency matrix. Retrieved from Modig and Åhlström (2012), pp. 98. 61Figure 2.26. Maturity model for cross-case companies. 65Figure 3.1. Elements of constructive research. Retrieved from Kasanen et al. (1993). 68Figure 3.2. Charateristics of the embedded, multiple case study conducted in this paper, with units
of analysis. Based on Runesson & Höst (2008), p. 139. 72Figure 3.3. The multiple-case study procedure adopted in this paper. Retrieved from Yin (2014), p.
60. 73Figure 3.4. Literature review methodology. Retrieved from Kembro et al. (2018). 73Figure 3.5. Contextual scheme of Master’s thesis. 86Figure 4.1. Pareto chart over the amount of sold toothbrushes for each category for 2015-2018. 91Figure 4.3. A brief operations chart over the steps required to manufacture a toothbrush at TePe, as
well as in which area each operation and storage occur. 93Figure 4.4. A summary of capacity and materials handling of each operation in the current layout
for TePe toothbrushes. RM is an abbreviation for raw material. 97Figure 4.5. Value stream mapping of Product 1. 99Figure 4.6. Value vs. time graph for Product 1. 100Figure 4.7. String diagram (spaghetti diagram) of the production areas delimited to toothbrushes at
TePe. 101Figure 4.8. Ishikawa diagram to find root causes related to efficiency. 104Figure 4.9. Ishikawa diagram to find root causes related to safety. 106Figure 5.1. Departments at TePe. 109Figure 5.2. Du Pont analysis of TePe 2018 (TePe h). 110Figure 5.3. Trends of asset turnover and profit margin from the Du Pont analysis (TePe). 110Figure 5.4. Stages in the TPS/Lean maturity model. 111Figure 5.5. Structure of Nolato’s business areas. 116Figure 5.6. Nolato Medical Solutions’ production system and its eight values (Nolato c). 117Figure 5.7. Du Pont analysis of Nolato. Based on Nolato (2019). 118Figure 5.8. Trends of asset turnover and profit margin fron the Du Pont analysis (Nolato). 118Figure 5.9. Stages in the TPS/Lean maturity model. 119Figure 5.10. The basis of each pulse meeting. 123Figure 5.11. The structure of pulse meetings at different levels (left) of Nolato MediTech, including
participants (right). 124Figure 5.12. Lean implementation process at Nolato MediTech. 128Figure 6.1. Gap analysis of the TPS/Lean implementation at TePe and Nolato MediTech based on
the TPS/Lean maturity model. 129Figure 6.2. Du Pont analysis of each case company’s ROI. 131Figure 7.1. Structure of Chapter 7. 133Figure 7.2. The effect of a setup time reduction on annual capacity at TePe. 136Figure 7.3. A possible TPS/Lean implementation process at TePe. 140Figure 7.4. A possible layout for the new production facility for toothbrushes. 144Figure 7.5. Proposed layout of the supermarket. 145Figure 7.6. A schematic outline of the new kanban procedure at TePe. 147Figure 8.1. Evaluation of recommendations for TePe. 153
Improving Materials Supply Processes to Assembly Lines
13
Figure 9.1. Evaluation of recommendations for TePe. 158Figure 9.2. A possible layout for the new production facility for toothbrushes. 159Figure 9.3. Stages in the TPS/Lean maturity model. 159Figure 0.1. Overall timeline for project. 180Figure 0.2. Supermarket layout. 205Figure 0.3. An example of a transportation-kanban at TePe. 210Figure 0.4. An example of a shelving system. Adapted from Vistamation (2020). 211
Abbreviations
14
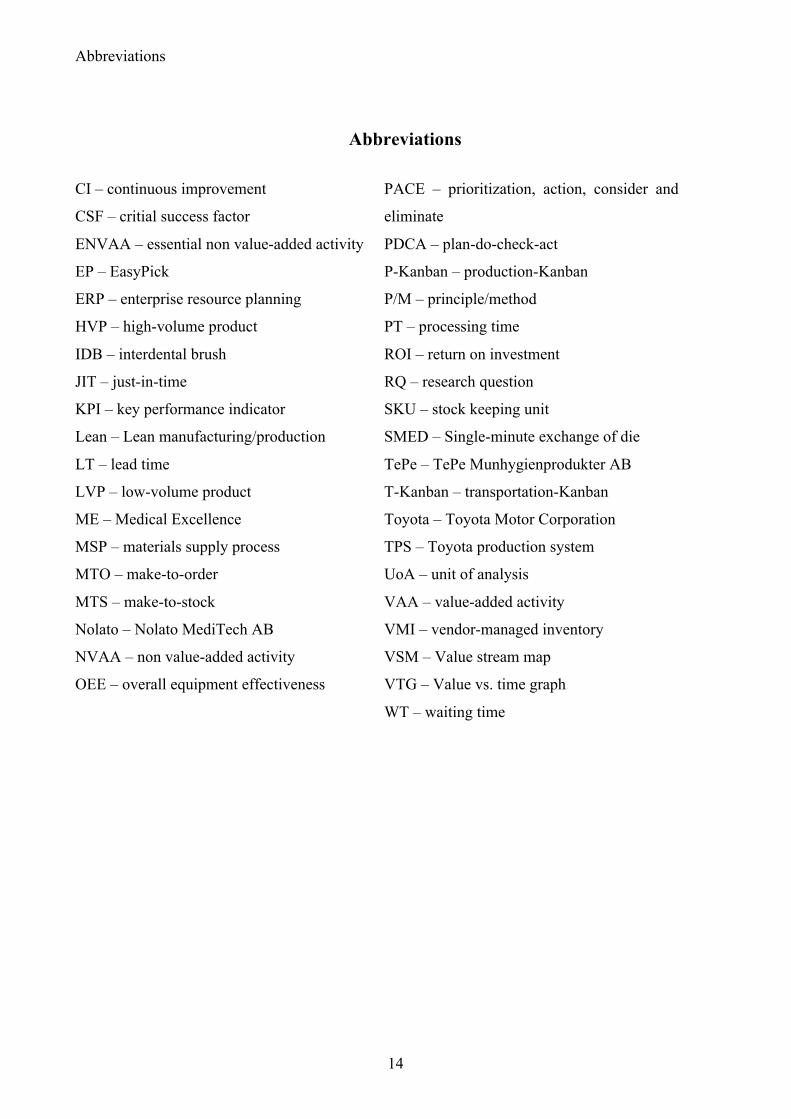
Abbreviations
CI – continuous improvement
CSF – critial success factor
ENVAA – essential non value-added activity
EP – EasyPick
ERP – enterprise resource planning
HVP – high-volume product
IDB – interdental brush
JIT – just-in-time
KPI – key performance indicator
Lean – Lean manufacturing/production
LT – lead time
LVP – low-volume product
ME – Medical Excellence
MSP – materials supply process
MTO – make-to-order
MTS – make-to-stock
Nolato – Nolato MediTech AB
NVAA – non value-added activity
OEE – overall equipment effectiveness
PACE – prioritization, action, consider and
eliminate
PDCA – plan-do-check-act
P-Kanban – production-Kanban
P/M – principle/method
PT – processing time
ROI – return on investment
RQ – research question
SKU – stock keeping unit
SMED – Single-minute exchange of die
TePe – TePe Munhygienprodukter AB
T-Kanban – transportation-Kanban
Toyota – Toyota Motor Corporation
TPS – Toyota production system
UoA – unit of analysis
VAA – value-added activity
VMI – vendor-managed inventory
VSM – Value stream map
VTG – Value vs. time graph
WT – waiting time
Improving Materials Supply Processes to Assembly Lines
15
Note to the Reader
In Japan, the family name appears before a person’s first name. The Americanized way of referring
to, for example, the famous founder of the Toyota production system is Taiichi Ohno, even though
the custom of his home country is to acknowledge him as Ōno Taiichi (Ohno, 1988). Therefore,
similarly to the CRC Press, which translated Toyota Production System: Beyond Large-Scale
Production into English in 1988, in-text references of this paper introduces Japanese names
according to their standards. This is simply done out of common courtesy to Japanese traditions.
16
Chapter 1. Introduction This chapter introduces the reader to the main drivers for why this Master’s thesis is conducted.
There is, first, a short overall background to the research area, followed by a description of TePe
as well as their products. Second, specified problems by TePe are described, as well as the purpose
of this research and its delimitations. A number of research questions are, then, stated. Finally, a
reader’s guide to the rest of the paper concludes this chapter.
1.1 Background
As the competition intensifies by global markets in many businesses (Alizon, Dallery, Essafi &
Feillet, 2007), companies have to consider, and adopt, new manufacturing approaches to stay
competitive (Hall, 1987; Meredith & McTavish, 1992; Shah & Ward, 2003). Suzaki (1985) even
acknowledged a revolution in competitive strategy some 30 years ago as progress was made in
manufacturing techniques, and to keep up with competition management needed to decide upon
methods improving manufacturing capabilities (Suzaki, 1985). This is still pertinent today due to
increased rivalry among global businesses (Shah & Ward, 2003).
Many companies have been forced to take action; therefore they have implemented Lean
manufacturing techniques (Alizon et al., 2007). By implementing Lean principles, corporations
have achieved economic benefits along with improved quality, and reduced costs and cycle times,
which are all important elements to stay competitive (Cudney & Elrod, 2011). That Lean
production1 is a well-accepted principle to enhance performance and add a competitive edge is
widely recognized among scholars and other professionals (Shah & Ward, 2007).
But what is in fact Lean production? Simply put, Womack, Jones and Roos (1990) define
the term as an innovative production system combining the advantages of mass production and craft
production. But, as is discussed by several authors such as Bhamu and Sangwan (2013), Petterson
(2008), and Shah and Ward (2007), the concept does lack a common definition. To understand Lean
production better, we have to consider its origins.
At the end of 1949, the automobile company Toyota Motor Company suffered a loss of
sales, whereupon their engineer Toyoda Eiji went to Detroit, USA, to carefully study the production
system initiated by Henry Ford, the father of mass production (Womack, Jones & Roos, 1990).
Back home in Japan, Toyoda and the production genius Ōno Taiichi developed the concept of
1 There is no clear definition between Lean production and Lean manufacturing, but different authors seem to
Improving Materials Supply Processes to Assembly Lines
17
Toyota production system (TPS) (Womack et al., 1990). Ohno (1988) himself defines the basis of
“Toyota production system … [to be] the absolute elimination of waste” (p. 9). Later, from that
system stems Lean production, which is introduced to North America by Womack et al. (1990).
Liker (2004) represents a lean manufacturer as a company striving for a product flow with value-
adding activities without interruptions, based on customer demand, which replenishes only what
next operation needs, and to have an ever-improving culture.
Lean production is frequently used as a surrogate for TPS (Shah & Ward, 2007). This paper
is trying to take the best out of two worlds, but the definition of Lean manufacturing is the same as
was introduced to North America many years ago. As discussed by Cudney & Elrod (2011), this
means focusing on identifying and eliminating waste and improving materials and information flow
by addressing value-added and non-value added activities.
Several researchers have identified that an implementation of Lean gains improvements in
production lead times, processing times, amount of inventories, employee morale, standardized
housekeeping and effective communication (Bhamu & Sangwan, 2014), to mention a few.
Moreover, an implementation provides a safer work environment (see Liker, 2004; Green, Lee &
Kozman 2010; Al-Aomar, 2011), including a cleaner workplace (Al-Aomar, 2011).
But to fully understand a company’s value stream, it is necessary to map value-added
activities (Hines & Rich, 1997). In Lean manufacturing, the most popular way of representing
production units to identify production waste is through value stream mapping (VSM) (Dinis-
Carvalho, Guimaraes, Sousa & Pinto Leao, 2019). But there exists several visual mapping
techniques discussed later in the theoretical framework of this paper. For example, Hines and Rich
(1997) present seven tools, two regarded as new at that time, while Kalman (2002) suggests six
techniques.
1.2 Company Description
TePe Munhygienprodukter AB (TePe) is a privately held Swedish family business operating in the
oral health industry (TePe a). They develop and manufacture oral health products in Malmö,
Sweden, and market them worldwide (TePe a). The company aims to have a scientific approach on
their product development whereupon they have a close collaboration with dental professionals
(TePe b).
It all started in 1965, when wood-carver Henning Eklund and two professors of the School
of Dentistry collaborated to develop the triangular stick designed to suit the interdental space
between teeth (TePe a). As the business grew, TePe introduced toothbrushes to their product
portfolio followed by the renewed TePe Interdental Brushes in 1993, which led to international
success, especially in the United Kingdom, Germany and Sweden (TePe a). TePe continued their
Introduction
18
internationalisation by establishing several subsidiaries globally, and Joel Eklund, CEO from 2012
and grandson of Henning Eklund, continued the expansion (TePe a).
Today, the company exports products to 60 countries, and they have a turnover of 750
MSEK (2018), with 340 employees spread over eight countries (TePe a). They now produce a wide
range of oral health products, still having their headquarters in Malmö with all research and
production, which gives them control over the value chain (TePe a). TePe strives to increase public
awareness of preventative dental care, interdental cleaning and how oral health impacts general
health, while their vision is to bring healthy smiles for life (TePe a).
1.3 Product Description
TePe offers a wide range of oral health products categorized in: toothbrushes, interdental cleaning
and special brushes (TePe c).
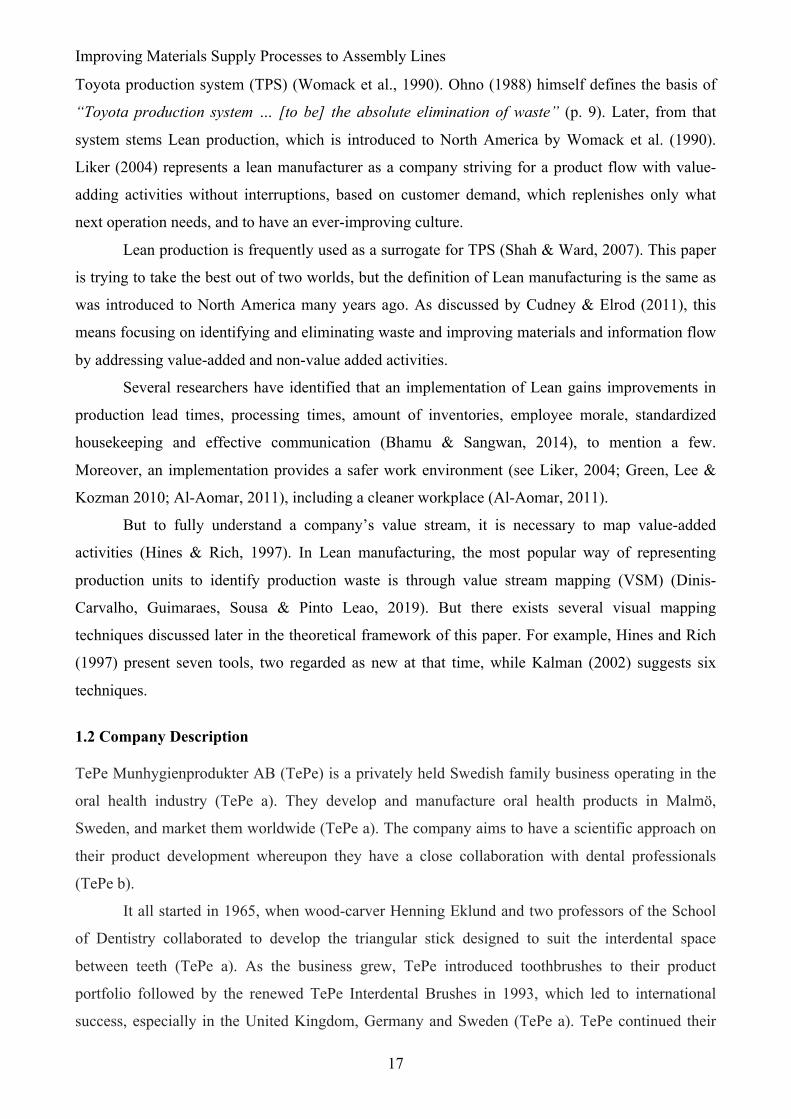
1.3.1 Toothbrushes
TePe manufactures 184 different types of toothbrushes, which all are made of plastic molded
handles, but come in many different sizes, models, colours and softness of the nylon filaments
(TePe c). A selection of types can be seen in Figure 1.1. The case study at TePe is limited to the
study of toothbrushes and no other products.
Figure 1.1. The TePe product category toothbrushes (TePe e).
Improving Materials Supply Processes to Assembly Lines
19
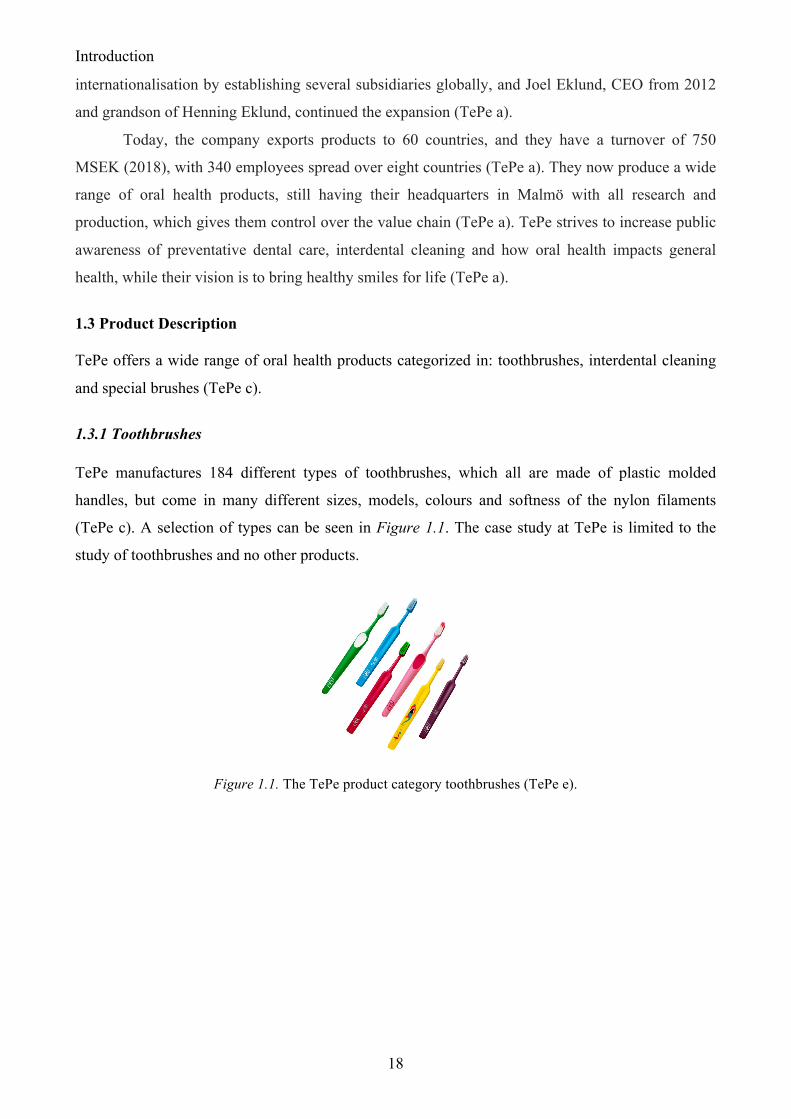
1.3.2 Interdental cleaning
Toothbrushes remove plaque from smooth surfaces; however, they have limits accessing
interproximally (Choo et al., 2001), i.e. in the area between adjoing teeth. TePe, therefore, offers a
collection of interdental cleaning products (TePe c), as can be seen in Figure 1.2. The IDB, which
comes in different sizes, models and angels, is a small brush used to clean between teeth, at such
places where the toothbrush cannot reach (TePe c).
Figure 1.2. Three types of products from the product category interdental cleaning. From left to right:
interdental brushes, toothpicks (EasyPick™) and dental floss (TePe e).
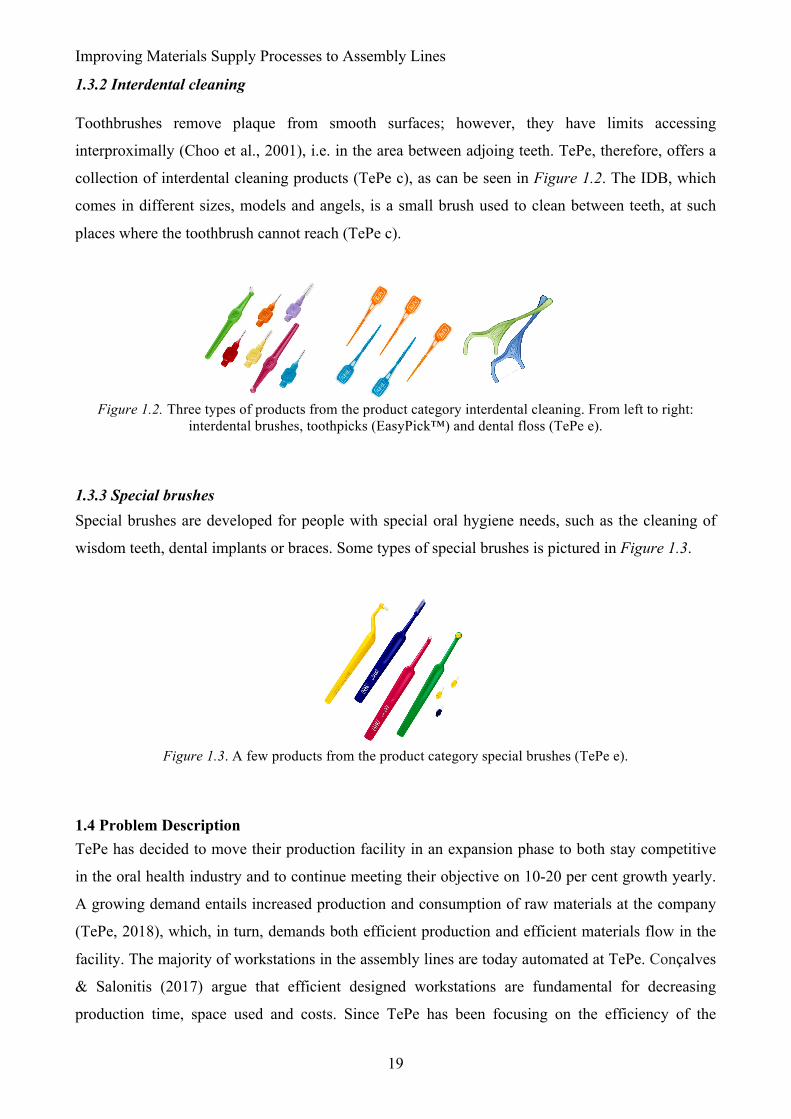
1.3.3 Special brushes Special brushes are developed for people with special oral hygiene needs, such as the cleaning of
wisdom teeth, dental implants or braces. Some types of special brushes is pictured in Figure 1.3.
Figure 1.3. A few products from the product category special brushes (TePe e).
1.4 Problem Description TePe has decided to move their production facility in an expansion phase to both stay competitive
in the oral health industry and to continue meeting their objective on 10-20 per cent growth yearly.
A growing demand entails increased production and consumption of raw materials at the company
(TePe, 2018), which, in turn, demands both efficient production and efficient materials flow in the
facility. The majority of workstations in the assembly lines are today automated at TePe. Conçalves
& Salonitis (2017) argue that efficient designed workstations are fundamental for decreasing
production time, space used and costs. Since TePe has been focusing on the efficiency of the
Introduction
20
assembly lines, they thereafter had to customize the materials supply processes to the production,
which according to Johansson and Johansson (2006) is common in the industry.
Accordingly, TePe is not satisfied with the materials flow to assembly lines in their
production facility due to several factors that I discussed in the Introduction section, such as long
lead times, high inventories, non-structured replenishment procedures and occurrence of safety
hazards. In some materials supply processes today, blue-collar workers refill materials manually
from the warehouse. Neither is this an efficient nor a safe method. Even though TePe instructs their
workers to take safety precautions when in the warehouse in which forklifts move, these
precautions are not followed perpetually. Since TePe now intend to move their production of
toothbrushes into a new, bigger facility, they see a reconstruction of materials supply processes
possible. In the procedure they need help mapping the materials flow and, based on that,
constructing improvement solutions. A possible solution is to construct these recommendations
using production methods such as Toyota production system and Lean manufacturing.
1.5 Research Purpose
The purpose of this paper is to improve the materials supply processes to assembly lines in a
manufacturing production facility through Toyota production system and Lean manufacturing, and
recommend TePe on improvements in their expansion phase.
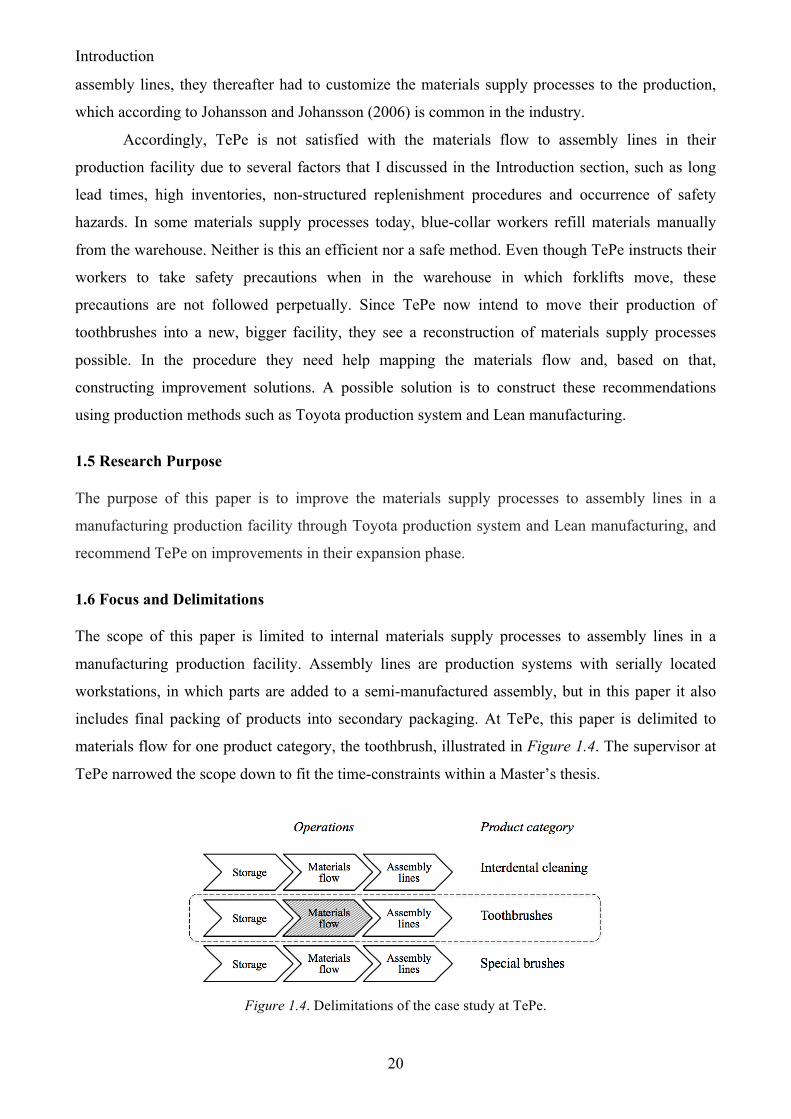
1.6 Focus and Delimitations
The scope of this paper is limited to internal materials supply processes to assembly lines in a
manufacturing production facility. Assembly lines are production systems with serially located
workstations, in which parts are added to a semi-manufactured assembly, but in this paper it also
includes final packing of products into secondary packaging. At TePe, this paper is delimited to
materials flow for one product category, the toothbrush, illustrated in Figure 1.4. The supervisor at
TePe narrowed the scope down to fit the time-constraints within a Master’s thesis.
Figure 1.4. Delimitations of the case study at TePe.
Improving Materials Supply Processes to Assembly Lines
21
1.7 Research Questions
This paper is built upon three research questions developed in collaboration with TePe. They are
constructed around three different aspects, i.e. efficiency, safety and the new production facility.
The research questions are presented below.
RQ1 How can materials supply processes to assembly lines at TePe be improved by
implementing Toyota production system and Lean?
RQ2 Why is the materials supply processes at TePe bringing safety hazards? How can
these safety hazards be minimized?
RQ3 How should raw materials be supplied to the new production facility?
1.8 A Reader’s Guide
This is a quite comprehensive Master´s thesis, and, thus, I have divided it into sections in order to
give the reader an understanding of its structure. Based on interest, the reader can, in that way,
immerse oneself in the section(s) most relevant.
Chapter 2-3 These chapters are this paper’s academic section, including both a
theoretical framework and the methodology used. This section should
be read by anyone with an interest either in the theory of TPS/Lean or in
assessing the quality of the paper. For further clarification on how
sections relate to each other, a contextual scheme of the Master’s thesis
concludes Chapter 3.
Chapter 4 This chapter is an AS-IS analysis of the materials supply processes at
TePe. The chapter can, however, be further divided into following sub-
sections: (1) description of current production facility, (2) evaluation of
current production facility and (3) current TePe challenges. Prioritized
challenges, then, conclude Chapter 4. The reader not well acquainted
with the TePe business should read this chapter. The second half of the
chapter is appropriate for any TePe employee interested in their
improvement possibilities.
Chapter 5-6 This section describes TePe’s implementation of TPS/Lean principles
thus far, and compares the efforts with a company publicly noticed for
their Lean commitments. This section should be read by anyone
Introduction
22
interested in a TPS/Lean implementation in a manufacturing company.
Chapter 7-8 These chapters are closely interrelated, since they either explain or
recommend the constructs of this paper. The section is based on
challenges found in Chapter 4-6. Many of the constructs developed in
Chapter 7 also have implementation guides appended for the interested
reader. Chapter 8 addresses the economic aspects of an implementation.
This section should be read by anyone interested in the results of this
Master’s thesis.
Chapter 9 This section concludes the results of the paper. Future development and
research, both for TePe and for academia, closes the paper. This section
should be read by the impatient reader, or the reader searching for ideas
to further research.
In summation, the reader who is already briefed of this paper’s aim and has a clear insight of the
challenges TePe faces may find an interest in starting their read from Chapter 7. My
recommendation is, however, to, at least, start a reading from Chapter 4, since this will give the
reader a thorough understanding of the foundation of this paper.
Improving Materials Supply Processes to Assembly Lines
23
Chapter 2. Theoretical Framework This chapter represents the theoretical foundation of which this paper is built on. Initially, an
outline of what the reader can expect from the rest of the chapter is presented. Then, materials
supply processes are discussed briefly, followed by the basis of this theoretical framework, which is
values, principles and methods from Toyota production system and Lean. Finally, critical success
factors in regard to a TPS/Lean implementation are discussed.
2.1 Outline of Chapter
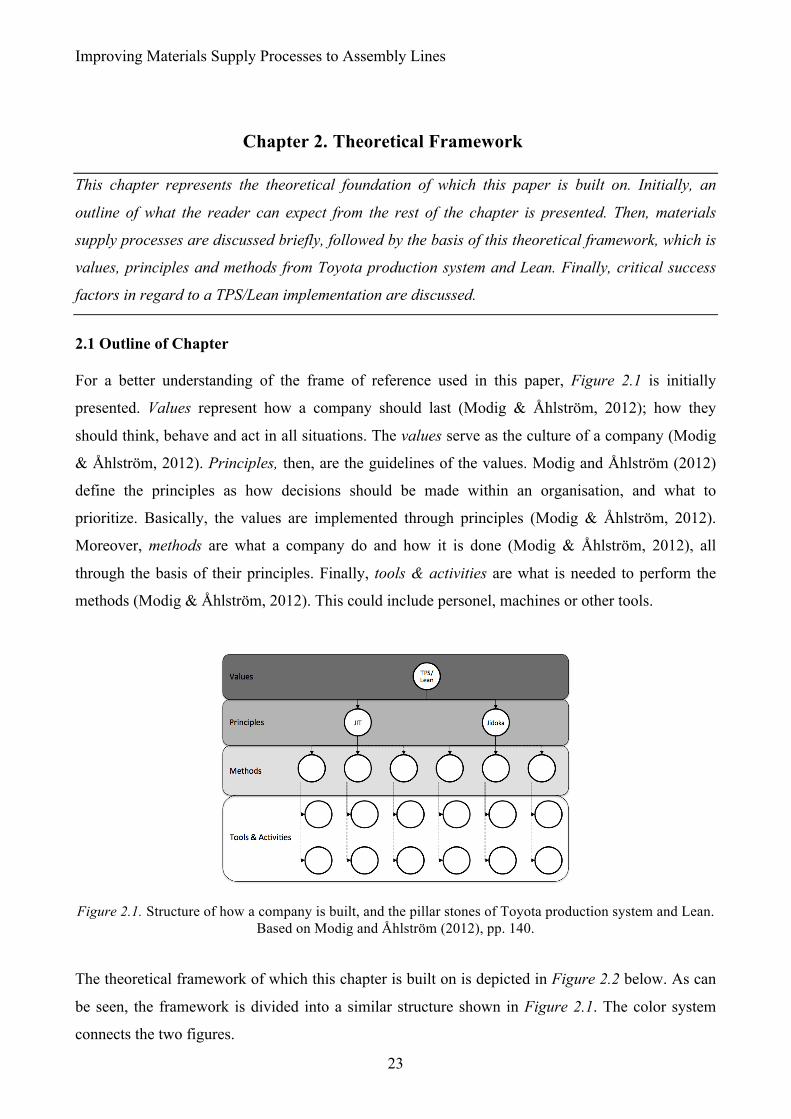
For a better understanding of the frame of reference used in this paper, Figure 2.1 is initially
presented. Values represent how a company should last (Modig & Åhlström, 2012); how they
should think, behave and act in all situations. The values serve as the culture of a company (Modig
& Åhlström, 2012). Principles, then, are the guidelines of the values. Modig and Åhlström (2012)
define the principles as how decisions should be made within an organisation, and what to
prioritize. Basically, the values are implemented through principles (Modig & Åhlström, 2012).
Moreover, methods are what a company do and how it is done (Modig & Åhlström, 2012), all
through the basis of their principles. Finally, tools & activities are what is needed to perform the
methods (Modig & Åhlström, 2012). This could include personel, machines or other tools.
Figure 2.1. Structure of how a company is built, and the pillar stones of Toyota production system and Lean.
Based on Modig and Åhlström (2012), pp. 140.
The theoretical framework of which this chapter is built on is depicted in Figure 2.2 below. As can
be seen, the framework is divided into a similar structure shown in Figure 2.1. The color system
connects the two figures.
Theoretical Framework
24
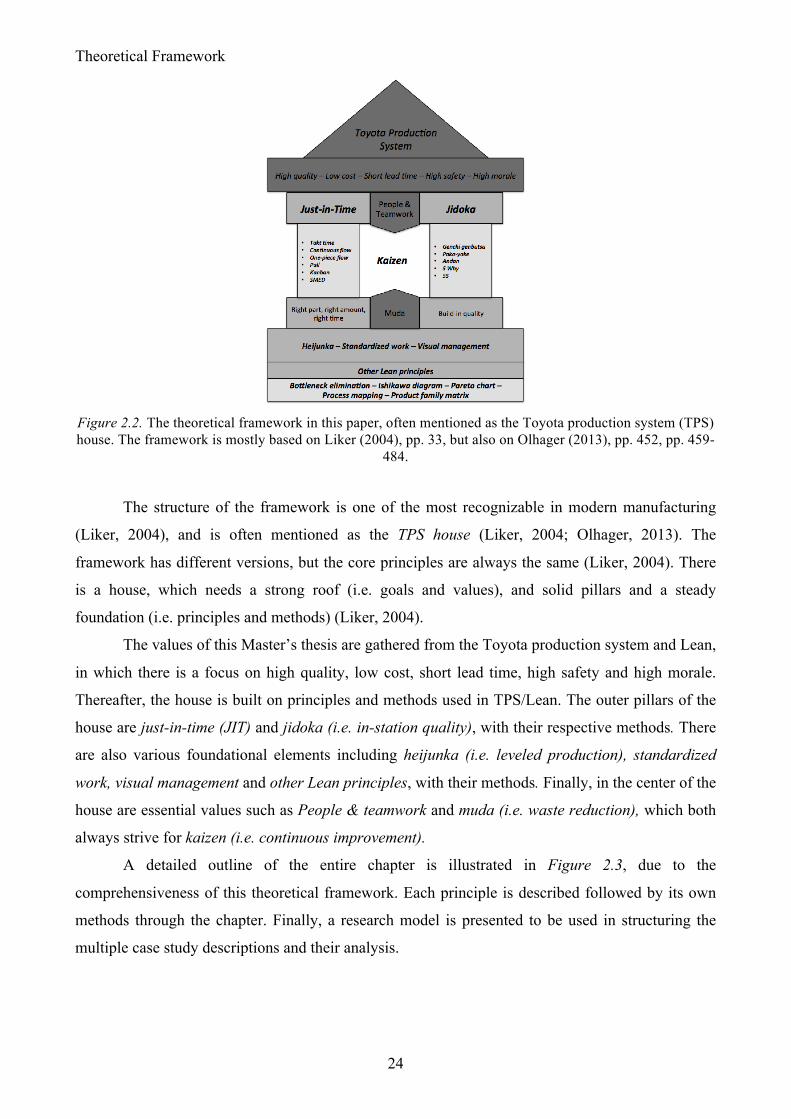
Figure 2.2. The theoretical framework in this paper, often mentioned as the Toyota production system (TPS) house. The framework is mostly based on Liker (2004), pp. 33, but also on Olhager (2013), pp. 452, pp. 459-
484.
The structure of the framework is one of the most recognizable in modern manufacturing
(Liker, 2004), and is often mentioned as the TPS house (Liker, 2004; Olhager, 2013). The
framework has different versions, but the core principles are always the same (Liker, 2004). There
is a house, which needs a strong roof (i.e. goals and values), and solid pillars and a steady
foundation (i.e. principles and methods) (Liker, 2004).
The values of this Master’s thesis are gathered from the Toyota production system and Lean,
in which there is a focus on high quality, low cost, short lead time, high safety and high morale.
Thereafter, the house is built on principles and methods used in TPS/Lean. The outer pillars of the
house are just-in-time (JIT) and jidoka (i.e. in-station quality), with their respective methods. There
are also various foundational elements including heijunka (i.e. leveled production), standardized
work, visual management and other Lean principles, with their methods. Finally, in the center of the
house are essential values such as People & teamwork and muda (i.e. waste reduction), which both
always strive for kaizen (i.e. continuous improvement).
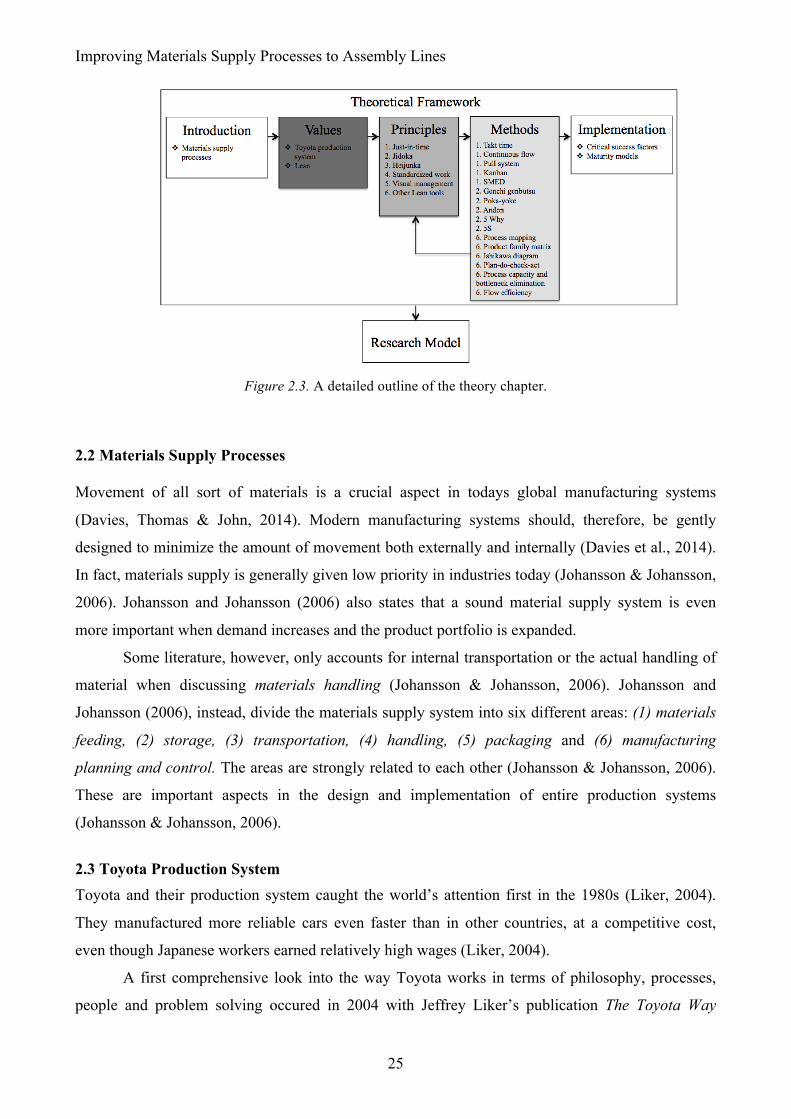
A detailed outline of the entire chapter is illustrated in Figure 2.3, due to the
comprehensiveness of this theoretical framework. Each principle is described followed by its own
methods through the chapter. Finally, a research model is presented to be used in structuring the
multiple case study descriptions and their analysis.
Improving Materials Supply Processes to Assembly Lines
25
Figure 2.3. A detailed outline of the theory chapter.
2.2 Materials Supply Processes
Movement of all sort of materials is a crucial aspect in todays global manufacturing systems
(Davies, Thomas & John, 2014). Modern manufacturing systems should, therefore, be gently
designed to minimize the amount of movement both externally and internally (Davies et al., 2014).
In fact, materials supply is generally given low priority in industries today (Johansson & Johansson,
2006). Johansson and Johansson (2006) also states that a sound material supply system is even
more important when demand increases and the product portfolio is expanded.
Some literature, however, only accounts for internal transportation or the actual handling of
material when discussing materials handling (Johansson & Johansson, 2006). Johansson and
Johansson (2006), instead, divide the materials supply system into six different areas: (1) materials
feeding, (2) storage, (3) transportation, (4) handling, (5) packaging and (6) manufacturing
planning and control. The areas are strongly related to each other (Johansson & Johansson, 2006).
These are important aspects in the design and implementation of entire production systems
(Johansson & Johansson, 2006).
2.3 Toyota Production System Toyota and their production system caught the world’s attention first in the 1980s (Liker, 2004).
They manufactured more reliable cars even faster than in other countries, at a competitive cost,
even though Japanese workers earned relatively high wages (Liker, 2004).
A first comprehensive look into the way Toyota works in terms of philosophy, processes,
people and problem solving occured in 2004 with Jeffrey Liker’s publication The Toyota Way
Theoretical Framework
26
(Martin and Osterling, 2014). However, Ōno Taiichi, founder of Toyota seisan hoshiki2, published
Toyota Production System: Beyond Large-Scale Production already in 1988 with several sturdy tips
from Toyota manufacturing facilities, even though the publication does lack a general
implementation process. But that may be because TPS according to Ohno (1988) is not just a
production system, but a management system. The system has been introduced in companies
regardless of industry, scale and nationality (Ohno, 1988). The main aim of TPS is to increase
production efficiency by eliminating waste thoroughly and consistently (Ohno, 1988). Waste,
basically, is ”anything that does not add value to the product or service, whether material,
equipment, space, time, energy, systems, or human activity of any sort” (Hall, 1987, p. 24).
So, how does Toyota apply this system? Ohno (1988) simply explains that ”[everything
they] are doing is looking at the time line” (p. ix) between order and cash, and, then reduce the time
line by removing waste.
2.4 Muda
Muda is the japanese word for waste. An initial step towards an application of TPS is to identify all
wastes (Ohno, 1988). But to be able to recognize waste, it is important to understand its nature
(Ohno, 1988). Ōno Taiichi (1988) was first to name the seven categories where waste could arise in
production, namely in:
! Overproduction. A company produces items for which there is no order, or they are
producing more than necessary (Liker, 2004; Olhager, 2013).
! Waiting. Machines, equipment or tools are not available when needed (Olhager,
2013), which also forces operators to wait for next processing step, or a tool, part etc.
(Liker, 2004). Operators may even be waiting because of equipment downtime,
capacity bottlenecks, delays or stock-outs (Liker, 2004).
! Unnecessary transportation. Products are often moved in-between workstations,
which in the layout could have been arranged closer to each other (Modig &
Åhlström, 2012; Olhager, 2013). Basically, there can be long distance transportations
of work-in-process (WIP), but unnecessary transportation is also, de facto, all
movement of materials, parts or finished goods between workstations or in and out
of storage (Liker, 2004).
! Overprocessing. Needlessly complex activities, which could be done simpler (Modig
& Åhlström, 2012; Olhager, 2013). Also, inefficient processing due to poor
equipment or tools (Liker, 2004). 2 Japanese name of Toyota production system (Ohno, 1988)
Improving Materials Supply Processes to Assembly Lines
27
! Excess inventory. Inventory that exceeds what is absolute necessary to meet demand
(Olhager, 2013). This can be excess raw material, WIP or finished goods (Liker,
2004), and it hides problems (Modig & Åhlström, 2012).
! Unnecessary movement. Any motion of an operator is waste, such as looking or
reaching for tools, material or help (Liker, 2004; Olhager, 2013). Even walking in
itself should be unnecessary, and is considered a waste (Liker, 2004).
! Defects. Producing defective parts (Liker, 2004). There can be incorrect work
instructions (Olhager, 2013), causing scrap, rework or extra inspection, which means
wasteful handling, time and effort (Liker, 2004).
Ōno Taiichi considered overproduction to be the fundamental waste, since it causes many of the
other six wastes (Liker, 2004). Overproduction leads, by definition, to a build-up in inventory
somewhere downstream (Liker, 2004), probably in the production facility. A mass producer may
ask why this is a problem, as long as, they say, operators and machines are producing parts (Liker,
2004). Besides more obvious reasons such as opportunity costs of tied-up capital and investment
costs in warehouses larger than necessary, Liker (2004) explains that inventory between processes
leads to suboptimal behaviour. It reduces an operator’s motivation to continuously improve
processes (Liker, 2004). Why should he worry about an equipment shutdown, when it does not
immediately affect the final assembly (Liker, 2004)? Why should he worry about some defects
scrapped downstreams, when it does not immediately affect the operations (Liker, 2004)?
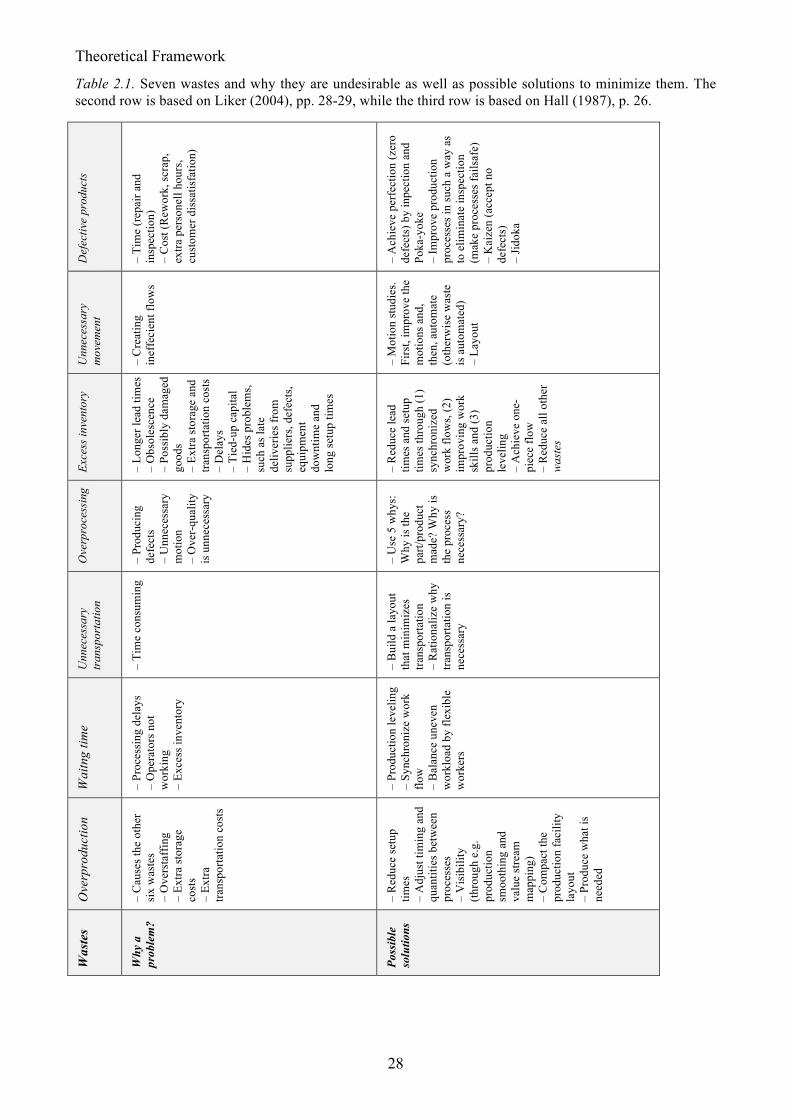
However, the seven wastes are all connected to each other, and often hidden in the
complexity of a large organization (Hall, 1987). Why different wastes are a problem and possible
solutions to them when encountered can be seen in Table 2.1 below.
Theoretical Framework
28
Table 2.1. Seven wastes and why they are undesirable as well as possible solutions to minimize them. The second row is based on Liker (2004), pp. 28-29, while the third row is based on Hall (1987), p. 26.
Def
ectiv
e pr
oduc
ts
– Ti
me
(rep
air a
nd
insp
ectio
n)
– C
ost (
Rew
ork,
scra
p,
extra
per
sone
ll ho
urs,
cust
omer
dis
satis
fatio
n)
– A
chie
ve p
erfe
ctio
n (z
ero
defe
cts)
by
inpe
ctio
n an
d Po
ka-y
oke
– Im
prov
e pr
oduc
tion
proc
esse
s in
such
a w
ay a
s to
elim
inat
e in
spec
tion
(mak
e pr
oces
ses f
ails
afe)
–
Kai
zen
(acc
ept n
o de
fect
s)
– Ji
doka
Unn
eces
sary
m
ovem
ent
– C
reat
ing
inef
feci
ent f
low
s
– M
otio
n st
udie
s. Fi
rst,
impr
ove
the
mot
ions
and
, th
en, a
utom
ate
(oth
erw
ise
was
te
is a
utom
ated
) –
Layo
ut
Exce
ss in
vent
ory
– Lo
nger
lead
tim
es
– O
bsol
esce
nce
– Po
ssib
ly d
amag
ed
good
s –
Extra
stor
age
and
trans
porta
tion
cost
s –
Del
ays
– Ti
ed-u
p ca
pita
l –
Hid
es p
robl
ems,
such
as l
ate
deliv
erie
s fro
m
supp
liers
, def
ects
, eq
uipm
ent
dow
ntim
e an
d lo
ng se
tup
times
– R
educ
e le
ad
times
and
setu
p tim
es th
roug
h (1
) sy
nchr
oniz
ed
wor
k flo
ws,
(2)
impr
ovin
g w
ork
skill
s and
(3)
prod
uctio
n le
velin
g –
Ach
ieve
one
-pi
ece
flow
–
Red
uce
all o
ther
w
aste
s
Ove
rpro
cess
ing
– Pr
oduc
ing
defe
cts
– U
nnec
essa
ry
mot
ion
– O
ver-
qual
ity
is u
nnec
essa
ry
– U
se 5
why
s:
Why
is th
e pa
rt/pr
oduc
t m
ade?
Why
is
the
proc
ess
nece
ssar
y?
Unn
eces
sary
tr
ansp
orta
tion
– Ti
me
cons
umin
g –
Bui
ld a
layo
ut
that
min
imiz
es
trans
porta
tion
– R
atio
naliz
e w
hy
trans
porta
tion
is
nece
ssar
y
Wai
tng
time
– Pr
oces
sing
del
ays
– O
pera
tors
not
w
orki
ng
– Ex
cess
inve
ntor
y
– Pr
oduc
tion
leve
ling
– Sy
nchr
oniz
e w
ork
flow
–
Bal
ance
une
ven
wor
kloa
d by
flex
ible
w
orke
rs
Ove
rpro
duct
ion
– C
ause
s the
oth
er
six
was
tes
– O
vers
taff
ing
– Ex
tra st
orag
e co
sts
– Ex
tra
trans
porta
tion
cost
s
– R
educ
e se
tup
times
–
Adj
ust t
imin
g an
d qu
antit
ies b
etw
een
proc
esse
s –
Vis
ibili
ty
(thro
ugh
e.g.
pr
oduc
tion
smoo
thin
g an
d va
lue
stre
am
map
ping
) –
Com
pact
the
prod
uctio
n fa
cilit
y la
yout
–
Prod
uce
wha
t is
need
ed
Was
tes
Why
a
prob
lem
?
Poss
ible
so
lutio
ns
Improving Materials Supply Processes to Assembly Lines
29
2.5 Lean Manufacturing (or just Lean)
Some authors question Lean to be a ”repackaged version of a previously popular method”
(Näslund, 2013, p. 86), i.e. a derivative of TPS (see Dahlgaard & Dahlgaard-Park, 2006; Näslund,
2013). Others may say that Lean manufacturing is merely a production method to minimize waste,
and, in turn, create value (see Botti, Mora & Regattieri, 2017). However, it cannot be emphasized
enough that Lean, or TPS, is not only a tool kit (Liker, 2004). It is much more than Lean tools and
techniques such as the Kanban system, 5S, 5Whys etc. Instead, Liker (2004) argues that it is, like
TPS, a sophisticated system in which all parts contribute to the whole. Additionally, it is a widely
used change philosophy (Näslund, 2013).
Lean production was first mentioned by researcher John Krafcik in 1988, who participated
in the International Motor Vehicle Program (IMVP) studying the car industry internationally
(Womack et al., 1990). Womack et al. (1990) explains Lean production to be ”lean” because it,
basically, uses less of everything in comparison to mass production (Womack, et al., 1990).
Womack and Jones (1996) discusses five Lean principles: (1) value, (2) the value stream, (3) flow,
(4) pull and (5) perfection.
! Value. The ultimate customer defines the value.
! Value stream. The set of activities that bring the product through the company.
! Flow. Flow is created by focusing on the value creating activities.
! Pull. By establishing a pull system, the customer gets the product when actually
needed.
! Perfection. Improvement is a continuous activity to bring value to customers, and,
therefore, a Lean company always seek for perfection, i.e. to continually strive to
decrease costs, manufacture zero defects, hold zero inventory and have an endless
product variety (Womack et al., 1990).
Activities within a value stream can be further divided into three categories (Liker, 2004; Olhager,
2013), describing the value to customer: (1) value-added activities, (2) non value-added activities
and (3) essential non value-added activities.
! Value-added activities (VAA): Anything that adds value to a product (Hall, 1987;
Ohno, 1988), i.e. the actual transformation processes (Liker, 2004). Ohno (1988) and
Olhager (2013) exemplifies with activities that create a change of shape and leads to
the completion of a product.
Theoretical Framework
30
! Non value-added activities (NVAA): Basically, this is everything not adding value
(Hall, 1987), such as transportation, storage, inspection, testing etc. (Olhager, 2013).
Some may say that such activities are VAA, since they make the product available
for the customer (Olhager, 2013)3. But in the conventional sense, those activities are
regarded as waste (Ohno, 1988). The conditions need to be partially changed to
eliminate them (Ohno, 1988).
! Essential non value-added activities (ENVAA): All activities that support effective
transformation processes of a product (Olhager, 2013). Examples are information-
based activities such as planning and forecasting (Olhager, 2013).
When used to its full extent, Lean even goes outside of the production facility and also integrates
suppliers in joint activities, such as, value analysis to reduce costs, information sharing, establishing
prices and agreements on sharing profits (Womack et al., 1990).
There are several process enhancement tools related to TPS/Lean, which is discussed in
more detail in the following sections. However, the centrality of people is missed if only focusing
on the tools. The people might not understand the culture behind TPS (Liker, 2004). Having that
said, a company shall strive for implementing the whole concept, rather than specific tools.
2.5.1 Industry appropriateness
Liker (2004) briefly discusses which businesses Lean applies to, since many practitioners often
think that Lean cannot be applied to their company. However, Lean is not about imitating the
manufacturing processes at Toyota, but rather about developing principles for any organization,
and, then, practice them relentlessly to be competitive and add value to customers (Liker, 2004).
Thus, according to Womack et al. (1990), the principles of Lean production can be applied to every
industry (Womack et al., 1990). Womack et al. (1990) may be biased in their statement, since the
appropriateness of Lean implementations in different organizations is a matter for debate (see e.g.
Christopher & Towill, 2000; Näslund, 2013).
2.5.2 Characteristics appropriateness
In fact, Näslund (2013) concludes that specific change efforts are not equally appropriate for every
company in every industry. An organization with high production volumes is, for example, likely to
be more successful after a Lean implementation (Näslund, 2013). However, a high degree of
customization and variability can cause some disturbances though (Näslund, 2013). A Lean
3 However, if the production lead time is shorter than the time a customer expects the delivery, the product could have been manufactured when the customer order was received. Therefore, such activities here are regarded as NVAA.
Improving Materials Supply Processes to Assembly Lines
31
implementation works best when the strategy to reach competitiveness is based on customer drivers
such as cost (see Christopher & Towill, 2000; Hallgren & Olhager, 2009). When the market winner
instead is service level, other initiatives such as Agile manufacturing is more appropriate (see
Christopher & Towill, 2000; Hallgren & Olhager, 2009). Another distinguishing attribute for
products in an Agile inititative is high profit margin (Christopher & Towill, 2000)4. Moreover, a
key characteristic of a Lean production is that it is repetitive (Hallgren & Olhager, 2009).
2.6 Kaizen
No process is ever perfect, so there is always room for improvements (Olhager, 2013). Kaizen – the
philosophy of continuous improvements – is, therefore, paramount to TPS/Lean because all other
principles and methods revolve around improvement.
There is an ambition to always strive for perfection – a perfect conformity to specification is
realistic in all cases (Schonberger, 1983). Kaizen is that total philosophy of striving for perfection
(Liker, 2014). Basically, it is the process of doing incremental improvements, regardless magnitude,
in the endeavor to eliminate waste (Liker, 2004). All employees should try to improve processes all
the time (Olhager, 2013). Liker (2004) mentions that kaizen consists of everything from (1)
teaching skills of problem solving, (2) working effectively and (3) documenting, to (4) analyzing
data and (5) self-managing. This, in turn, pushes a lot of responsibility onto the workers (Womack
et al., 1990). The people are the ones driving continuous improvement (Liker, 2004).
2.7 People & Teamwork
The unquestionable essence of the Toyota philosophy is the culture, and the culture needs to support
the people doing the work (Liker, 2004). It starts with upper management, who needs to be
commited to their goals (Liker, 2004). But ultimately, it is the blue-collar workers who fulfill goals
such as quality (Liker, 2004). First telling people they are important, but then risk their health and
safety to reach production goals is doomed (Liker, 2004). Everything starts with pushing
responsibility down the organization (Womack et al., 1990).
Motivation methods are often used in TPS/Lean to motivate associates (Liker, 2004). At
Toyota, five essential motivation theories have been used for this purpose (Liker, 2004). These are
not only external-driven theories, but internal-driven as well (Liker, 2004). The external-driven
theories assume that people are motivated by (1) reward, (2) punishments and (3) goal setting
(Liker, 2004). The internal-driven theories, however, focus on self-actualization through employees
moving in hierarchy, and job enrichment through, for example, a safe and attractive work
environment (Liker, 2004). 4 Such principles are, however, not within the area of this paper’s scope, and are not further evaluated.
Theoretical Framework
32
To fully master TPS/Lean, a company needs to move outside of their facility and
incorporate suppliers and customers. This extended network helps companies to improve and
challenge each other (Liker, 2004). Since plants strive for high-quality JIT deliveries, a company
needs their suppliers to be as capable as they are (Liker, 2004). Collaboration for mutual learning is,
thus, important (Liker, 2004).
2.8 Just-in-Time (JIT)
JIT is the skeletal structure of TPS, and was the starting point of the system (Ohno, 1988). The aim
is that the right parts reach the right location in the right amount and at the right time (Ohno, 1988).
The name of the method emphasizes the philosophy; no parts shall arrive earlier – this means waste
due to increased costs for inventory and space used, as well as extra managing of parts (Ohno,
1988). Needless to say, no parts shall neither arrive later than on time (Ohno, 1988). Shingo (1984)
illustrates these time management procedures with a train and a passenger: The passenger wants to
be at the train station on time to catch the train, but not too early due to waiting time; however, the
passenger will not get a seat if the train is full (p. 122), which means even more waiting time. If a
company accomplishes a flow through JIT, they can approach zero inventory (Ohno, 1988; Shingo,
1984).
2.8.1 Continuous flow
A continuous flow lowers the ”water level” of inventory and, in turn, exposes problems that need to
be fixed (Liker, 2004). A true one-piece flow is what TPS theoretically aims for, since this would,
according to Liker (2004), result in a zero-inventory system with goods appearing when they are
needed. A one-piece flow, for example, creates an in-build quality, real flexibility, free up floor
space and improves safety (due to smaller batch sizes and less forklifts transportation) (Liker,
2004).
The one-piece flow is, however, not always possible due to processes being too far apart or
variations in cycle times (Liker, 2004). Instead, a company should walk by the motto to flow where
they can but to pull where they must (Rother & Shook, 1999). The second best thing is to arrange a
pull system with some inventory (Liker, 2004).
2.8.2 Pull system vs. push system
A multi-step production system involves several processes with either pull or push methods (Ohno,
1988). The push method is widely used in industry (Ohno, 1988; Liker, 2004); when used all
through often referred to as mass production. By utilizing inventory on hand and demand
predictions, production quantities are planned (Ohno, 1988; Liker, 2004). Essentially, the products
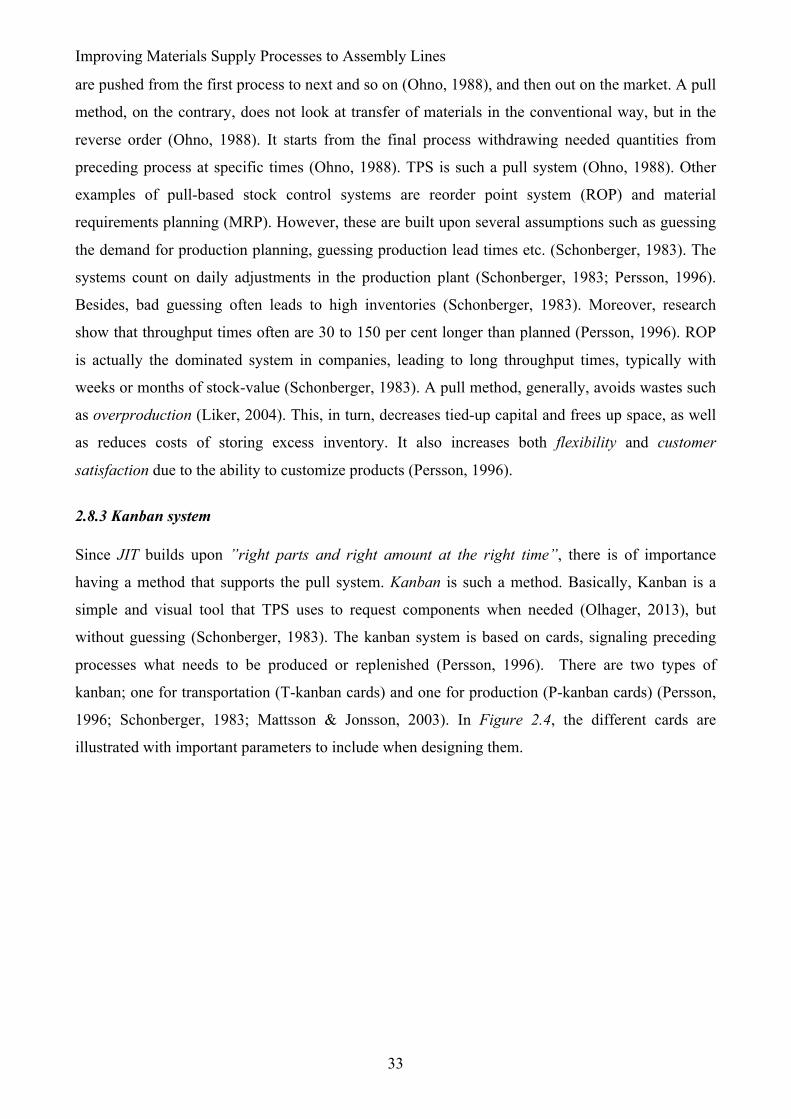
Improving Materials Supply Processes to Assembly Lines
33
are pushed from the first process to next and so on (Ohno, 1988), and then out on the market. A pull
method, on the contrary, does not look at transfer of materials in the conventional way, but in the
reverse order (Ohno, 1988). It starts from the final process withdrawing needed quantities from
preceding process at specific times (Ohno, 1988). TPS is such a pull system (Ohno, 1988). Other
examples of pull-based stock control systems are reorder point system (ROP) and material
requirements planning (MRP). However, these are built upon several assumptions such as guessing
the demand for production planning, guessing production lead times etc. (Schonberger, 1983). The
systems count on daily adjustments in the production plant (Schonberger, 1983; Persson, 1996).
Besides, bad guessing often leads to high inventories (Schonberger, 1983). Moreover, research
show that throughput times often are 30 to 150 per cent longer than planned (Persson, 1996). ROP
is actually the dominated system in companies, leading to long throughput times, typically with
weeks or months of stock-value (Schonberger, 1983). A pull method, generally, avoids wastes such
as overproduction (Liker, 2004). This, in turn, decreases tied-up capital and frees up space, as well
as reduces costs of storing excess inventory. It also increases both flexibility and customer
satisfaction due to the ability to customize products (Persson, 1996).
2.8.3 Kanban system
Since JIT builds upon ”right parts and right amount at the right time”, there is of importance
having a method that supports the pull system. Kanban is such a method. Basically, Kanban is a
simple and visual tool that TPS uses to request components when needed (Olhager, 2013), but
without guessing (Schonberger, 1983). The kanban system is based on cards, signaling preceding
processes what needs to be produced or replenished (Persson, 1996). There are two types of
kanban; one for transportation (T-kanban cards) and one for production (P-kanban cards) (Persson,
1996; Schonberger, 1983; Mattsson & Jonsson, 2003). In Figure 2.4, the different cards are
illustrated with important parameters to include when designing them.
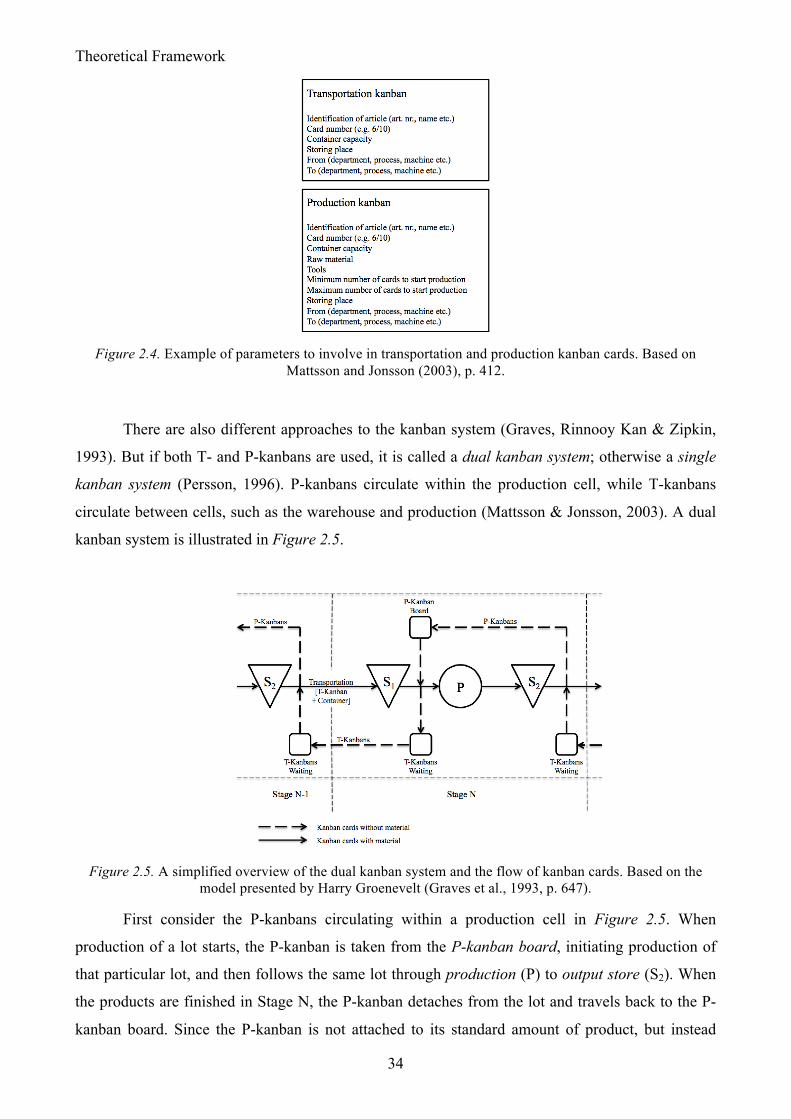
Theoretical Framework
34
Figure 2.4. Example of parameters to involve in transportation and production kanban cards. Based on
Mattsson and Jonsson (2003), p. 412.
There are also different approaches to the kanban system (Graves, Rinnooy Kan & Zipkin,
1993). But if both T- and P-kanbans are used, it is called a dual kanban system; otherwise a single
kanban system (Persson, 1996). P-kanbans circulate within the production cell, while T-kanbans
circulate between cells, such as the warehouse and production (Mattsson & Jonsson, 2003). A dual
kanban system is illustrated in Figure 2.5.
Figure 2.5. A simplified overview of the dual kanban system and the flow of kanban cards. Based on the
model presented by Harry Groenevelt (Graves et al., 1993, p. 647).
First consider the P-kanbans circulating within a production cell in Figure 2.5. When
production of a lot starts, the P-kanban is taken from the P-kanban board, initiating production of
that particular lot, and then follows the same lot through production (P) to output store (S2). When
the products are finished in Stage N, the P-kanban detaches from the lot and travels back to the P-
kanban board. Since the P-kanban is not attached to its standard amount of product, but instead
Improving Materials Supply Processes to Assembly Lines
35
posted on the board, it signals a need of replenishment of output store (Graves et al., 1993). The
kanban boards show all up-coming production, making it visible to both operators and management
(Graves et al., 1993).
Secondly, we look at the T-kanbans in Figure 2.5, which have the role of initiating
transportations (Graves et al., 1993). T-kanbans obviously travel between consecutive stages, and,
therefore, there can be several queues of detached T-kanbans. There can be one queue in Stage N
waiting on transportation over to Stage N-1. There can also be a queue in Stage N-1, waiting on
either a lot or transportation over to Stage N. After transportation, the T-kanban is attached to the lot
in input storage (S1) until the production of that lot starts, initiated by a P-kanban from the kanban
board.
There are a number of ways to organize the transportation function (Graves et al., 1993).
Either there can be a fixed interval system, which means that pick-ups are done every hour or half
hour, or there can be a fixed quantity system (Graves et al., 1993). The latter means that a pick-up is
done when a pre-determined quantity is reached (Graves et al., 1993).
The Kanban system also leans on some basic rules that needs to be followed: (i) no
production can be initiated without a P-kanban card, (ii) neither can there be any transportation
without a T-kanban card and (iii) all material being part of the system has a kanban card attached
(Graves et al., 1993).
2.8.3.1 Number of kanban cards.
To calculate the necessary amount of cards, aspects such as lead times for replenishment and safety
stocks protecting against variations need to be taken into consideration (Mattsson & Jonsson,
2003). Ideally, the production order quantity and the transportation order quantity are the same as
the standard container quantity (Mattsson & Jonsson, 2003). If not possible, multiples of the
standard container quantity can be used for P- and T-kanban cards (Mattsson & Jonsson, 2003).
Moreover, the number of kanban cards decides the amount of WIP (Persson, 1996). Mattsson and
Jonsson (2003), and Monden (1983) present the same way of calculating the number of kanban
cards for an article in Equation 1.
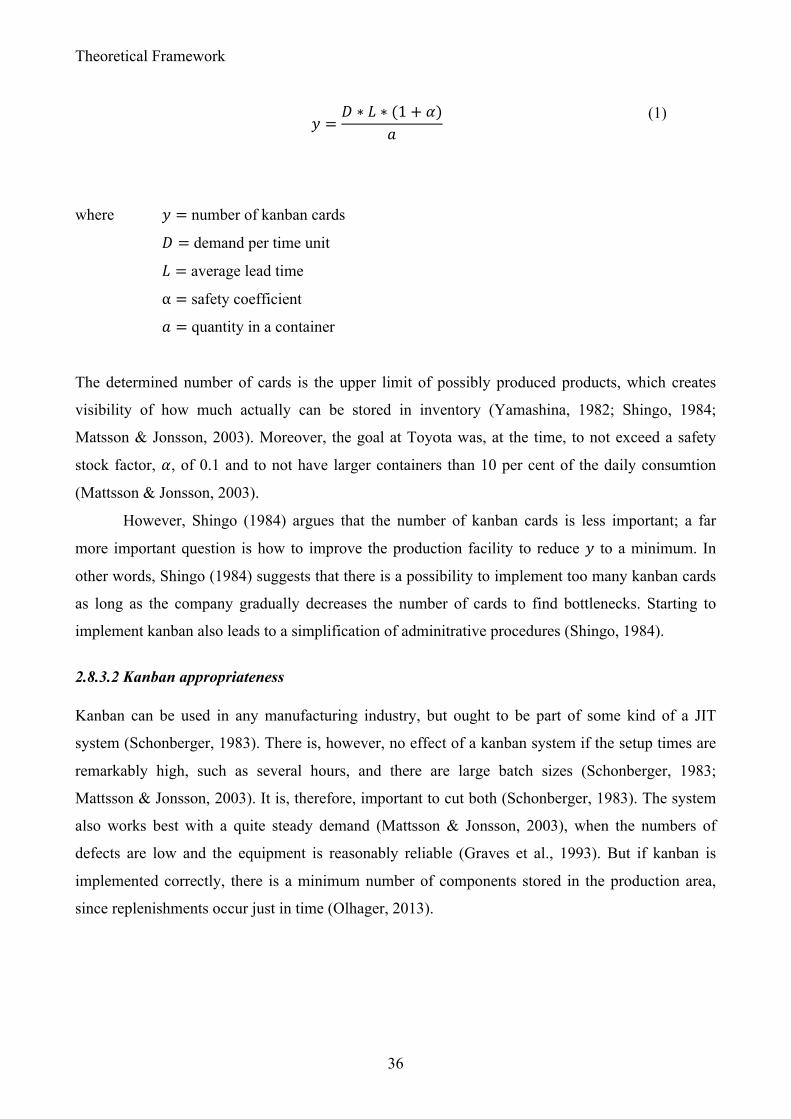
Theoretical Framework
36
𝑦 =
𝐷 ∗ 𝐿 ∗ (1+ 𝛼)𝑎
(1)
where 𝑦 = number of kanban cards
𝐷 = demand per time unit
𝐿 = average lead time
α = safety coefficient
𝑎 = quantity in a container
The determined number of cards is the upper limit of possibly produced products, which creates
visibility of how much actually can be stored in inventory (Yamashina, 1982; Shingo, 1984;
Matsson & Jonsson, 2003). Moreover, the goal at Toyota was, at the time, to not exceed a safety
stock factor, 𝛼, of 0.1 and to not have larger containers than 10 per cent of the daily consumtion
(Mattsson & Jonsson, 2003).
However, Shingo (1984) argues that the number of kanban cards is less important; a far
more important question is how to improve the production facility to reduce 𝑦 to a minimum. In
other words, Shingo (1984) suggests that there is a possibility to implement too many kanban cards
as long as the company gradually decreases the number of cards to find bottlenecks. Starting to
implement kanban also leads to a simplification of adminitrative procedures (Shingo, 1984).
2.8.3.2 Kanban appropriateness
Kanban can be used in any manufacturing industry, but ought to be part of some kind of a JIT
system (Schonberger, 1983). There is, however, no effect of a kanban system if the setup times are
remarkably high, such as several hours, and there are large batch sizes (Schonberger, 1983;
Mattsson & Jonsson, 2003). It is, therefore, important to cut both (Schonberger, 1983). The system
also works best with a quite steady demand (Mattsson & Jonsson, 2003), when the numbers of
defects are low and the equipment is reasonably reliable (Graves et al., 1993). But if kanban is
implemented correctly, there is a minimum number of components stored in the production area,
since replenishments occur just in time (Olhager, 2013).
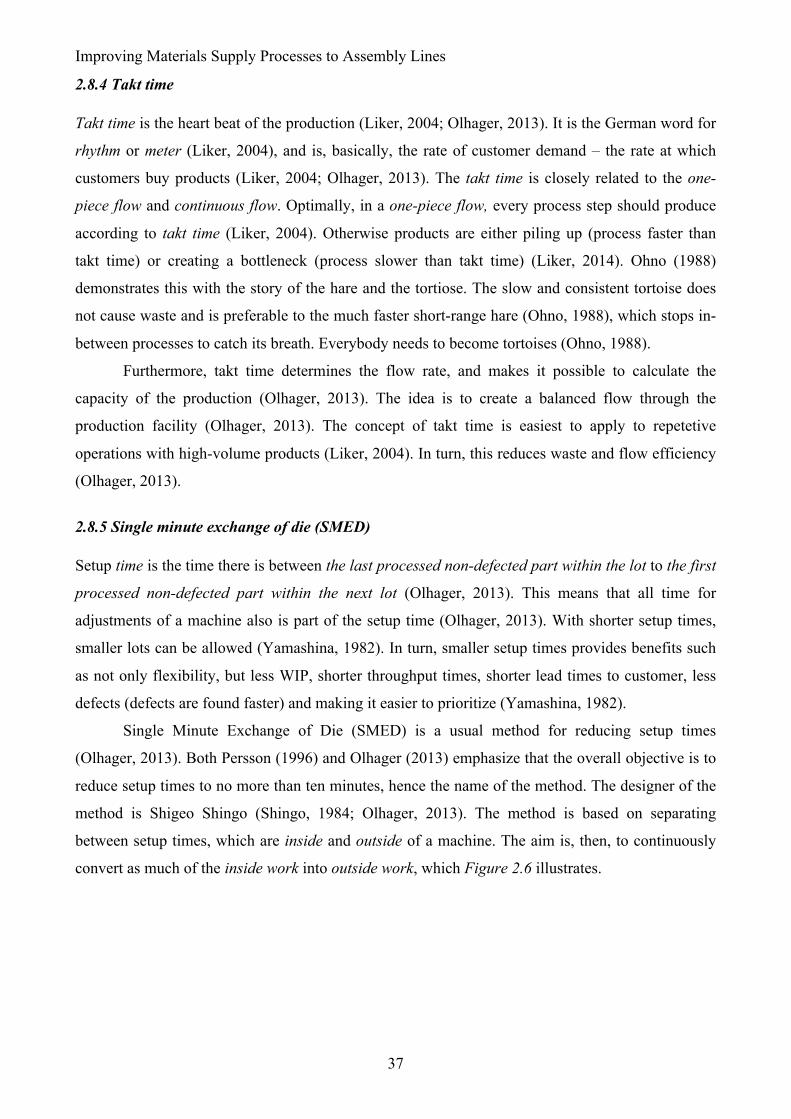
Improving Materials Supply Processes to Assembly Lines
37
2.8.4 Takt time
Takt time is the heart beat of the production (Liker, 2004; Olhager, 2013). It is the German word for
rhythm or meter (Liker, 2004), and is, basically, the rate of customer demand – the rate at which
customers buy products (Liker, 2004; Olhager, 2013). The takt time is closely related to the one-
piece flow and continuous flow. Optimally, in a one-piece flow, every process step should produce
according to takt time (Liker, 2004). Otherwise products are either piling up (process faster than
takt time) or creating a bottleneck (process slower than takt time) (Liker, 2014). Ohno (1988)
demonstrates this with the story of the hare and the tortiose. The slow and consistent tortoise does
not cause waste and is preferable to the much faster short-range hare (Ohno, 1988), which stops in-
between processes to catch its breath. Everybody needs to become tortoises (Ohno, 1988).
Furthermore, takt time determines the flow rate, and makes it possible to calculate the
capacity of the production (Olhager, 2013). The idea is to create a balanced flow through the
production facility (Olhager, 2013). The concept of takt time is easiest to apply to repetetive
operations with high-volume products (Liker, 2004). In turn, this reduces waste and flow efficiency
(Olhager, 2013).
2.8.5 Single minute exchange of die (SMED)
Setup time is the time there is between the last processed non-defected part within the lot to the first
processed non-defected part within the next lot (Olhager, 2013). This means that all time for
adjustments of a machine also is part of the setup time (Olhager, 2013). With shorter setup times,
smaller lots can be allowed (Yamashina, 1982). In turn, smaller setup times provides benefits such
as not only flexibility, but less WIP, shorter throughput times, shorter lead times to customer, less
defects (defects are found faster) and making it easier to prioritize (Yamashina, 1982).
Single Minute Exchange of Die (SMED) is a usual method for reducing setup times
(Olhager, 2013). Both Persson (1996) and Olhager (2013) emphasize that the overall objective is to
reduce setup times to no more than ten minutes, hence the name of the method. The designer of the
method is Shigeo Shingo (Shingo, 1984; Olhager, 2013). The method is based on separating
between setup times, which are inside and outside of a machine. The aim is, then, to continuously
convert as much of the inside work into outside work, which Figure 2.6 illustrates.
Theoretical Framework
38
Figure 2.6. The methodology of how SMED works. Retrieved from Yamashina (1982), p. 19.
Shingo (1984) established an eight-step-process for reducing setup times:
1. Separate between Inside Exchange of Die (IED) and Outside Exchange of Die (OED). OED
(tools, jigg and fixtures, material etc.) should be perfectly structured next to the machine
(Shingo, 1984). OED activities refer to activities that can be executed while the machine is
active (Yamashina, 1982; Olhager, 2013). IED activities refer to activities that require the
machine to be stopped (Yamashina, 1982; Olhager, 2013).
2. Convert IED to OED. This step often requires some ingenuity (Yamashina, 1982). Methods
of how to do the conversion follow in step three to eight.
3. Functional standardization. Standardizing the shape and dimension of tools often facilitates
setups (Shingo, 1984). But more importantly is to standardize the dimensions that are
essential for tool attachment (Shingo, 1984). Shingo (1984) examplifies that all tools should
have the same clamping height. In turn, the same clamps can be used everywhere (Shingo,
1984).
4. Functional clamps. Clamps should be constructed in such a way that they require minimum
time and effort (Shingo, 1984). Say, for example, that a bolt has 15 threads, it needs to be
turned 14 times before it tightens on the last turn (Yamashina, 1982). Such an arrangement
may be re-arranged depending on the requirements of clamping force (Yamashina, 1982).
5. Pre-adjusted fixtures. The up-coming tools can be attached on standardized fixtures while
the machine is still processing the previous lot.
6. Parallel operations. Two operators work in parallel during the setup (Yamashino, 1982).
For example, tools for injection moulding consists of two plates (injection mould and
erector mould). If such plates can be attached in parallel, Shingo (1984) argues that the
attachment time can be reduced by 2/3.
7. Eliminate adjustments. According to Shingo (1984), adjustments take up 50-70 per cent of
IED. Adjustments can be divided into positioning (e.g. moving from 150 mm to 200 mm)
and adjusting (e.g. moving back and forth until desired result is achieved) (Shingo, 1984).
All adjusting should be removed (Shingo, 1984).
Improving Materials Supply Processes to Assembly Lines
39
8. Mechanization. Mechanization of the setup process should be used only when the first seven
steps have been implemented already.
Olhager (2013) recommends each company experiencing some issues with setup times to do a
business case in which they analyze setup times. Because if these eight steps are used, Shingo
(1984) emphasizes that setup times will be decreased by 67 to 90 percent. Ohno (1988) further
clarifies that Toyota managed to decrease their setup times from two to three hours into three
minutes (i.e. with more than 97 per cent).
2.9 Jidoka
Jidoka is the second pillar stone in TPS (Liker, 2004). The principle is often referred to as
autonomation – that is applying human intelligence into machines to stop them when there is a
problem (Ohno, 1988; Liker, 2004; Modig & Åhlström, 2012; Olhager, 2013). Basically, the
principle is based on methods of automatically stopping production when a problem occurs,
requiring the operator to fix the problem and, by doing so, preventing defects flowing downstreams
(Liker, 2004) creating even more damage through tied-up capital.
Modig and Åhlström (2012) use a football reference when describing jidoka. If JIT is the
flow of the ball, the flow of players and their collaboration, they say jidoka is not only the rules but
the pitch itself with its lines, with the players, the scoreboard and the referee’s whistle (Modig &
Åhlström, 2012). Everything is visible for the players, and the same should be true for an
organisation. Moreover, if a player commits a foul, the referee blows her whistle. That should also
be true within an organisation. Therefore, jidoka is the countermeasure of JIT.
Jidoka focuses on creating an organisation that is visible enough to identify anything that
impedes or interferes with the flow (Modig & Åhlström, 2012) to eliminate it immediately. There is
no room for compromises in terms of quality in TPS, and therefore, jidoka builds upon quality
controls in every step in the production process (Olhager, 2013). Every team member has a
responsibility to do a quality inspection before next workstation (Olhager, 2013). Even though it
means a temporary stop in production (Olhager, 2013), it is essential for equipment to stop
immediately if there is any possibility for defects (Ohno, 1988, Olhager, 2013). Therefore, jidoka is
the other side of the JIT coin (Modig & Åhlström, 2012), the countermeasure to smooth flow.
2.9.1 Genchi genbutsu
Genchi genbutsu is Japanese for ”real location, real thing”, but Liker (2004) with many other
authors who have been in the business of Toyota interpret it as ”go and see for yourself to
thoroughly understand the situation”. This is part of jidoka, since it contributes to a better visibility.
Theoretical Framework
40
Also, the real issues need to be understood before improvements actually can be done (Olhager,
2013).
Liker (2004) exemplifies genchi genbutsu with the Ohno Circle – in which employees have
been forced, according to the many stories, to stand in a circle for several hours, just to ”watch for
themselves”. Obviously, data is important in manufacturing, but Ōno Taichii emphasizes that the
data is merely indicators of what is going on, one step removed from the actual processes (Liker,
2004). Ohno (1988) stresses the importance of going to the heart of the matter, but also to have a a
chessplayer’s overview of the entire picture.
As there is of importance to pass on information out of personally verified data, genchi
genbutsu is essential (Liker, 2004). But since time is finite for many managers, at least hourensou
can be used (Liker, 2004). Hourensou is a method for, especially, senior management to surround
themselves with people they trust, who can go see for them (Liker, 2004). Then, they hou koku
(report), ren-raku (update) and sou dan (consult or discuss) what they have seen (Liker, 2004).
2.9.2 5 Whys
When involved personally through genchi genbutsu, problems are going to be identified. Then, the
identified problem needs to be traced back to its root cause, which often is hidden beneath more
obviously identified issues (Ohno, 1988; Womack, Jones & Roos, 1990). Toyota implements this
by asking why five times to reach the root cause (Ohno, 1988; Womack, Jones & Roos, 1990;
Shingo, 1984). Ohno (1988) exemplifies the process of 5 Whys when confronted with a machine
that has stopped:
! Why? A fuse blew due to an overload.
! Why? Not enough lubrication on the bearing.
! Why? The lubrication pump did not pump sufficiently.
! Why? Due to a shaft that was worn out.
! Why? Metal scrap was present because there was not a strainer attached.
In this example, the root cause is found within the machine, but Olhager (2013) emphasizes that it
can often be found elsewhere in a complete different area from where the problem is identified.
2.9.3 5S
TPS goes beyond the production processes themselves and covers aspects of the entire organisation
(Olhager, 2013). Therefore, Toyota has developed a method that creates and maintains a clean,
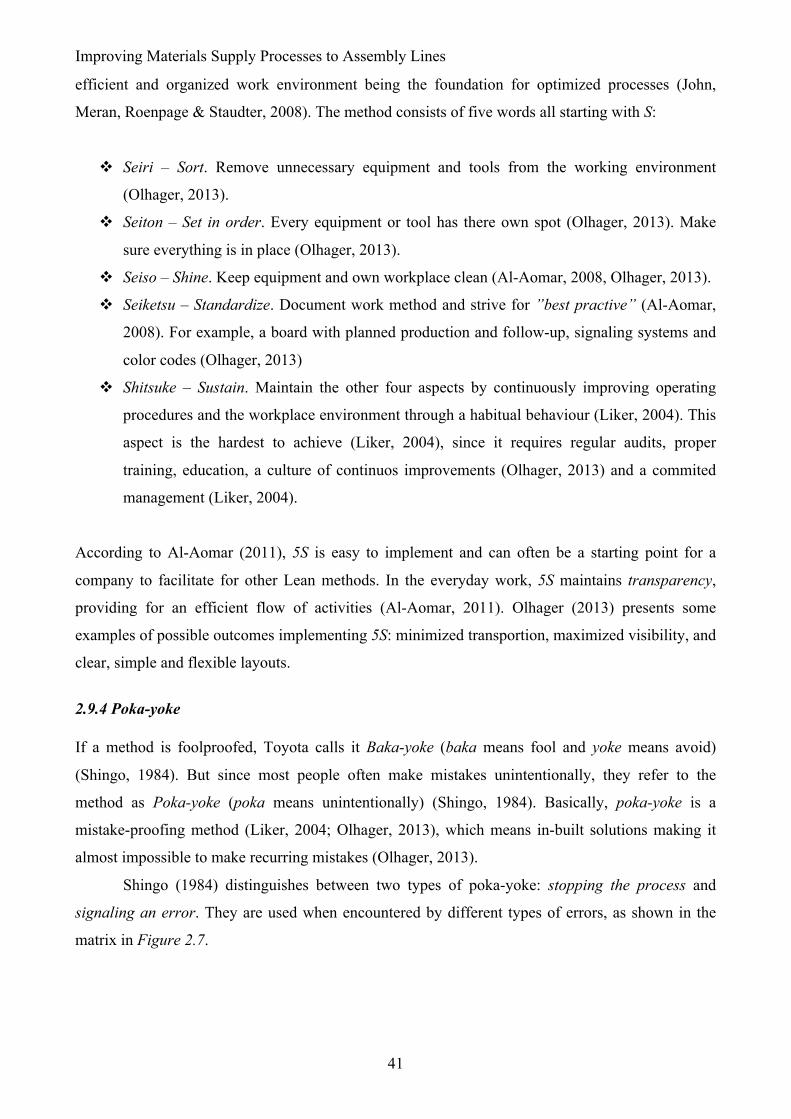
Improving Materials Supply Processes to Assembly Lines
41
efficient and organized work environment being the foundation for optimized processes (John,
Meran, Roenpage & Staudter, 2008). The method consists of five words all starting with S:
! Seiri – Sort. Remove unnecessary equipment and tools from the working environment
(Olhager, 2013).
! Seiton – Set in order. Every equipment or tool has there own spot (Olhager, 2013). Make
sure everything is in place (Olhager, 2013).
! Seiso – Shine. Keep equipment and own workplace clean (Al-Aomar, 2008, Olhager, 2013).
! Seiketsu – Standardize. Document work method and strive for ”best practive” (Al-Aomar,
2008). For example, a board with planned production and follow-up, signaling systems and
color codes (Olhager, 2013)
! Shitsuke – Sustain. Maintain the other four aspects by continuously improving operating
procedures and the workplace environment through a habitual behaviour (Liker, 2004). This
aspect is the hardest to achieve (Liker, 2004), since it requires regular audits, proper
training, education, a culture of continuos improvements (Olhager, 2013) and a commited
management (Liker, 2004).
According to Al-Aomar (2011), 5S is easy to implement and can often be a starting point for a
company to facilitate for other Lean methods. In the everyday work, 5S maintains transparency,
providing for an efficient flow of activities (Al-Aomar, 2011). Olhager (2013) presents some
examples of possible outcomes implementing 5S: minimized transportion, maximized visibility, and
clear, simple and flexible layouts.
2.9.4 Poka-yoke
If a method is foolproofed, Toyota calls it Baka-yoke (baka means fool and yoke means avoid)
(Shingo, 1984). But since most people often make mistakes unintentionally, they refer to the
method as Poka-yoke (poka means unintentionally) (Shingo, 1984). Basically, poka-yoke is a
mistake-proofing method (Liker, 2004; Olhager, 2013), which means in-built solutions making it
almost impossible to make recurring mistakes (Olhager, 2013).
Shingo (1984) distinguishes between two types of poka-yoke: stopping the process and
signaling an error. They are used when encountered by different types of errors, as shown in the
matrix in Figure 2.7.
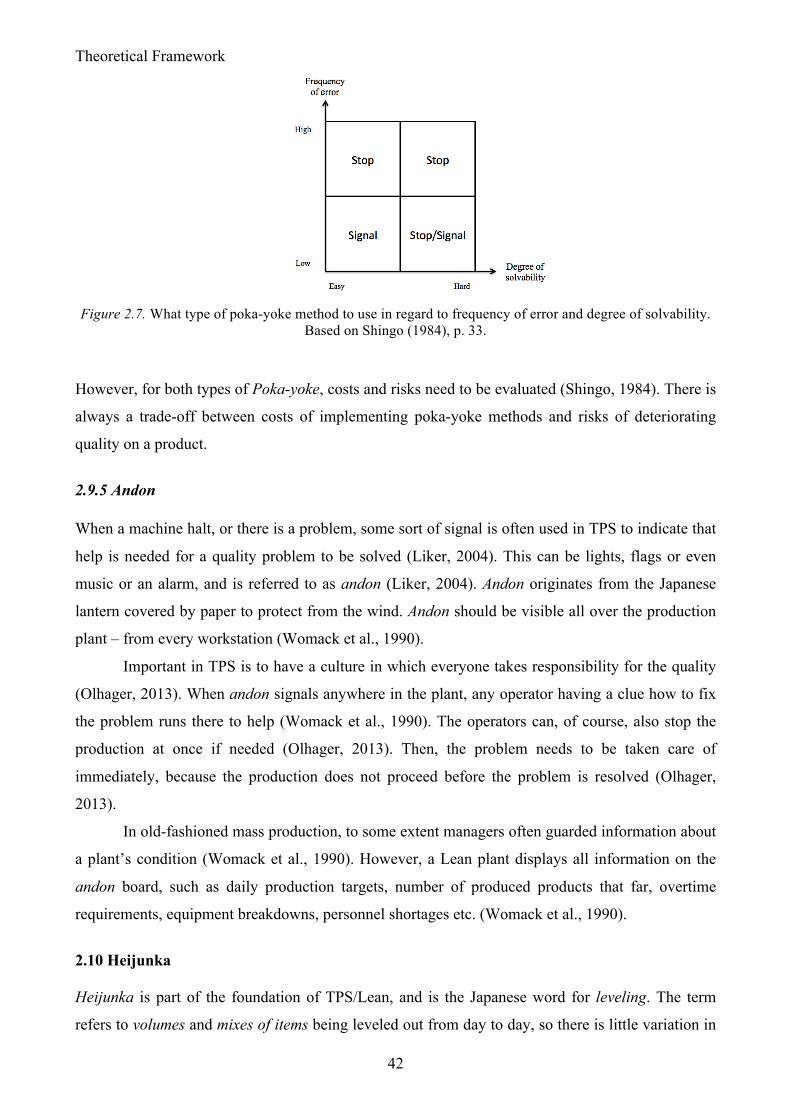
Theoretical Framework
42
Figure 2.7. What type of poka-yoke method to use in regard to frequency of error and degree of solvability.
Based on Shingo (1984), p. 33.
However, for both types of Poka-yoke, costs and risks need to be evaluated (Shingo, 1984). There is
always a trade-off between costs of implementing poka-yoke methods and risks of deteriorating
quality on a product.
2.9.5 Andon
When a machine halt, or there is a problem, some sort of signal is often used in TPS to indicate that
help is needed for a quality problem to be solved (Liker, 2004). This can be lights, flags or even
music or an alarm, and is referred to as andon (Liker, 2004). Andon originates from the Japanese
lantern covered by paper to protect from the wind. Andon should be visible all over the production
plant – from every workstation (Womack et al., 1990).
Important in TPS is to have a culture in which everyone takes responsibility for the quality
(Olhager, 2013). When andon signals anywhere in the plant, any operator having a clue how to fix
the problem runs there to help (Womack et al., 1990). The operators can, of course, also stop the
production at once if needed (Olhager, 2013). Then, the problem needs to be taken care of
immediately, because the production does not proceed before the problem is resolved (Olhager,
2013).
In old-fashioned mass production, to some extent managers often guarded information about
a plant’s condition (Womack et al., 1990). However, a Lean plant displays all information on the
andon board, such as daily production targets, number of produced products that far, overtime
requirements, equipment breakdowns, personnel shortages etc. (Womack et al., 1990).
2.10 Heijunka
Heijunka is part of the foundation of TPS/Lean, and is the Japanese word for leveling. The term
refers to volumes and mixes of items being leveled out from day to day, so there is little variation in
Improving Materials Supply Processes to Assembly Lines
43
production (Liker, 2004; Olhager, 2013). Heijunka considers the total volume of orders over a
period of time, and, then, produces the same amount and mix each day (Liker, 2004). Often,
however, customer demand fluctuates from day to day (Liker, 2004), but this can be dealt with
through production leveling, giving an even order flow to customers (Olhager, 2013). Moreover,
collaboration with suppliers and customers are equally important, establishing, for example,
standard times for delivery.
In the center of the TPS house one can find muda – the elimination of waste. However, it is
equally important to minimize both muri and mura, which Toyota together with muda calls the
three M’s (Liker, 2004). Muri is overburden of equipment or people, which causes either
breakdowns and defect or safety problems, while mura is unevenness in production (Liker, 2004).
Many companies starting to apply Lean thinking often forget about muri and mura (Liker, 2004).
Achieving heijunka is vital to reducing mura, which in turn reduces both muri and muda (Liker,
2004). The three M’s fit together and affect each other.
When producing batches, the goal is to achieve economies of scale for each and every piece
of an equipment (Liker, 2004). Then, it seems counter-intuitive to change tools to produce another
product, both due to downtime between setups and salaries of personnel while setting up the
machine (Liker, 2004). Therefore, many companies stick to large batches (Liker, 2004). Heijunka
often requires a reduction of setup times (Yamashina, 1982; Liker, 2004), using for example
SMED, and smaller batch sizes (Yamashina, 1982; Persson, 1996). Benefits, however, of leveling
the schedule (heijunka) are:
! Flexibility. Producing what customers want when they want it reduces both risk of unsold
goods and reduces inventory and correlated issues to a high inventory (Liker, 2004).
! Predictability. Heijunka creates a smoothed demand on processes upstream and, further, to
suppliers (Liker, 2004).
! Stability. The use of labor and machines are balanced throughout the day, which make it
easier to standardize work (Liker, 2004).
2.11 Standardized Work
Another foundation of TPS/Lean is to assure quality through standardized work (Olhager, 2013).
This does not only mean standardizing sequences of processes and sequences of how things are
done, but to standardize takt time and stock on hand (i.e. how much inventory does a worker need in
a process) as well (Ohno, 1988; Persson, 1996; Liker, 2004). Standardization is the basis for quality
and continuous improvement (Liker, 2004; Olhager 2013), since neither is it possible to improve
processes without standardization, nor guarantee quality without standard procedures (Liker, 2004).
Theoretical Framework
44
There are three elements to consider in the process of standardization according to Ohno
(1988). The elements are the machine, the material and the worker (Ohno, 1988). Since people
involvement is central in TPS/Lean, Ohno (1988) accentuates the combination of all elements.
Otherwise, the operators will feel alienated not reaching optimal efficiency (Ohno, 1988).
Therefore, Ohno (1988) also suggests that standards are set by the production workers themselves,
rather than by management only. Thereafter, the operators are the ones who improve the standards
(Liker, 2004).
2.12 Visual Management
In TPS/Lean, visual management is enforced everywhere (Ohno, 1988). This is implemented
through visual control, i.e. methods showing the presence of abnormalities at one glance (Liker,
2004). Many methods already described in this chapter are visual control systems, such as kanban,
standardized work, 5S, one-piece flow and andon (Liker, 2004). However, Liker (2004) also
emphasizes the importance of using visual management charts and graphs everywhere, showing the
actual status of each area (Liker, 2004). This can be implemented through process control boards,
i.e. white boards with important data (Liker, 2004). A simple process control board is pictured in
Figure 2.8.
Figure 2.8. An example of a process control board. Retrieved from Rother and Harris (2001), p.86.
Another TPS/Lean method for visual management is through A3 Reports. A typical A3
report is a full report documenting a process with its, for example, problems, current situation, root
causes, alternative and recommended solutions and a cost-benefit analysis – all on one sheet of
paper (A3) to access key information (Liker, 2004). The aim of visual controls is to ensure that no
problems are hidden, and designing a transparent environment without waste (Liker, 2004).
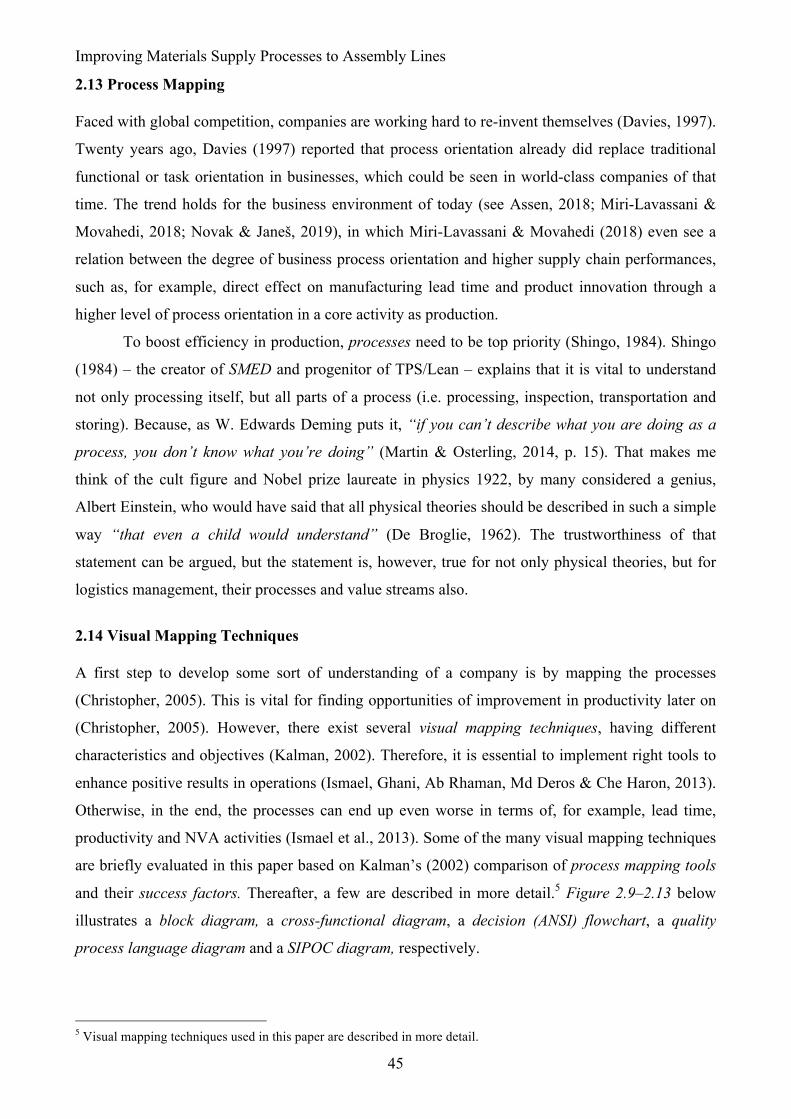
Improving Materials Supply Processes to Assembly Lines
45
2.13 Process Mapping
Faced with global competition, companies are working hard to re-invent themselves (Davies, 1997).
Twenty years ago, Davies (1997) reported that process orientation already did replace traditional
functional or task orientation in businesses, which could be seen in world-class companies of that
time. The trend holds for the business environment of today (see Assen, 2018; Miri-Lavassani &
Movahedi, 2018; Novak & Janeš, 2019), in which Miri-Lavassani & Movahedi (2018) even see a
relation between the degree of business process orientation and higher supply chain performances,
such as, for example, direct effect on manufacturing lead time and product innovation through a
higher level of process orientation in a core activity as production.
To boost efficiency in production, processes need to be top priority (Shingo, 1984). Shingo
(1984) – the creator of SMED and progenitor of TPS/Lean – explains that it is vital to understand
not only processing itself, but all parts of a process (i.e. processing, inspection, transportation and
storing). Because, as W. Edwards Deming puts it, “if you can’t describe what you are doing as a
process, you don’t know what you’re doing” (Martin & Osterling, 2014, p. 15). That makes me
think of the cult figure and Nobel prize laureate in physics 1922, by many considered a genius,
Albert Einstein, who would have said that all physical theories should be described in such a simple
way “that even a child would understand” (De Broglie, 1962). The trustworthiness of that
statement can be argued, but the statement is, however, true for not only physical theories, but for
logistics management, their processes and value streams also.
2.14 Visual Mapping Techniques
A first step to develop some sort of understanding of a company is by mapping the processes
(Christopher, 2005). This is vital for finding opportunities of improvement in productivity later on
(Christopher, 2005). However, there exist several visual mapping techniques, having different
characteristics and objectives (Kalman, 2002). Therefore, it is essential to implement right tools to
enhance positive results in operations (Ismael, Ghani, Ab Rhaman, Md Deros & Che Haron, 2013).
Otherwise, in the end, the processes can end up even worse in terms of, for example, lead time,
productivity and NVA activities (Ismael et al., 2013). Some of the many visual mapping techniques
are briefly evaluated in this paper based on Kalman’s (2002) comparison of process mapping tools
and their success factors. Thereafter, a few are described in more detail.5 Figure 2.9–2.13 below
illustrates a block diagram, a cross-functional diagram, a decision (ANSI) flowchart, a quality
process language diagram and a SIPOC diagram, respectively.
5 Visual mapping techniques used in this paper are described in more detail.
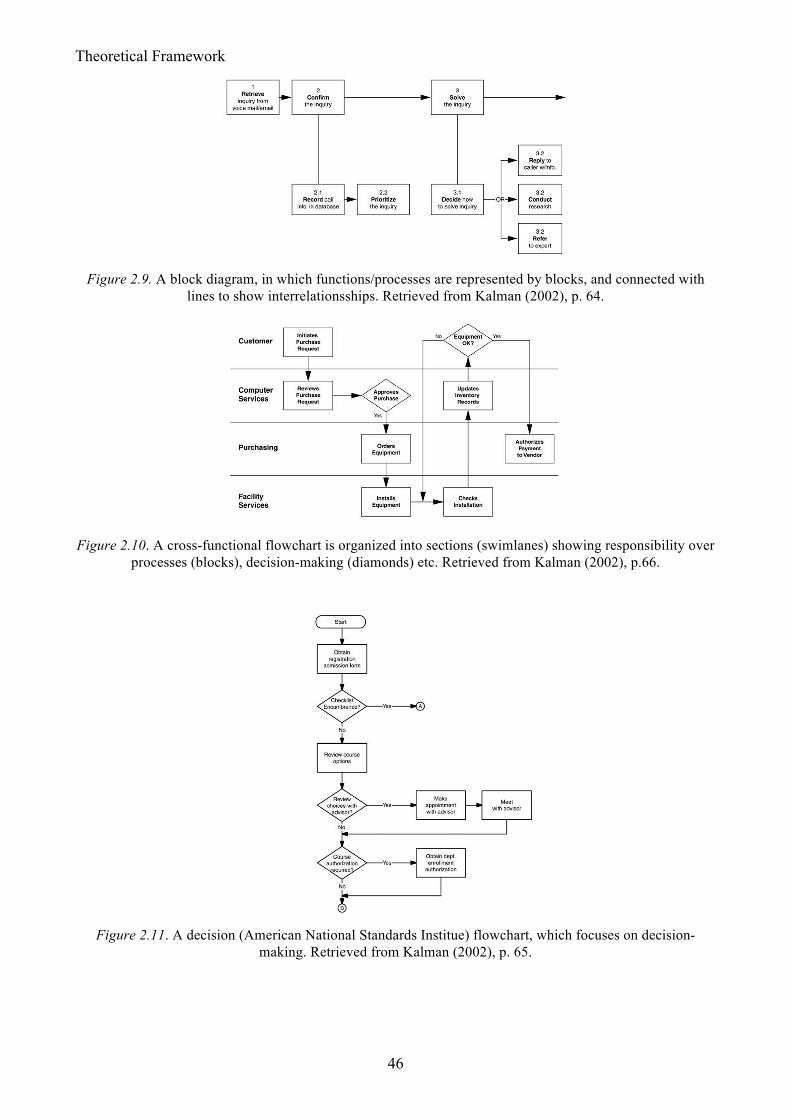
Theoretical Framework
46
Figure 2.9. A block diagram, in which functions/processes are represented by blocks, and connected with
lines to show interrelationsships. Retrieved from Kalman (2002), p. 64.
Figure 2.10. A cross-functional flowchart is organized into sections (swimlanes) showing responsibility over
processes (blocks), decision-making (diamonds) etc. Retrieved from Kalman (2002), p.66.
Figure 2.11. A decision (American National Standards Institue) flowchart, which focuses on decision-
making. Retrieved from Kalman (2002), p. 65.
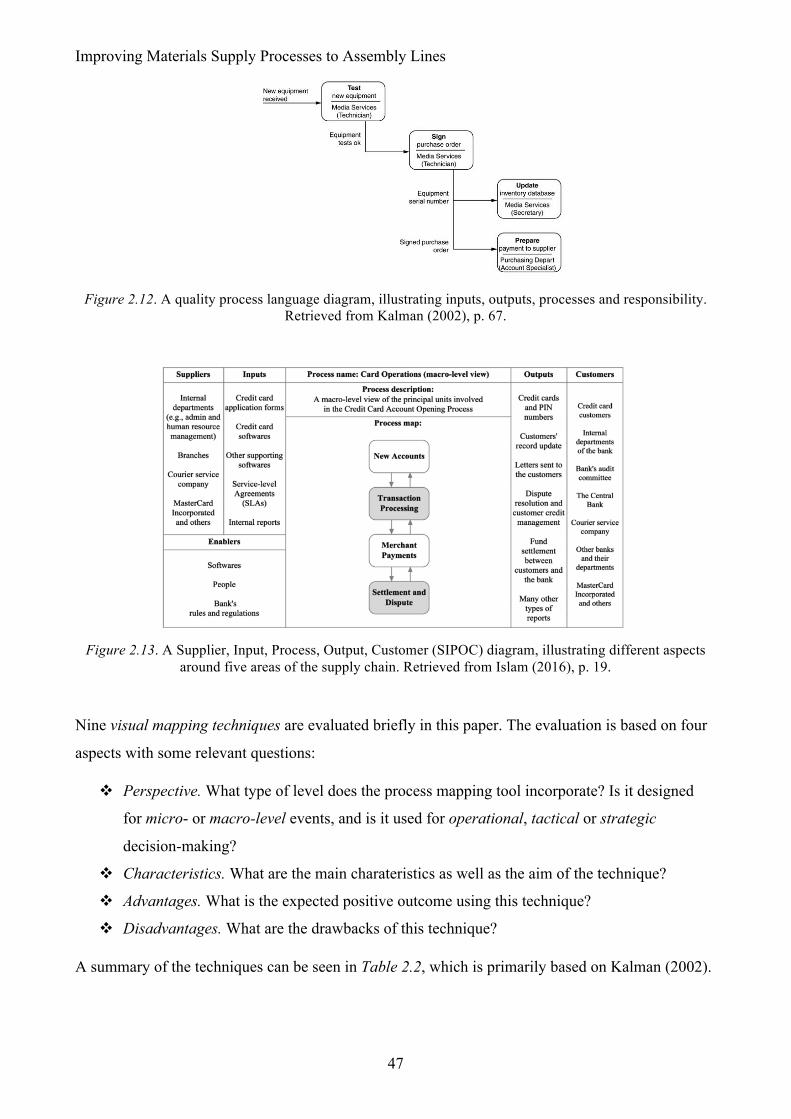
Improving Materials Supply Processes to Assembly Lines
47
Figure 2.12. A quality process language diagram, illustrating inputs, outputs, processes and responsibility.
Retrieved from Kalman (2002), p. 67.
Figure 2.13. A Supplier, Input, Process, Output, Customer (SIPOC) diagram, illustrating different aspects
around five areas of the supply chain. Retrieved from Islam (2016), p. 19.
Nine visual mapping techniques are evaluated briefly in this paper. The evaluation is based on four
aspects with some relevant questions:
! Perspective. What type of level does the process mapping tool incorporate? Is it designed
for micro- or macro-level events, and is it used for operational, tactical or strategic
decision-making?
! Characteristics. What are the main charateristics as well as the aim of the technique?
! Advantages. What is the expected positive outcome using this technique?
! Disadvantages. What are the drawbacks of this technique?
A summary of the techniques can be seen in Table 2.2, which is primarily based on Kalman (2002).
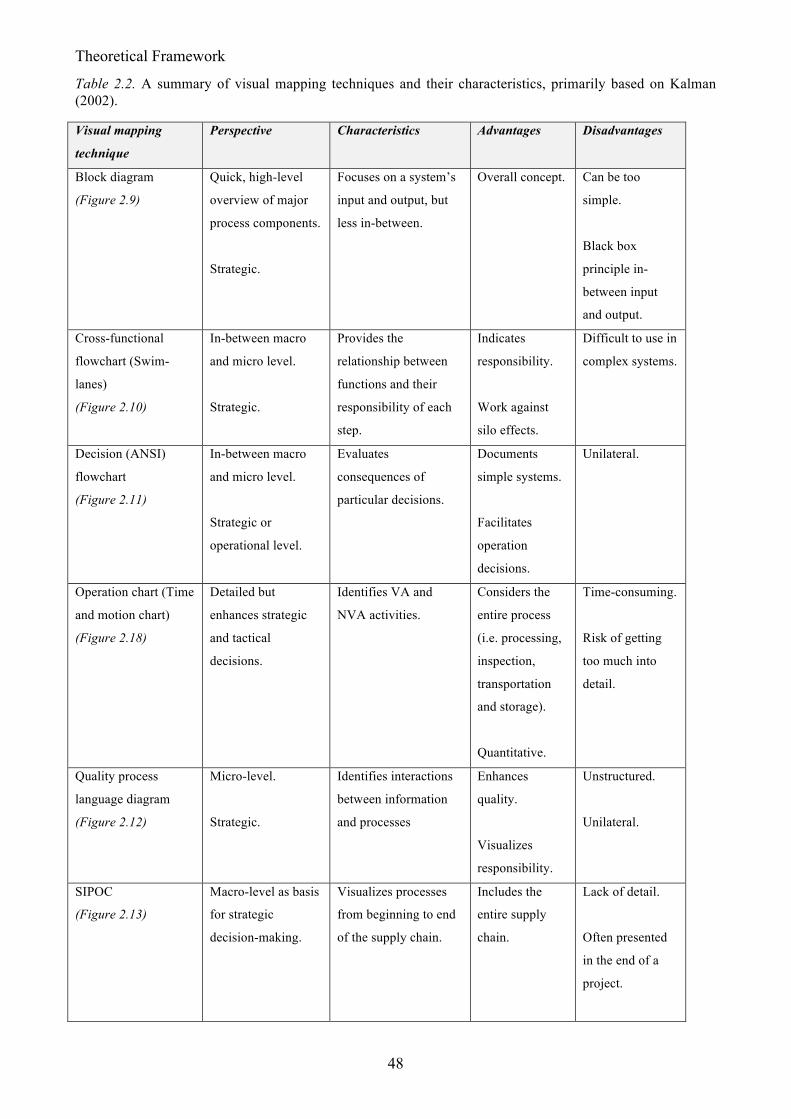
Theoretical Framework
48
Table 2.2. A summary of visual mapping techniques and their characteristics, primarily based on Kalman (2002).
Visual mapping
technique
Perspective Characteristics Advantages Disadvantages
Block diagram
(Figure 2.9)
Quick, high-level
overview of major
process components.
Strategic.
Focuses on a system’s
input and output, but
less in-between.
Overall concept. Can be too
simple.
Black box
principle in-
between input
and output.
Cross-functional
flowchart (Swim-
lanes)
(Figure 2.10)
In-between macro
and micro level.
Strategic.
Provides the
relationship between
functions and their
responsibility of each
step.
Indicates
responsibility.
Work against
silo effects.
Difficult to use in
complex systems.
Decision (ANSI)
flowchart
(Figure 2.11)
In-between macro
and micro level.
Strategic or
operational level.
Evaluates
consequences of
particular decisions.
Documents
simple systems.
Facilitates
operation
decisions.
Unilateral.
Operation chart (Time
and motion chart)
(Figure 2.18)
Detailed but
enhances strategic
and tactical
decisions.
Identifies VA and
NVA activities.
Considers the
entire process
(i.e. processing,
inspection,
transportation
and storage).
Quantitative.
Time-consuming.
Risk of getting
too much into
detail.
Quality process
language diagram
(Figure 2.12)
Micro-level.
Strategic.
Identifies interactions
between information
and processes
Enhances
quality.
Visualizes
responsibility.
Unstructured.
Unilateral.
SIPOC
(Figure 2.13)
Macro-level as basis
for strategic
decision-making.
Visualizes processes
from beginning to end
of the supply chain.
Includes the
entire supply
chain.
Lack of detail.
Often presented
in the end of a
project.
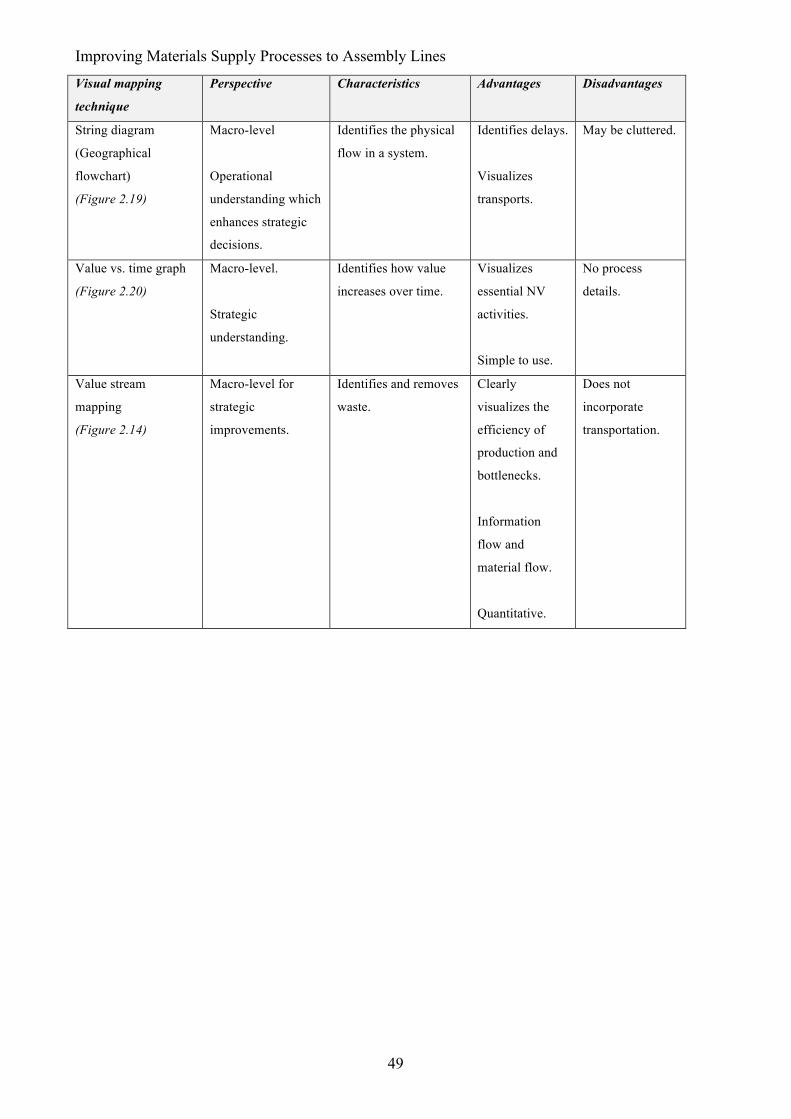
Improving Materials Supply Processes to Assembly Lines
49
Visual mapping
technique
Perspective Characteristics Advantages Disadvantages
String diagram
(Geographical
flowchart)
(Figure 2.19)
Macro-level
Operational
understanding which
enhances strategic
decisions.
Identifies the physical
flow in a system.
Identifies delays.
Visualizes
transports.
May be cluttered.
Value vs. time graph
(Figure 2.20)
Macro-level.
Strategic
understanding.
Identifies how value
increases over time.
Visualizes
essential NV
activities.
Simple to use.
No process
details.
Value stream
mapping
(Figure 2.14)
Macro-level for
strategic
improvements.
Identifies and removes
waste.
Clearly
visualizes the
efficiency of
production and
bottlenecks.
Information
flow and
material flow.
Quantitative.
Does not
incorporate
transportation.
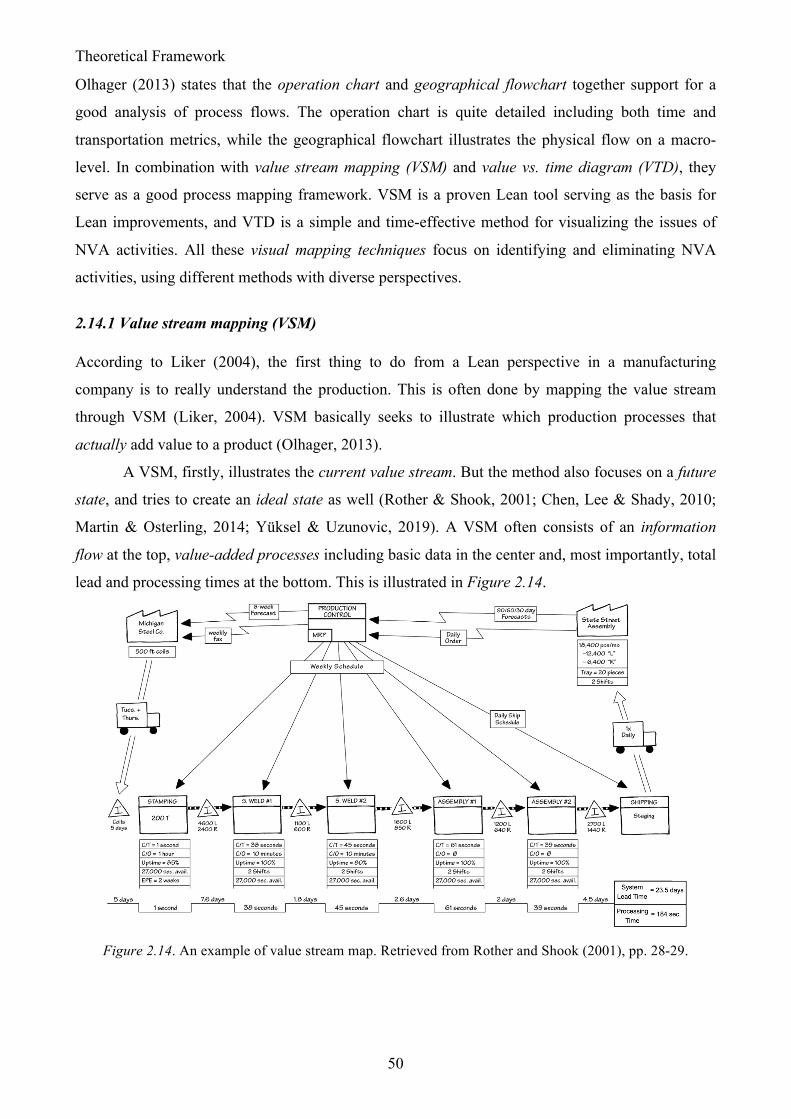
Theoretical Framework
50
Olhager (2013) states that the operation chart and geographical flowchart together support for a
good analysis of process flows. The operation chart is quite detailed including both time and
transportation metrics, while the geographical flowchart illustrates the physical flow on a macro-
level. In combination with value stream mapping (VSM) and value vs. time diagram (VTD), they
serve as a good process mapping framework. VSM is a proven Lean tool serving as the basis for
Lean improvements, and VTD is a simple and time-effective method for visualizing the issues of
NVA activities. All these visual mapping techniques focus on identifying and eliminating NVA
activities, using different methods with diverse perspectives.
2.14.1 Value stream mapping (VSM)
According to Liker (2004), the first thing to do from a Lean perspective in a manufacturing
company is to really understand the production. This is often done by mapping the value stream
through VSM (Liker, 2004). VSM basically seeks to illustrate which production processes that
actually add value to a product (Olhager, 2013).
A VSM, firstly, illustrates the current value stream. But the method also focuses on a future
state, and tries to create an ideal state as well (Rother & Shook, 2001; Chen, Lee & Shady, 2010;
Martin & Osterling, 2014; Yüksel & Uzunovic, 2019). A VSM often consists of an information
flow at the top, value-added processes including basic data in the center and, most importantly, total
lead and processing times at the bottom. This is illustrated in Figure 2.14.
Figure 2.14. An example of value stream map. Retrieved from Rother and Shook (2001), pp. 28-29.
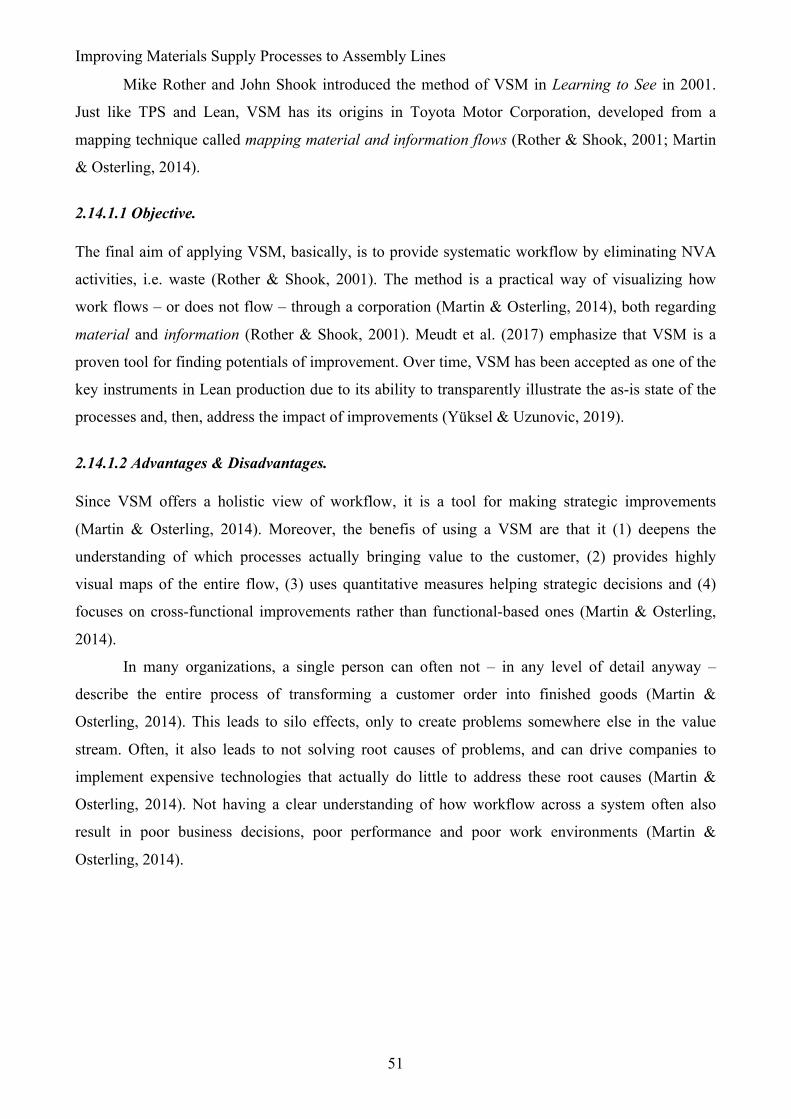
Improving Materials Supply Processes to Assembly Lines
51
Mike Rother and John Shook introduced the method of VSM in Learning to See in 2001.
Just like TPS and Lean, VSM has its origins in Toyota Motor Corporation, developed from a
mapping technique called mapping material and information flows (Rother & Shook, 2001; Martin
& Osterling, 2014).
2.14.1.1 Objective.
The final aim of applying VSM, basically, is to provide systematic workflow by eliminating NVA
activities, i.e. waste (Rother & Shook, 2001). The method is a practical way of visualizing how
work flows – or does not flow – through a corporation (Martin & Osterling, 2014), both regarding
material and information (Rother & Shook, 2001). Meudt et al. (2017) emphasize that VSM is a
proven tool for finding potentials of improvement. Over time, VSM has been accepted as one of the
key instruments in Lean production due to its ability to transparently illustrate the as-is state of the
processes and, then, address the impact of improvements (Yüksel & Uzunovic, 2019).
2.14.1.2 Advantages & Disadvantages.
Since VSM offers a holistic view of workflow, it is a tool for making strategic improvements
(Martin & Osterling, 2014). Moreover, the benefis of using a VSM are that it (1) deepens the
understanding of which processes actually bringing value to the customer, (2) provides highly
visual maps of the entire flow, (3) uses quantitative measures helping strategic decisions and (4)
focuses on cross-functional improvements rather than functional-based ones (Martin & Osterling,
2014).
In many organizations, a single person can often not – in any level of detail anyway –
describe the entire process of transforming a customer order into finished goods (Martin &
Osterling, 2014). This leads to silo effects, only to create problems somewhere else in the value
stream. Often, it also leads to not solving root causes of problems, and can drive companies to
implement expensive technologies that actually do little to address these root causes (Martin &
Osterling, 2014). Not having a clear understanding of how workflow across a system often also
result in poor business decisions, poor performance and poor work environments (Martin &
Osterling, 2014).
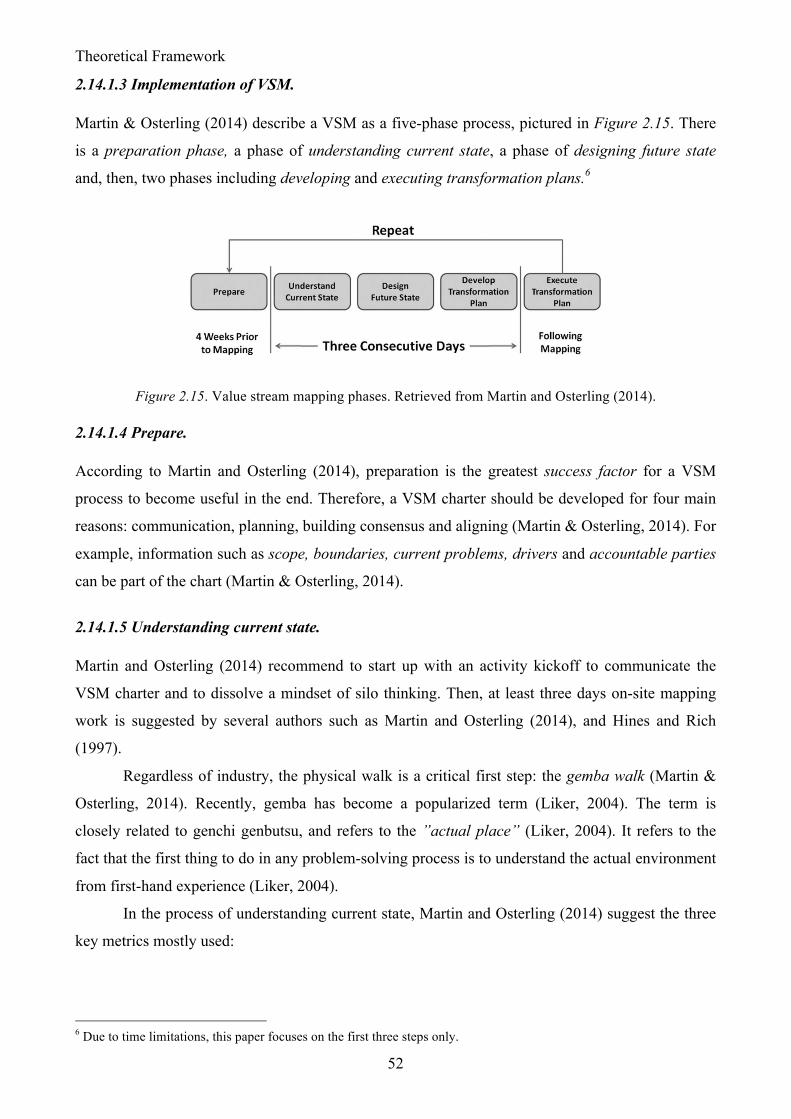
Theoretical Framework
52
2.14.1.3 Implementation of VSM.
Martin & Osterling (2014) describe a VSM as a five-phase process, pictured in Figure 2.15. There
is a preparation phase, a phase of understanding current state, a phase of designing future state
and, then, two phases including developing and executing transformation plans.6
Figure 2.15. Value stream mapping phases. Retrieved from Martin and Osterling (2014).
2.14.1.4 Prepare.
According to Martin and Osterling (2014), preparation is the greatest success factor for a VSM
process to become useful in the end. Therefore, a VSM charter should be developed for four main
reasons: communication, planning, building consensus and aligning (Martin & Osterling, 2014). For
example, information such as scope, boundaries, current problems, drivers and accountable parties
can be part of the chart (Martin & Osterling, 2014).
2.14.1.5 Understanding current state.
Martin and Osterling (2014) recommend to start up with an activity kickoff to communicate the
VSM charter and to dissolve a mindset of silo thinking. Then, at least three days on-site mapping
work is suggested by several authors such as Martin and Osterling (2014), and Hines and Rich
(1997).
Regardless of industry, the physical walk is a critical first step: the gemba walk (Martin &
Osterling, 2014). Recently, gemba has become a popularized term (Liker, 2004). The term is
closely related to genchi genbutsu, and refers to the ”actual place” (Liker, 2004). It refers to the
fact that the first thing to do in any problem-solving process is to understand the actual environment
from first-hand experience (Liker, 2004).
In the process of understanding current state, Martin and Osterling (2014) suggest the three
key metrics mostly used:
6 Due to time limitations, this paper focuses on the first three steps only.
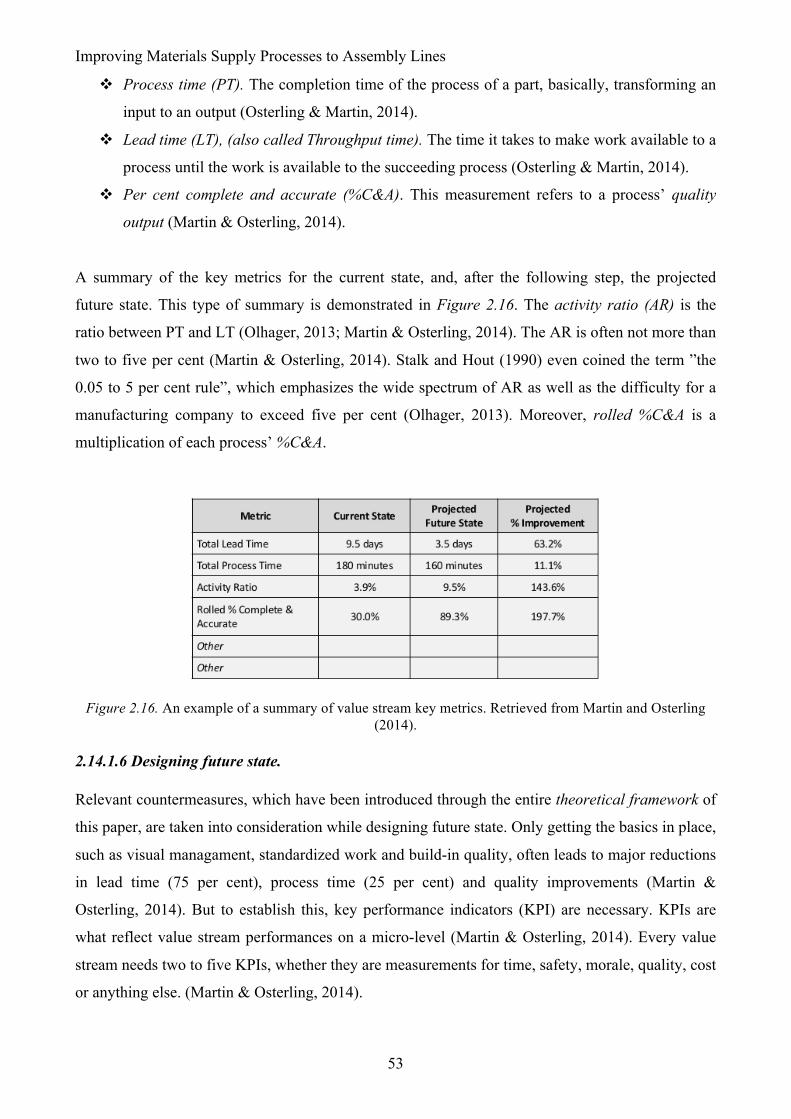
Improving Materials Supply Processes to Assembly Lines
53
! Process time (PT). The completion time of the process of a part, basically, transforming an
input to an output (Osterling & Martin, 2014).
! Lead time (LT), (also called Throughput time). The time it takes to make work available to a
process until the work is available to the succeeding process (Osterling & Martin, 2014).
! Per cent complete and accurate (%C&A). This measurement refers to a process’ quality
output (Martin & Osterling, 2014).
A summary of the key metrics for the current state, and, after the following step, the projected
future state. This type of summary is demonstrated in Figure 2.16. The activity ratio (AR) is the
ratio between PT and LT (Olhager, 2013; Martin & Osterling, 2014). The AR is often not more than
two to five per cent (Martin & Osterling, 2014). Stalk and Hout (1990) even coined the term ”the
0.05 to 5 per cent rule”, which emphasizes the wide spectrum of AR as well as the difficulty for a
manufacturing company to exceed five per cent (Olhager, 2013). Moreover, rolled %C&A is a
multiplication of each process’ %C&A.
Figure 2.16. An example of a summary of value stream key metrics. Retrieved from Martin and Osterling
(2014).
2.14.1.6 Designing future state.
Relevant countermeasures, which have been introduced through the entire theoretical framework of
this paper, are taken into consideration while designing future state. Only getting the basics in place,
such as visual managament, standardized work and build-in quality, often leads to major reductions
in lead time (75 per cent), process time (25 per cent) and quality improvements (Martin &
Osterling, 2014). But to establish this, key performance indicators (KPI) are necessary. KPIs are
what reflect value stream performances on a micro-level (Martin & Osterling, 2014). Every value
stream needs two to five KPIs, whether they are measurements for time, safety, morale, quality, cost
or anything else. (Martin & Osterling, 2014).
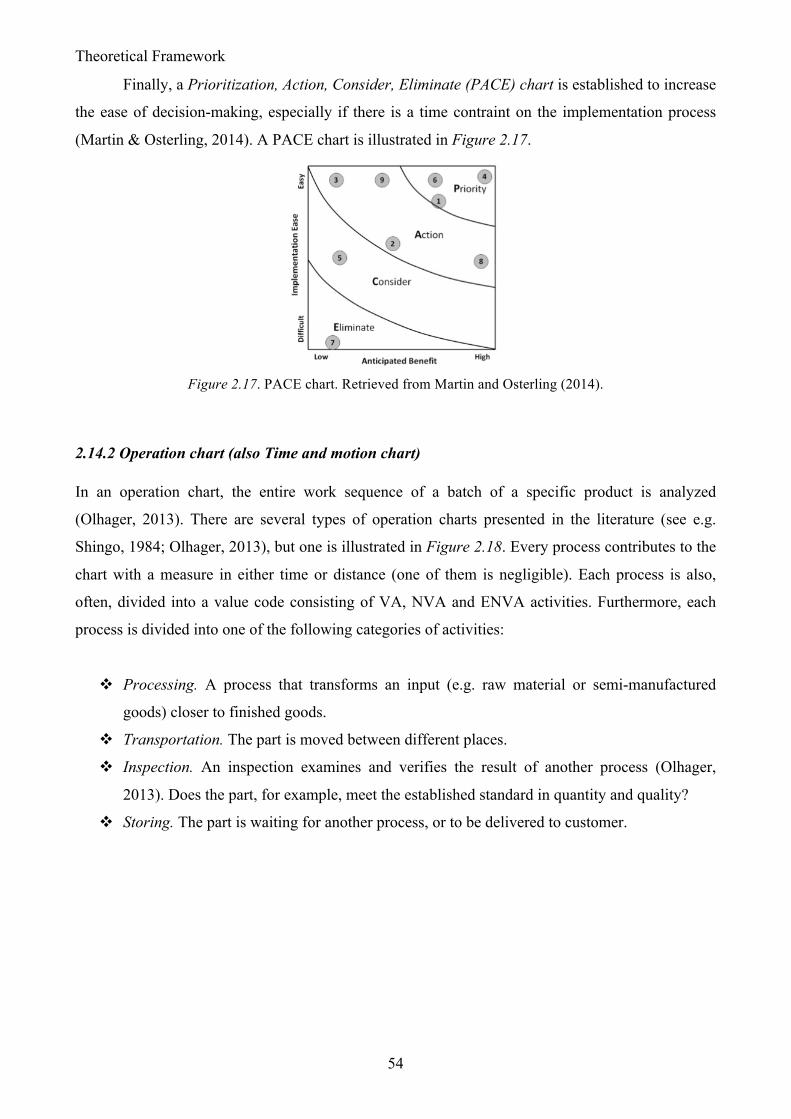
Theoretical Framework
54
Finally, a Prioritization, Action, Consider, Eliminate (PACE) chart is established to increase
the ease of decision-making, especially if there is a time contraint on the implementation process
(Martin & Osterling, 2014). A PACE chart is illustrated in Figure 2.17.
Figure 2.17. PACE chart. Retrieved from Martin and Osterling (2014).
2.14.2 Operation chart (also Time and motion chart)
In an operation chart, the entire work sequence of a batch of a specific product is analyzed
(Olhager, 2013). There are several types of operation charts presented in the literature (see e.g.
Shingo, 1984; Olhager, 2013), but one is illustrated in Figure 2.18. Every process contributes to the
chart with a measure in either time or distance (one of them is negligible). Each process is also,
often, divided into a value code consisting of VA, NVA and ENVA activities. Furthermore, each
process is divided into one of the following categories of activities:
! Processing. A process that transforms an input (e.g. raw material or semi-manufactured
goods) closer to finished goods.
! Transportation. The part is moved between different places.
! Inspection. An inspection examines and verifies the result of another process (Olhager,
2013). Does the part, for example, meet the established standard in quantity and quality?
! Storing. The part is waiting for another process, or to be delivered to customer.
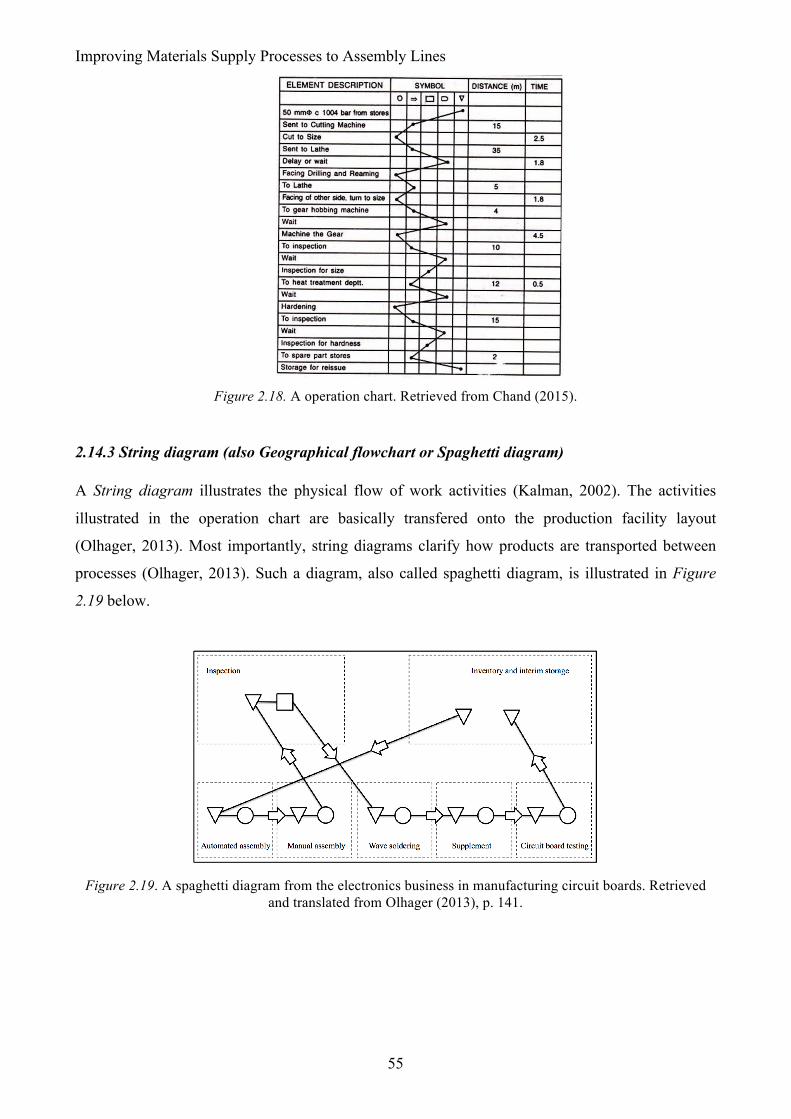
Improving Materials Supply Processes to Assembly Lines
55
Figure 2.18. A operation chart. Retrieved from Chand (2015).
2.14.3 String diagram (also Geographical flowchart or Spaghetti diagram)
A String diagram illustrates the physical flow of work activities (Kalman, 2002). The activities
illustrated in the operation chart are basically transfered onto the production facility layout
(Olhager, 2013). Most importantly, string diagrams clarify how products are transported between
processes (Olhager, 2013). Such a diagram, also called spaghetti diagram, is illustrated in Figure
2.19 below.
Figure 2.19. A spaghetti diagram from the electronics business in manufacturing circuit boards. Retrieved
and translated from Olhager (2013), p. 141.
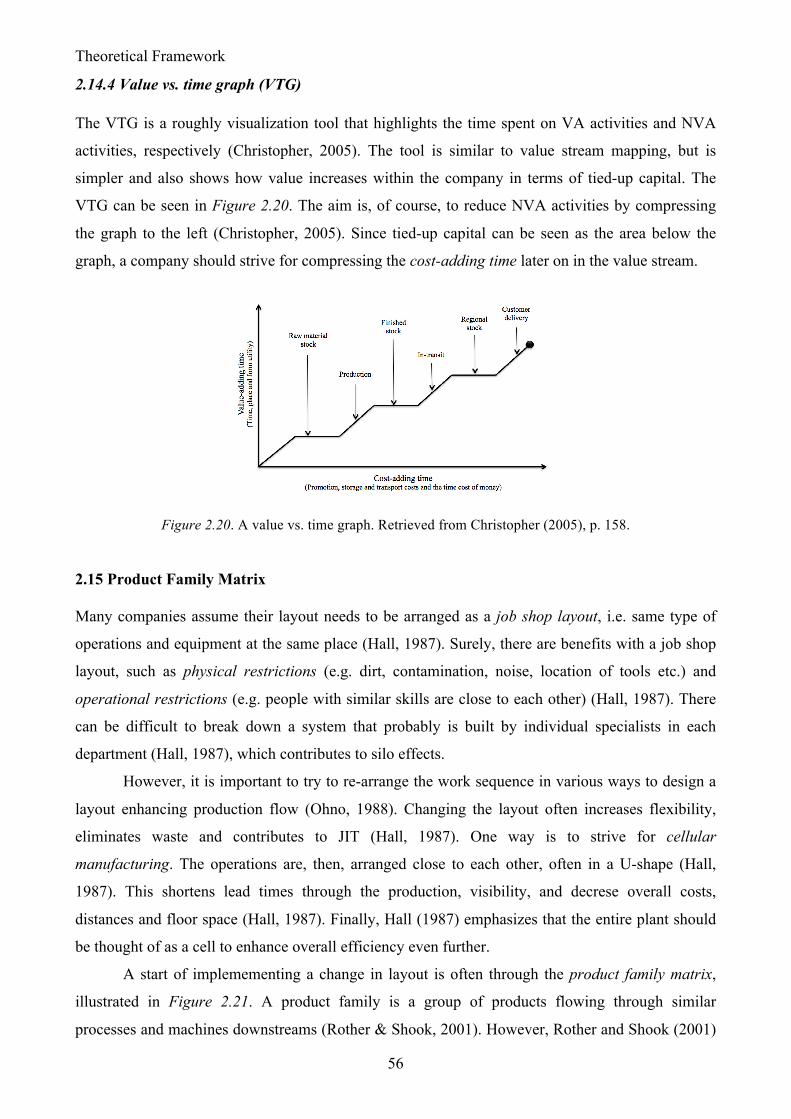
Theoretical Framework
56
2.14.4 Value vs. time graph (VTG)
The VTG is a roughly visualization tool that highlights the time spent on VA activities and NVA
activities, respectively (Christopher, 2005). The tool is similar to value stream mapping, but is
simpler and also shows how value increases within the company in terms of tied-up capital. The
VTG can be seen in Figure 2.20. The aim is, of course, to reduce NVA activities by compressing
the graph to the left (Christopher, 2005). Since tied-up capital can be seen as the area below the
graph, a company should strive for compressing the cost-adding time later on in the value stream.
Figure 2.20. A value vs. time graph. Retrieved from Christopher (2005), p. 158.
2.15 Product Family Matrix
Many companies assume their layout needs to be arranged as a job shop layout, i.e. same type of
operations and equipment at the same place (Hall, 1987). Surely, there are benefits with a job shop
layout, such as physical restrictions (e.g. dirt, contamination, noise, location of tools etc.) and
operational restrictions (e.g. people with similar skills are close to each other) (Hall, 1987). There
can be difficult to break down a system that probably is built by individual specialists in each
department (Hall, 1987), which contributes to silo effects.
However, it is important to try to re-arrange the work sequence in various ways to design a
layout enhancing production flow (Ohno, 1988). Changing the layout often increases flexibility,
eliminates waste and contributes to JIT (Hall, 1987). One way is to strive for cellular
manufacturing. The operations are, then, arranged close to each other, often in a U-shape (Hall,
1987). This shortens lead times through the production, visibility, and decrese overall costs,
distances and floor space (Hall, 1987). Finally, Hall (1987) emphasizes that the entire plant should
be thought of as a cell to enhance overall efficiency even further.
A start of implemementing a change in layout is often through the product family matrix,
illustrated in Figure 2.21. A product family is a group of products flowing through similar
processes and machines downstreams (Rother & Shook, 2001). However, Rother and Shook (2001)
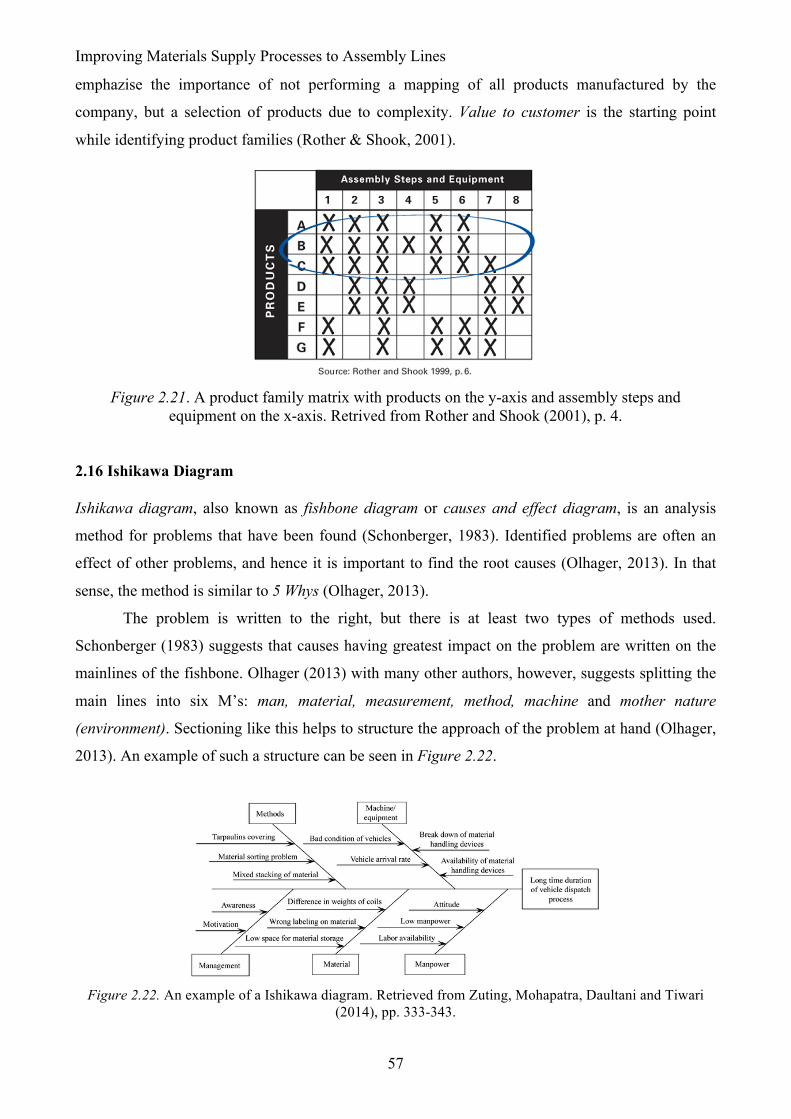
Improving Materials Supply Processes to Assembly Lines
57
emphazise the importance of not performing a mapping of all products manufactured by the
company, but a selection of products due to complexity. Value to customer is the starting point
while identifying product families (Rother & Shook, 2001).
Figure 2.21. A product family matrix with products on the y-axis and assembly steps and
equipment on the x-axis. Retrived from Rother and Shook (2001), p. 4.
2.16 Ishikawa Diagram
Ishikawa diagram, also known as fishbone diagram or causes and effect diagram, is an analysis
method for problems that have been found (Schonberger, 1983). Identified problems are often an
effect of other problems, and hence it is important to find the root causes (Olhager, 2013). In that
sense, the method is similar to 5 Whys (Olhager, 2013).
The problem is written to the right, but there is at least two types of methods used.
Schonberger (1983) suggests that causes having greatest impact on the problem are written on the
mainlines of the fishbone. Olhager (2013) with many other authors, however, suggests splitting the
main lines into six M’s: man, material, measurement, method, machine and mother nature
(environment). Sectioning like this helps to structure the approach of the problem at hand (Olhager,
2013). An example of such a structure can be seen in Figure 2.22.
Figure 2.22. An example of a Ishikawa diagram. Retrieved from Zuting, Mohapatra, Daultani and Tiwari
(2014), pp. 333-343.
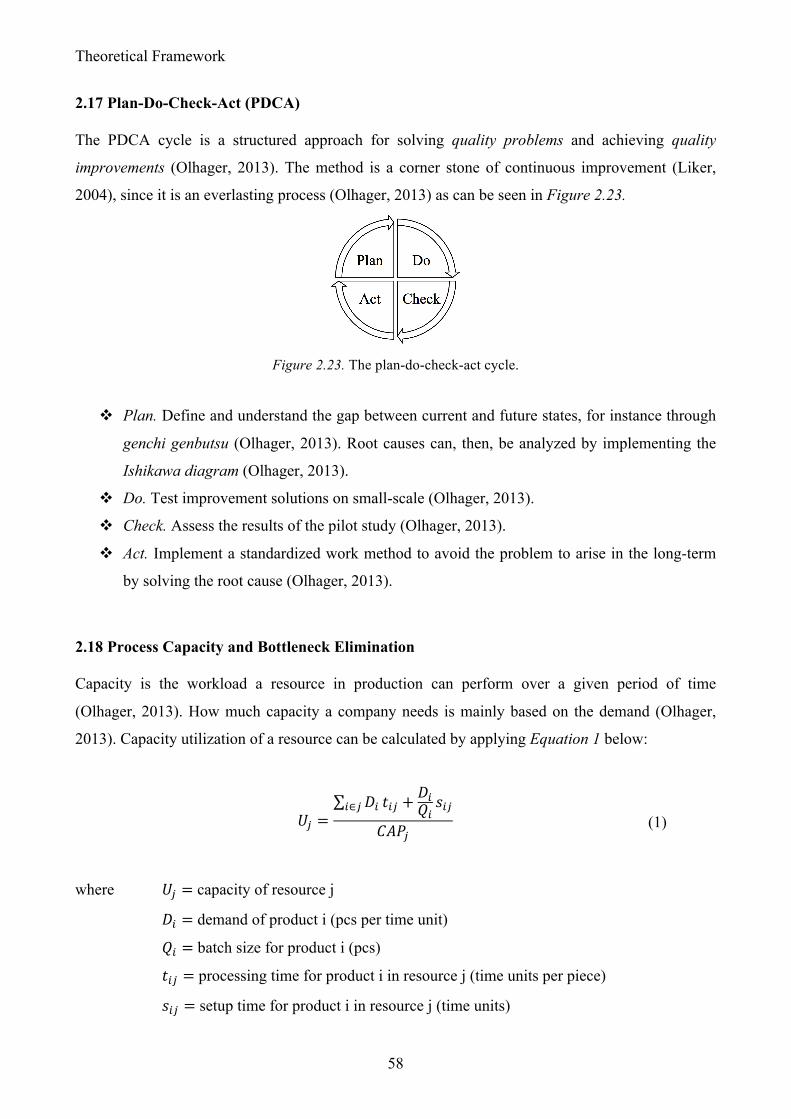
Theoretical Framework
58
2.17 Plan-Do-Check-Act (PDCA)
The PDCA cycle is a structured approach for solving quality problems and achieving quality
improvements (Olhager, 2013). The method is a corner stone of continuous improvement (Liker,
2004), since it is an everlasting process (Olhager, 2013) as can be seen in Figure 2.23.
Figure 2.23. The plan-do-check-act cycle.
! Plan. Define and understand the gap between current and future states, for instance through
genchi genbutsu (Olhager, 2013). Root causes can, then, be analyzed by implementing the
Ishikawa diagram (Olhager, 2013).
! Do. Test improvement solutions on small-scale (Olhager, 2013).
! Check. Assess the results of the pilot study (Olhager, 2013).
! Act. Implement a standardized work method to avoid the problem to arise in the long-term
by solving the root cause (Olhager, 2013).
2.18 Process Capacity and Bottleneck Elimination
Capacity is the workload a resource in production can perform over a given period of time
(Olhager, 2013). How much capacity a company needs is mainly based on the demand (Olhager,
2013). Capacity utilization of a resource can be calculated by applying Equation 1 below:
𝑈! =
𝐷!!∈! 𝑡!" +𝐷!𝑄!𝑠!"
𝐶𝐴𝑃!
(1)
where 𝑈! = capacity of resource j
𝐷! = demand of product i (pcs per time unit)
𝑄! = batch size for product i (pcs)
𝑡!" = processing time for product i in resource j (time units per piece)
𝑠!" = setup time for product i in resource j (time units)
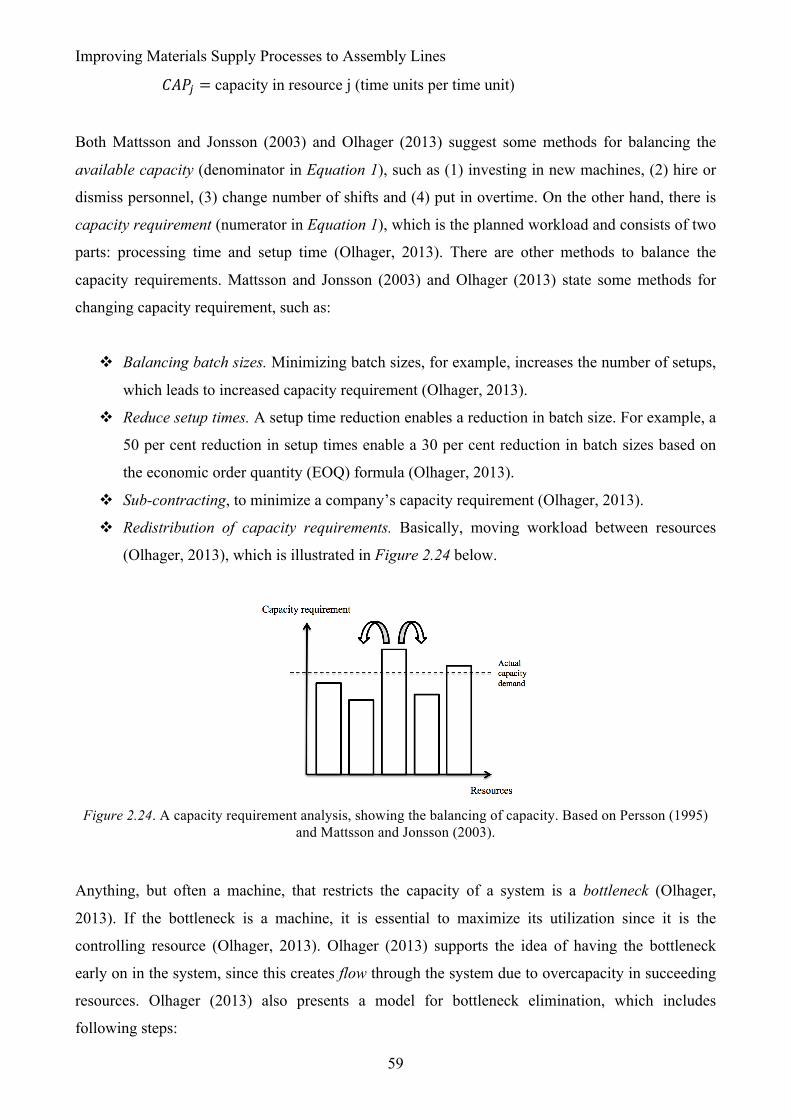
Improving Materials Supply Processes to Assembly Lines
59
𝐶𝐴𝑃! = capacity in resource j (time units per time unit)
Both Mattsson and Jonsson (2003) and Olhager (2013) suggest some methods for balancing the
available capacity (denominator in Equation 1), such as (1) investing in new machines, (2) hire or
dismiss personnel, (3) change number of shifts and (4) put in overtime. On the other hand, there is
capacity requirement (numerator in Equation 1), which is the planned workload and consists of two
parts: processing time and setup time (Olhager, 2013). There are other methods to balance the
capacity requirements. Mattsson and Jonsson (2003) and Olhager (2013) state some methods for
changing capacity requirement, such as:
! Balancing batch sizes. Minimizing batch sizes, for example, increases the number of setups,
which leads to increased capacity requirement (Olhager, 2013).
! Reduce setup times. A setup time reduction enables a reduction in batch size. For example, a
50 per cent reduction in setup times enable a 30 per cent reduction in batch sizes based on
the economic order quantity (EOQ) formula (Olhager, 2013).
! Sub-contracting, to minimize a company’s capacity requirement (Olhager, 2013).
! Redistribution of capacity requirements. Basically, moving workload between resources
(Olhager, 2013), which is illustrated in Figure 2.24 below.
Figure 2.24. A capacity requirement analysis, showing the balancing of capacity. Based on Persson (1995)
and Mattsson and Jonsson (2003).
Anything, but often a machine, that restricts the capacity of a system is a bottleneck (Olhager,
2013). If the bottleneck is a machine, it is essential to maximize its utilization since it is the
controlling resource (Olhager, 2013). Olhager (2013) supports the idea of having the bottleneck
early on in the system, since this creates flow through the system due to overcapacity in succeeding
resources. Olhager (2013) also presents a model for bottleneck elimination, which includes
following steps:
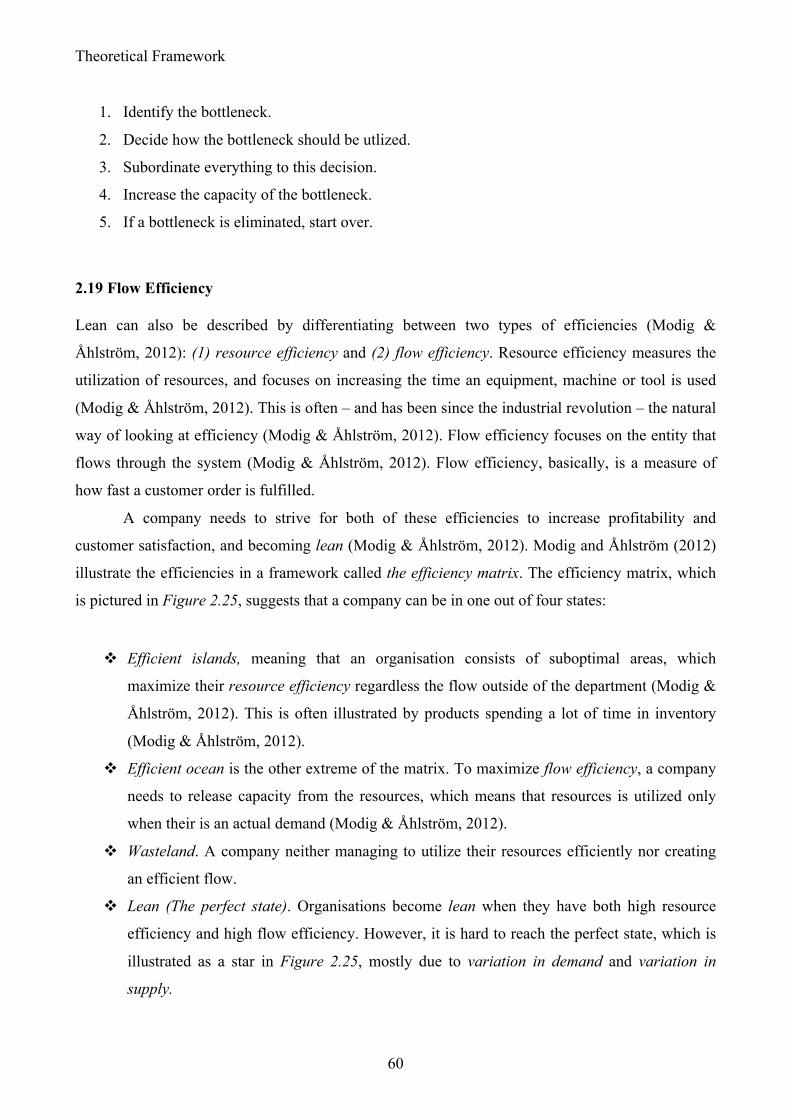
Theoretical Framework
60
1. Identify the bottleneck.
2. Decide how the bottleneck should be utlized.
3. Subordinate everything to this decision.
4. Increase the capacity of the bottleneck.
5. If a bottleneck is eliminated, start over.
2.19 Flow Efficiency
Lean can also be described by differentiating between two types of efficiencies (Modig &
Åhlström, 2012): (1) resource efficiency and (2) flow efficiency. Resource efficiency measures the
utilization of resources, and focuses on increasing the time an equipment, machine or tool is used
(Modig & Åhlström, 2012). This is often – and has been since the industrial revolution – the natural
way of looking at efficiency (Modig & Åhlström, 2012). Flow efficiency focuses on the entity that
flows through the system (Modig & Åhlström, 2012). Flow efficiency, basically, is a measure of
how fast a customer order is fulfilled.
A company needs to strive for both of these efficiencies to increase profitability and
customer satisfaction, and becoming lean (Modig & Åhlström, 2012). Modig and Åhlström (2012)
illustrate the efficiencies in a framework called the efficiency matrix. The efficiency matrix, which
is pictured in Figure 2.25, suggests that a company can be in one out of four states:
! Efficient islands, meaning that an organisation consists of suboptimal areas, which
maximize their resource efficiency regardless the flow outside of the department (Modig &
Åhlström, 2012). This is often illustrated by products spending a lot of time in inventory
(Modig & Åhlström, 2012).
! Efficient ocean is the other extreme of the matrix. To maximize flow efficiency, a company
needs to release capacity from the resources, which means that resources is utilized only
when their is an actual demand (Modig & Åhlström, 2012).
! Wasteland. A company neither managing to utilize their resources efficiently nor creating
an efficient flow.
! Lean (The perfect state). Organisations become lean when they have both high resource
efficiency and high flow efficiency. However, it is hard to reach the perfect state, which is
illustrated as a star in Figure 2.25, mostly due to variation in demand and variation in
supply.
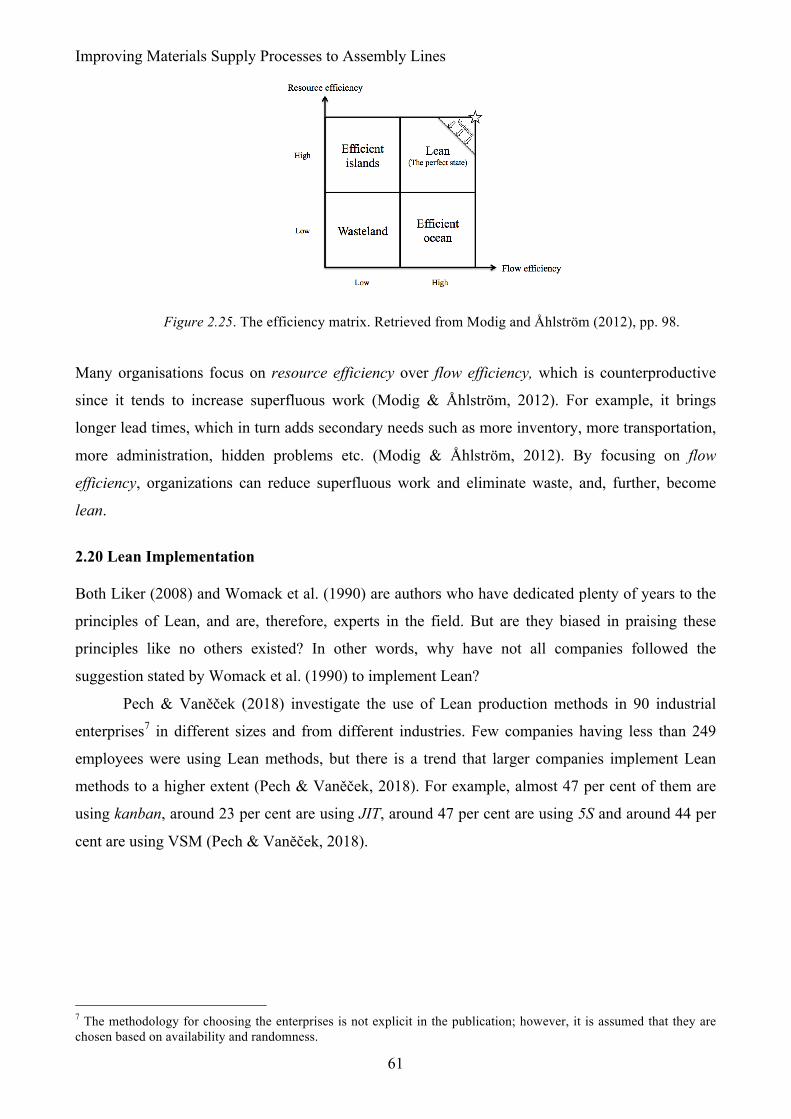
Improving Materials Supply Processes to Assembly Lines
61
Figure 2.25. The efficiency matrix. Retrieved from Modig and Åhlström (2012), pp. 98.
Many organisations focus on resource efficiency over flow efficiency, which is counterproductive
since it tends to increase superfluous work (Modig & Åhlström, 2012). For example, it brings
longer lead times, which in turn adds secondary needs such as more inventory, more transportation,
more administration, hidden problems etc. (Modig & Åhlström, 2012). By focusing on flow
efficiency, organizations can reduce superfluous work and eliminate waste, and, further, become
lean.
2.20 Lean Implementation
Both Liker (2008) and Womack et al. (1990) are authors who have dedicated plenty of years to the
principles of Lean, and are, therefore, experts in the field. But are they biased in praising these
principles like no others existed? In other words, why have not all companies followed the
suggestion stated by Womack et al. (1990) to implement Lean?
Pech & Vaněček (2018) investigate the use of Lean production methods in 90 industrial
enterprises7 in different sizes and from different industries. Few companies having less than 249
employees were using Lean methods, but there is a trend that larger companies implement Lean
methods to a higher extent (Pech & Vaněček, 2018). For example, almost 47 per cent of them are
using kanban, around 23 per cent are using JIT, around 47 per cent are using 5S and around 44 per
cent are using VSM (Pech & Vaněček, 2018).
7 The methodology for choosing the enterprises is not explicit in the publication; however, it is assumed that they are chosen based on availability and randomness.
Theoretical Framework
62
2.20.1 Critical success factors (CSFs)
Ivarsson, Molin, Lashajko, Wiestål and Johnsson (2018) conducted a study based on 50
companies8, also from different industries and of various sizes, operating in Sweden, to understand
critical success factors (CSFs) of Lean. A conclusion from the study, and possibly an answer to
Womack et al. (1990), is that Lean takes time to implement (Ivarsson et al., 2018). For example,
companies that have applied Lean principles for more than three years are more successful than
others (Ivarsson et al., 2018).
Moreover, a company benefits from implementing the whole concept of TPS/Lean.
However, a study presented by Chauhan and Chauhan (2019) suggests that a phase-wise
implementation approach shall be used in any manufacturing company due to (1) cost, resource and
time restraints in implementing tools in tandem, (2) possibilites to correct through feedback from
previous implementation problems and (3) motivation to continue implementing. The study also
suggests to start implementing ”softer” tools, such as (1) developing mutual faith, (2) maintaining
discipline, (3) delegate responsibility, (4) get employees to participate etc., while the most
important factors are (1) elimination of waste, followed by both (2) just-in-time and (3) continuous
improvement (Chauhan and Chauhan (2019).
Other CSFs in a Lean implementation are more related to how an organization approaches
the change effort, rather than the use of specific methods (Näslund, 2013). Management support and
organizational culture are often seen as especially critical (Näslund, 2013). Näslund (2013) presents
three additional CSFs in (1) strategically aligning the initiative to the organization’s objective, (2)
enhancing project management, since almost every change effort is project driven and (3) increased
training due to the organizational change needed to implement Lean. Näslund (2013) states that if
companies are informed of CSFs of a Lean implementation, the awareness can guide the companies
to a successful implementation.
2.20.2 Maturity models
Maturity models are used as holistical assessment tools to capture a company’s current situation to
support change (Maier, Moultrie & Clarkson, 2012). Generally, the models are conceptual
frameworks consisting of steps describing the development of an area of interest (Pigosso et al.,
2013). Any maturity model normally consists of four to six sequential steps building on each other
(Pigosso et al., 2013). Such a model helps an organization to assess strengths and weaknesses of
their business (Pigosso et al., 2013; Albliwi, 2017), as well as guiding them through the evolution
8 A selection from goods and service organizations from both private and public sectors in Sweden (Ivarsson et al., 2018).
Improving Materials Supply Processes to Assembly Lines
63
of an organizational change (Šajeva, 2009). It also allows for comparisons of similar efforts
between departments, but more importantly, between companies (Šajeva, 2009).
The applications of maturity models are widespread among different areas (Pigosso, 2013).
Röglinger, Poppelbuß and Becker (2012) even state that the number of maturity models is so high
today that the practitioners and scholars might soon lose track. Therefore, only a few maturity
models related to Lean implementations are evaluated further in this paper. The Lean maturity
models are summarized in Table 2.3. The models are compared based on three aspects: Lean
maturity levels, criteria and objective.
Lean maturity levels account for every step that a company can reach in the model, while
criteria is the foundation of how the evaluation of a company’s Lean maturity is done. The
objective of a model can be either on a micro- or macro-level, focusing on either a single
manufacturing cell or the entire organization.
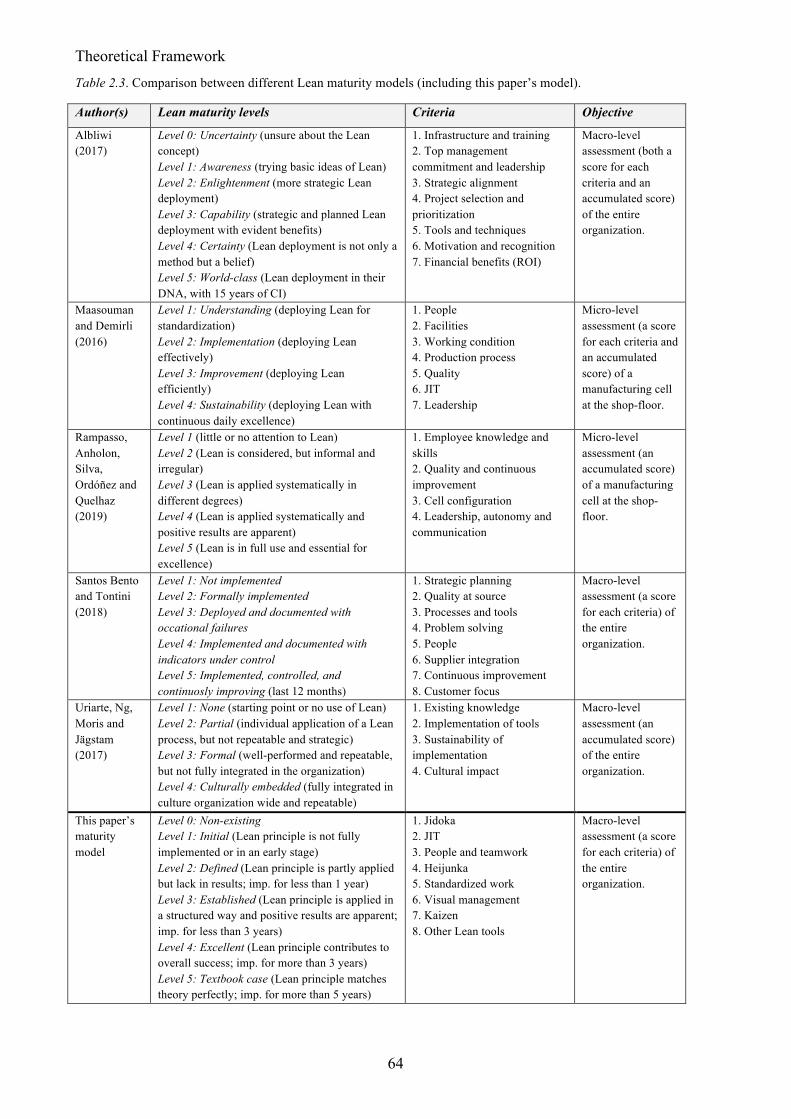
Theoretical Framework
64
Table 2.3. Comparison between different Lean maturity models (including this paper’s model).
Author(s) Lean maturity levels Criteria Objective
Albliwi (2017)
Level 0: Uncertainty (unsure about the Lean concept) Level 1: Awareness (trying basic ideas of Lean) Level 2: Enlightenment (more strategic Lean deployment) Level 3: Capability (strategic and planned Lean deployment with evident benefits) Level 4: Certainty (Lean deployment is not only a method but a belief) Level 5: World-class (Lean deployment in their DNA, with 15 years of CI)
1. Infrastructure and training 2. Top management commitment and leadership 3. Strategic alignment 4. Project selection and prioritization 5. Tools and techniques 6. Motivation and recognition 7. Financial benefits (ROI)
Macro-level assessment (both a score for each criteria and an accumulated score) of the entire organization.
Maasouman and Demirli (2016)
Level 1: Understanding (deploying Lean for standardization) Level 2: Implementation (deploying Lean effectively) Level 3: Improvement (deploying Lean efficiently) Level 4: Sustainability (deploying Lean with continuous daily excellence)
1. People 2. Facilities 3. Working condition 4. Production process 5. Quality 6. JIT 7. Leadership
Micro-level assessment (a score for each criteria and an accumulated score) of a manufacturing cell at the shop-floor.
Rampasso, Anholon, Silva, Ordóñez and Quelhaz (2019)
Level 1 (little or no attention to Lean) Level 2 (Lean is considered, but informal and irregular) Level 3 (Lean is applied systematically in different degrees) Level 4 (Lean is applied systematically and positive results are apparent) Level 5 (Lean is in full use and essential for excellence)
1. Employee knowledge and skills 2. Quality and continuous improvement 3. Cell configuration 4. Leadership, autonomy and communication
Micro-level assessment (an accumulated score) of a manufacturing cell at the shop-floor.
Santos Bento and Tontini (2018)
Level 1: Not implemented Level 2: Formally implemented Level 3: Deployed and documented with occational failures Level 4: Implemented and documented with indicators under control Level 5: Implemented, controlled, and continuosly improving (last 12 months)
1. Strategic planning 2. Quality at source 3. Processes and tools 4. Problem solving 5. People 6. Supplier integration 7. Continuous improvement 8. Customer focus
Macro-level assessment (a score for each criteria) of the entire organization.
Uriarte, Ng, Moris and Jägstam (2017)
Level 1: None (starting point or no use of Lean) Level 2: Partial (individual application of a Lean process, but not repeatable and strategic) Level 3: Formal (well-performed and repeatable, but not fully integrated in the organization) Level 4: Culturally embedded (fully integrated in culture organization wide and repeatable)
1. Existing knowledge 2. Implementation of tools 3. Sustainability of implementation 4. Cultural impact
Macro-level assessment (an accumulated score) of the entire organization.
This paper’s maturity model
Level 0: Non-existing Level 1: Initial (Lean principle is not fully implemented or in an early stage) Level 2: Defined (Lean principle is partly applied but lack in results; imp. for less than 1 year) Level 3: Established (Lean principle is applied in a structured way and positive results are apparent; imp. for less than 3 years) Level 4: Excellent (Lean principle contributes to overall success; imp. for more than 3 years) Level 5: Textbook case (Lean principle matches theory perfectly; imp. for more than 5 years)
1. Jidoka 2. JIT 3. People and teamwork 4. Heijunka 5. Standardized work 6. Visual management 7. Kaizen 8. Other Lean tools
Macro-level assessment (a score for each criteria) of the entire organization.
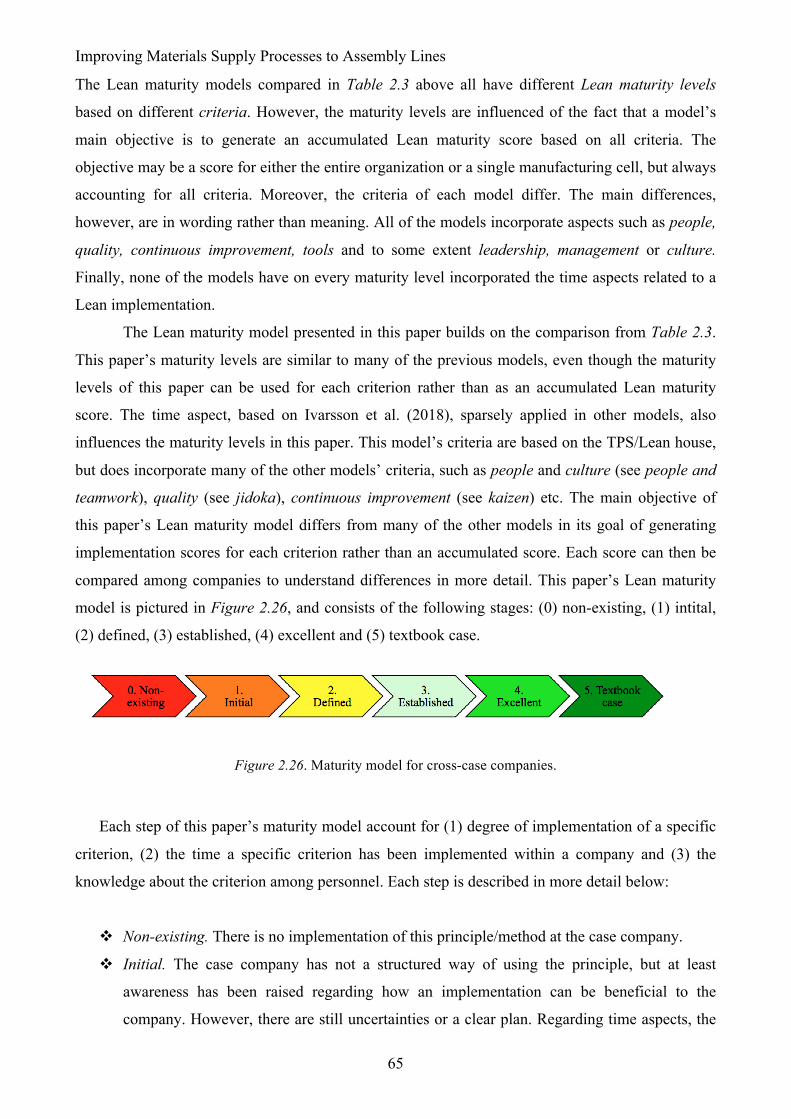
Improving Materials Supply Processes to Assembly Lines
65
The Lean maturity models compared in Table 2.3 above all have different Lean maturity levels
based on different criteria. However, the maturity levels are influenced of the fact that a model’s
main objective is to generate an accumulated Lean maturity score based on all criteria. The
objective may be a score for either the entire organization or a single manufacturing cell, but always
accounting for all criteria. Moreover, the criteria of each model differ. The main differences,
however, are in wording rather than meaning. All of the models incorporate aspects such as people,
quality, continuous improvement, tools and to some extent leadership, management or culture.
Finally, none of the models have on every maturity level incorporated the time aspects related to a
Lean implementation.
The Lean maturity model presented in this paper builds on the comparison from Table 2.3.
This paper’s maturity levels are similar to many of the previous models, even though the maturity
levels of this paper can be used for each criterion rather than as an accumulated Lean maturity
score. The time aspect, based on Ivarsson et al. (2018), sparsely applied in other models, also
influences the maturity levels in this paper. This model’s criteria are based on the TPS/Lean house,
but does incorporate many of the other models’ criteria, such as people and culture (see people and
teamwork), quality (see jidoka), continuous improvement (see kaizen) etc. The main objective of
this paper’s Lean maturity model differs from many of the other models in its goal of generating
implementation scores for each criterion rather than an accumulated score. Each score can then be
compared among companies to understand differences in more detail. This paper’s Lean maturity
model is pictured in Figure 2.26, and consists of the following stages: (0) non-existing, (1) intital,
(2) defined, (3) established, (4) excellent and (5) textbook case.
Figure 2.26. Maturity model for cross-case companies.
Each step of this paper’s maturity model account for (1) degree of implementation of a specific
criterion, (2) the time a specific criterion has been implemented within a company and (3) the
knowledge about the criterion among personnel. Each step is described in more detail below:
! Non-existing. There is no implementation of this principle/method at the case company.
! Initial. The case company has not a structured way of using the principle, but at least
awareness has been raised regarding how an implementation can be beneficial to the
company. However, there are still uncertainties or a clear plan. Regarding time aspects, the
Theoretical Framework
66
principle is in the early stages of implementation or in the conceptualization phase. There is
seldom any knowledge about the principle around the company.
! Defined. The case company has a structured way of using the principle, but lack in the
principle delivering the intended positive result. The principle has not been implemented for
more than one year. There is no widespread knowledge about the principle around the
company.
! Established. The case company has a structured way of using the principle in a sustained
way, and the principle delivers intended positive results. The principle has been
implemented for more than three year. There is a widespread knowledge about the principle
around the company.
! Excellent. The principle contributes to the overall success of the company. The principle has
been implemented in a successful way over a period of more than three years. There is a
widespread knowledge about the principle at different operational levels around the
company.
! Textbook case. The implementation of the principle is a textbook case, i.e. the use of the
principle matches theory perfectly. The case company’s application of the principle is seen
as a “best-practice” case in their business. The principle has been implemented for more
than five years, and everybody in the organization has knowledge about it.
Improving Materials Supply Processes to Assembly Lines
67
Chapter 3. Methodology and Approach This chapter outlines the methodological approach used in the research of this paper. In more
detail, this chapter describes the approach, purpose, method and process of the research. It also
elaborate on how data is collected and analyzed, as well as how high quality is attained in the
process of conducting the research.
3.1 Overall Research Approach
Research consistently starts with a problem at hand, from which there is an interest of acquiring
new or in-depth knowledge (Patel and Davidson, 2011). There is a distinction, however, between
research and inquiry, where the former has a deeper theoretical foundation (Patel & Davidson,
2011). Despite this distinction, both produce knowledge for either decision-making, educational
purposes or for being basis of new knowledge (Patel & Davidson, 2011). Thus, research uses a
systematic approach to understand problems through scientific theories and research methods
(Flick, 2015). The research, in turn, can be either basic or applied (Hedrick, Bickman & Rog, 2011;
Patel & Davidson, 2011). This paper uses an applied theory for solving specific problems. In other
words, a scientific methodology is used to produce knowledge from a social problem (Hedrick et
al., 2011) through normative applications (Kasanen, Lukka & Siitonen, 1993).
The main objective of this paper is to recommend the principal company (TePe) on how to
improve the materials flow to assembly lines within their production facility, based on four research
questions. Therefore, the constructive approach suits this paper, since such a methodology includes
”problem solving through the construction of models, diagrams, plans, organizations etc.”
(Kasanen et al., 1993, p. 243). Construction, here, refers to entities that produce solutions to explicit
problems and create new realities (Kasanen et al., 1993). But more importantly, their usability can
be demonstrated by an implementation (Kasanaen et al., 1993). Kasanen et al. (1993) have observed
this type of approach being useful in many other Master’s theses, and in operations research as well.
Logistics research is primarily based on a positivistic paradigm (Mentzer & Kahn, 1995;
Näslund, 2002). Näslund (2002) describes positivism as the belief of an ”objective” world, with
”objective” methods to study it. Since the constructive approach is seen as part of the systems
approach (Arbnor & Bjerke, 2009), it is as Gammelgaard (2003) puts it: ”pragmatic in nature” (p.
481). Instead of searching for an absolut truth, there is a search for a problem solution working in
practice (Gammelgaard, 2003). The systems approach is based on systems theory and is often seen
as holistic in contrast to the usual atomistic approach of positivism (Gammelgaard, 2003).
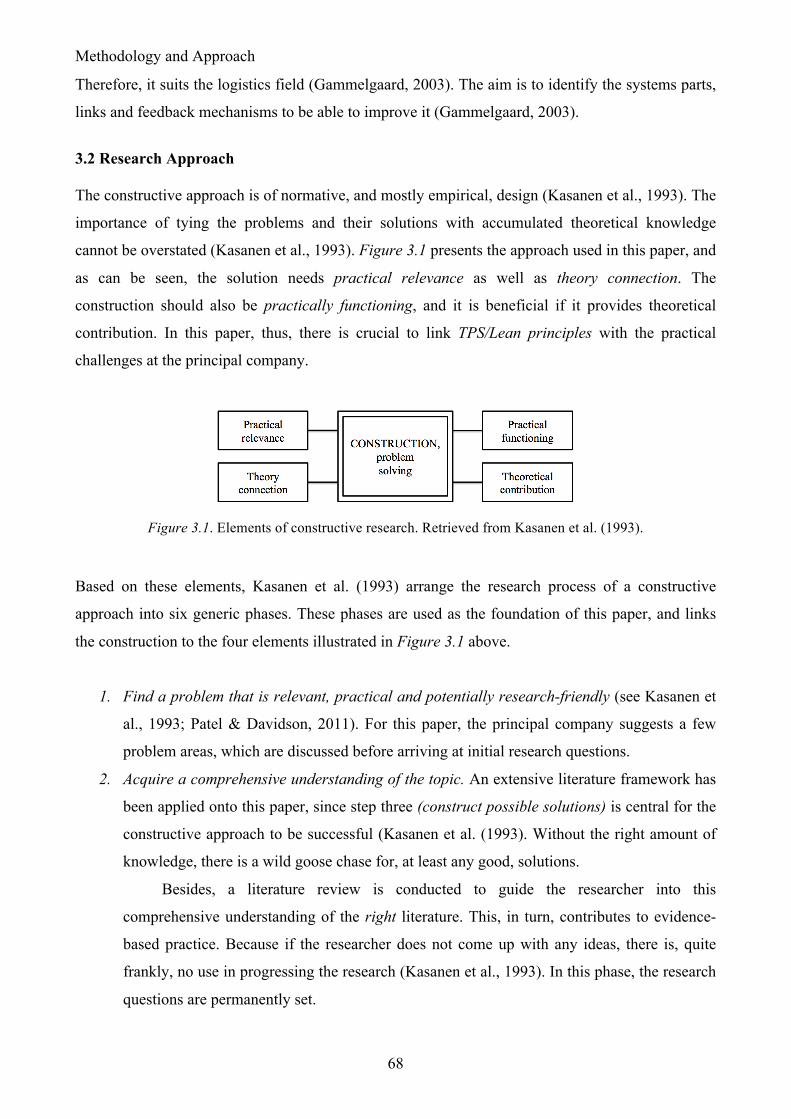
Methodology and Approach
68
Therefore, it suits the logistics field (Gammelgaard, 2003). The aim is to identify the systems parts,
links and feedback mechanisms to be able to improve it (Gammelgaard, 2003).
3.2 Research Approach
The constructive approach is of normative, and mostly empirical, design (Kasanen et al., 1993). The
importance of tying the problems and their solutions with accumulated theoretical knowledge
cannot be overstated (Kasanen et al., 1993). Figure 3.1 presents the approach used in this paper, and
as can be seen, the solution needs practical relevance as well as theory connection. The
construction should also be practically functioning, and it is beneficial if it provides theoretical
contribution. In this paper, thus, there is crucial to link TPS/Lean principles with the practical
challenges at the principal company.
Figure 3.1. Elements of constructive research. Retrieved from Kasanen et al. (1993).
Based on these elements, Kasanen et al. (1993) arrange the research process of a constructive
approach into six generic phases. These phases are used as the foundation of this paper, and links
the construction to the four elements illustrated in Figure 3.1 above.
1. Find a problem that is relevant, practical and potentially research-friendly (see Kasanen et
al., 1993; Patel & Davidson, 2011). For this paper, the principal company suggests a few
problem areas, which are discussed before arriving at initial research questions.
2. Acquire a comprehensive understanding of the topic. An extensive literature framework has
been applied onto this paper, since step three (construct possible solutions) is central for the
constructive approach to be successful (Kasanen et al. (1993). Without the right amount of
knowledge, there is a wild goose chase for, at least any good, solutions.
Besides, a literature review is conducted to guide the researcher into this
comprehensive understanding of the right literature. This, in turn, contributes to evidence-
based practice. Because if the researcher does not come up with any ideas, there is, quite
frankly, no use in progressing the research (Kasanen et al., 1993). In this phase, the research
questions are permanently set.
Improving Materials Supply Processes to Assembly Lines
69
3. Construct possible solutions. This phase is the core element of a successfully applied
constructive approach (Kasanen et al., 1993). This paper is partly characterised by heuristic
innovations (Kasanen et al., 1993), since direct observations and interviews are the basis
from where solutions for the materials supply are constructed.
4. Demonstrate that the solutions work. This paper follows the constructive research approach
of always explicitly demonstrate constructed solutions’ practical usability (Kasanen et al.,
1993). In this paper, workshops with key employees are held to increase validity and
establish the solutions. This is important to reinforce the elements of practical relevance and
practical functioning. Workshop I is mainly held to evaluate the progression of solutions
thus far, and to understand critical success factors of further development. Workshop II is
the final evaluation by key employees, which assess the practical functioning of the
solutions through an evaluation sheet. Practical information about how Workshop I and
Workshop II is conducted can be found in Appendix I and Appendix II.
5. Show theoretical connections and how the solutions contribute to research. This paper aims
on not only finding relevant solutions, but contributing to academic research with yet
another application of the contructive research approach, but on materials supply processes
in a manufacturing firm.
6. Examine solutions’ scope of applicability. Kasanen et al. (1993) emphasize the likeliness of
the solution being applicable in similar firms if it suits the principal company. The
constructions are, therefore, linked to previous case research studies to confirm applicability.
3.3 Research Purpose
Research is a rigorous and intricate process (Mentzer & Kahn, 1995). However, logistics research is
still maturing, not offering many well structured research processes (see Mentzer & Kahn, 1995;
Eisenhardt, 1989; Näslund, 2002). Therefore, planning is crucial in this logistics Master’s thesis to
ensure that a rigorous methodological procedure is followed (Yin, 2014). The first step in this
process is the development of sharp and answerable research questions (RQs), which builds a
foundation of the paper (Laurie & Jensen, 2016). The RQs are the driving force for the empirical
study (Yin, 2014), and are, therefore, designed in collaboration with TePe and their specific needs.
The RQs are shown below.
Methodology and Approach
70
RQ1 How can materials supply processes to assembly lines at TePe be improved by
implementing Toyota production system and Lean?
RQ2 Why is the materials supply processes at TePe bringing safety hazards? How can
these safety hazards be minimized?
RQ3 How should raw materials be supplied to the new production facility?
Defining the unit of analysis is also critical for the design of this research (Yin, 2014). The unit of
analysis should be related to the way the research questions are defined (Yin, 2014), and they are,
therefore, developed in tandem. The unit of analysis of this paper is defined as materials supply
processes to assembly lines in the production facility of a manufacturing company.
It is a necessity to formulate the purpose of the project early, otherwise the choice of
research method is hardly possible (Bell & Waters, 2014), later in the research process. But first, it
is necessary to understand the differences between research method and research methodology.
Methodology is the framework and principles of how to build the thesis, rather than specifically
follow a procedure (Höst, Regnell & Runeson, 2006). Deciding on which methodology to use is
based on purposes and charateristics of the study (Höst et al., 2006). Research methodology
characteristics can indeed be of different nature, but Handfield and Melnyk, (1998) differentiate
between five operations management purposes: (1) discovery/description, (2) mapping, (3)
relationship building, (4) theory validation and (5) theory extension/refinement.
This paper builds upon the three initial purposes presented by Handfield and Melnyk (1998).
Discovery/description is realized by exploring the territory of the TePe production plant. Thereafter,
key variables are identified by drawing maps over the territory. By identifying linkages and ”whys”
between the variables (i.e. relationship building), the map can later be improved (Handfield &
Melnyk, 1998). Handfield and Melnyk (1998) recommend longitudinal, in-depth case studies to be
appropriate for all of these purposes. Höst et al. (2006) also add a sixth purpose in problem solving.
Since this paper uses the constructive approach, the final purpose is to construct solutions for
TePe’s challenges, and, therefore, problem solving is the last purpose of the paper. In a Master’s
thesis at any technical university, problem solving is actually the most common purpose (Höst et
al., 2006).
3.4 Research Method
A tool for identifying advantages and disadvantages of research methods, and to further facilitate
the choice between them is presented by Yin (2014). Table 3.1 displays the five most common
research methods, and three conditions deciding which method to choose. The conditions are: (1)
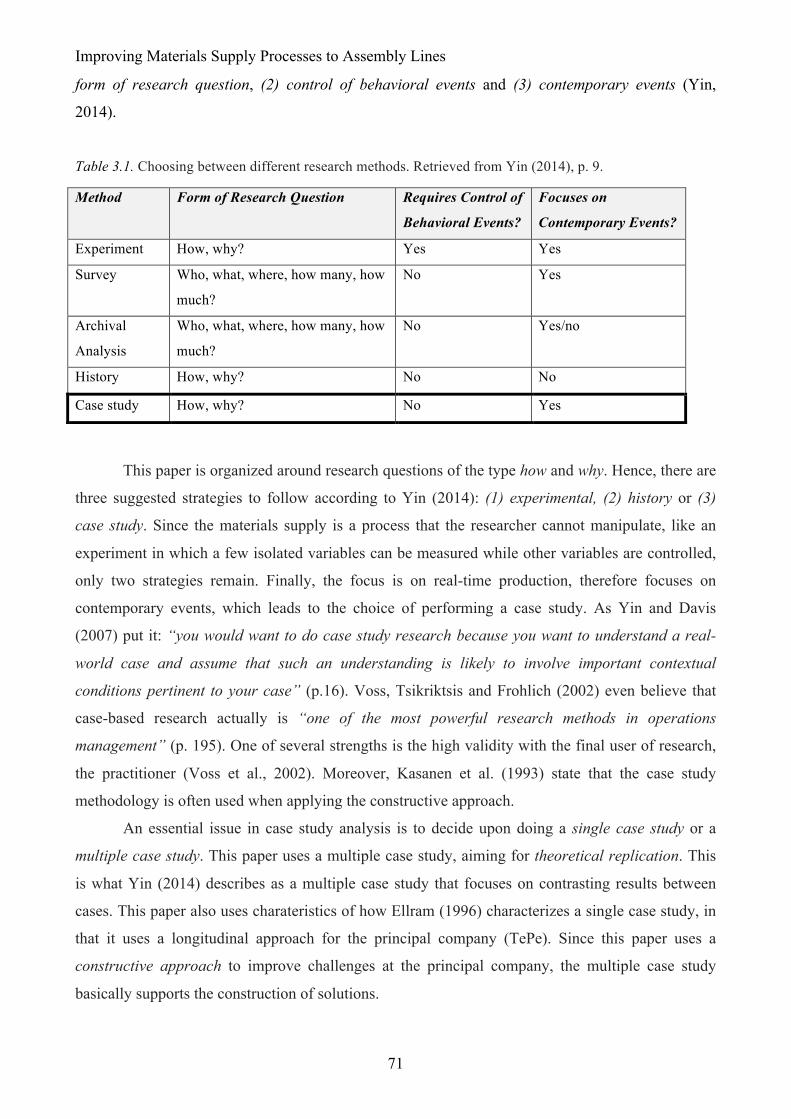
Improving Materials Supply Processes to Assembly Lines
71
form of research question, (2) control of behavioral events and (3) contemporary events (Yin,
2014).
Table 3.1. Choosing between different research methods. Retrieved from Yin (2014), p. 9.
Method Form of Research Question Requires Control of
Behavioral Events?
Focuses on
Contemporary Events?
Experiment How, why? Yes Yes
Survey Who, what, where, how many, how
much?
No Yes
Archival
Analysis
Who, what, where, how many, how
much?
No Yes/no
History How, why? No No
Case study How, why? No Yes
This paper is organized around research questions of the type how and why. Hence, there are
three suggested strategies to follow according to Yin (2014): (1) experimental, (2) history or (3)
case study. Since the materials supply is a process that the researcher cannot manipulate, like an
experiment in which a few isolated variables can be measured while other variables are controlled,
only two strategies remain. Finally, the focus is on real-time production, therefore focuses on
contemporary events, which leads to the choice of performing a case study. As Yin and Davis
(2007) put it: “you would want to do case study research because you want to understand a real-
world case and assume that such an understanding is likely to involve important contextual
conditions pertinent to your case” (p.16). Voss, Tsikriktsis and Frohlich (2002) even believe that
case-based research actually is “one of the most powerful research methods in operations
management” (p. 195). One of several strengths is the high validity with the final user of research,
the practitioner (Voss et al., 2002). Moreover, Kasanen et al. (1993) state that the case study
methodology is often used when applying the constructive approach.
An essential issue in case study analysis is to decide upon doing a single case study or a
multiple case study. This paper uses a multiple case study, aiming for theoretical replication. This
is what Yin (2014) describes as a multiple case study that focuses on contrasting results between
cases. This paper also uses charateristics of how Ellram (1996) characterizes a single case study, in
that it uses a longitudinal approach for the principal company (TePe). Since this paper uses a
constructive approach to improve challenges at the principal company, the multiple case study
basically supports the construction of solutions.
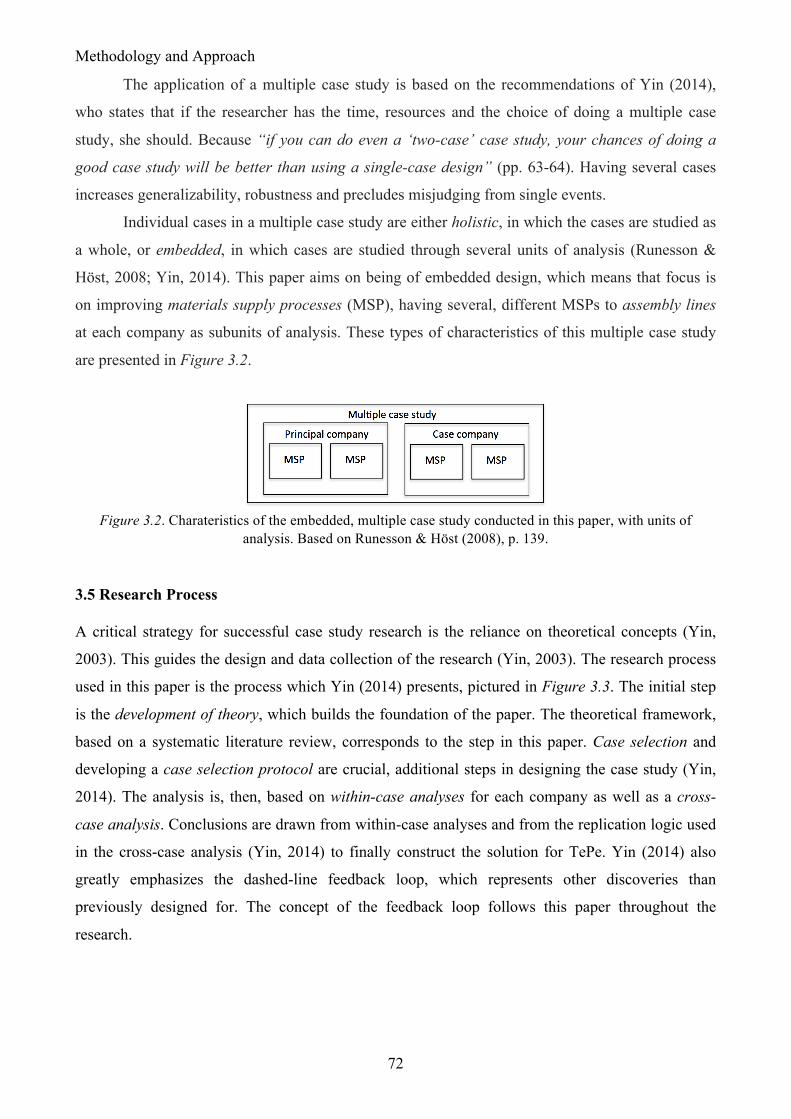
Methodology and Approach
72
The application of a multiple case study is based on the recommendations of Yin (2014),
who states that if the researcher has the time, resources and the choice of doing a multiple case
study, she should. Because “if you can do even a ‘two-case’ case study, your chances of doing a
good case study will be better than using a single-case design” (pp. 63-64). Having several cases
increases generalizability, robustness and precludes misjudging from single events.
Individual cases in a multiple case study are either holistic, in which the cases are studied as
a whole, or embedded, in which cases are studied through several units of analysis (Runesson &
Höst, 2008; Yin, 2014). This paper aims on being of embedded design, which means that focus is
on improving materials supply processes (MSP), having several, different MSPs to assembly lines
at each company as subunits of analysis. These types of characteristics of this multiple case study
are presented in Figure 3.2.
Figure 3.2. Charateristics of the embedded, multiple case study conducted in this paper, with units of
analysis. Based on Runesson & Höst (2008), p. 139.
3.5 Research Process
A critical strategy for successful case study research is the reliance on theoretical concepts (Yin,
2003). This guides the design and data collection of the research (Yin, 2003). The research process
used in this paper is the process which Yin (2014) presents, pictured in Figure 3.3. The initial step
is the development of theory, which builds the foundation of the paper. The theoretical framework,
based on a systematic literature review, corresponds to the step in this paper. Case selection and
developing a case selection protocol are crucial, additional steps in designing the case study (Yin,
2014). The analysis is, then, based on within-case analyses for each company as well as a cross-
case analysis. Conclusions are drawn from within-case analyses and from the replication logic used
in the cross-case analysis (Yin, 2014) to finally construct the solution for TePe. Yin (2014) also
greatly emphasizes the dashed-line feedback loop, which represents other discoveries than
previously designed for. The concept of the feedback loop follows this paper throughout the
research.
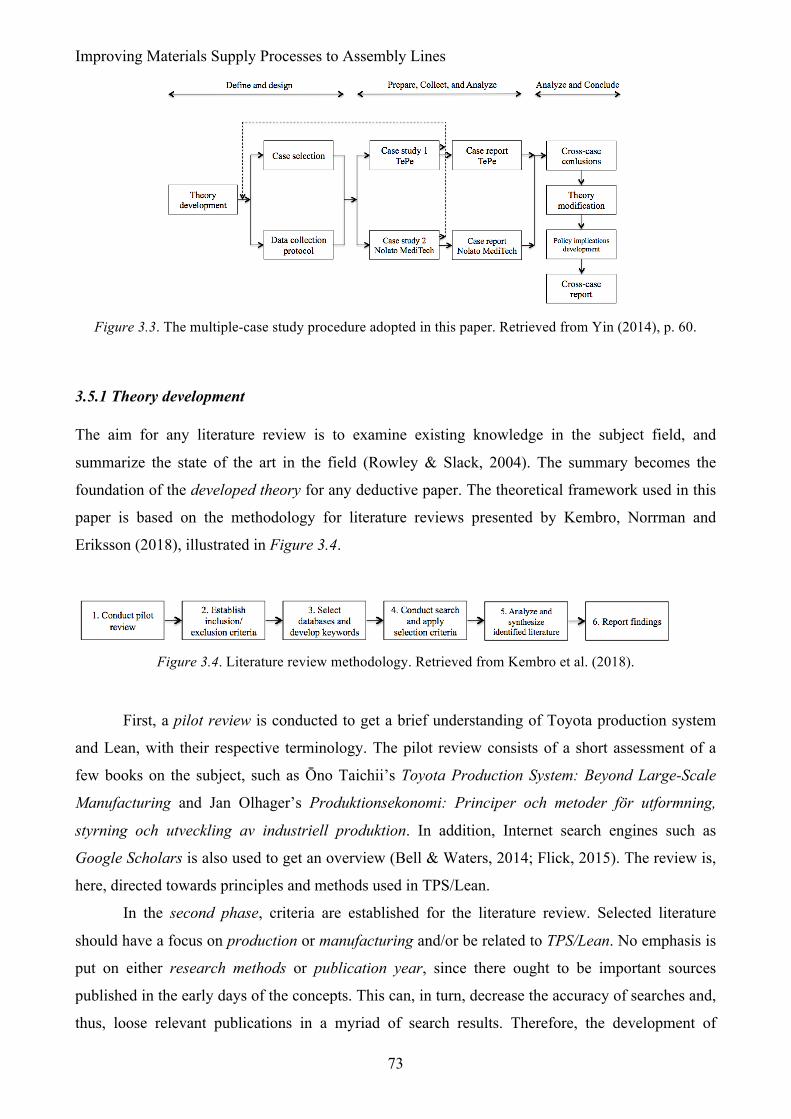
Improving Materials Supply Processes to Assembly Lines
73
Figure 3.3. The multiple-case study procedure adopted in this paper. Retrieved from Yin (2014), p. 60.
3.5.1 Theory development
The aim for any literature review is to examine existing knowledge in the subject field, and
summarize the state of the art in the field (Rowley & Slack, 2004). The summary becomes the
foundation of the developed theory for any deductive paper. The theoretical framework used in this
paper is based on the methodology for literature reviews presented by Kembro, Norrman and
Eriksson (2018), illustrated in Figure 3.4.
Figure 3.4. Literature review methodology. Retrieved from Kembro et al. (2018).
First, a pilot review is conducted to get a brief understanding of Toyota production system
and Lean, with their respective terminology. The pilot review consists of a short assessment of a
few books on the subject, such as Ōno Taichii’s Toyota Production System: Beyond Large-Scale
Manufacturing and Jan Olhager’s Produktionsekonomi: Principer och metoder för utformning,
styrning och utveckling av industriell produktion. In addition, Internet search engines such as
Google Scholars is also used to get an overview (Bell & Waters, 2014; Flick, 2015). The review is,
here, directed towards principles and methods used in TPS/Lean.
In the second phase, criteria are established for the literature review. Selected literature
should have a focus on production or manufacturing and/or be related to TPS/Lean. No emphasis is
put on either research methods or publication year, since there ought to be important sources
published in the early days of the concepts. This can, in turn, decrease the accuracy of searches and,
thus, loose relevant publications in a myriad of search results. Therefore, the development of
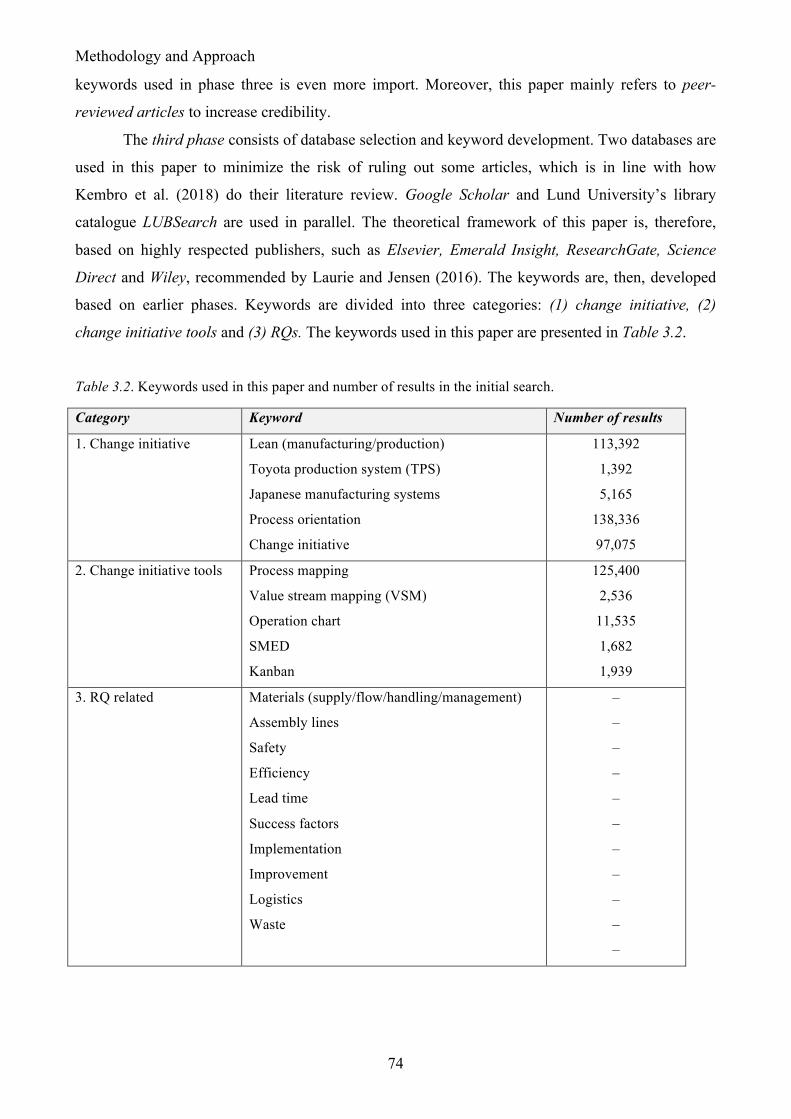
Methodology and Approach
74
keywords used in phase three is even more import. Moreover, this paper mainly refers to peer-
reviewed articles to increase credibility.
The third phase consists of database selection and keyword development. Two databases are
used in this paper to minimize the risk of ruling out some articles, which is in line with how
Kembro et al. (2018) do their literature review. Google Scholar and Lund University’s library
catalogue LUBSearch are used in parallel. The theoretical framework of this paper is, therefore,
based on highly respected publishers, such as Elsevier, Emerald Insight, ResearchGate, Science
Direct and Wiley, recommended by Laurie and Jensen (2016). The keywords are, then, developed
based on earlier phases. Keywords are divided into three categories: (1) change initiative, (2)
change initiative tools and (3) RQs. The keywords used in this paper are presented in Table 3.2.
Table 3.2. Keywords used in this paper and number of results in the initial search.
Category Keyword Number of results
1. Change initiative Lean (manufacturing/production)
Toyota production system (TPS)
Japanese manufacturing systems
Process orientation
Change initiative
113,392
1,392
5,165
138,336
97,075
2. Change initiative tools Process mapping
Value stream mapping (VSM)
Operation chart
SMED
Kanban
125,400
2,536
11,535
1,682
1,939
3. RQ related Materials (supply/flow/handling/management)
Assembly lines
Safety
Efficiency
Lead time
Success factors
Implementation
Improvement
Logistics
Waste
–
–
–
–
–
–
–
–
–
–
–
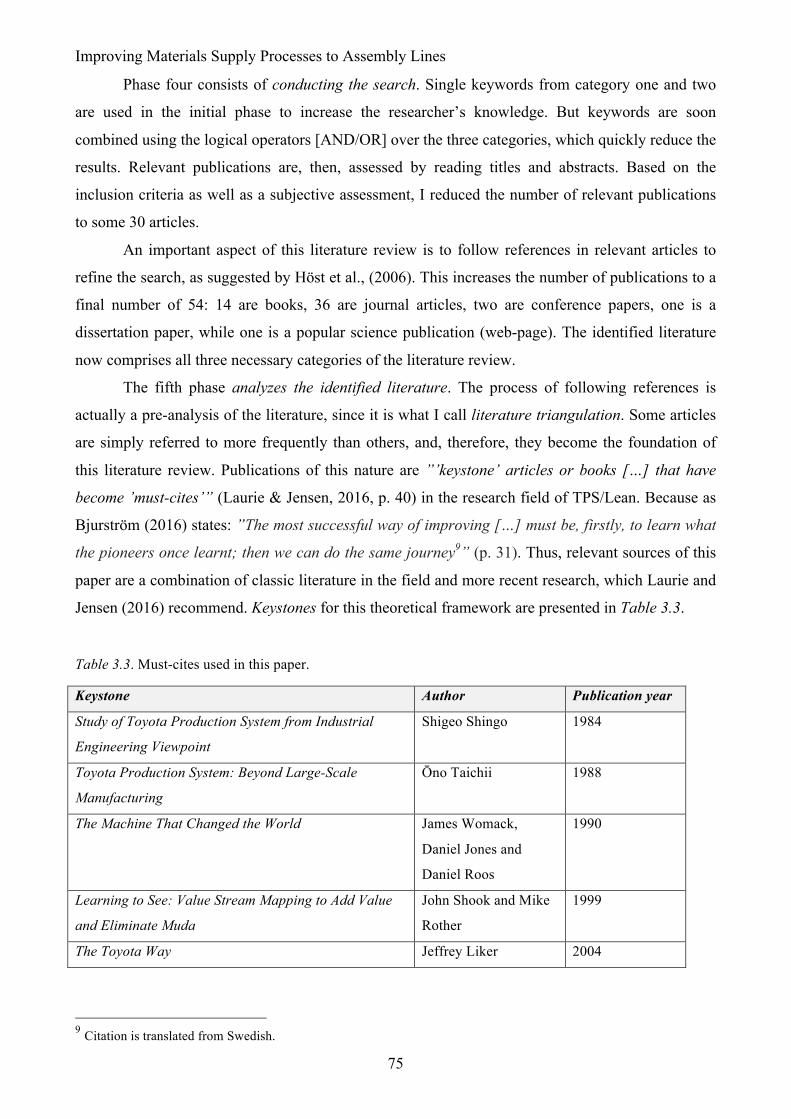
Improving Materials Supply Processes to Assembly Lines
75
Phase four consists of conducting the search. Single keywords from category one and two
are used in the initial phase to increase the researcher’s knowledge. But keywords are soon
combined using the logical operators [AND/OR] over the three categories, which quickly reduce the
results. Relevant publications are, then, assessed by reading titles and abstracts. Based on the
inclusion criteria as well as a subjective assessment, I reduced the number of relevant publications
to some 30 articles.
An important aspect of this literature review is to follow references in relevant articles to
refine the search, as suggested by Höst et al., (2006). This increases the number of publications to a
final number of 54: 14 are books, 36 are journal articles, two are conference papers, one is a
dissertation paper, while one is a popular science publication (web-page). The identified literature
now comprises all three necessary categories of the literature review.
The fifth phase analyzes the identified literature. The process of following references is
actually a pre-analysis of the literature, since it is what I call literature triangulation. Some articles
are simply referred to more frequently than others, and, therefore, they become the foundation of
this literature review. Publications of this nature are ”’keystone’ articles or books […] that have
become ’must-cites’” (Laurie & Jensen, 2016, p. 40) in the research field of TPS/Lean. Because as
Bjurström (2016) states: ”The most successful way of improving […] must be, firstly, to learn what
the pioneers once learnt; then we can do the same journey9” (p. 31). Thus, relevant sources of this
paper are a combination of classic literature in the field and more recent research, which Laurie and
Jensen (2016) recommend. Keystones for this theoretical framework are presented in Table 3.3.
Table 3.3. Must-cites used in this paper.
Keystone Author Publication year
Study of Toyota Production System from Industrial
Engineering Viewpoint
Shigeo Shingo 1984
Toyota Production System: Beyond Large-Scale
Manufacturing
Ōno Taichii 1988
The Machine That Changed the World James Womack,
Daniel Jones and
Daniel Roos
1990
Learning to See: Value Stream Mapping to Add Value
and Eliminate Muda
John Shook and Mike
Rother
1999
The Toyota Way Jeffrey Liker 2004
9 Citation is translated from Swedish.
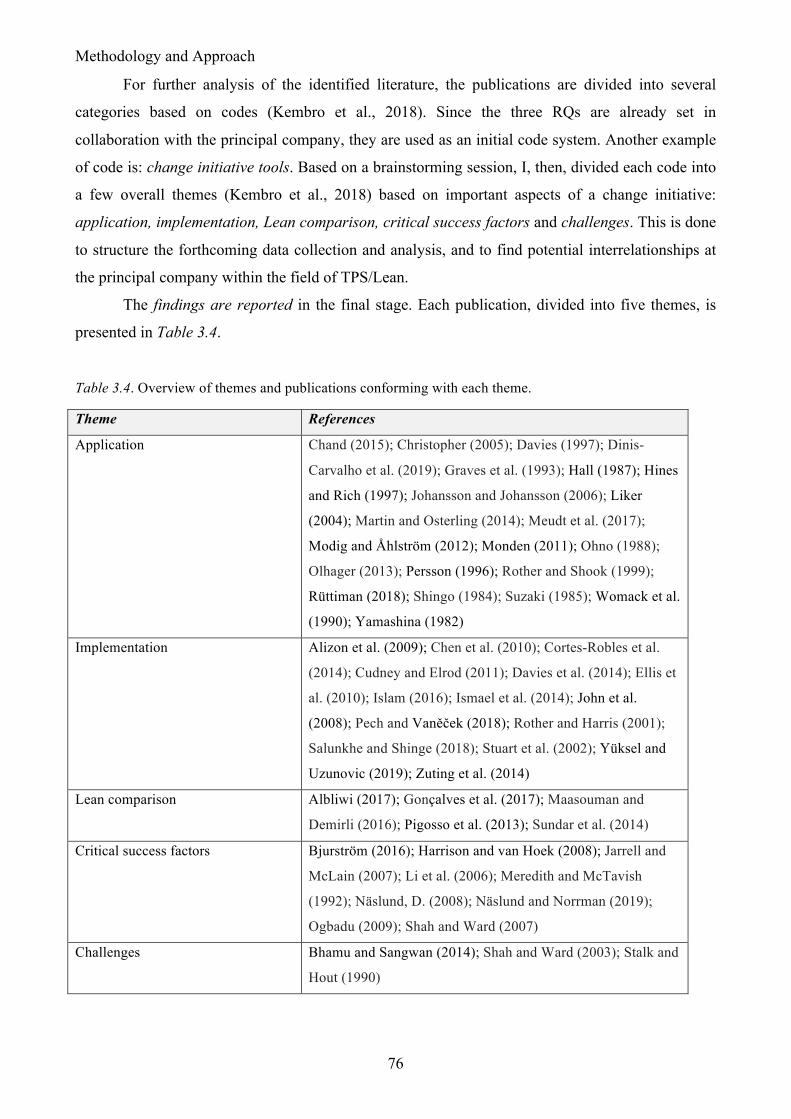
Methodology and Approach
76
For further analysis of the identified literature, the publications are divided into several
categories based on codes (Kembro et al., 2018). Since the three RQs are already set in
collaboration with the principal company, they are used as an initial code system. Another example
of code is: change initiative tools. Based on a brainstorming session, I, then, divided each code into
a few overall themes (Kembro et al., 2018) based on important aspects of a change initiative:
application, implementation, Lean comparison, critical success factors and challenges. This is done
to structure the forthcoming data collection and analysis, and to find potential interrelationships at
the principal company within the field of TPS/Lean.
The findings are reported in the final stage. Each publication, divided into five themes, is
presented in Table 3.4.
Table 3.4. Overview of themes and publications conforming with each theme.
Theme References
Application Chand (2015); Christopher (2005); Davies (1997); Dinis-
Carvalho et al. (2019); Graves et al. (1993); Hall (1987); Hines
and Rich (1997); Johansson and Johansson (2006); Liker
(2004); Martin and Osterling (2014); Meudt et al. (2017);
Modig and Åhlström (2012); Monden (2011); Ohno (1988);
Olhager (2013); Persson (1996); Rother and Shook (1999);
Rüttiman (2018); Shingo (1984); Suzaki (1985); Womack et al.
(1990); Yamashina (1982)
Implementation Alizon et al. (2009); Chen et al. (2010); Cortes-Robles et al.
(2014); Cudney and Elrod (2011); Davies et al. (2014); Ellis et
al. (2010); Islam (2016); Ismael et al. (2014); John et al.
(2008); Pech and Vaněček (2018); Rother and Harris (2001);
Salunkhe and Shinge (2018); Stuart et al. (2002); Yüksel and
Uzunovic (2019); Zuting et al. (2014)
Lean comparison Albliwi (2017); Gonçalves et al. (2017); Maasouman and
Demirli (2016); Pigosso et al. (2013); Sundar et al. (2014)
Critical success factors Bjurström (2016); Harrison and van Hoek (2008); Jarrell and
McLain (2007); Li et al. (2006); Meredith and McTavish
(1992); Näslund, D. (2008); Näslund and Norrman (2019);
Ogbadu (2009); Shah and Ward (2007)
Challenges Bhamu and Sangwan (2014); Shah and Ward (2003); Stalk and
Hout (1990)
Improving Materials Supply Processes to Assembly Lines
77
Every theme is an important aspect of a change initiative. Application and implementation
are quite similar in terms of both dealing with change initiative principles/tools. However, a
distinction can be made by asking a simple question. Application considers what to use in a change
initiative, while implementation manages how it is done. Lean comparison tries to evaluate why a
change initiative should take place at the outset. Both critical success factors and challenges deal
with possible obstacles. CSFs, however, are more related to the necessity of different elements in
the organization when applying a change initiative. Challenges, on the other hand, deals with
problems that can arise if, for example, the CSFs are not in place. Lean comparison and challenges
are a minor part of the total identified literature, and, thus, the cross-case analysis is conducted to
increase the emphasis put on these themes.
3.5.2 Case selection
A vital question if doing multiple case studies is case selection or sampling (Voss et al., 2002).
Miles and Huberman (1994) present two actions in sampling: (1) set boundaries and (2) create a
frame. In accordance to what Miles and Huberman (1994) suggest, this paper uses its RQs to help
setting the boundaries of the sampling decisions. The sampling is further based on all cases to
meeting specific criteria, which both Eisenhardt (1989) and Voss et al. (2002) explain is common
in case research when selecting cases.
Firstly, the objective of the case selection is to find a company working with values and
principles that originates from TPS/Lean, in addition with them having implemented these methods
successfully. Here, the paper aims on finding a polar type to TePe, suggested by both Miles and
Huberman (1994) and Eisenhardt (1989) for highlighting differences in cases with contrasting
charateristics. By looking at contrasting cases, there is easier to understand single-case findings
(Miles & Huberman, 1994), such as at the principal company. A sample may, for example, be
constructed of companies that have low or high performance in a certain aspect (Voss et al., 2002).
By delimiting the case selection to a company that have implemented Lean, there will be
easier to find weaknesses and improvement aspects at the principal company. Since this case study
requires a company to have been successful in their Lean implementation (RQ 1 and RQ 2), a
criterion is that the company has been publicly noticed for their Lean commitments. Another
criterion is that the case needs to be a manufacturing firm in the southern of Sweden, due to
resource and time limitations of a 20-week Master’s thesis. Other than that, there is no requirement
on a specific industry. Finally, the company needs a higher asset turnover than the principal
company, since that could indicate a higher efficient flow of products through the company (RQ 1).
To obtain a better understanding of which companies that have implemented Lean principles
successfully, I started by using a sort of reputational case selection (Miles & Huberman, 1994) by
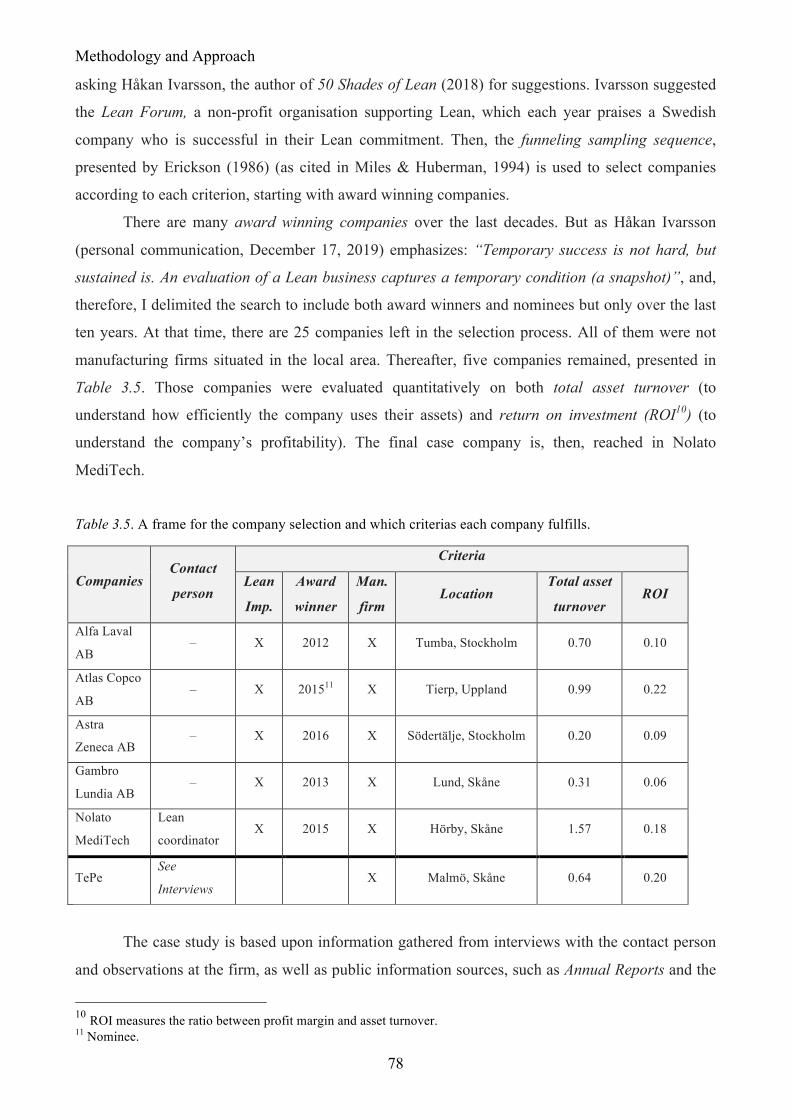
Methodology and Approach
78
asking Håkan Ivarsson, the author of 50 Shades of Lean (2018) for suggestions. Ivarsson suggested
the Lean Forum, a non-profit organisation supporting Lean, which each year praises a Swedish
company who is successful in their Lean commitment. Then, the funneling sampling sequence,
presented by Erickson (1986) (as cited in Miles & Huberman, 1994) is used to select companies
according to each criterion, starting with award winning companies.
There are many award winning companies over the last decades. But as Håkan Ivarsson
(personal communication, December 17, 2019) emphasizes: “Temporary success is not hard, but
sustained is. An evaluation of a Lean business captures a temporary condition (a snapshot)”, and,
therefore, I delimited the search to include both award winners and nominees but only over the last
ten years. At that time, there are 25 companies left in the selection process. All of them were not
manufacturing firms situated in the local area. Thereafter, five companies remained, presented in
Table 3.5. Those companies were evaluated quantitatively on both total asset turnover (to
understand how efficiently the company uses their assets) and return on investment (ROI10) (to
understand the company’s profitability). The final case company is, then, reached in Nolato
MediTech.
Table 3.5. A frame for the company selection and which criterias each company fulfills.
Companies Contact
person
Criteria
Lean
Imp.
Award
winner
Man.
firm Location
Total asset
turnover ROI
Alfa Laval
AB – X 2012 X Tumba, Stockholm 0.70 0.10
Atlas Copco
AB – X 201511 X Tierp, Uppland 0.99 0.22
Astra
Zeneca AB – X 2016 X Södertälje, Stockholm 0.20 0.09
Gambro
Lundia AB – X 2013 X Lund, Skåne 0.31 0.06
Nolato
MediTech
Lean
coordinator X 2015 X Hörby, Skåne 1.57 0.18
TePe See
Interviews X Malmö, Skåne 0.64 0.20
The case study is based upon information gathered from interviews with the contact person
and observations at the firm, as well as public information sources, such as Annual Reports and the
10 ROI measures the ratio between profit margin and asset turnover. 11 Nominee.
Improving Materials Supply Processes to Assembly Lines
79
firm’s webpage. Due to the time constraint, the empirical analysis and evaluation of the case
company is not based on several interviewes with different employees. Neither is there any access
to the case company’s ERP system. Of course, not lacking in both of these aspects would have been
beneficial for reliability. But, instead, extra focus is put on the interview guide to increase
reliability. Moreover, the cross-case analysis is for comparing TePe more generally with their polar
types, and, therefore, approximate numbers are enough.
3.5.3 Data collection protocol
Since case study research is one of the hardest research types to conduct, due to the absence of well-
documented approaches, the preparation for it is more than necessary (Yin, 2014). The most vital
part of preparation for data collection, especially for multiple-case design, is the development of a
case study protocol, which, if done well, enhances reliability of the research (Yin, 2014). The study
protocol describes the activities used in the research. The protocol used in this paper is based on
both Yin’s (2014) study protocol model and practical application made by Ellram (1996). There are
five areas forming the basis of the protocol: (1) overview of the case study, (2) data collection
procedures, (3) interview guides, (4) data analysis and (5) time management. The case study
protocol is attached in Appendix III. For more detailed information about this Master’s thesis time
management, see Appendix IV.
3.6 Data Collection
This paper is based on a case study being primarily qualitative, which Näslund (2002) confirms is
most typical for case studies. Näslund (2002) seems to yet criticize the use of traditional survey
research. This is due to the simplification of quite complex ”real-world” problems, which is often of
little use to the organizational practitioners themselves (Näslund, 2002). There are, in fact, usually
many cases in case studies conducted in the area of logistics research (Näslund, 2002). Most are
based on quanititative data, such as surveys (Näslund, 2002), but that can also include time-series
analyses or other gathered data based on statistical analyses (Patel & Davidson, 2011). However,
the researchers in those case studies do not spend any longer period of time in the companies for
observation and data gathering (Näslund, 2002). Näslund (2002), then, concludes that researchers
need to spend more time within organizations in the real world, and he also emphasizes the
necessity of using both qualitative as well as quantitative methods to develop and advance the
logistics research field.
This paper follows in Näslund’s footsteps, both spending several months at the principal
company and using a mixed methods approach. Both Gammelgaard (2003) and Kasanen et al
(1993) confirm that a mixed methods approach is suitable for the systems approach used in this
Methodology and Approach
80
paper, as well as the constructive approach. However, qualitative research tends to work with few
cases (Silverman, 2005), and this is one aspect of why this paper is primarily qualitative-based.
Others are that it uses direct observations and interviews to get closer to the employee’s perspective
(Näslund, 2002). Both of the methods are seen as qualitative techniques (see Ellram, 1996). Since
this paper applies a constructive approach, it also aims for a deeper understanding of the principal
company, spending plenty of time on-site. The research, therefore, tends to be empirical and to
some extent interpretive, which are qualitative charateristics (Stake, 1995). But the paper also uses
some quantitative techniques, such as time-series analysis for analyzing yearly sales data at the
principal company.
Regardless, there is actually not a clear distinction between quantitative and qualitative
methods, but rather a matter of emphasis (see Stake, 1995; Näslund, 2002; Silverman, 2005). Stake
(1995) highlights that all research seeks to find patterns, whether it is correlation/covariance
(quantitative studies) or, simply, patterns (qualitative studies).
However, what is generally called quantitative methods increases statistical generizability in
results and replicability (Flick, 2015). There is a risk of losing depth in the study though, and the
results may be too far removed from the real world problems (Laurie & Jensen, 2016). Preferably,
this paper is mainly a qualitative study, which enables an in-depth understanding of the subject,
enables descriptive and exploratory investigations and allow for flexibility in making adjustments in
the research design during the data collection phase (Laurie & Jensen, 2016). In general, the
qualitative case study also can contribute with analytical generalizations, but, as mentioned, often
not statistical generalizations (Yin, 2014). According to Yin (2014) case studies are not based on
”sampling units”, and the numbers are too small to represent any larger population (Yin, 2014).
However, this paper aims for analytical generalization through ”the opportunity to shed empirical
light about some theoretical concepts or principles” (Yin, 2014, p. 40), based on its RQs.
3.6.1 Principal company
Yin (2014) describes the importance of multiple sources of evidence, creating a database and
maintaining a chain of evidence to increase reliability in research. These are main ideas when
collecting data for this paper. Furthermore, triangulation is another important concept (see Yin,
2014; Voss et al., 2002; Miles & Huberman, 1994), described by Ellram (1996) as a use of different
techniques studying the same phenomenon. As part of a case study, some primary qualitative
techniques usually used are interviews, direct observations and archival research (Ellram, 1996;
Voss et al., 2002), and, as mentioned, that hold for this paper as well.
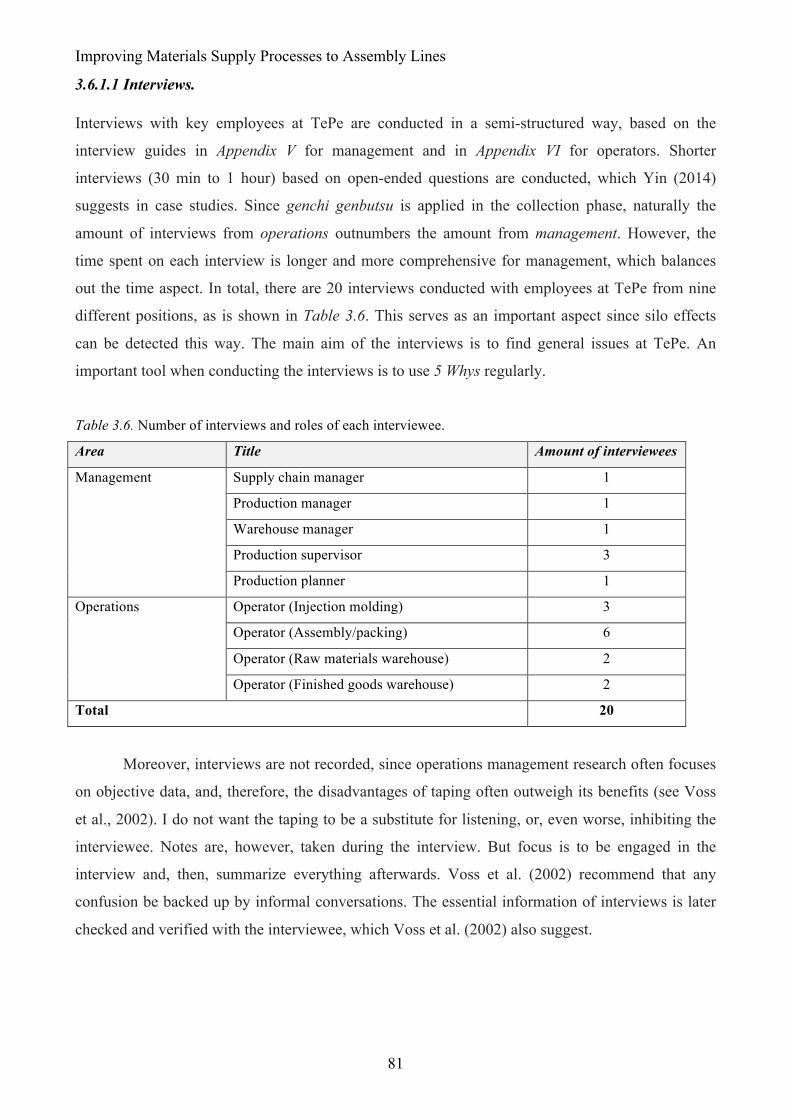
Improving Materials Supply Processes to Assembly Lines
81
3.6.1.1 Interviews.
Interviews with key employees at TePe are conducted in a semi-structured way, based on the
interview guides in Appendix V for management and in Appendix VI for operators. Shorter
interviews (30 min to 1 hour) based on open-ended questions are conducted, which Yin (2014)
suggests in case studies. Since genchi genbutsu is applied in the collection phase, naturally the
amount of interviews from operations outnumbers the amount from management. However, the
time spent on each interview is longer and more comprehensive for management, which balances
out the time aspect. In total, there are 20 interviews conducted with employees at TePe from nine
different positions, as is shown in Table 3.6. This serves as an important aspect since silo effects
can be detected this way. The main aim of the interviews is to find general issues at TePe. An
important tool when conducting the interviews is to use 5 Whys regularly.
Table 3.6. Number of interviews and roles of each interviewee.
Area Title Amount of interviewees
Management Supply chain manager 1
Production manager 1
Warehouse manager 1
Production supervisor 3
Production planner 1
Operations Operator (Injection molding) 3
Operator (Assembly/packing) 6
Operator (Raw materials warehouse) 2
Operator (Finished goods warehouse) 2
Total 20
Moreover, interviews are not recorded, since operations management research often focuses
on objective data, and, therefore, the disadvantages of taping often outweigh its benefits (see Voss
et al., 2002). I do not want the taping to be a substitute for listening, or, even worse, inhibiting the
interviewee. Notes are, however, taken during the interview. But focus is to be engaged in the
interview and, then, summarize everything afterwards. Voss et al. (2002) recommend that any
confusion be backed up by informal conversations. The essential information of interviews is later
checked and verified with the interviewee, which Voss et al. (2002) also suggest.
Methodology and Approach
82
3.6.1.2 Observations.
The direct observations are to some extent based on the output of the interviews, which means that
if, for example, several interviewees point on similar improvement areas, these are observed
specifically. Anyhow, the materials flow of high volume toothbrushes is observed and mapped
through visual mapping techniques such as VSM, operation chart, time and motion chart and the
value vs. time graph. This is done to understand the processes relevant to the case study. At first, a
key employee guides an initial gemba walk of the value stream to facilitate a brief understanding of
all processes within the production facility. Over the up-coming months, multiple direct
observations are conducted to support the visual mapping tools, primarily in quantitative terms. The
most essential aspects taken into consideration during observations are found in Appendix VII. The
guide is used in order to understand the current state, its charateristics and improvement aspects. All
metrics-related observations are based on several samples, often not at the same day or even in the
same week. This balances out influencing factors from the outer environment, such as variability in
demand, daily performances of an operator or intense breakdowns of a machine over a period of
time. However, when quantitative measurements were not possible to perform, a few operators
estimated the process in question.
Field notes are an important part of the collection phase of this paper. However, Silverman
(2005) states that the researcher should be aware of risks in the notes being subjective. Field notes
are taken continuously when encountering important facts or ideas, either in observation, informal
conversations or meetings to enhance credibility.
3.6.1.3 Archival records.
To support interviews and observations, both as triangulation and as complement for non-
observable information, archival records are used. For example, sales data, throughput times and
article information is gathered through TePe’s ERP system. Production orders are used to estimate
raw materials needed for specific products. To further understand the processes, this paper uses
secondary data in terms of a previous consulting job at TePe regarding production planning.
3.6.2 Case study company
The selected case company being part of the cross-case analysis is contacted through e-mail. For an
example of the initial contact or a succeeding e-mail, see Appendix VIII and Appendix IX,
respectively. The case company interview guide (see Appendix X) is sent out to the contact persons
in advance to help them prepare, in accordance to what Ellram (1996) suggests. A short agenda of
what I want out of the half-day study visit is attached, including time needed for the interview and
Improving Materials Supply Processes to Assembly Lines
83
such. Since the interview guide is sent out in advance, all aspects can be addressed within the 1-
hour interview timeframe.
All interviews are held in the interviewee’s own habitat without any recordings, to increase
the possibility of the interviewee answering from his/her heart. The same methodology is applied as
for the interviews conducted at TePe, which means that some short notes are taken in-between
questions, but the focus is rather on being dedicated the interview itself to track important answers
through open-ended questions.
The interviews are divided into seven aspects, in which the funnel model presented by Voss
et al. (2002) is partly used. The initial questions are broader, e.g. in the area of context. Thereafter,
the interviews go more into detail on positive aspects such as application, success factors and
characteristics. Then, more adverse aspects are brought up such as challenges, barriers and
improvement aspects. Shortly after finishing the interview, a brief summary of the answers is
written.
In addition with the interviews, observations are part of each study visit. The contact person
and I walk the gemba, for me to understand both the value stream of their products and how the
Lean methods are used in practice. During the observations 5 Whys is applied as far as possible. If
any ambiguities emerge later on, a follow-up is made through e-mail. Finally, for validation of their
answers, relevant parts are sent out to each interviewee for approval. All feedback is, then, taken
into consideration.
3.7 Analysis
In the beginning of a case study, too many researchers do not have a single idea about how evidence
is to be analyzed, and, surely, the analysis phase is the least developed process of case studies
(Eisenhardt, 1989; Yin, 2014). But that is why this paper uses a well-defined case study protocol
(Yin, 2014), early step analysis tools, and both within-case analysis and cross-case analysis.
3.7.1 Early step analysis
In the early steps of the analysis, some methods of which Miles and Huberman (1994) strongly
recommend are used to go back and forth over collected data, in parallel with generating strategies
for collecting new. This paper uses a frequent overlap between data collection and data analysis
(Eisenhardt, (1989). In the early process, this involves coding, memoing and case analysis meeting.
Coding is the start of the analysis (Miles & Huberman, 1994), and is fundamental for
effective case research (Voss et al., 2002). This paper uses the three types of coding suggested by
Miles and Huberman (1994):
Methodology and Approach
84
! Descriptive codes. Directly taken field notes after observations and interviews tries
to be as descriptive as possible without any interpretation. Simple codes, such as
RQ1, RQ2 and RQ3, to relate to each research question are used.
! Interpretively codes. Right after the observation or interview, the coding are
reviewed and results are interpreted. Codes used are either based on possible Lean
tools, such as KAN för Kanban etc., or on what the code influence, such as LEAD
for Lead time etc. Other codes used are based on the charateristics of the company,
such as CHA for Challenges, SUC for Critical success factors etc.
! Pattern coding. The coding is scrutinized to find patterns among the case itself but
also against the theoretical framework (what Yin (2014) calls pattern matching). The
coded field notes are reread periodically (Miles and Huberman, 1994).
Memos are the theorizing write-up of ideas about codes and their relationship (Miles and
Huberman, 1994). Along with coding, memos are used for several ideas created in this paper – it
can be personal, theoretical, methodological or of any other type. Moreover, to always stay on track
– especially being a lone researcher – case analysis meetings are held with the supervisor at TePe
weekly to summarize the current status of the case.
3.7.2 Within-case analysis
The overall idea of within-case studies is to strive for close acquaintance with each case
(Eisenhardt, 1989). Miles and Huberman (1994) presents plenty of methods for analyses; there are
probably as many approaches to case study analysis as there are researchers (Eisenhardt, 1989).
Many general tactics are used throughout this paper, such as looking for (1) patterns, (2)
relationships and (3) plausability, applying (4) lateral thinking, (5) clustering and (6) a chain of
evidence, and making (7) comparisons (Miles & Huberman, 1994).
This paper, however, starts describing and exploring the longitudinal case, in Chapter 4.5,
with displays, which is a visual format presenting systematic information for the user to draw valid
conclusions (Miles & Huberman, 1994). Many of the TPS/Lean visual mapping techniques are used
to display relevant information at TePe. There are also a time-oriented display in yearly sales data
to predict a future material flow (see Chapter 4.2). After observations and interviews, which are
structured in a role-ordered matrix to understand important information from key employees,
TePe’s most critical challenges are presented. Further on, each case company is analyzed using a
conceptually ordered matrix with this paper’s TPS/Lean maturity model as foundation (see Chapter
5.1.3 and Chapter 5.2.3). Each case company’s profitability and asset efficiency is also analyzed
through a Du Pont analysis using a time-oriented display over the last decade (see Chapter 5.1.2
Improving Materials Supply Processes to Assembly Lines
85
and Chapter 5.2.2). Both the conceptually ordered matrices and the time-oriented displays are, then,
the basis of the cross-case analysis in Chapter 6.
Next step of a within-case analysis is to look for explanation and causality (Miles &
Huberman, 1994). A powerful tool is causal networks, relating the most important dependant and
independant variables into a coherent picture (Miles & Huberman, 1994). This paper builds a causal
network for the Lean implementation process at Nolato to understand a generic TPS/Lean
implementation process (see Chapter 5.2.7). A similar causal network for a possible TPS/Lean
implementation at TePe is, later, built to guide a future implementation (see Chapter 7.3).
Moreover, I do a few analyses in early Chapter 7, which, basically, are displays of TePe’s machine
capacity influenced by important TPS/Lean variables. A scatterplot, which is suggested by Miles
and Huberman (1994), also shows this bottleneck identification (see Chapter 7.1.2). Finally,
another scatterplot is used to analyze the actual constructed recommendations for TePe in regards to
(1) execution ease and (2) anticipated benefit (see Chapter 8.3).
3.7.3 Cross-case analysis
A key step in case research is to systematically search for cross-case patterns (Voss et al., 2002).
Miles and Huberman (1994) present 22 different methods for cross-case analysis. Due to time
limitations, this paper uses only a few of them for exploring and describing, and, later, ordering and
explaining, which is the preferred methodology presented by Miles & Huberman (1994).
The conceptually ordered matrices from each case company are displayed in a gap analysis
to both understand TePe’s actual and potential degree of TPS/Lean implementation (see Chapter
6.1). As for the time-oriented displays from each case company, they are displayed in a time-
ordered scatterplot based on (1) asset turnover and (2) profit margin to understand how these
dimensions have changed over the decade (see Chapter 6.2.1). I also make use of cross-case
patterns for similarities and differences between the companies in efficiency and safety. Other
dimensions (i.e. strategy, characteristics, success factors and challenges) are chosen by the author of
this paper, which Eisenhardt (1989) proposes as a possibility, to show overall similarities and
differences between cases and support for cross-case conclusions to be drawn. Not only is a cross-
case analysis important for finding gaps between the case companies, but also to increase the
external validity of the findings in the TePe case study (Voss et al., 2002).
3.8 Contextual scheme of Master’s Thesis
It is crucial to have a view over what is intended to be studied and the relationship between these
categories prior to abovementioned empirical data collection and analysis (Voss et al., 2002). I
have, therefore, structured a contextual scheme over this Master’s thesis sections, related to each
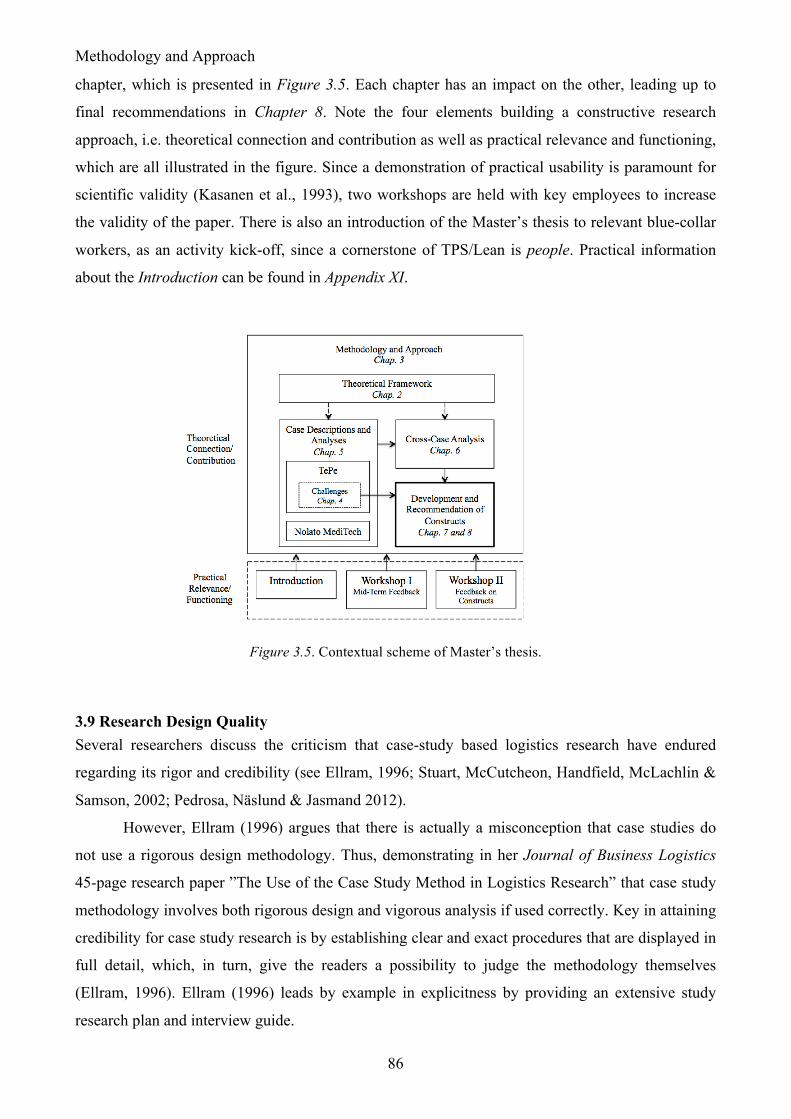
Methodology and Approach
86
chapter, which is presented in Figure 3.5. Each chapter has an impact on the other, leading up to
final recommendations in Chapter 8. Note the four elements building a constructive research
approach, i.e. theoretical connection and contribution as well as practical relevance and functioning,
which are all illustrated in the figure. Since a demonstration of practical usability is paramount for
scientific validity (Kasanen et al., 1993), two workshops are held with key employees to increase
the validity of the paper. There is also an introduction of the Master’s thesis to relevant blue-collar
workers, as an activity kick-off, since a cornerstone of TPS/Lean is people. Practical information
about the Introduction can be found in Appendix XI.
Figure 3.5. Contextual scheme of Master’s thesis.
3.9 Research Design Quality Several researchers discuss the criticism that case-study based logistics research have endured
regarding its rigor and credibility (see Ellram, 1996; Stuart, McCutcheon, Handfield, McLachlin &
Samson, 2002; Pedrosa, Näslund & Jasmand 2012).
However, Ellram (1996) argues that there is actually a misconception that case studies do
not use a rigorous design methodology. Thus, demonstrating in her Journal of Business Logistics
45-page research paper ”The Use of the Case Study Method in Logistics Research” that case study
methodology involves both rigorous design and vigorous analysis if used correctly. Key in attaining
credibility for case study research is by establishing clear and exact procedures that are displayed in
full detail, which, in turn, give the readers a possibility to judge the methodology themselves
(Ellram, 1996). Ellram (1996) leads by example in explicitness by providing an extensive study
research plan and interview guide.
Improving Materials Supply Processes to Assembly Lines
87
The constructive research has also met some criticism regarding the methodological process
not being scientific enough (Kasanen et al., 1993). This criticism can, however, be avoided through
properly planning and execution of the research (Stuart et al. 2002). Kasanen et al. (1993)
demonstrates that the constructive approach is a step-by-step procedure, with the possibility to
check every step, and the procedure has a definite purpose. The approach also shares the
characteristics of applied science in: (1) relevance, (2) easiness to use and (3) simplicity (Kasanen
et al., 1993). All of the abovementioned aspects answer to the most significant charateristics of
science (Kasanen et al., 1993).
Yin (2014), along with many other authors, provides more general guidelines for enhancing
validity and reliability in case study research. The conventional four criteria for judging the quality
of research design, based on positivism, is (1) construct validity, (2) internal validity, (3) external
validity and (4) reliability (see also Ellram, 1996; Näslund, 2002; Stuart et al., 2002; Voss et al.
2002; Halldórsson & Aastrup, 2003). Miles and Huberman (1994) mention a few more, but it is
particularly important to pay attention to validity and reliability in case study research (Voss et al.,
2002). How this paper applies each criterion is discussed below.
3.9.1 Construct validity
Construct validity is the criterion that addresses much of the attracted criticism (Yin, 2014). The
criterion refers to how well correct operational measures are established for the concepts being
studied (Ellram, 1996; Voss et al., 2002; Yin, 2014). Ellram (1996) and Yin (2014) discuss three
elements available to increase contruct validity: (1) multiple sources of evidence, (2) chain of
evidence and (3) draft review by key informants.
This paper uses multiple sources of evidence (triangulation) in four different ways presented
by Patton (1999). By using several data collection methods, such as interviews, direct observations
on-site, archival records and internal company memos, methods triangulation is achieved in this
paper. By, for example, interviewing 20 informants from several positions, triangulation of sources
is obtained. Analyst triangulation (review findings) is attained through two workshops, regularly
meetings with principal company supervisor and through verification of results from data collection
and analysis. Both root causes and challenges that TePe faces as well as the application of this
paper’s TPS/Lean maturity model on TePe’s business is roughly validated by some key employees
at the company. The workshops, in particular, are important to increase the overall quality of the
Methodology and Approach
88
final recommendations.12 Finally, several analysis methods are used striving for perspective
triangulation.
In the case of this report, the chain of evidence is verified by the supervisor13 at LTH
reading through the entire document a few times over the 20-week period.
For draft review by key informants, see analyst triangulation above.
3.9.2 Internal validity
Internal validity is to which extent there is a causal relationship between one event leading to the
other event (Yin, 2014). Are the findings credible to participants and readers (Miles & Huberman,
1994)? In this paper, pattern coding and pattern matching against existing literature, as well as
time-series analyses, are used to enhance the criterion.
3.9.3 External validity
Are the findings transferable and generalizable to other contexts (Miles & Huberman, 1994)? A
multiple case study increases external validity in comparison with a single case study (Voss et al.,
2002). Moreover, by using a replication logic (theoretical replication), the transferability is
increased further (Pedrosa et al., 2012). Since this case study provides well-defined units of
analyses and a justification of case selections14, the chances of generalizable findings are higher
(Pedrosa et al., 2012).
3.9.4 Reliability
Reliability addresses the repeatability of a study (Ellram, 1996). If the same procedure is used, a
later researcher can conduct the same research and come to find same results and conclusions (Yin,
2014). Yin (2014) suggests two tactics for enhancing reliability: using a case study protocol and
developing a case study database. Both tactics are used in this paper. Except the case study
protocol, interview guides and example of introduction e-mails are attached in Appendices. The
case study database has pictures of field notes, notes from interviews and printed material that case
companies provided during the research. For a summary of indicators that enhances different
quality criteria in this paper, see Table 3.7.
12 The recommended constructs are validated and assessed by key employees in Workshop 3 (see Appendix II). The constructs averaged 2.5 on a score from one to three (1 – ”not considered, 2 – ”considered” and 3 – ”definitely considered”). 13 Professor Andreas Norrman has won several Emerald Highly Commended Awards as both author and reviewer (Lund University, 2020). 14 Since the sample of cases is quite small, extra effort is put onto the case selection process.
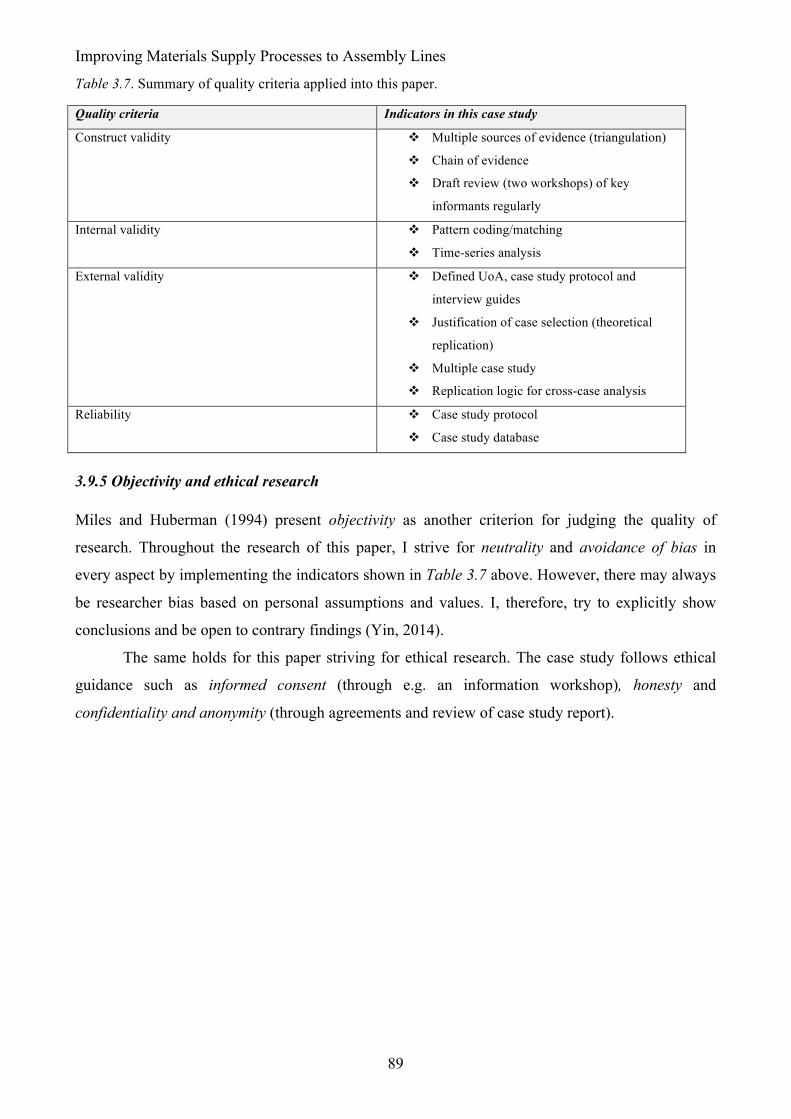
Improving Materials Supply Processes to Assembly Lines
89
Table 3.7. Summary of quality criteria applied into this paper.
Quality criteria Indicators in this case study
Construct validity ! Multiple sources of evidence (triangulation)
! Chain of evidence
! Draft review (two workshops) of key
informants regularly
Internal validity ! Pattern coding/matching
! Time-series analysis
External validity ! Defined UoA, case study protocol and
interview guides
! Justification of case selection (theoretical
replication)
! Multiple case study
! Replication logic for cross-case analysis
Reliability ! Case study protocol
! Case study database
3.9.5 Objectivity and ethical research
Miles and Huberman (1994) present objectivity as another criterion for judging the quality of
research. Throughout the research of this paper, I strive for neutrality and avoidance of bias in
every aspect by implementing the indicators shown in Table 3.7 above. However, there may always
be researcher bias based on personal assumptions and values. I, therefore, try to explicitly show
conclusions and be open to contrary findings (Yin, 2014).
The same holds for this paper striving for ethical research. The case study follows ethical
guidance such as informed consent (through e.g. an information workshop), honesty and
confidentiality and anonymity (through agreements and review of case study report).
Materials Supply Processes and Challenges at TePe
90
Chapter 4. Materials Supply Processes and Challenges at TePe
This chapter presents the empirical study of the principal company (TePe). Initially, a few
delimitations of this paper are stated, followed by descriptions of the operations in manufacturing a
toothbrush at TePe. The chapter moves over to studying the value streams of toothbrushes through
visual mapping techniques. Challenges related to each research question are identified. The
chapter is concluded with the most prioritized current challenges TePe faces.
4.1 Introduction
The research questions were, as mentioned, narrowed down to incorporate one product category,
toothbrushes, based on a close collaboration with TePe. However, after some research and some
on-site observations, I found out that there is a great variety of toothbrushes in different models in
many different colors. Only over the last couple of years, TePe has introduced several new products
to the market. Today, they have 19 different products in their product portfolio, along with some
being manufactured in eight different colors. Add to that toothbrushes that are sold in different
multi-packages: one, three, four and six pieces per package. In total, this adds up to around 108
SKUs only for toothbrushes in different colors. To be able to conduct a sharper analysis, this paper
therefore examines two categories of toothbrushes: (1) a high volume category and (2) a low
volume category.
4.2 Sales Volumes and Product Selection
To understand yearly volumes of sold toothbrushes, sales data is collected from the ERP system.
This basically highlights which products are more important to the company in regards to sales
volumes. This is essential for further construction of possible solutions, since it can have an impact
on everything from production planning prioritizations to material flows in the production facility
and the construction of new layouts etc.
Since TePe changed their ERP system some years ago, the sales data is limited to 2015-
2018. In total, TePe had a sales volume of around 19.9 million toothbrushes in 2019. Since they
strive for a yearly overall organic growth of 10-20 per cent, this value is most likely to increase over
the following years. Based on the last six years’ sales volumes, however, TePe has had an organic
growth for their toothbrushes of 5.4 per cent.
A pareto chart is established to evaluate the sales volumes of each and every product of
toothbrushes and their correlation to each other, which is in line with Hines and Rich (1997). In this
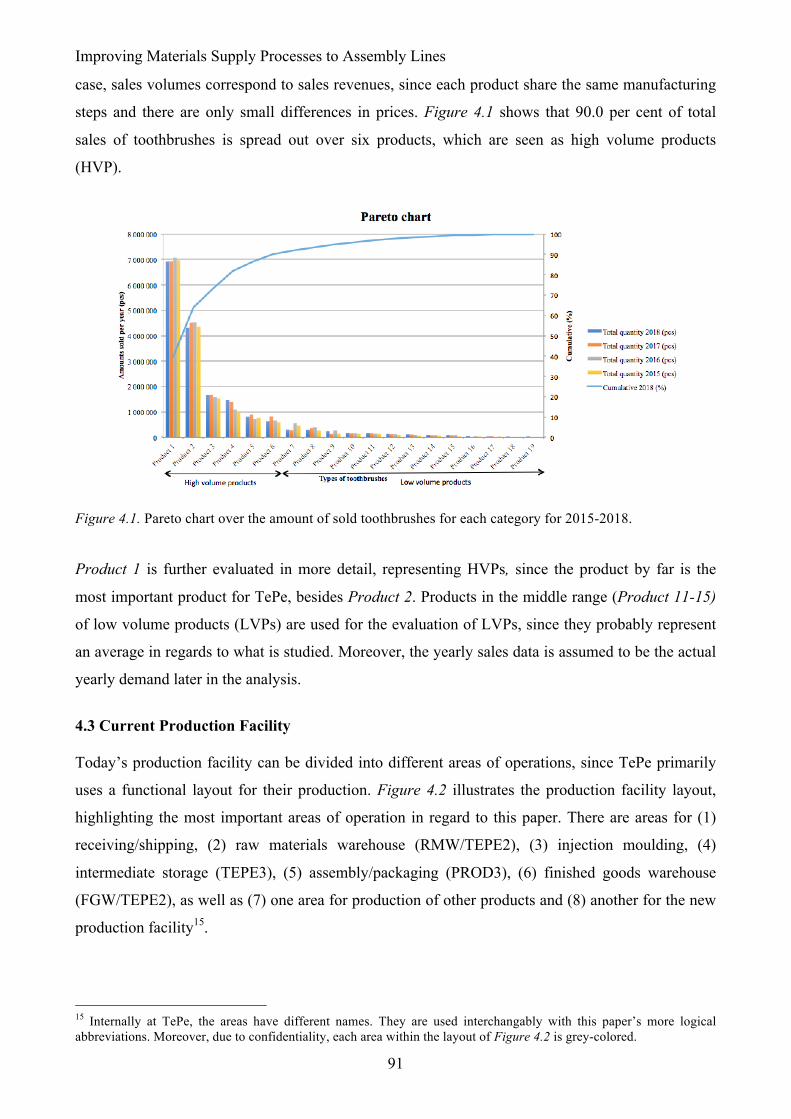
Improving Materials Supply Processes to Assembly Lines
91
case, sales volumes correspond to sales revenues, since each product share the same manufacturing
steps and there are only small differences in prices. Figure 4.1 shows that 90.0 per cent of total
sales of toothbrushes is spread out over six products, which are seen as high volume products
(HVP).
Figure 4.1. Pareto chart over the amount of sold toothbrushes for each category for 2015-2018.
Product 1 is further evaluated in more detail, representing HVPs, since the product by far is the
most important product for TePe, besides Product 2. Products in the middle range (Product 11-15)
of low volume products (LVPs) are used for the evaluation of LVPs, since they probably represent
an average in regards to what is studied. Moreover, the yearly sales data is assumed to be the actual
yearly demand later in the analysis.
4.3 Current Production Facility
Today’s production facility can be divided into different areas of operations, since TePe primarily
uses a functional layout for their production. Figure 4.2 illustrates the production facility layout,
highlighting the most important areas of operation in regard to this paper. There are areas for (1)
receiving/shipping, (2) raw materials warehouse (RMW/TEPE2), (3) injection moulding, (4)
intermediate storage (TEPE3), (5) assembly/packaging (PROD3), (6) finished goods warehouse
(FGW/TEPE2), as well as (7) one area for production of other products and (8) another for the new
production facility15.
15 Internally at TePe, the areas have different names. They are used interchangably with this paper’s more logical abbreviations. Moreover, due to confidentiality, each area within the layout of Figure 4.2 is grey-colored.

Materials Supply Processes and Challenges at TePe
92
Figu
re 4
.2. P
rodu
ctio
n fa
cilit
y la
yout
ove
r the
pro
duct
cat
egor
y to
othb
rush
es.
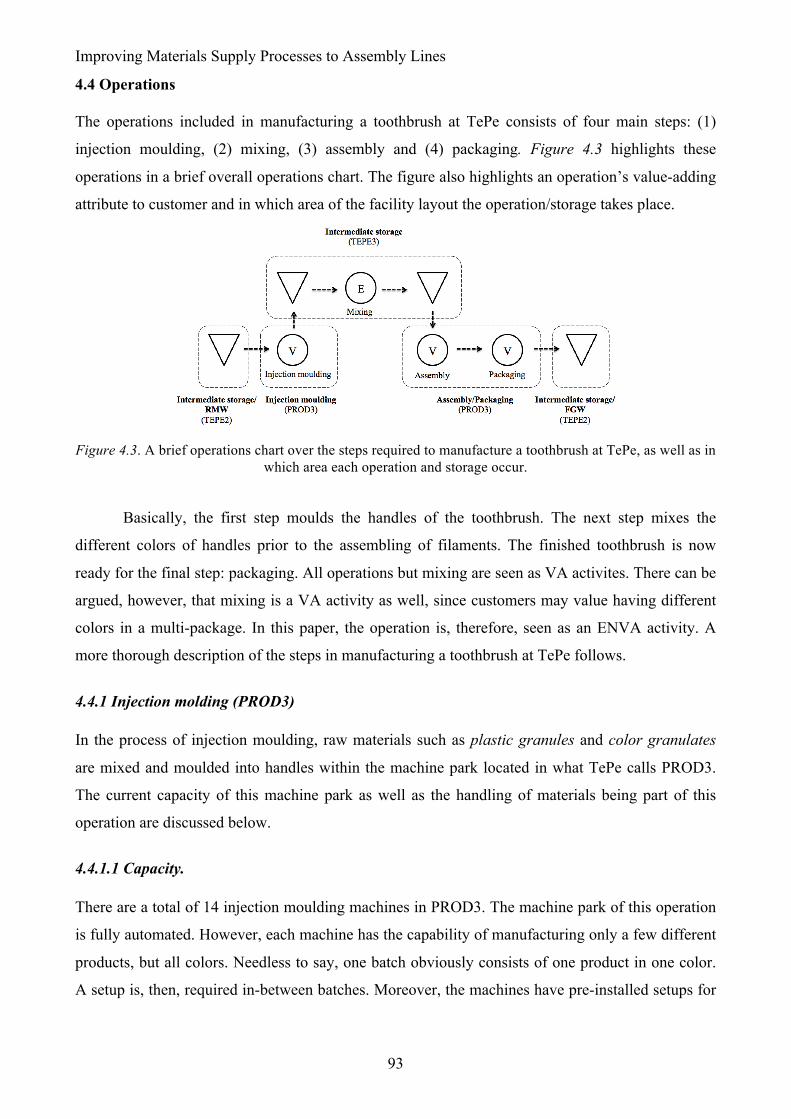
Improving Materials Supply Processes to Assembly Lines
93
4.4 Operations
The operations included in manufacturing a toothbrush at TePe consists of four main steps: (1)
injection moulding, (2) mixing, (3) assembly and (4) packaging. Figure 4.3 highlights these
operations in a brief overall operations chart. The figure also highlights an operation’s value-adding
attribute to customer and in which area of the facility layout the operation/storage takes place.
Figure 4.3. A brief operations chart over the steps required to manufacture a toothbrush at TePe, as well as in
which area each operation and storage occur.
Basically, the first step moulds the handles of the toothbrush. The next step mixes the
different colors of handles prior to the assembling of filaments. The finished toothbrush is now
ready for the final step: packaging. All operations but mixing are seen as VA activites. There can be
argued, however, that mixing is a VA activity as well, since customers may value having different
colors in a multi-package. In this paper, the operation is, therefore, seen as an ENVA activity. A
more thorough description of the steps in manufacturing a toothbrush at TePe follows.
4.4.1 Injection molding (PROD3)
In the process of injection moulding, raw materials such as plastic granules and color granulates
are mixed and moulded into handles within the machine park located in what TePe calls PROD3.
The current capacity of this machine park as well as the handling of materials being part of this
operation are discussed below.
4.4.1.1 Capacity.
There are a total of 14 injection moulding machines in PROD3. The machine park of this operation
is fully automated. However, each machine has the capability of manufacturing only a few different
products, but all colors. Needless to say, one batch obviously consists of one product in one color.
A setup is, then, required in-between batches. Moreover, the machines have pre-installed setups for
Materials Supply Processes and Challenges at TePe
94
suitable cycle times, injection times, cooling times, positions of tools etc. to produce each type of
stock keeping unit (SKU) with high quality.
While the machines run, technicians oversee them and solve problems if there are any
breakdowns. If no breakdowns occur, the machines can produce full batches without operator
supervision. The technician continuosly checks samples of the output visually to ensure high
quality. For example, they inspect the shape and the surface for any defects. Each technician knows
the standards by heart. If the handles do not meet specifications, the technician adjusts the settings
on the machine.
During the day shift, there is one technician overseeing all 14 injection moulding machines
for toothbrushes. However, the machines are planned to run around the clock, having one technician
overseeing all injection moulding machines at the plant (39 in total for all products) during the
remaining shifts.
4.4.1.2 Materials handling.
All machines have plastic granules transported as input through pipes connected with two silos
outside of the production plant. Technicians do only transport sacks of color granulates and pallets
of empty transportation boxes to the machines from intermediate storage. Then, their responsibility
is to start the production of handles by setting up the machines. The machines mould the handles,
let them cool while moulding new handles, and, then, automatically move the handles to the empty
transportation boxes which have room for 300 SKUs each. There are 48 transportation boxes on a
pallet, which means that the company generally strives for batches consisting of approximately 14
400 handles for all their different products. However, the technician finally transports the pallet into
the intermediate storage using a pallet jack. He drops the pallet on the warehouse floor in a
predetermined area in the middle of an aisle. The area is not painted.
4.4.2 Intermediate storage (IS or TEPE3)
There is an intermediate storage used between several different operations, but mainly in-between
injection moulding and assembly/packaging.
4.4.2.1 Capacity.
The current intermediate storage (IS or TEPE3) at TePe has a size of 437 m2 with 456 pallet
positions. A quarter of them are located on the bottom shelves, assigned fixed pallet positions16.
These fixed pallet positions are reserved for up-coming production orders. A SKU is assigned one
or several fixed pallet position based on the production planner’s forecast. This comprises 16 This is translated from what TePe internally calls ”dragningsplatser”.
Improving Materials Supply Processes to Assembly Lines
95
alterationes between production plans. There are 114 fixed pallet positions of today; 29 of which are
assigned raw materials and the rest handles.
There are also normal pallet positions within TEPE3 that are primarily assigned SKUs of
different handles, which are later used as a buffer for future demand. There are, however, a few17
pallets of raw materials stored in this area due to warehouse operator’s not putting away pallets with
residuals in the RMW after replenishment, since the residuals will be used in another raw materials
replenishment to the production later on anyway. A snapshot of the buffer gives 16 different SKUs
of handles in 62 various colors.
Moreover, there is a paternoster lift (TLIFT) connecting TEPE3 with assembly/packaging.
The lift consists of some 71 different SKUs of raw materials. When the TLIFT is fully utilized, it
takes up an estimated area of 52 m2, accounting for all 13 shelfs.
4.4.2.2 Materials handling.
The warehouse operators put away the batches of SKUs recieved from injection moulding that are
stacked one pallet high directly on the warehouse floor. There are four warehouse operators
working over two shifts, and they check TEPE3 at least twice a shift. Therefore, the batches often
wait on the floor for a shift (eight hours) before the warehouse operators are aware of them. The
batches are, then, transported to available normal pallet positions used as the buffer within TEPE3.
The warehouse operators also manually check fixed pallet positions and digitally check the TLIFT
for replenishments. In this way, these positions are easily accessible for the assembly/packaging
operators.
4.4.3 Mixing
Mixing is the second step in manufacturing a toothbrush at TePe. Since a batch is injection moulded
in a single color, and toothbrushes often are sold in multiple packages containing one color each,
many batches require mixing colors into new batches. Operators do this manually. Moreover, the
operation appears before assembly/packaging, since the latter is emerged into one automatic
sequence without storage in-between.
Safety is a corner stone at TePe, yet mixing is performed in an area within the intermediate
storage in which operators coexist with forklifts. Two reasons for this is accessibility and space
constraints.
Finally, mixing is seen as an ENVA acitivity in this paper. This is due to mixing not being a
VA activity per se, but may be seen as one for some customers. There may, for example, be
17 At the time of the analysis, there were 15 pallets of raw materials.
Materials Supply Processes and Challenges at TePe
96
customers, such as families, valuing a mix of colors when they buy a multi-package of
toothbrushes.
4.4.3.1 Capacity.
There is a scheme for mixing, which includes all assembly/packaging operators. Each day shift, a
new operator mixes. In theory, the restriction of capacity is the number of operators and the area of
operation. However, today one operator daily do the work of mixing.
4.4.3.2 Materials handling.
The assembly/packaging operator picks transportation boxes of different SKUs from the fixed pallet
positions. For example, Product 1 could be mixed in six different colors to enable for packaging of
a six pieces multi-package. As output of mixing, there are batches, still around 14 400 pcs each, of
mixed colors of a single product, in this example, Product 1. The batches are, again, put away in
intermediate storage prior to assembling.
4.4.4 Assembly/packaging
The third and the fourth step in manufacturing a toothbrush at TePe are linked together in an
automated machine park. First, assembly joins the filaments with the handles, which are newly
printed with a TePe logo. The machines, then, automatically move the finished toothbrushes onto a
conveyor belt connected with packaging. Second, the toothbrushes are packed in either a single or
multi-package (three, four or six).
4.4.4.1 Capacity.
There are ten stations in this machine park in total. A station includes both assembly and packaging,
with a single operator appointed responsibility for a particular station each shift. The machines are,
however, arranged in such a way that walking distances are minimized. Additionally, there is at
least one operator appointed an overall responsibility helping others in need. Thus, generally there
are 22 operators working over two shifts.
Generally speaking, the machines need no supervision. However, if any breakdowns occur,
the operator informs a technician. In either case, the responsible operator performs a quality
inspection on the conveyor belt in-between operations. Defects such as missing or too short
filaments, as well as misprints, are either scrapped or transported to developing countries depending
on the state of the product. Finally, the number of produced toothbrushes and defects as well as
break-down times are manually documented by the operator after each shift.
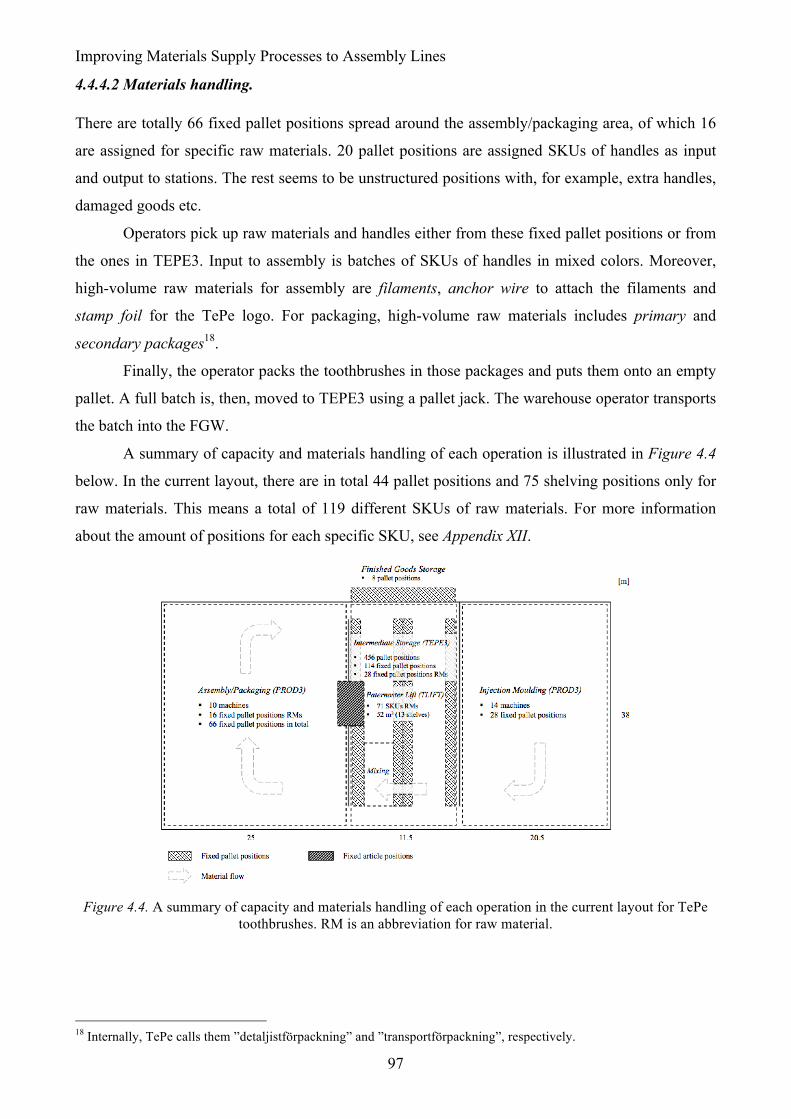
Improving Materials Supply Processes to Assembly Lines
97
4.4.4.2 Materials handling.
There are totally 66 fixed pallet positions spread around the assembly/packaging area, of which 16
are assigned for specific raw materials. 20 pallet positions are assigned SKUs of handles as input
and output to stations. The rest seems to be unstructured positions with, for example, extra handles,
damaged goods etc.
Operators pick up raw materials and handles either from these fixed pallet positions or from
the ones in TEPE3. Input to assembly is batches of SKUs of handles in mixed colors. Moreover,
high-volume raw materials for assembly are filaments, anchor wire to attach the filaments and
stamp foil for the TePe logo. For packaging, high-volume raw materials includes primary and
secondary packages18.
Finally, the operator packs the toothbrushes in those packages and puts them onto an empty
pallet. A full batch is, then, moved to TEPE3 using a pallet jack. The warehouse operator transports
the batch into the FGW.
A summary of capacity and materials handling of each operation is illustrated in Figure 4.4
below. In the current layout, there are in total 44 pallet positions and 75 shelving positions only for
raw materials. This means a total of 119 different SKUs of raw materials. For more information
about the amount of positions for each specific SKU, see Appendix XII.
Figure 4.4. A summary of capacity and materials handling of each operation in the current layout for TePe
toothbrushes. RM is an abbreviation for raw material.
18 Internally, TePe calls them ”detaljistförpackning” and ”transportförpackning”, respectively.
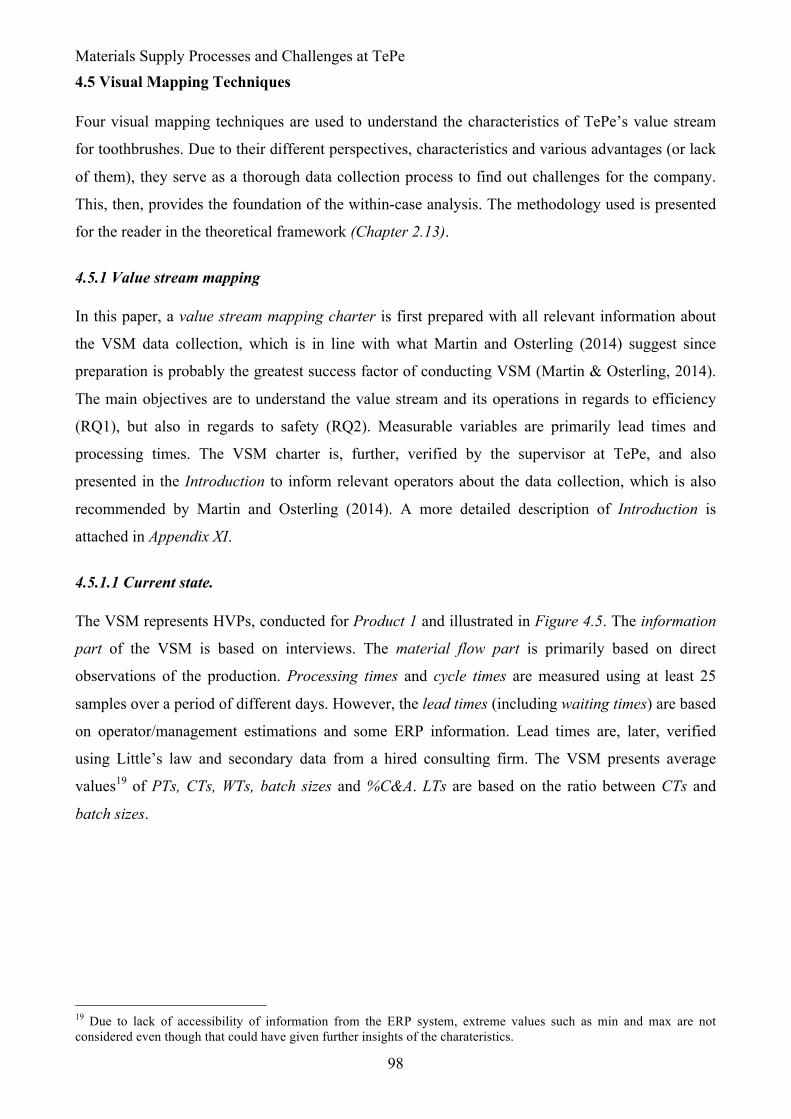
Materials Supply Processes and Challenges at TePe
98
4.5 Visual Mapping Techniques
Four visual mapping techniques are used to understand the characteristics of TePe’s value stream
for toothbrushes. Due to their different perspectives, characteristics and various advantages (or lack
of them), they serve as a thorough data collection process to find out challenges for the company.
This, then, provides the foundation of the within-case analysis. The methodology used is presented
for the reader in the theoretical framework (Chapter 2.13).
4.5.1 Value stream mapping
In this paper, a value stream mapping charter is first prepared with all relevant information about
the VSM data collection, which is in line with what Martin and Osterling (2014) suggest since
preparation is probably the greatest success factor of conducting VSM (Martin & Osterling, 2014).
The main objectives are to understand the value stream and its operations in regards to efficiency
(RQ1), but also in regards to safety (RQ2). Measurable variables are primarily lead times and
processing times. The VSM charter is, further, verified by the supervisor at TePe, and also
presented in the Introduction to inform relevant operators about the data collection, which is also
recommended by Martin and Osterling (2014). A more detailed description of Introduction is
attached in Appendix XI.
4.5.1.1 Current state.
The VSM represents HVPs, conducted for Product 1 and illustrated in Figure 4.5. The information
part of the VSM is based on interviews. The material flow part is primarily based on direct
observations of the production. Processing times and cycle times are measured using at least 25
samples over a period of different days. However, the lead times (including waiting times) are based
on operator/management estimations and some ERP information. Lead times are, later, verified
using Little’s law and secondary data from a hired consulting firm. The VSM presents average
values19 of PTs, CTs, WTs, batch sizes and %C&A. LTs are based on the ratio between CTs and
batch sizes.
19 Due to lack of accessibility of information from the ERP system, extreme values such as min and max are not considered even though that could have given further insights of the charateristics.
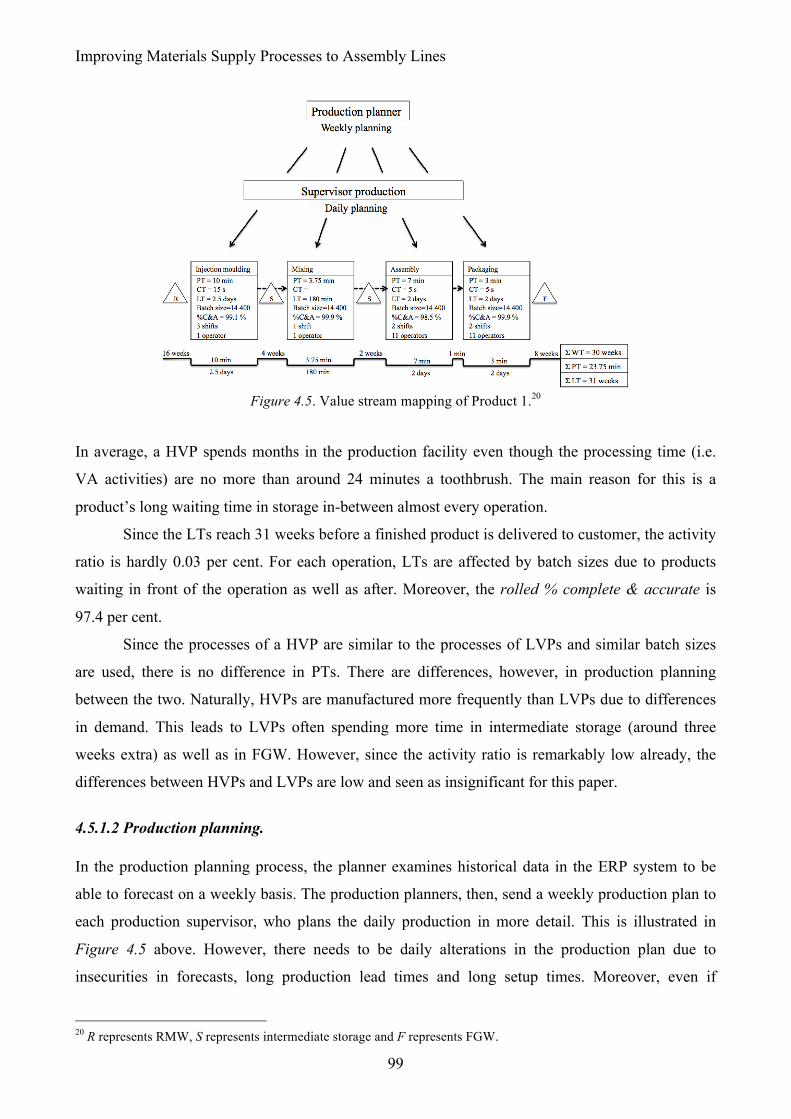
Improving Materials Supply Processes to Assembly Lines
99
Figure 4.5. Value stream mapping of Product 1.20
In average, a HVP spends months in the production facility even though the processing time (i.e.
VA activities) are no more than around 24 minutes a toothbrush. The main reason for this is a
product’s long waiting time in storage in-between almost every operation.
Since the LTs reach 31 weeks before a finished product is delivered to customer, the activity
ratio is hardly 0.03 per cent. For each operation, LTs are affected by batch sizes due to products
waiting in front of the operation as well as after. Moreover, the rolled % complete & accurate is
97.4 per cent.
Since the processes of a HVP are similar to the processes of LVPs and similar batch sizes
are used, there is no difference in PTs. There are differences, however, in production planning
between the two. Naturally, HVPs are manufactured more frequently than LVPs due to differences
in demand. This leads to LVPs often spending more time in intermediate storage (around three
weeks extra) as well as in FGW. However, since the activity ratio is remarkably low already, the
differences between HVPs and LVPs are low and seen as insignificant for this paper.
4.5.1.2 Production planning.
In the production planning process, the planner examines historical data in the ERP system to be
able to forecast on a weekly basis. The production planners, then, send a weekly production plan to
each production supervisor, who plans the daily production in more detail. This is illustrated in
Figure 4.5 above. However, there needs to be daily alterations in the production plan due to
insecurities in forecasts, long production lead times and long setup times. Moreover, even if
20 R represents RMW, S represents intermediate storage and F represents FGW.
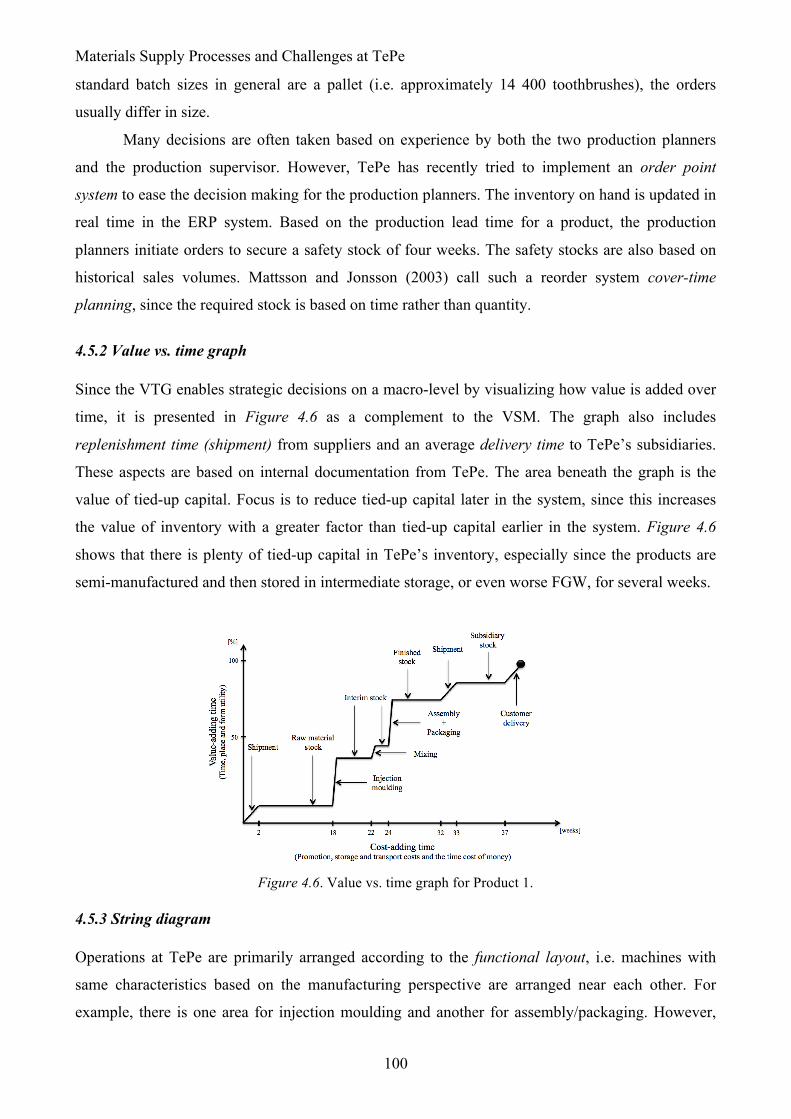
Materials Supply Processes and Challenges at TePe
100
standard batch sizes in general are a pallet (i.e. approximately 14 400 toothbrushes), the orders
usually differ in size.
Many decisions are often taken based on experience by both the two production planners
and the production supervisor. However, TePe has recently tried to implement an order point
system to ease the decision making for the production planners. The inventory on hand is updated in
real time in the ERP system. Based on the production lead time for a product, the production
planners initiate orders to secure a safety stock of four weeks. The safety stocks are also based on
historical sales volumes. Mattsson and Jonsson (2003) call such a reorder system cover-time
planning, since the required stock is based on time rather than quantity.
4.5.2 Value vs. time graph
Since the VTG enables strategic decisions on a macro-level by visualizing how value is added over
time, it is presented in Figure 4.6 as a complement to the VSM. The graph also includes
replenishment time (shipment) from suppliers and an average delivery time to TePe’s subsidiaries.
These aspects are based on internal documentation from TePe. The area beneath the graph is the
value of tied-up capital. Focus is to reduce tied-up capital later in the system, since this increases
the value of inventory with a greater factor than tied-up capital earlier in the system. Figure 4.6
shows that there is plenty of tied-up capital in TePe’s inventory, especially since the products are
semi-manufactured and then stored in intermediate storage, or even worse FGW, for several weeks.
Figure 4.6. Value vs. time graph for Product 1.
4.5.3 String diagram
Operations at TePe are primarily arranged according to the functional layout, i.e. machines with
same characteristics based on the manufacturing perspective are arranged near each other. For
example, there is one area for injection moulding and another for assembly/packaging. However,

Improving Materials Supply Processes to Assembly Lines
101
the production facility may be called a hybrid of a functional layout and a cell layout since a
packaging machine is arranged next to each assembly machine. TPS/Lean favors a cell layout (see
e.g. Schonberger, 1983; Yamashina, 1982; Liker, 2004). Partly arranging in a functional layout has
an impact on TePe’s entire material flow since it requires multiple storage areas, leading to the
wastes of unnecessary transportation and excess inventory. The string diagram in Figure 4.7
visualizes a general flow of a product through the production facility21.
Figure 4.7. String diagram (spaghetti diagram) of the production areas delimited to toothbrushes at TePe.
Using a functional layout, in general, increases flexibility in the sequence of processes
(Olhager, 2013). At TePe, however, the process sequence is not very complex and products need to
pass through all processes in a particular order, which means that the flexibility is insignificant.
Drawbacks of using a functional layout is instead that there is a risk of products piling up, leading
to long waiting times, long lead times and increased tied-up capital (Olhager, 2013), which happens
at TePe. Figure 4.7 also illustrates that the product travels back and forth in-between mixing and
intermediate storage, instead of having an aligned flow.
4.5.4 Operation chart
Since the operation chart accounts for the entire process (i.e. processing, inspection, transportation
and storage) step-by-step, it is used in this paper. Considering safety being a RQ measured in the
form of transportation distances by forklifts, the operation chart is a valuable tool since it visualizes
this aspect. The operation chart is based on the string diagram, but it delves into each step of the
system. The operation chart for toothbrushes is illustrated in Table 4.1.
21 The symbols are universal, but in any case described in the theoretical framework (Chapter 2.13).
Materials Supply Processes and Challenges at TePe
102
Table 4.1. Operation chart for a batch of toothbrushes at TePe.
Operation chart (Time & motion chart) for a batch of toothbrushes Current process
Step Description
Time (weeks)
Distance (m)
Value code
1 In storage x 16 N 2 To injection
moulding x 19 N
3 Injection moulding x - V 4 In injection
moulding x 0.5 N
5 Inspection x - E 6 To intermediate
storage x 54 N
7 In intermediate storage
x 4 N
8 To mixing x 25 N 9 Mixing x - E 10 To intermediate
storage x 25 N
11 In intermediate storage
x 2 N
12 To assembly/packaging
x 37.5 N
13 Assembly/packaging x - V 14 In
assembly/packaging x 0.5 N
15 Inspection x - E 16 To finished goods
warehouse x 135 N
15 In finished goods warehouse
x 8 N
Sum 3 6 2 6 31 295.5 -
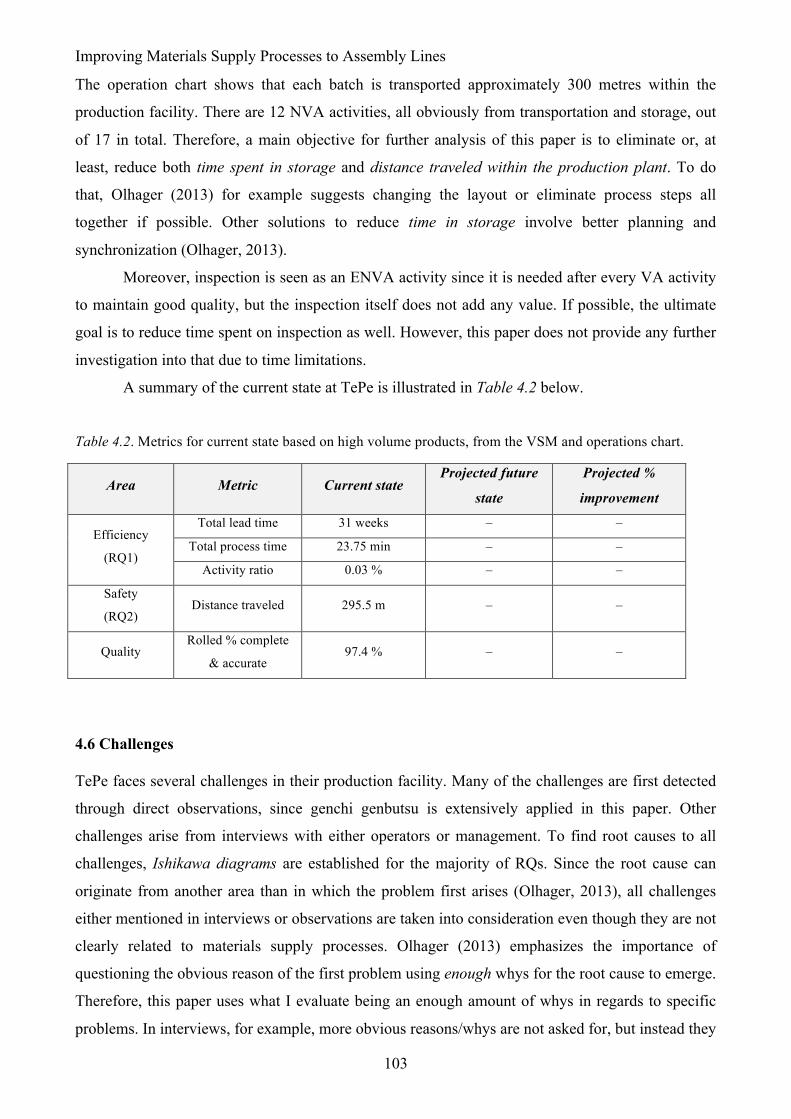
Improving Materials Supply Processes to Assembly Lines
103
The operation chart shows that each batch is transported approximately 300 metres within the
production facility. There are 12 NVA activities, all obviously from transportation and storage, out
of 17 in total. Therefore, a main objective for further analysis of this paper is to eliminate or, at
least, reduce both time spent in storage and distance traveled within the production plant. To do
that, Olhager (2013) for example suggests changing the layout or eliminate process steps all
together if possible. Other solutions to reduce time in storage involve better planning and
synchronization (Olhager, 2013).
Moreover, inspection is seen as an ENVA activity since it is needed after every VA activity
to maintain good quality, but the inspection itself does not add any value. If possible, the ultimate
goal is to reduce time spent on inspection as well. However, this paper does not provide any further
investigation into that due to time limitations.
A summary of the current state at TePe is illustrated in Table 4.2 below.
Table 4.2. Metrics for current state based on high volume products, from the VSM and operations chart.
Area Metric Current state Projected future
state
Projected %
improvement
Efficiency
(RQ1)
Total lead time 31 weeks – –
Total process time 23.75 min – –
Activity ratio 0.03 % – –
Safety
(RQ2) Distance traveled 295.5 m – –
Quality Rolled % complete
& accurate 97.4 % – –
4.6 Challenges
TePe faces several challenges in their production facility. Many of the challenges are first detected
through direct observations, since genchi genbutsu is extensively applied in this paper. Other
challenges arise from interviews with either operators or management. To find root causes to all
challenges, Ishikawa diagrams are established for the majority of RQs. Since the root cause can
originate from another area than in which the problem first arises (Olhager, 2013), all challenges
either mentioned in interviews or observations are taken into consideration even though they are not
clearly related to materials supply processes. Olhager (2013) emphasizes the importance of
questioning the obvious reason of the first problem using enough whys for the root cause to emerge.
Therefore, this paper uses what I evaluate being an enough amount of whys in regards to specific
problems. In interviews, for example, more obvious reasons/whys are not asked for, but instead they
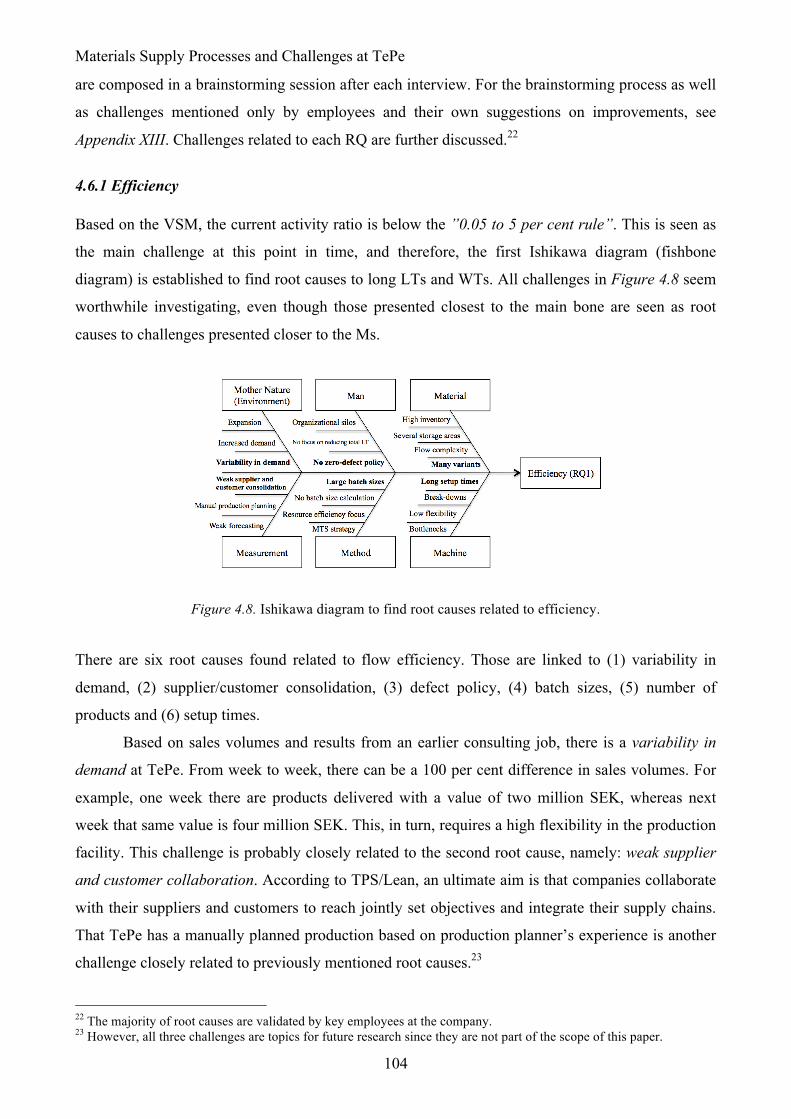
Materials Supply Processes and Challenges at TePe
104
are composed in a brainstorming session after each interview. For the brainstorming process as well
as challenges mentioned only by employees and their own suggestions on improvements, see
Appendix XIII. Challenges related to each RQ are further discussed.22
4.6.1 Efficiency
Based on the VSM, the current activity ratio is below the ”0.05 to 5 per cent rule”. This is seen as
the main challenge at this point in time, and therefore, the first Ishikawa diagram (fishbone
diagram) is established to find root causes to long LTs and WTs. All challenges in Figure 4.8 seem
worthwhile investigating, even though those presented closest to the main bone are seen as root
causes to challenges presented closer to the Ms.
Figure 4.8. Ishikawa diagram to find root causes related to efficiency.
There are six root causes found related to flow efficiency. Those are linked to (1) variability in
demand, (2) supplier/customer consolidation, (3) defect policy, (4) batch sizes, (5) number of
products and (6) setup times.
Based on sales volumes and results from an earlier consulting job, there is a variability in
demand at TePe. From week to week, there can be a 100 per cent difference in sales volumes. For
example, one week there are products delivered with a value of two million SEK, whereas next
week that same value is four million SEK. This, in turn, requires a high flexibility in the production
facility. This challenge is probably closely related to the second root cause, namely: weak supplier
and customer collaboration. According to TPS/Lean, an ultimate aim is that companies collaborate
with their suppliers and customers to reach jointly set objectives and integrate their supply chains.
That TePe has a manually planned production based on production planner’s experience is another
challenge closely related to previously mentioned root causes.23
22 The majority of root causes are validated by key employees at the company. 23 However, all three challenges are topics for future research since they are not part of the scope of this paper.
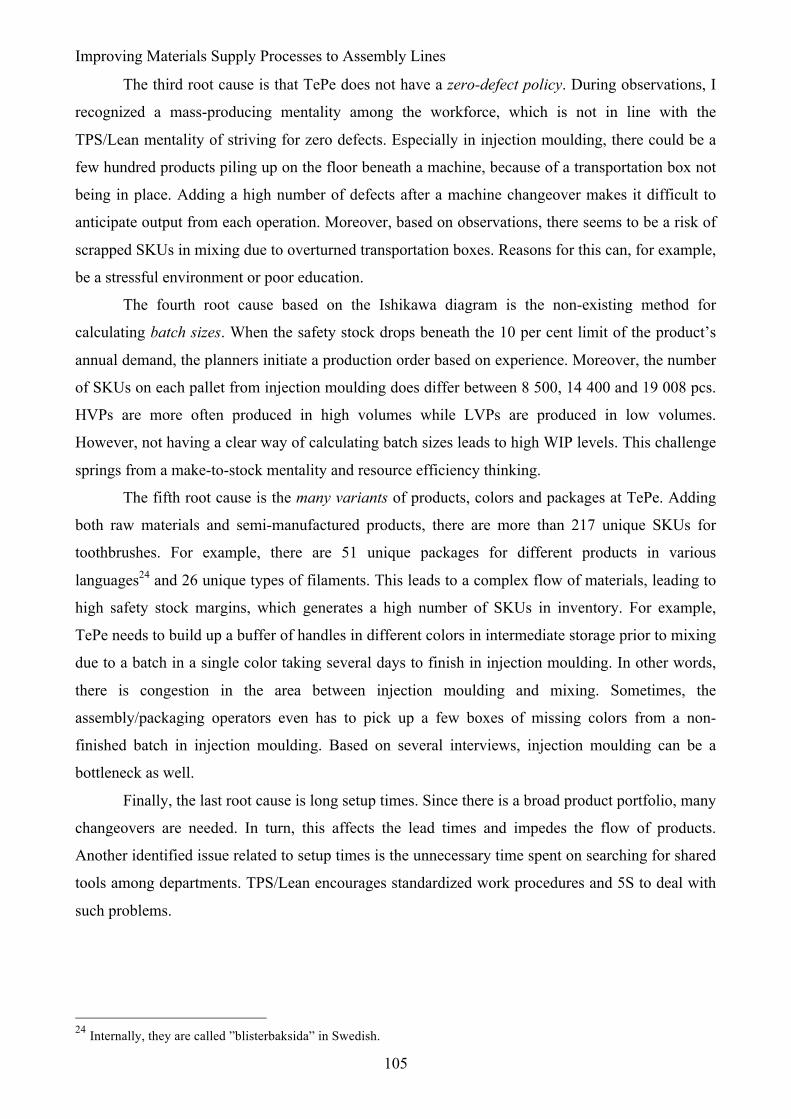
Improving Materials Supply Processes to Assembly Lines
105
The third root cause is that TePe does not have a zero-defect policy. During observations, I
recognized a mass-producing mentality among the workforce, which is not in line with the
TPS/Lean mentality of striving for zero defects. Especially in injection moulding, there could be a
few hundred products piling up on the floor beneath a machine, because of a transportation box not
being in place. Adding a high number of defects after a machine changeover makes it difficult to
anticipate output from each operation. Moreover, based on observations, there seems to be a risk of
scrapped SKUs in mixing due to overturned transportation boxes. Reasons for this can, for example,
be a stressful environment or poor education.
The fourth root cause based on the Ishikawa diagram is the non-existing method for
calculating batch sizes. When the safety stock drops beneath the 10 per cent limit of the product’s
annual demand, the planners initiate a production order based on experience. Moreover, the number
of SKUs on each pallet from injection moulding does differ between 8 500, 14 400 and 19 008 pcs.
HVPs are more often produced in high volumes while LVPs are produced in low volumes.
However, not having a clear way of calculating batch sizes leads to high WIP levels. This challenge
springs from a make-to-stock mentality and resource efficiency thinking.
The fifth root cause is the many variants of products, colors and packages at TePe. Adding
both raw materials and semi-manufactured products, there are more than 217 unique SKUs for
toothbrushes. For example, there are 51 unique packages for different products in various
languages24 and 26 unique types of filaments. This leads to a complex flow of materials, leading to
high safety stock margins, which generates a high number of SKUs in inventory. For example,
TePe needs to build up a buffer of handles in different colors in intermediate storage prior to mixing
due to a batch in a single color taking several days to finish in injection moulding. In other words,
there is congestion in the area between injection moulding and mixing. Sometimes, the
assembly/packaging operators even has to pick up a few boxes of missing colors from a non-
finished batch in injection moulding. Based on several interviews, injection moulding can be a
bottleneck as well.
Finally, the last root cause is long setup times. Since there is a broad product portfolio, many
changeovers are needed. In turn, this affects the lead times and impedes the flow of products.
Another identified issue related to setup times is the unnecessary time spent on searching for shared
tools among departments. TPS/Lean encourages standardized work procedures and 5S to deal with
such problems.
24 Internally, they are called ”blisterbaksida” in Swedish.
Materials Supply Processes and Challenges at TePe
106
4.6.2 Safety
Based on RQ2, an Ishikawa diagram is established to search for root causes related to safety
challenges found. The root causes are presented in Figure 4.9, and relate to (1) resource efficiency,
(2) safety measurements, (3) asset conditions, (4) replenishment procedures, (5) materials
accessibility and (6) area restrictions and painted lines.
Figure 4.9. Ishikawa diagram to find root causes related to safety.
The first root cause is part of the mass-producing mentality at the company: resource
efficiency. Mostly due to automation, TePe has become a company with, what Modig and Åhlström
(2012) would call, efficient islands. This leads to several secondary needs (see Chapter 2.18). An
organization also needs to focus on flow efficiency to reduce superfluous work and eliminate
wastes.
The second root cause is safety measurements. Today, TePe does have a zero tolerance
towards serious accidents. However, they lack in having an organized way of finding incidents and
observing risks among operators.25 Moreover, some deterioration in asset conditions also impact
safety, but resource efficiency and number of defects as well.26
The fourth (i.e. replenishment procedure) and fifth root cause (i.e. materials accessibility)
are closely related to each other. Operators are forced to pick up raw materials and semi-
manufactured products in intermediate storage (TEPE3). This obviously increases safety hazards,
since forklifts move there. There are also raw materials spread out within the assembly/packaging
area (PROD3), which means forklifts and operators working side-by-side there as well.
Lastly, the sixth root cause targets area restrictions. There are no restricted areas for visitors
or operators in neither intermediate storage (TEPE3) nor RMW/FGW (TEPE2). There are,
however, painted lines in assembly/packaging today.
25 FMEA analyses are used annually in each department by management, yet not among the operators. 26 The machine park is, however, not part of this paper’s scope.
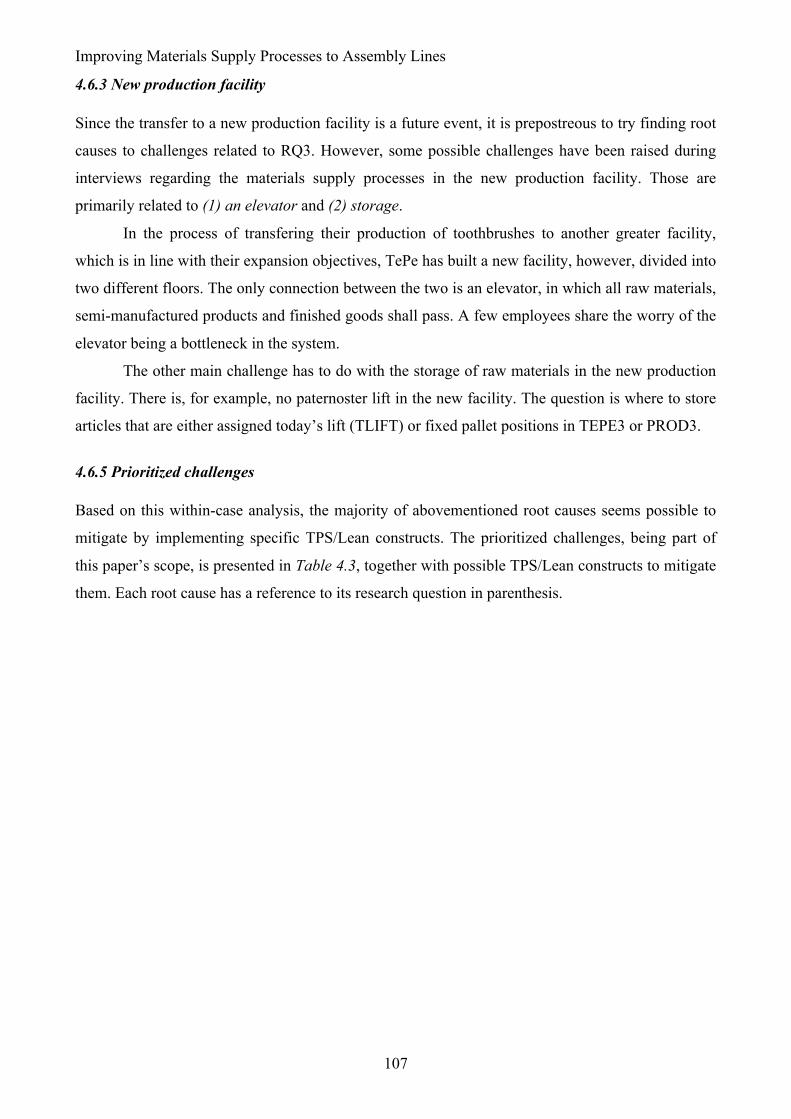
Improving Materials Supply Processes to Assembly Lines
107
4.6.3 New production facility
Since the transfer to a new production facility is a future event, it is prepostreous to try finding root
causes to challenges related to RQ3. However, some possible challenges have been raised during
interviews regarding the materials supply processes in the new production facility. Those are
primarily related to (1) an elevator and (2) storage.
In the process of transfering their production of toothbrushes to another greater facility,
which is in line with their expansion objectives, TePe has built a new facility, however, divided into
two different floors. The only connection between the two is an elevator, in which all raw materials,
semi-manufactured products and finished goods shall pass. A few employees share the worry of the
elevator being a bottleneck in the system.
The other main challenge has to do with the storage of raw materials in the new production
facility. There is, for example, no paternoster lift in the new facility. The question is where to store
articles that are either assigned today’s lift (TLIFT) or fixed pallet positions in TEPE3 or PROD3.
4.6.5 Prioritized challenges
Based on this within-case analysis, the majority of abovementioned root causes seems possible to
mitigate by implementing specific TPS/Lean constructs. The prioritized challenges, being part of
this paper’s scope, is presented in Table 4.3, together with possible TPS/Lean constructs to mitigate
them. Each root cause has a reference to its research question in parenthesis.
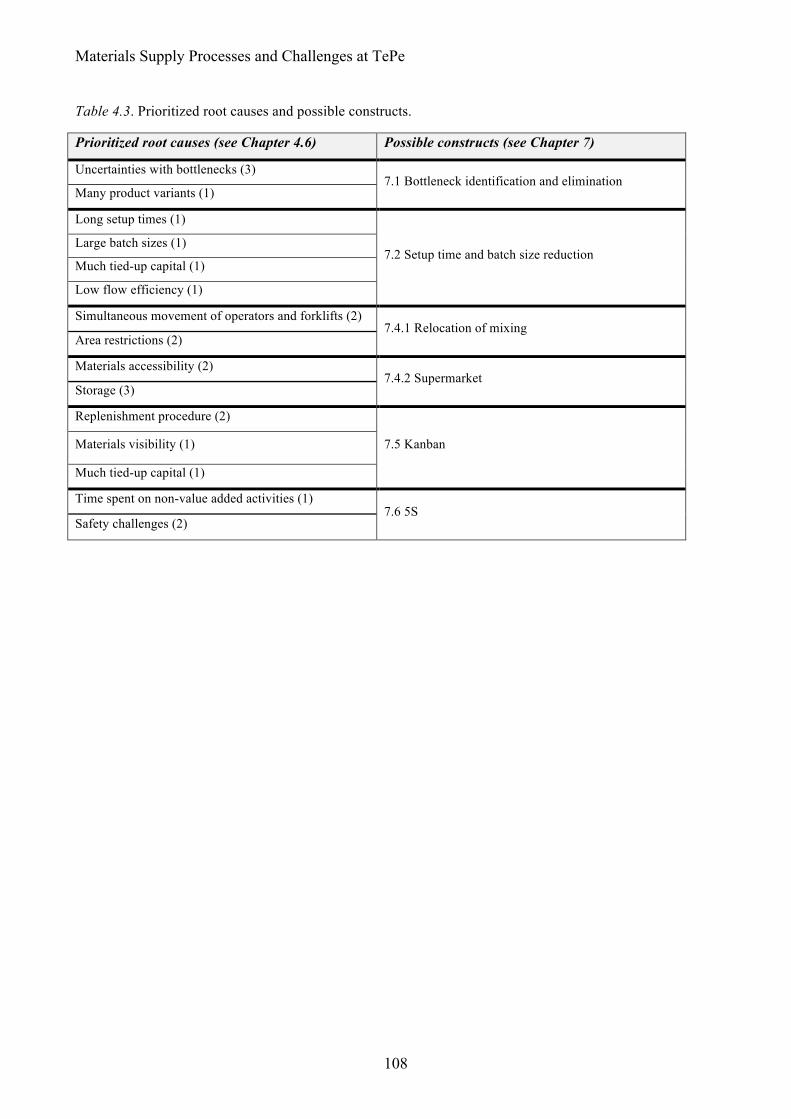
Materials Supply Processes and Challenges at TePe
108
Table 4.3. Prioritized root causes and possible constructs.
Prioritized root causes (see Chapter 4.6) Possible constructs (see Chapter 7)
Uncertainties with bottlenecks (3) 7.1 Bottleneck identification and elimination
Many product variants (1)
Long setup times (1)
7.2 Setup time and batch size reduction Large batch sizes (1)
Much tied-up capital (1)
Low flow efficiency (1)
Simultaneous movement of operators and forklifts (2) 7.4.1 Relocation of mixing
Area restrictions (2)
Materials accessibility (2) 7.4.2 Supermarket
Storage (3)
Replenishment procedure (2)
7.5 Kanban Materials visibility (1)
Much tied-up capital (1)
Time spent on non-value added activities (1) 7.6 5S
Safety challenges (2)
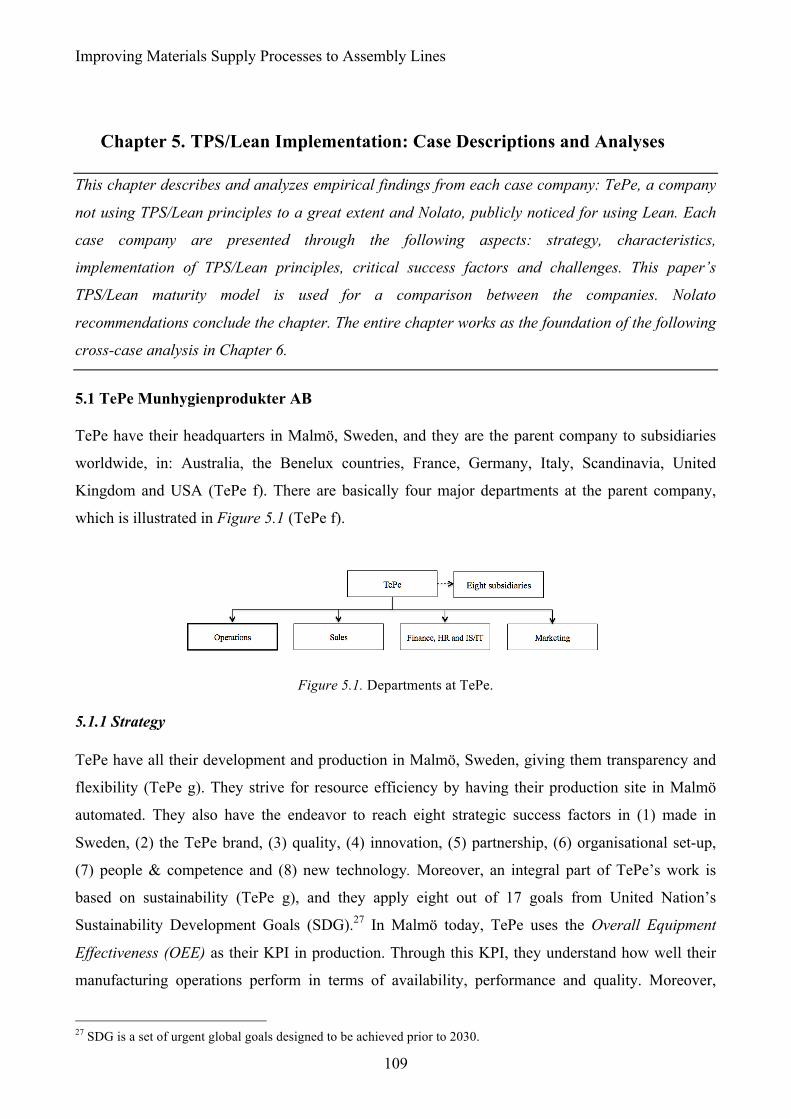
Improving Materials Supply Processes to Assembly Lines
109
Chapter 5. TPS/Lean Implementation: Case Descriptions and Analyses This chapter describes and analyzes empirical findings from each case company: TePe, a company
not using TPS/Lean principles to a great extent and Nolato, publicly noticed for using Lean. Each
case company are presented through the following aspects: strategy, characteristics,
implementation of TPS/Lean principles, critical success factors and challenges. This paper’s
TPS/Lean maturity model is used for a comparison between the companies. Nolato
recommendations conclude the chapter. The entire chapter works as the foundation of the following
cross-case analysis in Chapter 6.
5.1 TePe Munhygienprodukter AB
TePe have their headquarters in Malmö, Sweden, and they are the parent company to subsidiaries
worldwide, in: Australia, the Benelux countries, France, Germany, Italy, Scandinavia, United
Kingdom and USA (TePe f). There are basically four major departments at the parent company,
which is illustrated in Figure 5.1 (TePe f).
Figure 5.1. Departments at TePe.
5.1.1 Strategy
TePe have all their development and production in Malmö, Sweden, giving them transparency and
flexibility (TePe g). They strive for resource efficiency by having their production site in Malmö
automated. They also have the endeavor to reach eight strategic success factors in (1) made in
Sweden, (2) the TePe brand, (3) quality, (4) innovation, (5) partnership, (6) organisational set-up,
(7) people & competence and (8) new technology. Moreover, an integral part of TePe’s work is
based on sustainability (TePe g), and they apply eight out of 17 goals from United Nation’s
Sustainability Development Goals (SDG).27 In Malmö today, TePe uses the Overall Equipment
Effectiveness (OEE) as their KPI in production. Through this KPI, they understand how well their
manufacturing operations perform in terms of availability, performance and quality. Moreover,
27 SDG is a set of urgent global goals designed to be achieved prior to 2030.
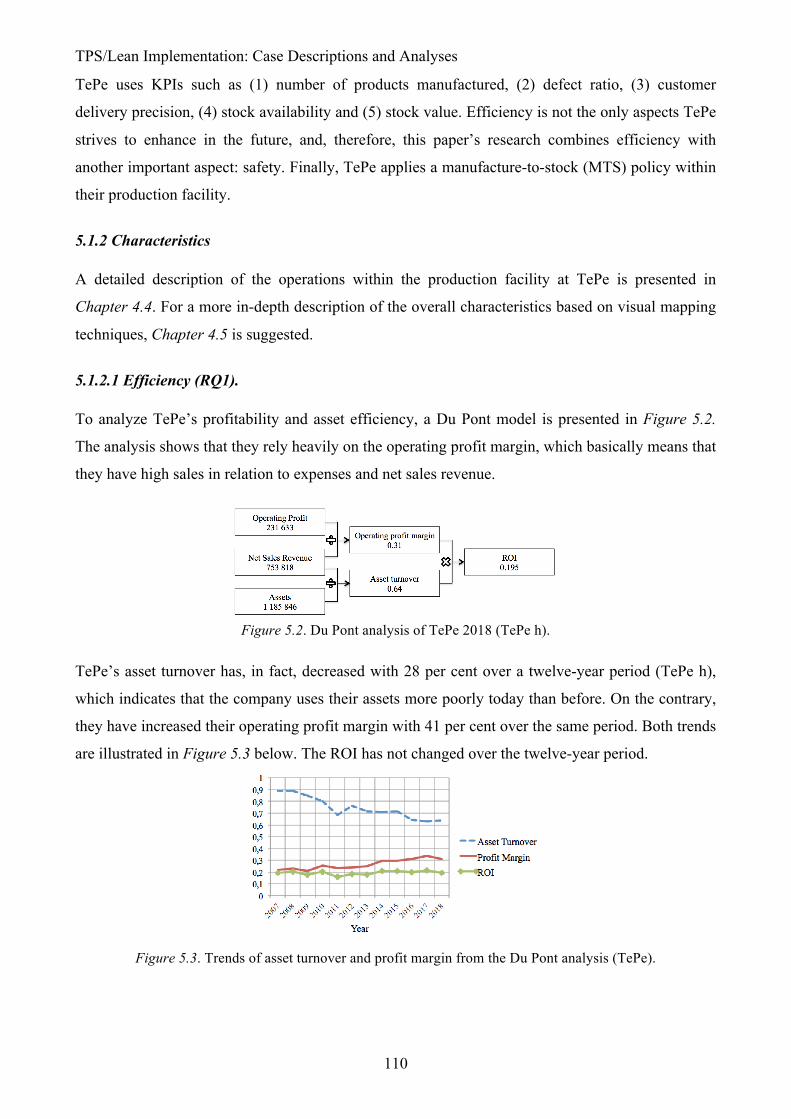
TPS/Lean Implementation: Case Descriptions and Analyses
110
TePe uses KPIs such as (1) number of products manufactured, (2) defect ratio, (3) customer
delivery precision, (4) stock availability and (5) stock value. Efficiency is not the only aspects TePe
strives to enhance in the future, and, therefore, this paper’s research combines efficiency with
another important aspect: safety. Finally, TePe applies a manufacture-to-stock (MTS) policy within
their production facility.
5.1.2 Characteristics
A detailed description of the operations within the production facility at TePe is presented in
Chapter 4.4. For a more in-depth description of the overall characteristics based on visual mapping
techniques, Chapter 4.5 is suggested.
5.1.2.1 Efficiency (RQ1).
To analyze TePe’s profitability and asset efficiency, a Du Pont model is presented in Figure 5.2.
The analysis shows that they rely heavily on the operating profit margin, which basically means that
they have high sales in relation to expenses and net sales revenue.
Figure 5.2. Du Pont analysis of TePe 2018 (TePe h).
TePe’s asset turnover has, in fact, decreased with 28 per cent over a twelve-year period (TePe h),
which indicates that the company uses their assets more poorly today than before. On the contrary,
they have increased their operating profit margin with 41 per cent over the same period. Both trends
are illustrated in Figure 5.3 below. The ROI has not changed over the twelve-year period.
Figure 5.3. Trends of asset turnover and profit margin from the Du Pont analysis (TePe).
Improving Materials Supply Processes to Assembly Lines
111
5.1.2.2 Safety (RQ2).
Work environment management, employees and safety are all important aspects at TePe. All work
needs to be conducted in a structured and secure manner to reach the zero accident goal (TePe g).
Therefore, the majority of machines have safety equipment. To reduce risk of injuries or ill health,
all operations undergo risk analysis, such as FMEA28, annually or in modification phases (TePe g).
There are also four safety inspections yearly, in which attendance, accident and injury statistics are
evaluated (TePe g). However, processes in-between operations, such as supplying materials do lack
in safety regulations, according to TePe employees. For more details, see safety challenges in
Chapter 4.6.2.
5.1.3 Implementation of Lean principles
The implementation of different TPS/Lean principles, and their methods, at TePe is presented in
Table 5.1. The principles are based on the theoretical framework, summarized in Chapter 2.1, and
the evaluation is based on the TPS/Lean maturity model established in Chapter 2.19.2, and, again,
presented to the reader in Figure 5.4 below. Brief explanations to each assessment follow.29
Figure 5.4. Stages in the TPS/Lean maturity model.
28 Failure Mode and Effects Analysis is a structured approach of identifying failures, and their effects, within a design of a process or products. The aim of a FMEA is to identify, prioritize and limit the failure modes. 29 The assessment based on the TPS/Lean maturity model is roughly validated by a key employee at TePe.
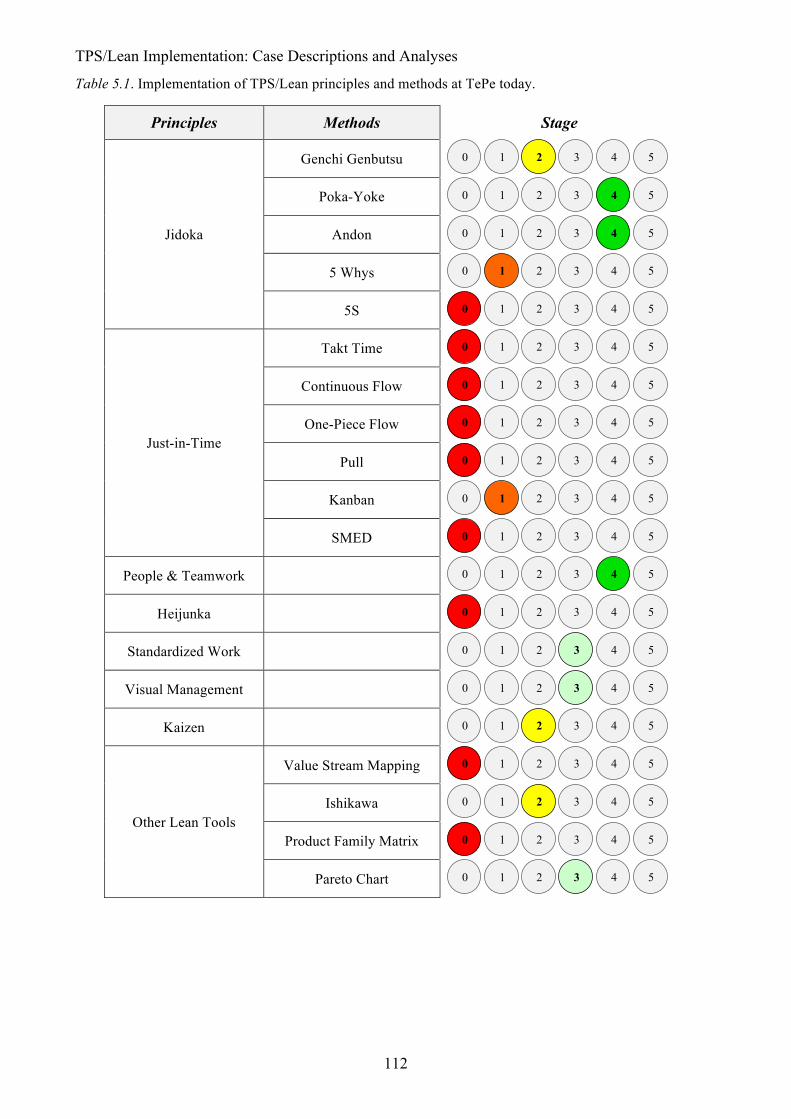
TPS/Lean Implementation: Case Descriptions and Analyses
112
Table 5.1. Implementation of TPS/Lean principles and methods at TePe today.
Principles Methods Stage
Jidoka
Genchi Genbutsu
Poka-Yoke
Andon
5 Whys
5S
Just-in-Time
Takt Time
Continuous Flow
One-Piece Flow
Pull
Kanban
SMED
People & Teamwork
Heijunka
Standardized Work
Visual Management
Kaizen
Other Lean Tools
Value Stream Mapping
Ishikawa
Product Family Matrix
Pareto Chart
0 1 2 3 4
5
0 1 2 3 4
5
0 1 2 3 4
5
0 1 2 3 4
5
0
1 2 3 4
5
0
1 2 3 4
5
0
1 2 3 4
5
0
1 2 3 4
5
0
1 2 3 4
5
0 1 2 3 4
5
0
1 2 3 4
5
0 1 2 3 4
5
0
1 2 3 4
5
0 1 2 3 4
5
0 1 2 3 4
5
0 1 2 3 4
5
0
1 2 3 4
5
0 1 2 3 4
5
0
1 2 3 4
5
0 1 2 3 4
5
Improving Materials Supply Processes to Assembly Lines
113
5.1.3.1 Genchi genbutsu.
Management are aware that observing the actual site where work takes place is the best thing to do
to understand problems. The method, however, is applied sparsely. Interviews with operators verify
the case. The method is assessed as defined.
5.1.3.2 Poka-yoke.
A process is stopped immediately if something happens. There are mistake-proofing methods built-
in automatically in the machine. TePe do work with autonomation, since operators shut down the
machines if something is wrong, then, tries to fix the problem at least in the short-term. The method
is assessed as excellent.
5.1.3.3 Andon.
The machines also have in-built signals for processing (green) and not processing (red). The signals
are activated automatically by the machines, and are shown all over the production facility. The
method is assessed as excellent.
5.1.3.4 5 Whys.
In the production facility, root cause analyses are often not performed by any operators. They,
instead, try to solve the issue at hand quickly to start up the production again. The method is
assessed as initial.
5.1.3.5 5S.
In the production area, TePe does have floor markings for materials close to the machines.
However, they lack in aspects such as (1) every-day cleaning and (2) tools not being ordered in
close proximity to operations. Basically, they have not implemented 5S. The method is assessed as
non-existing.
5.1.3.6 Just-in-time.
TePe does not work with any of the methods under the principle JIT. However, they have started
discussing an implementation of Kanban, and use an elementary Kanban design without any WIP
limits today. Kanban is assessed as initial, whereas all the other methods are assessed as non-
existing.
TPS/Lean Implementation: Case Descriptions and Analyses
114
5.1.3.7 People & teamwork.
In production, operators are responsible for different machines. However, if there are breakdowns
or something unexpected happens, they help each other out. This is important for TePe, and
therefore they educate their employees in such manners. Employees are also educated in leadership
and teamwork, with the basis of supporting a sound culture (TePe g). Moreover, weekly meetings
are held in production to highlight issues and news. There are also manager meetings on the floor,
in which aspects such as (1) targets and (2) actual production output is updated daily. I have,
however, experienced challenges in department collaboration, and, at times, an ”us-versus-them”
mentality between operators and management. The principle is still assessed as excellent.
5.1.3.8 Heijunka.
The demand is highly variable, and so is the production. The production planning is based on
annual demand and current inventory levels. There is no production smoothing. The principle is
assessed as non-existing.
5.1.3.9 Standardized work.
The operations contain standardized procedures to follow at TePe performed by employees.
However, there is often not any standardized documentation on how an operation should be carried
out. For example, there is no documentation on how a machine setup should be performed. This, in
turn, leads to difficulties in making use of continuous improvements of the operation over time.
Neither is there any standardized way of training operators to follow a zero defect policy, which, at
times, causes carelessness among personnel. However, the principle is assessed as established.
5.1.3.10 Visual management.
TePe makes use of a whiteboard to display targets and actual production output for each production
area. Incidents and risk observations are also highlighted visually, and unstructured pictures of how
a clean work environment should look like are displayed. The principle is assessed as established.
5.1.3.11 Kaizen.
TePe puts effort in continuous improvements, especially in the area of sustainability where the
SDGs are followed (TePe g). They work with constant improvements in environmental and quality
efforts in accorance with ISO 14001 and ISO 9001 (TePe g). However, they lack in standardized
kaizen procedures on the floor, which emphasizes the behaviour of operators solving problems in
the short-term rather than permanently. The principle is assessed as defined.
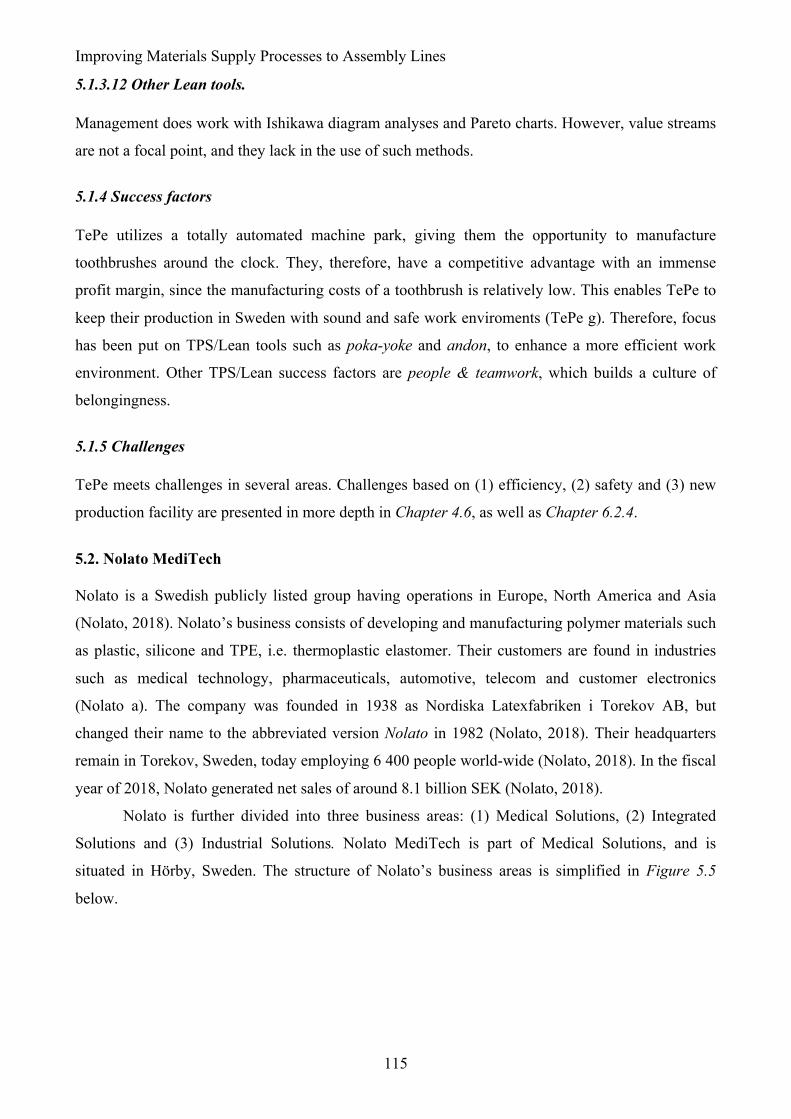
Improving Materials Supply Processes to Assembly Lines
115
5.1.3.12 Other Lean tools.
Management does work with Ishikawa diagram analyses and Pareto charts. However, value streams
are not a focal point, and they lack in the use of such methods.
5.1.4 Success factors
TePe utilizes a totally automated machine park, giving them the opportunity to manufacture
toothbrushes around the clock. They, therefore, have a competitive advantage with an immense
profit margin, since the manufacturing costs of a toothbrush is relatively low. This enables TePe to
keep their production in Sweden with sound and safe work enviroments (TePe g). Therefore, focus
has been put on TPS/Lean tools such as poka-yoke and andon, to enhance a more efficient work
environment. Other TPS/Lean success factors are people & teamwork, which builds a culture of
belongingness.
5.1.5 Challenges
TePe meets challenges in several areas. Challenges based on (1) efficiency, (2) safety and (3) new
production facility are presented in more depth in Chapter 4.6, as well as Chapter 6.2.4.
5.2. Nolato MediTech
Nolato is a Swedish publicly listed group having operations in Europe, North America and Asia
(Nolato, 2018). Nolato’s business consists of developing and manufacturing polymer materials such
as plastic, silicone and TPE, i.e. thermoplastic elastomer. Their customers are found in industries
such as medical technology, pharmaceuticals, automotive, telecom and customer electronics
(Nolato a). The company was founded in 1938 as Nordiska Latexfabriken i Torekov AB, but
changed their name to the abbreviated version Nolato in 1982 (Nolato, 2018). Their headquarters
remain in Torekov, Sweden, today employing 6 400 people world-wide (Nolato, 2018). In the fiscal
year of 2018, Nolato generated net sales of around 8.1 billion SEK (Nolato, 2018).
Nolato is further divided into three business areas: (1) Medical Solutions, (2) Integrated
Solutions and (3) Industrial Solutions. Nolato MediTech is part of Medical Solutions, and is
situated in Hörby, Sweden. The structure of Nolato’s business areas is simplified in Figure 5.5
below.
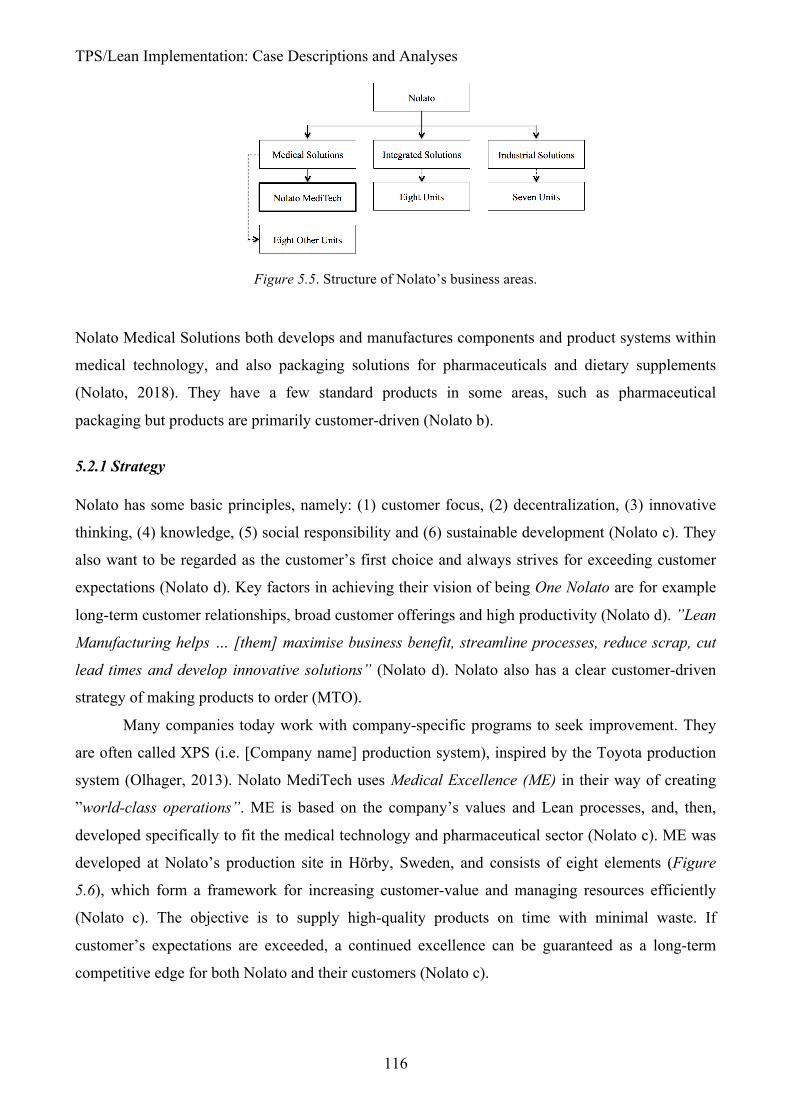
TPS/Lean Implementation: Case Descriptions and Analyses
116
Figure 5.5. Structure of Nolato’s business areas.
Nolato Medical Solutions both develops and manufactures components and product systems within
medical technology, and also packaging solutions for pharmaceuticals and dietary supplements
(Nolato, 2018). They have a few standard products in some areas, such as pharmaceutical
packaging but products are primarily customer-driven (Nolato b).
5.2.1 Strategy
Nolato has some basic principles, namely: (1) customer focus, (2) decentralization, (3) innovative
thinking, (4) knowledge, (5) social responsibility and (6) sustainable development (Nolato c). They
also want to be regarded as the customer’s first choice and always strives for exceeding customer
expectations (Nolato d). Key factors in achieving their vision of being One Nolato are for example
long-term customer relationships, broad customer offerings and high productivity (Nolato d). ”Lean
Manufacturing helps … [them] maximise business benefit, streamline processes, reduce scrap, cut
lead times and develop innovative solutions” (Nolato d). Nolato also has a clear customer-driven
strategy of making products to order (MTO).
Many companies today work with company-specific programs to seek improvement. They
are often called XPS (i.e. [Company name] production system), inspired by the Toyota production
system (Olhager, 2013). Nolato MediTech uses Medical Excellence (ME) in their way of creating
”world-class operations”. ME is based on the company’s values and Lean processes, and, then,
developed specifically to fit the medical technology and pharmaceutical sector (Nolato c). ME was
developed at Nolato’s production site in Hörby, Sweden, and consists of eight elements (Figure
5.6), which form a framework for increasing customer-value and managing resources efficiently
(Nolato c). The objective is to supply high-quality products on time with minimal waste. If
customer’s expectations are exceeded, a continued excellence can be guaranteed as a long-term
competitive edge for both Nolato and their customers (Nolato c).

Improving Materials Supply Processes to Assembly Lines
117
At their site in Hörby, Nolato has four strategic objectives in (1) efficiency, (2) quality, (3)
safety/environment and (4) service (Danielsen, personal communication, January 30, 2020)30. To be
able to meet the objectives, they have ten KPIs that are evaluated regularly. They measure
efficiency through OEE, scrap and inventory days, quality through customer claims, complaints,
audit remarks and supplier quality, safety/environment through accidents, and service through
customer delivery precision and supplier delivery performance.
Figure 5.6. Nolato Medical Solutions’ production system and its eight values (Nolato c).
5.2.2 Characteristics
The majority of Nolato’s products go through a similar sequence, containing injection moulding,
hardening, assembly and packaging. Products are stored in-between processes, but no more than a
day to a week. Lead times of their products can vary from a week to a couple of months, but mostly,
for their A-classified products, there is a lead time of four to five weeks. Order sizes are no more
than one week of production, however, batch sizes are multiples of 4000 pieces to increase
flexibility in production. This is based on forecasts of yearly demand, which Nolato recieves from
customers. They have a close collaboration through, for example, VMIs for regular updates on
inventory levels. The actual amount of tied-up capital are, however, classified information, but,
what can be said is that, Nolato always strives to decreasing their inventory.
30Data without references in the following paragraphs are either based on a half-day observation of Nolato MediTech’s production site or a single interview with Lean coordinator Lennart Danielsen, who later has verified the outcome. Danielsen has eight years of experience in his position, but has been an employee of the company since the 1980s.
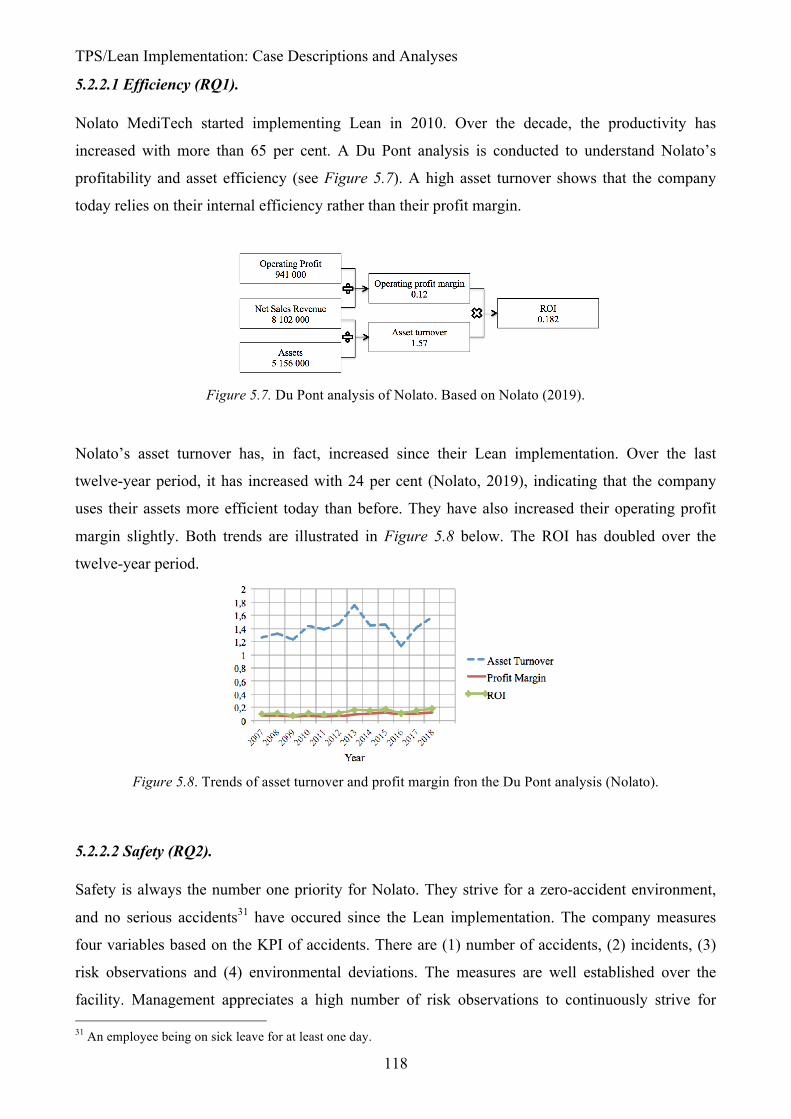
TPS/Lean Implementation: Case Descriptions and Analyses
118
5.2.2.1 Efficiency (RQ1).
Nolato MediTech started implementing Lean in 2010. Over the decade, the productivity has
increased with more than 65 per cent. A Du Pont analysis is conducted to understand Nolato’s
profitability and asset efficiency (see Figure 5.7). A high asset turnover shows that the company
today relies on their internal efficiency rather than their profit margin.
Figure 5.7. Du Pont analysis of Nolato. Based on Nolato (2019).
Nolato’s asset turnover has, in fact, increased since their Lean implementation. Over the last
twelve-year period, it has increased with 24 per cent (Nolato, 2019), indicating that the company
uses their assets more efficient today than before. They have also increased their operating profit
margin slightly. Both trends are illustrated in Figure 5.8 below. The ROI has doubled over the
twelve-year period.
Figure 5.8. Trends of asset turnover and profit margin fron the Du Pont analysis (Nolato).
5.2.2.2 Safety (RQ2).
Safety is always the number one priority for Nolato. They strive for a zero-accident environment,
and no serious accidents31 have occured since the Lean implementation. The company measures
four variables based on the KPI of accidents. There are (1) number of accidents, (2) incidents, (3)
risk observations and (4) environmental deviations. The measures are well established over the
facility. Management appreciates a high number of risk observations to continuously strive for 31 An employee being on sick leave for at least one day.
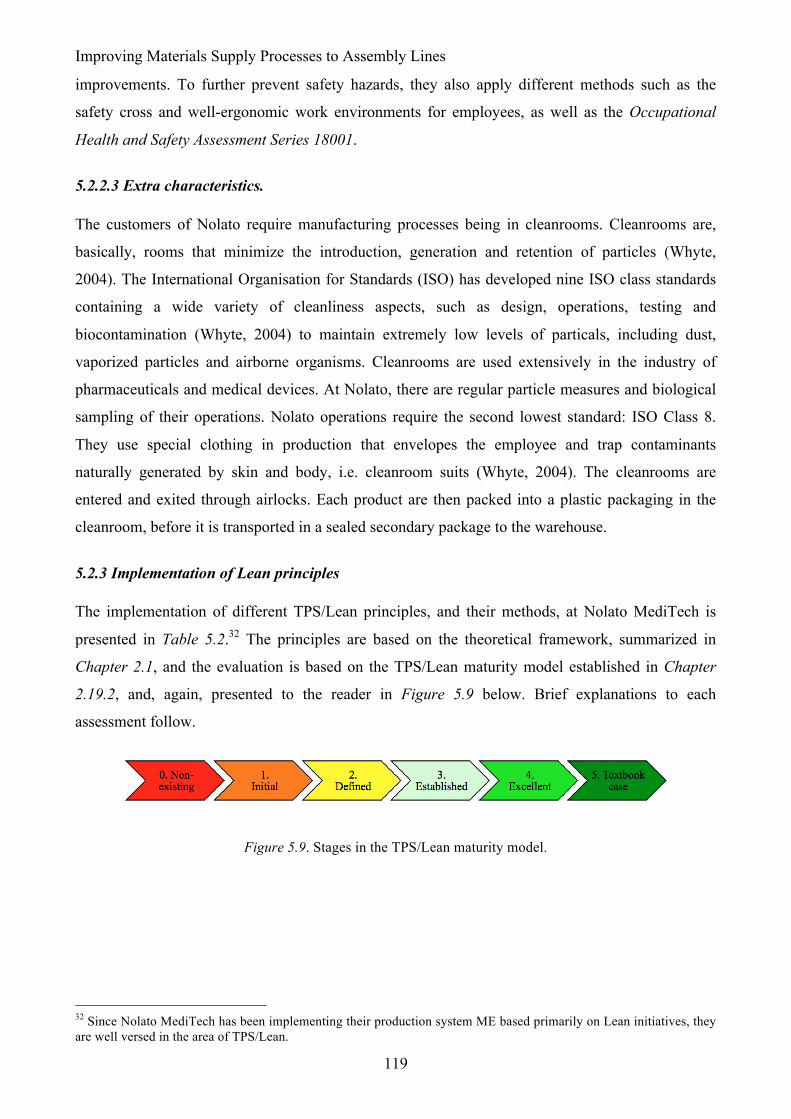
Improving Materials Supply Processes to Assembly Lines
119
improvements. To further prevent safety hazards, they also apply different methods such as the
safety cross and well-ergonomic work environments for employees, as well as the Occupational
Health and Safety Assessment Series 18001.
5.2.2.3 Extra characteristics.
The customers of Nolato require manufacturing processes being in cleanrooms. Cleanrooms are,
basically, rooms that minimize the introduction, generation and retention of particles (Whyte,
2004). The International Organisation for Standards (ISO) has developed nine ISO class standards
containing a wide variety of cleanliness aspects, such as design, operations, testing and
biocontamination (Whyte, 2004) to maintain extremely low levels of particals, including dust,
vaporized particles and airborne organisms. Cleanrooms are used extensively in the industry of
pharmaceuticals and medical devices. At Nolato, there are regular particle measures and biological
sampling of their operations. Nolato operations require the second lowest standard: ISO Class 8.
They use special clothing in production that envelopes the employee and trap contaminants
naturally generated by skin and body, i.e. cleanroom suits (Whyte, 2004). The cleanrooms are
entered and exited through airlocks. Each product are then packed into a plastic packaging in the
cleanroom, before it is transported in a sealed secondary package to the warehouse.
5.2.3 Implementation of Lean principles
The implementation of different TPS/Lean principles, and their methods, at Nolato MediTech is
presented in Table 5.2.32 The principles are based on the theoretical framework, summarized in
Chapter 2.1, and the evaluation is based on the TPS/Lean maturity model established in Chapter
2.19.2, and, again, presented to the reader in Figure 5.9 below. Brief explanations to each
assessment follow.
Figure 5.9. Stages in the TPS/Lean maturity model.
32 Since Nolato MediTech has been implementing their production system ME based primarily on Lean initiatives, they are well versed in the area of TPS/Lean.
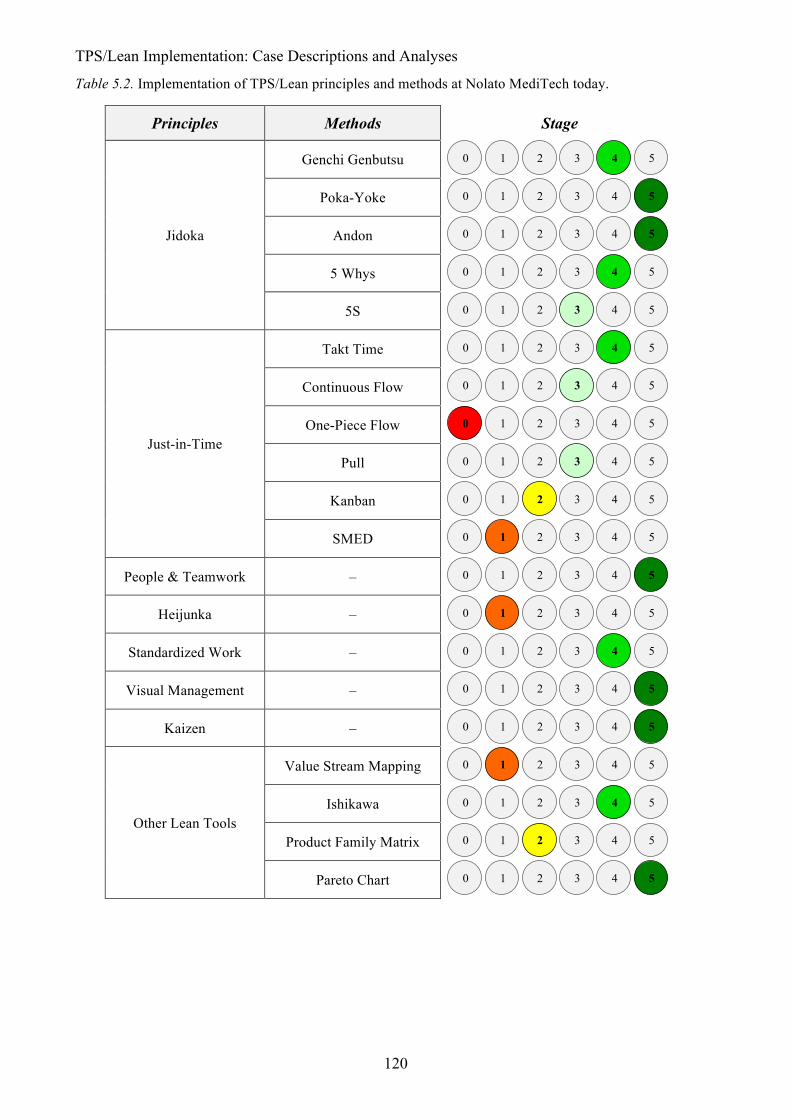
TPS/Lean Implementation: Case Descriptions and Analyses
120
Table 5.2. Implementation of TPS/Lean principles and methods at Nolato MediTech today.
Principles Methods Stage
Jidoka
Genchi Genbutsu
Poka-Yoke
Andon
5 Whys
5S
Just-in-Time
Takt Time
Continuous Flow
One-Piece Flow
Pull
Kanban
SMED
People & Teamwork –
Heijunka –
Standardized Work –
Visual Management –
Kaizen –
Other Lean Tools
Value Stream Mapping
Ishikawa
Product Family Matrix
Pareto Chart
0 1 2 3 4
5
0 1 2 3 4
5
0 1 2 3 4
5
0 1 2 3 4
5
0 1 2 3 4
5
0 1 2 3 4
5
0 1 2 3 4
5
0
1 2 3 4
5
0 1 2 3 4
5
0 1 2 3 4
5
0 1 2 3 4
5
0 1 2 3 4
5
0 1 2 3 4
5
0 1 2 3 4
5
0 1 2 3 4
5
0 1 2 3 4
5
0 1 2 3 4
5
0 1 2 3 4
5
0 1 2 3 4
5
0 1 2 3 4
5
Improving Materials Supply Processes to Assembly Lines
121
5.2.3.1 Genchi genbutsu.
Management strives for genchi genbutsu as much as possible. Every morning there is a pulse
meeting on the floor at each department. Since Nolato has their injection moulding, hardening and
assembly processes in clean rooms, genchi genbutsu is a challenge for management. But there are
windows all around the facility to ease transparency. The method is assessed as excellent.
5.2.3.2 Poka-yoke.
A process is stopped immediately if something happens. There are mistake-proofing methods built-
in automatically in the machine. This includes leak testing within the machines. Moreover, Nolato
always work with autonomation, since operators shut down the machines if something is wrong
and, then, tries to fix the problem and understand the root causes. The method is assessed as a
textbook case.
5.2.3.3 Andon.
The machines also have in-built signals for (1) processing (green), (2) detected problem or full
secondary package (orange) and (3) not processing (red). The signals are activated automatically by
the machines, and are shown all over the production facility. The method is assessed as a textbook
case.
5.2.3.4 5 Whys.
Both management and operators are educated in simple Lean methods such as 5 Whys, and is taught
that the problem at hand is often not the root cause. This method is used by the management often,
especially in the process of evaluating deviations. The method is assessed as excellent.
5.2.3.5 5S.
Nolato has not implemented 5S per se, but do use the method. They have specific areas for tools
(Sort) and floor markings for both equipment and for non-operators within the warehouse (Set in
order) to increase workflow and safety, respectively. Moreover, there are requirements on a clean
work environment since Nolato work in the medical business (Shine). They also work a lot with
education and training sessions for employees to understand Lean (Sustain). The method is assessed
as established.
TPS/Lean Implementation: Case Descriptions and Analyses
122
5.2.3.6 Takt time.
Nolato is totally aware of takt times and cycle times for their production. Their production is,
according to Danielsen (personal communication, January 30, 2020) ”strongly validated by
customers”. At times, production is stopped, since a pull system between processes is used. When
there is nothing to produce, the machines can be idle. The method is assessed as excellent.
5.2.3.7 Continuous flow.
Nolato is aware of the importance of striving for a continuous flow, and implements the method as
far as possible. They use several tools to accomplish a continuous flow. For example, they try to
minimize batch sizes as much as possible, which leads to less WIP, a lower amount of inventory
and, finally, a better flow. Order sizes can vary quite a lot (~10 000 – 1 000 000 pcs), but Nolato
use batch sizes in multiples of 4000 pcs. The maximum multiple is three, which means that there
can never be more than 12 000 pcs as WIP. Batches are partly customer-driven, but there are other
aspects to them as well, such as in-process controls based on quality requirements from customers33
and efficiency parameters in transportation affecting batch sizes. Therefore, they cannot be
calculated with any specific formula. The standard rule for batch sizes at Nolato, however, is that
they are restricted to a maximum of one week of demand. Moreover, they use pull systems (see
Chapter 5.2.3.9 below) over the production facility to enhance a contionuous flow. The method is
assessed as established.
5.2.3.8 One-piece flow.
Nolato has not implemented any one-piece flow of products. Lennartsen (personal communication,
January 30, 2020) emphasizes that a one-piece flow is the optimal solution in theory, but hard to
implement in practice. The method is assessed as non-existing.
5.2.3.9 Pull system.
As mentioned above, a visual pull system is partly used in-between processes to avoid
overproduction and other wastes. Especially has this been implemented between injection moulding
and assembly, where the injection moulding processes at times stay idle for assembly to finish its
production. The method is assessed as established.
33 For example, increased measurement frequency leads to more documentation.
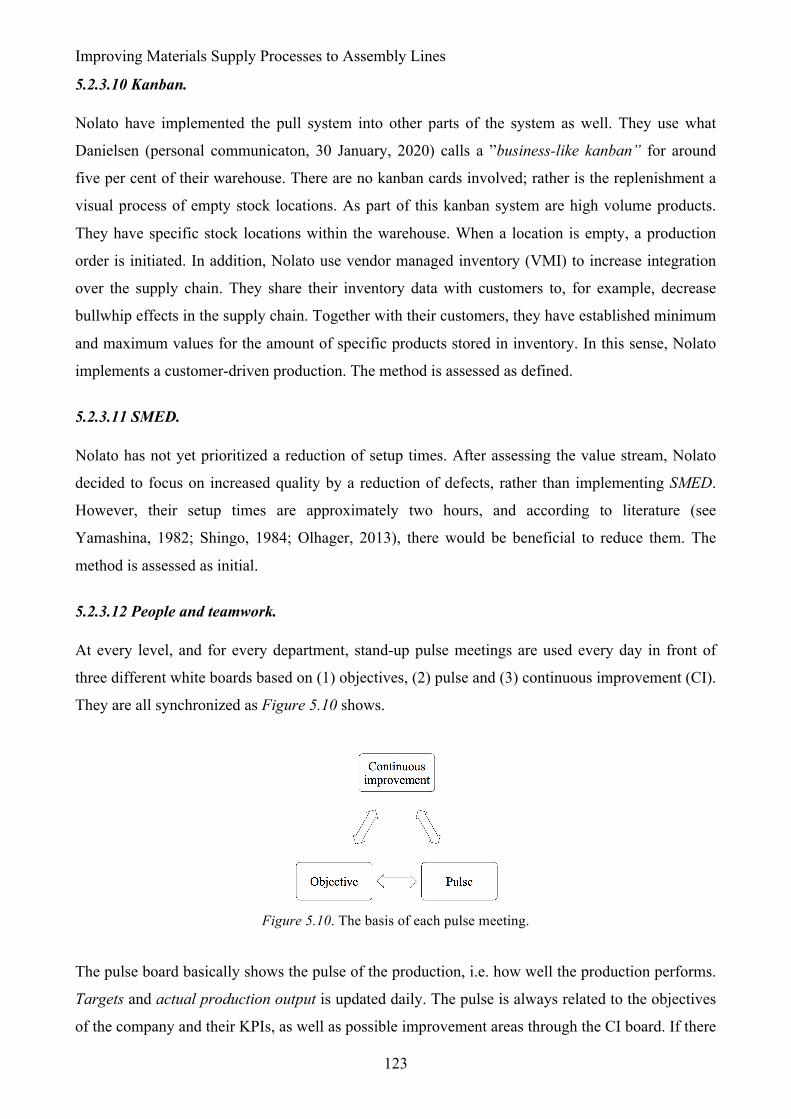
Improving Materials Supply Processes to Assembly Lines
123
5.2.3.10 Kanban.
Nolato have implemented the pull system into other parts of the system as well. They use what
Danielsen (personal communicaton, 30 January, 2020) calls a ”business-like kanban” for around
five per cent of their warehouse. There are no kanban cards involved; rather is the replenishment a
visual process of empty stock locations. As part of this kanban system are high volume products.
They have specific stock locations within the warehouse. When a location is empty, a production
order is initiated. In addition, Nolato use vendor managed inventory (VMI) to increase integration
over the supply chain. They share their inventory data with customers to, for example, decrease
bullwhip effects in the supply chain. Together with their customers, they have established minimum
and maximum values for the amount of specific products stored in inventory. In this sense, Nolato
implements a customer-driven production. The method is assessed as defined.
5.2.3.11 SMED.
Nolato has not yet prioritized a reduction of setup times. After assessing the value stream, Nolato
decided to focus on increased quality by a reduction of defects, rather than implementing SMED.
However, their setup times are approximately two hours, and according to literature (see
Yamashina, 1982; Shingo, 1984; Olhager, 2013), there would be beneficial to reduce them. The
method is assessed as initial.
5.2.3.12 People and teamwork.
At every level, and for every department, stand-up pulse meetings are used every day in front of
three different white boards based on (1) objectives, (2) pulse and (3) continuous improvement (CI).
They are all synchronized as Figure 5.10 shows.
Figure 5.10. The basis of each pulse meeting.
The pulse board basically shows the pulse of the production, i.e. how well the production performs.
Targets and actual production output is updated daily. The pulse is always related to the objectives
of the company and their KPIs, as well as possible improvement areas through the CI board. If there
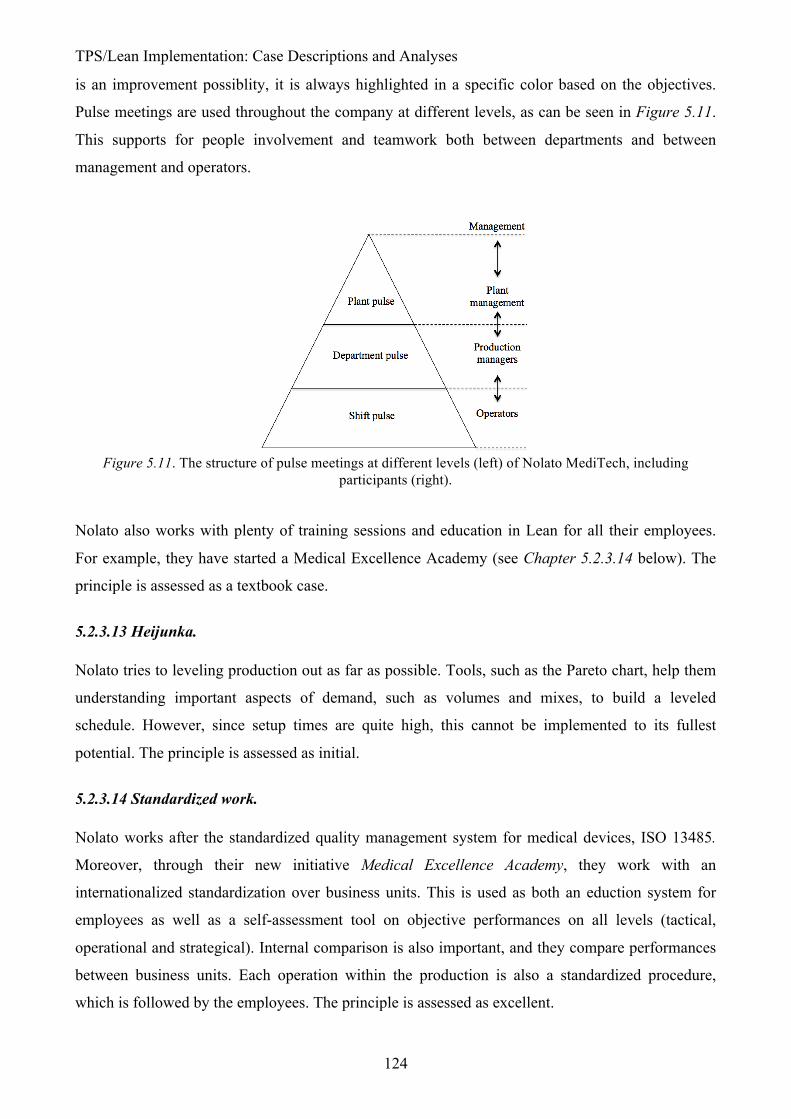
TPS/Lean Implementation: Case Descriptions and Analyses
124
is an improvement possiblity, it is always highlighted in a specific color based on the objectives.
Pulse meetings are used throughout the company at different levels, as can be seen in Figure 5.11.
This supports for people involvement and teamwork both between departments and between
management and operators.
Figure 5.11. The structure of pulse meetings at different levels (left) of Nolato MediTech, including
participants (right).
Nolato also works with plenty of training sessions and education in Lean for all their employees.
For example, they have started a Medical Excellence Academy (see Chapter 5.2.3.14 below). The
principle is assessed as a textbook case.
5.2.3.13 Heijunka.
Nolato tries to leveling production out as far as possible. Tools, such as the Pareto chart, help them
understanding important aspects of demand, such as volumes and mixes, to build a leveled
schedule. However, since setup times are quite high, this cannot be implemented to its fullest
potential. The principle is assessed as initial.
5.2.3.14 Standardized work.
Nolato works after the standardized quality management system for medical devices, ISO 13485.
Moreover, through their new initiative Medical Excellence Academy, they work with an
internationalized standardization over business units. This is used as both an eduction system for
employees as well as a self-assessment tool on objective performances on all levels (tactical,
operational and strategical). Internal comparison is also important, and they compare performances
between business units. Each operation within the production is also a standardized procedure,
which is followed by the employees. The principle is assessed as excellent.
Improving Materials Supply Processes to Assembly Lines
125
5.2.3.15 Visual management.
Visual management is applied all over the facility, with the pulse meetings as foundation. Specific
continuous improvements (CIs) are also visualized at whiteboards, as well as incentive systems for
employees and KPI comparisons against other business units within Medical Solutions. The
principle is assessed as a textbook case.
5.2.3.16 Kaizen.
Nolato puts a lot of effort into CIs. It can be everything from a very small improvement to
something that requires more time and effort. Over the last five years, they have accompished
around 5000 improvements, and an extra 5000 corrective and preventive actions. Every
improvement is also logged for the future. The CIs often start through the pulse meetings, in which
disturbances float up to the surface. The issue should, then, be solved in the short-term to the next
pulse meeting. A CI team, later, investigates the issue to find improvements, which leads to new
standards, based on the objectives of the firm. Moreover, Nolato are transparent with their
customers and assess customer inputs to improve their business. The principle is assessed as a
textbook case.
5.2.3.17 Other Lean tools.
Nolato has implemented Pareto charts to a wide extent, since everything can be traced to the 80/20
principle, according to Danielsen (personal communication, January 30, 2020). They also use
Ishikawa diagrams and similar tools extensively for root cause detection. Another Lean tool that
Nolato has investigated is the Product family matrix. However, their production plant has a
functional layout, mainly due to the fact that some operations need cleanrooms while other does
not, and, therefore, the method contributes little. Moreover, since the value streams are quite short,
Danielsen (personal communication, January 30, 2020) states that Value stream mapping is,
probably, an unnecessary tool.34
5.2.4 Success factors
Danielsen (personal communication, January 30, 2020) emphasizes that the most important success
factor for Nolato MediTech is the mindset of management, rather than specific tools used.
Everything starts with softer values such as management commitment and people involvement for
the creation of change (Danielsen, personal communication, January 30, 2020). This is in line with
many researchers (see e.g. Yin, 2003; Näslund 2013; Chaihan & Chauhan, 2019). Chauhan and
34 This statement can, however, be argued.
TPS/Lean Implementation: Case Descriptions and Analyses
126
Chauhan (2019) present research on specific actions most important when implementing Lean
principles. In top, there are (1) establishing a sense of belongingness and (2) developing mutual
faith. These values did build a strong foundation for Nolato to calmly strive for important aspects
such as (1) reduction of waste and (2) shortened lead times. Other success factors for Nolato are the
professionalism of employees and education in Lean principles and leadership, as well as an
excellent focus on what really is important. By creating their own production system Medical
Excellence, Nolato developed their own values which they needed to follow. The Lean methods
used were all a response on the values from Medical Excellence. In summary, the whole package
brought success to the company.
5.2.5 Challenges
Before implementing Lean, Nolato was facing several challenges. They needed to enhance both (1)
the quality and (2) the customer delivery precision of their products, as well as (3) the long-term
competitiveness of the company. By applying the Lean mindset, employees started what Danielsen
(personal communication, January 30, 2020) calls ”waste hunting”. The company, of course, looks
for all seven wastes, but the focal point has been the waste of defective products. Issues also arose
specifically in the waste of waiting time, unnecessary transportation and unnecessary movement.
But these wastes are reduced today due to the implementation of Lean. When a company has
reached a certain level of overall Lean implementation, however, some challenges become barriers
for a company according to Danielsen (personal communication, January 30, 2020). There is,
basically, more difficult to proceed with positive results at same pace due to a greater need for
resources. Another barrier for Nolato is batch sizes, which cannot be reduced more than actual
sizes, since a further reduction would lead to an increased number of sample measures to sustain a
high quality to customers in the medical business. There is always a trade-off, and therefore, it is
important to find an optimal solution customized for the company in question.
5.2.6 Nolato MediTech recommendations and journey
Many authors suggest simple methods, such as 5S or striving for continuous flow, for companies
that are starting to implement Lean principles (see Al-Aomar, 2011, Liker, 2008). Danielsen
(personal communication, January 30, 2020), however, does not recommend to start with tools
alike; instead, understanding and spelling out the objectives of the company are much more
important. Pulse meetings are, then, great to sustain the efforts. Danielsen (personal
communication, January 30, 2020) emphasizes that an understanding of how throughput times
really have an impact on a company is crucial as well. This goes down to educating employees all
over the company.
Improving Materials Supply Processes to Assembly Lines
127
The implementation process of Lean principles at Nolato has a lot in common with the
findings of a cross-case study conducted by Yin (2003, pp. 144-163) on 14 American firms after a
transformation process. There is a motivation for change at the outset (Yin, 2003). For Nolato, there
were some product quality issues and deficiencies in customer delivery precision. There was also a
need for productivity improvements (Yin, 2003), and the organization met challenges in basically
every element of the seven wastes.
To remain competitive, Nolato searched for a well-established change initiative and found
Lean. The Managing Director at the time, Johan Iveberg, was the driving force of implementing
Lean in 2010. Yin (2003) states that the implementation of a change initiative often starts with the
CEO pursuing a strategic plan, and a unitary vision and culture. This creates broad goals for the
whole firm, such as continuous improvement, environmental efficiency and a customer-driven
production (Yin, 2003). For Nolato, this process of evaluating their strategy resulted in the new
production system Medical Excellence. Throughout the process, management were supportive in
the transformation, which several researchers specify as the most important aspect in any change
initiative (see e.g. Yin, 2003; Näslund, 2013; Chauhan & Chauhan, 2019). For Nolato, this meant
that management were knowledgable, participant-friendly and professional, to mention a few. They
also decentralized responsibilities onto the shop floor (Yin, 2003) through pulse meetings and
improvement teams for each department.
The change led to several improvements, both in the short-term and in the long run. Nolato
were soon better aligned with their strategy (Yin, 2003), and employees were more involved. This
led to many incremental improvements, decreased lead times and a reduction in customer claims. In
the long run, the change initiative seems to have contributed to sales and profit growth, and all other
issues that were found prior to implementation. Moreover, the transformation led to a Lean success
recognition, which is difficult to measure in monetary terms. They received media attention, leading
to plenty of study visits, which, of course, boost reputation. Over the period of transformation,
Nolato also re-evaluated their business strategy regularly. This has recently led to new education
initiatives within the company, through for example Medical Excellence Academy.
5.2.7 Lean implementation process at Nolato
The entire process of the Nolato Lean implementation can be illustrated as an overall framework.
Figure 5.12 presents this logic model, which has sequential elements with, potentially, causal
relationships in-between. In other words, the first element is the cause, whereas the subsequent
event is the effect. The objective of this paper building a logic model is that it can guide the
implementation of any change (Yin, 2003). The model is based on Chapter 5.2.6.

TPS/Lean Implementation: Case Descriptions and Analyses
128
Figure 5.12. Lean implementation process at Nolato MediTech.
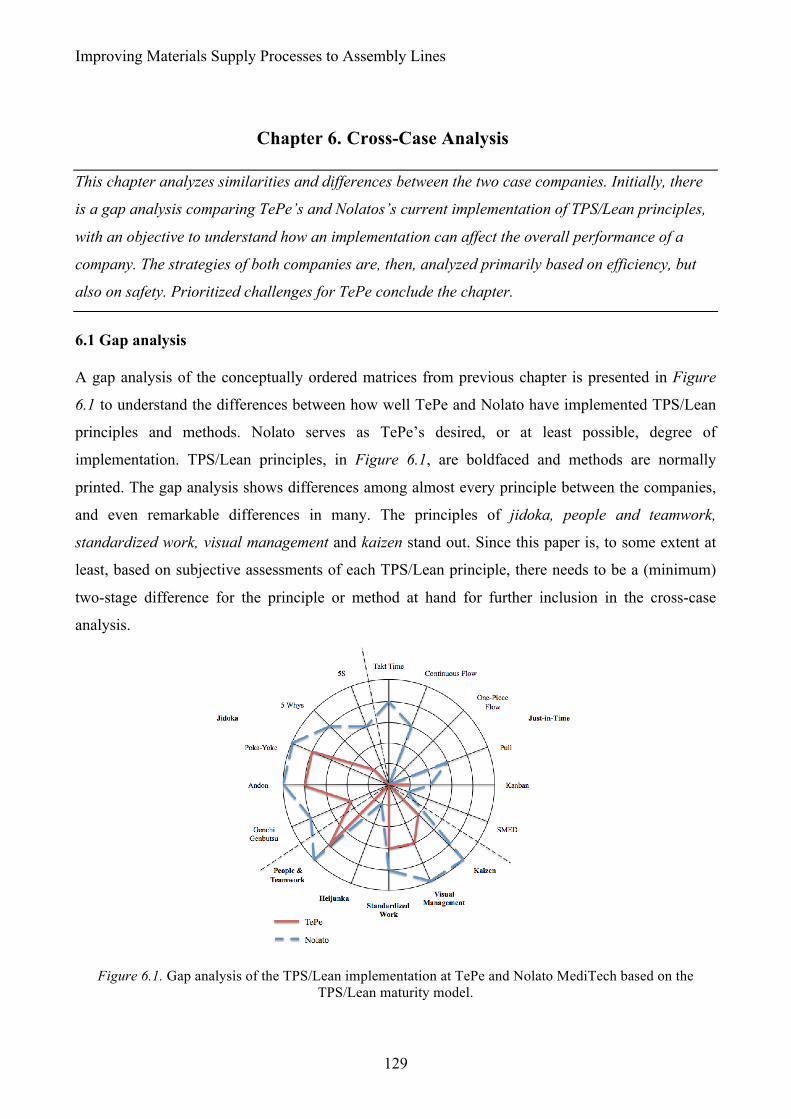
Improving Materials Supply Processes to Assembly Lines
129
Chapter 6. Cross-Case Analysis This chapter analyzes similarities and differences between the two case companies. Initially, there
is a gap analysis comparing TePe’s and Nolatos’s current implementation of TPS/Lean principles,
with an objective to understand how an implementation can affect the overall performance of a
company. The strategies of both companies are, then, analyzed primarily based on efficiency, but
also on safety. Prioritized challenges for TePe conclude the chapter.
6.1 Gap analysis
A gap analysis of the conceptually ordered matrices from previous chapter is presented in Figure
6.1 to understand the differences between how well TePe and Nolato have implemented TPS/Lean
principles and methods. Nolato serves as TePe’s desired, or at least possible, degree of
implementation. TPS/Lean principles, in Figure 6.1, are boldfaced and methods are normally
printed. The gap analysis shows differences among almost every principle between the companies,
and even remarkable differences in many. The principles of jidoka, people and teamwork,
standardized work, visual management and kaizen stand out. Since this paper is, to some extent at
least, based on subjective assessments of each TPS/Lean principle, there needs to be a (minimum)
two-stage difference for the principle or method at hand for further inclusion in the cross-case
analysis.
Figure 6.1. Gap analysis of the TPS/Lean implementation at TePe and Nolato MediTech based on the
TPS/Lean maturity model.
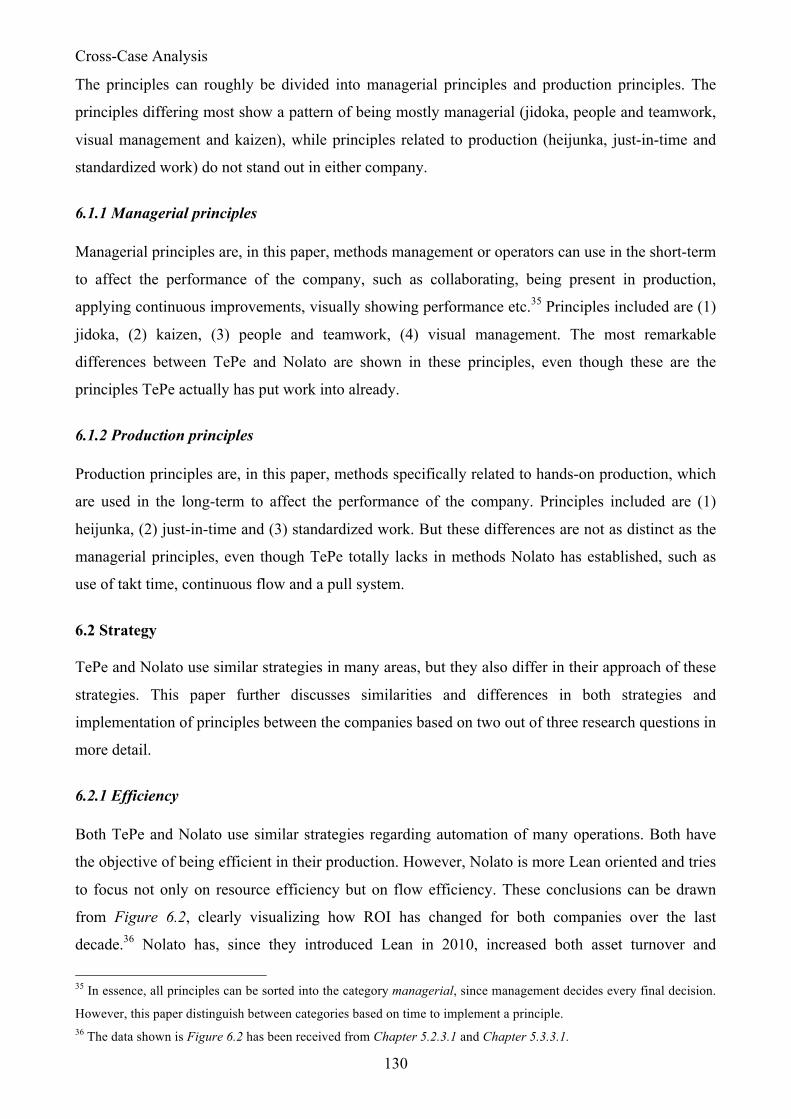
Cross-Case Analysis
130
The principles can roughly be divided into managerial principles and production principles. The
principles differing most show a pattern of being mostly managerial (jidoka, people and teamwork,
visual management and kaizen), while principles related to production (heijunka, just-in-time and
standardized work) do not stand out in either company.
6.1.1 Managerial principles
Managerial principles are, in this paper, methods management or operators can use in the short-term
to affect the performance of the company, such as collaborating, being present in production,
applying continuous improvements, visually showing performance etc.35 Principles included are (1)
jidoka, (2) kaizen, (3) people and teamwork, (4) visual management. The most remarkable
differences between TePe and Nolato are shown in these principles, even though these are the
principles TePe actually has put work into already.
6.1.2 Production principles
Production principles are, in this paper, methods specifically related to hands-on production, which
are used in the long-term to affect the performance of the company. Principles included are (1)
heijunka, (2) just-in-time and (3) standardized work. But these differences are not as distinct as the
managerial principles, even though TePe totally lacks in methods Nolato has established, such as
use of takt time, continuous flow and a pull system.
6.2 Strategy
TePe and Nolato use similar strategies in many areas, but they also differ in their approach of these
strategies. This paper further discusses similarities and differences in both strategies and
implementation of principles between the companies based on two out of three research questions in
more detail.
6.2.1 Efficiency
Both TePe and Nolato use similar strategies regarding automation of many operations. Both have
the objective of being efficient in their production. However, Nolato is more Lean oriented and tries
to focus not only on resource efficiency but on flow efficiency. These conclusions can be drawn
from Figure 6.2, clearly visualizing how ROI has changed for both companies over the last
decade.36 Nolato has, since they introduced Lean in 2010, increased both asset turnover and
35 In essence, all principles can be sorted into the category managerial, since management decides every final decision.
However, this paper distinguish between categories based on time to implement a principle. 36 The data shown is Figure 6.2 has been received from Chapter 5.2.3.1 and Chapter 5.3.3.1.
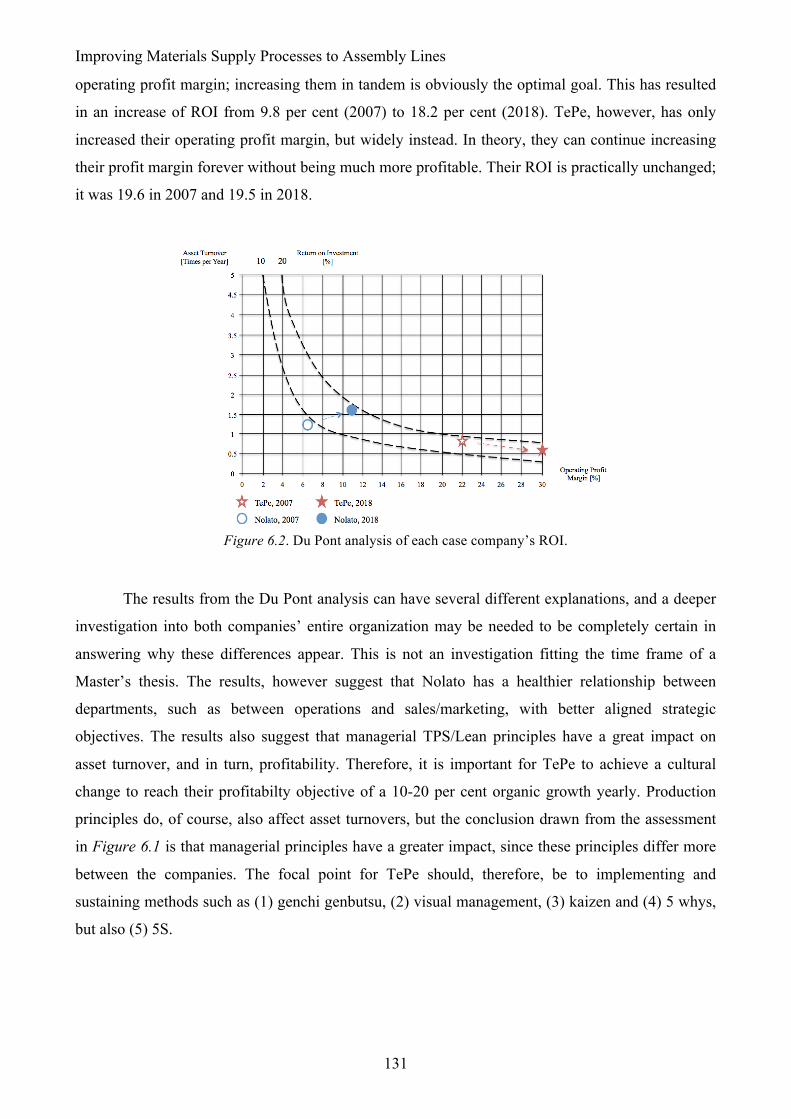
Improving Materials Supply Processes to Assembly Lines
131
operating profit margin; increasing them in tandem is obviously the optimal goal. This has resulted
in an increase of ROI from 9.8 per cent (2007) to 18.2 per cent (2018). TePe, however, has only
increased their operating profit margin, but widely instead. In theory, they can continue increasing
their profit margin forever without being much more profitable. Their ROI is practically unchanged;
it was 19.6 in 2007 and 19.5 in 2018.
Figure 6.2. Du Pont analysis of each case company’s ROI.
The results from the Du Pont analysis can have several different explanations, and a deeper
investigation into both companies’ entire organization may be needed to be completely certain in
answering why these differences appear. This is not an investigation fitting the time frame of a
Master’s thesis. The results, however suggest that Nolato has a healthier relationship between
departments, such as between operations and sales/marketing, with better aligned strategic
objectives. The results also suggest that managerial TPS/Lean principles have a great impact on
asset turnover, and in turn, profitability. Therefore, it is important for TePe to achieve a cultural
change to reach their profitabilty objective of a 10-20 per cent organic growth yearly. Production
principles do, of course, also affect asset turnovers, but the conclusion drawn from the assessment
in Figure 6.1 is that managerial principles have a greater impact, since these principles differ more
between the companies. The focal point for TePe should, therefore, be to implementing and
sustaining methods such as (1) genchi genbutsu, (2) visual management, (3) kaizen and (4) 5 whys,
but also (5) 5S.
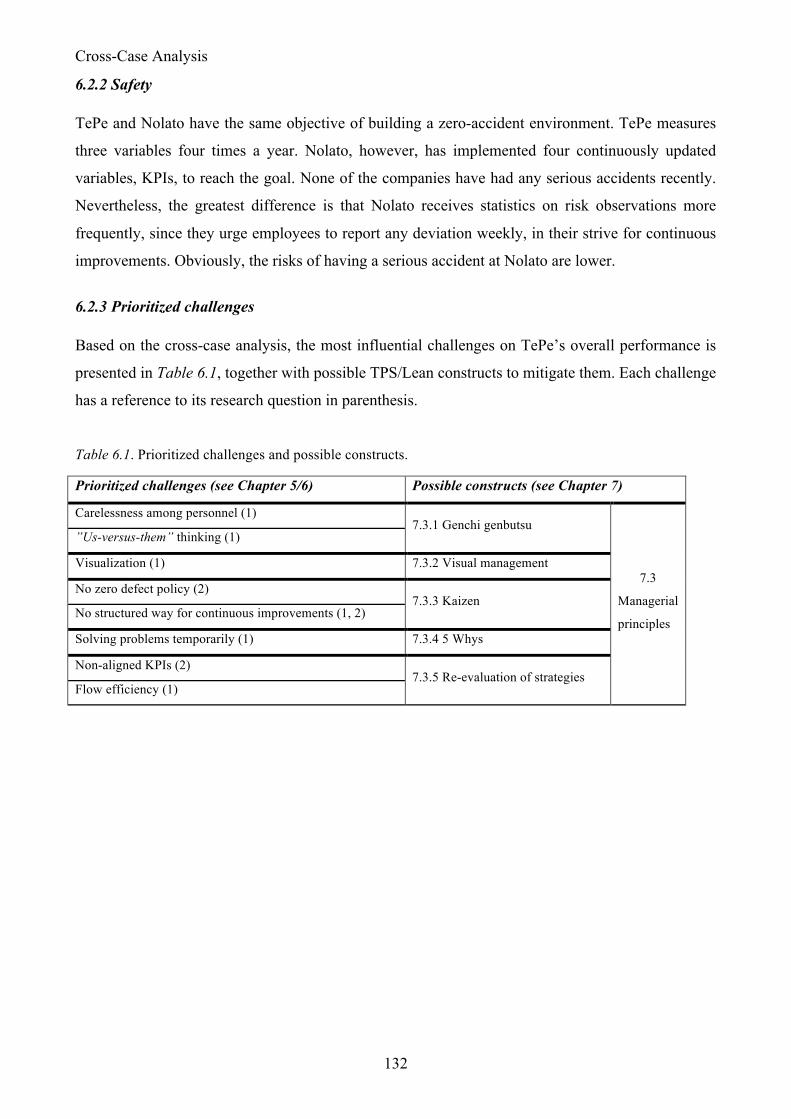
Cross-Case Analysis
132
6.2.2 Safety
TePe and Nolato have the same objective of building a zero-accident environment. TePe measures
three variables four times a year. Nolato, however, has implemented four continuously updated
variables, KPIs, to reach the goal. None of the companies have had any serious accidents recently.
Nevertheless, the greatest difference is that Nolato receives statistics on risk observations more
frequently, since they urge employees to report any deviation weekly, in their strive for continuous
improvements. Obviously, the risks of having a serious accident at Nolato are lower.
6.2.3 Prioritized challenges
Based on the cross-case analysis, the most influential challenges on TePe’s overall performance is
presented in Table 6.1, together with possible TPS/Lean constructs to mitigate them. Each challenge
has a reference to its research question in parenthesis.
Table 6.1. Prioritized challenges and possible constructs.
Prioritized challenges (see Chapter 5/6) Possible constructs (see Chapter 7)
Carelessness among personnel (1) 7.3.1 Genchi genbutsu
7.3
Managerial
principles
”Us-versus-them” thinking (1)
Visualization (1) 7.3.2 Visual management
No zero defect policy (2) 7.3.3 Kaizen
No structured way for continuous improvements (1, 2)
Solving problems temporarily (1) 7.3.4 5 Whys
Non-aligned KPIs (2) 7.3.5 Re-evaluation of strategies
Flow efficiency (1)
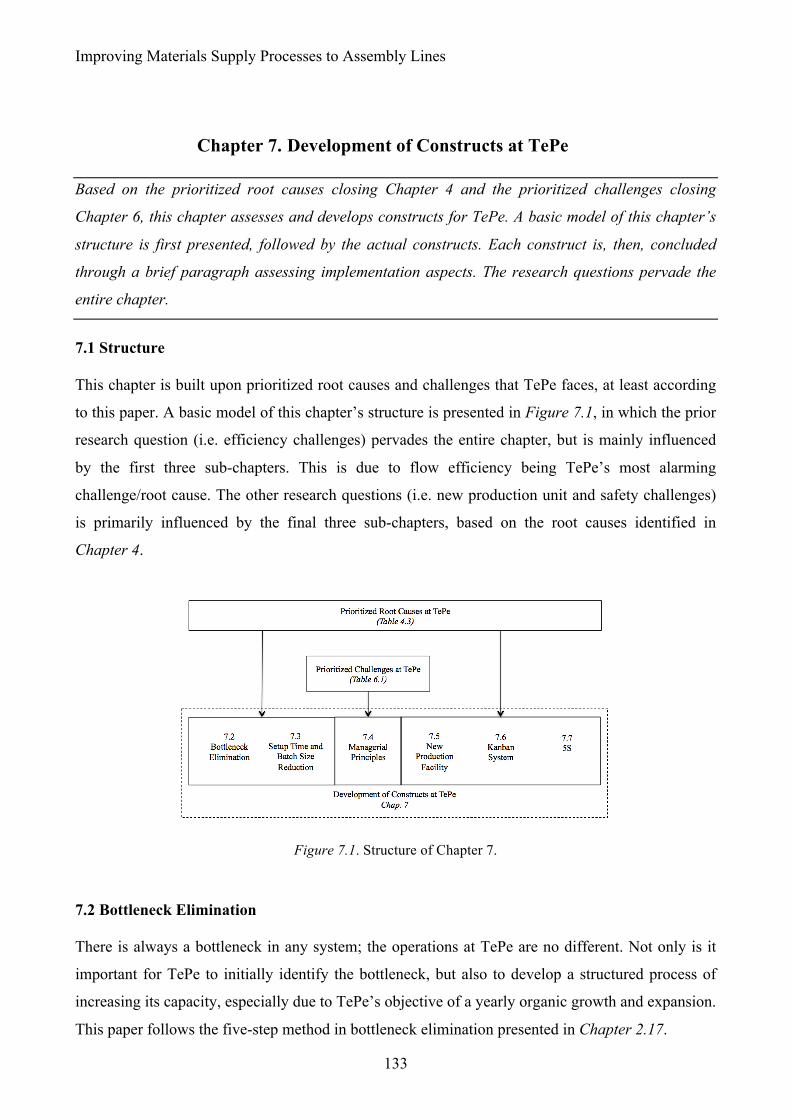
Improving Materials Supply Processes to Assembly Lines
133
Chapter 7. Development of Constructs at TePe Based on the prioritized root causes closing Chapter 4 and the prioritized challenges closing
Chapter 6, this chapter assesses and develops constructs for TePe. A basic model of this chapter’s
structure is first presented, followed by the actual constructs. Each construct is, then, concluded
through a brief paragraph assessing implementation aspects. The research questions pervade the
entire chapter.
7.1 Structure
This chapter is built upon prioritized root causes and challenges that TePe faces, at least according
to this paper. A basic model of this chapter’s structure is presented in Figure 7.1, in which the prior
research question (i.e. efficiency challenges) pervades the entire chapter, but is mainly influenced
by the first three sub-chapters. This is due to flow efficiency being TePe’s most alarming
challenge/root cause. The other research questions (i.e. new production unit and safety challenges)
is primarily influenced by the final three sub-chapters, based on the root causes identified in
Chapter 4.
Figure 7.1. Structure of Chapter 7.
7.2 Bottleneck Elimination
There is always a bottleneck in any system; the operations at TePe are no different. Not only is it
important for TePe to initially identify the bottleneck, but also to develop a structured process of
increasing its capacity, especially due to TePe’s objective of a yearly organic growth and expansion.
This paper follows the five-step method in bottleneck elimination presented in Chapter 2.17.
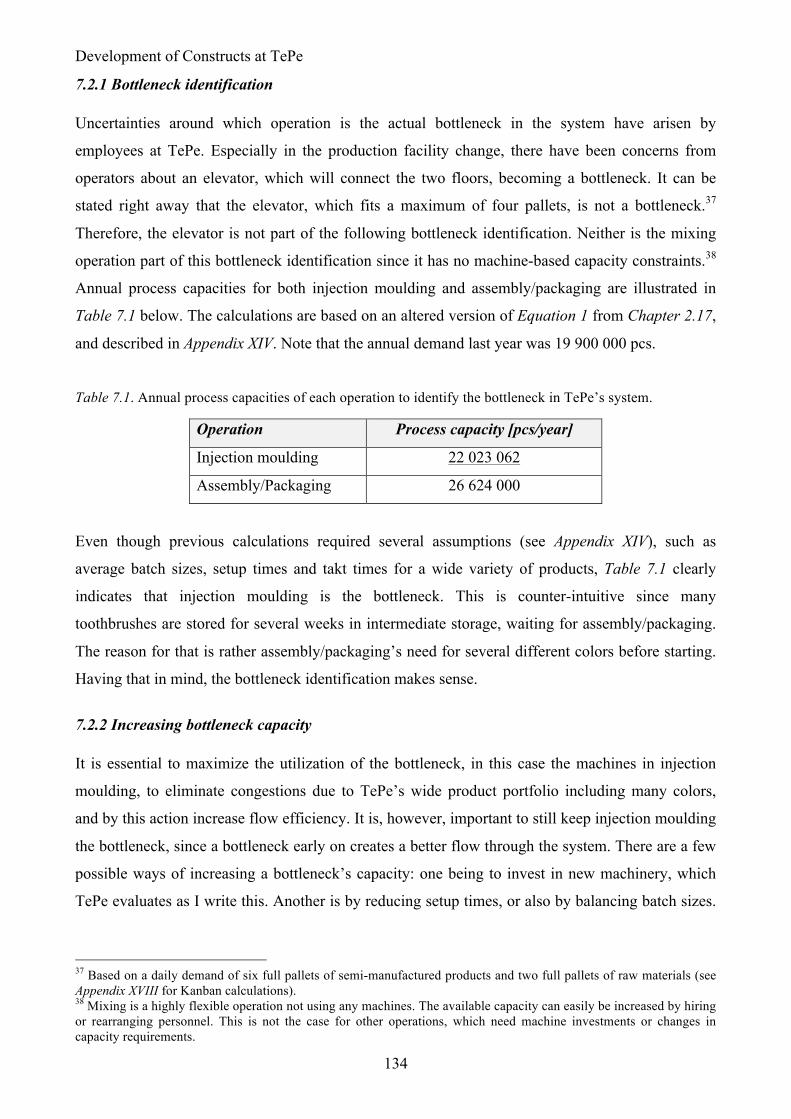
Development of Constructs at TePe
134
7.2.1 Bottleneck identification
Uncertainties around which operation is the actual bottleneck in the system have arisen by
employees at TePe. Especially in the production facility change, there have been concerns from
operators about an elevator, which will connect the two floors, becoming a bottleneck. It can be
stated right away that the elevator, which fits a maximum of four pallets, is not a bottleneck.37
Therefore, the elevator is not part of the following bottleneck identification. Neither is the mixing
operation part of this bottleneck identification since it has no machine-based capacity constraints.38
Annual process capacities for both injection moulding and assembly/packaging are illustrated in
Table 7.1 below. The calculations are based on an altered version of Equation 1 from Chapter 2.17,
and described in Appendix XIV. Note that the annual demand last year was 19 900 000 pcs.
Table 7.1. Annual process capacities of each operation to identify the bottleneck in TePe’s system.
Operation Process capacity [pcs/year]
Injection moulding 22 023 062
Assembly/Packaging 26 624 000
Even though previous calculations required several assumptions (see Appendix XIV), such as
average batch sizes, setup times and takt times for a wide variety of products, Table 7.1 clearly
indicates that injection moulding is the bottleneck. This is counter-intuitive since many
toothbrushes are stored for several weeks in intermediate storage, waiting for assembly/packaging.
The reason for that is rather assembly/packaging’s need for several different colors before starting.
Having that in mind, the bottleneck identification makes sense.
7.2.2 Increasing bottleneck capacity
It is essential to maximize the utilization of the bottleneck, in this case the machines in injection
moulding, to eliminate congestions due to TePe’s wide product portfolio including many colors,
and by this action increase flow efficiency. It is, however, important to still keep injection moulding
the bottleneck, since a bottleneck early on creates a better flow through the system. There are a few
possible ways of increasing a bottleneck’s capacity: one being to invest in new machinery, which
TePe evaluates as I write this. Another is by reducing setup times, or also by balancing batch sizes.
37 Based on a daily demand of six full pallets of semi-manufactured products and two full pallets of raw materials (see Appendix XVIII for Kanban calculations). 38 Mixing is a highly flexible operation not using any machines. The available capacity can easily be increased by hiring or rearranging personnel. This is not the case for other operations, which need machine investments or changes in capacity requirements.
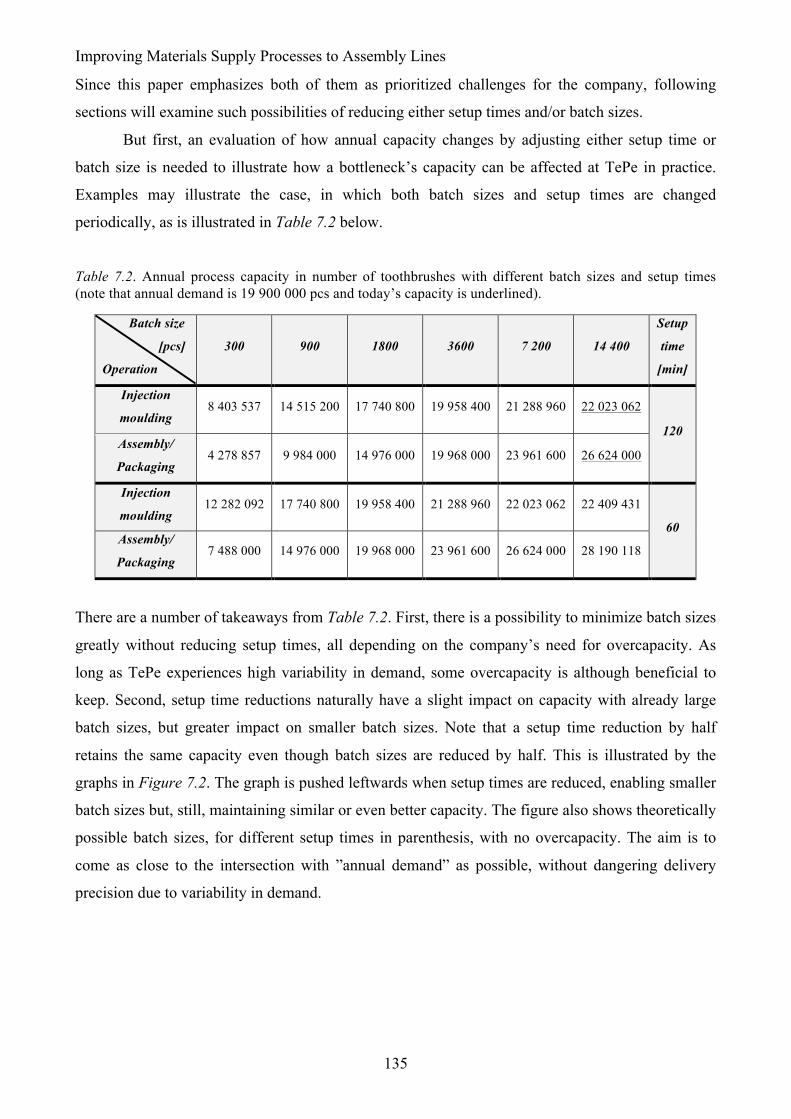
Improving Materials Supply Processes to Assembly Lines
135
Since this paper emphasizes both of them as prioritized challenges for the company, following
sections will examine such possibilities of reducing either setup times and/or batch sizes.
But first, an evaluation of how annual capacity changes by adjusting either setup time or
batch size is needed to illustrate how a bottleneck’s capacity can be affected at TePe in practice.
Examples may illustrate the case, in which both batch sizes and setup times are changed
periodically, as is illustrated in Table 7.2 below.
Table 7.2. Annual process capacity in number of toothbrushes with different batch sizes and setup times (note that annual demand is 19 900 000 pcs and today’s capacity is underlined).
Batch size
[pcs]
Operation
300 900 1800 3600 7 200 14 400
Setup
time
[min]
Injection
moulding 8 403 537 14 515 200 17 740 800 19 958 400 21 288 960 22 023 062
120 Assembly/
Packaging 4 278 857 9 984 000 14 976 000 19 968 000 23 961 600 26 624 000
Injection
moulding 12 282 092 17 740 800 19 958 400 21 288 960 22 023 062 22 409 431
60 Assembly/
Packaging 7 488 000 14 976 000 19 968 000 23 961 600 26 624 000 28 190 118
There are a number of takeaways from Table 7.2. First, there is a possibility to minimize batch sizes
greatly without reducing setup times, all depending on the company’s need for overcapacity. As
long as TePe experiences high variability in demand, some overcapacity is although beneficial to
keep. Second, setup time reductions naturally have a slight impact on capacity with already large
batch sizes, but greater impact on smaller batch sizes. Note that a setup time reduction by half
retains the same capacity even though batch sizes are reduced by half. This is illustrated by the
graphs in Figure 7.2. The graph is pushed leftwards when setup times are reduced, enabling smaller
batch sizes but, still, maintaining similar or even better capacity. The figure also shows theoretically
possible batch sizes, for different setup times in parenthesis, with no overcapacity. The aim is to
come as close to the intersection with ”annual demand” as possible, without dangering delivery
precision due to variability in demand.
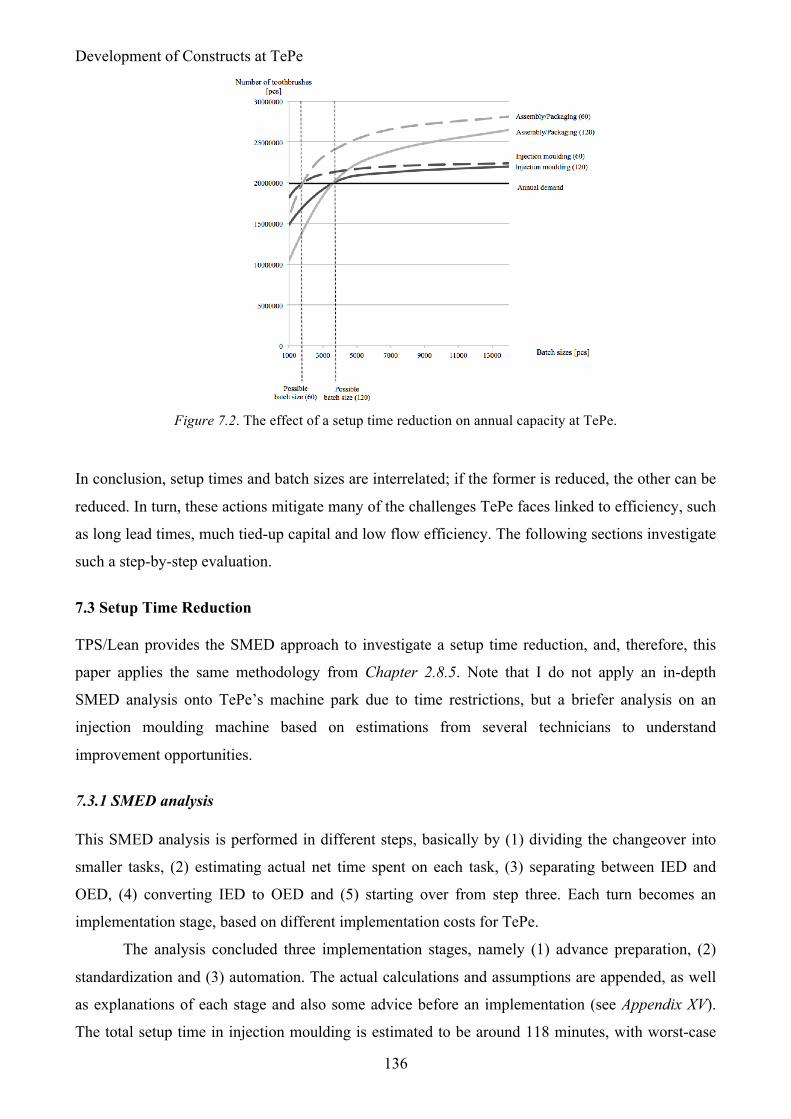
Development of Constructs at TePe
136
Figure 7.2. The effect of a setup time reduction on annual capacity at TePe.
In conclusion, setup times and batch sizes are interrelated; if the former is reduced, the other can be
reduced. In turn, these actions mitigate many of the challenges TePe faces linked to efficiency, such
as long lead times, much tied-up capital and low flow efficiency. The following sections investigate
such a step-by-step evaluation.
7.3 Setup Time Reduction
TPS/Lean provides the SMED approach to investigate a setup time reduction, and, therefore, this
paper applies the same methodology from Chapter 2.8.5. Note that I do not apply an in-depth
SMED analysis onto TePe’s machine park due to time restrictions, but a briefer analysis on an
injection moulding machine based on estimations from several technicians to understand
improvement opportunities.
7.3.1 SMED analysis
This SMED analysis is performed in different steps, basically by (1) dividing the changeover into
smaller tasks, (2) estimating actual net time spent on each task, (3) separating between IED and
OED, (4) converting IED to OED and (5) starting over from step three. Each turn becomes an
implementation stage, based on different implementation costs for TePe.
The analysis concluded three implementation stages, namely (1) advance preparation, (2)
standardization and (3) automation. The actual calculations and assumptions are appended, as well
as explanations of each stage and also some advice before an implementation (see Appendix XV).
The total setup time in injection moulding is estimated to be around 118 minutes, with worst-case
Improving Materials Supply Processes to Assembly Lines
137
scenarios at 1236 minutes. Note that both estimated setup time and, later, suggested reductions are
approximate numbers only to understand improvement opportunities.
7.3.1.1 Advance preparation (Stage 1).
Many tasks can be performed in advance of a changeover. TePe technicians do apply this rule
sporadically, but not as a standard. Instead, a technician may stop the machine, and then retrieve
both relevant tools and plastic granules, and then move the overhead crane. In fact, there may also
be some searching and phone calls before finding the right tools. This stage, therefore, includes a 5S
implementation and a short introduction of Lean to technicians. For the 5S implementation, see
Chapter 7.6. More detailed information about this stage is appended (see Appendix XV).
7.3.1.2 Implementation.
The implementation of this stage is the simplest and least time-consuming, but also the stage with
least impact on time reductions. However, setup times can be reduced by around 20 per cent to 94
minutes in the short-term. The education is estimated to take a few hours, and includes all
technicians.
7.3.1.3 Standardization (Stage 2).
There is no actual standardized work procedure for changeovers at TePe. Since the process for the
technician seems simple and straightforward, no setup sheet has been created. If a process is simple
this is even more of an incentive in creating a setup sheet, since it will streamline the optimal work
processes. The setup sheet needs regular updates in consulation with the technicians, enforcing the
company to continuously improve.
Many opportunities on improvements have been found related to standardization.
Technicians performing specific tasks in parallel are, for example, not prioritized by the company.
Instead, this happens occasionally. Neither is there a standard procedure on how to change color
granules from brighter spectrums to darker spectrums. This challenge can also be mitigated by
investing in purge compounds to clean machines from colors or materials in a changeover. More
information about these improvement opportunities is presented in Appendix XV.
7.3.1.4 Implementation.
An implementation of this stage can reduce the setup times by around 56 per cent to 52 minutes in
the long run. This stage needs an initial investment cost of 120 000 SEK, primarily for wages over a
two- to three-week period. For more information about these implementation costs, see Appendix
XV.
Development of Constructs at TePe
138
7.3.1.5 Automation (Stage 3).
A full-automation of the changeover process can reduce setup times significantly. This requires an
investment in a quick mould changeover system, such as a vertical or horizontal mould loading
system, for many of TePe’s injection moulding machines.
7.3.1.6 Implementation.
An implementation of this stage can reduce the setup times by around 92 per cent to 10 minutes.
The investment costs of such an implementation is, however, difficult to assess. It is vaguely
defined as a ”high capital investment”, and needs to be evaluated by upper management in parallel
with a re-evaluation of the company’s strategies. What can be said is that it probably needs a re-
arrangement of machines with another expansion of the production facility to fit an automation of
changeovers, and, therefore, is seen as an even costlier process. An implementation should,
however, not be completely ignored since it would lead to a possibility of significantly decreasing
batch sizes, leading to several competitive advantages for the company. It would also lead to a safer
environment, less defects and better efficiency. In this paper, withal, an implementation is not
further investigated due to the magnitude of such an investment.
7.3.2 Batch size reduction
There is a constant conflict between setup costs and holding costs in a manufacturing firm. From
this conflict stems the economic order quantity (EOQ) formula (Schonberger, 1983), which has
been the traditional way of calculating batch sizes. However, the formula is built on assumptions
not fulfilled at TePe, such as a steady demand and, more importantly, pre-determined setup costs.
Instead, this paper tries to reduce batch sizes as much as possible to strive for a theoretically optimal
one-piece flow. With a 56 per cent reduction of setup times, which is possible by implementing
SMED at TePe, there is an opportunity of a 34 per cent batch size reduction, based on the EOQ
formula (Olhager, 2013). This maintains the same capacity. Since TePe have some overcapacity, a
further reduction to an average of 7200 pieces, i.e. half of current batch sizes, is possible without
even affecting the capacity significantly.39 A 50 per cent reduction in batch sizes leads to an equally
large reduction in tied-up capital. For TePe, this means a release of 3.7 MSEK in tied-up capital, as
well as 0.74 MSEK saved yearly in inventory holding costs.40 Furthermore, such a batch size
39 The new capacity for injection moulding is 21 788 149 pcs, based on interpolation. 40 TePe does not have any standard policy on calculating inventory holding costs. Research by Azzi, Battini, Faccio, Persona and Sgarbossa (2014) suggests that ”inventory holding cost parameters range between a minimum of 21.9 and a maximum of 32.9 percent of the inventory value on hand” (p. 125), based on five case study companies. Inventory holding costs, in this paper, are conservatively assumed to be 20 per cent of the product toothbrushes’ total inventory value.
Improving Materials Supply Processes to Assembly Lines
139
reduction leads to a direct lead time reduction. Waiting times is, basically, reduced by half. For
TePe, this means reduced lead times in intermediate storage from in average six to three weeks,
mitigating the congestions between injection moulding and assembly/packaging. Moreover, it
means reduced lead times in finished goods warehouse from in average eight to four weeks. Most
likely, this leads to higher asset turnover, increasing ROI, which is another challenge TePe faces.
In the long run, less inventory also leads to indirect labor cost reduction (Schonberger, 1983)
in terms of less inventory accounting, better visibility of materials and smaller warehouses. Smaller
batch sizes create a chain reaction of other benefits as well (Schonberger, 1983). Many of them are
difficult to quantify, but very likely are the results less defects and better quality of products
(Schonberger, 1983). An example can illustrate the case. A technician at TePe may produce a batch
for several days full of defects. With reduced batch sizes, the feedback, both constructive and
positive, reaches upstream operations quicker and mistakes can be adjusted faster. This, in turn,
leads to an increase in the technician’s awareness of challenges and their root causes, which further
leads to improvements such as (1) defect prevention, and ideas on (2) better flow efficiency and (3)
even shorter setup times (Schonberger, 1983). Therefore, it is also important to give staff the
opportunity to easily share their ideas to allow for, and encourage, continuous improvements.
Finally, less defects and better quality obviously also leads to less scrap as well as less time
and costs for rework (Schonberger, 1983). Another indirect benefit of small batch sizes is the
elimination of carelessness among operators (Schonberger, 1983) in a mass-producing company,
such as a few hundred products piling up on the floor beneath an injection moulding machine at
TePe.
7.3.3 Implementation
Batch size reductions are, like the entire concept of Lean, an ever-changing process, aiming for a
one-piece flow. Therefore, I consider the idea of batch size reduction a long-term implementation,
even though this paper’s recommendation for TePe is seen as a short-term implementation based on
a setup time reduction. However, the intermediate storage will be less space utilized, due to higher
stock turnovers, after batch size reductions, whereupon pallet positions need to be trimmed
occasionally. The implementation time is, therefore, difficult to predict, but the implementation
costs are essentially nil. At least initially, since batches still can be transported on the same pallets.
7.4 Managerial Principles
TePe does have some improvement possibilities related to managerial principles, discussed in the
gap analysis in Chapter 6. Building a culture to strive for perfection and constantly improve is
necessary for the company, especially in regards to efficiency challenges. Putting effort into the
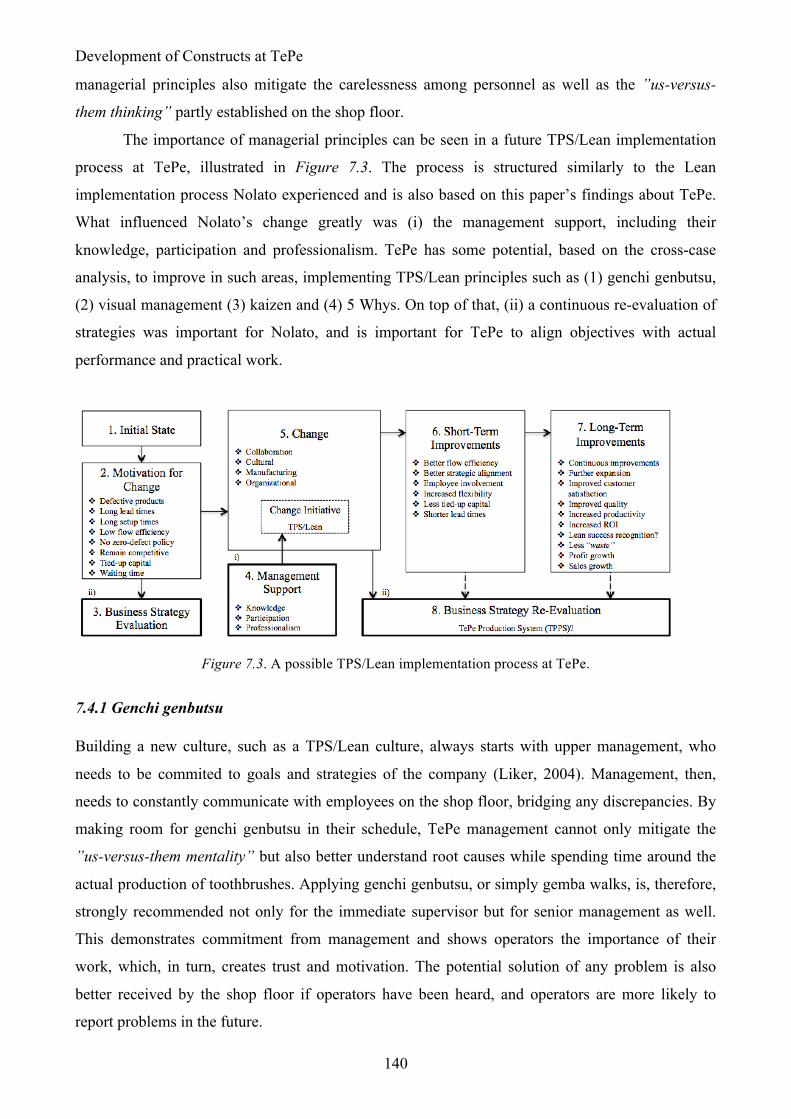
Development of Constructs at TePe
140
managerial principles also mitigate the carelessness among personnel as well as the ”us-versus-
them thinking” partly established on the shop floor.
The importance of managerial principles can be seen in a future TPS/Lean implementation
process at TePe, illustrated in Figure 7.3. The process is structured similarly to the Lean
implementation process Nolato experienced and is also based on this paper’s findings about TePe.
What influenced Nolato’s change greatly was (i) the management support, including their
knowledge, participation and professionalism. TePe has some potential, based on the cross-case
analysis, to improve in such areas, implementing TPS/Lean principles such as (1) genchi genbutsu,
(2) visual management (3) kaizen and (4) 5 Whys. On top of that, (ii) a continuous re-evaluation of
strategies was important for Nolato, and is important for TePe to align objectives with actual
performance and practical work.
Figure 7.3. A possible TPS/Lean implementation process at TePe.
7.4.1 Genchi genbutsu
Building a new culture, such as a TPS/Lean culture, always starts with upper management, who
needs to be commited to goals and strategies of the company (Liker, 2004). Management, then,
needs to constantly communicate with employees on the shop floor, bridging any discrepancies. By
making room for genchi genbutsu in their schedule, TePe management cannot only mitigate the
”us-versus-them mentality” but also better understand root causes while spending time around the
actual production of toothbrushes. Applying genchi genbutsu, or simply gemba walks, is, therefore,
strongly recommended not only for the immediate supervisor but for senior management as well.
This demonstrates commitment from management and shows operators the importance of their
work, which, in turn, creates trust and motivation. The potential solution of any problem is also
better received by the shop floor if operators have been heard, and operators are more likely to
report problems in the future.
Improving Materials Supply Processes to Assembly Lines
141
7.4.2 Visual management
Closely related to management devoting time to the shop floor is visual management. TePe does use
process control boards in their production facility to show important data, but the information is
only partly aligned with their KPIs. Visualizing all information enhances transparency and gives
operators direct feedback on their performance. This paper recommends TePe to implement daily,
or at least every other day, stand-up pulse meetings for each department, in the same spirit as
Nolato has implemented (see Chapter 5.2.3.12). The meetings should be no more than 15 minutes,
bringing up the most important information about the status of the production related to TePe’s
objectives as well as (potential) issues or improvement possibilities. The pulse boards should be
easy to follow, advisably relating an issue to a TePe objective when the issue arises. Issues are
always highlighted in a specific color based on the objectives. It is vital that the pulse board has a
spot for issues and improvement possibilities specifically, in which anybody can fill in issues
arising during the day. Pulse meetings can, generally, be used at all levels of a company, replacing
many of the regular meetings. TePe would benefit from such actions since pulse meetings are more
efficient than regular meetings, saving more time for value-added activities. There are many
examples of pulse boards on the Internet, from which TePe can be further guided in a pulse meeting
implementation. Other recommendations related to visual management are a 5S implementation
(see Chapter 7.6) and a kanban implementation (see Chapter 7.5).
7.4.3 Kaizen
TePe does not have a structured system for continuous improvements today. To be able to foster a
culture in which continuous improvements are seen as a vital part, TePe needs to give the
employees the right tools for that, such as the pulse boards/meetings or similar. But more
importantly, such a culture needs to be embedded at every level, starting from upper management
down on the shop floor. If management is not convinced about the benefits of kaizen, the shop floor
will not be either. To not meet resistance from operators in building a culture with continuous
improvements, the operators need to be part of the change. Therefore, daily pulse meetings are vital
for TePe rather than having weekly meetings. It is also important to implement managerial
principles sequentially, over a longer period of time, for employees to get accustomed to TPS/Lean.
That being said, employees at every level should be encouraged to find improvement opportunities.
In the long run, this increases efficiency, productivity and employee engagement, bridging
employees from different levels of the company.
The aim is to create a sense of responsibility in every employee, making them interested in
their own work (Schonberger, 1983). This can be created by implementing what Toyota calls small
group improvement activities (SGIA) (Schonberger, 1983). The department is, for example, divided
Development of Constructs at TePe
142
into smaller groups with team leaders who meet regularly. This also gives room for employees to
take on leadership roles. Research even suggests that interest among personnel arises not only by
creating SGIAs, but to actually implementing Lean principles (see Schonberger, 1983). In fact,
reducing inventory increases employee’s interest in finding improvements (Schonberger, 1983).
An investigation of external- and internal-driven motivational methods (see Chapter 2.7 for
theory) is also suitable for TePe to increase employee’s interest, since TePe constantly strives for
organic growth and expansion. TePe does work with goal setting motivation today, such as
visualizing daily expected production versus daily produced toothbrushes. Management can,
however, be more transparent in visualizing personal goal setting for operators to give them
incentives for kaizen. Another external-driven method for TePe can be to establish an incentive
system with monthly rewards for employees if reaching some accumulated number of produced
toothbrushes.
7.4.4 5 Whys
Issues automatically arise at shorter time intervals when genchi genbutsu is applied to a great
extent. More importantly is, then, the methods of 5 Whys in finding root causes, not only for
management at TePe but for operators. Instead of only solving problems temporarily to restart
production, operators need to be educated in solving problems permanently.
7.4.5 Re-evaluation of strategies
The re-evaluation of strategies is, as other managerial principles, a continuous on-going business, as
illustrated in Figure 7.3 above. Most essential is that the strategies pervade the entire company,
from upper management to the factory floor. Therefore, it is important for TePe to, initially, re-
evaluate their strategies. The OEE is, for example, one of the most important performance metrics
used in a manufacturing business to evaluate productivity and quality issues (Binti Aminuddin,
Garza-Reyes, Kumar, Antony & Rocha-Lona, 2016). A correlation between companies working
with improvement efforts such as Lean, and their use of OEE as a KPI has also been found in
research (see e.g. Binti Aminuddin et al., 2016). The OEE metric, which is already applied at TePe,
is, therefore, a good start. The metric, however, does only account for resource efficiency, which
has been the strategy TePe uses, especially with automation. Operations in-between machines are
hidden using only the OEE, and, thus, the metric lacks in aspects related to flow efficiency. Since
this paper has found the flow efficiency being of crucial importance in enhancing TePe’s overall
performance, the KPIs are recommended to be expanded. Examples of relevant KPIs for TePe are,
Improving Materials Supply Processes to Assembly Lines
143
therefore, the activity ratio41 and ROI42 (see Brewer & Speh, 2000). Especially is the activity ratio a
hands-on KPI, measuring the value-added time spent in production against the lead time. Both KPIs
serve as complement to current metrics. However, I recommed TePe to also re-evaluate their
current KPIs since many companies in general lack in linking their strategic goals with their supply
chain management practices (Brewer & Speh, 2000). For this process of strategically aligning
objectives with performance metrics, the Balanced scorecard presented by either Brewer and Speh
(2000) or Kaplan and Norton (2007) can be used. An Internet search can guide the reader to similar
balanced scorecards. Companies use the scorecard to update, communicate and clarify their strategy
as well as to focus on desired improvements in performance (Kaplan & Norton, 2007). Another,
probably even more relevant, performance measurement system is the Supply chain operations
reference (SCOR) model, developed by experts and practitioners from the Supply Chain Council
(Wang, Chan & Pauleen, 2009). The model is specifically designed for supply chain planning,
including both supply chain management practices and business process reengineering (Wang et al.,
2009).43 This paper, however, does not evaluate TePe’s strategies further due to both time
restrictions and the actual evaluation being more suitable for TePe upper management to proceed.
7.4.6 Implementation
This paper refrains from quantifying the benefits of applying managerial principles, which although
certainly enhances the overall well-being of the company in the long run. Such quantification would
be highly hypothetical, since every company reacts differently on a cultural change. For the reader
who is not yet convinced of the effects from managerial principles, Nolato can serve as example.
They, today, have an asset turnover of 1.57, and has doubled their ROI over a twelve-year period.
Note that there is not the actually recommended TPS/Lean methods that are most important,
but rather to achieve employee engagement (see Schonberger, 1983). This implementation requires
time invested continually from each employee over many years, and, therefore, neither is this
implementation quantified in terms of time or costs.
7.5 New Production Facility
The new production facility initiates a few challenges, but, most importantly, keeping high
materials availability on the second floor. The layout has already been planned by TePe
management, and is illustrated in Figure 7.4. Even though Lean suggests a cellular layout with
continuous flow, there were, according to management, many factors influencing the layout
41 The activity ratio is the ratio between processing time and lead time used in value stream mapping. 42 ROI measures the ratio between profit margin and asset turnover. 43 Both the Balanced scorecard and the SCOR model application at TePe requires further research since it goes beyond the scope of this paper.
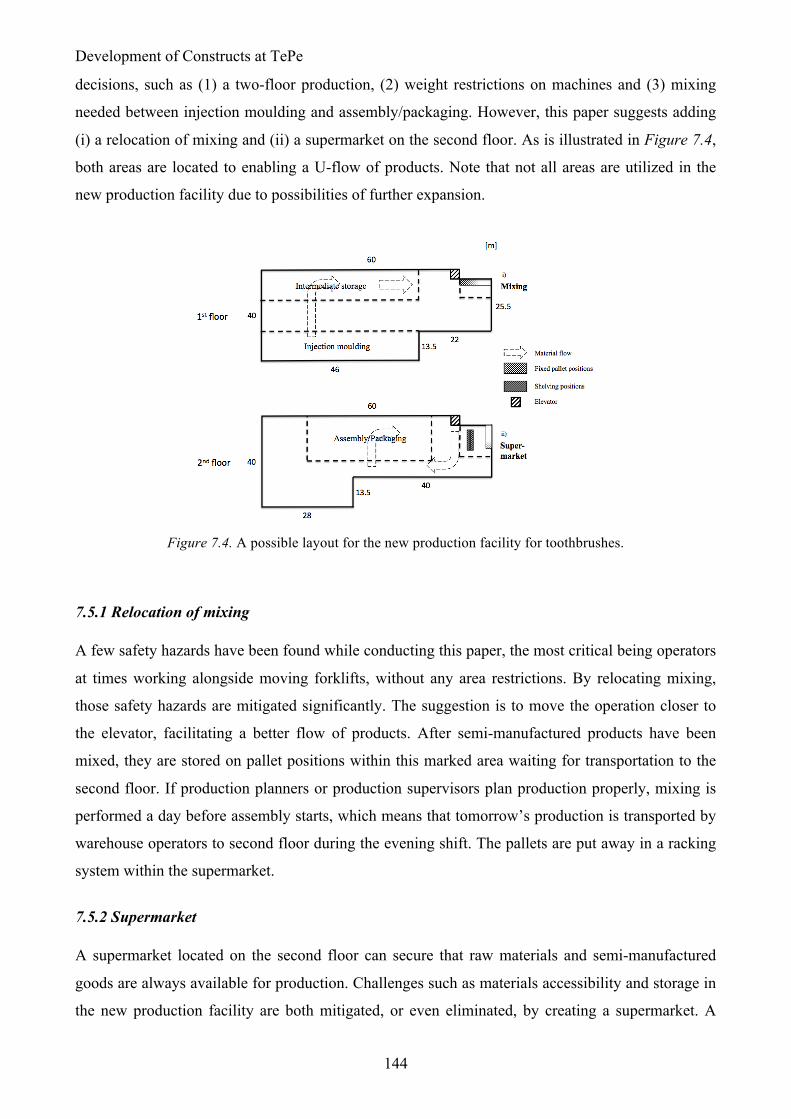
Development of Constructs at TePe
144
decisions, such as (1) a two-floor production, (2) weight restrictions on machines and (3) mixing
needed between injection moulding and assembly/packaging. However, this paper suggests adding
(i) a relocation of mixing and (ii) a supermarket on the second floor. As is illustrated in Figure 7.4,
both areas are located to enabling a U-flow of products. Note that not all areas are utilized in the
new production facility due to possibilities of further expansion.
Figure 7.4. A possible layout for the new production facility for toothbrushes.
7.5.1 Relocation of mixing
A few safety hazards have been found while conducting this paper, the most critical being operators
at times working alongside moving forklifts, without any area restrictions. By relocating mixing,
those safety hazards are mitigated significantly. The suggestion is to move the operation closer to
the elevator, facilitating a better flow of products. After semi-manufactured products have been
mixed, they are stored on pallet positions within this marked area waiting for transportation to the
second floor. If production planners or production supervisors plan production properly, mixing is
performed a day before assembly starts, which means that tomorrow’s production is transported by
warehouse operators to second floor during the evening shift. The pallets are put away in a racking
system within the supermarket.
7.5.2 Supermarket
A supermarket located on the second floor can secure that raw materials and semi-manufactured
goods are always available for production. Challenges such as materials accessibility and storage in
the new production facility are both mitigated, or even eliminated, by creating a supermarket. A
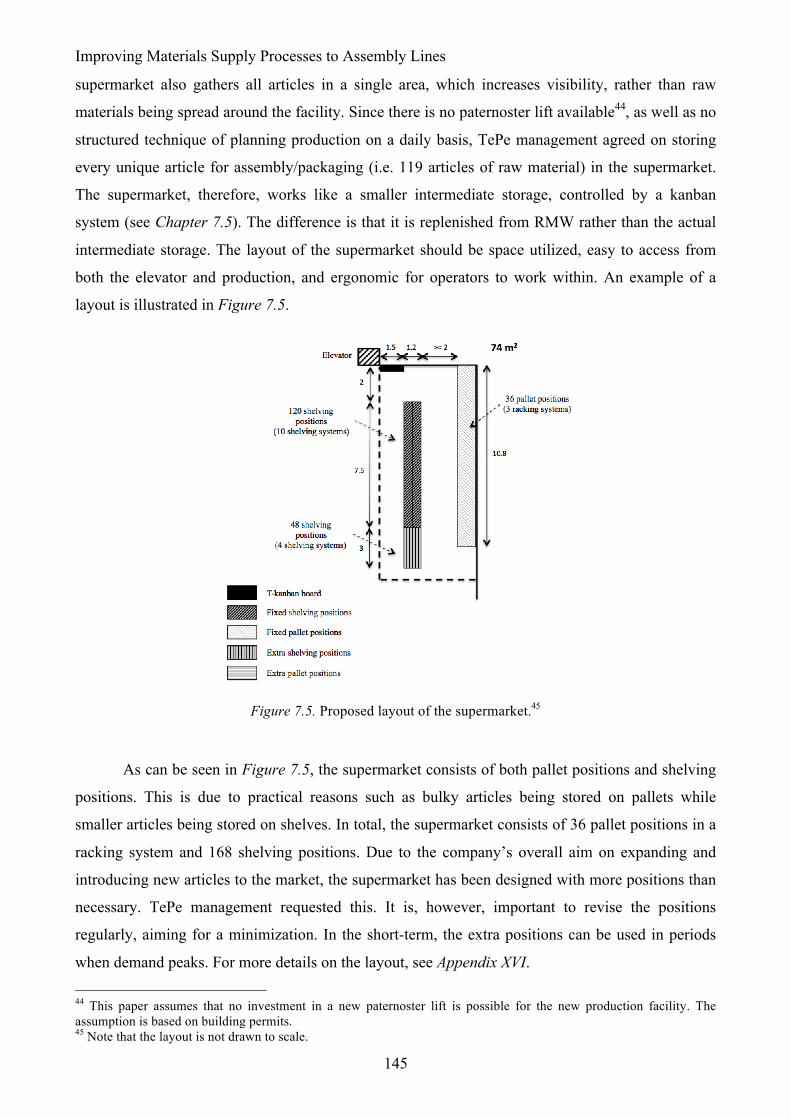
Improving Materials Supply Processes to Assembly Lines
145
supermarket also gathers all articles in a single area, which increases visibility, rather than raw
materials being spread around the facility. Since there is no paternoster lift available44, as well as no
structured technique of planning production on a daily basis, TePe management agreed on storing
every unique article for assembly/packaging (i.e. 119 articles of raw material) in the supermarket.
The supermarket, therefore, works like a smaller intermediate storage, controlled by a kanban
system (see Chapter 7.5). The difference is that it is replenished from RMW rather than the actual
intermediate storage. The layout of the supermarket should be space utilized, easy to access from
both the elevator and production, and ergonomic for operators to work within. An example of a
layout is illustrated in Figure 7.5.
Figure 7.5. Proposed layout of the supermarket.45
As can be seen in Figure 7.5, the supermarket consists of both pallet positions and shelving
positions. This is due to practical reasons such as bulky articles being stored on pallets while
smaller articles being stored on shelves. In total, the supermarket consists of 36 pallet positions in a
racking system and 168 shelving positions. Due to the company’s overall aim on expanding and
introducing new articles to the market, the supermarket has been designed with more positions than
necessary. TePe management requested this. It is, however, important to revise the positions
regularly, aiming for a minimization. In the short-term, the extra positions can be used in periods
when demand peaks. For more details on the layout, see Appendix XVI.
44 This paper assumes that no investment in a new paternoster lift is possible for the new production facility. The assumption is based on building permits. 45 Note that the layout is not drawn to scale.
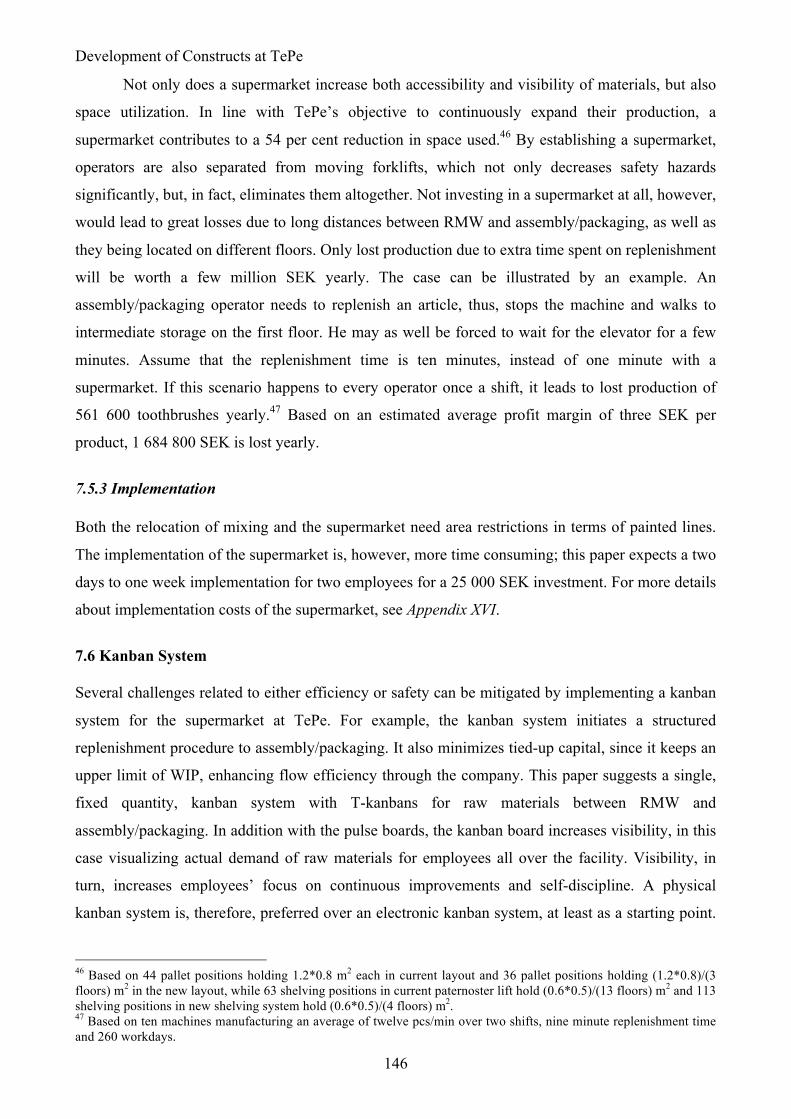
Development of Constructs at TePe
146
Not only does a supermarket increase both accessibility and visibility of materials, but also
space utilization. In line with TePe’s objective to continuously expand their production, a
supermarket contributes to a 54 per cent reduction in space used.46 By establishing a supermarket,
operators are also separated from moving forklifts, which not only decreases safety hazards
significantly, but, in fact, eliminates them altogether. Not investing in a supermarket at all, however,
would lead to great losses due to long distances between RMW and assembly/packaging, as well as
they being located on different floors. Only lost production due to extra time spent on replenishment
will be worth a few million SEK yearly. The case can be illustrated by an example. An
assembly/packaging operator needs to replenish an article, thus, stops the machine and walks to
intermediate storage on the first floor. He may as well be forced to wait for the elevator for a few
minutes. Assume that the replenishment time is ten minutes, instead of one minute with a
supermarket. If this scenario happens to every operator once a shift, it leads to lost production of
561 600 toothbrushes yearly.47 Based on an estimated average profit margin of three SEK per
product, 1 684 800 SEK is lost yearly.
7.5.3 Implementation
Both the relocation of mixing and the supermarket need area restrictions in terms of painted lines.
The implementation of the supermarket is, however, more time consuming; this paper expects a two
days to one week implementation for two employees for a 25 000 SEK investment. For more details
about implementation costs of the supermarket, see Appendix XVI.
7.6 Kanban System
Several challenges related to either efficiency or safety can be mitigated by implementing a kanban
system for the supermarket at TePe. For example, the kanban system initiates a structured
replenishment procedure to assembly/packaging. It also minimizes tied-up capital, since it keeps an
upper limit of WIP, enhancing flow efficiency through the company. This paper suggests a single,
fixed quantity, kanban system with T-kanbans for raw materials between RMW and
assembly/packaging. In addition with the pulse boards, the kanban board increases visibility, in this
case visualizing actual demand of raw materials for employees all over the facility. Visibility, in
turn, increases employees’ focus on continuous improvements and self-discipline. A physical
kanban system is, therefore, preferred over an electronic kanban system, at least as a starting point.
46 Based on 44 pallet positions holding 1.2*0.8 m2 each in current layout and 36 pallet positions holding (1.2*0.8)/(3 floors) m2 in the new layout, while 63 shelving positions in current paternoster lift hold (0.6*0.5)/(13 floors) m2 and 113 shelving positions in new shelving system hold (0.6*0.5)/(4 floors) m2. 47 Based on ten machines manufacturing an average of twelve pcs/min over two shifts, nine minute replenishment time and 260 workdays.
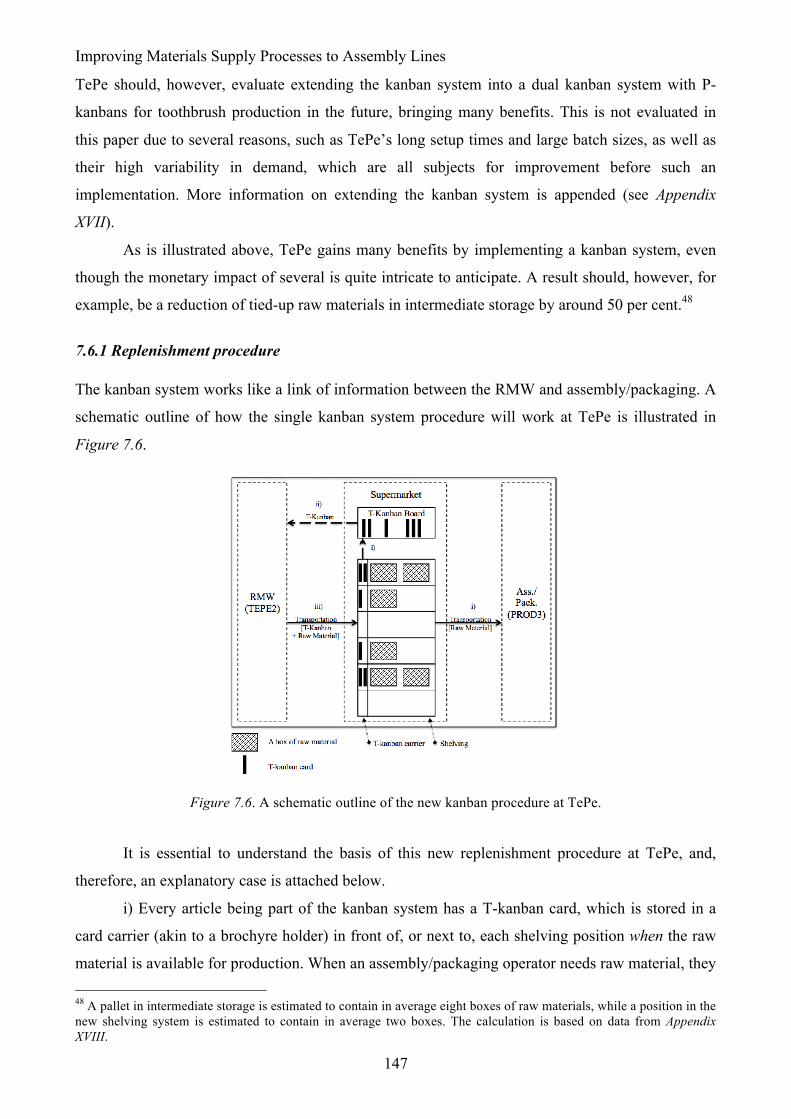
Improving Materials Supply Processes to Assembly Lines
147
TePe should, however, evaluate extending the kanban system into a dual kanban system with P-
kanbans for toothbrush production in the future, bringing many benefits. This is not evaluated in
this paper due to several reasons, such as TePe’s long setup times and large batch sizes, as well as
their high variability in demand, which are all subjects for improvement before such an
implementation. More information on extending the kanban system is appended (see Appendix
XVII).
As is illustrated above, TePe gains many benefits by implementing a kanban system, even
though the monetary impact of several is quite intricate to anticipate. A result should, however, for
example, be a reduction of tied-up raw materials in intermediate storage by around 50 per cent.48
7.6.1 Replenishment procedure
The kanban system works like a link of information between the RMW and assembly/packaging. A
schematic outline of how the single kanban system procedure will work at TePe is illustrated in
Figure 7.6.
Figure 7.6. A schematic outline of the new kanban procedure at TePe.
It is essential to understand the basis of this new replenishment procedure at TePe, and,
therefore, an explanatory case is attached below.
i) Every article being part of the kanban system has a T-kanban card, which is stored in a
card carrier (akin to a brochyre holder) in front of, or next to, each shelving position when the raw
material is available for production. When an assembly/packaging operator needs raw material, they 48 A pallet in intermediate storage is estimated to contain in average eight boxes of raw materials, while a position in the new shelving system is estimated to contain in average two boxes. The calculation is based on data from Appendix XVIII.

Development of Constructs at TePe
148
first transport the associated T-kanban card to the kanban board, which is a signal for demand in the
supermarket, and, then, transport the articles to the assembly/packaging area.
The kanban board consists of card holders, such as hooks, racks or magnets, for the kanban
cards to be stored, one for each unique article of raw materials. Above each card holder is the article
name or number. When the right amount49 of cards is located on a hook, this is a signal for
replenishment. The kanban board visually shows the need of raw materials for anybody, either
operators or management.
ii) The warehouse operators checks the kanban board twice a shift. If there are enough cards
on the card holder to initiate a replenishment of that article, she removes (!) the cards from the
board and brings them back to RMW (TEPE2). Note that she replenishes all unique articles ready
for replenishment simultaneously. She, then, registers the replenishment in TePe’s internal system,
Jeeves, exactly as is done today.
iii) The actual replenishment is initiated. The warehouse operator replenishes the raw
materials into the shelving system, and put the kanban cards in the T-kanban carrier. Again, since
the distance between RMW and the supermarket is quite long, the warehouse operators should
strive for transporting as many different articles as possible in a single turn, if possible.
7.6.2 Kanban cards
Every article stored on shelves in the supermarket is included in the kanban system, at least initially.
This is due to the importance of having no stock-outs. The system contains 219 kanban cards.
Detailed information about articles’ number of kanban cards, safety stock levels etc. can be found in
Appendix XVIII.
7.6.3 Kanban assumptions
It cannot be emphasized enough that a too detailed analysis of the amount of kanban cards is in fact
inappropriate, since the real world always differ from such an analysis (Yamashina, 1982). Remark
that the calculations of this paper, therefore, is only a recommendation, and definitely no final
answer. Such a calculation also includes many assumptions, and, therefore, I shortly argue for
assumptions regarding the most important variables: (1) the safety coefficient, (2) demand, (3) lead
times and (4) container size.
The safety coefficient was, first, set to α = 0.5, which means that half a day’s extra demand
is always stored within the supermarket. Guidance from TePe later led to an even higher safety
factor to eliminate risks of stock-out, yet implementing too many kanban cards is no problem as
long as there is a gradual decrease in cards (Shingo, 1984). 49 Each kanban card has this information.
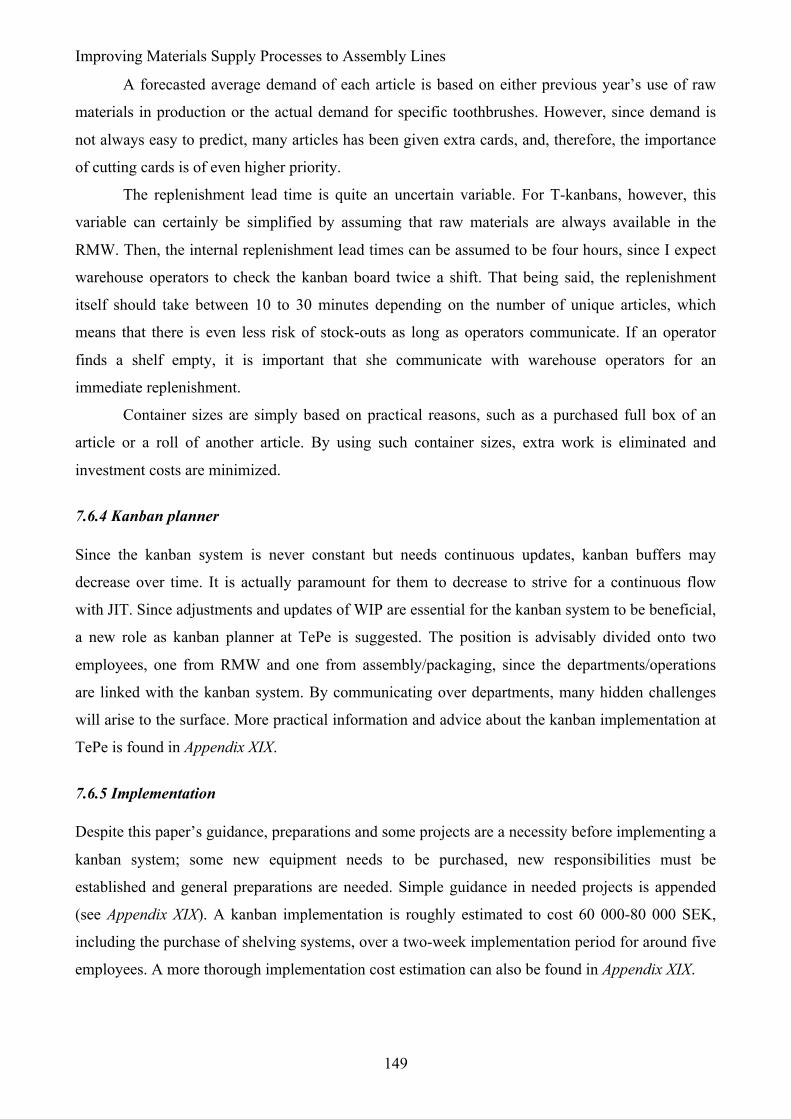
Improving Materials Supply Processes to Assembly Lines
149
A forecasted average demand of each article is based on either previous year’s use of raw
materials in production or the actual demand for specific toothbrushes. However, since demand is
not always easy to predict, many articles has been given extra cards, and, therefore, the importance
of cutting cards is of even higher priority.
The replenishment lead time is quite an uncertain variable. For T-kanbans, however, this
variable can certainly be simplified by assuming that raw materials are always available in the
RMW. Then, the internal replenishment lead times can be assumed to be four hours, since I expect
warehouse operators to check the kanban board twice a shift. That being said, the replenishment
itself should take between 10 to 30 minutes depending on the number of unique articles, which
means that there is even less risk of stock-outs as long as operators communicate. If an operator
finds a shelf empty, it is important that she communicate with warehouse operators for an
immediate replenishment.
Container sizes are simply based on practical reasons, such as a purchased full box of an
article or a roll of another article. By using such container sizes, extra work is eliminated and
investment costs are minimized.
7.6.4 Kanban planner
Since the kanban system is never constant but needs continuous updates, kanban buffers may
decrease over time. It is actually paramount for them to decrease to strive for a continuous flow
with JIT. Since adjustments and updates of WIP are essential for the kanban system to be beneficial,
a new role as kanban planner at TePe is suggested. The position is advisably divided onto two
employees, one from RMW and one from assembly/packaging, since the departments/operations
are linked with the kanban system. By communicating over departments, many hidden challenges
will arise to the surface. More practical information and advice about the kanban implementation at
TePe is found in Appendix XIX.
7.6.5 Implementation
Despite this paper’s guidance, preparations and some projects are a necessity before implementing a
kanban system; some new equipment needs to be purchased, new responsibilities must be
established and general preparations are needed. Simple guidance in needed projects is appended
(see Appendix XIX). A kanban implementation is roughly estimated to cost 60 000-80 000 SEK,
including the purchase of shelving systems, over a two-week implementation period for around five
employees. A more thorough implementation cost estimation can also be found in Appendix XIX.
Development of Constructs at TePe
150
7.7 5S
As TePe also meets safety related challenges within the production facility, a 5S implementation is
beneficial for them. Every equipment, in both injection moulding and assembly/packaging, will
have its own spot, mitigating safety hazards due to less movement of operators searching for tools.
TePe, in fact, experiences non-value added time spent on such activities, as well as, at times, a non-
structured work environment. Both are mitigated by a 5S implementation. Employees also need to
keep equipment and their work environment clean, no matter the operation.
As a few other constructions of this paper, the advantageous of implementing 5S is difficult
to quantify in monetary terms. However, imagine three operators or technicians spending ten
minutes a day searching for a tool. Over a year, 130 hours have been wasted on non-value added
activities. If this also prevents the production from manufacturing accordingly, there is a loss of
around 94 000 toothbruhes. Depending on how far up in the value stream the production is stopped,
the added product value is obviously different, but the total value on lost production is estimated to
be around 0.28 MSEK yearly.50
7.7.1 Implementation
The project of implementing 5S can be divided into two phases: (1) the actual implementation of 5S
and (2) sustaining 5S. Although the actual implementation of 5S may be simple, it is harder to
sustain. The importance of implementing the managerial principles (see Chapter 6.3) can, therefore,
not be emphasized enough.
The entire 5S project is seen as a ”low-cost investment” of around 20 000 SEK with an
actual implementation time of one week, including the workforce of an entire department (5-20
employees). Since education and follow-ups can be assigned the weekly meetings at TePe, and the
culture of continuous improvements should be embedded within the company via managerial
principles, sustaining 5S is seen as a zero-cost investment. More detailed information about
implementation times and costs as well as responsibilities and some advice is found in Appendix
XX.
50 Assuming 260 workdays a year, a production takt time of five seconds and an average product value of three SEK.
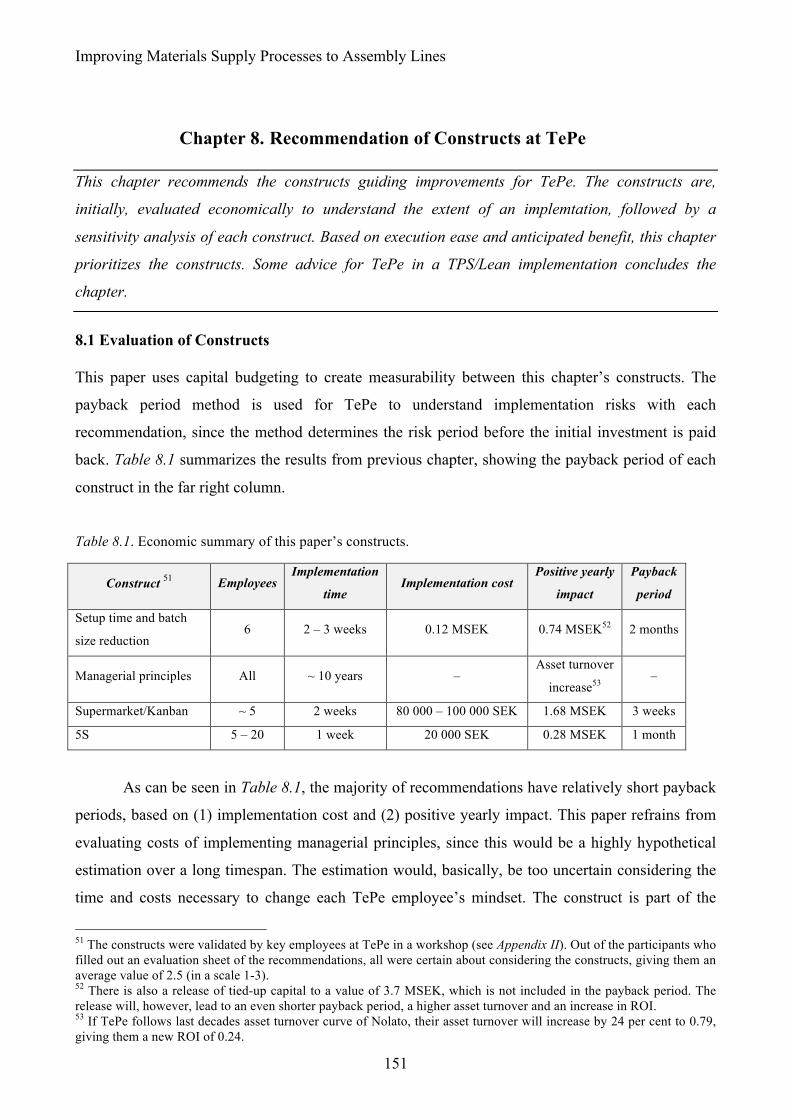
Improving Materials Supply Processes to Assembly Lines
151
Chapter 8. Recommendation of Constructs at TePe This chapter recommends the constructs guiding improvements for TePe. The constructs are,
initially, evaluated economically to understand the extent of an implemtation, followed by a
sensitivity analysis of each construct. Based on execution ease and anticipated benefit, this chapter
prioritizes the constructs. Some advice for TePe in a TPS/Lean implementation concludes the
chapter.
8.1 Evaluation of Constructs
This paper uses capital budgeting to create measurability between this chapter’s constructs. The
payback period method is used for TePe to understand implementation risks with each
recommendation, since the method determines the risk period before the initial investment is paid
back. Table 8.1 summarizes the results from previous chapter, showing the payback period of each
construct in the far right column.
Table 8.1. Economic summary of this paper’s constructs.
Construct 51 Employees Implementation
time Implementation cost
Positive yearly
impact
Payback
period
Setup time and batch
size reduction 6 2 – 3 weeks 0.12 MSEK 0.74 MSEK52 2 months
Managerial principles All ~ 10 years – Asset turnover
increase53 –
Supermarket/Kanban ~ 5 2 weeks 80 000 – 100 000 SEK 1.68 MSEK 3 weeks
5S 5 – 20 1 week 20 000 SEK 0.28 MSEK 1 month
As can be seen in Table 8.1, the majority of recommendations have relatively short payback
periods, based on (1) implementation cost and (2) positive yearly impact. This paper refrains from
evaluating costs of implementing managerial principles, since this would be a highly hypothetical
estimation over a long timespan. The estimation would, basically, be too uncertain considering the
time and costs necessary to change each TePe employee’s mindset. The construct is part of the
51 The constructs were validated by key employees at TePe in a workshop (see Appendix II). Out of the participants who filled out an evaluation sheet of the recommendations, all were certain about considering the constructs, giving them an average value of 2.5 (in a scale 1-3). 52 There is also a release of tied-up capital to a value of 3.7 MSEK, which is not included in the payback period. The release will, however, lead to an even shorter payback period, a higher asset turnover and an increase in ROI. 53 If TePe follows last decades asset turnover curve of Nolato, their asset turnover will increase by 24 per cent to 0.79, giving them a new ROI of 0.24.
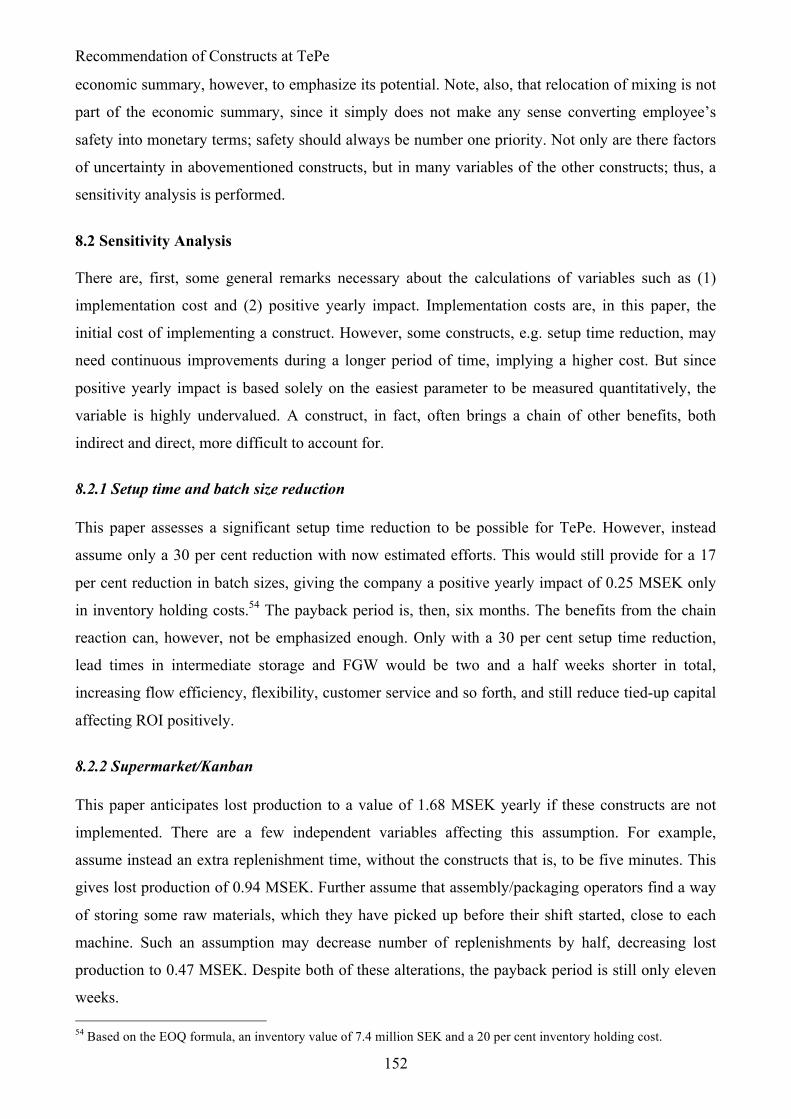
Recommendation of Constructs at TePe
152
economic summary, however, to emphasize its potential. Note, also, that relocation of mixing is not
part of the economic summary, since it simply does not make any sense converting employee’s
safety into monetary terms; safety should always be number one priority. Not only are there factors
of uncertainty in abovementioned constructs, but in many variables of the other constructs; thus, a
sensitivity analysis is performed.
8.2 Sensitivity Analysis
There are, first, some general remarks necessary about the calculations of variables such as (1)
implementation cost and (2) positive yearly impact. Implementation costs are, in this paper, the
initial cost of implementing a construct. However, some constructs, e.g. setup time reduction, may
need continuous improvements during a longer period of time, implying a higher cost. But since
positive yearly impact is based solely on the easiest parameter to be measured quantitatively, the
variable is highly undervalued. A construct, in fact, often brings a chain of other benefits, both
indirect and direct, more difficult to account for.
8.2.1 Setup time and batch size reduction
This paper assesses a significant setup time reduction to be possible for TePe. However, instead
assume only a 30 per cent reduction with now estimated efforts. This would still provide for a 17
per cent reduction in batch sizes, giving the company a positive yearly impact of 0.25 MSEK only
in inventory holding costs.54 The payback period is, then, six months. The benefits from the chain
reaction can, however, not be emphasized enough. Only with a 30 per cent setup time reduction,
lead times in intermediate storage and FGW would be two and a half weeks shorter in total,
increasing flow efficiency, flexibility, customer service and so forth, and still reduce tied-up capital
affecting ROI positively.
8.2.2 Supermarket/Kanban
This paper anticipates lost production to a value of 1.68 MSEK yearly if these constructs are not
implemented. There are a few independent variables affecting this assumption. For example,
assume instead an extra replenishment time, without the constructs that is, to be five minutes. This
gives lost production of 0.94 MSEK. Further assume that assembly/packaging operators find a way
of storing some raw materials, which they have picked up before their shift started, close to each
machine. Such an assumption may decrease number of replenishments by half, decreasing lost
production to 0.47 MSEK. Despite both of these alterations, the payback period is still only eleven
weeks. 54 Based on the EOQ formula, an inventory value of 7.4 million SEK and a 20 per cent inventory holding cost.
Improving Materials Supply Processes to Assembly Lines
153
8.2.3 5S
This paper anticipates lost production to a value of 0.28 MSEK yearly if this construct is not
implemented. Assume that there is only one employee, instead of three, searching for a tool each
day. Lost production is, then, estimated to be 94 000 SEK yearly, leading to an eleven-week
payback period. It should be added that this construct, like many others, contributes to a TPS/Lean
culture, leading to indirect benefits in efficiency as well as safety, serving as a start in implementing
managerial principles at the company.
8.3 Recommendation of Constructs
Based on both the evaluation and the sensitivity analysis, the constructs are prioritized using a
PACE chart, illustrated in Figure 8.1. The constructs are, basically, assessed on (i) execution ease
and (ii) anticipated benefit for TePe. This paper also considers each construct to be implemented
either in the short-term or in the long-term. Note, however, that (1) setup time and batch size
reduction, (5) kanban system and (6) 5S are all constructs requiring long term efforts as well, even
though the actual implementation is seen as a short-term recommendation.
Figure 8.1. Evaluation of recommendations for TePe.
8.3.1 Priority
The supermarket is the construct with highest priority for TePe. This is not only due to factors of
the PACE chart, but also due to the construct being a necessity in the new production facility. TePe
is recommended to prioritize an implementation of following construct: the supermarket.
8.3.2 Action
There are two constructs falling into each extreme of the ”take action” area. The setup time and
batch size reduction is estimated to have a strong impact on TePe’s efficiency challenges, yet it
Recommendation of Constructs at TePe
154
requires some effort from the company. The relocation of mixing, on the other hand, is an easy-to-
implement construct, yet not significantly impacting overall performance of the company. Both are,
however, in the ”take action” area. The kanban system and the 5S implementation are both close to
be prioritized, since they are both quite easy to implement mitigating many of the challenges TePe
faces. In summation, TePe is recommended to take action to implement following constructs: setup
time and batch size reduction, relocation of mixing, kanban system and 5S.
8.3.3 Consider
TePe is anticipated to benefit the most from implementing managerial principles. This paper
suggests five methods (see Chapter 7.3) to implement in the long-run, influencing the culture of the
company into TPS/Lean. Bringing every employee on board on such a project is hard, but the
outcome can have a real impact on the overall performance of the company. Therefore, TePe is
strongly recommended to consider an implementation of following construct: managerial principles.
8.4 Risk Assessment
There are always a few risks in any project; the same applies to the constructs of this Master’s
thesis. Some of them are summarized below for TePe to better prepare for implementing this
paper’s recommended constructs.
8.4.1 Resistance to change
Change is part of every improvement effort; TPS/Lean is no exception. Change often brings
resistance to some extent, since resistance is a natural part of human behaviour. I, therefore, suggest
that each employee affected by the construct in question is involved in the change. Some constructs
of this paper, such as the kanban implementation, is divided into projects to facilitate such an
employee engagement (see Appendix XIX). The empathetic aspect from management to always
explain decisions for operators, preferably individually to avoid unnecessary conflicts, is also vital.
Addressing the emotional responses, if there are any, at their root is a pressing factor to mitigate
resistance. This is especially important while implementing the SMED analysis, since technicians
may have been working in the machine park for decades already. In summation, employee
participation is important, and no projects should be rushed.
8.4.2 Sustaining constructs
There is a risk of employees starting to take instructions lightly after a while. Operators/technicians
may start to neglect putting back a tool in its place, or an operator may not be as accurate in moving
kanban cards. Similarly, employees may, for example, stop cleaning their workplace everyday. It is,
Improving Materials Supply Processes to Assembly Lines
155
therefore, vital for management to be supporters of the constructs from start, as well as they being
well versed in TPS/Lean to be able to inform personnel about all benefits with specific actions.
8.4.3 Demand variability
A fluctuating demand can risk the kanban buffert to not deal with peaks in demand for some lower-
volume products. Therefore, the kanban card calculations use extra safety factors. It is, however,
important for the kanban planner to continuously update the cards, especially in situations with
predictable peaks in demand. In such cases, extra kanban cards can be initiated temporarily to
prevent stock-outs in the supermarket. The long-term solution for such challenges is, however,
heijunka, i.e. production leveling, which has some of this paper’s constructs as prerequisites, such
as setup time and batch size reduction. Therefore, heijunka is not part of this paper’s scope.
8.4.4 New products
Another risk factor TePe faces, in general, is the rapidly growing difference between asset turnover
and profit margin. This can be due to their strategy of continuosly introducing new products to the
market. In average, TePe’s new products increase unique articles of raw materials by 50-100 each
year, leading to more tied-up capital, a more complex material flow, more changeovers of machines
etc. An increase in machine changeovers, for example, leads to worse flow efficiency, which has an
impact on asset turnover.
Conclusions
156
Chapter 9. Conclusions This chapter summarizes the findings of the entire paper. The research questions are answered one
by one, followed by this Master’s thesis actual contribution to both practice and academia. Future
development and research for both TePe and academia concludes this final chapter.
9.1 Conclusion
The main objective of this research has been to improve the materials supply processes to assembly
lines in a manufacturing production facility through Toyota production system and Lean
manufacturing, and recommend TePe on improvements in their expansion phase, based on three
research questions. Through this paper, the constructive research approach has been used to produce
these recommendations, or contructs, to practical challenges TePe faces, all based on theory. In
collaboration with TePe management, we found three important aspects on what the research should
be based, i.e. efficiency, safety and a new production facility. Since neither of these areas were
specified in any precise detail, a comprehensive TPS/Lean process mapping was required as a
foundation of the paper. Challenges were found, both in the mapping process but also as a result of
the cross-case analysis, which guided the research to recommended constructs. Many of the
challenges were, and are still, a consequence of an underlying focus on resource efficiency rather
than flow efficiency. Research shows that this is a natural phenomenon in companies not aiming
regular attention to TPS/Lean or production methods alike. Research also shows that a TPS/Lean
implementation does result in a wide range of benefits for a company, even though several of them
can be difficult to quantify in monetary terms. During this research, such challenges were
encountered, why it is important for upper-management to really grasp the concept of TPS/Lean,
and to support a full implementation before the actual one.
In the research of this paper, the ambition has been to letting the purpose and the research
questions run through every chapter as a common thread. But as a reminder for the reader, the
research questions are restated and answered below.
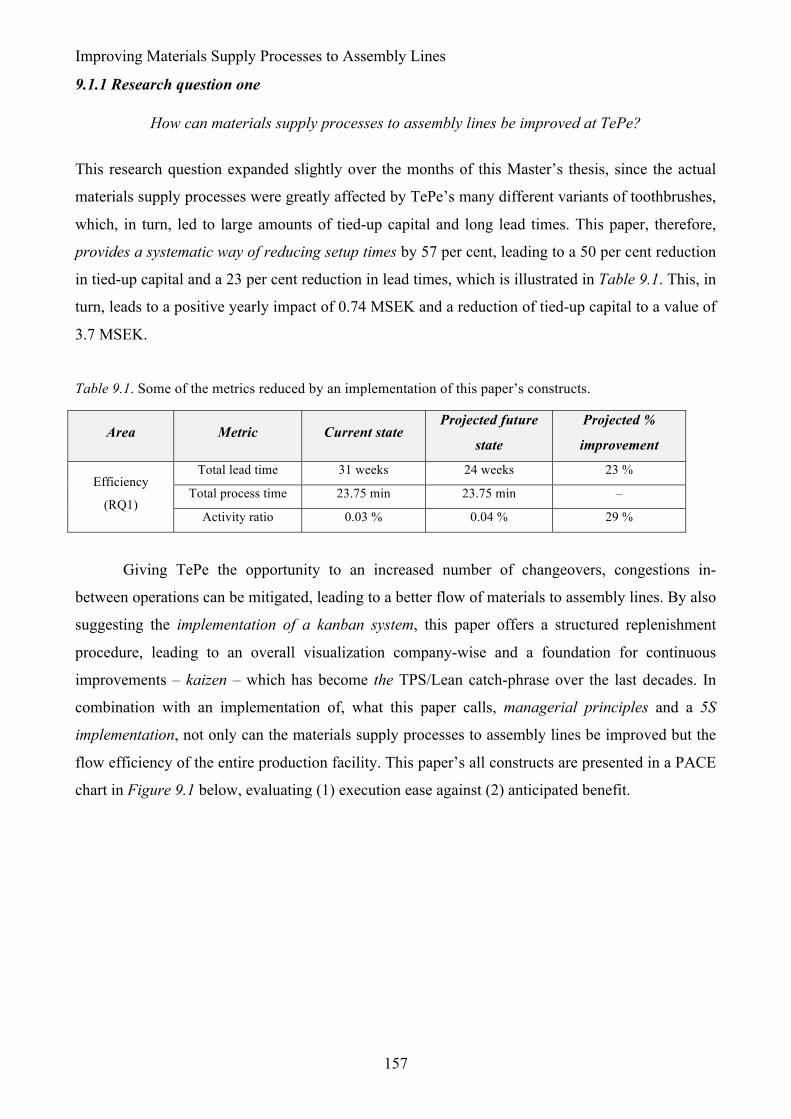
Improving Materials Supply Processes to Assembly Lines
157
9.1.1 Research question one
How can materials supply processes to assembly lines be improved at TePe?
This research question expanded slightly over the months of this Master’s thesis, since the actual
materials supply processes were greatly affected by TePe’s many different variants of toothbrushes,
which, in turn, led to large amounts of tied-up capital and long lead times. This paper, therefore,
provides a systematic way of reducing setup times by 57 per cent, leading to a 50 per cent reduction
in tied-up capital and a 23 per cent reduction in lead times, which is illustrated in Table 9.1. This, in
turn, leads to a positive yearly impact of 0.74 MSEK and a reduction of tied-up capital to a value of
3.7 MSEK.
Table 9.1. Some of the metrics reduced by an implementation of this paper’s constructs.
Area Metric Current state Projected future
state
Projected %
improvement
Efficiency
(RQ1)
Total lead time 31 weeks 24 weeks 23 %
Total process time 23.75 min 23.75 min –
Activity ratio 0.03 % 0.04 % 29 %
Giving TePe the opportunity to an increased number of changeovers, congestions in-
between operations can be mitigated, leading to a better flow of materials to assembly lines. By also
suggesting the implementation of a kanban system, this paper offers a structured replenishment
procedure, leading to an overall visualization company-wise and a foundation for continuous
improvements – kaizen – which has become the TPS/Lean catch-phrase over the last decades. In
combination with an implementation of, what this paper calls, managerial principles and a 5S
implementation, not only can the materials supply processes to assembly lines be improved but the
flow efficiency of the entire production facility. This paper’s all constructs are presented in a PACE
chart in Figure 9.1 below, evaluating (1) execution ease against (2) anticipated benefit.
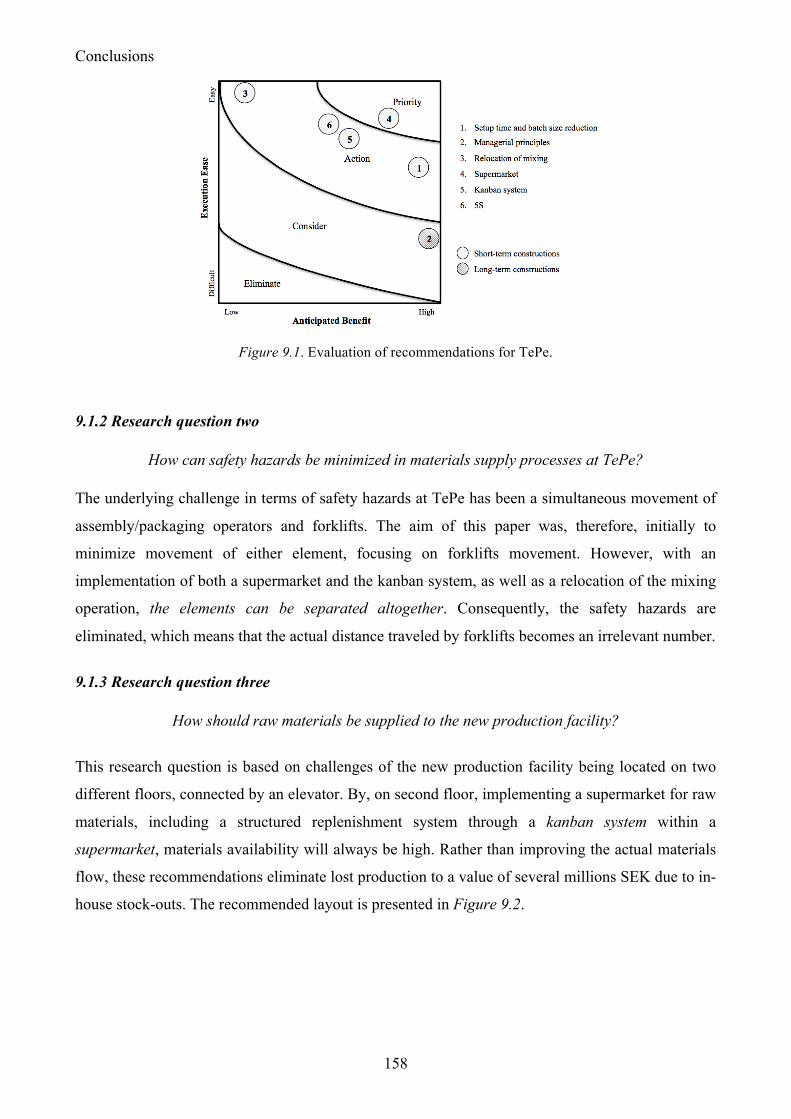
Conclusions
158
Figure 9.1. Evaluation of recommendations for TePe.
9.1.2 Research question two
How can safety hazards be minimized in materials supply processes at TePe?
The underlying challenge in terms of safety hazards at TePe has been a simultaneous movement of
assembly/packaging operators and forklifts. The aim of this paper was, therefore, initially to
minimize movement of either element, focusing on forklifts movement. However, with an
implementation of both a supermarket and the kanban system, as well as a relocation of the mixing
operation, the elements can be separated altogether. Consequently, the safety hazards are
eliminated, which means that the actual distance traveled by forklifts becomes an irrelevant number.
9.1.3 Research question three
How should raw materials be supplied to the new production facility?
This research question is based on challenges of the new production facility being located on two
different floors, connected by an elevator. By, on second floor, implementing a supermarket for raw
materials, including a structured replenishment system through a kanban system within a
supermarket, materials availability will always be high. Rather than improving the actual materials
flow, these recommendations eliminate lost production to a value of several millions SEK due to in-
house stock-outs. The recommended layout is presented in Figure 9.2.
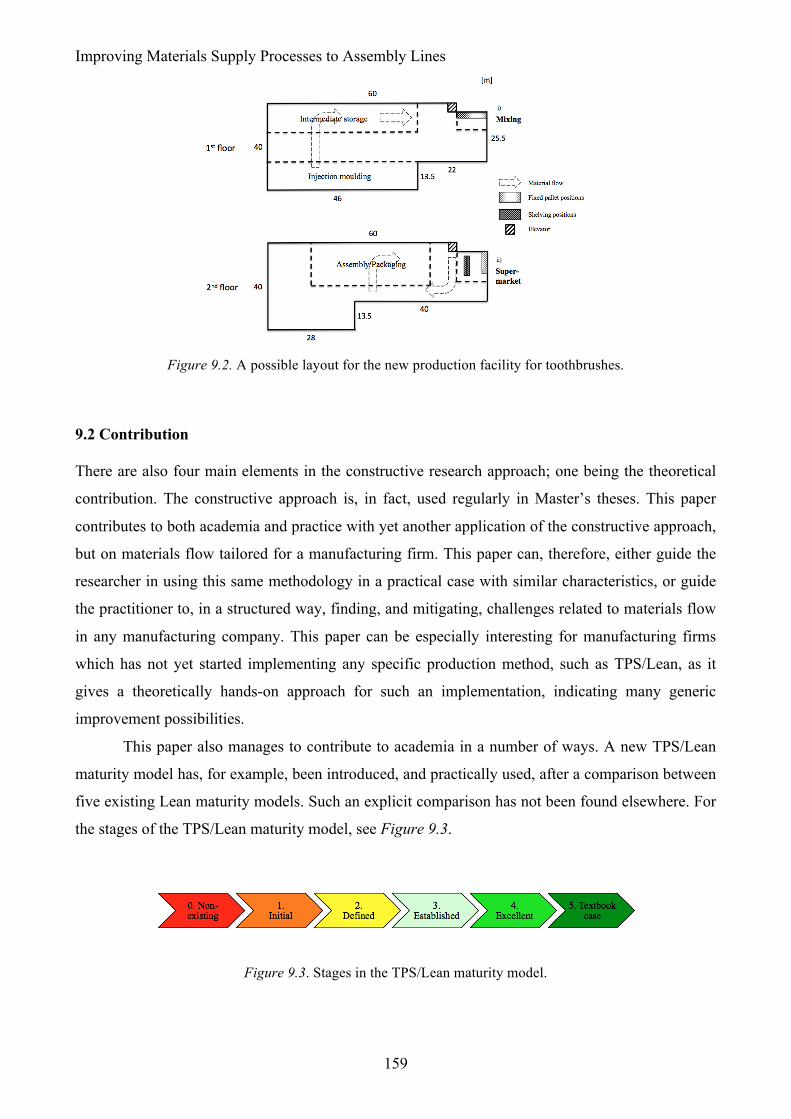
Improving Materials Supply Processes to Assembly Lines
159
Figure 9.2. A possible layout for the new production facility for toothbrushes.
9.2 Contribution
There are also four main elements in the constructive research approach; one being the theoretical
contribution. The constructive approach is, in fact, used regularly in Master’s theses. This paper
contributes to both academia and practice with yet another application of the constructive approach,
but on materials flow tailored for a manufacturing firm. This paper can, therefore, either guide the
researcher in using this same methodology in a practical case with similar characteristics, or guide
the practitioner to, in a structured way, finding, and mitigating, challenges related to materials flow
in any manufacturing company. This paper can be especially interesting for manufacturing firms
which has not yet started implementing any specific production method, such as TPS/Lean, as it
gives a theoretically hands-on approach for such an implementation, indicating many generic
improvement possibilities.
This paper also manages to contribute to academia in a number of ways. A new TPS/Lean
maturity model has, for example, been introduced, and practically used, after a comparison between
five existing Lean maturity models. Such an explicit comparison has not been found elsewhere. For
the stages of the TPS/Lean maturity model, see Figure 9.3.
Figure 9.3. Stages in the TPS/Lean maturity model.
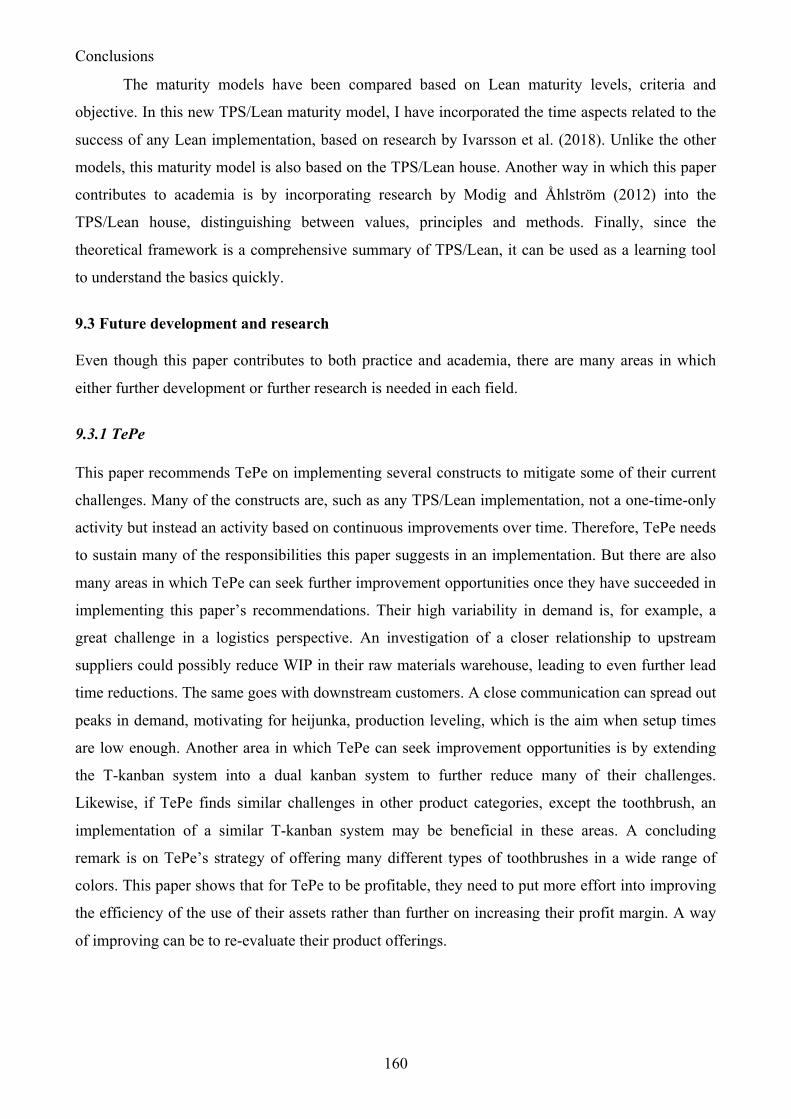
Conclusions
160
The maturity models have been compared based on Lean maturity levels, criteria and
objective. In this new TPS/Lean maturity model, I have incorporated the time aspects related to the
success of any Lean implementation, based on research by Ivarsson et al. (2018). Unlike the other
models, this maturity model is also based on the TPS/Lean house. Another way in which this paper
contributes to academia is by incorporating research by Modig and Åhlström (2012) into the
TPS/Lean house, distinguishing between values, principles and methods. Finally, since the
theoretical framework is a comprehensive summary of TPS/Lean, it can be used as a learning tool
to understand the basics quickly.
9.3 Future development and research
Even though this paper contributes to both practice and academia, there are many areas in which
either further development or further research is needed in each field.
9.3.1 TePe
This paper recommends TePe on implementing several constructs to mitigate some of their current
challenges. Many of the constructs are, such as any TPS/Lean implementation, not a one-time-only
activity but instead an activity based on continuous improvements over time. Therefore, TePe needs
to sustain many of the responsibilities this paper suggests in an implementation. But there are also
many areas in which TePe can seek further improvement opportunities once they have succeeded in
implementing this paper’s recommendations. Their high variability in demand is, for example, a
great challenge in a logistics perspective. An investigation of a closer relationship to upstream
suppliers could possibly reduce WIP in their raw materials warehouse, leading to even further lead
time reductions. The same goes with downstream customers. A close communication can spread out
peaks in demand, motivating for heijunka, production leveling, which is the aim when setup times
are low enough. Another area in which TePe can seek improvement opportunities is by extending
the T-kanban system into a dual kanban system to further reduce many of their challenges.
Likewise, if TePe finds similar challenges in other product categories, except the toothbrush, an
implementation of a similar T-kanban system may be beneficial in these areas. A concluding
remark is on TePe’s strategy of offering many different types of toothbrushes in a wide range of
colors. This paper shows that for TePe to be profitable, they need to put more effort into improving
the efficiency of the use of their assets rather than further on increasing their profit margin. A way
of improving can be to re-evaluate their product offerings.
Improving Materials Supply Processes to Assembly Lines
161
9.3.2 Academia
There are several examples mentioned above from which a researcher using the constructive
research approach can proceed another case study research. This paper would, anyhow, have been
strengthened further in terms of external validity if there was a multiple case study including several
companies. Therefore, such an investigation would, with higher certainty, pinpoint how any degree
of TPS/Lean implementation affects a company’s overall performance in practice. Moreover, this
paper assumes a TPS/Lean implementation to be superior other change efforts in terms of suitability
for TePe. This can, however, be argued, since TePe also demonstrates characteristics, like many
other companies, moving towards a more customised production with higher profit margins. A
future research focus can, hence, be to investigate a development of this paper’s TPS/Lean
suggestions into more Leagile recommendations. It would be of great interest to, for example, study
a postponement of product customization in any manufacturing firm, but especially in TePe’s value
stream.55 Another future research focus would be to test and investigate this paper’s TPS/Lean
maturity model on several other cases, as well as critically assessing it against other Lean maturity
models.
55 One could consider studying the effects of postponing color differences in the value stream of toothbrushes. In a Leagile value stream, all toothbrushes would, for example, be injection moulded in a standard color. The agile value stream would start in assembly/packaging, in which the product is customized with a wide range of colors for filaments.
References
162
References Al-Aomar, R.A. (2011). Applying 5S Lean technology. World Academy of Science, Engineering
and Technology, Vol. 60, pp. 1606-1611.
Albliwi, S.A. (2017). Lean Six Sigma maturity level within Saudi Arabian organizations: An
empirical study (Doctoral dissertation, Herriot-Watt University, Edinburgh, Scotland).
Retrieved from https://ethos.bl.uk.
Alizon, F., Dallery, Y., Essafi, I & Feillet, D. (2009). Optimising material handling costs in an
assembly workshop. International Journal of Production Research, Vol. 47, Issue 14, 3853-
3866.
Arbnor, I. & Bjerke. B (2009). Methodology for creating business knowledge (3rd ed.). London,
UK: Sage Publication.
Assen, van M. (2018). Process orientation and the impact on operational performance and
customer-focused performance. Business Process Management Journal, Vol. 24, No. 2, pp.
446-458.
Azzi, Battini, Faccio, Persona & Sgarbossa (2014). Inventory holding costs measurement: A multi-
case study. The International Journal of Logistics Management, Vol. 25, No. 1, pp. 109-
132.
Bell, J. & Waters, S. (2014). Introduktion till forskningsmetodik. Lund, Sweden: Studentlitteratur
AB.
Bhamu, J. & Sangwan, K.S. (2014). Lean manufacturing: literature review and research issues.
International Journal of Operations & Production Management, Vol. 34, No. 7, 876-940.
Binti Aminuddin, N.A., Garza-Reyes, J.A., Kumar, V., Antony, J. & Rocha-Lona, L. (2016). An
analysis of managerial factors affecting the implementation and use of overall equipment
effectiveness. International Journal of Production Research, Vol. 54, Issue 15, pp. 4430-
4447.
Bjurström, J. (2016). Bortom lean: 12 steg för en verksamhet i världsklass. Malmö: Rood &
Tegnér.
Botti, L., Mora, C. & Regattieri, A. (2017). Integrating ergonimics and lean manufacturing
principles in a hybrid assembly lines. Computers and Industrial Engineering, Vol. 111, pp.
481-491.
Brewer, P.C. & Speh, T.W. (2000). Using the balanced scorecard to measure supply chain
performance. Journal of Business Logistics, Vol. 21, No. 1, pp. 75-93.
Improving Materials Supply Processes to Assembly Lines
163
Celeste, R.K., Listl, S., Peres, M. & Watt, R. (2019). Oral diseases: a global public health challenge.
The Lancet, Vol. 394, Issue 10194, 249-260.
Chand, S. (2015, June 9). Outline process flow chart: Method study (with statistics). Retrieved from
http://www.yourarticlelibrary.com.
Chater, B.V. & Warren, P.R. (1996). An overview of established interdental cleaning methods. The
Journal of Clinical Dentistry. Vol. 7, No. 3, 65-69.
Chauhan, G. & Chauhan, V. (2019). A phase-wise approach to implement lean manufacturing.
International Journal of Lean Six Sigma, Vol. 10, No. 1, pp. 106-122.
Chen, J.C., Li, Y. & Shady, B.D. (2010). From value stream mapping toward a lean/sigma
continuous improvement process: An industrial case study. International Journal of
Production Research, Vol. 48, No. 4, pp. 1069-1086.
Choo, A., Delac, D.M. & Messer, L.B. (2001). Oral hygiene measures and promotion: Review and
considerations. Australian Dental Journal. Vol. 46, No. 3, 166-173.
Christopher, M. & Towill, D.R. (2000). Supply chain migration from lean and functional to agile
and customised. Supply Chain Management: An International Journal, Vol. 5, Issue 4,
pp.206-213.
Christopher, M. (2005). Logistics and supply chain management: Creating value-adding networks
(3rd ed.). Harlow, Great Britain: Pearson Education.
Cortes-Robles, G., García-Alcaraz, J.L., Maldonado-Macías, A.A. (2014). Lean manufacturing in
the developing world: Methodologies, case studies and trends in Latin America.
Switzerland: Springer International Publishing.
Cudney, E.A. & Elrod, C.C. (2011). A comparative analysis of integrating lean concepts into supply
chain management in manufacturing and service industries. International Journal of Lean
Six Sigma, Vol. 2, No. 1, 5-22.
Dahlgaard, J.J. & Dahlgaard-Park, S.M. (2006). Lean production, six sigma quality, TQM and
company culture. The TQM Magazine, Vol. 18, Issue 3, pp. 263-281.
Davies, A., Thomas, A.J., John, E.G. (2014). Minimising transportation in manufacturing supply
chains. International journal of sustainable engineering. Vol. 7, Issue 2, 144-153.
Davies, I.K. (1997). Process re-design for enhanced human performance. Performance
Improvement Quarterly, Vol. 10, Issue 1, 265-274.
De Broglie, L. (1962). New perspectives in physics. USA: Basic Books.
Dinis-Carvalho, J., Guimaraes, L., Pinto Leao, C. & Sousa, R.M. (2019). Waste identification
diagram and value stream mapping. Internation Journal of Six Sigma, Vol. 10, No. 3, 767-
783.
References
164
Dul, J. & Hak, T. (2008). Case study methodology in business research (1st ed.). Oxford, UK:
Butterworth-Heinemann
Eisenhardt, K.M. (1989). Building theories from case study research. The Academy of Management
Review, Vol. 14, No. 4, pp. 532-550.
Ellis, K.P., Marchand, F., Meller, R.D., Parikh, P.J. & Wilck, J.H. (2010). Effective material flow at
an assembly facility. International Journal of Production Research, Vol. 48, Issue 23, 7195-
7217.
Ellram, L.M. (1996). The use of the case study methods in logistics research. Journal of Business
Logistics Vol. 17, No. 2.
Flick, U. (2015). Introducing research methodology: A beginner’s guide to doing a research
project. London, UK: SAGE Publication.
Gammelgaard, B. (2004). Schools in logistics research? A methodological framework for analysis
of discipline. International Journal of Physical Distribution & Logistics Management, Vol.
34, No. 6, pp. 479-491.
Gonçalves, M.T. & Salonitis, K. (2017). Lean assessment tool for workstation design of assembly
lines. Procedia CIRP Vol. 60, 386-391.
Graves, S.C., Rinnooy Kan, A.H.G. & Zipkin, P.H (1993). Logistics of production and inventory,
Vol. 4. Netherlands: North Holland Publishing.
Green, J.C., Lee, J. & Kozman, T.A. (2010). Managing lean manufacturing in material handling
operations. International Journal of Production Research, Vol. 48, Issue 10, pp. 2975-2993.
Haldórsson, A. & Aastrup, J. (2003). Quality criteria for qualitative inquiries in logistics. European
Journal of Operational Research, Vol. 144, pp. 321-332.
Hall, R.W. (1987). Attaining manufacturing excellence. Homewood, IL: Dow Jones-Irwin.
Hallgren, M. & Olhager, J. (2009). Lean and agile manufacturing: External and internal drivers and
performance outcomes. International Journal of Operations & Production Management,
Vol. 29, No. 10, pp. 976-999.
Handfield, R.B. & Melnyk, S.A. (1998). The scientific theory-building process: a primer using the
case of TQM. Journal of Operations Management, Vol. 16, pp. 321-339.
Harrison, A. & van Hoek, R. (2008). Logistics management and strategy: Competing through the
supply chain (3rd ed.). Edinburgh Gate, Harlow, UK: Pearson Education.
Hedrick, P.E., Bickman, L. & Rog, D.J. (2011). The Nature of Applied Research. Thousand Oaks,
USA: Sage Publications.
Hines, P. & Rich, N. (1997). The seven value stream mapping tools. International Journal of
Operations & Production Management, Vol. 17, No. 1, 46-64.
Improving Materials Supply Processes to Assembly Lines
165
Höst, M., Regnell, B. & Runeson, P. (2006). Att genomföra examensarbete. Lund, Sweden:
Studentlitteratur AB.
Islam, S. (2016). Credit card account opening excellence using six sigma methodology.
International Journal of Lean Six Sigma, Vol. 7, Issue 3, pp. 294-323.
Ismael, A., Ghani, J.A., Ab Raman, M.N., Md Deros, B., Che Haron, C.H. (2014). Application of
Lean Six Sigma Tools for Cycle Time Reduction in Manufacturing: Case Study in
Biopharmaceutical Industry. Arabic Journal of Sciencific Engineering, Vol. 39, 1449-1463.
Ivarsson, H., Molin, C., Lishajko, I., Wiestål, J. & Johnsson, F.B. (2018). 50 shades of Lean: Why
only a few succeed. Sweden: The Authors.
Jarrell, K.A. & McLain, D.L. (2007). The perceived compatibility of safety and production
expectations in hazardous occupations. Journal of Safety Research Vol. 38, Issue 3, 299-
309.
Johansson, E. & Johansson, M. (2006). Materials supply systems design in product development
projects. International Journal of Operations & Production Management, Vol. 26, No. 4,
371-393.
John, A., Meran, R., Roenpage, O. & Staudter, C. (2008). Sig sigma + lean toolset: Executing
improvement projects successfully. Frankfurt, Germany: Springer-Verlag.
Kalman, H.K. (2002). Process mapping: Tools, techniques, & critical success factors. Performance
Improvement Quarterly, Vol. 15, Issue 4, pp. 57-73.
Kaplan, R.S. & Norton, D.P. (2007). Using the balanced scorecard as a strategic management
system. Harvard Business Review, Vol. 85, Issue 7/8, pp. 150-161.
Kasanen, E., Lukka, K. & Siitonen, A. (1993). The constructive approach in management
accounting research. Journal of Management Accounting Research, Vol 5, pp. 243-264.
Kembro, J.H., Norrman, A. & Eriksson, E. (2018). Adapting warehouse operations and design to
omni-channel logistics: A literature review and research agenda. International Journal of
Physical Distribution & Logistics Management, Vol. 48, Issue 9, pp. 890-912.
Kvale, S. (1988). The 1000-page question. Phenomenology + Pedagogy, Vol. 6, Issue 2, 90-106.
Laurie, C. & Jensen, E.A. (2016). Doing real research. Thousand Oaks, CA, USA: SAGE
Publications.
Li, S., Ragu-Nathan, B., Ragu-Nathan, T.S. & Rao, S.S. (2006). The impact of supply chain
management practices on competitive advantage and organizational performance. Omega,
Vol. 34, Issue 2, 107-124.
Liker, J.K. (2004). The Toyota way: 14 management principlesfrom the world’s greatest
manufacturer. Two Penn Plaza, NY: McGraw-Hill.
References
166
Lund University, Research portal. (n.d.). Retrieved February 11, 2020 from
https://portal.research.lu.se/portal/en/persons/andreas-norrman(4db7a048-2457-44c4-89d3-
c8d4292a01aa).html.
Maasouman, M.A. & Demirli, K. (2016). Development of a lean maturity model for operational
level planning. International Journal of Advanced Manufacturing Technology, Vol. 83, pp.
1171-1188.
Maier, A.M., Moultrie, J. & Clarkson, P.J. (2012). Assessing organizational capabilities: Reviewing
and guiding the development of maturity grids. IEEE Transaction on Engineering
Management, Vol. 59, No. 1, pp. 138-159.
Martin, K. & Osterling, M. (2014). Value stream mapping: How to visualize work and align
leadership for organizational transformation. USA: McGraw-Hill Education.
Mattsson, S-A. & Jonsson, P. (2003). Produktionslogistik. Lund, Sweden: Studentlitteratur.
Mentzer, J.T. & Kahn, K.B. (1995). A framework of logistics research. Journal of Business
Logistics, Vol. 16, Issue 1, pp. 231-250.
Meredith, J.R. & McTavish, R. (1992). Organized manufacturing for superior market performance.
Long Range Planning, Vol. 25, No. 6, 63-71.
Meudt, T., Metternoch, J. & Abele, E. (2017). Value stream mapping 4.0: Holistic examination of
value stream and information logistics in production. CISP Annals – Manufacturing
Technology, Vol. 66, 413-416.
Miles, M.B. & Huberman, A.M. (1994). Qualitative data analysis: An expanded sourcebook.
Thousand Oaks, CA, USA: SAGE Publications.
Miri-Lavassani, K. & Movahedi, B. (2018). Achieving higher supply chain performance via
business process orientation. Business Process Management Journal, Vol. 24, No. 3, pp.
671-694.
Modig, N. & Åhlström, P. (2012). Detta är lean: Lösningen på effektivitetsparadoxen (2nd ed.).
Stockholm, Sweden: Stockholm School of Economics Institute for Research.
Monden, Y. (2011). Toyota production system: An integrated approach to just-in-time. NY, USA:
Press Productivity.
Nolato (2019). Annual report 2018. Retrieved February 20, 2020, from
https://www.nolato.com/en/investor-relations/nolato-annual-report.
Nolato a, Nolatos affärsidé och affärsmodell. (n.d.). Retrieved 20 February, 2020, from
https://www.nolato.se/sv-SE/investerare/affarside-och-affarsmodell.
Nolato b, Medical Solutions business area. (n.d.). Retrieved 20 February, 2020, from
https://www.nolato.com/en/nolato-group/medical-solutions-business-area.
Improving Materials Supply Processes to Assembly Lines
167
Nolato c, Medical Excellence tool to create a world class business. Retrieved 20 February, 2020,
from https://www.nolato.com/en/case-articles/medical-excellence.
Nolato d, Our vision and how we shall achieve it. Retrieved 20 February, 2020, from
https://www.nolato.com/en/investor-relations/our-vision-and-how-we-shall-achieve-it.
Novak, R. & Janeš, A. (2019). Business process orientation in the Slovenian prwer supply. Business
Process Management Journal, Vol. 25, No. 4, pp. 780.798.
Näslund, D. (2002). Logistics need qualitative research – especially action research. International
Journal of Physical Distribution and Logistics Management, Vol. 32, Issue 5, pp. 321-338.
Näslund, D. (2008). Lean, six sigma and lean sigma: fads or real process improvement methods.
Business Process Management Journal, Vol. 14, Issue 3, pp. 269-287.
Näslund, D. (2013). Lean and six sigma – critical success factors revisited. International Journal of
Quality and Service Sciences, Vol. 5, No. 1, pp. 86-100.
Näslund, D. & Norrman, A. (2019). A performance measurement system for change initiatives: An
action research study from design to evaluation. Business Process Management Journal,
Vol. 25, Issue 7, pp. 1647-1672.
Ogbadu, E.E. (2009). Profitability through effective management of materials. Journal of
Economics and International Finance, Vol. 1, Issue 4, pp. 99-105.
Ohno, T. (1988). Toyota production system: Beyond large-scale production. Broken Sound
Parkway, NW. CRC Press.
Olhager (2013). Produktionsekonomi: Principer och metoder för utformning, styrning och
utveckling av industriell production. Lund, Sweden: Studentlitteratur AB.
Patel, R. & Davidson, B. (2011). Forskningsmetodikens grunder: Att planera, genomföra och
rapportera en undersökning. Lund, Sweden: Studentlitteratur AB.
Patton, M.Q. (1999). Enhancing the quality and credibility of qualitative analysis. Health Service
Research, Vol. 34, Issue 5, Pt. II., pp. 1189-2008.
Pech, M. & Vaněček, D. (2018). Methods of lean production to improve quality in manufacturing.
Quality Innovation Prosperity, Vol. Vol. 22, Issue 2.
Pedrosa, A. da Mota, Näslund, D. & Jasmand, C. (2012). Logistics case study based research:
towards higher quality. International Journal of Physical Distribution & Logistics
Management, Vol. 42, No. 3, pp. 275-295.
Persson, G. (1996). Logistik för konkurrenskraft (2nd ed.). Malmö, Sweden: Liber-Hermods.
Pettersen, J. (2008). Defining Lean production: Some conceptual and practical issues. Quality
Management and Organizational Development Conference, pp. 285-300.
References
168
Pigosso, D.C.A., Rozenfeld, H. & McAloone, T.C. (2013). Ecodesign maturity model: A
management framwork to support ecodesign implementation into manufacturing companies.
Journal of Cleaner Production, Vol. 59, pp. 160-173.
Rampasso, I.S., Anholon, R., da Silva, D., Ordóñez, R.E.C. & Quelhas, O.L.G. (2019). Maturity
analysis of manufacturing cells. Production Planning & Control, Vol. 30, No. 15, pp. 1250-
1264.
Rowley, J. & Slack, F. (2004). Conducting a literature review. Management Research News, Vol.
27, Issue 6, 31-39.
Rother, M. & Harris, R. (2001). Creating continuous flow: An action-guide for managers, engineers
and production associates. MA, USA: The Lean Enterprize Institute.
Rother, M. & Shook, J. (1999). Learning to see: Value-stream mapping to create value and
eliminate muda. Lean Enterprise Institute.
Röglinger, Pöbbeöbuß & Becker (2012). Mturity models in business process management. Business
Process Management Journal, Vol. 18, No. 2, pp. 328-346.
Runesson, P. & Höst, M. (2008). Guidelines for conducting and reporting case study research in
software engineering. Empirical Software Engineering, Vol. 14 (2).
Rüttiman, B.G. (2018). Lean compendium: Introduction to modern manufacturing theory. Zürich,
Switzerland: Springer International Publishing.
Šajeva, S. (2009). Critical analysis of knowledge management maturity models and their
components. Žinių Valdymo Brandumo Vertinimo Modelių Ir Jų Komponentų Kritinė
Analizė. Economics & Management, Vol. 14, pp 611-623.
Salunkhe, R.T & Shinge, A.R. (2018). Value stream mapping to reduce lead-time and improve
throughput time in a manufacturing organization: a review. Journal of Operations
Management, Vol. 17, Issue 3, 42-45.
Santos Bento, G. dos & Tontini, G. (2018). Developing an instrument to measure lean
manufacturing maturity and its relationship with operational performance. Total Quality
Management, Vol. 29, No. 9, pp. 977-995.
Schonberger, R.J. (1983). Japansk kvalitet och produktivitet: Nio lektioner i enkelhet. Lund,
Sweden: LiberFörlag.
Shah, R. & Ward, P.T. (2007). Defining and developing measures of lean production. Journal of
Operations Management, 25, 785-805.
Shah, R. & Ward, P.T. (2003). Lean manufacturing: context, practise bundles, and performance.
Journal of Operations Management, 21, pp. 129-149.
Shingo, S. (1984). Den nya japanska produktionsfilosofin. Tokyo, Japan: Japan Management.
Silverman, D. (2005). Doing Qualitative Research (2nd ed.). London, UK: SAGE Publications.
Improving Materials Supply Processes to Assembly Lines
169
Stalk, G. Jr. & Hout, T.M. (1990). Competing against time: How time-based competition is
reshaping global markets. New York, USA: Free Press/MacMillan.
Stuart, I., Handfield, R., McCutcheon, D., McLachlin, R., Samson, D. (2002). Effective case
research in operations management: a process perspective. Journal of Operations
Management, 20, 419-433.
Stake, R.E. (1995). The Art Of Case Study Research. Thousand Oaks, CA: SAGE Publications.
Sundar, R., Balaji, A.N., SatheeshKumar, R.M. (2014). A review on lean manufacturing
implemention techniques. Procedia Engineering, Vol. 97, pp. 1875-1885.
Suzaki, K. (1985). Japanese manufacturing techniques: Their importance to U.S. manufacturers.
Journal of Business Strategy, Vol. 5, Issue 3, 10-19.
TePe a, About TePe: Over 50 years in oral health. (n.d). Retrieved November 2, 2019, from
https://group.tepe.com/about-tepe/.
TePe b, Odontology: Odontology (n.d). Retrieved November 2, 2019, from
https://group.tepe.com/odontology/.
TePe c, Our products in short: Our products (n.d). Retrieved November 2, 2019, from
https://group.tepe.com/our-products-in-short/.
TePe d, Vetenskapliga studier: Interdental brushes (n.d). Retrieved November 2, 2019, from
https://www.tepe.com/uk/for-professionals/research/.
TePe e, TePe Products (n.d.). Retrieved November 2, 2019, from
https://www.tepe.com/uk/products/.
TePe f, Departments (n.d.). Retrieved February 22, 2020, from
https://karriar.tepe.com/departments/.
TePe g (2019). Sustainability report 2018. Retrieved February 22, 2020, from
https://group.tepe.com/media/2623/sustainability_report_2018_hr_6128.pdf.
TePe h (2019). Annual report 2018. Retrieved February 22, 2020, from http://web.retriever-
info.com.ludwig.lub.lu.se/services/businessinfo/displayBusinessInfo?orgnum=5562246487
&country=SE.
United Nation a, Sustainable Development Goals (n.d.). Retrieved February 22, 2020, from
https://sustainabledevelopment.un.org/?menu=1300.
Uriarte, A.G., Ng, A.H.C., Moris, M.U. & Jägstam, M. (2017). Lean, simulation and optimization:
A maturity model. IEEE International Conference on Industrial Engineering and
Engineering Management (IEEM), Singapore, pp. 1310-1315.
Vistamation (2020). Super Duty 14 Gauge Shelving (n.d.). Adapted April 10, 2020, from
https://www.vistamation.com/products/super-duty-14-gauge-shelving/?F_All=Y.
References
170
Voss, C., Tsikriktsis, N. & Frohlich, M. (2002). Case research in operations management.
International Journal of Operations & Production Management, Vol. 22, No. 2, pp. 195-
219.
Whyte, W. (2004). Cleanroom technology: Fundamentals of design, testing and operation.
Chichester, UK: Wiley.
Womack, J.P., Jones, D.T. & Roos, D. (1990). The machine that changed the world. Third Avenue,
NY: Macmillan Publishing Company.
Womack, J.P. & Jones, D.T. (1996). Beyond Toyota: How to root out waste and pursue perfection.
Harvard Business Review, Sep-Oct.
Yamashina, H. (1982). Japansk tillverkningsfilosofi och Kanban-systemet. Stockholm, Sweden:
Sverige Mekanförbund.
Yin, R.K. (2003). Applications of Case Study Research (2nd edition). Thousand Oaks, CA: SAGE
Publications.
Yin, R.K. (2014). Case Study Research: Design and Methods (5th ed.). Thousand Oaks, CA: SAGE
Publications.
Yin, R.K. & Davis, D. (2007). Adding new dimensions to case study evaluations: The case of
evaluating comprehensive reforms. Informing federal policies for evaluation methodology.
No. 113, pp. 75-93. San Fransisco: Jossey-Bass.
Yüksel, H. & Uzunovic, Z.F. (2019). Application of value stream mapping in a manufacturing firm
in Bosnia Herzegovina. Journal of Management & Economics. Vol. 26, Issue 1, pp. 201-
219.
Zuting, K.R., Mohapatra, P., Daultani, Y. & Tiwari, M.K. (2014). A synchronized strategy to
minimize vehicle dispatching time: A real example of steel industry. Advances in
manufacturing, Vol. 2, Issue 4, pp. 333-343.
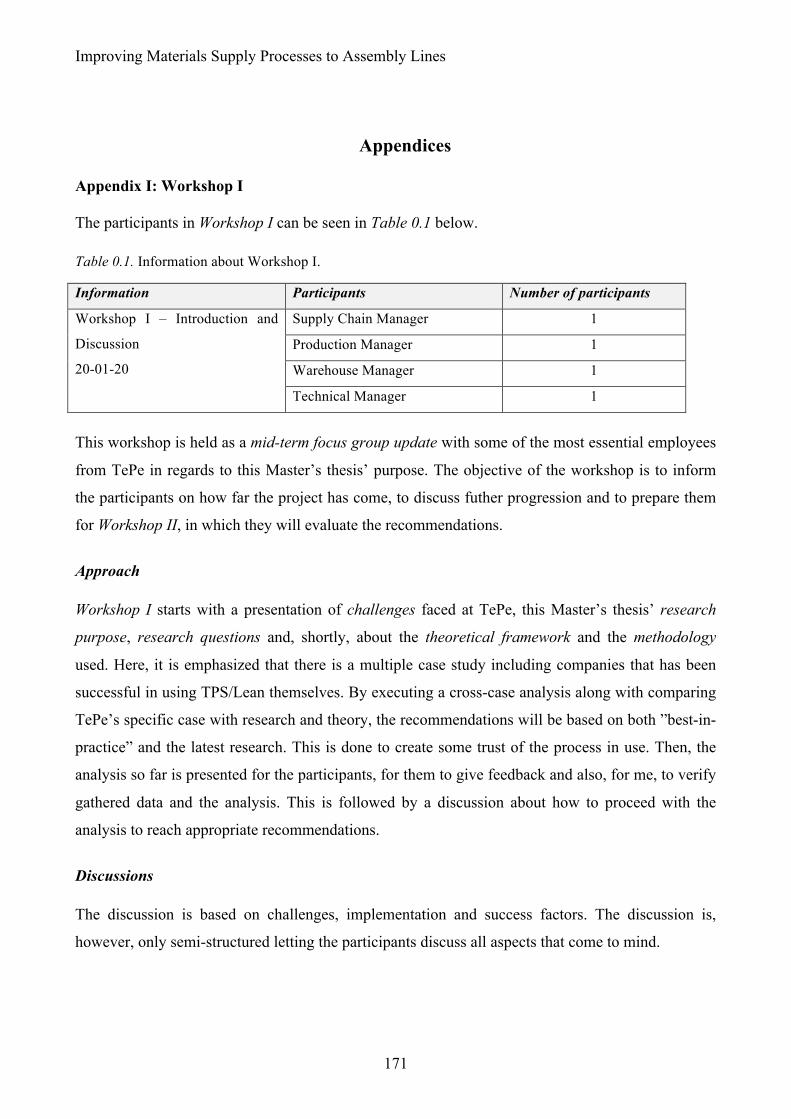
Improving Materials Supply Processes to Assembly Lines
171
Appendices
Appendix I: Workshop I
The participants in Workshop I can be seen in Table 0.1 below. Table 0.1. Information about Workshop I.
Information Participants Number of participants
Workshop I – Introduction and
Discussion
20-01-20
Supply Chain Manager 1
Production Manager 1
Warehouse Manager 1
Technical Manager 1
This workshop is held as a mid-term focus group update with some of the most essential employees
from TePe in regards to this Master’s thesis’ purpose. The objective of the workshop is to inform
the participants on how far the project has come, to discuss futher progression and to prepare them
for Workshop II, in which they will evaluate the recommendations.
Approach
Workshop I starts with a presentation of challenges faced at TePe, this Master’s thesis’ research
purpose, research questions and, shortly, about the theoretical framework and the methodology
used. Here, it is emphasized that there is a multiple case study including companies that has been
successful in using TPS/Lean themselves. By executing a cross-case analysis along with comparing
TePe’s specific case with research and theory, the recommendations will be based on both ”best-in-
practice” and the latest research. This is done to create some trust of the process in use. Then, the
analysis so far is presented for the participants, for them to give feedback and also, for me, to verify
gathered data and the analysis. This is followed by a discussion about how to proceed with the
analysis to reach appropriate recommendations.
Discussions
The discussion is based on challenges, implementation and success factors. The discussion is,
however, only semi-structured letting the participants discuss all aspects that come to mind.
Appendices
172
Challenges
The 7 wastes are discussed, in which the participants conclude that they lack in fulfilling to
minimize several categories, such as overproduction, excess inventory and unnecessary
transportation. Some specific challenges at TePe, which have been discovered through
observations, are discussed, such as long lead times, long waiting times and long setup times, and
what causes them. Large batch sizes is one, while mixing colors is another.
There is also a lot of transportation of raw materials, handles and toothbrushes in general,
which is time consuming and resource inefficient. Moreover, there are bottlenecks in injection
moulding as well as machines having quite some downtime, giving an unbalanced flow. In addition,
mixing colors requires quite some space within the warehouse today, which reduces safety for both
assembly operators and warehousing operators.
Moreover, challenges that TePe meet in their expansion phase with the movement of the
production plant is discussed further. The materials flow to the second floor, where the assembly
and packaging will take place, is the greatest challenge since there is only one elevator in which
material can be transported.
Finally, there is also a discussion of the components in the efficiency matrix presented by
Modig and Åhlström (2012), in which the participants agree on that TePe is far more resource
efficient than flow efficient.
Implementation
Possible solutions that could solve some of the challenges TePe faces are briefly discussed. Since
large batch sizes is a challenge, changing batch sizes from pallets into transportation boxes which fit
300 handles each is suggested, and the participants concurred that it is a solution worth
investigasting. This goes in line with TPS/Lean, which encourages smaller batches, even though a
one-piece flow is theoretically optimal.
Regarding long setup times, I mention a possible solution using SMED, which has been
exemplified by Shingo (1984, p. 130) to reduce setup times in several cases into 1/10 to 1/60 of a
machine’s initial setup time. A participant addresses that there can be resistance to a tool alike from
operators who have managed some machines for several years. But the participants also agree on it
being a tool worth considering.
Lean tools such as the pareto chart and the product family matrix are discussed as well. The
participants verify the idea of the project to be focusing on one high-volume product and one low-
volume product to understand the materials flow of different products. However, there is suggested
for me not to focus very much on the layout of machines in the new production plant since that is
Improving Materials Supply Processes to Assembly Lines
173
already prepared for. Instead, a recommendation which suits the challenges faced with the new
production plant is of priority. Questions to consider in addition to the research questions:
! How is material going to flow from inventory to the assembly lines and back?
! How much material is needed for the assembly lines?
! Layout of intermediate storage?
Success factors
The majority of the participants agreed on success factors for the recommendations of this Master’s
thesis to be simplicity and good assumptions. These characteristics will most likely guide a future
implementation of the constructs recommended, according to participants. Another success factor is
for the recommendations to be based on illustrative analyses, such as the VSM presented during the
workshop. The VSM clearly shows a waiting time of 7.5 months while the processing time is some
23 minutes. According to the production manager, it is important for employees to understand such
a difference for them to accept a change.
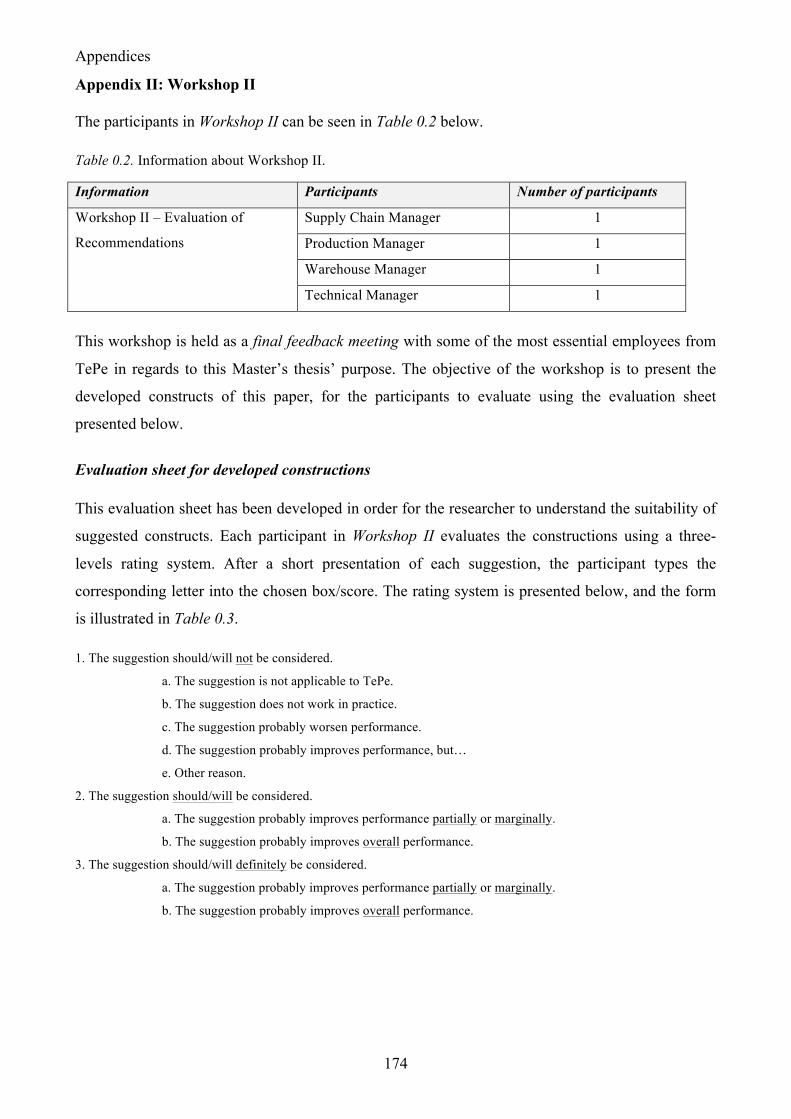
Appendices
174
Appendix II: Workshop II
The participants in Workshop II can be seen in Table 0.2 below. Table 0.2. Information about Workshop II.
Information Participants Number of participants
Workshop II – Evaluation of
Recommendations
Supply Chain Manager 1
Production Manager 1
Warehouse Manager 1
Technical Manager 1
This workshop is held as a final feedback meeting with some of the most essential employees from
TePe in regards to this Master’s thesis’ purpose. The objective of the workshop is to present the
developed constructs of this paper, for the participants to evaluate using the evaluation sheet
presented below.
Evaluation sheet for developed constructions
This evaluation sheet has been developed in order for the researcher to understand the suitability of
suggested constructs. Each participant in Workshop II evaluates the constructions using a three-
levels rating system. After a short presentation of each suggestion, the participant types the
corresponding letter into the chosen box/score. The rating system is presented below, and the form
is illustrated in Table 0.3.
1. The suggestion should/will not be considered.
a. The suggestion is not applicable to TePe.
b. The suggestion does not work in practice.
c. The suggestion probably worsen performance.
d. The suggestion probably improves performance, but…
e. Other reason.
2. The suggestion should/will be considered.
a. The suggestion probably improves performance partially or marginally.
b. The suggestion probably improves overall performance.
3. The suggestion should/will definitely be considered.
a. The suggestion probably improves performance partially or marginally.
b. The suggestion probably improves overall performance.
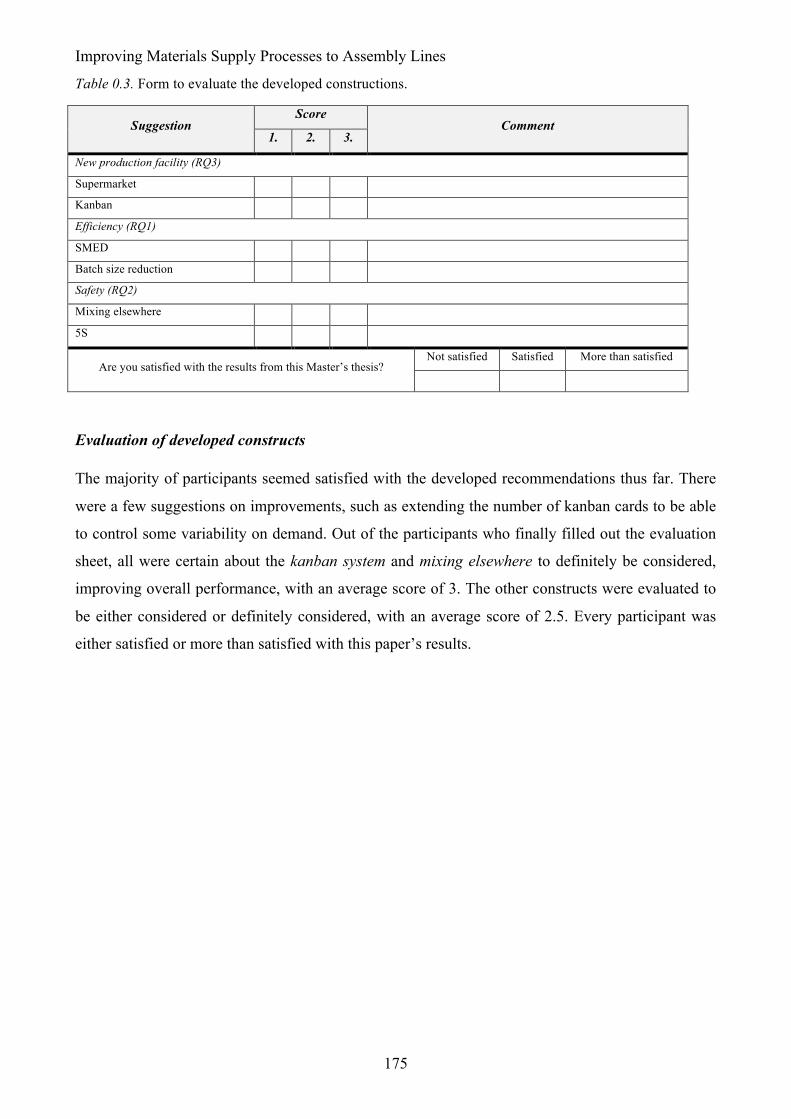
Improving Materials Supply Processes to Assembly Lines
175
Table 0.3. Form to evaluate the developed constructions.
Suggestion Score
Comment 1. 2. 3.
New production facility (RQ3)
Supermarket
Kanban
Efficiency (RQ1)
SMED
Batch size reduction
Safety (RQ2)
Mixing elsewhere
5S
Are you satisfied with the results from this Master’s thesis? Not satisfied Satisfied More than satisfied
Evaluation of developed constructs
The majority of participants seemed satisfied with the developed recommendations thus far. There
were a few suggestions on improvements, such as extending the number of kanban cards to be able
to control some variability on demand. Out of the participants who finally filled out the evaluation
sheet, all were certain about the kanban system and mixing elsewhere to definitely be considered,
improving overall performance, with an average score of 3. The other constructs were evaluated to
be either considered or definitely considered, with an average score of 2.5. Every participant was
either satisfied or more than satisfied with this paper’s results.
Appendices
176
Appendix III: Case Study Protocol I. Overview of the Case Study
1. Research Purpose:
The purpose of this thesis is to improve the materials supply processes to assembly
lines in a manufacturing production facility through process mapping and lean
manufacturing, and recommend TePe on improvements.
2. Goals:
The thesis provides TePe with a better understanding of their materials supply
processes and suggests improvements in their expansion of the production facility. For
academia, the results will clarify difficulties in having efficient materials supply
processes to assembly lines in a manufacturing industry. For me, personally, I will
learn a great deal about the subject and get some real-life experience from the industry
along with better researching skills.
3. Unit of Analysis
The unit of analysis of the thesis is defined as materials supply processes to assembly
lines in the production facility of a manufacturing company.
4. Research Questions
A. How can materials supply processes to assembly lines at TePe be improved
through process mapping and lean manufacturing?
B. Why is the materials supply processes at TePe bringing safety hazards? How can
these safety hazards be minimized?
C. How should raw materials be supplied to the new production facility?
5. Theoretical Framework:
The theoretical framework for this thesis is existing literature reviewed in the area of
Lean manufacturing (LM) and Toyota production system (TPS). There are several
must-reads in the literature, e.g. Schonberger (1983), Ohno (1988), Womack et al.
(1990), Shingo (1984), Liker (2004) and Rother and Shook (2004).
Improving Materials Supply Processes to Assembly Lines
177
II. Data Collection Procedures
1. Collecting Evidence
A. Direct observations56
• Spending a lot of time in the production facility
o Ohno circle
o Observe material flow, processes, the work environment, operators,
buffers, stocks etc. to get an understanding, and look for possible
problems
" Ishikawa diagram
• Mapping and understanding the materials supply processes using Lean tools
o VSM
o Operation chart
o Spaghetti diagram
o Product families
o Tied-up capital graph
• Finding bottlenecks
o Calculate annual capacity in machines/processes
• Finding value-added and non value-added activities
o Being prepared on theory
o Mapping
• Measuring lead times of materials supply processes
o Clocking warehouse operators when replenishing
• Measuring takt time and cycle time on a high volume and a low volume
product
o Clocking machines when operating
• Measuring amount of inventory in intermediate storing
o # of pallet locations
B. Interviews
• Semi-structured
o Key informants
" Blue-collar workers
" Production manager
" Supply chain manager
56 Key source of evidence.
Appendices
178
" Warehouse manager
o Use funnel model presented by Voss et al. (2002)
" Start broad – open-ended questions
" Narrow down – more detailed questions
o Send interview guide in advance
o No recording
o Apply 5 Whys throughout interviews
C. Archival records
• Copies of maps and charts over production
• Copies of expansion area
• Sales volumes
• Data from machines
o Down-time
o Efficiency
o Defects
• Data on tied-up capital, buffer stocks, lead times etc.
D. Documents
• List of relevant employees
• E-mails
E. Other sources of evidence exemplified by Voss et al. (2002)
• Informal conversations – field notes to increase reliability
• Attendance at meetings
2. Concepts for High Validity
A. Multiple sources of evidence
B. Field notes
C. Data base – transfer field notes, physical documents etc. to data base as soon as
possible
D. Chain of evidence – link observations, interviews and conclusions
E. Triangulation
F. Pattern analysis – look for patterns
3. Case studies
A. Embedded design
B. Longitudinal at TePe
C. Purpose
• Discovery/Descriptive
Improving Materials Supply Processes to Assembly Lines
179
• Mapping
• Cross-case analysis
• Constructive approach
D. Case selection
• “Two-case” case study – including TePe
• Manufacturing company in southern of Sweden
• Theoretical replication (aiming for the case company having implemented
some lean methods)
III. Data Collection Questions
See Appendix V, Appendix VI and Appendix X, for interview guides for TePe management, TePe
operators and Nolato management, respectively.
IV. Data Analysis
1. Pattern matching
A. Patterns between case/principal company and theoretical framework
B. Patterns based on Lean critical success factors
C. Patterns based on the lack/use of Lean tools
D. Causal relationships
2. Within-case analysis
A. Effects matrix
• Lead time
• Quality
• Cost
• Safety
• Morale
B. Role-ordered matrix
• Interviews and observations
3. Cross-case analysis
A. Meta-matrix
• Context
• Characteristics
• Application
• Success factors
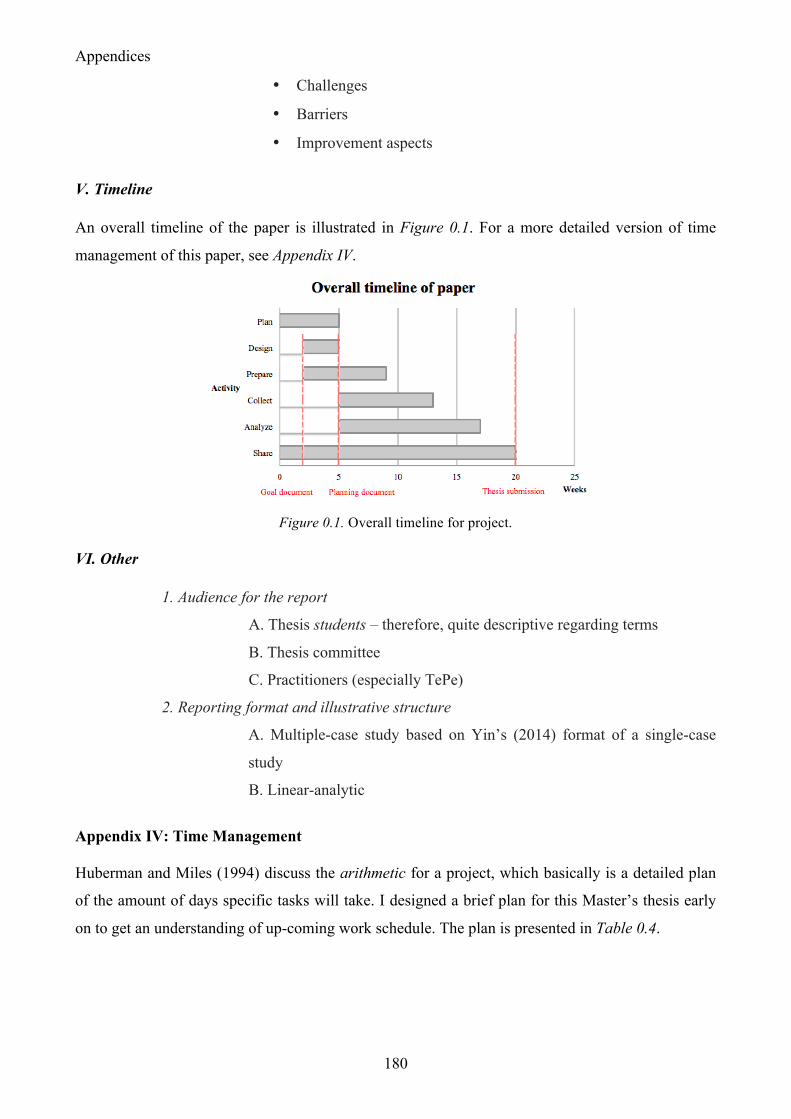
Appendices
180
• Challenges
• Barriers
• Improvement aspects
V. Timeline
An overall timeline of the paper is illustrated in Figure 0.1. For a more detailed version of time
management of this paper, see Appendix IV.
Figure 0.1. Overall timeline for project.
VI. Other
1. Audience for the report
A. Thesis students – therefore, quite descriptive regarding terms
B. Thesis committee
C. Practitioners (especially TePe)
2. Reporting format and illustrative structure
A. Multiple-case study based on Yin’s (2014) format of a single-case
study
B. Linear-analytic
Appendix IV: Time Management
Huberman and Miles (1994) discuss the arithmetic for a project, which basically is a detailed plan
of the amount of days specific tasks will take. I designed a brief plan for this Master’s thesis early
on to get an understanding of up-coming work schedule. The plan is presented in Table 0.4.
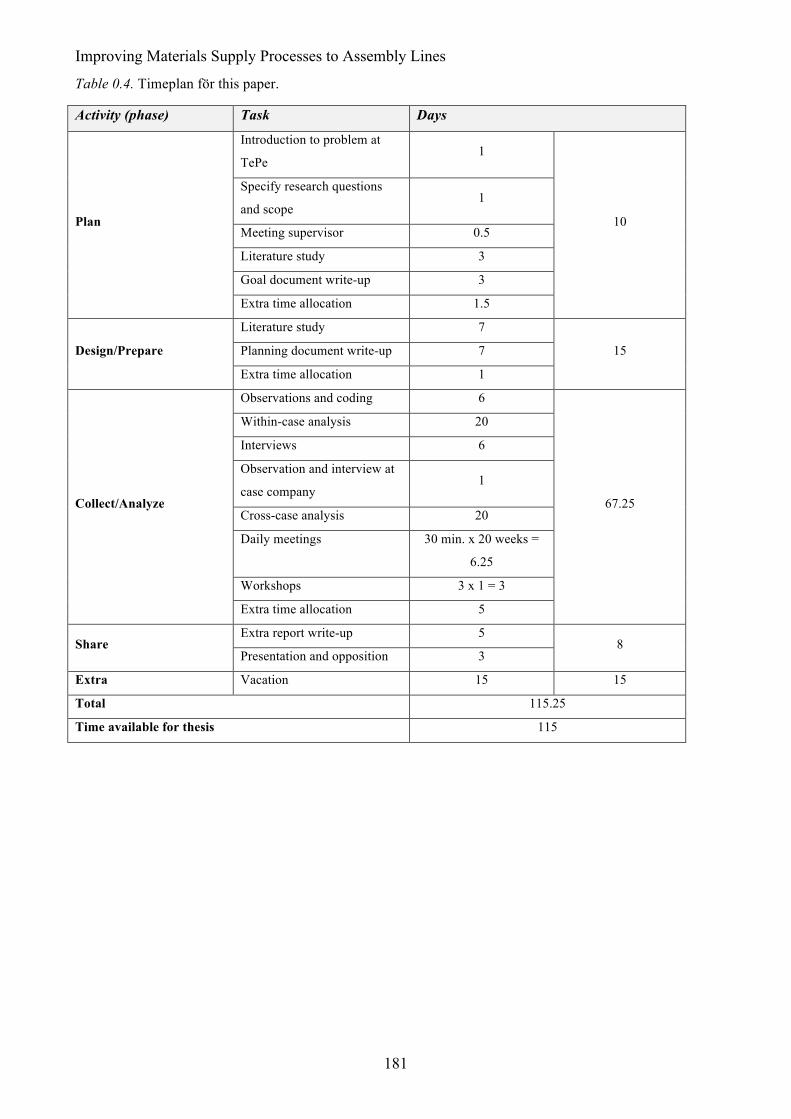
Improving Materials Supply Processes to Assembly Lines
181
Table 0.4. Timeplan för this paper.
Activity (phase) Task Days
Plan
Introduction to problem at
TePe 1
10
Specify research questions
and scope 1
Meeting supervisor 0.5
Literature study 3
Goal document write-up 3
Extra time allocation 1.5
Design/Prepare
Literature study 7
15 Planning document write-up 7
Extra time allocation 1
Collect/Analyze
Observations and coding 6
67.25
Within-case analysis 20
Interviews 6
Observation and interview at
case company 1
Cross-case analysis 20
Daily meetings 30 min. x 20 weeks =
6.25
Workshops 3 x 1 = 3
Extra time allocation 5
Share Extra report write-up 5
8 Presentation and opposition 3
Extra Vacation 15 15
Total 115.25
Time available for thesis 115
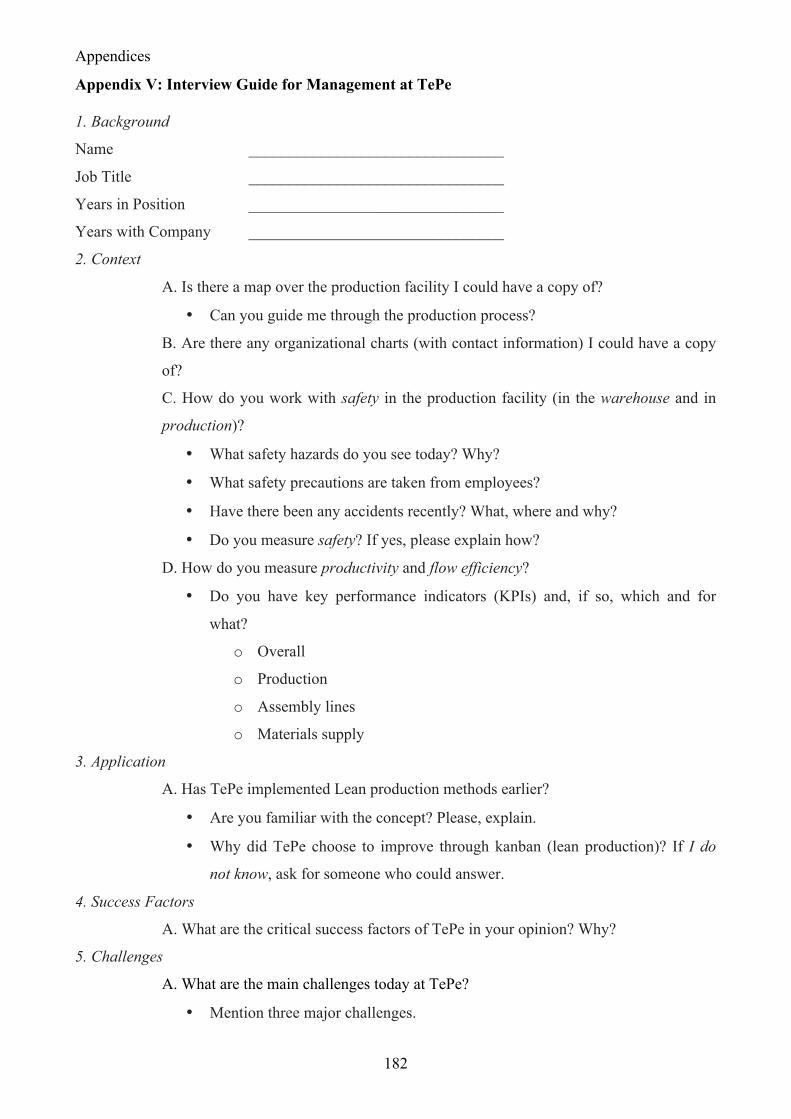
Appendices
182
Appendix V: Interview Guide for Management at TePe
1. Background
Name ________________________________
Job Title ________________________________
Years in Position ________________________________
Years with Company ________________________________
2. Context
A. Is there a map over the production facility I could have a copy of?
• Can you guide me through the production process?
B. Are there any organizational charts (with contact information) I could have a copy
of?
C. How do you work with safety in the production facility (in the warehouse and in
production)?
• What safety hazards do you see today? Why?
• What safety precautions are taken from employees?
• Have there been any accidents recently? What, where and why?
• Do you measure safety? If yes, please explain how?
D. How do you measure productivity and flow efficiency?
• Do you have key performance indicators (KPIs) and, if so, which and for
what?
o Overall
o Production
o Assembly lines
o Materials supply
3. Application
A. Has TePe implemented Lean production methods earlier?
• Are you familiar with the concept? Please, explain.
• Why did TePe choose to improve through kanban (lean production)? If I do
not know, ask for someone who could answer.
4. Success Factors
A. What are the critical success factors of TePe in your opinion? Why?
5. Challenges
A. What are the main challenges today at TePe?
• Mention three major challenges.
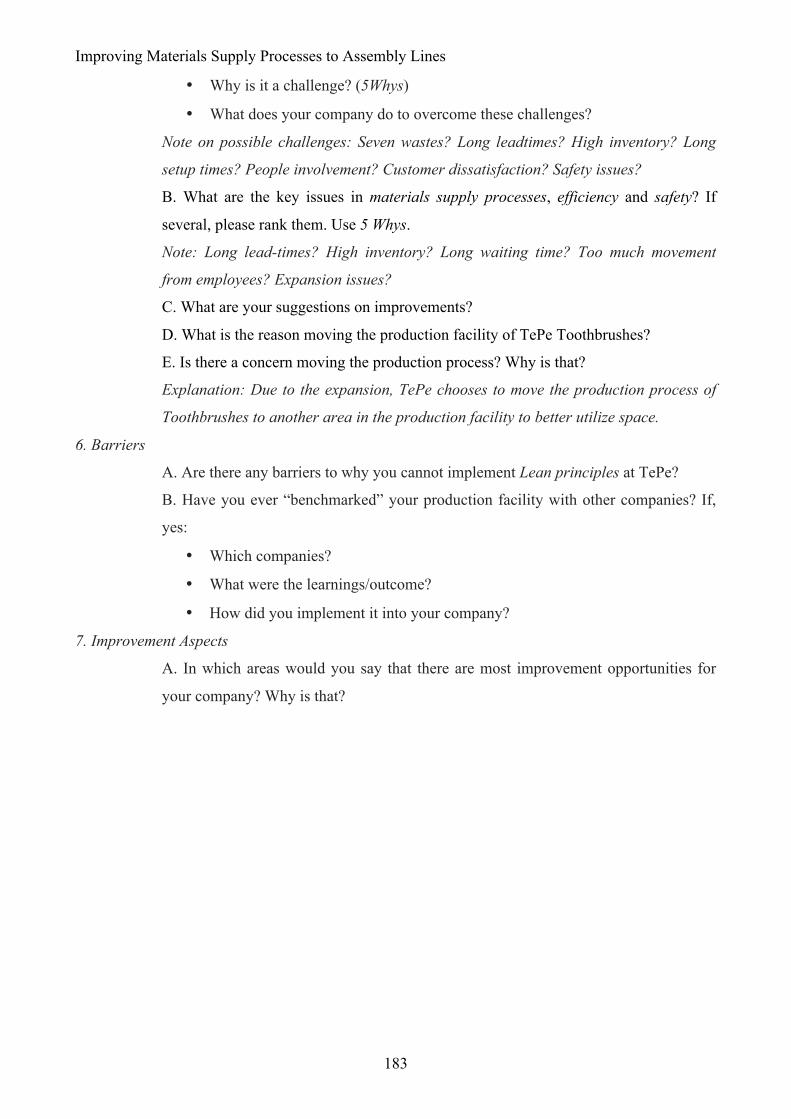
Improving Materials Supply Processes to Assembly Lines
183
• Why is it a challenge? (5Whys)
• What does your company do to overcome these challenges?
Note on possible challenges: Seven wastes? Long leadtimes? High inventory? Long
setup times? People involvement? Customer dissatisfaction? Safety issues?
B. What are the key issues in materials supply processes, efficiency and safety? If
several, please rank them. Use 5 Whys.
Note: Long lead-times? High inventory? Long waiting time? Too much movement
from employees? Expansion issues?
C. What are your suggestions on improvements?
D. What is the reason moving the production facility of TePe Toothbrushes?
E. Is there a concern moving the production process? Why is that?
Explanation: Due to the expansion, TePe chooses to move the production process of
Toothbrushes to another area in the production facility to better utilize space.
6. Barriers
A. Are there any barriers to why you cannot implement Lean principles at TePe?
B. Have you ever “benchmarked” your production facility with other companies? If,
yes:
• Which companies?
• What were the learnings/outcome?
• How did you implement it into your company?
7. Improvement Aspects
A. In which areas would you say that there are most improvement opportunities for
your company? Why is that?
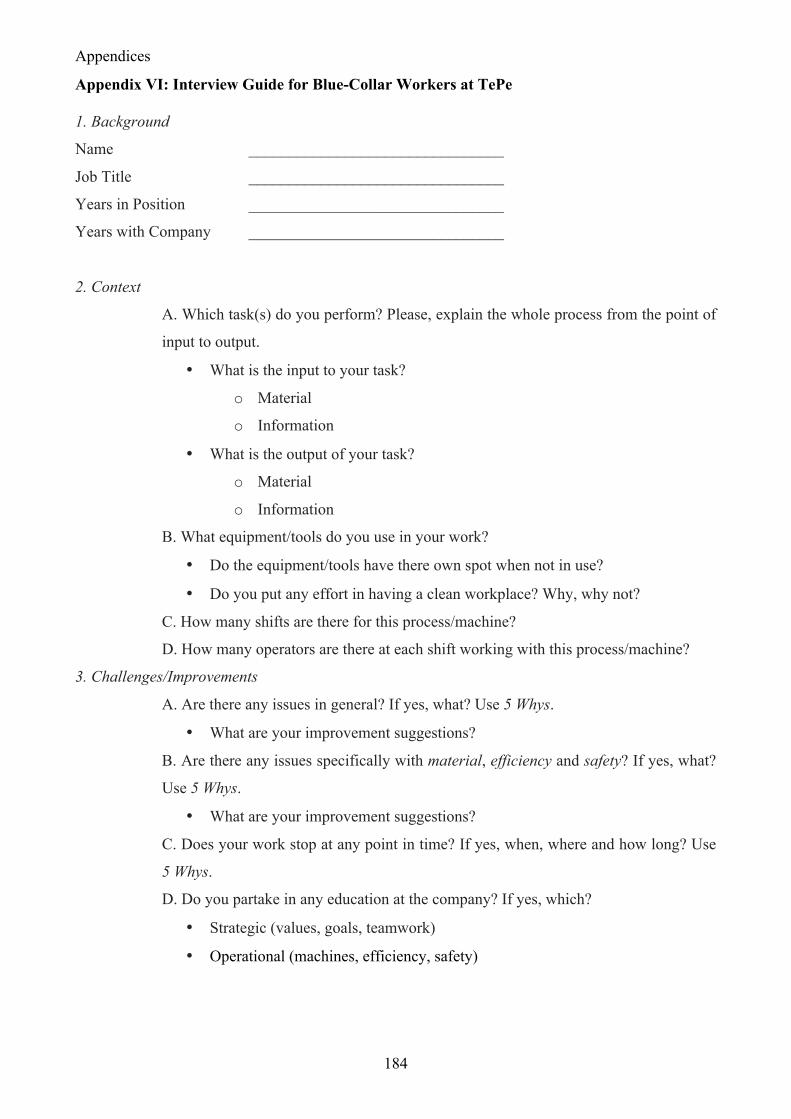
Appendices
184
Appendix VI: Interview Guide for Blue-Collar Workers at TePe
1. Background
Name ________________________________
Job Title ________________________________
Years in Position ________________________________
Years with Company ________________________________
2. Context
A. Which task(s) do you perform? Please, explain the whole process from the point of
input to output.
• What is the input to your task?
o Material
o Information
• What is the output of your task?
o Material
o Information
B. What equipment/tools do you use in your work?
• Do the equipment/tools have there own spot when not in use?
• Do you put any effort in having a clean workplace? Why, why not?
C. How many shifts are there for this process/machine?
D. How many operators are there at each shift working with this process/machine?
3. Challenges/Improvements
A. Are there any issues in general? If yes, what? Use 5 Whys.
• What are your improvement suggestions?
B. Are there any issues specifically with material, efficiency and safety? If yes, what?
Use 5 Whys.
• What are your improvement suggestions?
C. Does your work stop at any point in time? If yes, when, where and how long? Use
5 Whys.
D. Do you partake in any education at the company? If yes, which?
• Strategic (values, goals, teamwork)
• Operational (machines, efficiency, safety)
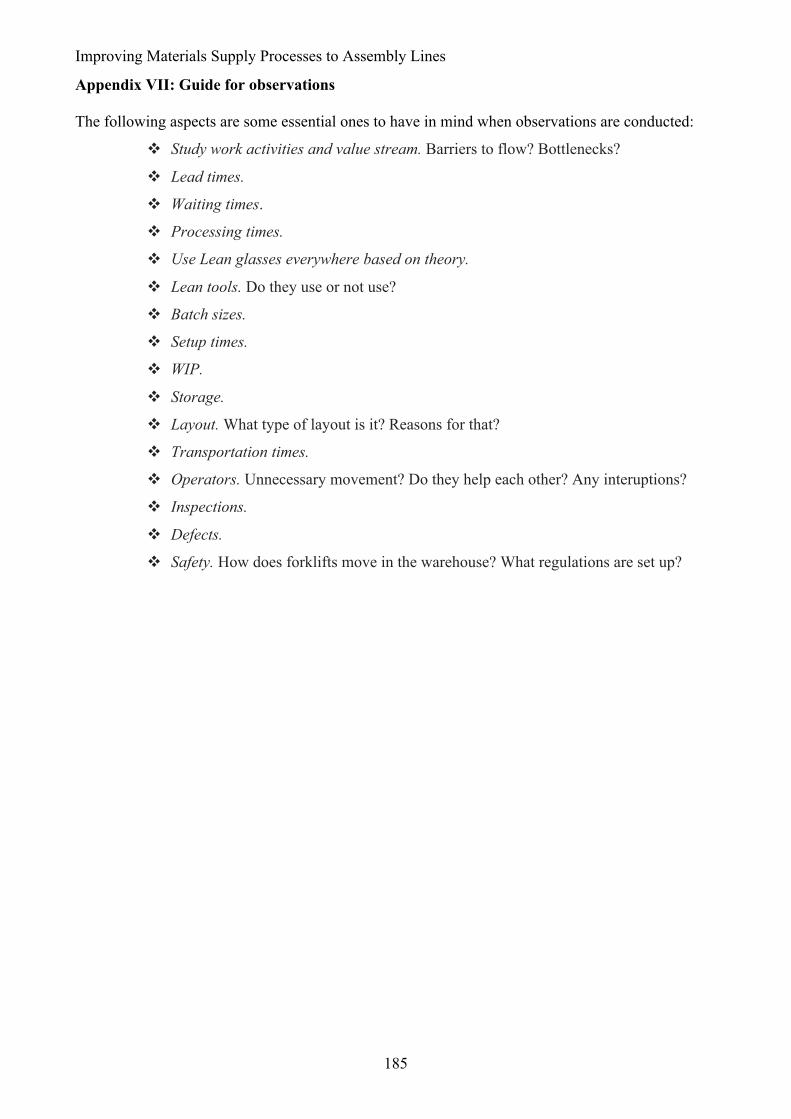
Improving Materials Supply Processes to Assembly Lines
185
Appendix VII: Guide for observations
The following aspects are some essential ones to have in mind when observations are conducted:
! Study work activities and value stream. Barriers to flow? Bottlenecks?
! Lead times.
! Waiting times.
! Processing times.
! Use Lean glasses everywhere based on theory.
! Lean tools. Do they use or not use?
! Batch sizes.
! Setup times.
! WIP.
! Storage.
! Layout. What type of layout is it? Reasons for that?
! Transportation times.
! Operators. Unnecessary movement? Do they help each other? Any interuptions?
! Inspections.
! Defects.
! Safety. How does forklifts move in the warehouse? What regulations are set up?

Appendices
186
Appendix VIII: Example of an initial e-mail to a case company
Hej [Namn på kontaktperson].
Jag är civilingenjörsstudent inom maskinteknik, specialiserad inom Logistik och
Produktionsekonomi, på Lunds Tekniska Högskola. Just nu skriver jag mitt examensarbete inom
TPS/Lean med uppgift att förbättra materialflödet hos TePe Munhygienprodukter i Malmö.
Examensarbetet är en flerfallsstudie, där företag som har implementerat principer och tankesätt
kring Lean undersöks och analyseras. I och med att [Företagets namn] ligger i framkant här, och har
vunnit bl.a. Lean-forums utmärkelse år [År], och dessutom har relativt hög
kapitalomsättningshastighet, så är ni ett företag som är väldigt intressant för mig i min studie.
Jag är alltså intresserad av hur [Företagets namn] gör för att nå sitt mål att bli världsledande genom
[Företagets egna produktionssystem], för jag antar att detta fortfarande är er filosofi trots att ni vann
priset för ett antal år sedan nu. Jag skulle alltså vara intresserad av ett studiebesök hos er inom den
närmaste framtiden om detta är möjligt.
Om du kan/vill hjälpa mig, eller om du kan vidarebefordra mig till någon av era Lean-koordinatorer
eller produktionschef, uppskattas det mycket.
Tack på förhand!
Vänliga hälsningar,
Patrik Östlund

Improving Materials Supply Processes to Assembly Lines
187
Appendix IX: Example of the following e-mail to a case company
Hej [Namn på kontaktperson].
Först och främst vill jag tacka för snabb respons!
Jag är alltså intresserad av exempelvis en halvdag, eller så mycket som hinns med, ute i [plats] för
att förstå hur ni arbetar med [Företagets produktionssystem]. Det är av intresse att både hinna med
en observation av produktionen och en intervju för att bl.a. uppfatta vilka lean-metoder ni använder,
hur ni löser problem, hur materialet flödar etc.
Intervjun är indelad i värden och principer, utmaningar, tillämpning av lean-metoder,
framgångsfaktorer, barriärer och förbättringsaspekter, och lägger extra vikt
vid flödeseffektivitet, säkerhet och hygien.
Finns det möjlighet för en träff [Datum]? Jag kan vara tillgänglig alla vardagar. Annars mottages
gärna andra förslag.
Du når mig här, eller via telefon när som helst: [Telefonnummer]
Er hjälp i projektet skulle uppskattas mycket!
Vänliga hälsningar,
Patrik
Appendices
188
Appendix X: Interview Guide – Nolato
1. Background
Name ________________________________
Job Title ________________________________
Years in Position ________________________________
Years with Company ________________________________
2. Context
A. Industry – Research beforehand
B. Products – Research beforehand
C. Key customers – Research beforehand
D. How does the production facility look like?
• Is there a map over the production facility I could have a copy of?
E. How does the organization look like? How do you work with the organizational
structure?
• Horizontal/Vertical?
• Are there any organizational charts I could have a copy of?
3. Application
A. What is Lean to you? Describe shortly.
B. How does your company work with Lean?
• Which Lean methods are implemented at your company? Use Table 0.5 on
next page.
• Mention the three most important for the success of your company.
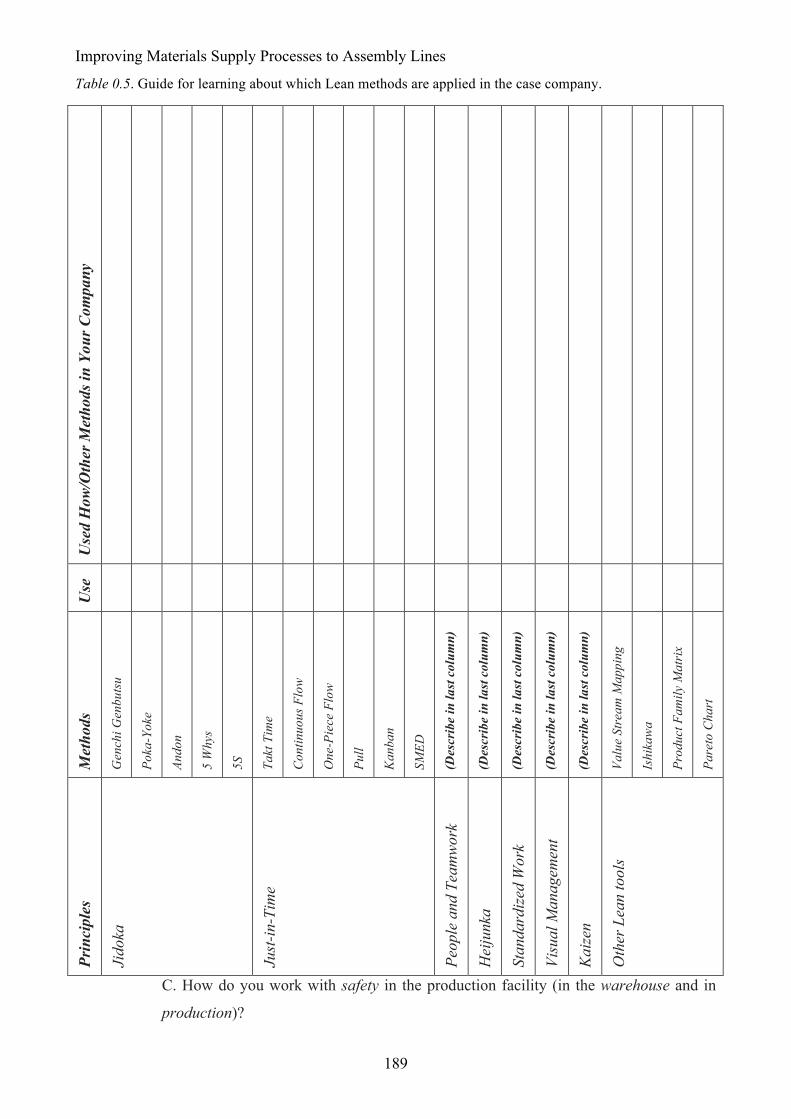
Improving Materials Supply Processes to Assembly Lines
189
Table 0.5. Guide for learning about which Lean methods are applied in the case company. U
sed
How
/Oth
er M
etho
ds in
You
r Com
pany
Use
Met
hods
Gen
chi G
enbu
tsu
Poka
-Yok
e
Ando
n
5 W
hys
5S
Takt
Tim
e
Con
tinuo
us F
low
One
-Pie
ce F
low
Pull
Kan
ban
SMED
(Des
crib
e in
last
col
umn)
(Des
crib
e in
last
col
umn)
(Des
crib
e in
last
col
umn)
(Des
crib
e in
last
col
umn)
(Des
crib
e in
last
col
umn)
Valu
e St
ream
Map
ping
Ishi
kaw
a
Prod
uct F
amily
Mat
rix
Pare
to C
hart
Prin
cipl
es
Jido
ka
Just
-in-T
ime
Peop
le a
nd T
eam
wor
k
Hei
junk
a
Stan
dard
ized
Wor
k
Visu
al M
anag
emen
t
Kai
zen
Oth
er L
ean
tool
s
C. How do you work with safety in the production facility (in the warehouse and in
production)?
Appendices
190
• What safety hazards do you see today? Why?
• What safety precautions are taken from employees?
• Have there been any accidents recently? What, where and why?
• Do you measure safety? If yes, please explain how?
D. How do you measure productivity and flow efficiency?
• Do you have key performance indicators (KPIs) and, if so, which and for
what?
o Overall
o Production
4. Success Factors
A. Your company has been awarded for your Lean commitments. What would you
say are your success factors?
• Mention three major benefits from implementing Lean.
5. Characteristics
A. Can you guide me through the value stream of an A-classified product (mostly
sold)?
• What processes are value added activities?
B. How long are the lead times at an average?
• For A-classified products?
• For C-classified products (least sold)?
• How do you do to decrease lead times?
C. How much inventory do you have at this moment? Quantity/value?
• Raw material
• Finished goods
• WIP
• Buffer stocks
• Tied-up capital
D. What are the batch sizes?
• Are they customer-driven or standard?
• How do you calculate batch sizes?
E. How does your company handle safety?
• Which methods are used?
• Do you have any measurement for those?
6. Challenges
Improving Materials Supply Processes to Assembly Lines
191
A. Have there been any drawbacks implementing Lean principles?
B. Did you meet any resistance from employees while starting to implement Lean
principles?
C. What were the challenges before introducing Lean principles?
• Mention three major challenges.
• Why was it a challenge?
• What does your company do to overcome these challenges?
o Possible challenges:
" Seven wastes
• Overproduction
• Waiting time
• Unnecessary transportation
• Overprocessing
• Excess inventory
• Unnecessary movement
• Defective products
o Other
Note: Long leadtimes? High inventory? Long setup times? People involvement?
Customer dissatisfaction? Safety issues?
D. What is your take on a company that has not implemented Lean principles?
• Any suggestions for such a company?
7. Barriers
A. What are the key issues/challenges today at your company?
• Mention three. Please, rank them.
• Why are those issues/challenges to you?
• How do/will you solve these issues/challenges?
B. Are there any specific issues/challenges in the material flow?
• In materials supply processes, e.g. Kanban?
C. Are there any barriers to why you cannot implement specific Lean
principles/methods?
D. Have you ever “benchmarked” your production facility with other companies? If,
yes:
• Which companies?
• What were the learnings/outcome?

Appendices
192
• How did you implement it into your company?
8. Improvement Aspects
A. In which areas would you say that there are most improvement opportunities for
your company?
• Relate to 7 wastes and Table 0.5.
• Continuous improvement?
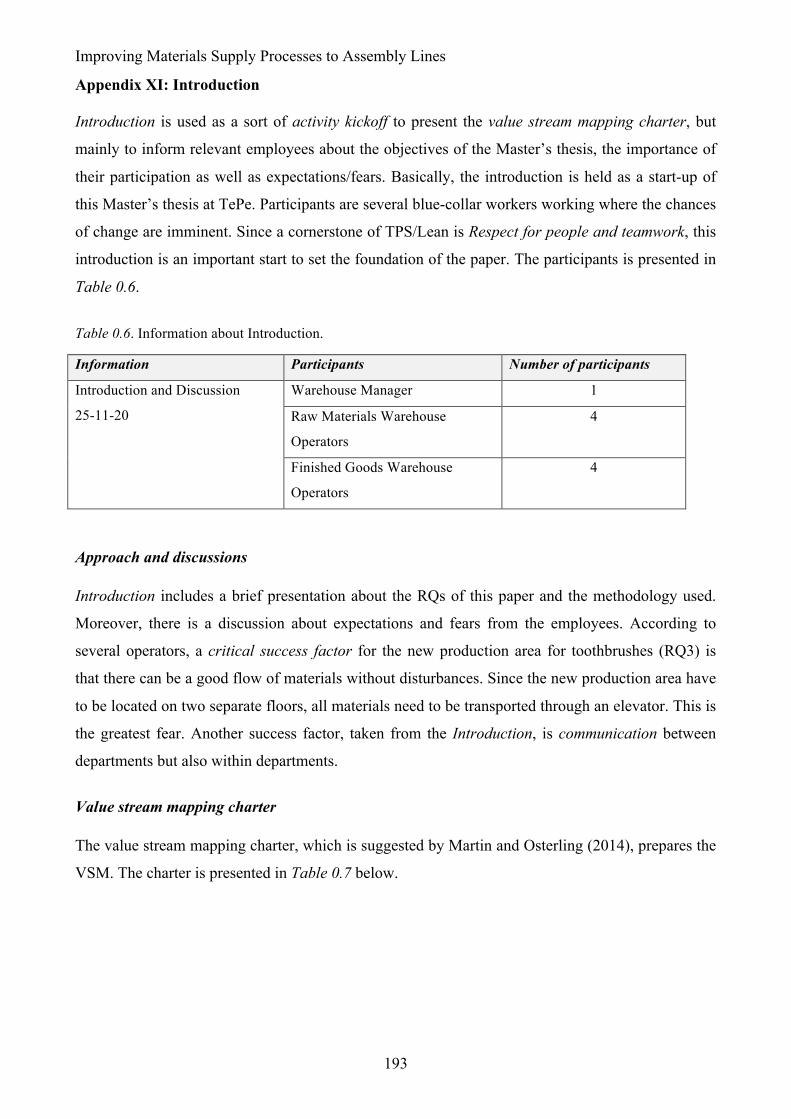
Improving Materials Supply Processes to Assembly Lines
193
Appendix XI: Introduction
Introduction is used as a sort of activity kickoff to present the value stream mapping charter, but
mainly to inform relevant employees about the objectives of the Master’s thesis, the importance of
their participation as well as expectations/fears. Basically, the introduction is held as a start-up of
this Master’s thesis at TePe. Participants are several blue-collar workers working where the chances
of change are imminent. Since a cornerstone of TPS/Lean is Respect for people and teamwork, this
introduction is an important start to set the foundation of the paper. The participants is presented in
Table 0.6.
Table 0.6. Information about Introduction.
Information Participants Number of participants
Introduction and Discussion
25-11-20
Warehouse Manager 1
Raw Materials Warehouse
Operators
4
Finished Goods Warehouse
Operators
4
Approach and discussions
Introduction includes a brief presentation about the RQs of this paper and the methodology used.
Moreover, there is a discussion about expectations and fears from the employees. According to
several operators, a critical success factor for the new production area for toothbrushes (RQ3) is
that there can be a good flow of materials without disturbances. Since the new production area have
to be located on two separate floors, all materials need to be transported through an elevator. This is
the greatest fear. Another success factor, taken from the Introduction, is communication between
departments but also within departments.
Value stream mapping charter
The value stream mapping charter, which is suggested by Martin and Osterling (2014), prepares the
VSM. The charter is presented in Table 0.7 below.
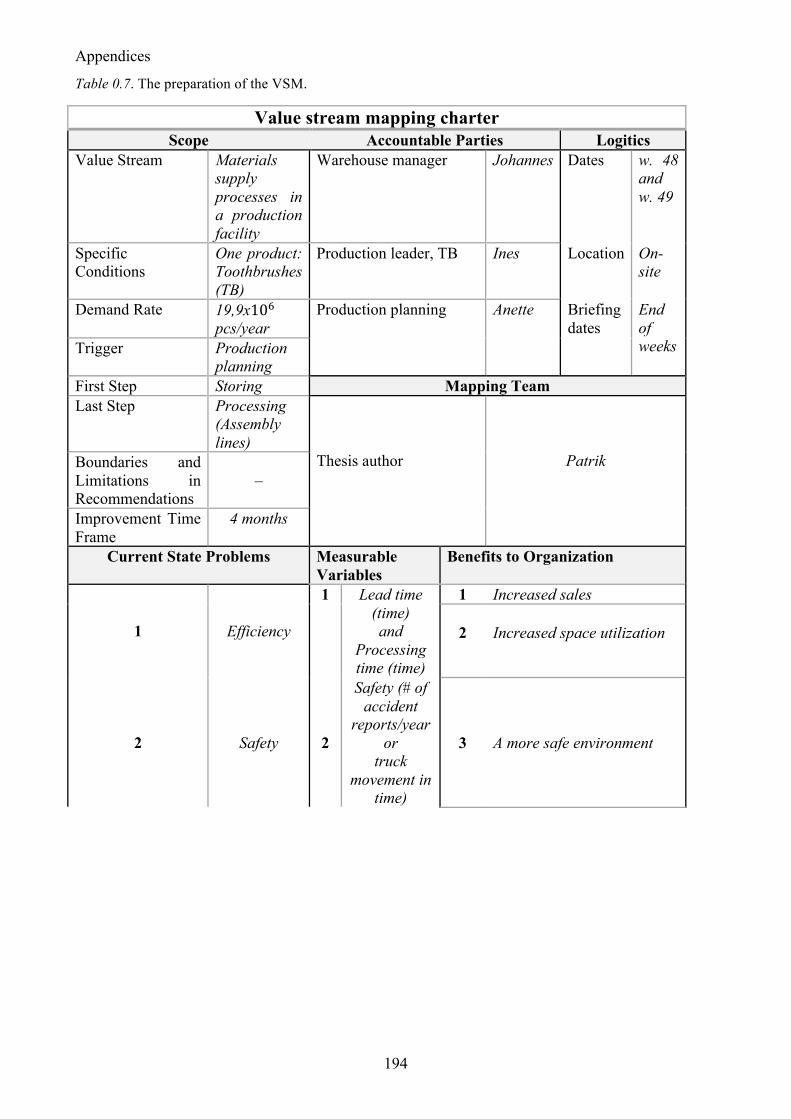
Appendices
194
Table 0.7. The preparation of the VSM.
Value stream mapping charter Scope Accountable Parties Logitics
Value Stream Materials supply processes in a production facility
Warehouse manager Johannes Dates w. 48 and w. 49
Specific Conditions
One product: Toothbrushes (TB)
Production leader, TB Ines Location On-site
Demand Rate 19,9x10! pcs/year
Production planning Anette Briefing dates
End of weeks Trigger Production
planning First Step Storing Mapping Team Last Step Processing
(Assembly lines)
Thesis author
Patrik Boundaries and Limitations in Recommendations
–
Improvement Time Frame
4 months
Current State Problems Measurable Variables
Benefits to Organization
1
Efficiency
1 Lead time (time) and
Processing time (time)
1 Increased sales 2
Increased space utilization
2
Safety
2
Safety (# of accident
reports/year or
truck movement in
time)
3
A more safe environment
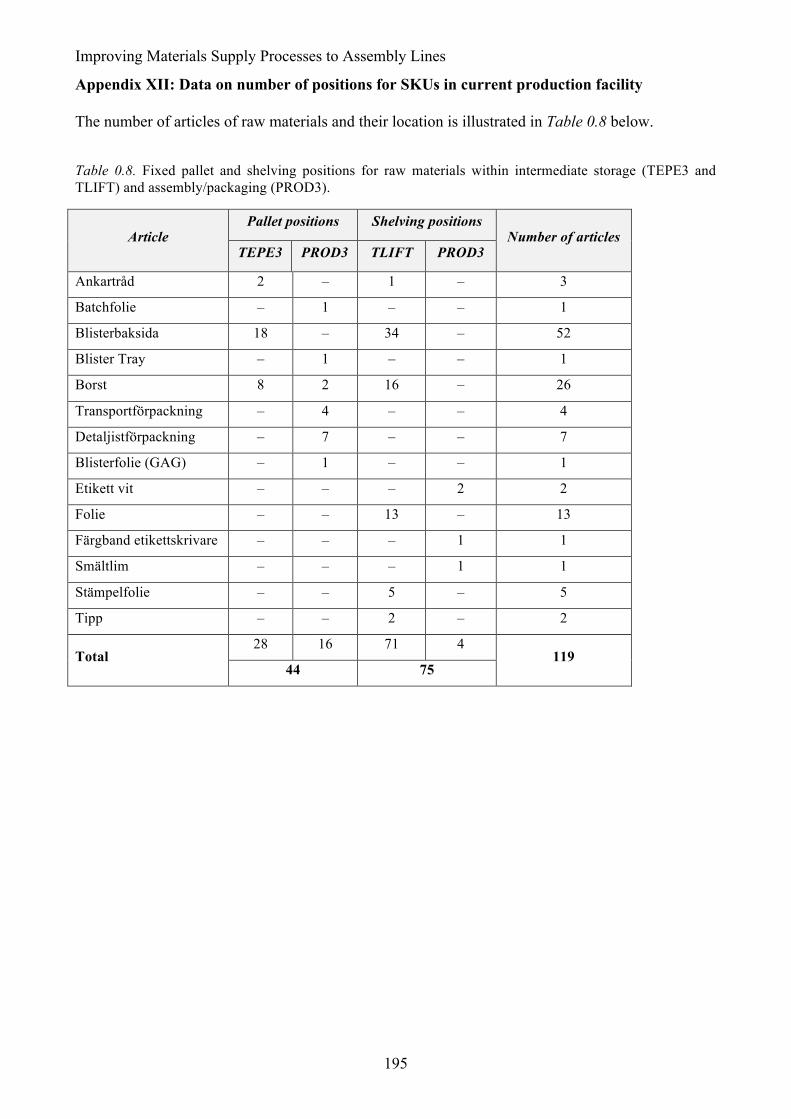
Improving Materials Supply Processes to Assembly Lines
195
Appendix XII: Data on number of positions for SKUs in current production facility
The number of articles of raw materials and their location is illustrated in Table 0.8 below.
Table 0.8. Fixed pallet and shelving positions for raw materials within intermediate storage (TEPE3 and TLIFT) and assembly/packaging (PROD3).
Article Pallet positions Shelving positions
Number of articles TEPE3 PROD3 TLIFT PROD3
Ankartråd 2 – 1 – 3
Batchfolie – 1 – – 1
Blisterbaksida 18 – 34 – 52
Blister Tray – 1 – – 1
Borst 8 2 16 – 26
Transportförpackning – 4 – – 4
Detaljistförpackning – 7 – – 7
Blisterfolie (GAG) – 1 – – 1
Etikett vit – – – 2 2
Folie – – 13 – 13
Färgband etikettskrivare – – – 1 1
Smältlim – – – 1 1
Stämpelfolie – – 5 – 5
Tipp – – 2 – 2
Total 28 16 71 4
119 44 75
Appendices
196
Appendix XIII: Brainstorming Session Using 5 Whys
The 5 Whys method was used during interviews to understand the root causes to any challenge.
Each interviewee, then, tried to come up with relevant suggestions on improvement. When
employees struggled to find any, I helped them be creative by giving examples. The majority of
challenges (problems), which becomes the foundation of the Ishikawa diagrams in Chapter 4.6, are
illustrated in Table 0.9 below.
Table 0.9. Problems mentioned in interviews, their root causes using an alteration of 5 Whys and interviewee’s suggestions on improvements.
Posi
tion
at
com
pany
Are
a
Problem Interviewee
Problem Problem Problem Root cause Relevant
suggestions on improvement
Why? Why? Why? Why?
Ope
rato
rs
Eff
icie
ncy
(RQ
1)
Eff
icie
ncy
Safe
ty
Complaints from
management to production
Theoretically OK does not always mean practically
OK
– –
Collaboration between
office and production
Management visiting
production (Genchi genbutsu)
A lot of administrative workload for
FGW in materials handling
Double handling of information
– –
Different ERP system in
production and FGW
Shared ERP system
Stressed occationally
Machine downtime
Stamp not in position
Foil gets stuck in machine
Manufacturi
ng low-quality
products
Machine changeover is problematic
Long setup times
Long time
before machines
produce high-quality
products after changeover
Educate technicians
Operators help
each others
Pick up raw materials, which
are not in position
No materials on shelfs
Call warehouse operator
– ERP system
Raw materials closer to assembly
lines
Better replenishing
system Pick up semi-manufactured goods, which
are not in position
Walk to injection molding
Handles not finished in all
colours
Machine capacity
restraints in injection molding
Invest in new injection molding
machines
Visually checking if
replenishments are needed
A lot of movement for
operators
ERP system is not
updated frequently
– Unreliable ERP system
Put more resources into aligning to one
ERP system
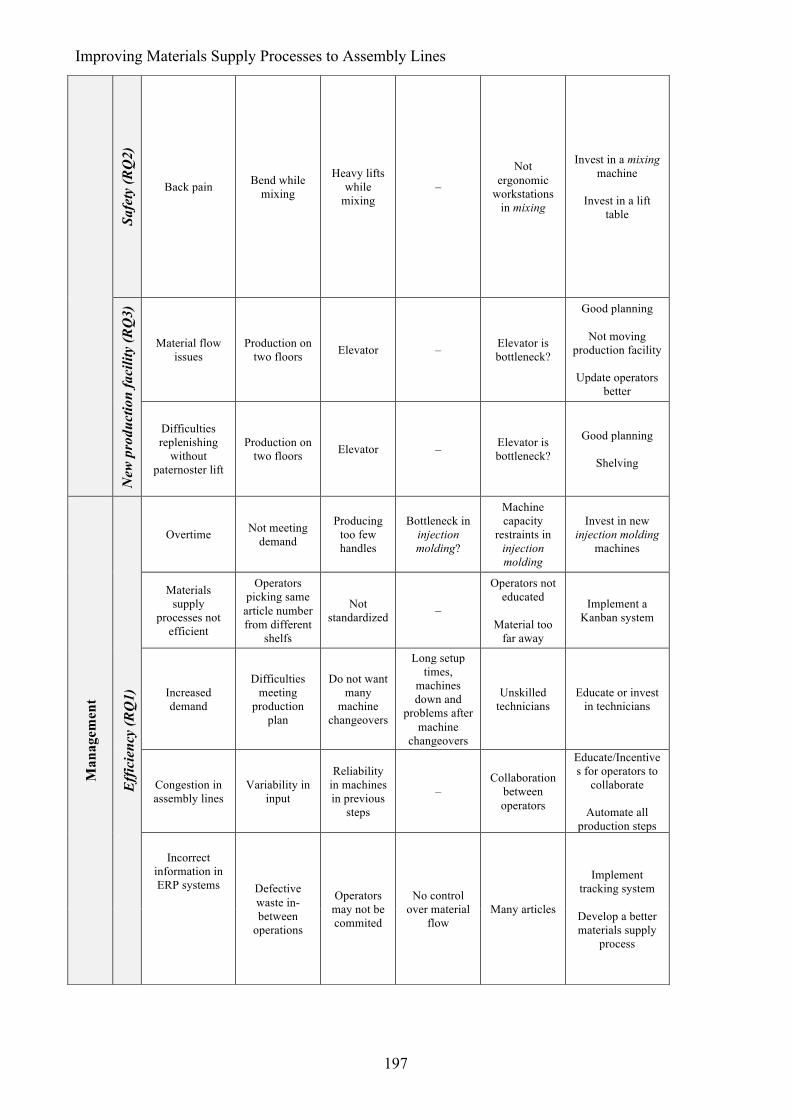
Improving Materials Supply Processes to Assembly Lines
197
Safe
ty (R
Q2)
Back pain Bend while mixing
Heavy lifts while
mixing –
Not ergonomic
workstations in mixing
Invest in a mixing machine
Invest in a lift
table
New
pro
duct
ion
faci
lity
(RQ
3)
Material flow issues
Production on two floors Elevator – Elevator is
bottleneck?
Good planning
Not moving production facility
Update operators
better
Difficulties replenishing
without paternoster lift
Production on two floors Elevator – Elevator is
bottleneck?
Good planning
Shelving
Man
agem
ent
Eff
icie
ncy
(RQ
1)
Overtime Not meeting demand
Producing too few handles
Bottleneck in injection molding?
Machine capacity
restraints in injection molding
Invest in new injection molding
machines
Materials supply
processes not efficient
Operators picking same
article number from different
shelfs
Not standardized –
Operators not educated
Material too
far away
Implement a Kanban system
Increased demand
Difficulties meeting
production plan
Do not want many
machine changeovers
Long setup times,
machines down and
problems after machine
changeovers
Unskilled technicians
Educate or invest in technicians
Congestion in assembly lines
Variability in input
Reliability in machines in previous
steps
– Collaboration
between operators
Educate/Incentives for operators to
collaborate
Automate all production steps
Incorrect information in ERP systems Defective
waste in-between
operations
Operators may not be commited
No control over material
flow Many articles
Implement tracking system
Develop a better materials supply
process
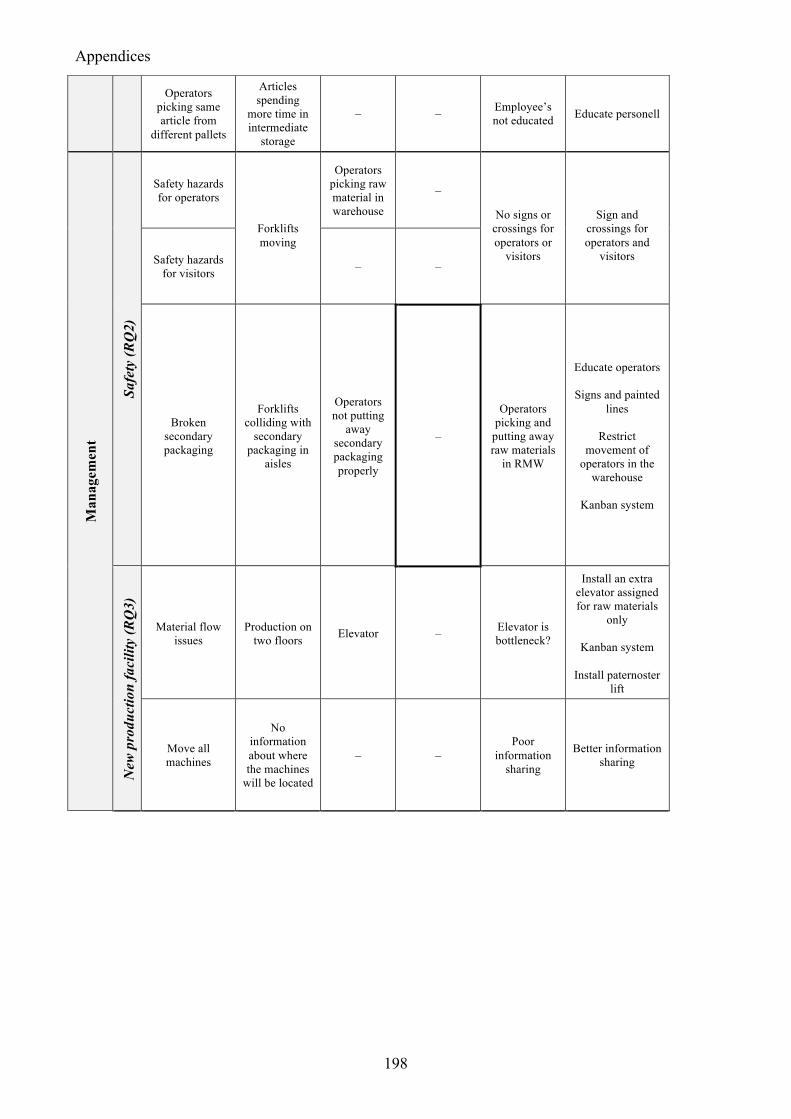
Appendices
198
Operators picking same article from
different pallets
Articles spending
more time in intermediate
storage
– – Employee’s not educated Educate personell
Man
agem
ent
Safe
ty (R
Q2)
Safety hazards for operators
Forklifts moving
Operators picking raw material in warehouse
–
No signs or crossings for operators or
visitors
Sign and
crossings for operators and
visitors Safety hazards for visitors – –
Broken secondary packaging
Forklifts colliding with
secondary packaging in
aisles
Operators not putting
away secondary packaging properly
–
Operators picking and
putting away raw materials
in RMW
Educate operators
Signs and painted lines
Restrict
movement of operators in the
warehouse
Kanban system
New
pro
duct
ion
faci
lity
(RQ
3)
Material flow issues
Production on two floors Elevator – Elevator is
bottleneck?
Install an extra elevator assigned for raw materials
only
Kanban system
Install paternoster lift
Move all machines
No information about where the machines
will be located
– – Poor
information sharing
Better information sharing
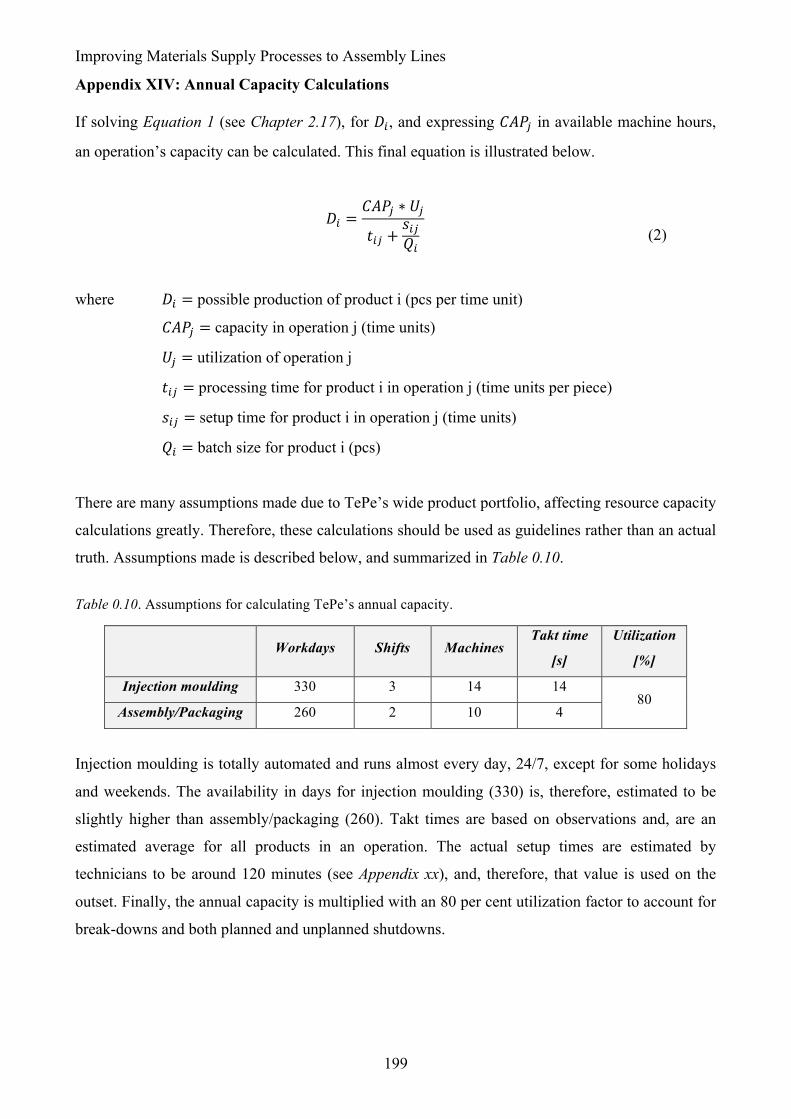
Improving Materials Supply Processes to Assembly Lines
199
Appendix XIV: Annual Capacity Calculations
If solving Equation 1 (see Chapter 2.17), for 𝐷!, and expressing 𝐶𝐴𝑃! in available machine hours,
an operation’s capacity can be calculated. This final equation is illustrated below.
𝐷! =
𝐶𝐴𝑃! ∗ 𝑈!𝑡!" +
𝑠!"𝑄!
(2)
where 𝐷! = possible production of product i (pcs per time unit)
𝐶𝐴𝑃! = capacity in operation j (time units)
𝑈! = utilization of operation j
𝑡!" = processing time for product i in operation j (time units per piece)
𝑠!" = setup time for product i in operation j (time units)
𝑄! = batch size for product i (pcs)
There are many assumptions made due to TePe’s wide product portfolio, affecting resource capacity
calculations greatly. Therefore, these calculations should be used as guidelines rather than an actual
truth. Assumptions made is described below, and summarized in Table 0.10.
Table 0.10. Assumptions for calculating TePe’s annual capacity.
Workdays Shifts Machines Takt time
[s]
Utilization
[%]
Injection moulding 330 3 14 14 80
Assembly/Packaging 260 2 10 4
Injection moulding is totally automated and runs almost every day, 24/7, except for some holidays
and weekends. The availability in days for injection moulding (330) is, therefore, estimated to be
slightly higher than assembly/packaging (260). Takt times are based on observations and, are an
estimated average for all products in an operation. The actual setup times are estimated by
technicians to be around 120 minutes (see Appendix xx), and, therefore, that value is used on the
outset. Finally, the annual capacity is multiplied with an 80 per cent utilization factor to account for
break-downs and both planned and unplanned shutdowns.
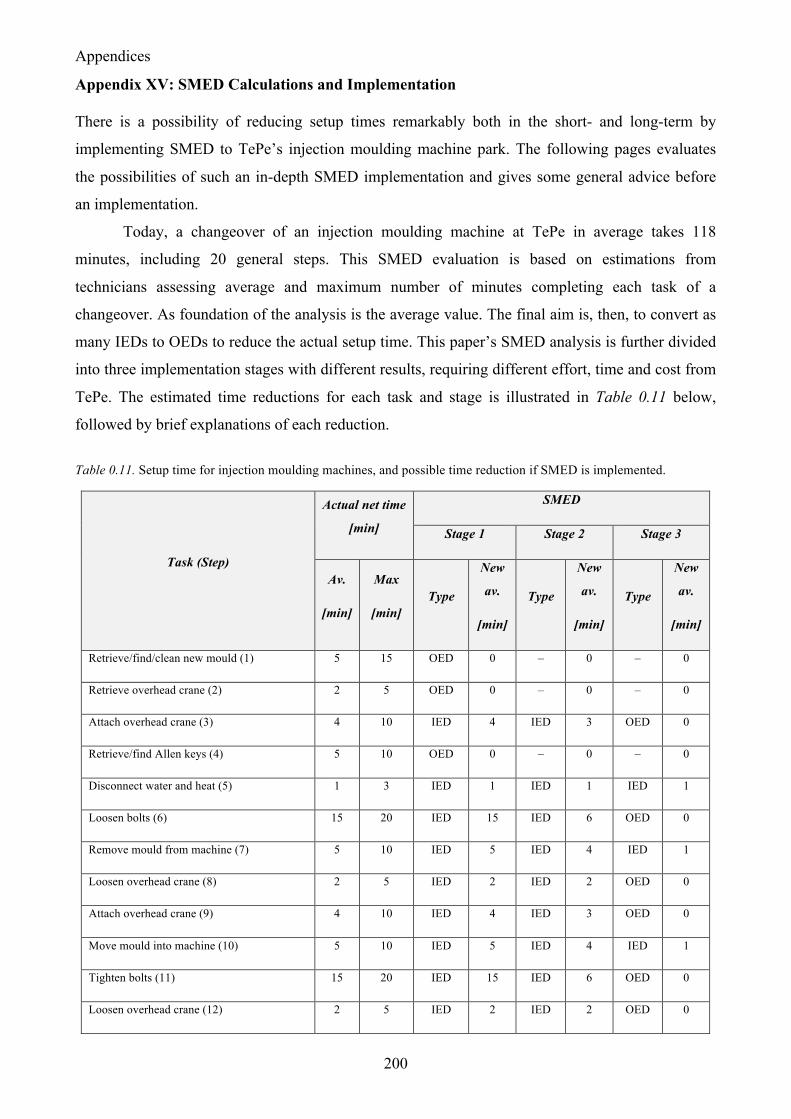
Appendices
200
Appendix XV: SMED Calculations and Implementation
There is a possibility of reducing setup times remarkably both in the short- and long-term by
implementing SMED to TePe’s injection moulding machine park. The following pages evaluates
the possibilities of such an in-depth SMED implementation and gives some general advice before
an implementation.
Today, a changeover of an injection moulding machine at TePe in average takes 118
minutes, including 20 general steps. This SMED evaluation is based on estimations from
technicians assessing average and maximum number of minutes completing each task of a
changeover. As foundation of the analysis is the average value. The final aim is, then, to convert as
many IEDs to OEDs to reduce the actual setup time. This paper’s SMED analysis is further divided
into three implementation stages with different results, requiring different effort, time and cost from
TePe. The estimated time reductions for each task and stage is illustrated in Table 0.11 below,
followed by brief explanations of each reduction.
Table 0.11. Setup time for injection moulding machines, and possible time reduction if SMED is implemented.
Task (Step)
Actual net time
[min]
SMED
Stage 1 Stage 2 Stage 3
Av.
[min]
Max
[min] Type
New
av.
[min]
Type
New
av.
[min]
Type
New
av.
[min]
Retrieve/find/clean new mould (1) 5 15 OED 0 – 0 – 0
Retrieve overhead crane (2) 2 5 OED 0 – 0 – 0
Attach overhead crane (3) 4 10 IED 4 IED 3 OED 0
Retrieve/find Allen keys (4) 5 10 OED 0 – 0 – 0
Disconnect water and heat (5) 1 3 IED 1 IED 1 IED 1
Loosen bolts (6) 15 20 IED 15 IED 6 OED 0
Remove mould from machine (7) 5 10 IED 5 IED 4 IED 1
Loosen overhead crane (8) 2 5 IED 2 IED 2 OED 0
Attach overhead crane (9) 4 10 IED 4 IED 3 OED 0
Move mould into machine (10) 5 10 IED 5 IED 4 IED 1
Tighten bolts (11) 15 20 IED 15 IED 6 OED 0
Loosen overhead crane (12) 2 5 IED 2 IED 2 OED 0
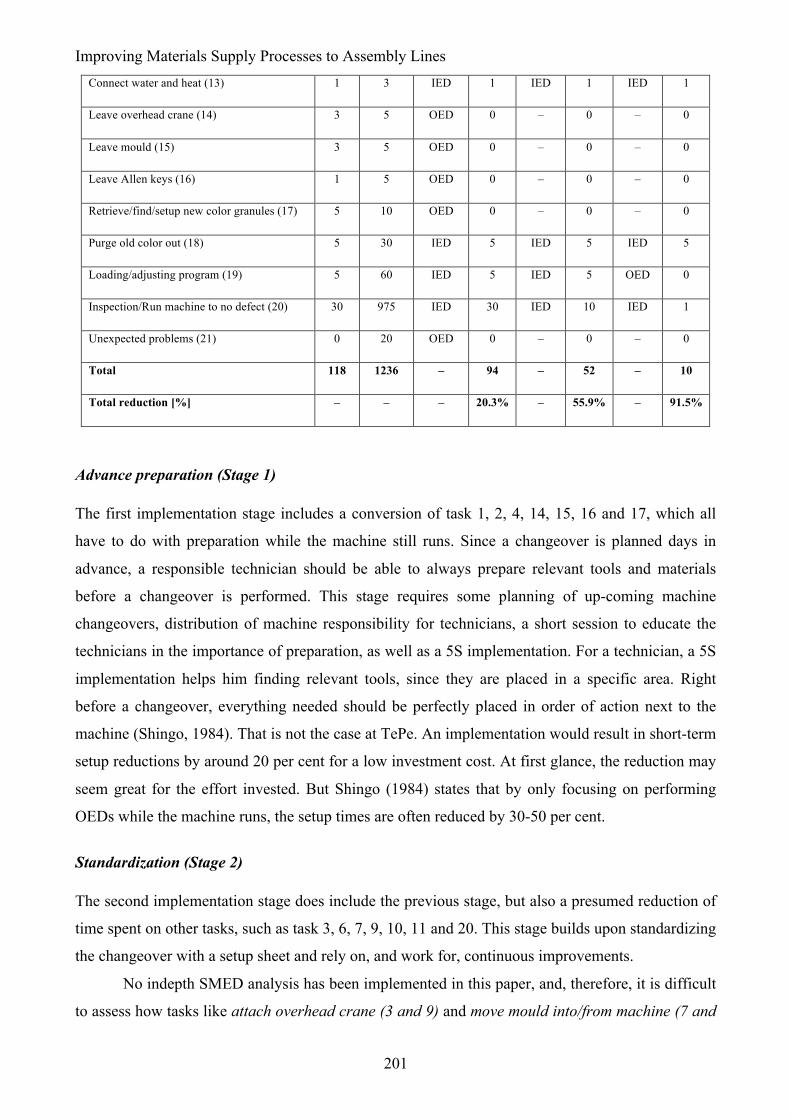
Improving Materials Supply Processes to Assembly Lines
201
Connect water and heat (13) 1 3 IED 1 IED 1 IED 1
Leave overhead crane (14) 3 5 OED 0 – 0 – 0
Leave mould (15) 3 5 OED 0 – 0 – 0
Leave Allen keys (16) 1 5 OED 0 – 0 – 0
Retrieve/find/setup new color granules (17) 5 10 OED 0 – 0 – 0
Purge old color out (18) 5 30 IED 5 IED 5 IED 5
Loading/adjusting program (19) 5 60 IED 5 IED 5 OED 0
Inspection/Run machine to no defect (20) 30 975 IED 30 IED 10 IED 1
Unexpected problems (21) 0 20 OED 0 – 0 – 0
Total 118 1236 – 94 – 52 – 10
Total reduction [%] – – – 20.3% – 55.9% – 91.5%
Advance preparation (Stage 1)
The first implementation stage includes a conversion of task 1, 2, 4, 14, 15, 16 and 17, which all
have to do with preparation while the machine still runs. Since a changeover is planned days in
advance, a responsible technician should be able to always prepare relevant tools and materials
before a changeover is performed. This stage requires some planning of up-coming machine
changeovers, distribution of machine responsibility for technicians, a short session to educate the
technicians in the importance of preparation, as well as a 5S implementation. For a technician, a 5S
implementation helps him finding relevant tools, since they are placed in a specific area. Right
before a changeover, everything needed should be perfectly placed in order of action next to the
machine (Shingo, 1984). That is not the case at TePe. An implementation would result in short-term
setup reductions by around 20 per cent for a low investment cost. At first glance, the reduction may
seem great for the effort invested. But Shingo (1984) states that by only focusing on performing
OEDs while the machine runs, the setup times are often reduced by 30-50 per cent.
Standardization (Stage 2)
The second implementation stage does include the previous stage, but also a presumed reduction of
time spent on other tasks, such as task 3, 6, 7, 9, 10, 11 and 20. This stage builds upon standardizing
the changeover with a setup sheet and rely on, and work for, continuous improvements.
No indepth SMED analysis has been implemented in this paper, and, therefore, it is difficult
to assess how tasks like attach overhead crane (3 and 9) and move mould into/from machine (7 and
Appendices
202
10) can be improved specifically. However, these tasks, which takes more than two minutes to
perform today, are assumed to be reduced by 20-25 per cent through continuous improvements.
Loosen bolts (6) and tighten bolts (11) are tasks that can be performed with two technicians
working in parallel, reducing time spent with up to two thirds (Shingo, 1984). By being innovative,
there are probably more tasks that can be performed working in parallel.
A great challenge for TePe in the changeover process is not the actual setup, but the time
between a finished setup and manufacturing non-defective products. This can be seen in
inspection/run machine to no defects (20). A color change often influence the color of new
products. In fact, there is often at least one transportation box with around 300 handles scrapped
after a setup due to discoloration. This means a value of 1 243 750 SEK annually. Once, not long
ago, a setup at TePe actually used 13 full transportation boxes before producing non-defective
products. It is, therefore, important to create standardized work procedures even for color changes.
Colors should, for example, always be changed from brighter spectrums to darker spectrums, which
is not the case today. An investment in purging compounds to clean moulding machines is also
recommended. The purging compound can be used when going from darker spectrums back to
brighter spectrums. By taking these actions, this step is estimated to be reduced by two thirds in the
long run.
Finally, each product requires its unique machine program for specifications such as
injection speed and cycle times. This is already implemented at TePe, and, therefore,
loading/adjusting program (19) is difficult to reduce further. However, the machine program for
each product should be updated regularly.
An implementation of this stage is predicted to reduce setup times by 57 per cent in the
long-term. This may seem incredible. But companies applying SMED in average reduce their setup
times by 95 per cent (Shingo, 1984). Over a year, Mitsubishi Heavy Industries, for example,
reduced setup times from 24 hours to two minutes and 40 seconds, and Toyota Motor reduced theirs
from eight hours to 58 seconds.
Investment costs
An engineer educated in SMED, advisably the production manager, is estimated to work full-time
with the project for two to three weeks to create a proper setup sheet. Every technician needs to
participate in the change. The technicians are estimated to put two full days of work each into the
project, including (1) helping creating the setup sheet, (2) brief education in the importance of
Improving Materials Supply Processes to Assembly Lines
203
kaizen and (3) discussions for improvements. This means wages to a value of 100 000 SEK.57 The
project is estimated to involve approximately six employees.
There are some other investments required as well. Purging compound is estimated to cost
10 000 SEK yearly.58 Even smaller initial investments may be needed, such as recording equipment
and a 5S implementation.
Since SMED is an ongoing improvement project, the initial implementation phase is part of
a longer improvement phase, in which technicians need to strive for continuous improvements (see
Chapter 7.5 for kaizen). Evaluating and updating the setup sheet and striving for improvements
need to be embedded in the work of both the engineer and each technician.
Some advice
An engineer should have the overall responsibility of the SMED implementation. However, the
technicians know the machines and the changeover process by heart and they are, therefore, vital in
constructing the setup sheet. Primarily, the actual net time for a changeover needs to be clocked
meticulously. This is most successfully achieved by recording the changeover, for the technicians to
watch themselves afterwards. Watching oneself in the work environment provides objectivity and
new improvement aspects (Shingo, 1984). Then, it is important for the engineer to organize
discussions between the technicians. Discussion begets ideas for time reductions, and if the ideas
come from technicians themselves the sense of belongingness increases as well as productivity.
The setup sheet should contain quite detailed information about the changeover. For
example, this includes expected time spent on each task, an operation manual with information
about each task, which tools/materials needed and where to find them etc. The setup sheet needs
regular updates through continouos improvements.
Both the engineer and the technicians, then, need to use their ingenuity in the process of
constantly reducing setup times. Chapter 2.8.5 supports with some theoretical suggestions on
general improvement ideas. Some questions to ask is presented below to inspire the investigators.
Are bolts actually needed to fasten the mould, or is there a more time-efficient solution?
Bolts are, for example, often longer than necessary, which leads to excessive tensioning. Investigate
the real function and purpose of the bolts, as well as minimum clamping force. Are all tools and
materials in perfect order next to the machine during a changeover? Why not? Are tools/moulds
functionally standardized for all products? Are standard fixtures used? How much of the actual tool
attachment can be prepared before a changeover? Can, for example, other bolts be attached in the
57 40 000 SEK for a full-time engineer working two to three weeks, and 60 000 SEK for five technicians working two full days. 58 Based on annual sales of 19 900 000, batch sizes of 14 400 and a 40 SEK cost per purge, with a purge every sixth changeover.

Appendices
204
new mould beforehand? Are operator and tool movements minimized during the changeover? Use 5
Whys to understand root causes.
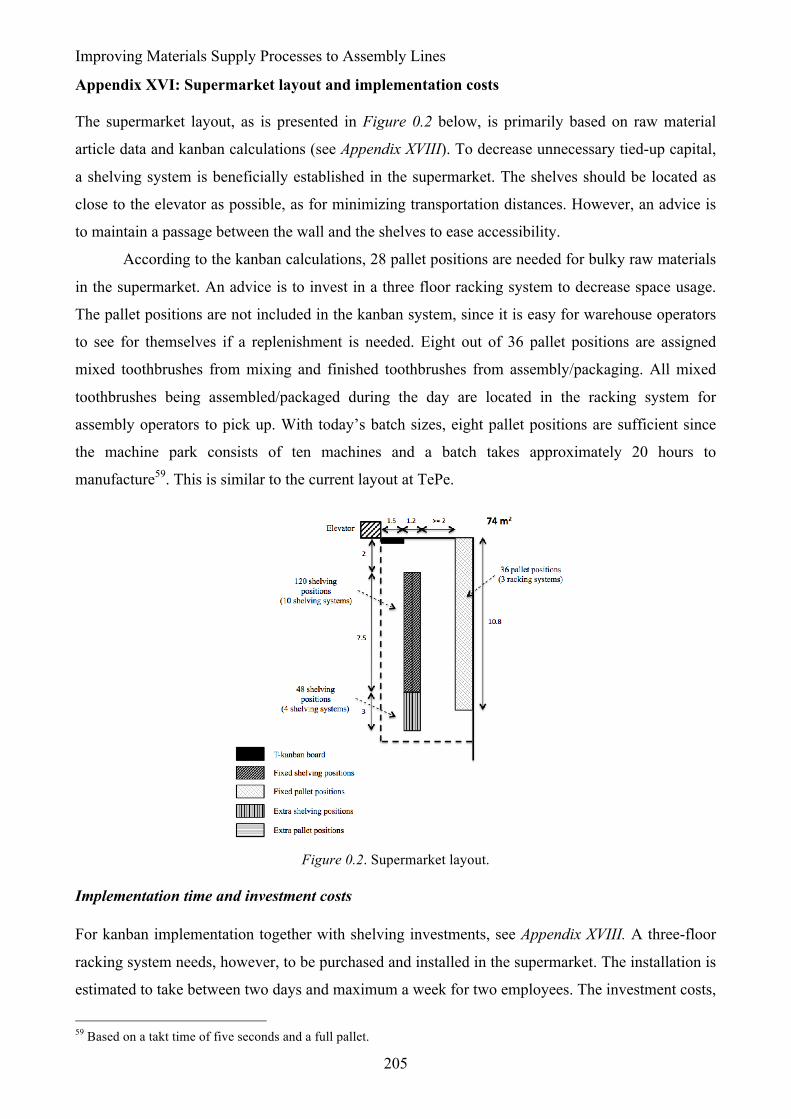
Improving Materials Supply Processes to Assembly Lines
205
Appendix XVI: Supermarket layout and implementation costs
The supermarket layout, as is presented in Figure 0.2 below, is primarily based on raw material
article data and kanban calculations (see Appendix XVIII). To decrease unnecessary tied-up capital,
a shelving system is beneficially established in the supermarket. The shelves should be located as
close to the elevator as possible, as for minimizing transportation distances. However, an advice is
to maintain a passage between the wall and the shelves to ease accessibility.
According to the kanban calculations, 28 pallet positions are needed for bulky raw materials
in the supermarket. An advice is to invest in a three floor racking system to decrease space usage.
The pallet positions are not included in the kanban system, since it is easy for warehouse operators
to see for themselves if a replenishment is needed. Eight out of 36 pallet positions are assigned
mixed toothbrushes from mixing and finished toothbrushes from assembly/packaging. All mixed
toothbrushes being assembled/packaged during the day are located in the racking system for
assembly operators to pick up. With today’s batch sizes, eight pallet positions are sufficient since
the machine park consists of ten machines and a batch takes approximately 20 hours to
manufacture59. This is similar to the current layout at TePe.
Figure 0.2. Supermarket layout.
Implementation time and investment costs
For kanban implementation together with shelving investments, see Appendix XVIII. A three-floor
racking system needs, however, to be purchased and installed in the supermarket. The installation is
estimated to take between two days and maximum a week for two employees. The investment costs,
59 Based on a takt time of five seconds and a full pallet.

Appendices
206
however, are what is estimated to be costly. A three-floor racking system containing twelve pallets
are estimated to cost 5 000 SEK, which gives a total of 15 000 SEK. Since the supermarket is
located on the second floor, and no forklifts fit in the elevator, investing in a manual pallet stacker is
a necessity. A manual pallet stacker is estimated to be purchased for 10 000 SEK. Not investing in a
racking system would put all pallet positions on the floor, making the supermarket more than twice
as big. This would interfere with the assembly/packaging area in future expansions, leading to
barriers in expanding.
Improving Materials Supply Processes to Assembly Lines
207
Appendix XVII: Extending the Kanban System
There are two opportunities to extend the kanban system in the future. On the one hand, a P-kanban
system can, and should, be investigated when this paper’s other recommendations have been
implemented and the results have been achieved. On the other hand, the physical kanban system can
be extended into partly an electronic kanban system in the future. However, none of these
opportunities have been investigated due to several reasons mentioned below.
There are many reasons why TePe should examine a dual kanban system, extending with P-
kanban cards for toothbrushes. TePe will, for example, be able to better manage their inventory
levels for toothbrushes (i.e. reduce tied-up capital), increase flow efficiency, place more control in
the hands of the operators, but most importantly, creating an orderly and highly visual system in the
entire production facility, which increases self-improvements. Many of the reasons are, however,
difficult to quantify, and this paper has not tried estimating the positive effects due to time
limitations. Another factor of not investigating the P-kanban system is the need of short setup times
and small batch sizes in order for such a system to be beneficial. Therefore, TePe needs to decrease
both of them before evaluating a P-kanban system. Moreover, TePe also needs to evaluate customer
collaboration to decrease variability in demand before implementing such a system. In fact, research
shows that the standard deviation on customer demand should not exceed 30 per cent of average
customer demand (Shingo, 1984; Olhager, 2013). At times, that same standard deviation reaches
100 per cent at TePe.
A physical kanban system can seem to be unnecessary and a waste of time for an operator.
After a few months, the assembly/packaging operator may stop moving the kanban cards to the
kanban board, forcing the warehouse operators to check each shelving position, which creates
annoyance. Therefore, it is important to avoid this scenario by informing employees about the
advantageous with the kanban board: everything related to raw materials is visible for anybody at
any time. With that said, it is important to keep the physical cards, but the registration of orders can
be simplified with, for example, finger scanners to scan barcodes instead of being registered
manually.
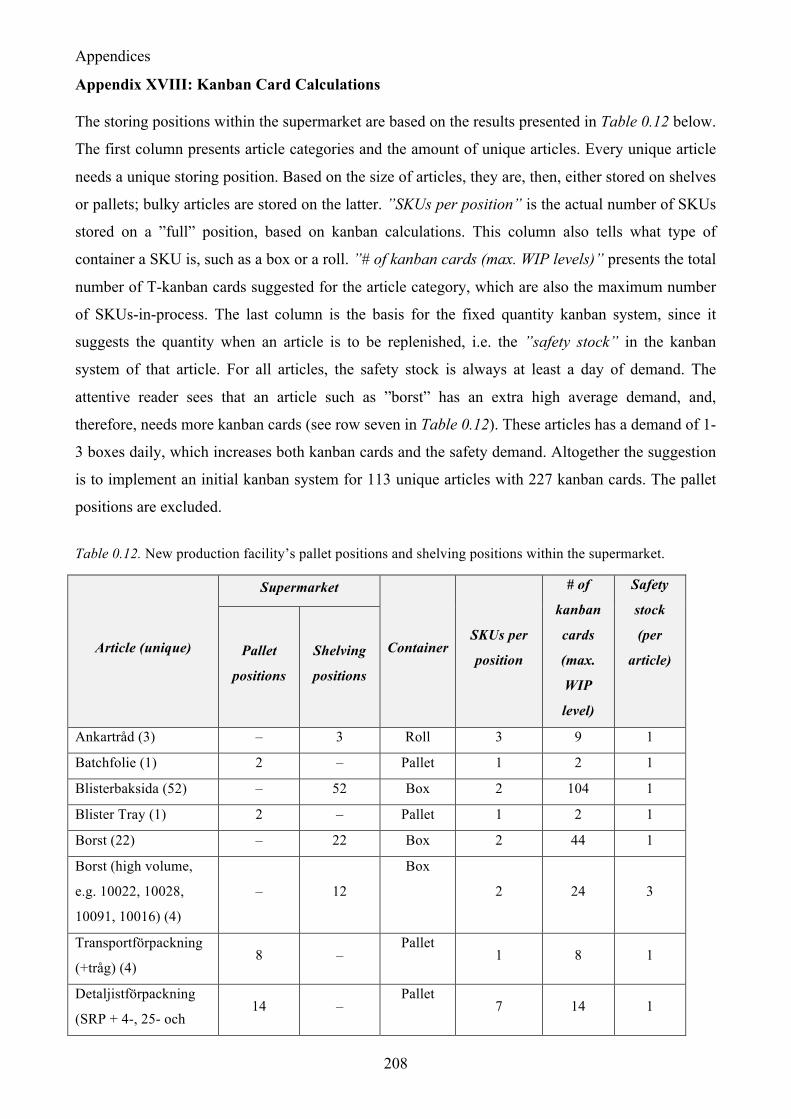
Appendices
208
Appendix XVIII: Kanban Card Calculations
The storing positions within the supermarket are based on the results presented in Table 0.12 below.
The first column presents article categories and the amount of unique articles. Every unique article
needs a unique storing position. Based on the size of articles, they are, then, either stored on shelves
or pallets; bulky articles are stored on the latter. ”SKUs per position” is the actual number of SKUs
stored on a ”full” position, based on kanban calculations. This column also tells what type of
container a SKU is, such as a box or a roll. ”# of kanban cards (max. WIP levels)” presents the total
number of T-kanban cards suggested for the article category, which are also the maximum number
of SKUs-in-process. The last column is the basis for the fixed quantity kanban system, since it
suggests the quantity when an article is to be replenished, i.e. the ”safety stock” in the kanban
system of that article. For all articles, the safety stock is always at least a day of demand. The
attentive reader sees that an article such as ”borst” has an extra high average demand, and,
therefore, needs more kanban cards (see row seven in Table 0.12). These articles has a demand of 1-
3 boxes daily, which increases both kanban cards and the safety demand. Altogether the suggestion
is to implement an initial kanban system for 113 unique articles with 227 kanban cards. The pallet
positions are excluded.
Table 0.12. New production facility’s pallet positions and shelving positions within the supermarket.
Article (unique)
Supermarket
Container SKUs per
position
# of
kanban
cards
(max.
WIP
level)
Safety
stock
(per
article) Pallet
positions
Shelving
positions
Ankartråd (3) – 3 Roll 3 9 1
Batchfolie (1) 2 – Pallet 1 2 1
Blisterbaksida (52) – 52 Box 2 104 1
Blister Tray (1) 2 – Pallet 1 2 1
Borst (22) – 22 Box 2 44 1
Borst (high volume,
e.g. 10022, 10028,
10091, 10016) (4)
– 12
Box
2 24 3
Transportförpackning
(+tråg) (4) 8 –
Pallet 1 8 1
Detaljistförpackning
(SRP + 4-, 25- och 14 –
Pallet 7 14 1
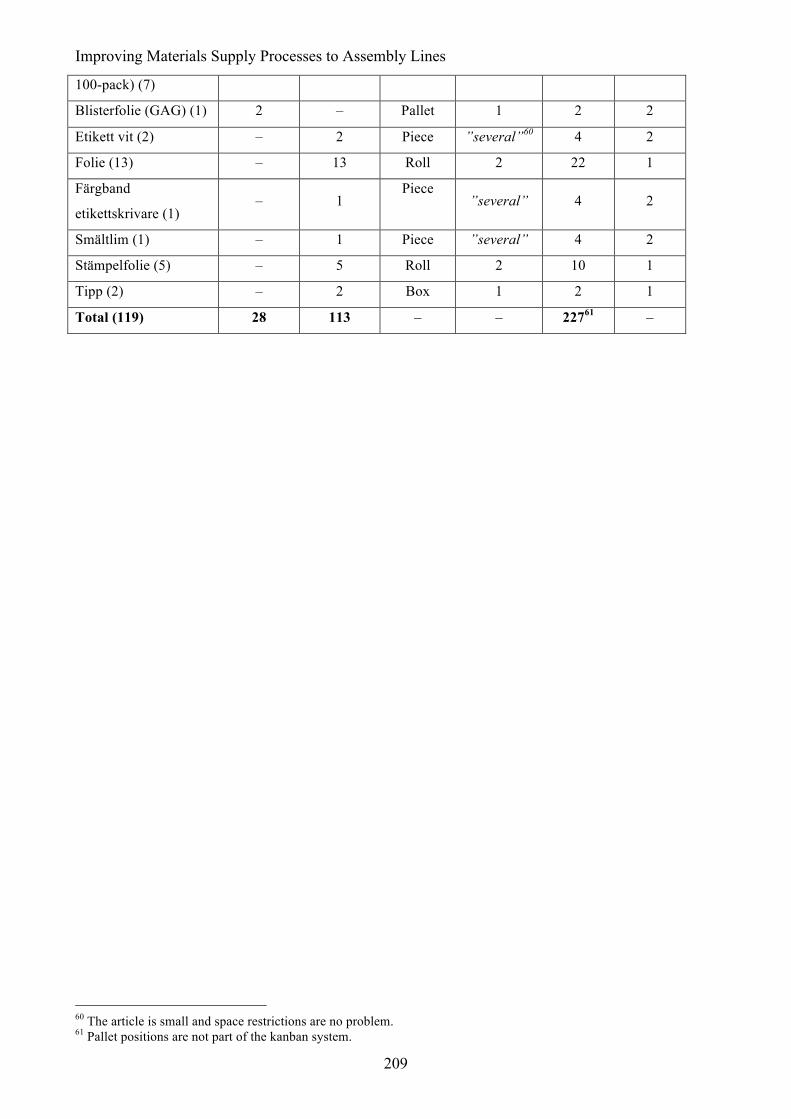
Improving Materials Supply Processes to Assembly Lines
209
100-pack) (7)
Blisterfolie (GAG) (1) 2 – Pallet 1 2 2
Etikett vit (2) – 2 Piece ”several”60 4 2
Folie (13) – 13 Roll 2 22 1
Färgband
etikettskrivare (1) – 1
Piece ”several” 4 2
Smältlim (1) – 1 Piece ”several” 4 2
Stämpelfolie (5) – 5 Roll 2 10 1
Tipp (2) – 2 Box 1 2 1
Total (119) 28 113 – – 22761 –
60 The article is small and space restrictions are no problem. 61 Pallet positions are not part of the kanban system.
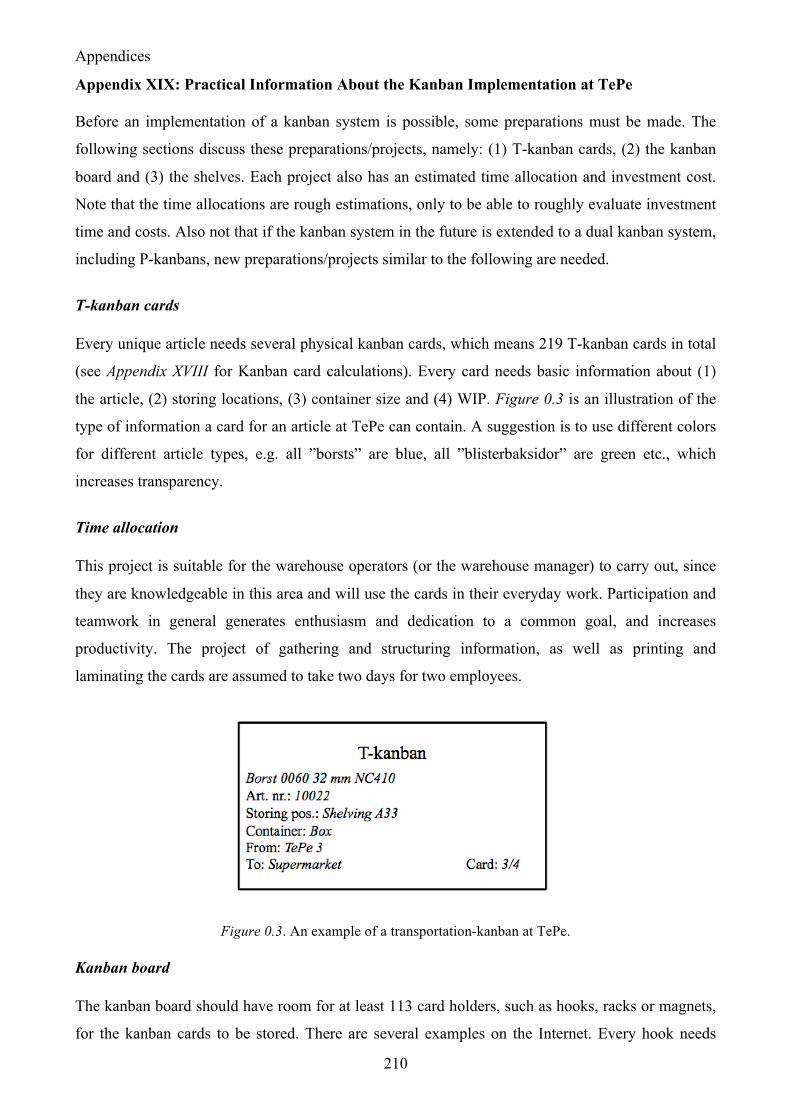
Appendices
210
Appendix XIX: Practical Information About the Kanban Implementation at TePe
Before an implementation of a kanban system is possible, some preparations must be made. The
following sections discuss these preparations/projects, namely: (1) T-kanban cards, (2) the kanban
board and (3) the shelves. Each project also has an estimated time allocation and investment cost.
Note that the time allocations are rough estimations, only to be able to roughly evaluate investment
time and costs. Also not that if the kanban system in the future is extended to a dual kanban system,
including P-kanbans, new preparations/projects similar to the following are needed.
T-kanban cards
Every unique article needs several physical kanban cards, which means 219 T-kanban cards in total
(see Appendix XVIII for Kanban card calculations). Every card needs basic information about (1)
the article, (2) storing locations, (3) container size and (4) WIP. Figure 0.3 is an illustration of the
type of information a card for an article at TePe can contain. A suggestion is to use different colors
for different article types, e.g. all ”borsts” are blue, all ”blisterbaksidor” are green etc., which
increases transparency.
Time allocation
This project is suitable for the warehouse operators (or the warehouse manager) to carry out, since
they are knowledgeable in this area and will use the cards in their everyday work. Participation and
teamwork in general generates enthusiasm and dedication to a common goal, and increases
productivity. The project of gathering and structuring information, as well as printing and
laminating the cards are assumed to take two days for two employees.
Figure 0.3. An example of a transportation-kanban at TePe.
Kanban board
The kanban board should have room for at least 113 card holders, such as hooks, racks or magnets,
for the kanban cards to be stored. There are several examples on the Internet. Every hook needs
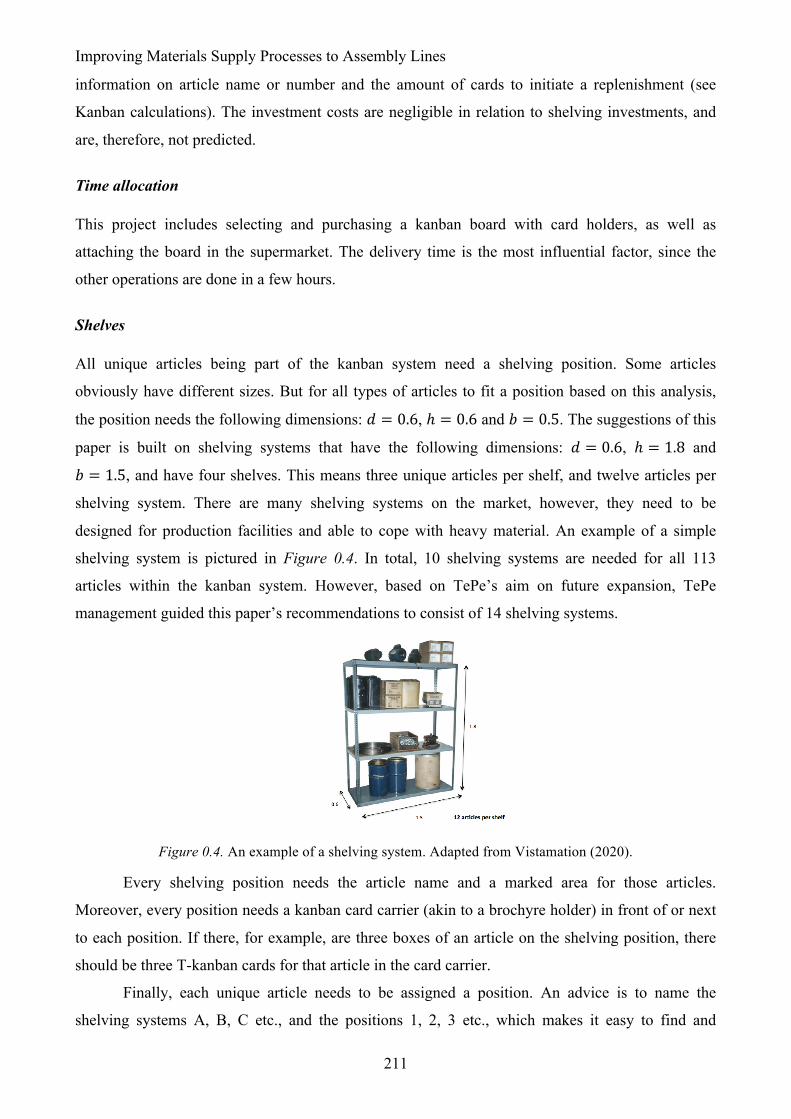
Improving Materials Supply Processes to Assembly Lines
211
information on article name or number and the amount of cards to initiate a replenishment (see
Kanban calculations). The investment costs are negligible in relation to shelving investments, and
are, therefore, not predicted.
Time allocation
This project includes selecting and purchasing a kanban board with card holders, as well as
attaching the board in the supermarket. The delivery time is the most influential factor, since the
other operations are done in a few hours.
Shelves
All unique articles being part of the kanban system need a shelving position. Some articles
obviously have different sizes. But for all types of articles to fit a position based on this analysis,
the position needs the following dimensions: 𝑑 = 0.6, ℎ = 0.6 and 𝑏 = 0.5. The suggestions of this
paper is built on shelving systems that have the following dimensions: 𝑑 = 0.6, ℎ = 1.8 and
𝑏 = 1.5, and have four shelves. This means three unique articles per shelf, and twelve articles per
shelving system. There are many shelving systems on the market, however, they need to be
designed for production facilities and able to cope with heavy material. An example of a simple
shelving system is pictured in Figure 0.4. In total, 10 shelving systems are needed for all 113
articles within the kanban system. However, based on TePe’s aim on future expansion, TePe
management guided this paper’s recommendations to consist of 14 shelving systems.
Figure 0.4. An example of a shelving system. Adapted from Vistamation (2020).
Every shelving position needs the article name and a marked area for those articles.
Moreover, every position needs a kanban card carrier (akin to a brochyre holder) in front of or next
to each position. If there, for example, are three boxes of an article on the shelving position, there
should be three T-kanban cards for that article in the card carrier.
Finally, each unique article needs to be assigned a position. An advice is to name the
shelving systems A, B, C etc., and the positions 1, 2, 3 etc., which makes it easy to find and
Appendices
212
understand the system. For example, all ”borsts” can be stored in shelving system A and B, while
all ”blisterbaksidor” can be stored in shelving system C, D, E etc. The storing position for a unique
”blisterbaksida” is, for example, named C3.
Time allocation
This project includes selecting and purchasing both shelving systems and card carriers. Those need
to be installed within the supermarket. Shelving positions need to be named and assigned articles, as
well as painted. If three to four employees work with the project, it is assumed to take one week. An
advice is that the warehouse operators and/or assembly/packaging operators are involved in the
implementation of this project, since they are affected on a daily basis by the end result.
Roles and responsibilities
Abovementioned preparations need project manager(s), who delegates responsibility to appropriate
personnel. An advice is to give the warehouse manager the overall responsibility of the kanban
implementation. He delegates the responsibilities of establishing kanban cards, the kanban board
and shelves. If further alterations in the supermarket layout is required, he has the responsibility of
collaborating with personnel responsible for the overall layout of the new production facility.
The kanban system also needs a kanban planner, whose responsibility is to update the
system regularly. In more detail, this means to (1) update (and cut) the kanban buffer, (2) do follow-
ups on potential stock-outs, (3) do practical checks on cards, shelves and the replenishment process,
(4) introducing new articles to the system if needed etc. Note that a kanban update does not mean
theoretically calculating new card numbers, but instead withdrawing a card from the system. An
update can be illustrated with a simple example. The kanban planner detects a shelving position
often being full. She simply withdraws a T-kanban card together with the raw material being
attached to the card, and informs the warehouse operators about her decision. If no stock-outs occur
due to the withdrawal, the card is permanently discarded.
Note that the position of kanban planner is not a full-time job, but a part-time responsibility
over the time a kanban system is used. Since the kanban system is a link between RMW and
assembly/packaging, the role of kanban planner can also, and is advisably, divided onto two
employees, one from each operation/department. By communicating over departments, many
hidden challenges will arise to the surface. An advice is to have short regular briefing meetings
about the kanban system. Initially, this means daily meetings, but can be decreased to weekly
meetings after the first four weeks.
Improving Materials Supply Processes to Assembly Lines
213
Time allocation
A kanban planner needs to be somebody well-versed in the production, with some knowledge about
Lean/TPS. This can either be personnel from management, who applies genchi genbutsu to a great
extent, or a team leader or operator within the production facility. An advice is to promote an
operator to such a position pushing responsibility down the corporate ladder, to increase a sense of
belongingness and productivity as well as to initiate continuous improvements all around the
company.
The kanban planner’s presence is most important over the first four weeks of the kanban
implementation due to her work of monitoring the materials flow and adjusting any unforeseen
issues, such as stock-outs of an article. The workload of the planner ease over time, even though she
needs to do monthly checks on the system. Note that the position of kanban planner is not a full-
time job, but merely a responsibility over the time a kanban system is used.
Implementation time and investment costs
Abovementioned projects all need to be carried out before an implementation of the kanban system
is possible. However, many of the projects can be executed in parallel. A rough estimation is that an
initial implementation of the kanban system requires no more than two weeks. Since TePe moves
their production facility in the kanban implementation process, the opportunity costs of not
manufacturing any toothbrushes is zero. Therefore, implementation time per se does not cost TePe
anything. However, employee wages are difficult to estimate since nobody is full, or even half, time
employed in any specific project. The wages are estimated to be low. Instead, the purchasing costs
of materials are the most influential factor affecting investment costs. A shelf system is assumed to
cost 3000 SEK, leading to a total investment cost of 42 000 SEK. By adding supplements and
employee wages, a budget of 60 000-80 000 SEK for the entire kanban implementation would be
sufficient.
Appendices
214
Appendix XX: 5S Implementation
The project of implementing 5S can be divided into two phases: (1) the actual implementation of 5S
and (2) sustaining 5S. Implementation time and costs as well as responsibilities are briefly
discussed below with some advice.
The actual implementation of 5S
Implementing 5S at TePe is seen as a low-cost investment. The project requires an employee, who
has the overall responsibility at each department. This is advisably either a manager or a supervisor.
There are two intrinsic parts of the project.
First, the manager/supervisor guides the process of every operation evaluating tools needed.
All tools can, for example, be gathered in one place, and if some tools are not used for a longer
period of time they are discarded. The necessary tools are, then, given a specific location, such as
on the wall or on a board to visually display which tools exist and are available. There are several
examples of such arrangements on the Internet. Such an investment is vital especially for injection
moulding, since it facilitates for a setup time reduction.
Second, each operator needs to meticulously clean and organize their work environment
before photographing the workplace. Cleanliness provides a safe work enviroment as well. The
photos need to be printed and laminated, and, then, placed next to each workplace.
Implementation time and costs
The arrangement of visually displaying tools is seen as a small investment, probably only a couple
of thousand SEK. It is estimated to take a maximum of two days to gather tools and prepare the
board/wall. Organizing workplaces is estimated to take a few hours per employee. Adding the
preparation of photos, it is estimated to take three days with little materials cost. The project
includes every workstation within an operation (e.g. injection moulding, assembly/packaging,
warehouse etc.), and, therefore, between 5-20 employees, who have responsibility for their own
workstation. Including both operators and the manager/supervisor, the entire project is estimated to
require a full-week salary for one employee, i.e. 20 000 SEK.
Sustaining 5S
It is harder to sustain a 5S implementation than it is to actually implement it. The employee needs to
systematically go through step one to three (i.e. sort, set in order, shine) every single day to keep the
new standards in place (10-15 min each day). Therefore, it is important for the manager/supervisor
to support, as well as educate, the employees in the process. As a starter, education and follow-ups
Improving Materials Supply Processes to Assembly Lines
215
on 5S can be integrated into the weekly meetings at TePe. It is important that the
manager/supervisor is well-versed in 5S, and its effects, such as, according to Olhager (2013) are,
better efficiency, higher quality, better visibility, less movement etc. Every change process starts
with the management being willing to change.
There needs to be at least two follow-ups, one after a few weeks and another after a few
months to evaluate how well 5S is sustained. The process of sustaining 5S does not require any
investment per se, but instead an incorporation of 5S as part of the culture and a habit at TePe (see
Chapter 7.3 for managerial principles). To continuously improve over time, smaller projects can be
performed as well, such as peer reviews for employees to ensure that defined schedules are being
met. Other commitments, such as cleaning schedules, working schedules etc., should also be
evaluated and updated over time.


Related Documents


![Legislative Assembly FRIDAY SEPTEMBER · 2014. 4. 8. · 772 Question8. [ASSEMBLY.] lines menti](https://static.cupdf.com/doc/110x72/5feb33dbf981091ed8517dd2/legislative-assembly-friday-september-2014-4-8-772-question8-assembly-lines.jpg)