2332-7731 (c) 2018 IEEE. Personal use is permitted, but republication/redistribution requires IEEE permission. See http://www.ieee.org/publications_standards/publications/rights/index.html for more information. This article has been accepted for publication in a future issue of this journal, but has not been fully edited. Content may change prior to final publication. Citation information: DOI 10.1109/TCCN.2019.2901787, IEEE Transactions on Cognitive Communications and Networking 1 Improving Liquidity in Secondary Spectrum Markets: Virtualizing Spectrum for Fungibility Marcela Gomez, Member, IEEE, Martin Weiss, Member, IEEE, and Prashant Krishnamurthy Abstract—Pricing mechanisms in the form of auctions have been the main method for spectrum assignment in the U.S. for over 20 years. The spectrum auctions carried out by the Federal Communications Commission (FCC) constitute a primary market for spectrum and have been affected by lack of flexibility which has re- sulted in inefficiencies in spectrum assignment, especially in environments where spectrum is considered scarce. In recent years, we have observed significant efforts to increase efficiency in spectrum assignment and use. Among those efforts is the design and adoption of secondary markets. Secondary markets have the potential to address inefficiencies arising in primary markets over time or those that occur through features of auction mechanisms by enabling spectrum to be assigned to users who value it the most. Furthermore, liquid secondary markets have enabled the explicit management of risk in other markets, such as agriculture and commodities, through futures and options trading. In this paper, we advance the study of liquidity in secondary markets that was begun in our previous work. We explore (i) the reasons that may have hindered the emergence of liquid secondary markets for radio spectrum and (ii) what we might change to promote secondary markets. With these objectives in mind, we study various configurations for the design of secondary markets, which account for the physical constraints inherent to electromag- netic spectrum. In addition, we study technical alternatives that would permit us to develop an appropriate, tradeable, spectrum-related commodity. The results of our analysis show that lack of fungibility has an adverse impact on secondary market liquidity. To address this outcome, we propose virtualization of spectrum resources into fungible chunks and show that this improves market liquidity by yielding viable market outcomes in all the scenarios we tested. Index Terms—Secondary Spectrum Markets, Spectrum Virtualization, Spectrum Management, Spectrum Fungi- bility, Agent-based Modeling The authors are with the Department of Informatics and Net- worked Systems of the School of Computing and Information of the University of Pittsburgh. Corresponding e-mails: [email protected], [email protected] and [email protected] I. I NTRODUCTION AND BACKGROUND Over the years, a variety of approaches to efficient and effective spectrum allocation and assignment have been adopted. Regulation was initially insti- tuted to avoid harmful interference among spec- trum users. The resulting spectrum policy separates spectrum use in space, time, and frequency (or electrospace [1]). Thus, an applicable band plan associates a license with a particular electrospace and defines what services may be provided [2]. As the importance of spectrum increases in society, researchers and policymakers have sought ways to increase access to and the utility of this resource while taking the challenge of harmful interference into consideration. Consequently, what traditionally required a license that was obtained through an administrative process may now be acquired through new mechanisms: licenses may be purchased, spec- trum may be shared by several different users, or users may avail themselves of designated open access, unlicensed bands. Licenses have the economic characteristics of a “property right” 1 , which led the Nobel Laureate Ronald Coase to argue in 1959 that a pricing mechanism should be used for resolving harmful in- terference rather than administrative procedures [7]. He pointed out that under a proper definition and en- forcement of property rights, the parties involved in a dispute could bargain over the allocation of rights. He effectively argued that markets could efficiently assign spectrum to the highest valued uses, as they do with many other scarce resources. In the specific case of the U.S., the Federal Communications Com- mission’s (FCC) approach to spectrum management 1 Economically, property rights can be thought of as a social con- struct necessitated by our desire to separate ownership and decision- making as a consequence of economic specialization [3]. In fact, this notion really refers to a bundle of rights [4], [5]. It is also important to note that the “property rights” associated with spectrum allocations relate to usage rights rather than actual ownership rights [6].

Welcome message from author
This document is posted to help you gain knowledge. Please leave a comment to let me know what you think about it! Share it to your friends and learn new things together.
Transcript

2332-7731 (c) 2018 IEEE. Personal use is permitted, but republication/redistribution requires IEEE permission. See http://www.ieee.org/publications_standards/publications/rights/index.html for more information.
This article has been accepted for publication in a future issue of this journal, but has not been fully edited. Content may change prior to final publication. Citation information: DOI 10.1109/TCCN.2019.2901787, IEEETransactions on Cognitive Communications and Networking
1
Improving Liquidity in Secondary SpectrumMarkets: Virtualizing Spectrum for Fungibility
Marcela Gomez, Member, IEEE, Martin Weiss, Member, IEEE,and Prashant Krishnamurthy
Abstract—Pricing mechanisms in the form of auctionshave been the main method for spectrum assignmentin the U.S. for over 20 years. The spectrum auctionscarried out by the Federal Communications Commission(FCC) constitute a primary market for spectrum andhave been affected by lack of flexibility which has re-sulted in inefficiencies in spectrum assignment, especiallyin environments where spectrum is considered scarce.In recent years, we have observed significant efforts toincrease efficiency in spectrum assignment and use. Amongthose efforts is the design and adoption of secondarymarkets. Secondary markets have the potential to addressinefficiencies arising in primary markets over time or thosethat occur through features of auction mechanisms byenabling spectrum to be assigned to users who value it themost. Furthermore, liquid secondary markets have enabledthe explicit management of risk in other markets, such asagriculture and commodities, through futures and optionstrading.
In this paper, we advance the study of liquidity insecondary markets that was begun in our previous work.We explore (i) the reasons that may have hindered theemergence of liquid secondary markets for radio spectrumand (ii) what we might change to promote secondarymarkets. With these objectives in mind, we study variousconfigurations for the design of secondary markets, whichaccount for the physical constraints inherent to electromag-netic spectrum. In addition, we study technical alternativesthat would permit us to develop an appropriate, tradeable,spectrum-related commodity. The results of our analysisshow that lack of fungibility has an adverse impact onsecondary market liquidity. To address this outcome, wepropose virtualization of spectrum resources into fungiblechunks and show that this improves market liquidity byyielding viable market outcomes in all the scenarios wetested.
Index Terms—Secondary Spectrum Markets, SpectrumVirtualization, Spectrum Management, Spectrum Fungi-bility, Agent-based Modeling
The authors are with the Department of Informatics and Net-worked Systems of the School of Computing and Information of theUniversity of Pittsburgh. Corresponding e-mails: [email protected],[email protected] and [email protected]
I. INTRODUCTION AND BACKGROUND
Over the years, a variety of approaches to efficientand effective spectrum allocation and assignmenthave been adopted. Regulation was initially insti-tuted to avoid harmful interference among spec-trum users. The resulting spectrum policy separatesspectrum use in space, time, and frequency (orelectrospace [1]). Thus, an applicable band planassociates a license with a particular electrospaceand defines what services may be provided [2]. Asthe importance of spectrum increases in society,researchers and policymakers have sought ways toincrease access to and the utility of this resourcewhile taking the challenge of harmful interferenceinto consideration. Consequently, what traditionallyrequired a license that was obtained through anadministrative process may now be acquired throughnew mechanisms: licenses may be purchased, spec-trum may be shared by several different users,or users may avail themselves of designated openaccess, unlicensed bands.
Licenses have the economic characteristics of a“property right”1, which led the Nobel LaureateRonald Coase to argue in 1959 that a pricingmechanism should be used for resolving harmful in-terference rather than administrative procedures [7].He pointed out that under a proper definition and en-forcement of property rights, the parties involved ina dispute could bargain over the allocation of rights.He effectively argued that markets could efficientlyassign spectrum to the highest valued uses, as theydo with many other scarce resources. In the specificcase of the U.S., the Federal Communications Com-mission’s (FCC) approach to spectrum management
1Economically, property rights can be thought of as a social con-struct necessitated by our desire to separate ownership and decision-making as a consequence of economic specialization [3]. In fact, thisnotion really refers to a bundle of rights [4], [5]. It is also importantto note that the “property rights” associated with spectrum allocationsrelate to usage rights rather than actual ownership rights [6].

2332-7731 (c) 2018 IEEE. Personal use is permitted, but republication/redistribution requires IEEE permission. See http://www.ieee.org/publications_standards/publications/rights/index.html for more information.
This article has been accepted for publication in a future issue of this journal, but has not been fully edited. Content may change prior to final publication. Citation information: DOI 10.1109/TCCN.2019.2901787, IEEETransactions on Cognitive Communications and Networking
2
has evolved considerably since the 1920s. This in-cludes the opening of unlicensed bands and the useof auctions to assign licenses. As we have arguedelsewhere, these are some mechanisms that may beused in the governance of a common pool resource[4].
About 25 years ago, regulators began implement-ing Coase’s recommendation by assigning radiospectrum licenses through economic rather thanadministrative means. Since then, many spectrumauctions have been conducted worldwide. Theseauctions are the primary markets for spectrum,much like an initial public offering (IPO) for equityshares. Equity owners use secondary markets for anumber of purposes, including valuing their currentholdings, adjusting their holdings through purchasesor sales, writing derivative financial instruments(e.g. put and call options), etc.
The FCC recognized the importance of secondarymarkets in their 2002 Report and Order [8] andsought to build a framework to enable them. Theyframed secondary markets not as a substitute forspectrum auctions but rather as a means to correctpossible inefficiencies resulting from the primarymarket and an alternative for carriers to respond tochanging technologies and market conditions. Thus,secondary markets were expected to help alleviatespectrum scarcity by making underutilized spectrumheld by current licensees readily available to newuses and users, hence promoting the developmentof novel and more spectrum efficient technologies.2
As pointed out in [6], “[w]ell functioning secondarymarkets can help ensure that, as demand and supplyshift, spectrum will migrate to more efficient uses,including those by parties outside of the initialallocation”.
In this paper, we examine an approach for acquir-ing spectrum usage rights through a secondary mar-ket mechanism. Our work focuses on the complexityof defining spectrum as a market commodity, whichcalls for a thorough examination of the conditionsthat would yield positive market outcomes (e.g.,
2See the statement of Professor Peter Cramton in the SecondaryMarket Forum of the Federal Communications Commission. May 31,2000.
market thickness3 and thus liquidity4). We buildupon our previous work [10], [11] to understandthe impact of non-fungible spectrum. In this way,we use agent-based modeling (ABM) to simulatesecondary markts. We modified the ABM tool,called SPECTRAD, to take spectrum fungiblityinto acccount through the fungibilty scores that wepreviously developed in [11], [12]. To facilitate thecomparison with the previously reported work [10],[13], we made the smallest changes possible toSPECTRAD to implement this new functionality.The agent-based model developed for this paperseeks to evaluate how agents interact when theyface spectrum fungibility constraints. Additionally,we propose a model where virtualized spectrumcommodities may alleviate the limitations imposedby the lack of spectrum fungibility.
The remainder of our paper is organized as fol-lows: in section II we include an overview of exist-ing research work on the spectrum markets area andhow our research differs from these publications;in section III we show how we adapt fungibilityconsiderations to spectrum markets via fungibilityscores; in section IV we explore how resource virtu-alization may improve market liquidity, and finally,in sections V and VI we present our conclusions andfuture research directions. Specific details on ourapproach to calculate fungibility scores have beenincluded in Appendix A.
II. RELATED WORK
Since 2002, various researchers have focused onthe development of secondary spectrum markets, at-tending to the challenges inherent to the commodityto trade, the market environment, and the technicalcharacteristics of the systems where spectrum isutilized. In what follows we explore some of the
3An example of a thick market is the Amazon marketplace, whichhas a large amount of participants who are ready to transact with oneanother. Thickness results in more sellers being attracted by all thepotential buyers and more buyers coming to this marketplace due tothe increasing variety of sellers [9].
4The Palgrave Dictionary of Economics writes “A thin marketis a market with few buying or selling offers. ... A thin marketis characterized by low trading volume, high volatility, and highbid-ask spreads ... Market thinness is a particular source of marketilliquidity. Liquidity is broadly defined as the ease of trading asecurity.” http://j.mp/1pRJjHY
2332-7731 (c) 2018 IEEE. Personal use is permitted, but republication/redistribution requires IEEE permission. See http://www.ieee.org/publications_standards/publications/rights/index.html for more information.
This article has been accepted for publication in a future issue of this journal, but has not been fully edited. Content may change prior to final publication. Citation information: DOI 10.1109/TCCN.2019.2901787, IEEETransactions on Cognitive Communications and Networking
3
existing approaches and how these differ from thefocus of our research5.
Extensive work has been published on differenttypes of auction mechanisms to enable dynamicspectrum access [14]–[18]. These works, and thecitations therein, explore how various types of auc-tions may improve efficiency in spectrum assign-ment, allow buyers to more flexibly define theresources they need (e.g., auctioning spectrum asa continuous good instead of as a collection ofdiscrete items), and how auction mechanisms mayaffect the bidding strategies of spectrum buyers aswell as the revenue perceived by spectrum hold-ers. For instance, the authors in [15], [16] focuson developing frameworks where truthful spectrumauctions can be used to enable spectrum reuse.Other proposals include the design of new auctionmechanisms that increase the diversity of the usersthat obtain resources in an auction, thus exploringthe trade-off between social welfare maximizationand provision of minimum service guarantees [18].
An important research topic is the design of real-time spectrum markets, which have been studied in[19]–[22]. For instance, in [19], the authors explorethe development of real-time secondary markets,where the primary license-holder is a GSM-basedcellular carrier. Their main focus is to assess howthis type of real-time trading mechanisms impactsspectrum utilization and performance of the primarylicense-holder, and whether this scheme is techni-cally and economically viable. In [20], the studyof markets is framed within the context of cog-nitive radio technologies. Besides real-time spec-trum markets, the author also explores the conceptof interruptible spectrum, which seeks to enablesharing of public sector spectrum in non-emergencyconditions. In [23], the authors compare orthogonal(spectrum overlay) and non-orthogonal (spectrumunderlay) sharing. The first scenario involves leasingof spectrum by a primary owner to secondary usersas exclusive but temporary rights. In the secondscenario, secondary users are allowed to transmitin the primary user’s band and they are chargedfor the interference they cause. For their analysis,the authors consider only one primary user and one
5We do not claim that this section presents a complete survey ofthe literature and we acknowledge that there are far more works thathave been developed in multiple areas of spectrum trading. In thissection we focus on the works that are relevant to different stages ofour research.
secondary user.
More comprehensive and complex network defi-nitions that rely on spectrum trading are presentedin [24]–[26]. These works do not necessarily rely onspecific auction mechanisms; instead, they presentadditional settings where the benefits of market-based approaches can enhance spectrum utilization.In a similar vein, in [27], the authors focus onoptimization methods to explore markets whereheterogeneous spectrum resources are leased by,and subsequently shared among secondary users.The authors consider a duopoly of wireless serviceproviders that offer spectrum in distinct frequencybands. Secondary users opt for resources belongingto the service provider that maximizes their utility,which is calculated in terms of achievable linkcapacity and price. In [28], the authors study adynamic market setting where a cognitive mobilenetwork operator (C-MVNO) (sub)leases spectrumto unlicensed secondary users. The C-MVNO doesnot own spectrum, instead, it obtains resources by 1)sensing available spectrum holes and/or 2) leasingresources from current spectrum owners. Resourceallocation from the C-MVNO to the secondaryusers is modeled as a Stackelberg game, where thecognitive operator is the leader. The objective ofthe cognitive operator is to determine the optimalamount of sensing and leasing it has to perform, andsubsequently the optimal resource price it needs toset so as to maximize its profit. On the other hand,secondary users seek to maximize their utility whichis a function of the required bandwidth and the priceset by the C-MVNO. In other words, secondaryusers choose an amount of bandwidth depending onthe price previously set by the cognitive operator. Inboth studies, [27] and [28], the price of resourcesis set by spectrum lessor (to a value that maximizesits profits); hence, secondary users cannot directlyaffect the price to pay.
In terms of how different market approaches havebeen tested, modeling has been a widely used mech-anism. This is due to the lack of fully functionalsecondary spectrum markets in the real world. Theobjective of modeling that we are interested in con-sists on exploring how different market participantsbehave and how this influences market outcomes.In this context, game theory has been extensivelyutilized [29]–[31]. Another important method for
2332-7731 (c) 2018 IEEE. Personal use is permitted, but republication/redistribution requires IEEE permission. See http://www.ieee.org/publications_standards/publications/rights/index.html for more information.
This article has been accepted for publication in a future issue of this journal, but has not been fully edited. Content may change prior to final publication. Citation information: DOI 10.1109/TCCN.2019.2901787, IEEETransactions on Cognitive Communications and Networking
4
modeling markets is agent-based modeling (ABM)6.ABM has mainly been used for testing and desigin-ing electricity markets. The work presented in [10],[13] is, to the best of our knowledge, one of themost thorough examples of using ABM to studythe viability of secondary spectrum markets.
Our work differs from available publications inthat we provide a throrough analysis on the fungi-bilty of spectrum by proposing a quantitative metric(i.e., fungibility scores) that could allow us to assesshow the lack of spectrum fungibility impacts marketviability. In computing the fungibility scores, we areinterested in finding what bandwidth or capacity, atvarious frequencies, may be considered fungible orinterchangeable (e.g., of the same economic valueor perfect substitutes). Hence, we refined the initialcalculation of fungibility scores (presented in [11])and defined a metric to compare spectrum chunksin terms of the achievable capacity in differentbands7. Further, in our effort to define spectrumas a tradeable commodity, we study how technicalalternatives may render the thickness that marketsneed in order to be liquid. To this end, by relyingon an existing and mature technology, we proposea model where virtualized spectrum commoditiesmay alleviate the limitations imposed by the lackof spectrum fungibility.
Along these lines, the overall goal of our studyis to present alternatives that can result in viablesecondary spectrum markets. Our approach is toincrease spectrum buyers’ participation by providingthem with a quantitative metric to assess how theresources available in the market compare to theirpreferred resources. In this way, potential buyersmay be attracted to a marketplace that they wouldotherwise dismiss. From the perspective of marketsupply, our study also focuses on how we canleverage existing technologies to take a step closertoward commodifying spectrum, hence making itpossible, for a frequency band, to fit a wider arrayof users and uses. In this manner, this study can beextrapolated to other types of auction mechanismand can be used as a basis for the design of differentsecondary spectrum market models.
6ABM is a “form of computational modeling whereby a phe-nomenon is modeled in terms of agents and their interactions.” [32].In turn, agents are modeled with particular properties that determinetheir behavior and hence their interactions in the environment [32].
7A detailed overview on how fungibility scores are calculated hasbeen included in Appendix A at the end of this paper.
III. INCORPORATING SPECTRUM FUNGIBILITYLIMITATIONS TO SECONDARY MARKETS
In this work, we incorporate fungibility scores ina trading environment to test the viability of sec-ondary markets. We expect imperfect fungibility tohave a negative impact on the liquidity of secondarytrading markets. To assess the magnitude of this, weinclude fungibility scores as a key addition to theagent-based spectrum trading model, SPECTRAD[10]. We have focused on the frequency dimensionof electrospace, so fungibility scores are a means toaccount for spectrum heterogeneity and frequencyavailability versus the specific band preferences ofa market participant.
In what follows, we describe the market char-acteristics considered to develop a new version ofSPECTRAD that would enable us to study theconsequences of imperfect spectrum fungibility ina synthetic market.
A. Market Model
Throughout our analysis, we compare the resultsobtained with those presented in [13] to assess howmarket viability is affected by limited spectrumfungibility. Hence, we have maintained one of themarket structures studied in [13], which we brieflydetail in what follows:
1) Market Type: Using the market modelingalternatives presented in [10], [13], we focus onmodeling a spectrum exchange with Band Manager(BM) functionality. The BM is a broker-like en-tity that holds, auctions and assigns the spectrumavailable in the market. Hence, the BM is also incharge of reclaiming the spectrum resources afterthe lease or license transfer periods have ended. ABM handles the process of granting authorizationsfor spectrum use; however, it is not responsible forthe configuration of the radio equipment needed tomake use of the acquired spectrum. We have chosenthis market configuration as it allows us to havea middleman that can manage available resources,thus avoiding the overhead of direct interactionsamong all market participants. Additionally, thisconfiguration allows us to center our attention onthe definition of spectrum as a tradeable commodity.
2) Tradeable commodity: The commodity tradedin this market is a basic (spectrum) trading unitwhich is referred to as basic bandwidth unit (BBU).
2332-7731 (c) 2018 IEEE. Personal use is permitted, but republication/redistribution requires IEEE permission. See http://www.ieee.org/publications_standards/publications/rights/index.html for more information.
This article has been accepted for publication in a future issue of this journal, but has not been fully edited. Content may change prior to final publication. Citation information: DOI 10.1109/TCCN.2019.2901787, IEEETransactions on Cognitive Communications and Networking
5
In our model, BBUs consist of spectrum units of200 KHz of bandwith in the 1900 MHz band.
3) Market Participants: Besides the Band Man-ager, spectrum license requesters (SLRs) also par-ticipate in the market. The SLRs’ objective is toobtain a spectrum lease or license transfer to fulfilltheir traffic demand. We assume that every SLRhas the infrastructure facilities to use the spectrumresources obtained in the market. Additionally, it isimportant to highlight that each SLR has a preferredfrequency for providing its services, which couldbe different from the BM spectrum holdings (at thetime of purchase)8.
4) Spectrum Valuation: We focus on a model thattakes into account the consequences of the lack ofspectrum fungibility for market design and develop-ment. For this reason, we measure an SLR’s spec-trum valuation in terms of the difference between itspreferred capacity and the capacity obtained in themarket. Our specific approach consisted of limitingthe maximum amount that an SLR is willing to payfor an available frequency using the correspondingcapacity fungibility score.
The original SPECTRAD model defines a re-lationship between the amount that a user wouldpay for obtaining additional spectrum in the marketand the price a user would pay for (or invest in)an alternate technology (AT) (e.g., wireline sys-tems, investments to improve spectrum efficiency,unlicensed bands, etc.) that would allow them tofulfill specific traffic requirements. The inclusion ofATs frames the market process as part of a broaderdecision process that a secondary user faces (whichhas been elaborated more broadly by Cui et al. [33]).In this context, the price of ATs essentially sets amaximum price that a user is willing to pay forspectrum9. SPECTRAD allows different valuationsfor ATs for different users to capture the ideathat different spectrum entrants may have differentapplications in mind. It is also important to notethat SPECTRAD assumed that investments in ATspersist over several trading periods because they
8The participation of Spectrum License Holders (SLHs) is im-plicit in our model. We expect the BM spectrum holdings to stemfrom unused spectrum belonging to current incumbents i.e., SLHs.However, at this point of our analysis, we do not model their explicitinteractions and dynamic changes in the market.
9Note that we assume that, for any given user, the performance(i.e., capacity) that it can obtain through AT investments matches theperformance of their preferred frequency band (which may not bethe same band available in the market).
are typically associated with capital investments thatmust be amortized.
The relationship between the willingness to payfor spectrum and ATs is presented in equation (1),where numBBUs and numATs correspond to thenumber of BBUs and AT units, respectively, neededfor meeting specific traffic requirements. Limit-PriceBBU and LimitPriceAT represent the maxi-mum price a given user is willing to pay for BBUsor AT units, respectively.
(numBBUs)(LimitPricePerBBU) = (numATs)(LimitPriceAT)(1)
In turn, numBBUs and numATs are defined asthe ratio between the traffic to serve and the ca-pacity per BBU or AT, respectively. In other words,these represent the amount of spectrum or AT unitsneeded to provide a specific service.
From these expressions and definitions, it followsthat the maximum or limit price that a user willpay for a BBU is given by (2). In this expression,we observe that the measure of proportionalitybetween the maximum price to pay for spectrum,LimitPriceBBU, and the maximum price to payfor ATs, LimitPriceAT , is given by the ratio of thecapacity obtained with these two types of resources.In turn, this ratio corresponds to the (capacity-based) fungibility score we propose (3)10.
LimitPriceBBU =capacityPerBBUcapacityPer AT
× LimitPriceAT (2)
LimitPricePerBBU = FungScore × LimitPriceAT (3)
From (3), we expect that as the capacity fungibil-ity score decreases, so does the maximum amountthat users will pay for the spectrum available in themarket. Thus, the level of comparability betweentwo frequency bands drives the resource valuation,which we set to one of three levels: low, mediumor high. These levels stem from dividing the rangeof fungibility values into three equally sized sets.
The maximum price per AT unit (PAT ) alsofollows three valuation levels, which are distributed
10This definition complies with our assumption that in a certaindegree, AT units and BBUs can be considered as perfect substitutes.In this way, x BBUs provide the same level of utility (i.e., capacity)as y AT units. This results in a linear relationship between thesetwo factors, which further translates in a linear relationship in themaximum willingness to pay.

2332-7731 (c) 2018 IEEE. Personal use is permitted, but republication/redistribution requires IEEE permission. See http://www.ieee.org/publications_standards/publications/rights/index.html for more information.
This article has been accepted for publication in a future issue of this journal, but has not been fully edited. Content may change prior to final publication. Citation information: DOI 10.1109/TCCN.2019.2901787, IEEETransactions on Cognitive Communications and Networking
6
in the range, rP, between the minimum (PATmin)and maximum (PATmax) allowable AT prices (4),as shown by expressions (5), (6) and (7). In thisway, users in each valuation level will be assigneda uniformly distributed random value in the corre-sponding range.
rP =(PATmax − PATmin)
3(4)
PATl = [(PATmin), (PATmin + rP)] (5)
PATm = [(PATmin + rP + 1), (PATmin + 2 × (rP))] (6)
PATh = [(PATmin + 2 × (rP) + 1), (PATmax)] (7)
Note that in this non-perfect fungibility study,we shall allow that an SLR’s spectrum valuation isinversely proportional to the same SLR’s valuationof AT units. For instance, when an SLR has a lowspectrum valuation, it will be assigned AT pricesfrom the range belonging to PATh .
From the previous section, it is possible to obtaina score for any pair of frequencies. For the purposesof our analysis, we focus on a ‘worst-case’ scenariowhere the SLRs have the lowest valuation for theavailable spectrum (i.e., the available frequency is1900 MHz while the SLRs’ preferred frequenciesare in the 700MHz band); hence, we used 0.3448as the fungibility score for calculating the pricelimit expressed in (3). This value corresponds tothe probabilistic fungibility score that results fromcomparing the capacity obtained with 1900 MHzand 700 MHz when both frequencies operate witha bandwidth of 200 KHz. A detailed explanation ofthis calculation is included in Apendix B2. Addi-tionally, we have set PATmin and PATmax as 100 and250 monetary units, respectively.
5) Market Transactions: The market transactionsin SPECTRAD are driven by sealed-bid, second-price auctions11. In the initial bidding round, eachuser will post a bid according to its own BBU andAT valuation level (i.e., private value), as explainedin the previous subsection. If the demand is greater
11In sealed-bid, second-price auctions, the strategy of bidding one’shighest value weakly dominates all other strategies. This stems fromthe fact that “bidding your maximum value leaves you as well off as,or better off than, bidding any other value. The amount that you bidaffects whether you win, but it does not affect how much you pay ifyou win, which equals the second-highest bid” [34]. In other words,truthful bidding dominates an overbidding stategy.
than the supply, the bids are organized in descendingorder and the available resources are temporarilyassigned to the SLRs with the highest bids. Theminimum bid that temporarily receives resources isconsidered as the current auction cutoff price (i.e.,clearing price), and it is announced to all SLRs.In this way, for each subsequent round, the SLRshave the option to adjust their bids according tothe cutoff price in order to remain competitive inthe market. The auction ends when we have notperceived a change in the cutoff price in the lastfive bidding rounds or when we reach a (predefined)maximum number of bidding rounds. At this point,the SLRs with bids above the cutoff price receivetheir requested resources until the BM supply isexhausted. The SLRs that could not obtain all thenecessary spectrum units from the market will optfor an amount of AT units that could permit themto fulfill their traffic demand.
When the demand is not greater than the supply,there is no competitive bidding. Hence, all biddersreceive their requested resources and they pay theminimum cutoff price established by the BM. In thisparticular scenario, it corresponds to 30 monetaryunits.
B. Simulation Environment
We have maintained the agent-based simulationenvironment and running considerations made in[13]12. For market evaluation, we have considereddifferent combinations of spectrum users (SLRs)and spectrum supply conditions (i.e., under supplyand oversupply). To quantify the latter, we consideran additional parameter, R, defined in (8). In thisequation, totBBUs corresponds to the amount ofspectrum bandwidth units available in the marketand numSLRs refers to the number of marketparticipants in a particular scenario. In this way,lower values of R represent spectrum undersupplyconditions, while higher values of R correspond tospectrum oversupply.
R =totBBUsnumSLRs
(8)
12The original and revised versions of SPECTRAD were de-veloped in Java and they run using REPAST Simphony, anagent-based modeling platform that works with the EclipseIDE. Full information on REPAST Simphony can be found inhttp://repast.sourceforge.net/repast_simphony.php
2332-7731 (c) 2018 IEEE. Personal use is permitted, but republication/redistribution requires IEEE permission. See http://www.ieee.org/publications_standards/publications/rights/index.html for more information.
This article has been accepted for publication in a future issue of this journal, but has not been fully edited. Content may change prior to final publication. Citation information: DOI 10.1109/TCCN.2019.2901787, IEEETransactions on Cognitive Communications and Networking
7
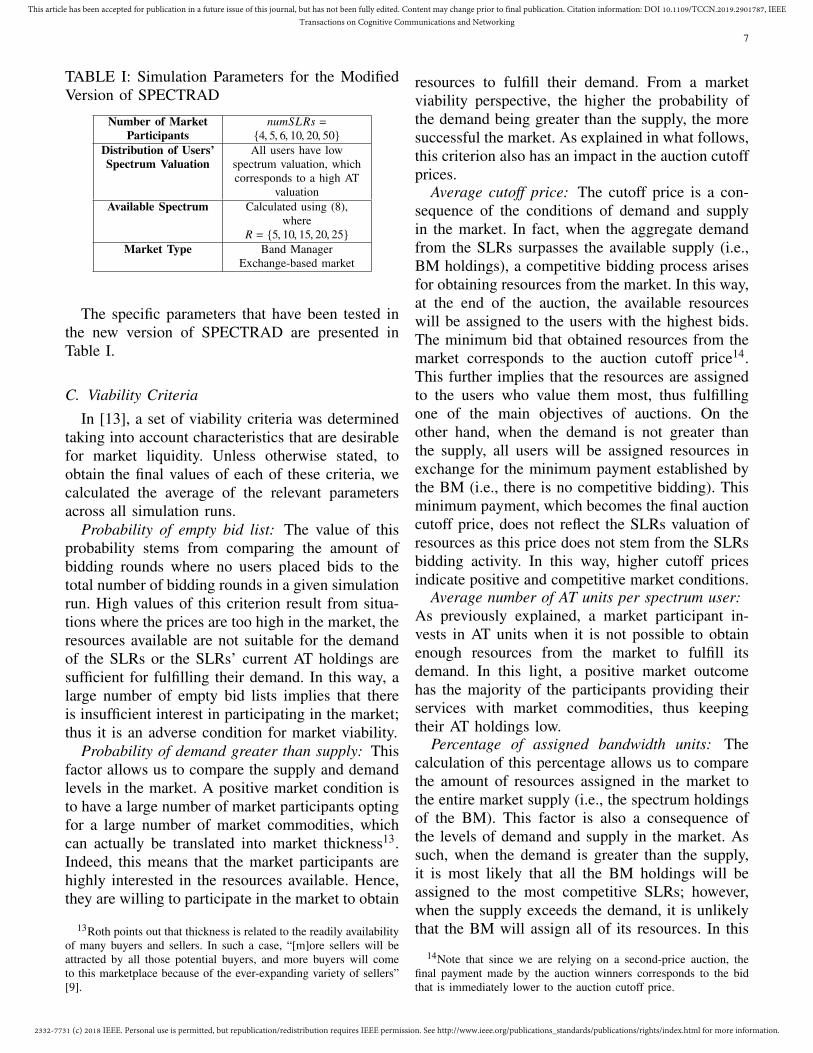
TABLE I: Simulation Parameters for the ModifiedVersion of SPECTRAD
Number of MarketParticipants
numSLRs ={4, 5, 6, 10, 20, 50}
Distribution of Users’Spectrum Valuation
All users have lowspectrum valuation, whichcorresponds to a high AT
valuationAvailable Spectrum Calculated using (8),
whereR = {5, 10, 15, 20, 25}
Market Type Band ManagerExchange-based market
The specific parameters that have been tested inthe new version of SPECTRAD are presented inTable I.
C. Viability Criteria
In [13], a set of viability criteria was determinedtaking into account characteristics that are desirablefor market liquidity. Unless otherwise stated, toobtain the final values of each of these criteria, wecalculated the average of the relevant parametersacross all simulation runs.
Probability of empty bid list: The value of thisprobability stems from comparing the amount ofbidding rounds where no users placed bids to thetotal number of bidding rounds in a given simulationrun. High values of this criterion result from situa-tions where the prices are too high in the market, theresources available are not suitable for the demandof the SLRs or the SLRs’ current AT holdings aresufficient for fulfilling their demand. In this way, alarge number of empty bid lists implies that thereis insufficient interest in participating in the market;thus it is an adverse condition for market viability.
Probability of demand greater than supply: Thisfactor allows us to compare the supply and demandlevels in the market. A positive market condition isto have a large number of market participants optingfor a large number of market commodities, whichcan actually be translated into market thickness13.Indeed, this means that the market participants arehighly interested in the resources available. Hence,they are willing to participate in the market to obtain
13Roth points out that thickness is related to the readily availabilityof many buyers and sellers. In such a case, “[m]ore sellers will beattracted by all those potential buyers, and more buyers will cometo this marketplace because of the ever-expanding variety of sellers”[9].
resources to fulfill their demand. From a marketviability perspective, the higher the probability ofthe demand being greater than the supply, the moresuccessful the market. As explained in what follows,this criterion also has an impact in the auction cutoffprices.
Average cutoff price: The cutoff price is a con-sequence of the conditions of demand and supplyin the market. In fact, when the aggregate demandfrom the SLRs surpasses the available supply (i.e.,BM holdings), a competitive bidding process arisesfor obtaining resources from the market. In this way,at the end of the auction, the available resourceswill be assigned to the users with the highest bids.The minimum bid that obtained resources from themarket corresponds to the auction cutoff price14.This further implies that the resources are assignedto the users who value them most, thus fulfillingone of the main objectives of auctions. On theother hand, when the demand is not greater thanthe supply, all users will be assigned resources inexchange for the minimum payment established bythe BM (i.e., there is no competitive bidding). Thisminimum payment, which becomes the final auctioncutoff price, does not reflect the SLRs valuation ofresources as this price does not stem from the SLRsbidding activity. In this way, higher cutoff pricesindicate positive and competitive market conditions.
Average number of AT units per spectrum user:As previously explained, a market participant in-vests in AT units when it is not possible to obtainenough resources from the market to fulfill itsdemand. In this light, a positive market outcomehas the majority of the participants providing theirservices with market commodities, thus keepingtheir AT holdings low.
Percentage of assigned bandwidth units: Thecalculation of this percentage allows us to comparethe amount of resources assigned in the market tothe entire market supply (i.e., the spectrum holdingsof the BM). This factor is also a consequence ofthe levels of demand and supply in the market. Assuch, when the demand is greater than the supply,it is most likely that all the BM holdings will beassigned to the most competitive SLRs; however,when the supply exceeds the demand, it is unlikelythat the BM will assign all of its resources. In this
14Note that since we are relying on a second-price auction, thefinal payment made by the auction winners corresponds to the bidthat is immediately lower to the auction cutoff price.

2332-7731 (c) 2018 IEEE. Personal use is permitted, but republication/redistribution requires IEEE permission. See http://www.ieee.org/publications_standards/publications/rights/index.html for more information.
This article has been accepted for publication in a future issue of this journal, but has not been fully edited. Content may change prior to final publication. Citation information: DOI 10.1109/TCCN.2019.2901787, IEEETransactions on Cognitive Communications and Networking
8
way, this percentage provides us with a measure ofmarket efficiency in the assignment of resources andan additional means to evaluate the degree of marketparticipation.
To evaluate quantitatively whether markets areviable, we define pass and fail values for eachof the viability criteria. To this end, we observethe simulation results for the individual viabilityfactors. Due to the relationship existing among thesefactors, we focus on the limit values associated withpositive outcomes, and those that lead to a negativeshift in the market conditions. This allows us todefine, experimentally, pass / fail thresholds. In turn,the scores associated with “passing” and “failing”conditions represent how critical each factor is forthe overall viability assessment. The thresholds andscores relevant to our market are defined in TableII 15.
TABLE II: Viability Criteria and Market Scores
Criteria PassValue
FailValue
ScorePass/Fail
P1 - Bid ListEmpty < 1% ≥ 1% 1/-1
P2 - DemandGreater thanSupply
≥ 10% < 1% 1/-1
P3 - Cutoff Price N/A < 31 0/-1P4 - Percentage ofAssigned BBUs ≥ 62% < 62% 1/-1
P5 - Number ofATs per User N/A ≥ 3 0/-1
D. Results
Our market viability results are derived from theanalysis of one hundred simulation runs of eachmarket scenario, each being active for 5000 timeticks16. The first 3000 time ticks were used as awarm up period, and the data for analysis wasextracted from the last 2000 time instances.
As previously stated, our analysis focused on the‘worst-case’ scenario, thus considering each SLRto have a low valuation of spectrum. Given thatthis valuation is directly related to the fungibilityscore, we performed a sensitivity analysis as ameans to validate our results and further explore
15Note that this process is the same as that followed for theevaluation of the original version of SPECTRAD [13].
16Time ticks are the time units defined in the ABM simulationenvironment. These could be replaced with any suitable time repre-sentation.
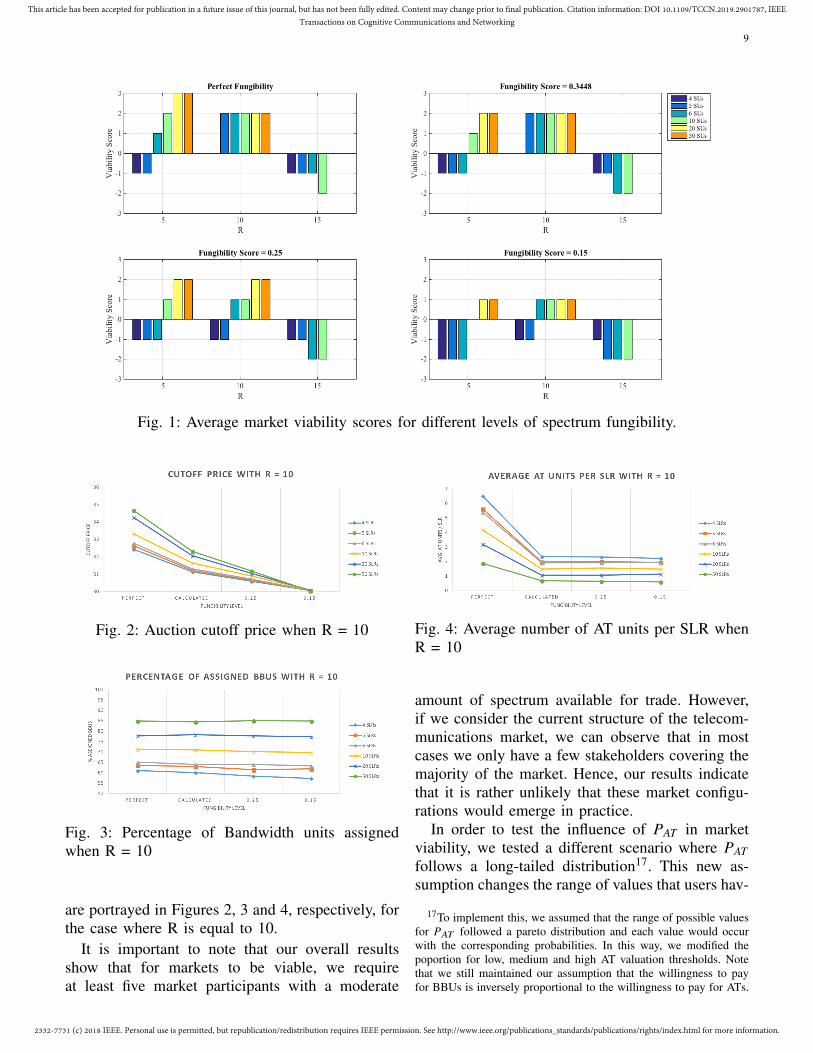
the market behavior when the fungibility scorechanges. The market viability results presented infigure 1 contrast the following levels of spectrumfungibility: 1 or perfect fungibility; 0.3448 or cal-culated capacity fungibility score; 0.25 and 0.15.The lower fungibility scores aim at consideringfurther constraints that could be derived from theuse of an alternative frequency, which are not onlyinherent to the changes in the achievable capacity[12]. For instance, these constraints could representthe cost that an SLR would need to incur for usinga new type of technology that is compatible withthe frequency bands acquired in the market.
The simulation results point to the combinationof number of users and spectrum availability, ex-pressed through R, that render viable markets. Inthis way, our results show that markets are viablewhen 5 ≤ R ≤ 10. We did not obtain successfulmarkets under spectrum oversupply conditions (i.e.,R ≥ 15). In turn, the number of users associatedwith market viability varies with the level of fun-gibility studied. Figure 1 summarizes the marketviability scenarios we found in our simulations.
E. Discussion
Analyzing the results presented in Figure 1, wecan observe that the number of viable marketsdecreases with lower fungibility scores. In fact, thenumber of viable markets ranges from 9 in a perfectfungibility scenario to 6 under lower fungibility con-ditions. Further, as the fungibility score decreases,not only we lose viable markets, but also, the actualviability score associated with our positive resultsdiminishes.
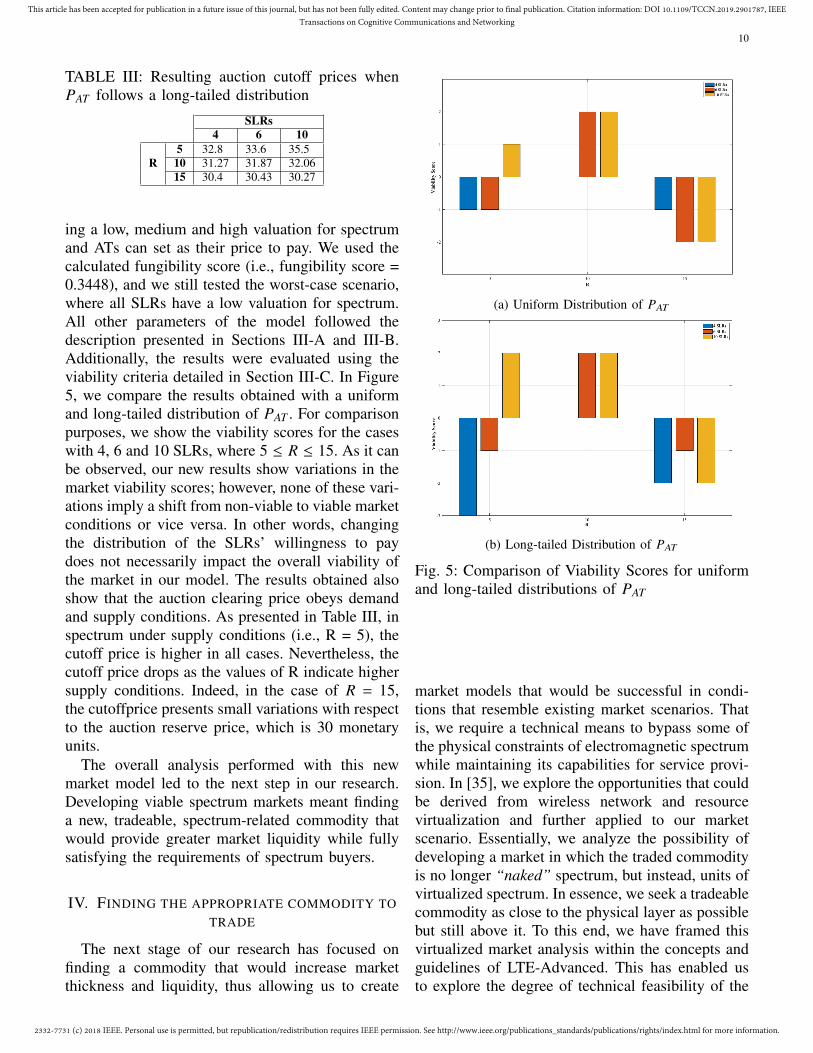
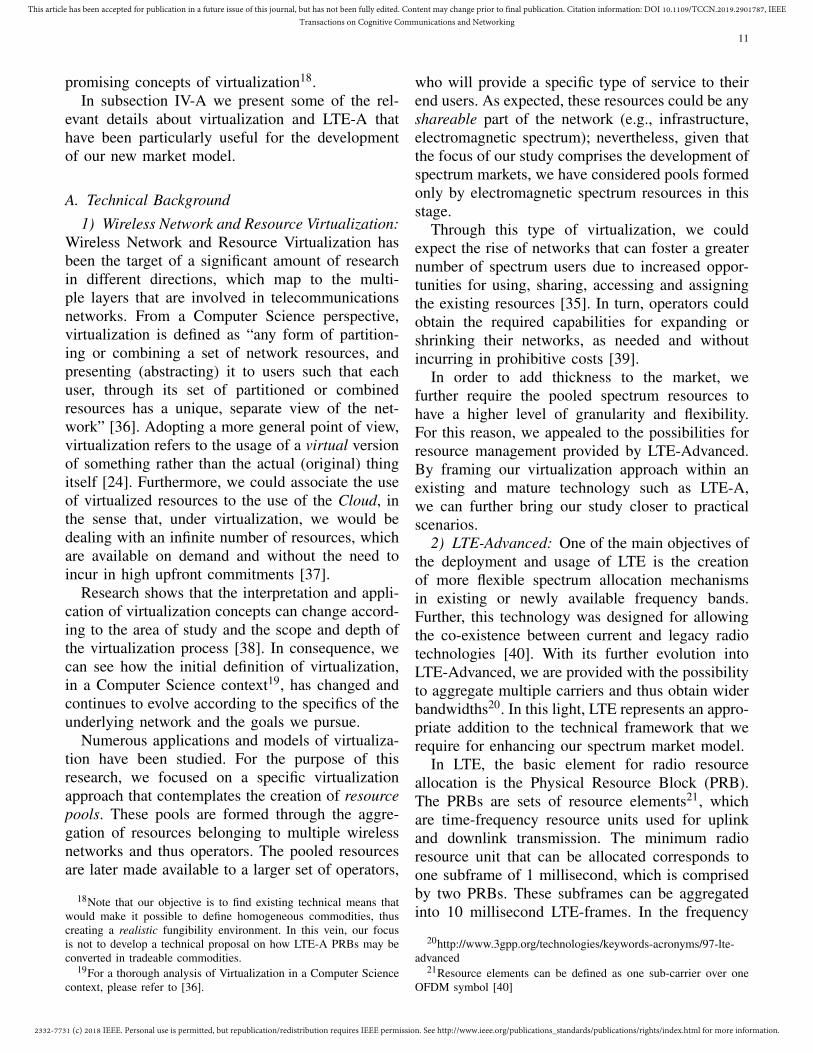
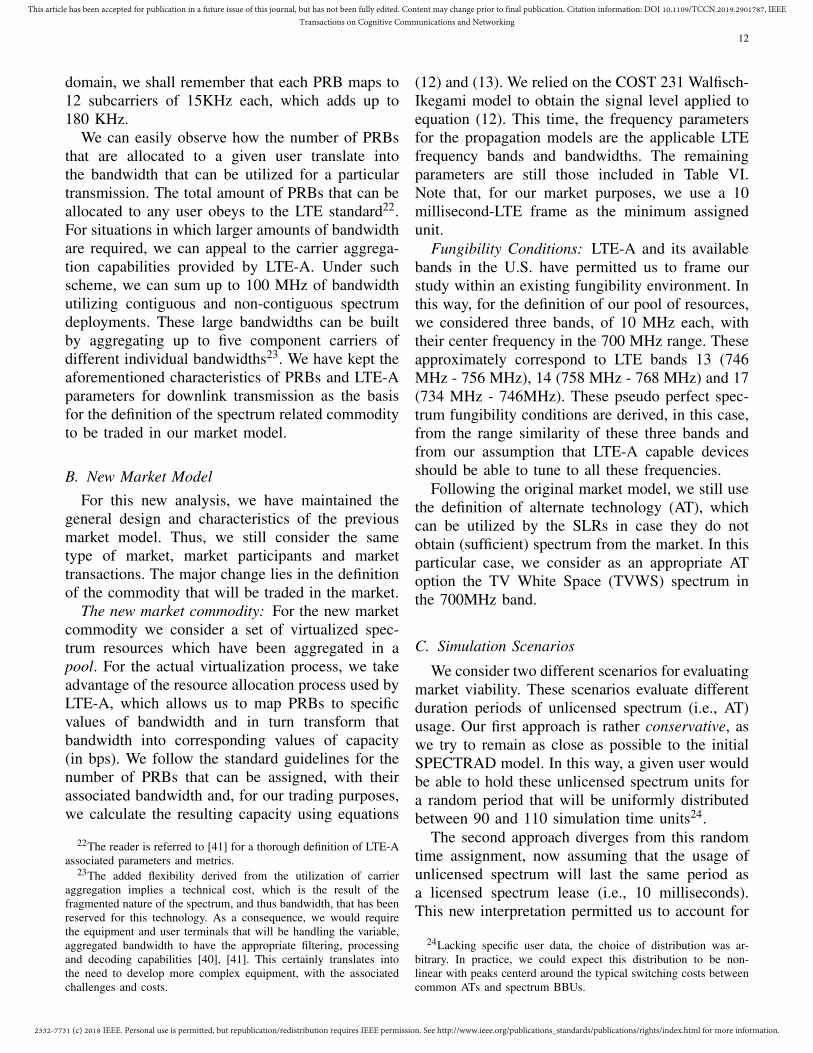
Delving into particular viability parameters, weexplore how they change as we vary the spectrumfungibility level. We find that the auction cutoffprice falls as the fungibility level decreases. In thecase of the percentage of BBUs that are assignedthrough the market, we find that this is consistentwith demand and supply levels in the market (i.e.,higher percentage of BBUs are assigned in highersupply conditions); however, this parameter remainsrelatively constant in spite of changes in spectrumfungibility. A complementary parameter, the amountof ATs assigned in the market, shows a significantdrop of as we switch from perfect fungibility to ourcalculated value; however, as the fungibility levelcontinues to drop, this value stabilizes. These results
2332-7731 (c) 2018 IEEE. Personal use is permitted, but republication/redistribution requires IEEE permission. See http://www.ieee.org/publications_standards/publications/rights/index.html for more information.
This article has been accepted for publication in a future issue of this journal, but has not been fully edited. Content may change prior to final publication. Citation information: DOI 10.1109/TCCN.2019.2901787, IEEETransactions on Cognitive Communications and Networking
9
Fig. 1: Average market viability scores for different levels of spectrum fungibility.
Fig. 2: Auction cutoff price when R = 10
Fig. 3: Percentage of Bandwidth units assignedwhen R = 10
are portrayed in Figures 2, 3 and 4, respectively, forthe case where R is equal to 10.
It is important to note that our overall resultsshow that for markets to be viable, we requireat least five market participants with a moderate
Fig. 4: Average number of AT units per SLR whenR = 10
amount of spectrum available for trade. However,if we consider the current structure of the telecom-munications market, we can observe that in mostcases we only have a few stakeholders covering themajority of the market. Hence, our results indicatethat it is rather unlikely that these market configu-rations would emerge in practice.
In order to test the influence of PAT in marketviability, we tested a different scenario where PATfollows a long-tailed distribution17. This new as-sumption changes the range of values that users hav-
17To implement this, we assumed that the range of possible valuesfor PAT followed a pareto distribution and each value would occurwith the corresponding probabilities. In this way, we modified thepoportion for low, medium and high AT valuation thresholds. Notethat we still maintained our assumption that the willingness to payfor BBUs is inversely proportional to the willingness to pay for ATs.
2332-7731 (c) 2018 IEEE. Personal use is permitted, but republication/redistribution requires IEEE permission. See http://www.ieee.org/publications_standards/publications/rights/index.html for more information.
This article has been accepted for publication in a future issue of this journal, but has not been fully edited. Content may change prior to final publication. Citation information: DOI 10.1109/TCCN.2019.2901787, IEEETransactions on Cognitive Communications and Networking
10
TABLE III: Resulting auction cutoff prices whenPAT follows a long-tailed distribution
SLRs4 6 10
R5 32.8 33.6 35.510 31.27 31.87 32.0615 30.4 30.43 30.27
ing a low, medium and high valuation for spectrumand ATs can set as their price to pay. We used thecalculated fungibility score (i.e., fungibility score =0.3448), and we still tested the worst-case scenario,where all SLRs have a low valuation for spectrum.All other parameters of the model followed thedescription presented in Sections III-A and III-B.Additionally, the results were evaluated using theviability criteria detailed in Section III-C. In Figure5, we compare the results obtained with a uniformand long-tailed distribution of PAT . For comparisonpurposes, we show the viability scores for the caseswith 4, 6 and 10 SLRs, where 5 ≤ R ≤ 15. As it canbe observed, our new results show variations in themarket viability scores; however, none of these vari-ations imply a shift from non-viable to viable marketconditions or vice versa. In other words, changingthe distribution of the SLRs’ willingness to paydoes not necessarily impact the overall viability ofthe market in our model. The results obtained alsoshow that the auction clearing price obeys demandand supply conditions. As presented in Table III, inspectrum under supply conditions (i.e., R = 5), thecutoff price is higher in all cases. Nevertheless, thecutoff price drops as the values of R indicate highersupply conditions. Indeed, in the case of R = 15,the cutoffprice presents small variations with respectto the auction reserve price, which is 30 monetaryunits.
The overall analysis performed with this newmarket model led to the next step in our research.Developing viable spectrum markets meant findinga new, tradeable, spectrum-related commodity thatwould provide greater market liquidity while fullysatisfying the requirements of spectrum buyers.
IV. FINDING THE APPROPRIATE COMMODITY TOTRADE
The next stage of our research has focused onfinding a commodity that would increase marketthickness and liquidity, thus allowing us to create
(a) Uniform Distribution of PAT
(b) Long-tailed Distribution of PAT
Fig. 5: Comparison of Viability Scores for uniformand long-tailed distributions of PAT
market models that would be successful in condi-tions that resemble existing market scenarios. Thatis, we require a technical means to bypass some ofthe physical constraints of electromagnetic spectrumwhile maintaining its capabilities for service provi-sion. In [35], we explore the opportunities that couldbe derived from wireless network and resourcevirtualization and further applied to our marketscenario. Essentially, we analyze the possibility ofdeveloping a market in which the traded commodityis no longer “naked” spectrum, but instead, units ofvirtualized spectrum. In essence, we seek a tradeablecommodity as close to the physical layer as possiblebut still above it. To this end, we have framed thisvirtualized market analysis within the concepts andguidelines of LTE-Advanced. This has enabled usto explore the degree of technical feasibility of the
2332-7731 (c) 2018 IEEE. Personal use is permitted, but republication/redistribution requires IEEE permission. See http://www.ieee.org/publications_standards/publications/rights/index.html for more information.
This article has been accepted for publication in a future issue of this journal, but has not been fully edited. Content may change prior to final publication. Citation information: DOI 10.1109/TCCN.2019.2901787, IEEETransactions on Cognitive Communications and Networking
11
promising concepts of virtualization18.In subsection IV-A we present some of the rel-
evant details about virtualization and LTE-A thathave been particularly useful for the developmentof our new market model.
A. Technical Background1) Wireless Network and Resource Virtualization:
Wireless Network and Resource Virtualization hasbeen the target of a significant amount of researchin different directions, which map to the multi-ple layers that are involved in telecommunicationsnetworks. From a Computer Science perspective,virtualization is defined as “any form of partition-ing or combining a set of network resources, andpresenting (abstracting) it to users such that eachuser, through its set of partitioned or combinedresources has a unique, separate view of the net-work” [36]. Adopting a more general point of view,virtualization refers to the usage of a virtual versionof something rather than the actual (original) thingitself [24]. Furthermore, we could associate the useof virtualized resources to the use of the Cloud, inthe sense that, under virtualization, we would bedealing with an infinite number of resources, whichare available on demand and without the need toincur in high upfront commitments [37].
Research shows that the interpretation and appli-cation of virtualization concepts can change accord-ing to the area of study and the scope and depth ofthe virtualization process [38]. In consequence, wecan see how the initial definition of virtualization,in a Computer Science context19, has changed andcontinues to evolve according to the specifics of theunderlying network and the goals we pursue.
Numerous applications and models of virtualiza-tion have been studied. For the purpose of thisresearch, we focused on a specific virtualizationapproach that contemplates the creation of resourcepools. These pools are formed through the aggre-gation of resources belonging to multiple wirelessnetworks and thus operators. The pooled resourcesare later made available to a larger set of operators,
18Note that our objective is to find existing technical means thatwould make it possible to define homogeneous commodities, thuscreating a realistic fungibility environment. In this vein, our focusis not to develop a technical proposal on how LTE-A PRBs may beconverted in tradeable commodities.
19For a thorough analysis of Virtualization in a Computer Sciencecontext, please refer to [36].
who will provide a specific type of service to theirend users. As expected, these resources could be anyshareable part of the network (e.g., infrastructure,electromagnetic spectrum); nevertheless, given thatthe focus of our study comprises the development ofspectrum markets, we have considered pools formedonly by electromagnetic spectrum resources in thisstage.
Through this type of virtualization, we couldexpect the rise of networks that can foster a greaternumber of spectrum users due to increased oppor-tunities for using, sharing, accessing and assigningthe existing resources [35]. In turn, operators couldobtain the required capabilities for expanding orshrinking their networks, as needed and withoutincurring in prohibitive costs [39].
In order to add thickness to the market, wefurther require the pooled spectrum resources tohave a higher level of granularity and flexibility.For this reason, we appealed to the possibilities forresource management provided by LTE-Advanced.By framing our virtualization approach within anexisting and mature technology such as LTE-A,we can further bring our study closer to practicalscenarios.
2) LTE-Advanced: One of the main objectives ofthe deployment and usage of LTE is the creationof more flexible spectrum allocation mechanismsin existing or newly available frequency bands.Further, this technology was designed for allowingthe co-existence between current and legacy radiotechnologies [40]. With its further evolution intoLTE-Advanced, we are provided with the possibilityto aggregate multiple carriers and thus obtain widerbandwidths20. In this light, LTE represents an appro-priate addition to the technical framework that werequire for enhancing our spectrum market model.
In LTE, the basic element for radio resourceallocation is the Physical Resource Block (PRB).The PRBs are sets of resource elements21, whichare time-frequency resource units used for uplinkand downlink transmission. The minimum radioresource unit that can be allocated corresponds toone subframe of 1 millisecond, which is comprisedby two PRBs. These subframes can be aggregatedinto 10 millisecond LTE-frames. In the frequency
20http://www.3gpp.org/technologies/keywords-acronyms/97-lte-advanced
21Resource elements can be defined as one sub-carrier over oneOFDM symbol [40]
2332-7731 (c) 2018 IEEE. Personal use is permitted, but republication/redistribution requires IEEE permission. See http://www.ieee.org/publications_standards/publications/rights/index.html for more information.
This article has been accepted for publication in a future issue of this journal, but has not been fully edited. Content may change prior to final publication. Citation information: DOI 10.1109/TCCN.2019.2901787, IEEETransactions on Cognitive Communications and Networking
12
domain, we shall remember that each PRB maps to12 subcarriers of 15KHz each, which adds up to180 KHz.
We can easily observe how the number of PRBsthat are allocated to a given user translate intothe bandwidth that can be utilized for a particulartransmission. The total amount of PRBs that can beallocated to any user obeys to the LTE standard22.For situations in which larger amounts of bandwidthare required, we can appeal to the carrier aggrega-tion capabilities provided by LTE-A. Under suchscheme, we can sum up to 100 MHz of bandwidthutilizing contiguous and non-contiguous spectrumdeployments. These large bandwidths can be builtby aggregating up to five component carriers ofdifferent individual bandwidths23. We have kept theaforementioned characteristics of PRBs and LTE-Aparameters for downlink transmission as the basisfor the definition of the spectrum related commodityto be traded in our market model.
B. New Market ModelFor this new analysis, we have maintained the
general design and characteristics of the previousmarket model. Thus, we still consider the sametype of market, market participants and markettransactions. The major change lies in the definitionof the commodity that will be traded in the market.
The new market commodity: For the new marketcommodity we consider a set of virtualized spec-trum resources which have been aggregated in apool. For the actual virtualization process, we takeadvantage of the resource allocation process used byLTE-A, which allows us to map PRBs to specificvalues of bandwidth and in turn transform thatbandwidth into corresponding values of capacity(in bps). We follow the standard guidelines for thenumber of PRBs that can be assigned, with theirassociated bandwidth and, for our trading purposes,we calculate the resulting capacity using equations
22The reader is referred to [41] for a thorough definition of LTE-Aassociated parameters and metrics.
23The added flexibility derived from the utilization of carrieraggregation implies a technical cost, which is the result of thefragmented nature of the spectrum, and thus bandwidth, that has beenreserved for this technology. As a consequence, we would requirethe equipment and user terminals that will be handling the variable,aggregated bandwidth to have the appropriate filtering, processingand decoding capabilities [40], [41]. This certainly translates intothe need to develop more complex equipment, with the associatedchallenges and costs.
(12) and (13). We relied on the COST 231 Walfisch-Ikegami model to obtain the signal level applied toequation (12). This time, the frequency parametersfor the propagation models are the applicable LTEfrequency bands and bandwidths. The remainingparameters are still those included in Table VI.Note that, for our market purposes, we use a 10millisecond-LTE frame as the minimum assignedunit.
Fungibility Conditions: LTE-A and its availablebands in the U.S. have permitted us to frame ourstudy within an existing fungibility environment. Inthis way, for the definition of our pool of resources,we considered three bands, of 10 MHz each, withtheir center frequency in the 700 MHz range. Theseapproximately correspond to LTE bands 13 (746MHz - 756 MHz), 14 (758 MHz - 768 MHz) and 17(734 MHz - 746MHz). These pseudo perfect spec-trum fungibility conditions are derived, in this case,from the range similarity of these three bands andfrom our assumption that LTE-A capable devicesshould be able to tune to all these frequencies.
Following the original market model, we still usethe definition of alternate technology (AT), whichcan be utilized by the SLRs in case they do notobtain (sufficient) spectrum from the market. In thisparticular case, we consider as an appropriate AToption the TV White Space (TVWS) spectrum inthe 700MHz band.
C. Simulation Scenarios
We consider two different scenarios for evaluatingmarket viability. These scenarios evaluate differentduration periods of unlicensed spectrum (i.e., AT)usage. Our first approach is rather conservative, aswe try to remain as close as possible to the initialSPECTRAD model. In this way, a given user wouldbe able to hold these unlicensed spectrum units fora random period that will be uniformly distributedbetween 90 and 110 simulation time units24.
The second approach diverges from this randomtime assignment, now assuming that the usage ofunlicensed spectrum will last the same period asa licensed spectrum lease (i.e., 10 milliseconds).This new interpretation permitted us to account for
24Lacking specific user data, the choice of distribution was ar-bitrary. In practice, we could expect this distribution to be non-linear with peaks centerd around the typical switching costs betweencommon ATs and spectrum BBUs.
2332-7731 (c) 2018 IEEE. Personal use is permitted, but republication/redistribution requires IEEE permission. See http://www.ieee.org/publications_standards/publications/rights/index.html for more information.
This article has been accepted for publication in a future issue of this journal, but has not been fully edited. Content may change prior to final publication. Citation information: DOI 10.1109/TCCN.2019.2901787, IEEETransactions on Cognitive Communications and Networking
13
the possible degradation of service that users couldexperience when utilizing unlicensed spectrum, aswell as their willingness to participate in the marketonce a new bidding round started.
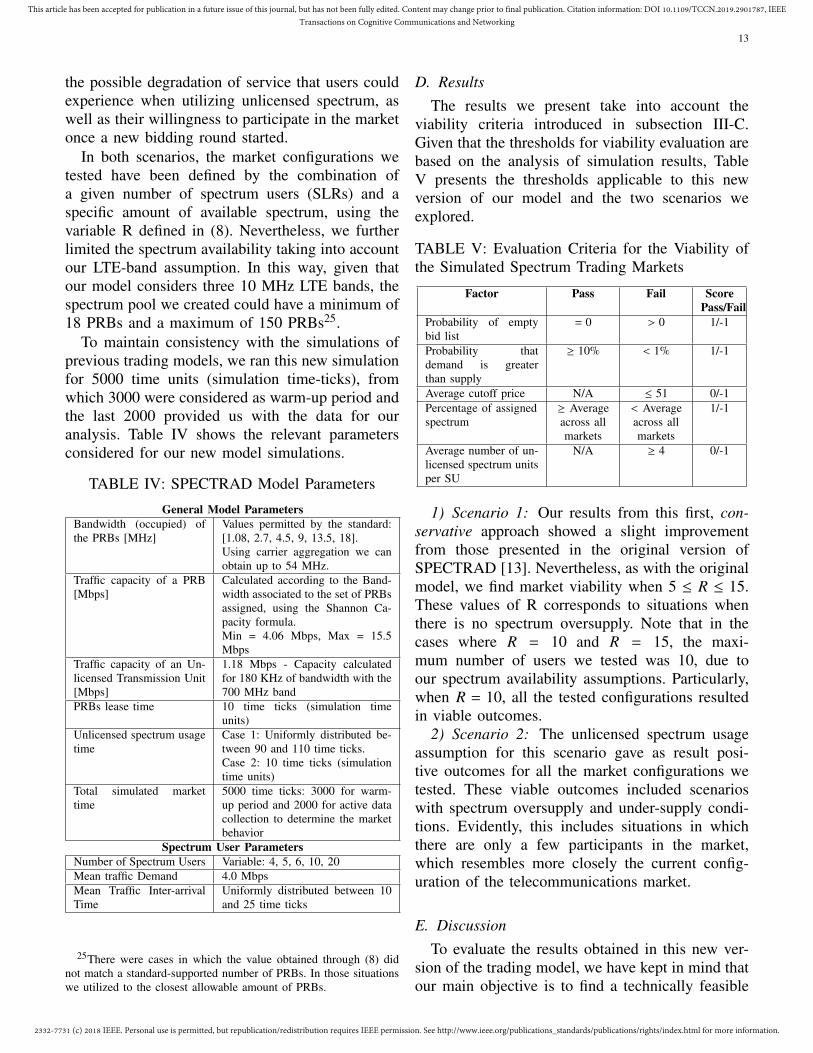
In both scenarios, the market configurations wetested have been defined by the combination ofa given number of spectrum users (SLRs) and aspecific amount of available spectrum, using thevariable R defined in (8). Nevertheless, we furtherlimited the spectrum availability taking into accountour LTE-band assumption. In this way, given thatour model considers three 10 MHz LTE bands, thespectrum pool we created could have a minimum of18 PRBs and a maximum of 150 PRBs25.
To maintain consistency with the simulations ofprevious trading models, we ran this new simulationfor 5000 time units (simulation time-ticks), fromwhich 3000 were considered as warm-up period andthe last 2000 provided us with the data for ouranalysis. Table IV shows the relevant parametersconsidered for our new model simulations.
TABLE IV: SPECTRAD Model Parameters
General Model ParametersBandwidth (occupied) ofthe PRBs [MHz]
Values permitted by the standard:[1.08, 2.7, 4.5, 9, 13.5, 18].Using carrier aggregation we canobtain up to 54 MHz.
Traffic capacity of a PRB[Mbps]
Calculated according to the Band-width associated to the set of PRBsassigned, using the Shannon Ca-pacity formula.Min = 4.06 Mbps, Max = 15.5Mbps
Traffic capacity of an Un-licensed Transmission Unit[Mbps]
1.18 Mbps - Capacity calculatedfor 180 KHz of bandwidth with the700 MHz band
PRBs lease time 10 time ticks (simulation timeunits)
Unlicensed spectrum usagetime
Case 1: Uniformly distributed be-tween 90 and 110 time ticks.Case 2: 10 time ticks (simulationtime units)
Total simulated markettime
5000 time ticks: 3000 for warm-up period and 2000 for active datacollection to determine the marketbehavior
Spectrum User ParametersNumber of Spectrum Users Variable: 4, 5, 6, 10, 20Mean traffic Demand 4.0 MbpsMean Traffic Inter-arrivalTime
Uniformly distributed between 10and 25 time ticks
25There were cases in which the value obtained through (8) didnot match a standard-supported number of PRBs. In those situationswe utilized to the closest allowable amount of PRBs.
D. ResultsThe results we present take into account the
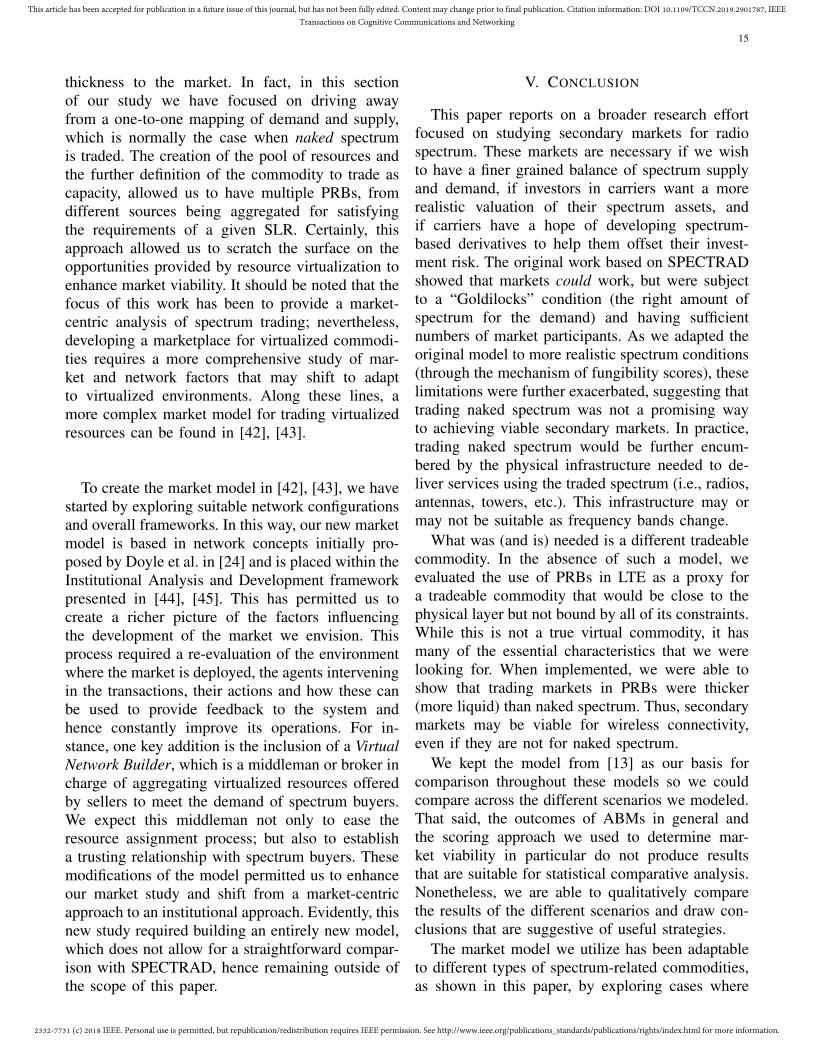
viability criteria introduced in subsection III-C.Given that the thresholds for viability evaluation arebased on the analysis of simulation results, TableV presents the thresholds applicable to this newversion of our model and the two scenarios weexplored.
TABLE V: Evaluation Criteria for the Viability ofthe Simulated Spectrum Trading Markets
Factor Pass Fail ScorePass/Fail
Probability of emptybid list
= 0 > 0 1/-1
Probability thatdemand is greaterthan supply
≥ 10% < 1% 1/-1
Average cutoff price N/A ≤ 51 0/-1Percentage of assignedspectrum
≥ Averageacross allmarkets
< Averageacross allmarkets
1/-1
Average number of un-licensed spectrum unitsper SU
N/A ≥ 4 0/-1
1) Scenario 1: Our results from this first, con-servative approach showed a slight improvementfrom those presented in the original version ofSPECTRAD [13]. Nevertheless, as with the originalmodel, we find market viability when 5 ≤ R ≤ 15.These values of R corresponds to situations whenthere is no spectrum oversupply. Note that in thecases where R = 10 and R = 15, the maxi-mum number of users we tested was 10, due toour spectrum availability assumptions. Particularly,when R = 10, all the tested configurations resultedin viable outcomes.
2) Scenario 2: The unlicensed spectrum usageassumption for this scenario gave as result posi-tive outcomes for all the market configurations wetested. These viable outcomes included scenarioswith spectrum oversupply and under-supply condi-tions. Evidently, this includes situations in whichthere are only a few participants in the market,which resembles more closely the current config-uration of the telecommunications market.
E. DiscussionTo evaluate the results obtained in this new ver-
sion of the trading model, we have kept in mind thatour main objective is to find a technically feasible

2332-7731 (c) 2018 IEEE. Personal use is permitted, but republication/redistribution requires IEEE permission. See http://www.ieee.org/publications_standards/publications/rights/index.html for more information.
This article has been accepted for publication in a future issue of this journal, but has not been fully edited. Content may change prior to final publication. Citation information: DOI 10.1109/TCCN.2019.2901787, IEEETransactions on Cognitive Communications and Networking
14
Fig. 6: Comparison of the Market Viability Scores for different SPECTRAD Model Versions. This figureshows results for relevant combinations of R and numSLR values.
alternative that would bring thickness to the marketwhile portraying practical market configurations. Inthis light, our study does not address the technicalprocess that would be required to turn LTE-A PRBsinto tradeable commodities; instead, our approachhas been to use LTE-A PRBs as a proxy fordefining a fungible and tradeable spectrum-relatedcommodity. In figure 6, we include a comparisonof the three different models of SPECTRAD as ameans to visually evidence the changes that theincorporation of virtualization represents for overallmarket viability conditions.
Analyzing the results we obtained for our firstscenario, we observed a slight improvement over theoriginal SPECTRAD model. It is important to notethat the fungibility conditions we have tested thistime are more realistic, given that they are boundedwithin an existing and properly functioning tech-nology, so it is an improvement over the fungibilityconstrained naked spectrum model.
In the second scenario, we found positive resultsin all the tested scenarios. One particular factorthat contributes to this outcome is the fact that,throughout our market simulations, the probabilityof having an empty bid list was always equal to zero.This is a direct consequence of the (shorter) durationof the unlicensed spectrum usage period, whichincreases the possibilities for SLRs to participatein new bidding rounds.
To highlight the differences between Scenarios 1and 2, in Figures 7 and 8, we show how these twoscenarios compare in terms of market efficiency. In-deed, we can observe significant higher percentages
Fig. 7: Percentage of resources assigned in Scenario1. Each color bar represents scenarios with 4, 5, 6,10 and 20 SLRs where available.
Fig. 8: Percentage of resources assigned in Scenario2. Each color bar represents scenarios with 4, 5, 6,10 and 20 SLRs where available.
of resources assigned when SLRs have the optionof utilizing a more flexible and replaceable alternatetechnology.
These results are also a consequence of adding
2332-7731 (c) 2018 IEEE. Personal use is permitted, but republication/redistribution requires IEEE permission. See http://www.ieee.org/publications_standards/publications/rights/index.html for more information.
This article has been accepted for publication in a future issue of this journal, but has not been fully edited. Content may change prior to final publication. Citation information: DOI 10.1109/TCCN.2019.2901787, IEEETransactions on Cognitive Communications and Networking
15
thickness to the market. In fact, in this sectionof our study we have focused on driving awayfrom a one-to-one mapping of demand and supply,which is normally the case when naked spectrumis traded. The creation of the pool of resources andthe further definition of the commodity to trade ascapacity, allowed us to have multiple PRBs, fromdifferent sources being aggregated for satisfyingthe requirements of a given SLR. Certainly, thisapproach allowed us to scratch the surface on theopportunities provided by resource virtualization toenhance market viability. It should be noted that thefocus of this work has been to provide a market-centric analysis of spectrum trading; nevertheless,developing a marketplace for virtualized commodi-ties requires a more comprehensive study of mar-ket and network factors that may shift to adaptto virtualized environments. Along these lines, amore complex market model for trading virtualizedresources can be found in [42], [43].
To create the market model in [42], [43], we havestarted by exploring suitable network configurationsand overall frameworks. In this way, our new marketmodel is based in network concepts initially pro-posed by Doyle et al. in [24] and is placed within theInstitutional Analysis and Development frameworkpresented in [44], [45]. This has permitted us tocreate a richer picture of the factors influencingthe development of the market we envision. Thisprocess required a re-evaluation of the environmentwhere the market is deployed, the agents interveningin the transactions, their actions and how these canbe used to provide feedback to the system andhence constantly improve its operations. For in-stance, one key addition is the inclusion of a VirtualNetwork Builder, which is a middleman or broker incharge of aggregating virtualized resources offeredby sellers to meet the demand of spectrum buyers.We expect this middleman not only to ease theresource assignment process; but also to establisha trusting relationship with spectrum buyers. Thesemodifications of the model permitted us to enhanceour market study and shift from a market-centricapproach to an institutional approach. Evidently, thisnew study required building an entirely new model,which does not allow for a straightforward compar-ison with SPECTRAD, hence remaining outside ofthe scope of this paper.
V. CONCLUSION
This paper reports on a broader research effortfocused on studying secondary markets for radiospectrum. These markets are necessary if we wishto have a finer grained balance of spectrum supplyand demand, if investors in carriers want a morerealistic valuation of their spectrum assets, andif carriers have a hope of developing spectrum-based derivatives to help them offset their invest-ment risk. The original work based on SPECTRADshowed that markets could work, but were subjectto a “Goldilocks” condition (the right amount ofspectrum for the demand) and having sufficientnumbers of market participants. As we adapted theoriginal model to more realistic spectrum conditions(through the mechanism of fungibility scores), theselimitations were further exacerbated, suggesting thattrading naked spectrum was not a promising wayto achieving viable secondary markets. In practice,trading naked spectrum would be further encum-bered by the physical infrastructure needed to de-liver services using the traded spectrum (i.e., radios,antennas, towers, etc.). This infrastructure may ormay not be suitable as frequency bands change.
What was (and is) needed is a different tradeablecommodity. In the absence of such a model, weevaluated the use of PRBs in LTE as a proxy fora tradeable commodity that would be close to thephysical layer but not bound by all of its constraints.While this is not a true virtual commodity, it hasmany of the essential characteristics that we werelooking for. When implemented, we were able toshow that trading markets in PRBs were thicker(more liquid) than naked spectrum. Thus, secondarymarkets may be viable for wireless connectivity,even if they are not for naked spectrum.
We kept the model from [13] as our basis forcomparison throughout these models so we couldcompare across the different scenarios we modeled.That said, the outcomes of ABMs in general andthe scoring approach we used to determine mar-ket viability in particular do not produce resultsthat are suitable for statistical comparative analysis.Nonetheless, we are able to qualitatively comparethe results of the different scenarios and draw con-clusions that are suggestive of useful strategies.
The market model we utilize has been adaptableto different types of spectrum-related commodities,as shown in this paper, by exploring cases where
2332-7731 (c) 2018 IEEE. Personal use is permitted, but republication/redistribution requires IEEE permission. See http://www.ieee.org/publications_standards/publications/rights/index.html for more information.
This article has been accepted for publication in a future issue of this journal, but has not been fully edited. Content may change prior to final publication. Citation information: DOI 10.1109/TCCN.2019.2901787, IEEETransactions on Cognitive Communications and Networking
16
naked and virtualized spectrum is traded. Addition-ally, our simulations show that SPECTRAD cansupport varying numbers of participants and re-sources available. This shows that our model scaleswell to various supply and demand conditions aswell as different commodity definitions. It is alsoimportant to note that other auction mechanismscould be adapted to our model. Nevertheless, morecomplex settings that require different definitionsof market participants and consider more compre-hensive technical approaches may require a modelrestructuring process, and this is indeed part of ourongoing research efforts.
VI. FUTURE WORK
Our research focuses on finding an appropriate,spectrum-derived commodity to trade in the mar-ket and defining how we can leverage technicaladvantages to increase market thickness. In turn,this would permit us to find market viability con-ditions that resemble those of existing telecommu-nications markets. With this aim, we are interestedin deepening our study of more complex networkdefinitions that rely on the resource pooling concept.This requires a study of the appropriate marketparticipants, their goals and requirements, and howthese influence the necessary market transactions.Additionally, we are interested in exploring differentmarket mechanisms that may be suitable for spec-trum trading. For instance, our future work will lookinto adapting matching theory for the developmentof a marketplace where spectrum buyers could ex-press their requirements in more depth, noting thatthese requirements could go beyond willingness topay and technical characteristics.
As part of a comprehensive spectrum marketsstudy, we are also committed to incorporating ad-ditional economics, policy and governance con-siderations that could improve the framework wepropose; hence converting it in a model that couldbe successfully adopted in practice.
APPENDIXSPECTRUM FUNGIBILITY
In this section, we discuss spectrum fungibilityand its characterization, which we use in the agent-based simulations of the secondary spectrum mar-kets we propose.
A. Fungibility Basics
Previous research seeking to establish the prop-erties of electromagnetic spectrum has character-ized it across multiple dimensions [1], [46] intowhat has been referred to as electrospace. Oneof these dimensions is frequency. Electromagnetictheory shows us that two frequency bands mayhave distinct properties and characteristics. From aneconomic perspective, these differences mean thattwo frequency bands are interchangeable only upto a certain degree and under specific conditions.Expressed differently, two units of electrospacethat differ in frequency are not perfect (economic)substitutes, which represents significant limitationsfor the fungibility of spectrum as an economiccommodity.26
Weiss et al. analyzed spectrum fungibility in[11] and developed a quantitative measure for spec-trum fungibility based on various axes in whichspectrum can vary (i.e., space, time, technologyand regulation)27. They proposed two measures offungibility: a distance score (Euclidean distance)and a probabilistic score.28 The objective was toidentify a measure of similarity between two bandsthat could be used by decision makers (and markets)to estimate the comparability of bands. Equations(9) and (10) show the general definition of these fun-gibility scores, where d1 and f1 are the distance andfrequency parameters associated with the preferredoption, while d2 and f2 correspond to the availableoptions. The independent variables are scalars here,but could be generalized to vectors for comparingbands across multiple dimensions.
Distance Score =max ((d1 − d2), 0)
d1(9)
Probabilistic Score = min(
f1f2, 1)
(10)
The scores quantify the level of comparabilityand substitutability between available and preferredfrequency bands, which could be used by spectrumbuyers in order to assess the measure in which a
26Note that other dimensions of electrospace (e.g., time, location,regulations) may also create limitations on its fungibility.
27While the authors focused on the frequency dimension of elec-trospace, this theory could apply to other dimensions as well.
28The probabilistic score is not a probability in the mathematicalsense; it rather represents the fraction of a specific characteristic (e.g.,coverage, capacity, etc.) obtained when using an available (optional)frequency instead of the preferred one [11].
2332-7731 (c) 2018 IEEE. Personal use is permitted, but republication/redistribution requires IEEE permission. See http://www.ieee.org/publications_standards/publications/rights/index.html for more information.
This article has been accepted for publication in a future issue of this journal, but has not been fully edited. Content may change prior to final publication. Citation information: DOI 10.1109/TCCN.2019.2901787, IEEETransactions on Cognitive Communications and Networking
17
frequency available could match the performance oftheir preferred frequency. Additionally, the scorescould be used by a seller in order to determine theprobability of success of a given transaction [11].
As the authors point out in [11], “when in-frastructure and frequency bands can be assumed,then service providers do not trade spectrum accessbut rather for connectivity and reachability at aparticular QoS”. This supports our effort to defineadditional fungibility scores that aim at comparingspectrum-related attributes29.
B. Calculating Spectrum Fungibility ScoresIn [12], we evaluated the fungibility score def-
inition presented in [11] while applying empir-ical propagation models such as Okumura-Hataand COST 231 Walfisch-Ikegami. These modelsallowed us to take into account important physicaland environmental characteristics associated withparticular frequency bands. We studied how thereceived power changes according to the parametersconsidered in the different models, which permittedus to further explore fungibility in terms of capacityand coverage, which we explain next.
1) Coverage Fungibility Scores: One of the mostimportant concerns for network management anddimensioning is the actual coverage that couldbe achieved with a specific frequency, under theconditions of the area where the system will bedeployed. To this end, we developed a coveragefungibility score in order to provide a comparativemeasure of the coverage that can be achieved withtwo different frequency bands (i.e., available vs.preferred frequency).
To calculate this score, we utilized the link budgetformula (11), where Pr is the received power, Pt is
29These fungibility scores map to the economic concept of rent.Ricardo [47] defines rent as “the difference between the produceobtained by the employment of two equal quantities of capital andlabor”. More generally, as expressed in ,“the economic rent of anasset is the added value or the net return to investment, of usingthat asset instead of the least efficient, or least desirable, alternativeasset available” [48]. In consequence, economic rent “represents theadditional value a producer is willing to pay to use the characteristicsand quality of an asset”. The authors further explain that it is alsoexpected that as the quality of the resources diminishes, the rent paidon those resources will be reduced as well [48]. We find that theuse of fungibility scores could represent a practical means to capturethis difference between distinct frequency bands. If we further mapthis to a spectrum trading environment, fungibility scores could beutilized to find the difference between the frequency bands that areavailable in the market and those that a user prefers and project thisdifference to spectrum valuation.
the transmitted power, Gt and Gr are the transmitterand receiver gains, respectively, and Lp is the pathloss.30 We worked with a specific minimum requiredreceived power, which permitted us to calculate themaximum allowable path loss, and thus determinethe distance (from the transmitter) associated withthis value. This distance would correspond to themaximum cell radius, or in other words, maximumcoverage.
Pr = Pt (dBm) + Gt (dB) + Gr (dB) − Lp(dB) (11)
We built our coverage fungibility score by com-paring the maximum coverage achieved with thepreferred frequency, f1, and the available frequencyf2. Table VI shows the parameters that we utilizedfor our calculations.31
2) Capacity Fungibility Scores: The capacityscores permit us to assess what capacity, whencalculated with different frequency bands, maybe considered fungible. To do this, we utilizedthe Shannon-Hartley Information Capacity theorem(12), which enables us to determine the maximumrate achievable in a specific channel with a givenbandwidth and under the presence of noise.
C = B log2(1 + SNR) (12)
For the signal value, we utilized the power re-ceived at a specific distance (i.e., fixed distance orcell-edge), and the noise power was estimated using(14), where F is the noise figure of the receiver, kis the Boltzmann’s constant, T is the reference tem-perature (290 K) and B is the applicable bandwidth.
N = FkT B (13)
= F(dB) + k(dBm/Hz/K) + T(dBm) + B(dBm) (14)
In the analysis presented in [12], the capacity fungi-bility score was determined by comparing the capac-ity resulting from utilizing an available frequency(available capacity) with the capacity achievablewith the preferred frequency (reference capacity).Note that the path-loss impacts the received powerand hence the capacity. Thus, the capacity at 1900MHz with a given unit of bandwidth would be
30Path loss was calculated using the aforementioned empiri-cal propagation models: Okumura-Hata and COST 231 Walfisch-Ikegami.
31The values included in this table, and thus utilized for ourcalculations, correspond to those utilized in [13] and [11]. Thispermitted us to maintain those works as a measure for comparability.
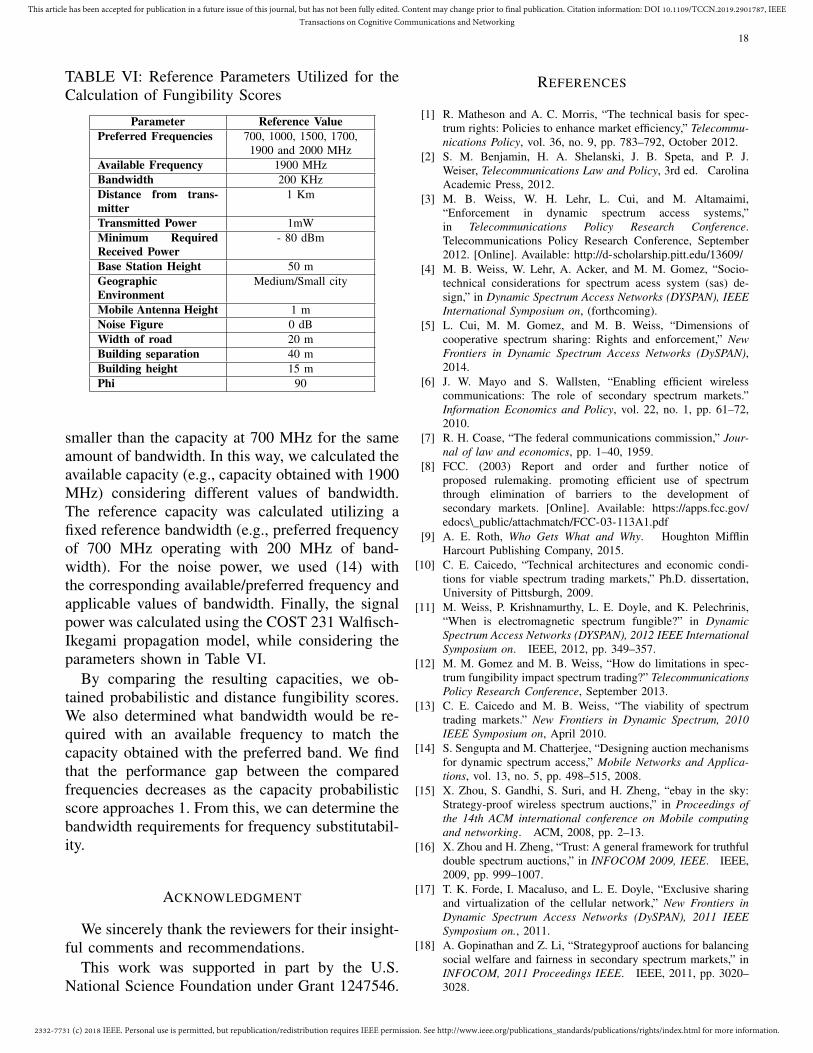
2332-7731 (c) 2018 IEEE. Personal use is permitted, but republication/redistribution requires IEEE permission. See http://www.ieee.org/publications_standards/publications/rights/index.html for more information.
This article has been accepted for publication in a future issue of this journal, but has not been fully edited. Content may change prior to final publication. Citation information: DOI 10.1109/TCCN.2019.2901787, IEEETransactions on Cognitive Communications and Networking
18
TABLE VI: Reference Parameters Utilized for theCalculation of Fungibility Scores
Parameter Reference ValuePreferred Frequencies 700, 1000, 1500, 1700,
1900 and 2000 MHzAvailable Frequency 1900 MHzBandwidth 200 KHzDistance from trans-mitter
1 Km
Transmitted Power 1mWMinimum RequiredReceived Power
- 80 dBm
Base Station Height 50 mGeographicEnvironment
Medium/Small city
Mobile Antenna Height 1 mNoise Figure 0 dBWidth of road 20 mBuilding separation 40 mBuilding height 15 mPhi 90
smaller than the capacity at 700 MHz for the sameamount of bandwidth. In this way, we calculated theavailable capacity (e.g., capacity obtained with 1900MHz) considering different values of bandwidth.The reference capacity was calculated utilizing afixed reference bandwidth (e.g., preferred frequencyof 700 MHz operating with 200 MHz of band-width). For the noise power, we used (14) withthe corresponding available/preferred frequency andapplicable values of bandwidth. Finally, the signalpower was calculated using the COST 231 Walfisch-Ikegami propagation model, while considering theparameters shown in Table VI.
By comparing the resulting capacities, we ob-tained probabilistic and distance fungibility scores.We also determined what bandwidth would be re-quired with an available frequency to match thecapacity obtained with the preferred band. We findthat the performance gap between the comparedfrequencies decreases as the capacity probabilisticscore approaches 1. From this, we can determine thebandwidth requirements for frequency substitutabil-ity.
ACKNOWLEDGMENT
We sincerely thank the reviewers for their insight-ful comments and recommendations.
This work was supported in part by the U.S.National Science Foundation under Grant 1247546.
REFERENCES
[1] R. Matheson and A. C. Morris, “The technical basis for spec-trum rights: Policies to enhance market efficiency,” Telecommu-nications Policy, vol. 36, no. 9, pp. 783–792, October 2012.
[2] S. M. Benjamin, H. A. Shelanski, J. B. Speta, and P. J.Weiser, Telecommunications Law and Policy, 3rd ed. CarolinaAcademic Press, 2012.
[3] M. B. Weiss, W. H. Lehr, L. Cui, and M. Altamaimi,“Enforcement in dynamic spectrum access systems,”in Telecommunications Policy Research Conference.Telecommunications Policy Research Conference, September2012. [Online]. Available: http://d-scholarship.pitt.edu/13609/
[4] M. B. Weiss, W. Lehr, A. Acker, and M. M. Gomez, “Socio-technical considerations for spectrum acess system (sas) de-sign,” in Dynamic Spectrum Access Networks (DYSPAN), IEEEInternational Symposium on, (forthcoming).
[5] L. Cui, M. M. Gomez, and M. B. Weiss, “Dimensions ofcooperative spectrum sharing: Rights and enforcement,” NewFrontiers in Dynamic Spectrum Access Networks (DySPAN),2014.
[6] J. W. Mayo and S. Wallsten, “Enabling efficient wirelesscommunications: The role of secondary spectrum markets.”Information Economics and Policy, vol. 22, no. 1, pp. 61–72,2010.
[7] R. H. Coase, “The federal communications commission,” Jour-nal of law and economics, pp. 1–40, 1959.
[8] FCC. (2003) Report and order and further notice ofproposed rulemaking. promoting efficient use of spectrumthrough elimination of barriers to the development ofsecondary markets. [Online]. Available: https://apps.fcc.gov/edocs\_public/attachmatch/FCC-03-113A1.pdf
[9] A. E. Roth, Who Gets What and Why. Houghton MifflinHarcourt Publishing Company, 2015.
[10] C. E. Caicedo, “Technical architectures and economic condi-tions for viable spectrum trading markets,” Ph.D. dissertation,University of Pittsburgh, 2009.
[11] M. Weiss, P. Krishnamurthy, L. E. Doyle, and K. Pelechrinis,“When is electromagnetic spectrum fungible?” in DynamicSpectrum Access Networks (DYSPAN), 2012 IEEE InternationalSymposium on. IEEE, 2012, pp. 349–357.
[12] M. M. Gomez and M. B. Weiss, “How do limitations in spec-trum fungibility impact spectrum trading?” TelecommunicationsPolicy Research Conference, September 2013.
[13] C. E. Caicedo and M. B. Weiss, “The viability of spectrumtrading markets.” New Frontiers in Dynamic Spectrum, 2010IEEE Symposium on, April 2010.
[14] S. Sengupta and M. Chatterjee, “Designing auction mechanismsfor dynamic spectrum access,” Mobile Networks and Applica-tions, vol. 13, no. 5, pp. 498–515, 2008.
[15] X. Zhou, S. Gandhi, S. Suri, and H. Zheng, “ebay in the sky:Strategy-proof wireless spectrum auctions,” in Proceedings ofthe 14th ACM international conference on Mobile computingand networking. ACM, 2008, pp. 2–13.
[16] X. Zhou and H. Zheng, “Trust: A general framework for truthfuldouble spectrum auctions,” in INFOCOM 2009, IEEE. IEEE,2009, pp. 999–1007.
[17] T. K. Forde, I. Macaluso, and L. E. Doyle, “Exclusive sharingand virtualization of the cellular network,” New Frontiers inDynamic Spectrum Access Networks (DySPAN), 2011 IEEESymposium on., 2011.
[18] A. Gopinathan and Z. Li, “Strategyproof auctions for balancingsocial welfare and fairness in secondary spectrum markets,” inINFOCOM, 2011 Proceedings IEEE. IEEE, 2011, pp. 3020–3028.

2332-7731 (c) 2018 IEEE. Personal use is permitted, but republication/redistribution requires IEEE permission. See http://www.ieee.org/publications_standards/publications/rights/index.html for more information.
This article has been accepted for publication in a future issue of this journal, but has not been fully edited. Content may change prior to final publication. Citation information: DOI 10.1109/TCCN.2019.2901787, IEEETransactions on Cognitive Communications and Networking
19
[19] J. M. Peha and S. Panichpapiboon, “Real-time secondary mar-kets for spectrum,” Telecommunications Policy, vol. 28, no. 7,pp. 603–618, 2004.
[20] M. J. Marcus, “Real time spectrum markets and interruptiblespectrum: New concepts of spectrum use enabled by cognitiveradio,” in New Frontiers in Dynamic Spectrum Access Networks,2005. DySPAN 2005. 2005 First IEEE International Symposiumon. IEEE, 2005, pp. 512–517.
[21] S. Gandhi, C. Buragohain, L. Cao, H. Zheng, and S. Suri,“A general framework for wireless spectrum auctions,” inNew Frontiers in Dynamic Spectrum Access Networks, 2007.DySPAN 2007. 2nd IEEE International Symposium on. IEEE,2007, pp. 22–33.
[22] ——, “Towards real-time dynamic spectrum auctions,” Com-puter Networks, vol. 52, no. 4, pp. 879–897, 2008.
[23] S. Mishra and S. Roy, “Market mechanisms for dynamicspectrum access (dsa),” IEEE Transactions on Wireless Com-munications, vol. 17, no. 5, pp. 3071–3081, 2018.
[24] L. Doyle, J. Kibilda, T. K. Forde, and L. DaSilva, “Spectrumwithout bounds, networks without borders,” Proceedings of theIEEE, vol. 102, no. 3, pp. 351–365, March 2014.
[25] P. Cramton and L. Doyle, “Open access wireless markets,”Telecommunications Policy, vol. 41, no. 5-6, pp. 379–390, 2017.
[26] B. Lorenzo, A. S. Shafigh, J. Liu, F. J. González-Castaño, andY. Fang, “Data and spectrum trading policies in a trusted cog-nitive dynamic network architecture,” IEEE/ACM Transactionson Networking, 2018.
[27] A. W. Min, X. Zhang, J. Choi, and K. G. Shin, “Exploitingspectrum heterogeneity in dynamic spectrum market,” IEEETransactions on Mobile Computing, vol. 11, no. 12, pp. 2020–2032, 2012.
[28] L. Duan, J. Huang, and B. Shou, “Investment and pricing withspectrum uncertainty: A cognitive operator’s perspective,” IEEETransactions on Mobile Computing, vol. 10, no. 11, pp. 1590–1604, 2011.
[29] D. Niyato and E. Hossain, “Spectrum trading in cognitive ra-dio networks: A market-equilibrium-based approach,” WirelessCommunications, IEEE, vol. 15, no. 6, pp. 71–80, 2008.
[30] D. Niyato, E. Hossain, and Z. Han, “Dynamics of multiple-seller and multiple-buyer spectrum trading in cognitive radionetworks: A game-theoretic modeling approach,” IEEE Trans-actions on Mobile Computing, vol. 8, no. 8, pp. 1009–1022,2009.
[31] D. Niyato and E. Hossain, “Competitive pricing for spectrumsharing in cognitive radio networks: Dynamic game, ineffi-ciency of nash equilibrium, and collusion,” IEEE journal onselected areas in communications, vol. 26, no. 1, 2008.
[32] U. Wilensky and W. Rand, An introduction to agent-basedmodeling: modeling natural, social, and engineered complexsystems with NetLogo. MIT Press, 2015.
[33] L. Cui, M. B. Weiss, B. Morel, and D. Tipper, “Riskand decision analysis of dynamic spectrum access,”Telecommunications Policy, vol. 41, no. 5, pp. 405 – 421, 2017,optimising Spectrum Use. [Online]. Available: http://www.sciencedirect.com/science/article/pii/S0308596117300460
[34] J. M. Perloff, Microeconomics: theory and applications withcalculus, 2008.
[35] M. M. Gomez, L. Cui, and M. B. H. Weiss, “Trading wirelesscapacity through spectrum virtualization using lte-a,” TPRCConference Paper, 2014.
[36] A. Wang, M. Iyer, R. Dutta, G. N. Rouskas, and I. Baldine,“Network virtualization: Technologies, perspectives, and fron-tiers.” Lightwave Technology, Journal of, vol. 31, no. 4, pp.523–537, 2013.
[37] T. Forde and L. E. Doyle, “Cellular clouds,” Telecommunica-tions Policy, vol. 37, no. 2-3, pp. 194–207, 2013.
[38] H. Wen, P. K. Tiwary, and T. Le-Ngoc, Wireless Virtualization.Springer, 2013.
[39] Y. Zaki, L. Zhao, C. Goerg, and A. Timm-Giel, “Lte mobilenetwork virtualization,” Mobile Networks and Applications,vol. 16, no. 4, pp. 424–432, 2011.
[40] S. Ahmadi, LTE-Advanced: A Practical Systems Approach toUnderstanding 3GPP LTE Releases 10 and 11 Radio AccessTechnologies. Academic Press, 2013.
[41] 3GPP, “Evolved universal terrestrial radio access (e-utra); basestation (bs) radio transmission and reception (3gpp ts 36.104version 12.3.0 release 12),” 3GPP, TS 12.3.0:V12.3.0, March2014.
[42] M. M. Gomez, “Secondary spectrum markets: from ‘naked’spectrum to virtualized commodities,” Ph.D. dissertation, Uni-versity of Pittsburgh, 2017.
[43] M. M. Gomez, M. B. Weiss, G. McHenry, and L. Doyle,“Matching markets for spectrum sharing,” TPRC ConferencePaper, 2017. [Online]. Available: https://ssrn.com/abstract=2944197
[44] E. Ostrom, “Background on the institutional analysis and de-velopment framework,” Policy Studies Journal, vol. 39, no. 1,pp. 7–27, 2011.
[45] M. D. McGinnis, “An introduction to iad and the language ofthe ostrom workshop: a simple guide to a complex framework,”Policy Studies Journal, vol. 39, no. 1, pp. 169–183, 2011.
[46] A. S. DeVany, R. D. Eckert, C. J. Meyers, D. J. O’Hara,and R. C. Scott, “A property system for market allocationof the electromagnetic spectrum: A legal-economic-engineeringstudy.” Stanford Law Review, pp. 1499–1561, 1969.
[47] D. Ricardo, “On rent,” in On the Principles of Political Econ-omy and Taxation. Library of Economics and Liberty, 1821.
[48] C. Bazelon, “The economic basis of spectrum value: Pairingaws-3 with the 1755 mhz band is more valuable than pairing itwith frequencies from the 1690 mhz band,” The Brattle Group,Washington DC, 2011.
Related Documents


