Improving Greek Medical Facilities in Central Macedonia Paul Nikolaidis, Dimitrios Xanthidis Abstract—The monitoring and exploring competencies of GIS health mapping can enhance health knowledge communicability in health society and thus provide a grater consensus among all health stakeholders. The persistence to investigate further the need for reallocation of the public hospitals in the Central Macedonia region of Greece gave birth to the illustration of a density map produced by the involvement of Arc-GIS software as a health monitoring and exploring paradigm. The resulting suggestion was the progression of Giannitsa’s General Hospital equipment and staff because of its strategic position concerning the homelands of the patients involved in this research. Keywords—E-Health, Health Provision, Patients’ Density Map I. INTRODUCTION andling geographical information with computer systems to enable the better understanding of the world triggers the need to place information in geographical context. That “where” issue of every human activity plays a special role in comprehending human life. Geographical Information Systems have undertaken the need to address such matters and they proved to be an effective way of monitoring and visualizing many aspects of human life [1]. “With a single collection of tools, GIS is able to bridge the gap between curiosity-driven science and practical problem solving” [2] This is already done for several areas of societal issues and of scientific fields like, for instance, archaeology, geology, topography, demographics, etc. In those fields GIS plays a very important role either directly as a core application or as an aid instrument for mapping and analyzing data and revealing new patterns that could lead to better understanding of existing knowledge or to generate new knowledge that needs further consideration. Paul Nikolaidis, Department of Geography, Environment & Development Studies Birkbeck University of London, U.K., e- mail: [email protected] Dimitrios Xanthidis, Ph.D, Department of Computer Science Imam University Riyadh, Kingdom of Saudi Arabia, e-mail: [email protected] But GIS can contribute also, as Luc Loslier strongly states in the International Workshop held in Sri Lanka, in Health planning and Health education. The appropriate establishment of Health centres can be considered as part of the health planning. This “where” problem of health centres can be addressed by GIS facilities which can suggest a more robust distribution of hospitals and, as consequence, of health provisions in general [3]. So, in the case of public Health, the element of right location is of critical importance for the establishment of medical health centres. The Greek National Health System is based mainly on public hospitals to address the health needs of chronic disease patients. Therefore their distribution attracts a significant interest. So, in this case the following quest could be justified: are secondary public health centres in the region, allocated for chronic disease people, situated in the appropriate locations for the cause? II. AIMS AND OBJECTIVES More specifically, this research study aims at helping evaluate the public hospital centres distribution of Central Macedonia through the spatial analysis of chronic disease patients’ geography. With that goal in mind the following objectives had to be fulfilled: • Map public hospital centres in Central Macedonia Northern Greece, • Examine the data looking for health inequalities at county scale explaining the current situation, • Investigate a better allocation proposal for public hospitals’ through a density map. III. LITERATURE REVIEW Jones Christopher believes that GIS can deal effectively with the “where” problem and, through the analysis of data, can monitor and visualize human life addressing the “where” issue. He depicts GIS more as a computer-based handling tool than a method for discovering new knowledge. Longley, Goodhild, Maquire and Rhind underpin this GIS scientific approach clearly in page 13 and in the “Gallery of Applications” chapter they mention Health as a GIS application area [2]. Health is one more sector where GIS has found a fertile ground for producing great outcomes. One of the main reasons that GIS can produce a significant performance in utilizing health services is mentioned in the Ellen’s Cromley and Sara’s McLaferty work titled as “Public Health and GIS”. This is to aid health care reform H INTERNATIONAL JOURNAL OF EDUCATION AND INFORMATION TECHNOLOGIES Issue 4, Volume 6, 2012 371

Welcome message from author
This document is posted to help you gain knowledge. Please leave a comment to let me know what you think about it! Share it to your friends and learn new things together.
Transcript
Improving Greek Medical Facilities in Central
Macedonia
Paul Nikolaidis, Dimitrios Xanthidis
Abstract—The monitoring and exploring competencies of
GIS health mapping can enhance health knowledge
communicability in health society and thus provide a grater
consensus among all health stakeholders. The persistence to
investigate further the need for reallocation of the public
hospitals in the Central Macedonia region of Greece gave birth
to the illustration of a density map produced by the involvement
of Arc-GIS software as a health monitoring and exploring
paradigm. The resulting suggestion was the progression of
Giannitsa’s General Hospital equipment and staff because of its
strategic position concerning the homelands of the patients
involved in this research.
Keywords—E-Health, Health Provision, Patients’ Density
Map
I. INTRODUCTION
andling geographical information with computer
systems to enable the better understanding of the
world triggers the need to place information in
geographical context. That “where” issue of every human
activity plays a special role in comprehending human life.
Geographical Information Systems have undertaken the
need to address such matters and they proved to be an
effective way of monitoring and visualizing many aspects
of human life [1].
“With a single collection of tools, GIS is able to bridge
the gap between curiosity-driven science and practical
problem solving” [2]
This is already done for several areas of societal issues
and of scientific fields like, for instance, archaeology,
geology, topography, demographics, etc. In those fields
GIS plays a very important role either directly as a core
application or as an aid instrument for mapping and
analyzing data and revealing new patterns that could lead
to better understanding of existing knowledge or to
generate new knowledge that needs further consideration.
Paul Nikolaidis, Department of Geography, Environment &
Development Studies Birkbeck University of London, U.K., e-
mail: [email protected]
Dimitrios Xanthidis, Ph.D, Department of Computer Science
Imam University Riyadh, Kingdom of Saudi Arabia, e-mail:
But GIS can contribute also, as Luc Loslier strongly
states in the International Workshop held in Sri Lanka, in
Health planning and Health education. The appropriate
establishment of Health centres can be considered as part
of the health planning. This “where” problem of health
centres can be addressed by GIS facilities which can
suggest a more robust distribution of hospitals and, as
consequence, of health provisions in general [3].
So, in the case of public Health, the element of right
location is of critical importance for the establishment of
medical health centres. The Greek National Health
System is based mainly on public hospitals to address the
health needs of chronic disease patients. Therefore their
distribution attracts a significant interest. So, in this case
the following quest could be justified: are secondary
public health centres in the region, allocated for chronic
disease people, situated in the appropriate locations for
the cause?
II. AIMS AND OBJECTIVES
More specifically, this research study aims at helping
evaluate the public hospital centres distribution of Central
Macedonia through the spatial analysis of chronic disease
patients’ geography. With that goal in mind the following
objectives had to be fulfilled:
• Map public hospital centres in Central Macedonia
Northern Greece,
• Examine the data looking for health inequalities at
county scale explaining the current situation,
• Investigate a better allocation proposal for public
hospitals’ through a density map.
III. LITERATURE REVIEW
Jones Christopher believes that GIS can deal
effectively with the “where” problem and, through the
analysis of data, can monitor and visualize human life
addressing the “where” issue. He depicts GIS more as a
computer-based handling tool than a method for
discovering new knowledge. Longley, Goodhild, Maquire
and Rhind underpin this GIS scientific approach clearly
in page 13 and in the “Gallery of Applications” chapter
they mention Health as a GIS application area [2].
Health is one more sector where GIS has found a
fertile ground for producing great outcomes. One of the
main reasons that GIS can produce a significant
performance in utilizing health services is mentioned in
the Ellen’s Cromley and Sara’s McLaferty work titled as
“Public Health and GIS”. This is to aid health care reform
H
INTERNATIONAL JOURNAL OF EDUCATION AND INFORMATION TECHNOLOGIES Issue 4, Volume 6, 2012
371
for a better provision of health care services. The book is
geographically focused on the United States of America
and treats GIS as a computer based system that can lead
health management [4].
Public health investigation (diseases, morbidity and
well-being) and Healthcare provision (diagnostic and
treatment) are two areas of great interest for GIS analysts
in the Health sector of human societies where GIS can be
applicable. It has been made very clear that a GIS system
like Arc-GIS can be very successful. Through their
tutorials they revealed the applicability of GIS in many
areas of human activity and especially for health sector.
They explained the used technology and gave relevant
case studies and they pointed out the reasons that
strengthen the necessity of GIS in improving Health
management effectiveness [5].
The provision of better healthcare services can have a
positive impact to public health indexes because of
treatment reasons and because of psychological reasons
as well, like the feeling of security in certain areas that
have a Hospital nearby that can cover all patients’ needs.
As Dr Cathrine Emma Jones stated:
“Health Inequalities People in disadvantaged
circumstances prone, to more illness, to greater distress,
to more disability and to shorter lives” [6]
Α study conducted by Maniou and Iakovidou revealed
the current situation in Greece public and private sector
with great details. They are illustrating many aspects of
the Greek National Health System (GNHS from now on)
and they are concluding that public health sector in
Greece should consider to improve their services
provisions and promote better health policies in order to
be comparable with private health sector [7].
The Greek Ministry of Health and Social Solidarity
(MHSS from now on) tried to improve the GNHS, by
creating an interactive site where all the relevant agents
(physicians, nurseries, health staff and public) can
contribute towards the construction of robust and relevant
databases. It is called the Health Map of Greece and
presents, with the aid of a GIS system, epidemiological,
demographic, environmental data that affect public health
in a short or long term. One of its main data sources is the
National Statistics Agency. The National School of
Public Health also collaborated with the above Ministry
to create and analyze these kinds of data.
These days in Greece the MHSS prepares a
reformation of clinics and management departments in
public hospitals. This fact opened an extensive discussion
in the society for the effectiveness of such plans and
brought out once again the problems that chronic disease
patients facing in GNHS [8].
In Greece there has been a research exploitation of GIS
systems, from public universities and private
organizations mostly for seismology predictions,
mapping of archaeological areas, cadastral projects,
coastal mapping, agriculture, etc [9].
As far as Healthcare provision concerns, little has been
done. Additionally from the Internet research emerged
that there is not any kind of GIS integration with
Healthcare management yet. Thus there is a great
opportunity for researchers to apply GIS in Health area
and especially here in Central Macedonia, Greece, where
the benefits of such systems is needed to enhance health
management in order to improve health provision,
prediction and education promotion.
For example, there should be a redistribution
evaluation for every health unit in the country, to prevent
inequalities in the GNHS, depended on geographical
factor.
It is an acceptable problem from Greece
authorities and GIS can facilitate the efforts to find most
appropriate areas for placing health units. At this point
GIS specialists should be particularly thoughtful and
sensitive for disabled people and people with special
clinical needs when they are going to suggest such areas
and when they care for such projects they should bear in
mind the significance of health determinants.
IV. METHODOLOGY
A. Study Area
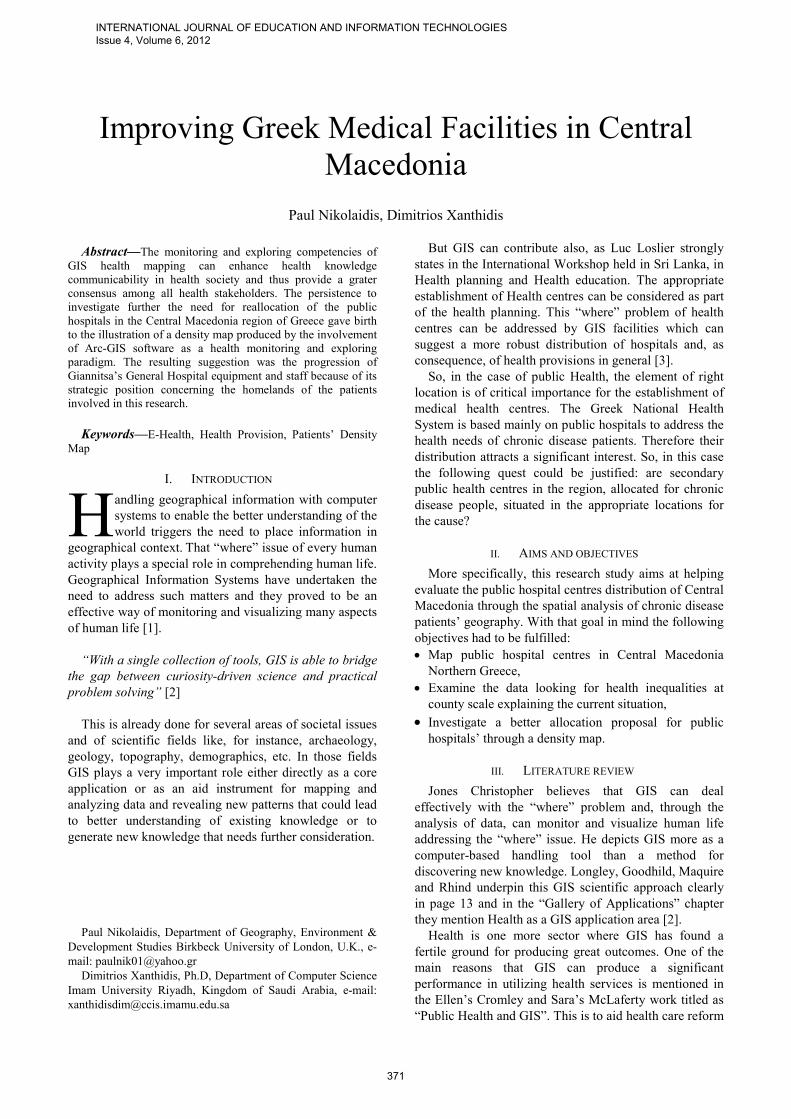
Central Macedonia (CM from now on, Fig.1) is the
study area and one of the thirteen administrative regions
of Greece. It is cited in the north area of Greece and the
city of Thessaloniki, the second largest in Greece, is its
capital. It consists of 7 peripheral units (counties) and 38
municipalities and as a region presents increased
percentages of Chronic Disease Patients (CDP from now
on) which have complaints about current public health
services provision and so worthy of research
investigation [10].
Fig. 1: Central Macedonia in Greece
INTERNATIONAL JOURNAL OF EDUCATION AND INFORMATION TECHNOLOGIES Issue 4, Volume 6, 2012
372

B. Initiating research
At first the research began with an opening of a circle
of contacts with medical staff in CM to discover the
categories of Chronic Disease Patients that have an
urgent and continuous need for hospital treatment and to
find the ways to possibly administer a questionnaire in
public hospitals with relevant health units. Of all the CDP
categories mentioned three of them were chosen to be the
representatives for this research purposes. This was done
due to time constraints and because they could reveal the
current situation as being severe CDP cases. Thus, the
cancer patients, the renal failure patients and thalassemia
patients became the three categories of CDP that this
research focused on.
This research also decided to be concentrated to the
secondary health level, meaning hospitals in CM, for
almost the same reasons and because hospitals are more
important for CDP than health centres of the first health
level and that is because they have an immediate and
frequent dependence for hospitals services. The research
was focused also in public hospitals due to the fact that
Greece is in a middle of an economic crisis. This
influenced negatively the purchasing power of the people
and so their ability to address health services in private
hospitals.
As a consequence nowadays more people tend to seek
for treatment at public hospitals that provide their
services to anyone almost for free. Thus public hospitals
accessibility and the quality of their health services
should attract more attention.
As the conversations with medical staff, managers and
staff of relevant associations and the Internet research
revealed, CDP have to visit a hospital for treatment very
often. To be more specific, people who suffer from renal
failure have to visit a hospital even three times a week for
their dialysis. Thalassemia patients need RBC transfusion
every 20-30 days and cancer patients need their
chemotherapy, maybe radiotherapy sessions and
frequently medical examinations. All of them are also
bound with the hospitals because of the special medical
examinations they have to take every so often to help
their doctors monitor their current health situation. So
they are severe CDP cases and, hence, worthy to be the
CDP representatives.
Another online investigation was followed to find all
relevant articles and links about CDP and their health
system environment especially in CM. From this search
every association and medical units related to those
patients were found as well as special information about
the total populations of the three CDP categories in CM
given the balance necessary for the survey sample.
Arc-GIS software is the instrument of choice suitable
for the editing and presentation of all available data. The
first Geographical outcome of this software was the map
of Greece in Fig. 1 to spot easily the researched area. The
spatial data needed for the Greece basic map layer were
found after a quick Internet inquiry and downloaded from
DIVA-GIS site and the WORLD-ATLAS site. The
second geographical action necessary for this research
purposes was to produce a point map layer of Public
Hospitals in CM. A full recording of Greek Hospitals can
be found on the MHSS Internet resource site.
At this point, the research was directed at finding all
the hospitals of CM that have an immediate medical
relationship with the chosen CDP categories. It was
decided that in the end, the important and chosen
hospitals should be only those that maintain special staff
and equipment that could respond to any medical
treatment necessary for those CDP. So, an Internet
research began once again which leaded to a list of
hospitals proper for our chosen CDP.
All of these hospitals are treating CDP but not all of
them have special clinics or departments with full
equipment dedicated to them. After communicating with
those hospitals, interviewing CDP and by the Internet
research it was clear that about ten (10) hospitals had to
be excluded from the list of proper CM Hospitals for the
selected CDP. Even if some of them where performing
treating procedures, it was certain that they did not have
permanent or specialized enough staff. For example, the
General Hospital of George Genimatas has no Dialysis
Unit (DU) or Thalassemia Unit (TU) or special Cancer
Clinic (CC) inside. So, even if it performs cancer
surgeries it cannot be included to CDP proper Hospitals’
list. The General Hospital for Infectious Diseases and the
Hospital for Venereal and Skin Diseases are two more
cases that have no specialized units for the three chosen
CDP and in addition, they are about to shut operations
shortly. One more example of marginally excluded
hospital is that of Poligyros General Hospital in
Chalkidiki County where the phone call made there by
the researcher revealed that there is only one thalassemia
patient treated with no special equipment for RBC
transfusion. So, the research proceeded with excluding
those Hospitals from the mentioned Hospitals’ list and
finally retained a list of ten (10) Hospitals capable of
ensuring treatment safety in all manners for those CDP.
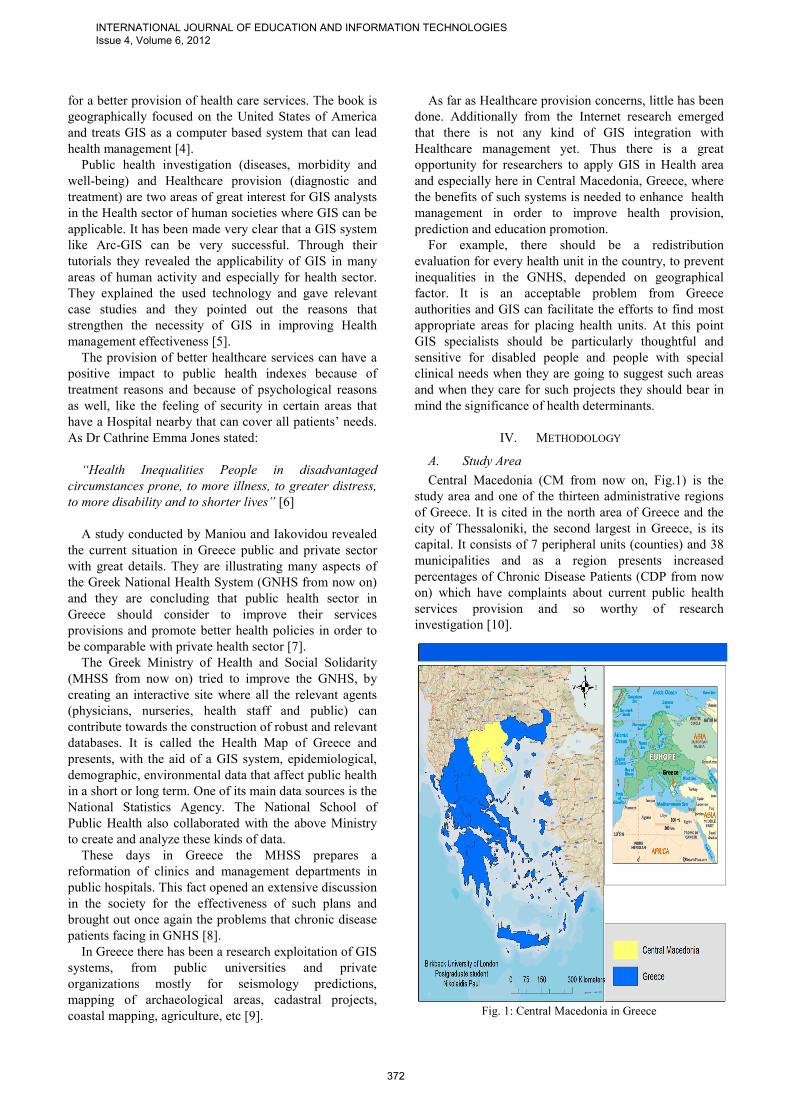
After exclusion, georeferencing and symbolization
procedures taken place in Esri’s software (Arc-GIS), the
researchers managed to create a CM Hospitals point layer
on top of CM Municipalities polygon layer as shown in
Fig. 2 (next section) in order to present the current
allocation reality of public CDP hospitals in CM region.
C. The Sample of Chronic Disease Patients
First the research sought some characteristics of the
current socioeconomically status of CDP in CM, their
general opinion about the GNHS and their accessibility
status to public hospitals grouped into categories using
MS Access. Next, demographic pie charts should be
generated using MS Excel that would be imported into
Arc-GIS in groups by country so as to perform a
Geostatistical and Geo-visualization analysis.
Afterwards, the CDPs were reached, mainly in
hospitals, their associations and the researcher’s circle of
INTERNATIONAL JOURNAL OF EDUCATION AND INFORMATION TECHNOLOGIES Issue 4, Volume 6, 2012
373
private contacts, to gather answers on specific questions,
as objective as possible, away from medical staff or other
individuals that could influence their opinions.
The sample taken for further research consisted of a
balanced mix of a fair analogy of CDP survey
participants based on the population of each category in
the CM. To be more precise, the total population of renal
failure patients in CM is approximately 3,000 people
when the total national population is about 12,000. And
in the case of thalassemia patients the numbers are 800
and 3,500 respectively. Thus, their share in this sample
was relatively small. The cancer patients’ number on the
other hand was much higher and their percentage in the
sample much larger. This information was taken directly
from the records of their associations in Thessaloniki,
CM.
The survey was deployed for a period of 8 weeks
(October, November 2011). The sample size, of about
258 participants, is appropriate considering the total
population of the geographic area under study is around
2,500,000 residents yielding a rate of 1.03 respondents
for every 10,000 individuals in the population close to the
normal size of around 1,200 respondents of important
public surveys on events like parliament elections in the
country with a population around 9,000,000 and a ratio of
around 1.3 respondents per 10,000 people. These CDPs
were approached in the 10 public hospitals and the 3 CDP
associations in CM. There were also about 20
questionnaires or so filled up from author’s circle of
acquaintances. All CDP gave their consent to be part in
this research.
D. Geovisualization methods
After the survey the patients’ data collected were
organized so as to be used in the Geostatistical and
Geovisualization analysis that followed using Arc-GIS.
This geo-referencing was of critical importance for
exploring the sample data with Arc-GIS grouped maps
and producing 3 more Arc-GIS maps of CDP travel
distance accessibility level, expenses accessibility level
and satisfaction level. The chosen and most appropriate
scale would be the county scale.
Another georeferencing of CDP according to their
municipalities’ city halls coordinates was performed
insight Arc-Map. More specifically, a CDP point layer in
Municipality residency scale was created giving to its
point feature population attributes. Kernel density
estimation (KDE) analysis followed over this point layer
using the spatial analyst tool in arc-toolbox. The CDP
percentage field was chosen to be the weight factor of
this analysis. So a transformation from vector discrete
units to raster continuous surface took place and the
required CDP density map was displayed [11], right
above the choropleth CDP population layer map of CM
in county scale and the Public Hospitals’ point layer map
of those CDP in CM. Another layer showing the rest (non
valid) Public Hospitals was also illustrated. After some
symbolization actions and after selecting a 50%
transparency for the CDP density map the final output
map was ready. Finally, the results endorsed an answer to
the main quest of this paper despite the fact that the
Geostatistical analysis performed earlier weakened the
need for continuation.
V. FINDINGS
A. Map public hospital centres in Central
Macedonia, Northern Greece
The first outcome of this research was to reveal the
geo-distribution of public hospitals in CM. Thus, after
collecting information about CDP’s public hospitals’
allocation over CM and with the involvement of Arc-GIS
this research managed to illustrate the below map as a
starting point of its findings.
Fig.2: Spatial Distribution of Population and Public Hospitals in
CM
From observing the left and the right side of the map
above it is clear that Hospitals are located into urban
areas and, basically, the most populated Thessaloniki
Urban Area. In addition, a hospitals’ point layer was
created as decided it was necessary for the third face of
this research.
In the second face of exploring CDP’s data this
research attempted to present a contemporary profile and
maybe discover some kind of inequalities. The results
taken from the analysis made over the demographic pies
showed that as far as their education concerns, 25% of
the respondents have finished just the elementary
education, 36% of them have a high school degree, 26%
hold a bachelor’s degree and 10% have a postgraduate
degree, either a diploma (6%) or a Master’s or PhD (4%).
Just a 3% mentioned other education.
Moreover, the profession demographic pie depicted
that the majority of the CDP’s sample population consists
of people that works to the educational sector (15%), to
INTERNATIONAL JOURNAL OF EDUCATION AND INFORMATION TECHNOLOGIES Issue 4, Volume 6, 2012
374
the services provision sector (13%), as traders (10%) and
they are mostly (Other 44%) pensioners.
Concerning their income 44% make up to 12,000
Euros annually, 30% make between 12,000 and 25,000,
some 16% with 25,000 up to 50,000 and very few enjoy
an income of 50,000-150,000 Euros (2%) or more than
150,000 (1%). There was a significant 7% unable or
unwilling to answer. Most of the participants were 65
years old or more (31%), about a fifth of them (21%)
between 50 and 65, a quarter of them (26%) between 35
and 49 and 17% of them were 18 to 34 years old. There
was a small 4% of very young individuals and a negligent
1% that did not answer. There is no doubt that the
statistics above prove the validity of the sample with only
the part of the education shifting to some extend towards
the less educated people.
B. Spatial exploration of sample data
By continuing the profile efforts aforementioned the
research moved on to the presentation of a geo-reality by
exploiting the CDP’s residencies information in County
scale.
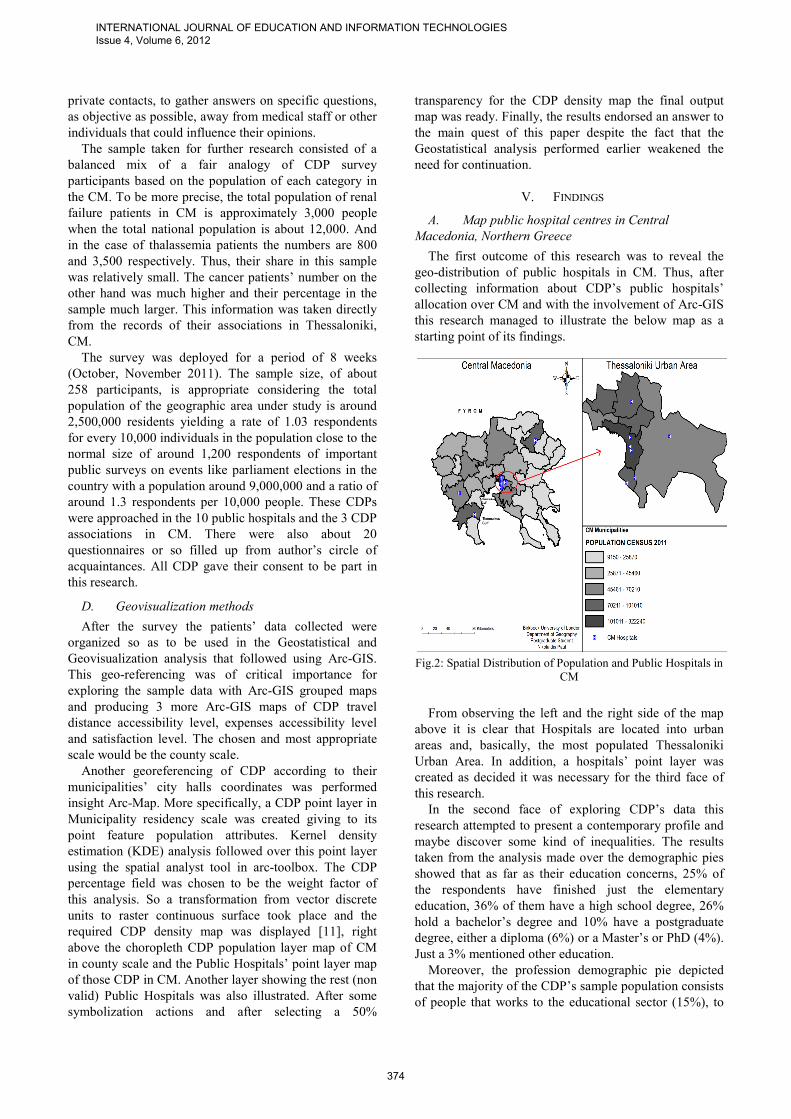
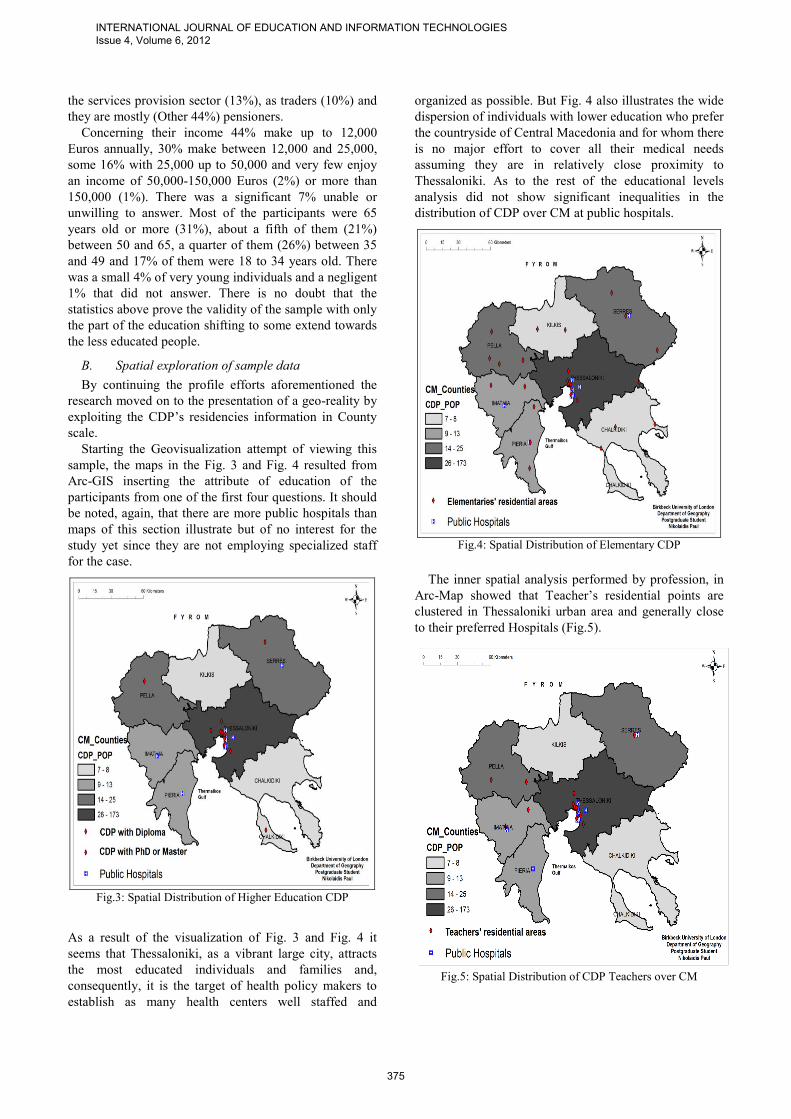
Starting the Geovisualization attempt of viewing this
sample, the maps in the Fig. 3 and Fig. 4 resulted from
Arc-GIS inserting the attribute of education of the
participants from one of the first four questions. It should
be noted, again, that there are more public hospitals than
maps of this section illustrate but of no interest for the
study yet since they are not employing specialized staff
for the case.
Fig.3: Spatial Distribution of Higher Education CDP
As a result of the visualization of Fig. 3 and Fig. 4 it
seems that Thessaloniki, as a vibrant large city, attracts
the most educated individuals and families and,
consequently, it is the target of health policy makers to
establish as many health centers well staffed and
organized as possible. But Fig. 4 also illustrates the wide
dispersion of individuals with lower education who prefer
the countryside of Central Macedonia and for whom there
is no major effort to cover all their medical needs
assuming they are in relatively close proximity to
Thessaloniki. As to the rest of the educational levels
analysis did not show significant inequalities in the
distribution of CDP over CM at public hospitals.
Fig.4: Spatial Distribution of Elementary CDP
The inner spatial analysis performed by profession, in
Arc-Map showed that Teacher’s residential points are
clustered in Thessaloniki urban area and generally close
to their preferred Hospitals (Fig.5).
Fig.5: Spatial Distribution of CDP Teachers over CM
INTERNATIONAL JOURNAL OF EDUCATION AND INFORMATION TECHNOLOGIES Issue 4, Volume 6, 2012
375
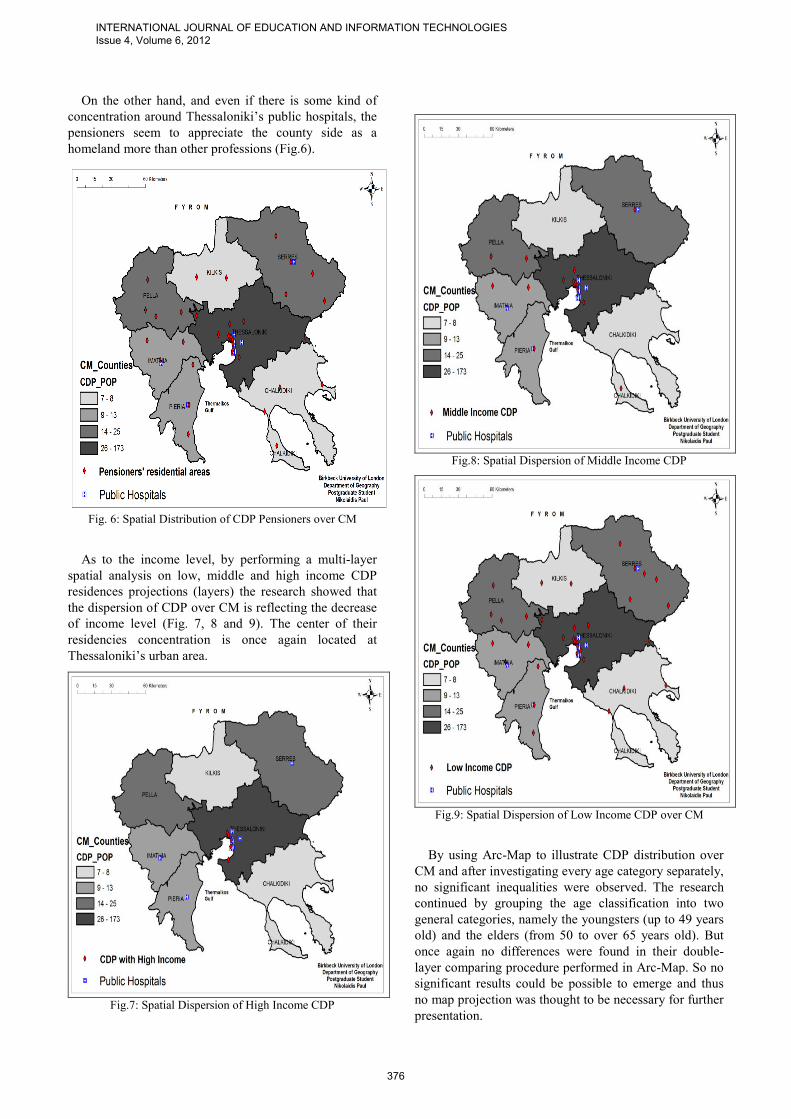
On the other hand, and even if there is some kind of
concentration around Thessaloniki’s public hospitals, the
pensioners seem to appreciate the county side as a
homeland more than other professions (Fig.6).
Fig. 6: Spatial Distribution of CDP Pensioners over CM
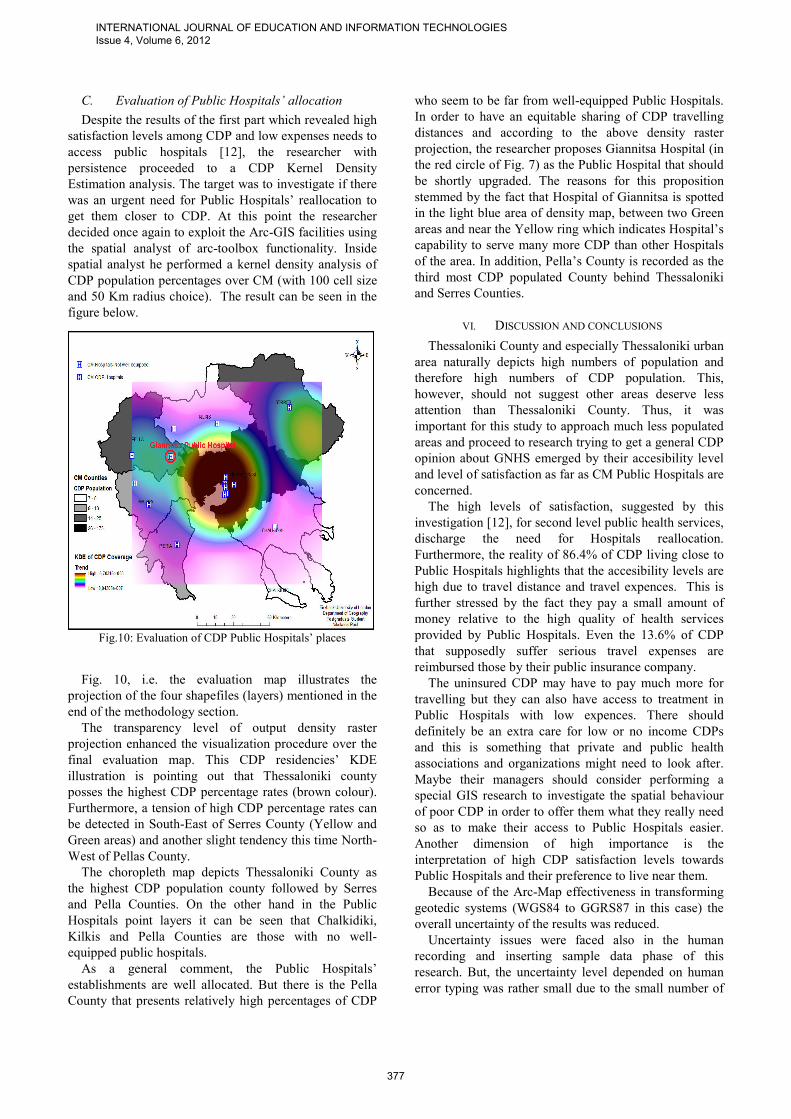
As to the income level, by performing a multi-layer
spatial analysis on low, middle and high income CDP
residences projections (layers) the research showed that
the dispersion of CDP over CM is reflecting the decrease
of income level (Fig. 7, 8 and 9). The center of their
residencies concentration is once again located at
Thessaloniki’s urban area.
Fig.7: Spatial Dispersion of High Income CDP
Fig.8: Spatial Dispersion of Middle Income CDP
Fig.9: Spatial Dispersion of Low Income CDP over CM
By using Arc-Map to illustrate CDP distribution over
CM and after investigating every age category separately,
no significant inequalities were observed. The research
continued by grouping the age classification into two
general categories, namely the youngsters (up to 49 years
old) and the elders (from 50 to over 65 years old). But
once again no differences were found in their double-
layer comparing procedure performed in Arc-Map. So no
significant results could be possible to emerge and thus
no map projection was thought to be necessary for further
presentation.
INTERNATIONAL JOURNAL OF EDUCATION AND INFORMATION TECHNOLOGIES Issue 4, Volume 6, 2012
376
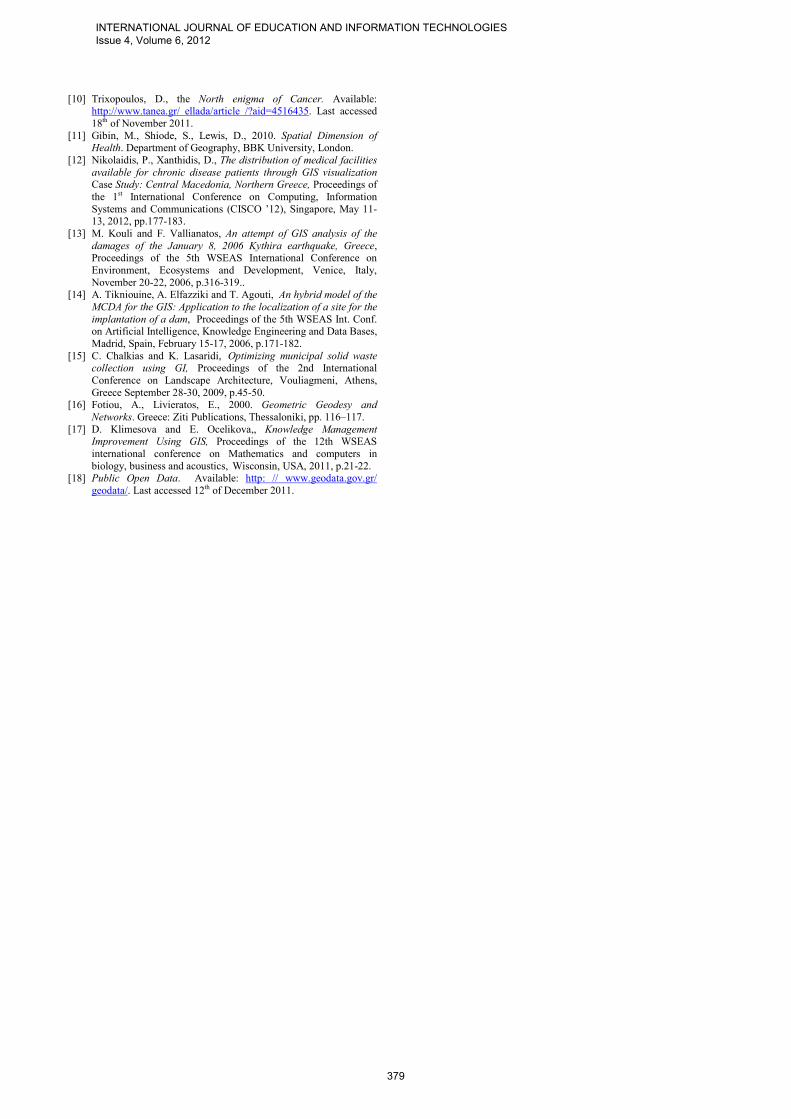
C. Evaluation of Public Hospitals’ allocation
Despite the results of the first part which revealed high
satisfaction levels among CDP and low expenses needs to
access public hospitals [12], the researcher with
persistence proceeded to a CDP Kernel Density
Estimation analysis. The target was to investigate if there
was an urgent need for Public Hospitals’ reallocation to
get them closer to CDP. At this point the researcher
decided once again to exploit the Arc-GIS facilities using
the spatial analyst of arc-toolbox functionality. Inside
spatial analyst he performed a kernel density analysis of
CDP population percentages over CM (with 100 cell size
and 50 Km radius choice). The result can be seen in the
figure below.
Fig.10: Evaluation of CDP Public Hospitals’ places
Fig. 10, i.e. the evaluation map illustrates the
projection of the four shapefiles (layers) mentioned in the
end of the methodology section.
The transparency level of output density raster
projection enhanced the visualization procedure over the
final evaluation map. This CDP residencies’ KDE
illustration is pointing out that Thessaloniki county
posses the highest CDP percentage rates (brown colour).
Furthermore, a tension of high CDP percentage rates can
be detected in South-East of Serres County (Yellow and
Green areas) and another slight tendency this time North-
West of Pellas County.
The choropleth map depicts Thessaloniki County as
the highest CDP population county followed by Serres
and Pella Counties. On the other hand in the Public
Hospitals point layers it can be seen that Chalkidiki,
Kilkis and Pella Counties are those with no well-
equipped public hospitals.
As a general comment, the Public Hospitals’
establishments are well allocated. But there is the Pella
County that presents relatively high percentages of CDP
who seem to be far from well-equipped Public Hospitals.
In order to have an equitable sharing of CDP travelling
distances and according to the above density raster
projection, the researcher proposes Giannitsa Hospital (in
the red circle of Fig. 7) as the Public Hospital that should
be shortly upgraded. The reasons for this proposition
stemmed by the fact that Hospital of Giannitsa is spotted
in the light blue area of density map, between two Green
areas and near the Yellow ring which indicates Hospital’s
capability to serve many more CDP than other Hospitals
of the area. In addition, Pella’s County is recorded as the
third most CDP populated County behind Thessaloniki
and Serres Counties.
VI. DISCUSSION AND CONCLUSIONS
Thessaloniki County and especially Thessaloniki urban
area naturally depicts high numbers of population and
therefore high numbers of CDP population. This,
however, should not suggest other areas deserve less
attention than Thessaloniki County. Thus, it was
important for this study to approach much less populated
areas and proceed to research trying to get a general CDP
opinion about GNHS emerged by their accesibility level
and level of satisfaction as far as CM Public Hospitals are
concerned.
The high levels of satisfaction, suggested by this
investigation [12], for second level public health services,
discharge the need for Hospitals reallocation.
Furthermore, the reality of 86.4% of CDP living close to
Public Hospitals highlights that the accesibility levels are
high due to travel distance and travel expences. This is
further stressed by the fact they pay a small amount of
money relative to the high quality of health services
provided by Public Hospitals. Even the 13.6% of CDP
that supposedly suffer serious travel expenses are
reimbursed those by their public insurance company.
The uninsured CDP may have to pay much more for
travelling but they can also have access to treatment in
Public Hospitals with low expences. There should
definitely be an extra care for low or no income CDPs
and this is something that private and public health
associations and organizations might need to look after.
Maybe their managers should consider performing a
special GIS research to investigate the spatial behaviour
of poor CDP in order to offer them what they really need
so as to make their access to Public Hospitals easier.
Another dimension of high importance is the
interpretation of high CDP satisfaction levels towards
Public Hospitals and their preference to live near them.
Because of the Arc-Map effectiveness in transforming
geotedic systems (WGS84 to GGRS87 in this case) the
overall uncertainty of the results was reduced.
Uncertainty issues were faced also in the human
recording and inserting sample data phase of this
research. But, the uncertainty level depended on human
error typing was rather small due to the small number of
INTERNATIONAL JOURNAL OF EDUCATION AND INFORMATION TECHNOLOGIES Issue 4, Volume 6, 2012
377

sample records of geodatabases and the excess precaution
measures taken.
Subsequently, and during the GIS visualisation phase a
need for seeking new knowledge was brought into the
surface. For example, something else that could be
thought off as important is the formal scale of Public
Hospitals. Besides the secondary and primary healthcare
division there is a larger one that is the geographical
division of Greece in Health Districts (seven to be
precise). Then, a Health District research of CDP could
be interesting.
Another dimension of high importance is the
translation of high CDP satisfaction levels towards Public
Hospitals and their preference to live near them. Of
course the selection of residency factor is not investigated
in depth at this research. But some CDP subgroups
present high residential concentrations in Thessaloniki
urban area, like CDP teachers (Fig. 5), high educated
CDP (Fig. 3) and CDP with high income (Fig. 9). This
means that the above CDP categories indicated a higher
ability in choosing their residential areas. This geographic
phenomenon can be detected in CDP combined
subgroups too, like Teachers with Thalassemia for
instance. This fact triggers the need for further behavioral
investigation on CDP subgroups to find health
inequalities by comparing their accessibility level with
other CDP or detecting the behavior of combined CDP
subgroups.
There could be concerns also, about the chosen
administrative boundaries scale. In this country the
administrative boundaries division plan is called
“Kalikratis” (implemented from 2010 onwards) and
divides Greece only into provinces and municipalities.
However, in this research the old county division scale
(which is a subdivision of the provinces scale) was
decided to be the appropriate scale for this sample CDP
data.
The dimension of time should be also inserted as a
variable in this research and with dynamic cartography
tools it could be possible to produce dynamic maps. For
instance there could be another question for CDP in
questionnaire’s form that indicates their residency
changes over time. Then, the resulting dynamic map of
changing residences over time could investigate the
internal migration of CDP in more detail.
Maybe there should be a research with satelite images
presenting, through GIS systems, the CDP residences
geography over time so to illustrate a trend pattern of
CDP soil occupation in the future [13].
Moreover there could be a multiple criteria decision
analysis (MCDA) performed to provision and suggest
possible places for Hospitals permitable establishments in
CM by using Arc-GIS spatial analysis abilities. The
selected criteria could be a Land Use Land Cover
Analysis excluding the unavailable areas, a Proximity
Road Analysis excluding, by buffering, areas that are far
from central roads and a CDP Density Analysis to find
areas close to CDP clusters [14].
To bring it all together, this research illustrated that the
majority of travel distances that CDPs have to undergo to
reach Public Hospitals are rather small and therefore, the
travel expences are relatively small too, even if they
claim otherwise. In addition CDPs are in general satisfied
by Public Hospitals’ Health Services offered despite
some observed deficiencies.
All the above drive this research to the conclusion that
CDPs of Central Macedonia believe that they enjoy high
quality of medical services in CM Public Hospitals. As a
concequence they recognize that GNHS treats them well.
(At this point it is only reasonable to say, due to the fact
that Greece is in the middle of an economic crisis, the
above general picture is prone to be altered in the near
future).
There is a small scale monetary adjustment that could
be thought of as crucial, given the current financial
environment in Greece, which is the recommendation that
can be depicted from density analysis illustration (Fig.
10) that Giannitsa’s public hospital be upgraded with
more medical equipment and specialized staff so to be
able to provide a substantial improvement of treatment to
its CDPs.
In conclusion, despite some minor technical and
methodological difficulties, with the right editing and
beyond cartography, the answers to geospatial questions
have been given with close promiximity to reality. This
analysis resulted to a better understanding of CM health
domain and highlighted the need of monitoring
periodically the allocation of public hospitals in the
region.
GIS introduced, in this research study, a socio-spatial
dialectic that created new knowledge and made clear the
need for further understanding and visualization over
results so to find new ways of gaining knowledge.
REFERENCES
[1] Jones, C., 1999. Geographical Information Systems and Computer Cartography. 3d edition, Addison Wesley Longman Ltd,
Singapore.
[2] Longley, P., Goodhild, M., Maguire, D., Rhind, D., “Geographic Information Systems and Science”, Third edition, John Wiley &
Sons Inc., USA, 2011, p.10.
[3] De Savigny, D., Wijeyaratne, P., 1995. GIS for Health and the Environment: proceedings of an international work-shop held in
Colombo, Sri Lanka, 5-10 September 1994. IDRC Publications,
Ottawa, Canada, pp.13-20. [4] Cromley, K.E., McLafferty, S., 2002. GIS and public health.
Guildford Publications Inc, New York, pp.5-10. [5] Kurland, K., Wilpen Corr, 2006-2007. GIS 1st Tutorial for Health.
Esri Press, California.
[6] Jones, E.C., 2011. GIS and Public Health. Lecture Notes for University of Portsmouth, Portsmouth, 2011.
[7] Maniou, M., Iakovidou, E., 2009. The current situation in the
public and private hospitals in Greece. To vima tou Asklipiou, Vol.8, issue 4.
[8] “THE NEWS” online, Cancer patients mitigating to Thessaloniki
for Chemo-therapies, Health division, published 23rd of December, Athens 2009, http://ygeia.tanea.gr/default.asp? pid=5
&faqID=8514&la=1, Accessed: 29th of October, 2011.
[9] Aristotle University of Thessaloniki, Laboratory of Geodesy, Publications Section, Thessaloniki, http://gserver.civil.auth.gr/
glab/indexgr-publ.htm#f61, Accessed: 3rd of November, 2011.
INTERNATIONAL JOURNAL OF EDUCATION AND INFORMATION TECHNOLOGIES Issue 4, Volume 6, 2012
378
[10] Trixopoulos, D., the North enigma of Cancer. Available: http://www.tanea.gr/ ellada/article /?aid=4516435. Last accessed
18th of November 2011.
[11] Gibin, M., Shiode, S., Lewis, D., 2010. Spatial Dimension of Health. Department of Geography, BBK University, London.
[12] Nikolaidis, P., Xanthidis, D., The distribution of medical facilities
available for chronic disease patients through GIS visualization Case Study: Central Macedonia, Northern Greece, Proceedings of
the 1st International Conference on Computing, Information
Systems and Communications (CISCO ’12), Singapore, May 11-13, 2012, pp.177-183.
[13] M. Kouli and F. Vallianatos, An attempt of GIS analysis of the
damages of the January 8, 2006 Kythira earthquake, Greece, Proceedings of the 5th WSEAS International Conference on
Environment, Ecosystems and Development, Venice, Italy,
November 20-22, 2006, p.316-319.. [14] A. Tikniouine, A. Elfazziki and T. Agouti, An hybrid model of the
MCDA for the GIS: Application to the localization of a site for the
implantation of a dam, Proceedings of the 5th WSEAS Int. Conf. on Artificial Intelligence, Knowledge Engineering and Data Bases,
Madrid, Spain, February 15-17, 2006, p.171-182.
[15] C. Chalkias and K. Lasaridi, Optimizing municipal solid waste collection using GI, Proceedings of the 2nd International
Conference on Landscape Architecture, Vouliagmeni, Athens,
Greece September 28-30, 2009, p.45-50. [16] Fotiou, A., Livieratos, E., 2000. Geometric Geodesy and
Networks. Greece: Ziti Publications, Thessaloniki, pp. 116–117.
[17] D. Klimesova and E. Ocelikova,, Knowledge Management Improvement Using GIS, Proceedings of the 12th WSEAS
international conference on Mathematics and computers in
biology, business and acoustics, Wisconsin, USA, 2011, p.21-22. [18] Public Open Data. Available: http: // www.geodata.gov.gr/
geodata/. Last accessed 12th of December 2011.
INTERNATIONAL JOURNAL OF EDUCATION AND INFORMATION TECHNOLOGIES Issue 4, Volume 6, 2012
379
Related Documents

![Improving student achievement in mathematics [Greek version]No 4, 2000 Improving student achievement in mathematics by Douglas A. Grouws and Kristin J. Cebulla Translated in Greek](https://static.cupdf.com/doc/110x72/5f4ffffe6fcb3e73ec424938/improving-student-achievement-in-mathematics-greek-version-no-4-2000-improving.jpg)


