Transactions of the ASABE Vol. 53(5): 1399-1411 2010 American Society of Agricultural and Biological Engineers ISSN 2151-0032 1399 IMPROVING FROST ‐SIMULATION SUBROUTINES OF THE W ATER EROSION PREDICTION PROJECT (WEPP) MODEL S. Dun, J. Q. Wu, D. K. McCool, J. R. Frankenberger, D. C. Flanagan ABSTRACT. Erosion models play an important role in assessing the influence of human activities on the environment. For cold areas, adequate frost simulation is crucial for predicting surface runoff and water erosion. The Water Erosion Prediction Project (WEPP) model is a physically based erosion prediction software program developed by the USDA. One of the major components of WEPP is the simulation of winter processes, which include snow accumulation and melt as well as soil freeze and thaw. WEPP is successfully used in the evaluation of important natural resource issues throughout the U.S. and in a number of other countries. However, previous studies revealed problems in the winter component of the WEPP model, especially the routine for frost simulation. The main purpose of this study was to improve the WEPP model (v2006.5) by changing the soil profile discretization and computation of key thermal and hydraulic parameters in the frost simulation routines so that the model can adequately simulate soil freeze‐thaw and winter runoff and erosion. WEPP v2006.5 and the modified version (v2010.1) were applied to experimental plots in Pullman, Washington, and Morris, Minnesota. The simulated snow and frost depths as well as runoff and sediment yield were contrasted and compared with field observations; the results from v2010.1 showed substantial improvement compared to those from v2006.5. Keywords. Frost, Hydrologic modeling, Runoff, Soil erosion, WEPP, Winter hydrology. n cold regions, frozen soil has a significant influence on runoff and soil erosion (Horner et al., 1944; Zuzel et al., 1982; Seyfried and Flerchinger, 1994; Stadler et al., 1997; Greer et al., 2006; McCool et al., 2006). A thaw‐ weakened soil is highly susceptible to water erosion (Kok and McCool, 1990). Severe runoff and soil erosion events are often observed due to the presence of frozen soil and subse‐ quent thawing (Øygarden, 2003; Singh et al., 2009). Long‐ term field studies in the Palouse region of the U.S. Pacific Northwest showed that more than 70% of water erosion re‐ sulted from rainfall or snowmelt events involving soil freez‐ ing and thawing, and the largest erosion events occurred on thawing soil (McCool et al., 2006; Singh et al., 2009). Wide‐ spread severe erosion due to rapid snowmelt on thawing soils on farmlands in Prince Edward Island, Canada (Edwards et al., 1998) and in the hilly lowlands of eastern Scotland (Wade and Kirkbride, 1998) was also reported. Submitted for review in July 2009 as manuscript number SW 8093; approved for publication by the Soil & Water Division of ASABE in September 2010. Presented at the 2009 ASABE Annual Meeting as Paper No. 096445. The authors are Shuhui Dun, ASABE Member Engineer, Post‐Doctoral Fellow, and Joan Q. Wu, ASABE Member Engineer, Professor, Department of Biological Systems Engineering, Washington State University, Pullman, Washington; Donald K. McCool, ASABE Fellow, Research Agricultural Engineer and Lead Research Scientist, USDA‐ARS Land Management and Water Conservation Research Unit, Pullman, Washington; James R. Frankenberger, Information Technology Specialist, and Dennis C. Flanagan, ASABE Member Engineer, Research Agricultural Engineer and Lead Research Scientist, USDA‐ARS National Soil Erosion Research Laboratory, West Lafayette, Indiana. Corresponding author: Shuhui Dun, Department of Biological Systems Engineering, Washington State University, Pullman, WA 99164; phone: 509‐335‐1100; fax: 509‐335‐2722; e‐mail: [email protected]. Freeze‐thaw degrades the soil cohesive strength (Forman‐ ek et al., 1984; Kok and McCool, 1990) and increases the soil erodibility (Van Klaveren and McCool, 1998). Frozen soil can reduce infiltration capacity by reducing the pore space (Boll, 1988; McCauley et al., 2002), thus increasing the sur‐ face runoff. In addition, in certain soils (silt or clay), substan‐ tial amounts of water may migrate to the freezing front (Miller, 1980; Gatto, 2000) and cause runoff to occur even without rain or snowmelt in areas such as the Palouse region (Kok and McCool, 1990). A frozen layer underneath a thawed surface can cause water to temporarily perch above the frozen layer and lead to extreme but transitory erosion vulnerability (Froese and Cruse, 1997). Knowledge of frost formation is important for developing sound management practices to reduce runoff and erosion in winter. Proper representation of freezing and thawing pro‐ cesses is also crucial to adequately modeling water erosion. The Water Erosion Prediction Project (WEPP) is a physically based erosion prediction model developed by the USDA (La‐ flen et al., 1991, 1997). The model has a winter simulation component, which includes the soil freeze and thaw pro‐ cesses (Flanagan et al., 2001). WEPP has been widely ap‐ plied both in and outside the U.S. (Laflen et al., 1997; Merrit et al., 2003; Flanagan et al., 2007). The model was used for evaluating the impacts of various management practices and natural disturbances in forest settings (Elliot et al., 1995; El‐ liot and Hall, 1997; Soto and Diaz‐Fierros, 1998; Forsyth et al., 2006; Robichaud et al., 2007; Dun et al., 2009). WEPP was also applied to assess water erosion from agricultural lands (Cochrane and Flanagan, 1999; Clark et al., 2006; Cruse et al., 2006; Pieri et al., 2007; Yüksel et al., 2008) and rangeland (Wilcox et al., 1990; Hunt and Wu, 2004; Moffet et al., 2007). However, studies (Kennedy and Sharratt, 1998; McCool et al., 1998; Pannkuk et al., 2000; Greer et al., 2006) have shown the winter routines of WEPP to be inadequate in I

Welcome message from author
This document is posted to help you gain knowledge. Please leave a comment to let me know what you think about it! Share it to your friends and learn new things together.
Transcript

Transactions of the ASABE
Vol. 53(5): 1399-1411 2010 American Society of Agricultural and Biological Engineers ISSN 2151-0032 1399
IMPROVING FROST‐SIMULATION SUBROUTINES OF THE WATER
EROSION PREDICTION PROJECT (WEPP) MODEL
S. Dun, J. Q. Wu, D. K. McCool, J. R. Frankenberger, D. C. Flanagan
ABSTRACT. Erosion models play an important role in assessing the influence of human activities on the environment. For coldareas, adequate frost simulation is crucial for predicting surface runoff and water erosion. The Water Erosion PredictionProject (WEPP) model is a physically based erosion prediction software program developed by the USDA. One of the majorcomponents of WEPP is the simulation of winter processes, which include snow accumulation and melt as well as soil freezeand thaw. WEPP is successfully used in the evaluation of important natural resource issues throughout the U.S. and in anumber of other countries. However, previous studies revealed problems in the winter component of the WEPP model,especially the routine for frost simulation. The main purpose of this study was to improve the WEPP model (v2006.5) bychanging the soil profile discretization and computation of key thermal and hydraulic parameters in the frost simulationroutines so that the model can adequately simulate soil freeze‐thaw and winter runoff and erosion. WEPP v2006.5 and themodified version (v2010.1) were applied to experimental plots in Pullman, Washington, and Morris, Minnesota. Thesimulated snow and frost depths as well as runoff and sediment yield were contrasted and compared with field observations;the results from v2010.1 showed substantial improvement compared to those from v2006.5.
Keywords. Frost, Hydrologic modeling, Runoff, Soil erosion, WEPP, Winter hydrology.
n cold regions, frozen soil has a significant influence onrunoff and soil erosion (Horner et al., 1944; Zuzel et al.,1982; Seyfried and Flerchinger, 1994; Stadler et al.,1997; Greer et al., 2006; McCool et al., 2006). A thaw‐
weakened soil is highly susceptible to water erosion (Kok andMcCool, 1990). Severe runoff and soil erosion events areoften observed due to the presence of frozen soil and subse‐quent thawing (Øygarden, 2003; Singh et al., 2009). Long‐term field studies in the Palouse region of the U.S. PacificNorthwest showed that more than 70% of water erosion re‐sulted from rainfall or snowmelt events involving soil freez‐ing and thawing, and the largest erosion events occurred onthawing soil (McCool et al., 2006; Singh et al., 2009). Wide‐spread severe erosion due to rapid snowmelt on thawing soilson farmlands in Prince Edward Island, Canada (Edwards etal., 1998) and in the hilly lowlands of eastern Scotland (Wadeand Kirkbride, 1998) was also reported.
Submitted for review in July 2009 as manuscript number SW 8093;approved for publication by the Soil & Water Division of ASABE inSeptember 2010. Presented at the 2009 ASABE Annual Meeting as PaperNo. 096445.
The authors are Shuhui Dun, ASABE Member Engineer,Post‐Doctoral Fellow, and Joan Q. Wu, ASABE Member Engineer,Professor, Department of Biological Systems Engineering, WashingtonState University, Pullman, Washington; Donald K. McCool, ASABEFellow, Research Agricultural Engineer and Lead Research Scientist,USDA‐ARS Land Management and Water Conservation Research Unit,Pullman, Washington; James R. Frankenberger, Information TechnologySpecialist, and Dennis C. Flanagan, ASABE Member Engineer, ResearchAgricultural Engineer and Lead Research Scientist, USDA‐ARS NationalSoil Erosion Research Laboratory, West Lafayette, Indiana.Corresponding author: Shuhui Dun, Department of Biological SystemsEngineering, Washington State University, Pullman, WA 99164; phone:509‐335‐1100; fax: 509‐335‐2722; e‐mail: [email protected].
Freeze‐thaw degrades the soil cohesive strength (Forman‐ek et al., 1984; Kok and McCool, 1990) and increases the soilerodibility (Van Klaveren and McCool, 1998). Frozen soilcan reduce infiltration capacity by reducing the pore space(Boll, 1988; McCauley et al., 2002), thus increasing the sur‐face runoff. In addition, in certain soils (silt or clay), substan‐tial amounts of water may migrate to the freezing front(Miller, 1980; Gatto, 2000) and cause runoff to occur evenwithout rain or snowmelt in areas such as the Palouse region(Kok and McCool, 1990). A frozen layer underneath athawed surface can cause water to temporarily perch abovethe frozen layer and lead to extreme but transitory erosionvulnerability (Froese and Cruse, 1997).
Knowledge of frost formation is important for developingsound management practices to reduce runoff and erosion inwinter. Proper representation of freezing and thawing pro‐cesses is also crucial to adequately modeling water erosion.The Water Erosion Prediction Project (WEPP) is a physicallybased erosion prediction model developed by the USDA (La‐flen et al., 1991, 1997). The model has a winter simulationcomponent, which includes the soil freeze and thaw pro‐cesses (Flanagan et al., 2001). WEPP has been widely ap‐plied both in and outside the U.S. (Laflen et al., 1997; Merritet al., 2003; Flanagan et al., 2007). The model was used forevaluating the impacts of various management practices andnatural disturbances in forest settings (Elliot et al., 1995; El‐liot and Hall, 1997; Soto and Diaz‐Fierros, 1998; Forsyth etal., 2006; Robichaud et al., 2007; Dun et al., 2009). WEPPwas also applied to assess water erosion from agriculturallands (Cochrane and Flanagan, 1999; Clark et al., 2006;Cruse et al., 2006; Pieri et al., 2007; Yüksel et al., 2008) andrangeland (Wilcox et al., 1990; Hunt and Wu, 2004; Moffetet al., 2007). However, studies (Kennedy and Sharratt, 1998;McCool et al., 1998; Pannkuk et al., 2000; Greer et al., 2006)have shown the winter routines of WEPP to be inadequate in
I

1400 TRANSACTIONS OF THE ASABE
simulating (1) frost depth and duration and (2) the impact offrozen soil on soil infiltration capacity, which in turn lead toinadequate simulation of winter runoff and erosion.
The main purpose of this study was to improve the WEPPmodel (v2006.5) so that it more accurately simulates soilfreezing and thawing processes as well as winter runoff gen‐eration in cold regions where winter hydrology is important.The specific objectives were:
� To modify the algorithms and subroutines of WEPP(v2006.5) that improperly describe soil freezing andthawing processes.
� To assess the performance of the modified model(WEPP v2010.1) at two experimental research sites un‐der different climatic conditions.
MATERIAL AND METHODSMODEL DESCRIPTION: WEPP V2006.5
The WEPP model is a distributed‐parameter, continuous‐simulation, erosion prediction model for hillslope and wa‐tershed applications (Flanagan et al., 1995). WEPP includesthe following components: climate generation, hydrologyand hydraulics, soil dynamics, plant growth and residue de‐composition, and erosion (Flanagan and Livingston, 1995).With these components integrated, WEPP has the potentialto quantify hydrological and erosion processes under differ‐ent climatic, vegetation and residue management, soil, andtopographic conditions.
In WEPP, a soil profile is discretized into finer, 10 cm lay‐ers for the top 20 cm (in consideration of the dynamic changesin soil properties due to tillage) and 20 cm layers for the re‐mainder of the soil profile (for computing the daily water bal‐ance). The winter routines of the WEPP model simulate snowaccumulation and melt along with soil freeze and thaw on anhourly basis. The winter processes are simulated when asnowpack or a soil frost layer exists or when the daily mini‐mum temperature is below 0°C. Since the focus of this studyis on the simulation of soil frost, we include below a summaryof the approaches to quantifying soil freeze and thaw, togeth‐er with detailed description of the methods for determiningsystem surface temperature and frost thickness in the originalWEPP v2006.5 after Savabi et al. (1995).
Simulation of frost in WEPP is driven by surface tempera‐ture, which is estimated from an energy balance at the surfaceof a snow‐residue‐soil system (fig. 1). The estimated surfacetemperature is used to determine heat flow to, or from, afreezing front (0°C isothermal) due to a temperature gradi‐ent. WEPP accounts for thermal resistance of snow, residue,frozen soil, and unfrozen soil in heat transfer. At a freezingfront, heat conducted to the surface of the system is balancedby the heat flow from the underlying unfrozen soil and the la‐tent heat released by freezing water. At a thawing front, heatconducted from the surface to the frozen soil is balanced bythe latent heat absorbed by thawing ice in the soil. The thick‐ness of soil frozen or thawed is then determined based on thelatent heat required and the soil water content at the freezingor thawing front.
There are several assumptions in frost simulation byWEPP. Snow and soil thermal conductivities and water fluxare assumed constant during a simulation step, i.e., one hour.Within a simulation step, soil freezing would cause all thewater currently in the freezing zone, excluding the residual
Figure 1. Snow‐residue‐soil system (a) without and (b) with frost“sandwich” layers.
water, to be converted to ice. In WEPP, the residual water isdefined as the amount of soil water corresponding to plantwilting point. Soil temperature one meter below the freezingfront is assumed to be 7°C, taken as the mean annual air tem‐perature for the Midwest (NOAA, 2010).
Estimation of Surface TemperatureHourly temperature at the surface of the residue‐snow‐soil
system, Thrs (°C), was estimated based on an energy balancefollowing equation 1 (Flerchinger, 1987), with the individualterms expanded as equations 2 through 7 and the resultantThrs given by equation 8 (Flerchinger, 1987):
0)0()(
)1( 44
=−−−ρ+
σε−σε+α−
srf
hrssrf
H
hrshraaa
hrsKshraKas
d
TK
r
TTc
TTt
R
(1)
)(4
)(4
34
3
44
hrshrahraKshraKs
hraKhrsKhraKs
hraKshrsKs
TTTT
TTT
TT
−σε−σε=
−σε+
σε≈σε
(2)
4)()1(
hraKsas
net Tt
RR σε−ε+α−= (3)
3hraKscof TR σε= (4)
⎥⎦
⎤⎪⎣
⎡ +−⎥⎦
⎤⎪⎣
⎡ +−
κ=
H
Hdv
m
mdvH
z
zzz
z
zzz
zv
rlnln
)(1 2
(5)
⎥⎦
⎤⎪⎣
⎡ +−⎥⎦
⎤⎪⎣
⎡ +−
ρκ=
H
Hdv
m
mdv
aaconH
z
zzz
z
zzz
cK
lnln
2
(6)
0))((
)(
=−−+
−+
hrssrf
srfhrshraconH
hrshracofnet
Td
KTTzvK
TTRR
(7)

1401Vol. 53(5): 1399-1411
srf
srfconHcof
hraconHcofnethrs
d
KzvKR
TzvKRRT
++
++=
)(
)]([ (8)
where the energy flux terms (W m‐2) in equation 1 from leftto right are incoming solar radiation, longwave radiationfrom air, longwave radiation from the surface of the residue‐snow‐soil system, convective heat from air, and conductiveheat from the residue‐snow‐soil system, respectively, and:
Rs = solar radiation on a sloping surface(J m‐2)
� = albedo of the surface (‐)t = duration for receiving the solar
radiation (s)� = Stefan‐Boltzmann constant (5.67 ×
10‐8 W m‐2 K‐4)�s and �a = emissivities of the surface and air,
respectively (‐)ThrsK and ThraK = hourly temperatures of the surface and
air, respectively (K)Thrs and Thra = hourly temperatures of the surface and
air, respectively (°C)ρa = air density (kg m‐3)ca = specific heat (J kg‐1 °C‐1)rH = resistance to heat transfer (s m‐1)Ksrf = effective thermal conductivity
(W m‐1 °C‐1)dsrf = depth of residue‐snow‐frozen‐soil
system (m)Rnet = net radiation flux (W m‐2)Rcof = radiation coefficient (W m‐2 °C‐1)� = von Karman constant (‐)v(z) = wind velocity (m s‐1)zv, zd, zm, zH = height of wind measured, height of
zero‐plane displacement of the windprofile, momentum roughness of thesurface, and surface roughness of thetemperature profile, respectively (m)
KconH = convective heat transfer coefficient(J m‐3 °C‐1).
Hourly air temperature in the WEPP model is estimatedfollowing DeWit et al. (1978) from the model input of dailymaximum and minimum temperatures. The lowest andhighest temperatures of the day are assumed to occur atsunrise and 2:00 p.m., respectively. The temperature betweenthe maximum and minimum values follows two cosinecurves.
Daily solar radiation reaching a sloped surface iscalculated from measured solar radiation with an adjustmentfactor for aspect and slope following Swift (1976). Hourlyextraterrestrial solar radiation is described by trigonometricfunctions of station latitude, solar declination, and solar timeangle (Jensen et al., 1990). Hourly solar radiation on a slopedsurface is then estimated by multiplying the daily solarradiation on a sloped surface by the ratio of hourly to dailyextraterrestrial solar radiation with the assumption of aconstant atmospheric transmissivity throughout the day.
Simulation of Frost ThicknessFrost simulation in WEPP is a combination of mass and
energy balance at the freezing or thawing front. Waterbalance is simulated by tracking the changes in liquid soilwater, ice, and the thickness of the frozen soil. Energy
balance at the freezing front is described using equations 9through 11:
ufsrffz QQ
t
dL−=
ΔθΔ
(9)
srf
srfsrfsrf Z
TKQ
Δ= (10)
t
ZdTC
Z
PLK
Z
TKQ ufufuf
wuf
ufufuf Δ
+Δ+Δ
= (11)
whereL = latent heat of fusion (J m‐3)� t = time interval (s)� dfz = thickness of soil frozen or thawed within
� t (m)� = volumetric soil water content (m m‐3)Qsrf and Quf = heat fluxes through the snow‐residue‐
frozen soil zone and from the unfrozen soilbeneath the frozen zone, respectively(W m‐2)
Zsrf = thickness of the snow‐residue‐frozen‐soilzone (m)
� Tsrf = temperature difference between the top ofthe snow‐residue‐frozen‐soil zone andthe freezing front (0°C isotherm) (°C)
Zuf = distance between the top of the unfrozensoil and the depth of “constanttemperature” assumed to be 1 m below thetop of the unfrozen soil (m).
� Tuf = temperature difference between the top ofthe unfrozen soil and the depth of “constanttemperature” assumed to be one m belowthe top of the unfrozen soil (°C)
Ksrf and Kuf = average thermal conductivities for thesnow‐residue‐frozen‐soil zone and theunfrozen soil, respectively (W m‐1 °C‐1)
Kw = unsaturated hydraulic conductivity ofunfrozen soil (m s‐1)
Z = soil thickness between the freezing frontand the center of the underlying unfrozensoil layer (m)
� Puf = difference of water potential between thefreezing front and the center of theunderlying unfrozen soil layer (m)
Cuf = heat capacity of the unfrozen soil(J m‐3 °C‐1)
dTuf = change in temperature of a unit volume ofunfrozen soil within � t (°C).
When surface temperature is below 0°C, cold from thesurface of the snow‐residue‐soil system is balanced with theenergy sources at the freezing front in the sequence of (1) heatconducted from the underlying unfrozen soil, (2) latent heatreleased from freezing the water migrated to the freezingfront, and (3) heat released from freezing the water held inplace at the freezing front, which results in an increase in thethickness of frozen soil.
When surface temperature is above 0°C, heat from thesurface of the snow‐residue‐soil system and from theunfrozen soil is consumed by thawing the top‐most andbottom‐most frozen soil, respectively. If a frost “sandwich”

1402 TRANSACTIONS OF THE ASABE
occurs, cold from the surface is balanced by freezing the top‐most unfrozen soil (fig. 1).
LIMITATIONS OF THE FROST SIMULATION ROUTINES INWEPP v2006.5
Major limitations in the frost simulation routines of WEPPv2006.5 included: (1) coarse discretization of the entire soilprofile into two layers (tillage and non‐tillage) without usingthe finer soil profile discretization for daily water balance,and accounting for only one frost “sandwich” layer;(2)�assumption of a constant temperature of 7°C for theunfrozen soil 1 m below the freezing front; (3) inadequateadjustment of saturated hydraulic conductivity of frozen soil(Greer et al., 2006); and (4) programming errors incomputing unsaturated hydraulic conductivity, soil waterpotential, and upward water movement to a freezing front,and in incorrect use of energy flux for the amount of energy.
IMPROVEMENTS OF THE FROST SIMULATION ROUTINES IN
WEPP v2010.1The framework of the frost simulation in WEPP v2006.5
was retained, and the major limitations were rectified.Specific improvements were made to (1) adequatelydiscretize the snow‐residue‐soil system; (2) better representsoil temperature below the bottom‐most frozen zone,unsaturated hydraulic conductivity and water characteristic,saturated hydraulic conductivity of frozen soil, and thermalconductivity of snow and soil; and (3) properly integrate thefrost simulation routines and other water balance routines ofWEPP. The equations and associated assumptions presentedin the following sections pertain to WEPP v2010.1 unlessspecified otherwise.
DiscretizationSnow and surface residue were each treated as a single
layer. A soil profile was divided into 1 cm computationallayers in the top 20 cm tillage zone and 2 cm layers in theremainder, at one‐tenth of the original resolution. Theamount of ice, the thickness of frozen soil, and the soil watercontent of unfrozen soil in each layer were explicitly tracked.The fine discretization helps to simulate the liquid soil waterand ice as well as the occurrence and location of a frost“sandwich” more accurately.
Temperature of Soil Below the Bottom‐Most Frozen Zone
The temperature of the unfrozen soil was estimatedfollowing Campbell and Norman (1998), an analyticalsolution of 1‐d heat transfer for uniform soil (eq. 12), and thesoil temperature gradient at a given time of a year wasestimated as the partial derivative of soil temperature withrespect to soil depth (eq. 13):
]/)(sin[)/exp(),( 00 DzttDzATtzT avg −−ω−+= (12)
]}/)(cos[]/
)(){sin[/exp()/0.1(),(
0
00
DzttDz
ttDzDAz
tzT
−−ω+−
−ω−−=∂
∂
(13)
whereTavg = annual mean temperature at the soil surface (°C)A0 = amplitude of fluctuation of the temperature at the
soil surface (°C)
� = 2/365 (rad d‐1)D = damping depth (m)z = soil depth (m)t = time in Julian day (d)t0 = temporal phase shift (d).Equations 12 and 13 suggest that, for a given time, the
temperature of the soil beneath the bottom‐most frozen zoneincreases with increasing depth, whereas the temperaturegradient decreases with depth. Soil temperature at 1 m belowthe bottom‐most frozen zone was thus used to estimate heatconducted from unfrozen soil to a freezing or thawing front.
A typical damping depth of 2 m for temperature changeson a yearly time scale (Campbell and Norman, 1998) wasused in the modified frost routines. Other parameters inequation 12, i.e., Tavg, A0, and t0, were estimated frommonthly mean temperature approximated by a sine curve. Noheat transfer from the unfrozen soil occurs if the estimatedtemperature for the soil 1 m below the bottom‐most frozenzone is below 0°C.
Unsaturated Hydraulic Conductivity and WaterCharacteristic
The unsaturated hydraulic conductivity and the matricpotential of unfrozen soil were determined from thevolumetric soil water content and soil texture of individualcomputational layers following Saxton and Rawls (2006).The WEPP model simulates water migration to the freezingfront if the soil water potential at the freezing front is lowerthan that of the unfrozen soil in the layer beneath. Soil waterpotential of a frozen soil was estimated from soil temperatureusing the generalized form of the Clausius‐Clapeyronequation following Watanabe and Wake (2008). We assumedthat the soil temperature at the freezing front is the same asthe freezing depression temperature, typically ranging from0.01°C to 2.5°C as a function of volumetric soil watercontent and soil texture (Kozlowski, 2004). Such atemperature range of a freezing front would correspond to awater potential range of ‐1.2 m to ‐310 m based on Watanabeand Flury (2008).
Saturated Hydraulic Conductivity of Frozen SoilIt was assumed that the ice in the soil occupies pore spaces
in the same manner as air in the unsaturated soil. Hence, themethod of estimating unsaturated hydraulic conductivity ofan unfrozen soil by Saxton and Rawls (2006) was adapted toestimate the saturated hydraulic conductivity of a frozen soil.Specifically, the saturated hydraulic conductivity of a frozensoil is taken as the unsaturated hydraulic conductivity at thesoil water content that is equal to the soil's porosity minus theice content.
Ice content of a computational layer in frost simulationwas calculated by dividing the depth of water in solid formby the thickness of the computational layer. Hence, thecalculated ice content was dependent on the initial soil watercontent before soil was frozen and the thickness of frozen soilin the layer: the smaller the initial soil water content or thethinner the frozen soil, the smaller the ice content andtherefore the larger the saturated hydraulic conductivity ofthe frozen soil. The vertical and horizontal hydraulicconductivities of a larger soil layer for water balancecomputation were respectively the harmonic mean andarithmetic mean of the saturated hydraulic conductivities ofthe frost computational layers enclosed in the larger layer.The saturated hydraulic conductivity of the larger soil layer

1403Vol. 53(5): 1399-1411
was adjusted for crusting, tillage, crop, and rainfall ininfiltration simulation and was adjusted based on soil textureand saturation level in percolation and subsurface lateral flowcalculation (Flanagan and Nearing, 1995).
Thermal Conductivity of Snow and SoilSnow thermal conductivity was estimated following
Sturm et al. (1997) based on snow density as follows:
156
)1000/(234.0023.0
≤ρρ+=
snow
snowsnowK (14)
156
)1000/(233.3
)1000/(01.1138.0
2
>ρρ+
ρ−=
snow
snow
snowsnowK
(15)
where Ksnow is the snow thermal conductivity (W m‐1 °C‐1),and ρsnow is the snow density (kg m‐3).
Snow density is the major factor that impacts thermalconductivity of a snow cover. Other factors, e.g., snowmicrostructure (Satyawali and Singh, 2008), may also play arole. A proportionality coefficient, Kfsnow, was included inthe modified WEPP for users to adjust the snow thermalconductivity estimated from equations 14 and 15. The defaultvalue of Kfsnow was set to 1.0.
The thermal conductivity values for frozen soils (1.75 and2.10 W m‐1 °C‐1 for tilled and untilled soil, respectively;Savabi et al., 1995) in WEPP v2006.5 were used in v2010.1.The equation for estimating thermal conductivity of anunfrozen soil (eq. 16; Savabi et al., 1995) was also adoptedfrom WEPP v2006.5:
)0588.10014139.0(
)7484.84493.75096.0( 2
−ρ×
θ−θ+=
b
soilK
(16)
where Ksoil is thermal conductivity of unfrozen soil (W m‐1
°C‐1), � is soil water content (m3 m‐3), and ρb is soil bulkdensity (kg m‐3).
The functions between thermal conductivity versus soilwater content vary among different soil types (Campbell andNorman, 1998). Equation 16 yielded a curve most agreeableto that of a sandy soil reported by Campbell and Norman(1998). A proportionality coefficient, Kfsoil (default 1.0 forsandy soil), was therefore added as an input in WEPP v2010.1for users to adjust the estimated unfrozen soil thermalconductivity for site‐specific soils. A Kfsoil value less than 1should be used for other soil types following Campbell andNorman (1998).
Integrating Frost Simulation Routines with Other WaterBalance Components of WEPP
Soil freeze and thaw affect soil hydraulic and erodibilityparameters. In WEPP, these parameters include hydraulicconductivity, interrill and rill erodibility, as well as criticalshear stress. The results of frost simulation were used by theWEPP water balance and erosion routines to update soilwater content and to adjust hydraulic properties (Saxton andRawls, 2006) and erosion parameters based on ice content(Savabi et al., 1995).
Updating of soil water content of an individual frostcomputational layer was carried out at the beginning of adaily frost simulation, and updating of both soil water and icecontent and interactions with other water balance
components was carried out at the end of a daily frostsimulation. In the absence of frost, initial soil water contentof a computational layer in the frost simulation was presumedthe same as the soil water content in the larger, enclosinglayer used in other water balance calculations. When frost ispresent, the increased (due to infiltration) or decreased (dueto percolation) water in an enclosing layer is evenlydistributed to each frost computational layer. Soil water andice content of the larger layer are updated from thecumulative water and ice amount of all the enclosed frostcomputational layers at the end of a daily frost simulation.
SITE DESCRIPTIONTwo study sites under different climatic conditions were
chosen to assess the performance of the winter routines inWEPP v2010.1. One site was the Palouse Conservation FieldStation (PCFS; 46° 45′ N, 117° 12′ W), located 3 kmnorthwest of Pullman, Washington. Long‐term experimentalrunoff plots have been installed at the PCFS since the 1970s(McCool et al., 2002). Data from these experimental plotsincluded weather, snow and frost depths, and runoff andsediment yield from fall 1983 to spring 1990. A 24 h chart‐type recording rain gauge near the runoff plots provided thebreak‐point rainfall data for this study (Lin and McCool,2006). Other weather data, including temperature, wind,humidity, and solar radiation, were from the NOAA Pullman2 NW, 0.6 km to the east of the runoff plots and the closestweather station with the majority of the required WEPPclimate inputs. The NOAA Pullman 2 NW station and therunoff plots are at the same elevation of 762 m a.s.l. and areseparated by a ridge at 797 m a.s.l. in an area of extendedrolling hills. Snow depth was measured with snow stakes, andfrost depth was measured with frost tubes (McCool andMolnau, 1984) installed at three locations (top, middle, andbottom) along the edge of each plot. Runoff and sedimentyield were measured using sediment delivery tank (McCoolet al., 2006). In this study, one plot at the PCFS site waschosen for WEPP simulations.
The other study site (45° 41′ N, 95° 48′ W) was locatednear Morris, Minnesota. Weather data, snow and frost depths,as well as soil temperature and soil water content werecollected from no‐till corn plots with different residuemanagements during the winter (November to March) of1993‐1996 (Kennedy and Sharratt, 1998; Sharratt, 2002).Precipitation data were from a tipping‐bucket rain gauge(0.254 mm per tip) in an automatic weather station. Snowdepth was measured using snow stakes, and frost depth wasdetermined with frost tubes (Sharratt, 2002). Runoff andsediment yield were not monitored at these plots. For thisstudy, one plot was selected for WEPP modeling.
The PCFS is in a Mediterranean climate zone with a wetwinter and dry summer. The long‐term mean annualtemperature is 8.3°C, and the long‐term mean annualprecipitation is 533 mm (NRCS, 2010a, 2010b). Rapid falland rise in temperature can occur multiple times during thewinter. Snow cover is transient, with accumulated snowsubject to rapid melting by the warm fronts. On average, frostdepth in the soil can reach 0.2 to 0.5 m (WRCC, 2008), andit can reach 0.9 m under severe conditions. Numerous freeze‐thaw cycles may occur (McCool, 1990). In contrast, theMorris research site is typified by a continental climate witha long‐term mean annual temperature of 6.1°C and a long‐term mean annual precipitation of 635 mm (NRCS, 2010a,

1404 TRANSACTIONS OF THE ASABE
Table 1. Monthly means of observed climate data during 1983‐1990 at Pullman, Washington.
MonthPrecipitation
(mm)
MaximumTemperature
(°C)
MinimumTemperature
(°C)
SolarRadiation
Langley (d‐1)
WindVelocity(m s‐1)
DewpointTemperature
(°C)
10 27 17.1 2.6 234 2.7 2.811 75 5.6 ‐1.1 142 3.6 ‐1.112 53 ‐0.1 ‐6.5 87 3.3 ‐6.51 56 1.7 ‐4.7 120 3.7 ‐4.72 42 4.4 ‐3.5 206 4.0 ‐3.53 57 9.5 0.2 308 4.2 0.24 40 15.0 2.8 438 3.9 ‐0.45 50 18.8 5.3 539 3.4 3.66 34 23.6 8.4 603 3.3 6.57 21 27.9 9.6 636 3.1 6.28 25 28.0 9.8 526 3.1 6.29 25 22.2 6.0 388 2.8 4.1
Yearly[a] 505 14.5 2.4 352 3.4 1.1[a] Yearly precipitation refers to the total, and the rest of the yearly values are means of monthly values.
Table 2. Monthly means of observed climate data during 1993‐1996 at Morris, Minnesota.
MonthPrecipitation
(mm)
MaximumTemperature
(°C)
MinimumTemperature
(°C)
SolarRadiation
Langley (d‐1)
WindVelocity(m s‐1)
DewpointTemperature
(°C)
10 64 13.0 2.5 191 4.1 2.511 24 2.3 ‐6.6 123 4.6 ‐6.612 19 ‐4.2 ‐13.1 108 4.3 ‐13.11 26 ‐10.9 ‐21.1 147 4.7 ‐21.12 14 6.2 ‐17.7 231 5.0 ‐17.73 41 1.5 ‐7.5 306 4.6 ‐7.54 75 9.6 ‐0.8 378 4.6 ‐0.85 64 19.4 7.4 364 4.4 7.46 23 24.7 8.9 575 3.2 8.97 28 26.3 9.4 630 3.2 9.48 9 29.5 9.9 537 3.1 9.99 26 23.4 6.4 387 2.7 6.4
Yearly[a] 413 10.7 ‐1.9 340 4.0 ‐1.9[a] Yearly precipitation refers to the total, and the rest of the yearly values are means of monthly values.
2010b). Snow cover persists from early December to lateMarch, and soil frost may start to form from mid‐November andlast to mid‐May in the following spring. Soil frost penetrated upto 1.2 m as observed in a field study during 1993‐1996 (Sharratt,2002). Note that annual mean temperature of the two study sitesdiffered by only 2.2°C; however, Morris had much greatertemperature change within a year and much colder winters thanPullman (tables�1 and 2).
The soil at the PCFS was Palouse silt loam (fine‐silty,mixed, superactive, mesic Pachic Ultic Haploxerolls) undercontinuous bare fallow condition. The chosen plot for WEPPsimulation (hereafter referred to as the PCFS plot) was 22.3m long and 3.7 m wide on a 21% south‐facing slope (McCoolet al., 1995). The soil at the Morris research site was Barnesloam (fine‐loamy, mixed, superactive, frigid CalcicHapludolls). The study plot (hereafter referred to as theMorris plot) was 12 m long and 18 m wide on a 2% east‐facing slope in a no‐tillage corn field. Standing stubble andflat residue were removed from the plot after each harvest(Sharratt, 2002).
WEPP SIMULATIONS AND MODEL PERFORMANCEASSESSMENT
WEPP hillslope simulation requires four input files:climate, topography, soil, and management. The climate
inputs included observed daily precipitation, maximum andminimum air temperature, solar radiation, wind speed anddirection, and dewpoint temperature. Topographic inputs forboth study plots included a uniform slope configuration withrespective slope gradients, slope aspects, and plotdimensions. Management was continuous‐tilled fallow forthe PCFS plot (Lin and McCool, 2006) and no‐tillage cornwith 100% residue removal for the Morris plot (Kennedy andSharratt, 1998).
The particle size distribution data in the soil inputs(tables�3 and 4) were from field and lab measurements asreported by Lin and McCool (2006) and Kennedy andSharratt (1998). Other soil input parameters were from theWEPP database for Palouse silt loam and Barnes loam. Theerosion parameters (rill and interrill erodibilities and criticalshear stress) are crucial WEPP inputs affecting erosionprediction. Previous studies showed that these parameters arestrongly impacted by crop and tillage management andshould be calibrated to site‐specific surface conditions(McCool et al., 1998; Pannkuk et al., 2000; Greer et al., 2006;Singh et al., 2009). In this study, rill erodibility and criticalshear stress for the top soil layer for the Palouse silt loam wereadjusted to best reproduce field‐observed average annualrunoff and erosion at the PCFS plot where field‐observedrunoff and erosion data were available.

1405Vol. 53(5): 1399-1411
Table 3. Soil properties of Palouse silt loam.Property Value
Albedo 0.23Initial soil saturation (%) 75Interrill erodibility (kg s m‐4) 4.9 × 10⁶
Rill erodibility (s m‐1) 9.0 × 10‐3
Rill erodibility (s m‐1) (adjusted value) 1.2 × 10‐2
Critical shear (N m‐2) 3.5Critical shear (N m‐2) (adjusted value) 0.08Effective hydraulic conductivity (mm h‐1) 1.5
Soil Depth (m)
0 to0.2
0.2 to0.4
0.4 to0.6
0.6 to0.9
0.9 to1.2
1.2 to1.6
Sand (% wt) 9.8 8.3 8.3 8.5 9.5 8.9Clay (% wt) 20.1 22.3 21.5 18.8 17.8 15.0Organic matter (% wt) 2.6 1.1 0.8 0.6 0.4 0.2CEC (cmol kg‐1) 19.6 20.5 21.2 21.0 21.0 21.1
Table 4. Soil properties of Barnes loam.
Property Value
Albedo 0.23Initial soil saturation (%) 50Interrill erodibility (kg s m‐4) 5.3 × 10⁶
Rill erodibility (s m‐1) 6.0 × 10‐3
Critical shear (N m‐2) 3.1Effective hydraulic conductivity (mm h‐1) 5.9
Soil Depth (m)
0 to0.05
0.05 to0.15
0.15 to0.45
0.45 to0.75
0.75 to1.05
Sand (% wt) 39.8 39.3 36.8 44.6 55.5Clay (% wt) 25.4 23.8 23.8 22.5 17.5Organic matter (% wt) 5.8 4.0 3.5 2.0 1.0CEC (cmol kg‐1) 19.5 10.5 8.7 9.8 9.4
Cannell and Gardner (1959) reported that lab‐measuredfreezing point depression for the Palouse silt loam variedfrom 0.02°C to 0.06°C, corresponding to a water potential atthe freezing front of ‐2.5 to ‐7.5 m by the Clausius‐Clapeyronequation. In this study, water potential at the freezing frontwas set to ‐5 m (the average of ‐2.5 and ‐7.5 m) for both thePCFS and Morris plots.
Soils at the two study plots were silt loam and loam,respectively. Thermal conductivities for loam soils rangefrom 0.15 to 0.79 W m‐1 °C‐1 (Ghuman and Lal, 1985), whichare lower than those estimated in the WEPP model for sandysoils. The adjustment factor for thermal conductivity ofunfrozen soil (Kfsoil) was therefore set to 0.5 for both studysites.
A calibrated Kfsnow value of 1.5 (default value of 1.0) wasfound to better reproduce the field‐observed frost depth at thePCFS plot. The increase in thermal conductivity was likelyattributed to two reasons. First, snow depths at the PCFS plotwere shallow, rarely exceeding 200 mm, during the studyperiod. Second, the shallow snow cover in combination withrapid and frequent freeze and thaw created non‐uniformity ofsnow cover (depth and density), which in turn led to largespatial variation in snow thermal conductivity.
WEPP simulations for the PCFS plot and Morris plot wereconducted using WEPP v2010.1 and v2006.5 with the sameinputs to assess the performance of the new frost routines.The simulated snow and frost depths were compared withfield observations using graphical plots and statistical
indices. Additionally, field‐observed runoff and sedimentyield from the PCFS plot were also used to assess the abilityof the WEPP model to represent winter hydrologic anderosion processes.
Statistical indices of standard error of estimate (SEE),relative bias (PBIAS), and standard deviation of observations(SD) (eqs. 17, 18, and 19; ASCE, 1996) were used to assessthe performance of WEPP:
2
)(
SEE 1
2,,
−
−=
∑=
n
xxn
iiois
(17)
∑
∑
=
=
−=
n
iio
n
iiois
x
xx
1,
1,, )(
PBIAS (18)
1
/
SD 1
2
1,,
−
⎟⎟⎠
⎞⎢⎢⎝
⎛−
=∑ ∑
= =
n
nxxn
i
n
iioio
(19)
where xs,i and xo,i are simulated and observed values forobservation dates where snow cover, frost depth, or runoffand erosion events were measured, and n is the sample size.
In addition, non‐parametric paired t‐tests (Wilcoxonsigned‐rank) were conducted using SAS (2004) to compareWEPP‐simulated and field‐observed snow and frost depthsas well as runoff and erosion events. The non‐parametric two‐sample test instead of paired t‐test was chosen due to the non‐normality and lack of independence associated with our snowand frost depth and runoff and sediment yield data.
RESULTS AND DISCUSSIONWEPP V2010.1 AND V2006.5 RESULTS FOR THE PCFSPLOT
There was a good agreement between WEPP v2010.1simulated and field‐observed snow and frost depths at the PCFSplot (figs. 2a and 2b). WEPP v2010.1 properly reproduced thesnow depth as well as the occurrence and duration of the majorsnow cover and frost presence for the winter seasons of1985‐1988 for the study plot. The model rendered anoverestimate of snow depth for 1984, and an underestimate forfrost depth. An over‐ or under prediction of snow will directlyimpact the predicted frost depth. In addition, the modelunderestimated snow depth for 1989. Wilcoxon signed‐ranktests showed that WEPP‐simulated snow and frost depths bothdiffered from field observations. The PBIAS of ‐8% for snowdepth and ‐14% for frost depth (table 5) suggest underestimatesof both quantities by WEPP v2010.1. Adequate prediction offrost penetration depends on many factors, including properprediction of soil surface temperature, soil water content, andthermal properties of residue and snow on the ground. Themonthly mean of daily maximum temperatures at the PCFSfluctuated around 0°C in December during the study period(table 1), posing a challenge for simulating the dynamics of bothsnow cover and soil freeze‐thaw.

1406 TRANSACTIONS OF THE ASABE
Figure 2. Comparison of WEPP‐simulated and field‐observed snow (upper panels) and frost (lower panels) depths for the Palouse Conservation FieldStation (PCFS) plot near Pullman, Washington.
Table 5. Statistical tests comparing WEPP simulation results and field observationsfor the Palouse Conservation Field Station (PCFS) plot near Pullman, Washington.[a]
WEPPVersion Parameters[b]
Simulated[c]
SEEPBIAS
(%)
Wilcoxon Test[d]
Mean SD S‐Statistic P > |S|
v2010.1
Snow depth, mm (145) 109 (118) 84 (73) 76 ‐8 1337 0.0079Frost depth, mm (254) 102 (118) 69 (77) 71 ‐14 3390 0.0036
Event runoff, mm (253) 5.3 (6.3) 5.9(7.5) 8.0 ‐7 484 0.68Event sediment yield, t ha‐1 (253) 2.7 (4.9) 14.8 (9.9) 10.5 ‐25 3149 <0.0001
Annual runoff, mm (7) 118 (133) 42 (48) 59 ‐11 ‐1 0.94Annual sediment yield, t ha‐1 (7) 60 (104) 22 (59) 99 ‐42 ‐6 0.38
V2006.5
Snow depth, mm (145) 39 (118) 14 (73) 120 ‐67 4392 <0.0001Frost depth, mm (254) 175 (118) 18 (77) 87 49 ‐11486 <0.0001
Event runoff, mm (180) 2.4 (6.3) 3.5 (7.5) 9.0 ‐71 5714 <0.0001Event sediment yield, t ha‐1 (180) 5.0 (4.9) 13.2 (9.9) 11.8 ‐51 3515 <0.0001
Annual runoff, mm (7) 18 (133) 12 (50) 142 ‐86 ‐14 0.016Annual sediment yield, t ha‐1 (7) 39 (104) 49 (59) 98 ‐62 ‐14 0.016
[a] SD = standard deviation (root mean square), SEE = standard error of the estimate, and PBIAS = percent bias.[b] Values in parentheses are sample sizes. For snow and frost depth, the sample sizes are the number of days with observations.
For runoff and sediment yield, the sample sizes are the days when runoff was observed or for which runoff was predicted.[c] Values in parentheses are field‐observed values.[d] Significance level α= 0.05.
There were no significant differences between WEPPv2010.1 simulated and field‐observed annual runoff andsediment yields (tables 5 and 6). The simulated event‐by‐event runoff was also not significantly different from the fieldobservations, with PBIAS of ‐7%. However, event‐by‐eventsediment yields were significantly different from the field‐observed values, with PBIAS of ‐25%, indicating anunderestimate for sediment yield by WEPP.
WEPP v2010.1 reproduced the large runoff eventstypically observed in winter (fig. 3a). However, WEPP did
not predict some of the small runoff events observed duringwinter, and WEPP predicted events that were not observed,especially during summer when the winter routines were notin effect (fig. 3a). Improving WEPP's winter routines was anintegral part of our goal to improve the model's overall abilityin continuous simulation of water erosion. That the summerevents were not always properly simulated suggests furtherassessment of WEPP application for summer season underMediterranean climatic conditions. The incorrect simulatedtiming of the small runoff events in winter was likely due to

1407Vol. 53(5): 1399-1411
Table 6. Observed and simulated yearly runoff and sediment yield for thePalouse Conservation Field Station (PCFS) plot near Pullman, Washington.
Water Year(Oct. to Sept.)
Precipitation(mm)
Runoff (mm) Sediment Yield (t ha‐1)
Observed
Simulated
Observed
Simulated
v2010.1 v2006.5 v2010.1 v2006.5
1984 596 228 133 43 181 22 1441985 515 119 152 15 31 74 101986 536 147 169 17 167 57 131987 415 71 74 11 71 58 91988 424 108 104 15 69 87 511989 559 125 140 24 66 77 371990 492 134 55 5 144 46 13
Mean 505 133 118 18 104 60 39
Figure 3. Comparison of WEPP‐simulated and field‐observed runoff (upper panels) and sediment yield (lower panels) for the Palouse ConservationField Station (PCFS) plot near Pullman, Washington.
the inadequate simulation of the rapid snowmelt and soilfreeze‐thaw processes in the Palouse region. The incorrectsimulated summer runoff may be due to the impropercharacterization of seasonal changes in soil hydraulicproperties.
WEPP v2010.1 reproduced the occurrence of the majorobserved erosion events (fig. 3b). However, the amount ofsediment yield was either under‐ or overpredicted. Thecritical shear stress (0.08 N m‐2) calibrated in this study wasat the lower end of the range (0 to 2.1 N m‐2) of field‐measured values (Elliot et al., 1989), and the calibrated rillerodibility (1.2 × 10‐2 s m‐1) was higher than the defaultvalue (9.0 × 10‐3 s m‐1) in the WEPP database. Thecalibrated values differed from the field‐measured valueslikely because the latter were obtained from fieldexperiments conducted during summer without the impact of
soil freeze and thaw (Elliot et al., 1989). The inability ofWEPP to reproduce all field‐observed erosion eventssuggests the complexity of the dynamic changes in soilproperties and the need for improving the representation ofsuch dynamics.
The performance of WEPP v2006.5 was generallyinadequate (figs. 2 and 3). Snow depths simulated by WEPPv2006.5 were underestimates with a PBIAS of ‐67% anddiffered significantly from the field observations (table 5).The snow cover period simulated by WEPP v2006.5 wasmuch shorter than the observed value (fig. 2c). Frost depthsimulated by WEPP v2006.5 differed significantly from theobserved value (table 5). WEPP v2006.5 simulated a frostpenetration mostly around 180 mm and a longer frost period(fig. 2d) than observed due to an error in estimating energybalance at the freezing front.
1408 TRANSACTIONS OF THE ASABE
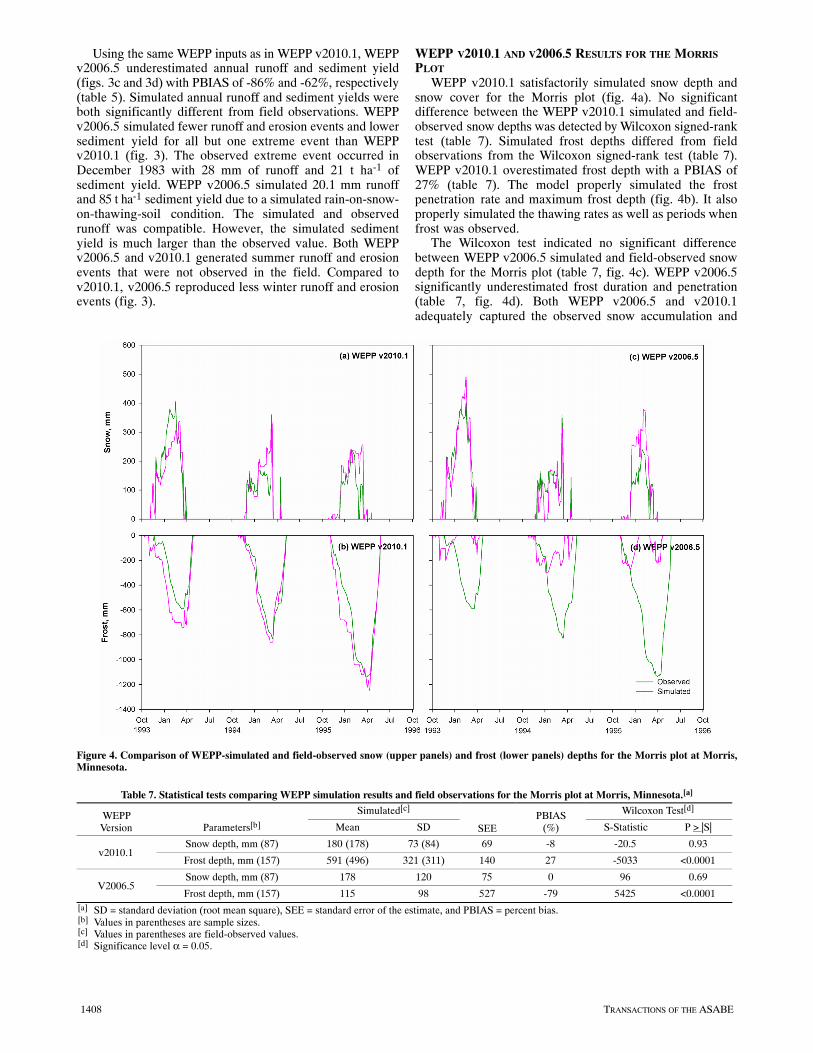
Using the same WEPP inputs as in WEPP v2010.1, WEPPv2006.5 underestimated annual runoff and sediment yield(figs. 3c and 3d) with PBIAS of ‐86% and ‐62%, respectively(table 5). Simulated annual runoff and sediment yields wereboth significantly different from field observations. WEPPv2006.5 simulated fewer runoff and erosion events and lowersediment yield for all but one extreme event than WEPPv2010.1 (fig. 3). The observed extreme event occurred inDecember 1983 with 28 mm of runoff and 21 t ha‐1 ofsediment yield. WEPP v2006.5 simulated 20.1 mm runoffand 85 t ha‐1 sediment yield due to a simulated rain‐on‐snow‐on‐thawing‐soil condition. The simulated and observedrunoff was compatible. However, the simulated sedimentyield is much larger than the observed value. Both WEPPv2006.5 and v2010.1 generated summer runoff and erosionevents that were not observed in the field. Compared tov2010.1, v2006.5 reproduced less winter runoff and erosionevents (fig. 3).
WEPP V2010.1 AND V2006.5 RESULTS FOR THE MORRISPLOT
WEPP v2010.1 satisfactorily simulated snow depth andsnow cover for the Morris plot (fig. 4a). No significantdifference between the WEPP v2010.1 simulated and field‐observed snow depths was detected by Wilcoxon signed‐ranktest (table 7). Simulated frost depths differed from fieldobservations from the Wilcoxon signed‐rank test (table 7).WEPP v2010.1 overestimated frost depth with a PBIAS of27% (table 7). The model properly simulated the frostpenetration rate and maximum frost depth (fig. 4b). It alsoproperly simulated the thawing rates as well as periods whenfrost was observed.
The Wilcoxon test indicated no significant differencebetween WEPP v2006.5 simulated and field‐observed snowdepth for the Morris plot (table 7, fig. 4c). WEPP v2006.5significantly underestimated frost duration and penetration(table 7, fig. 4d). Both WEPP v2006.5 and v2010.1adequately captured the observed snow accumulation and
Figure 4. Comparison of WEPP‐simulated and field‐observed snow (upper panels) and frost (lower panels) depths for the Morris plot at Morris,Minnesota.
Table 7. Statistical tests comparing WEPP simulation results and field observations for the Morris plot at Morris, Minnesota.[a]
WEPPVersion
Simulated[c]
SEEPBIAS
(%)
Wilcoxon Test[d]
Parameters[b] Mean SD S‐Statistic P > |S|
v2010.1Snow depth, mm (87) 180 (178) 73 (84) 69 ‐8 ‐20.5 0.93
Frost depth, mm (157) 591 (496) 321 (311) 140 27 ‐5033 <0.0001
V2006.5Snow depth, mm (87) 178 120 75 0 96 0.69
Frost depth, mm (157) 115 98 527 ‐79 5425 <0.0001[a] SD = standard deviation (root mean square), SEE = standard error of the estimate, and PBIAS = percent bias.[b] Values in parentheses are sample sizes.[c] Values in parentheses are field‐observed values.[d] Significance level α = 0.05.

1409Vol. 53(5): 1399-1411
melt, yet WEPP v2010.1 better reproduced frost penetrationand frost duration (fig. 4).
SUMMARY AND CONCLUSIONSThis study aimed to modify the algorithms and
subroutines of WEPP v2006.5 that inadequately describe soilfreezing and thawing processes so that WEPP can be appliedto adequately simulate soil freezing and thawing processes aswell as winter runoff generation in cold regions where winterhydrology is important, and to assess the performance of themodified model by applying it to two experimental researchsites under different climatic conditions.
Limitations of the frost simulation routines in WEPPv2006.5 were identified, and new frost simulation routineswere developed and implemented in WEPP v2010.1.Specifically, improvement was made in (1) discretization ofa snow‐residue‐soil system; (2) computation of soiltemperature, soil water movement in unsaturated soil, andsaturated hydraulic conductivity of frozen soil; and(3)�integration of the frost‐simulation routines and otherwater balance routines of WEPP. The refined WEPP modelhas the ability to account for multiple sandwiched frost layersand soil water migration to the freezing front. Further, themodel allows for interaction between hourly frost simulationand other daily water balance computations. Comparison ofthe results from WEPP v2006.5 and v2010.1 shows that thenew version can be used to more realistically simulate winterhydrologic processes in cold regions.
Model performance assessment was carried out byapplying the WEPP model to experimental research sites atPullman, Washington, and Morris, Minnesota. Considerablydifferent snow and frost characteristics were observed fromthe study plots at the Pullman and Morris research sites.Pullman is typified by rapid snow melt and numerous freeze‐thaw cycles under a Mediterranean climate, and Morris istypified by long‐lasting snow cover and frost presence undercontinental climate. Comparison of WEPP model resultsfrom v2006.5 and v2010.1 showed that WEPP v2010.1 hadsubstantial improvement in simulating snow and frost depthfor both study sites as well as in predicting winter runoffevents and annual runoff and sediment yield from thePullman site.
WEPP v2010.1 simulated contrasting snow and frostcharacteristics for the two study sites, consistent with fieldobservations. With the new frost routines, WEPP v2010.1more adequately simulated the major winter processes at thestudy sites. WEPP‐simulated snow and frost depths, snowcover period, and frost duration were in reasonableagreement with field observations for both study sites. WEPPsimulated the runoff events for the Pullman site reasonablywell.
WEPP v2010.1 showed great potential for evaluatingwinter hydrologic and erosion processes in cold regions,which is a marked improvement in accuracy over WEPPv2006.5. However, it was not able to fully describe thedynamic winter processes in the field at the daily time scale.Snow accumulation and melt, and soil freeze‐thaw arecomplex processes that are impacted by numerous factors,including weather characteristics, surface conditions, andsoil type. Future efforts should be devoted to furtherimproving the ability of WEPP in simulating snow pack
dynamics and the transient change of soil hydraulicconductivity and erodibility parameters.
ACKNOWLEDGEMENTSWe are grateful to Drs. W. J. Elliot, G. N. Flerchinger, and
C. O. Stöckle for their valuable discussions on winterhydrologic processes and for their comments that helped toimprove the technical rigor and editorial clarity of themanuscript. We thank Mr. J. R. Morse and Drs. C. Lin and B.S. Sharratt for their suggestions about WEPP inputpreparation and discussions on field observations. We arealso thankful to the anonymous reviewers and the ASABEassociate editor for their constructive comments andsuggestions that substantially helped to improve themanuscript.
REFERENCESASCE. 1996. Hydrology Handbook. 2nd ed. New York, N.Y.:
ASCE.Boll, J. 1988. A laboratory study of infiltration into frozen soils
under rainfall conditions. MS thesis. Moscow, Ida.: University ofIdaho.
Campbell, G. S., and J. M. Norman. 1998. Introduction toEnvironmental Biophysics. 2nd ed. New York, N.Y.: Springer‐Verlag.
Cannell, G. C., and W. H. Gardner. 1959. Freezing‐pointdepressions in stabilized soil aggregates, synthetic soil, andquartz sand. SSSA Proc. 23(6): 418‐422.
Clark, D. L., D. R. Janecky, and L. J. Lane. 2006. Science‐basedcleanup of Rocky Flats. Phys. Today 59(9): 34‐40.
Cochrane, T. A., and D. C. Flanagan. 1999. Assessing water erosionin small watersheds using WEPP with GIS and digital elevationmodels. J. Soil Water Cons. 54(4): 678‐685.
Cruse, R. M., D. C. Flanagan, J. R. Frankenberger, B. K. Gelder, D.Herzmann, D. James, W. Krajewski, M. Kraszewski, J. M.Laflen, and D. Todey. 2006. Daily estimates of rainfall, waterrunoff, and soil erosion in Iowa. J. Soil Water Cons. 61(2):191‐199.
DeWit, C. T., J. Goudriaan, and H. H. van Laar. 1978. Simulation ofAssimilation, Respiration, and Transpiration of Crops.Wageningen, The Netherlands: Pudoc.
Dun, S., J. Q. Wu, W. J. Elliot, P. R. Robichaud, D. C. Flanagan, J.R. Frankenberger, R. E. Brown, and A. C. Xu. 2009. Adaptingthe Water Erosion Prediction Project (WEPP) model for forestapplications. J. Hydrol. 366: 46‐54.
Edwards, L, G. Richter, B. Bernsdorf, R. G. Schmidt, and J. Burney.1998. Measurement of rill erosion by snowmelt on potato fieldsunder rotation in Prince Edward Island (Canada). Canadian J.Soil Sci. 78(3): 449‐458.
Elliot, W. J., and D. E. Hall. 1997. Water Erosion Prediction Project(WEPP) forest applications. Report INT‐GTR‐365. Ogden,Utah: USDA Forest Service, Rocky Mountain Research Station.
Elliot, W. J., A. M. Liebenow, J. M. Laflen, and K. D. Kohl. 1989.A compendium of soil erodibility data from WEPP cropland soilfield erodibility experiments, 1987 and 1988. NSERL Report 3.West Lafayette, Ind.: USDA‐ARS National Soil ErosionResearch Laboratory.
Elliot, W. J., P. R. Robichaud, and C. H. Luce. 1995. Applying theWEPP erosion model to timber harvest areas. In Proc. ASCEWatershed Mgmt. Conf., 83‐92. T. J. Ward, ed. New York, N.Y.:ASCE.
Flanagan, D. C., and S. J. Livingston, eds. 1995. USDA WaterErosion Prediction Project user summary. NSERL Report 11.West Lafayette, Ind.: USDA‐ARS National Soil ErosionResearch Laboratory.

1410 TRANSACTIONS OF THE ASABE
Flanagan, D. C., and M. A. Nearing, eds. 1995. USDA WaterErosion Prediction Project Hillslope Profile and WatershedModel Documentation. NSERL Report 10. West Lafayette, Ind.:USDA‐ARS National Soil Erosion Research Laboratory.
Flanagan, D. C., J. C. Ascough II, A. D. Nicks, M. A. Nearing, andJ. M. Laflen. 1995. Chapter 1: Overview of the WEPP erosionprediction model. In USDA Water Erosion Prediction ProjectHillslope Profile and Watershed Model Documentation. NSERLReport 10. D. C. Flanagan and M. A. Nearing, eds. WestLafayette, Ind.: USDA‐ARS National Soil Erosion ResearchLaboratory.
Flanagan, D. C., J. C. Ascough II, M. A. Nearing, and J. M. Laflen.2001. Chapter 7: The Water Erosion Prediction Project (WEPP)model. In Landscape Erosion and Evolution Modeling,145‐199. R. S. Harmon and W. W. Doe III, eds. New York, N.Y.:Kluwer Academic/Plenum.
Flanagan, D. C., J. E. Gilley, and T. G. Franti. 2007. Water ErosionPrediction Project (WEPP): Development history, modelcapabilities, and future enhancements. Trans. ASABE 50(5):1603‐1612.
Flerchinger, G. N. 1987. Simultaneous heat and water model of asnow‐residue‐soil system. PhD diss. Pullman, Wash.:Washington State University.
Formanek, G. E., D. K. McCool, and R. I. Papendick. 1984.Freeze‐thaw and consolidation effects on strength of a wet siltloam. Trans. ASAE 27(6): 1749‐1752.
Forsyth, A. R., K. A. Bubb, and M. E. Cox. 2006. Runoff, sedimentloss, and water quality from forest roads in a southeastQueensland coastal plain Pinus plantation. Forest Ecol. Mgmt.221: 194‐206.
Froese, J. C., and R. M. Cruse. 1997. Erosion impact of the soilthawing process. In Proc. Intl. Symp. on Physics, Chemistry, andEcology of Seasonally Frozen Soil, 231‐234. I. K. Iskandar, E.A. Wright, J. K. Radke, B. S. Sharratt, P. H. Groenevelt, and L.D. Hinzman, eds. U.S. Army Cold Region Research andEngineering Lab Special Report 97‐10. Springfield, Va.:National Technical Information Service (NTIS).
Gatto, L. W. 2000. Soil freeze‐thaw‐induced changes to a simulatedrill: Potential impacts on soil erosion. Geomorphology 32(1‐2):147‐160.
Ghuman, B. S., and R. Lal. 1985. Thermal conductivity, thermaldiffusivity, and thermal capacity of some Nigerian soils. Soil Sci.139(1): 74‐80.
Greer, R. C., J. Q. Wu, P. Singh, and D. K. McCool. 2006. WEPPsimulation of observed winter runoff and erosion in the U.S.Pacific Northwest. Vadose Zone J. 5(1): 261‐272.
Horner, G. M., A. G. McCall, and F. G. Bell. 1944. Investigations inerosion control and the reclamation of eroded land at the PalouseConservation Experiment Station, Pullman, Washington,1931‐1942. Tech. Bulletin 860. Washington, D.C.: USDA SoilConservation Service.
Hunt, A. G., and J. Q. Wu. 2004. Climatic influences on Holocenevariations in soil erosion rates on a small hill in the MojaveDesert. Geomorphology 58: 263‐289.
Jensen, M. E., R. D. Burman, and R. G. Allen, eds. 1990.Evapotranspiration and Irrigation Water Requirements. ASCEManual No. 70. New York, N.Y.: ASCE.
Kennedy, I., and B. Sharratt. 1998. Model comparisons to simulatesoil frost depth. Soil Sci. 163(8): 636‐645.
Kok, H., and D. K. McCool. 1990. Quantifying freeze/thaw‐induced variability of soil strength. Trans. ASAE 33(2):501‐506.
Kozlowski, T. 2004. Soil freezing point as obtained on melting.Cold Reg. Sci. Tech. 38(2‐3): 93‐101.
Laflen, J. M., L. J. Lane, and G. R. Foster. 1991. WEPP: A nextgeneration of erosion prediction technology. J. Soil Water Cons.46(1): 34‐38.
Laflen, J. M., W. J. Elliot, D. C. Flanagan, C. R. Meyer, and M. A.Nearing. 1997. WEPP: Predicting water erosion using aprocess‐based model. J. Soil Water Cons. 52(2): 96‐102.
Lin, C., and D. K. McCool. 2006. Simulating snowmelt and soilfrost depth by an energy budget approach. Trans. ASABE 49(5):1383‐1394.
McCauley, C. A., D. M. White, M. R. Lilly, and D. M. Nyman.2002. A comparison of hydraulic conductivities, permeabilities,and infiltration rates in frozen and unfrozen soils. Cold Reg. Sci.Tech. 34(2): 117‐125.
McCool, D. K. 1990. Crop management effects on runoff and soilloss from thawing soil. In Proc. Intl. Symp. Frozen Soil Impactson Agricultural, Range, and Forest Lands (Special Report90‐1), 271‐278. K. R. Cooley, ed. Hanover, N.H.: Army ColdRegions Research and Engineering Laboratory.
McCool, D. K., and M. Molnau. 1984. Measurement of frost depth.In Proc. Western Snow Conf., 33‐41. Sun Valley, Idaho.
McCool, D. K., M. T. Walter, and L. G. King. 1995. Runoff indexvalues for frozen soil areas of the Pacific Northwest. J. SoilWater Cons. 50(5): 466‐469.
McCool, D. K., C. D. Pannkuk, C. Lin, and J. M. Laflen. 1998.Evaluation of WEPP for temporally frozen soil. ASAE PaperNo. 982048. St. Joseph, Mich.: ASAE.
McCool, D. K., G. R. Foster, A. H. Ingersoll, R. C. McClellan, andR. W. Rickman. 2002. Cover‐management enhancements forRUSLE2 in the Pacific Northwest USA. In Proc. 12th ISCOConf., 513‐517. L. Wang, D. Wu, X. Tu, J. Nie, eds.International Soil Conservation Organization. Available at:http://tucson.ars.ag.gov/isco/isco12/index.html.
McCool, D. K., K. E. Saxton, and P. K. Kalita. 2006. Winter runoffand erosion on northwestern USA cropland. ASABE Paper No.062190. St. Joseph, Mich.: ASABE. Available at: http://asae.frymulti.com/azdez.asp?JID=5&AID=20748&CID=por2006&T=2. Accessed February 2010.
Merrit, W. S., R. A. Letcher, and A. J. Jakeman. 2003. A review oferosion and sediment transport models. Environ. Model.Software 18(8‐9): 761‐799.
Miller, R. D. 1980. Freezing phenomena in soils. In Application ofSoil Physics, 254‐299. D. Hillel, ed. New York, N.Y.: AcademicPress.
Moffet, C. A., F. B. Pierson, P. R. Robichaud, K. E. Spaeth, and S.P. Hardegree. 2007. Modeling soil erosion on steep sagebrushrangeland before and after prescribed fire. Catena 71(2):218‐228.
NOAA. 2010. Maps of annual 1961‐1990 normal temperature,precipitation, and degree days. Washington, D.C.: NationalOceanic and Atmospheric Administration. Available at:http://lwf.ncdc.noaa.gov/oa/documentlibrary/clim81supp3/clim81.html. Accessed August 2010.
NRCS. 2010a. Processed annual precipitation. Washington, D.C.:USDA‐NRCS National Cartography and Geospatial Center.Available at: http://datagateway.nrcs.usda.gov. Accessed August2010.
NRCS. 2010b. Processed annual average temperature. Washington,D.C.: USDA‐NRCS National Cartography and GeospatialCenter. Available at: http://datagateway.nrcs.usda.gov. AccessedAugust 2010.
Øygarden, L. 2003. Rill and gully development during an extremewinter runoff event in Norway. Catena 50(2‐4): 217‐242.
Pannkuk, C. D., D. K. McCool, and J. M. Laflen. 2000. Chapter 55:Evaluation of WEPP for transient frozen soil. In Soil Erosionand Dryland Farming, 567‐571. J. M. Laflen, J. Tian, and C. H.Huang, eds. Boca Raton, Fla.: CRC Press.
Pieri, L., M. Bittelli, J. Q. Wu, S. Dun, D. C. Flanagan, P. R. Pisa, F.Ventura, and F. Salvatorelli. 2007. Using the Water ErosionPrediction Project (WEPP) model to simulate field‐observedrunoff and erosion in the Apennines mountain range, Italy. J.Hydrol. 336(1‐2): 84‐97.

1411Vol. 53(5): 1399-1411
Robichaud, P. R., W. J. Elliot, F. B. Pierson, D. E. Hall, and C. A.Moffet. 2007. Predicting postfire erosion and mitigationeffectiveness with a web‐based probabilistic erosion model.Catena 71(2): 229‐241.
SAS. 2004. Base SAS 9.1 Procedure Guide. Vol. 1, 2, and 3. Cary,N.C.: SAS Institute, Inc.
Satyawali, P. K., and A. K. Singh. 2008. Dependence of thermalconductivity of snow on microstructure. J. Earth Syst. Sci.117(4): 465‐475.
Savabi, M. R., R. A. Young, G. R. Benoit, J. M. Witte, and D. C.Flanagan. 1995. Chapter 3: Winter hydrology. In USDA WaterErosion Prediction Project: Hillslope Profile and WatershedModel Documentation. NSERL Report 10. D. C. Flanagan andM. A. Nearing, eds. West Lafayette, Ind.: USDA‐ARS NationalSoil Erosion Research Laboratory.
Saxton, K. E., and W. J. Rawls. 2006. Soil water characteristicestimates by texture and organic matter for hydrologic solutions.SSSA J. 70(5): 1569‐1578.
Soto, B., and F. Diaz‐Fierros. 1998. Runoff and soil erosion fromareas of burnt scrub: Comparison of experimental results withthose predicted by the WEPP model. Catena 31(4): 257‐270.
Seyfried, M. S., and G. N. Flerchinger. 1994. Influence of frozensoil on rangeland erosion. In Variability of Rangeland WaterErosion Processes, 67‐82. SSSA Spec. Publ. 38. Madison,Wisc.: SSSA.
Sharratt, B. S. 2002. Corn stubble height and residue placement inthe northern U.S. Corn Belt: Part I. Soil physical environmentduring winter. Soil Till. Res. 64(3‐4): 234‐252.
Singh, P., J. Q. Wu, D. K. McCool, S. Dun, C. H. Lin, and J. R.Morse. 2009. Winter hydrological and erosion processes in theU.S. Palouse region: Field experimentation and WEPPsimulation. Vadose Zone J. 8(2): 426‐436.
Stadler, D., H. Fluhler, and P. Jansson. 1997. Modeling vertical andlateral water flow in frozen and sloped forest soil plots. ColdReg. Sci. Tech. 26(3): 181‐194.
Sturm, M., J. Holmgren, M. König, and K. Morris. 1997. Thethermal conductivity of seasonal snow. J. Glaciol. 43(143):26‐41.
Swift, L. W. 1976. Algorithm for solar radiation estimation onmountain slopes. Water Resour. Res. 12(1): 108‐112.
Van Klaveren, R. W., and D. K. McCool. 1998. Erodibility andcritical shear of a previously frozen soil. Trans. ASAE 41(5):1315‐1321.
Wade, R. J., and M. P. Kirkbride. 1998. Snowmelt‐generated runoffand soil erosion in Fife, Scotland. Earth Surf. Proc. Landforms23(2): 123‐132.
Watanabe, K., and M. Flury. 2008. Capillary bundle model ofhydraulic conductivity for frozen soil. Water Resour. Res. 44:W12402, doi:10.1029/2008WR007012.
Watanabe, K., and T. Wake. 2008. Hydraulic conductivity of frozenunsaturated soil. In Proc. 9th Intl. Conf. Permafrost, 147‐152.Fairbanks, Alaska
Wilcox, B. P., M. Sbaa, W. Blackburn, and J. H. Milligan. 1990.Runoff prediction from sagebrush rangelands using WaterErosion Prediction Project (WEPP) technology. J. Range Mgmt.45(5): 470‐474.
WRCC. 2008. Climate of Washington. Reno, Nev.: WesternRegional Climate Center. Available at: www.wrcc.dri.edu/narratives/WASHINGTON.htm. Accessed October 2008.
Yüksel, A., A. E. Akay, R. Gundogan, M. Reis, and M. Cetiner.2008. Application of GeoWEPP for determining sediment yieldand runoff in the Orcan Creek watershed in Kahramanmaras,Turkey. Sensors 8(2): 1222‐1236.
Zuzel, J. F., R. R. Allamaras, and R. N. Greenwalt. 1982. Runoffand soil erosion on frozen soil in northeastern Oregon. J. SoilWater Cons. 37(6): 351‐354.

1412 TRANSACTIONS OF THE ASABE
Related Documents