Improving FE models of a long-span flat concrete floor using natural frequency measurements Emad El-Dardiry a , Endah Wahyuni b , Tianjian Ji a, * , Brian R. Ellis c a Manchester Centre for Civil and Construction Engineering, Institute of Science and Technology, University of Manchester, Manchester, M60 1QD, UK b ITS Surabaya, Indonesia (formerly UMIST) c Building Research Establishment Ltd., Watford, WD2 7JR, UK Received 14 November 2000; accepted 4 July 2002 Abstract The paper identifies an appropriate FE model for determining the dynamic characteristics of a long-span flat concrete floor using natural frequency measurements. The Cardington concrete building was selected for the study because it represents a popular form of concrete construction. The natural frequencies of the floors were measured. Several FE models of the floor are considered and the models are refined based on the comparison between numerical predictions and the frequency measurements. It is concluded that a floor-column model provides the most appropriate representation of the actual structure. Ó 2002 Civil-Comp Ltd. and Elsevier Science Ltd. All rights reserved. 1. Introduction Long-span flat slabs supported by columns are widely used for floors in offices, shopping centres and airport terminals. The use of this type of structure can lead to a serviceability problem due to vibrations produced by people walking and this should be considered in design. However, the dynamic behaviour of this type of floor is not well understood. The objective of this study is to identify an appropriate FE model for this type of floor, which can be used to study its dynamic behaviour. A seven-storey in-situ concrete building has been constructed inside the BRE Cardington Laboratory as a part of the European Concrete Building Project (ECBP). It was designed as an office building and in situ concrete was chosen because it is the most popular form of concrete construction [1]. The building consists of seven storeys of 3.75 m each in height, giving a total height of 26.25 m. The building has three bays of 7.50 m constituting a width of 22.50 m and four bays of 7.50 m making a length of 30.00 m. The building has been designed to Eurocode 2. The building was built on pad foundation supported on the existing floor. The cross-sections of the columns are kept con- stant throughout the height of the building. High strength concrete C85 is used in the first three storeys and C37 concrete is used from the fourth floor up to the roof level. In the absence of cross walls or dia- phragms, the lateral stiffness of the building is enhanced by steel cross bracing members. The building is shown in Fig. 1. The building floors have been designed as reinforced concrete flat slabs and cast in C37 concrete, which is typical for this type of construction. The flat floor slabs are 0.25 m thick with each slab having a different ar- rangement of reinforcement steel. The floors have been designed to carry an imposed load of 2.5 kN/m 2 instead of the usual 4.5 kN/m 2 . The flat slab construction of- fers significant advantages to contractors in ease of * Corresponding author. Tel.: +44-161-200-4604; fax: +44- 161-200-4646. E-mail address: [email protected] (T. Ji). 0045-7949/02/$ - see front matter Ó 2002 Civil-Comp Ltd. and Elsevier Science Ltd. All rights reserved. PII:S0045-7949(02)00264-X Computers and Structures 80 (2002) 2145–2156 www.elsevier.com/locate/compstruc

Welcome message from author
This document is posted to help you gain knowledge. Please leave a comment to let me know what you think about it! Share it to your friends and learn new things together.
Transcript
Improving FE models of a long-span flat concrete floorusing natural frequency measurements
Emad El-Dardiry a, Endah Wahyuni b, Tianjian Ji a,*, Brian R. Ellis c
a Manchester Centre for Civil and Construction Engineering, Institute of Science and Technology,
University of Manchester, Manchester, M60 1QD, UKb ITS Surabaya, Indonesia (formerly UMIST)
c Building Research Establishment Ltd., Watford, WD2 7JR, UK
Received 14 November 2000; accepted 4 July 2002
Abstract
The paper identifies an appropriate FE model for determining the dynamic characteristics of a long-span flat
concrete floor using natural frequency measurements. The Cardington concrete building was selected for the study
because it represents a popular form of concrete construction. The natural frequencies of the floors were measured.
Several FE models of the floor are considered and the models are refined based on the comparison between numerical
predictions and the frequency measurements. It is concluded that a floor-column model provides the most appropriate
representation of the actual structure.
� 2002 Civil-Comp Ltd. and Elsevier Science Ltd. All rights reserved.
1. Introduction
Long-span flat slabs supported by columns are widely
used for floors in offices, shopping centres and airport
terminals. The use of this type of structure can lead to a
serviceability problem due to vibrations produced by
people walking and this should be considered in design.
However, the dynamic behaviour of this type of floor is
not well understood. The objective of this study is to
identify an appropriate FE model for this type of floor,
which can be used to study its dynamic behaviour.
A seven-storey in-situ concrete building has been
constructed inside the BRE Cardington Laboratory as a
part of the European Concrete Building Project (ECBP).
It was designed as an office building and in situ concrete
was chosen because it is the most popular form of
concrete construction [1].
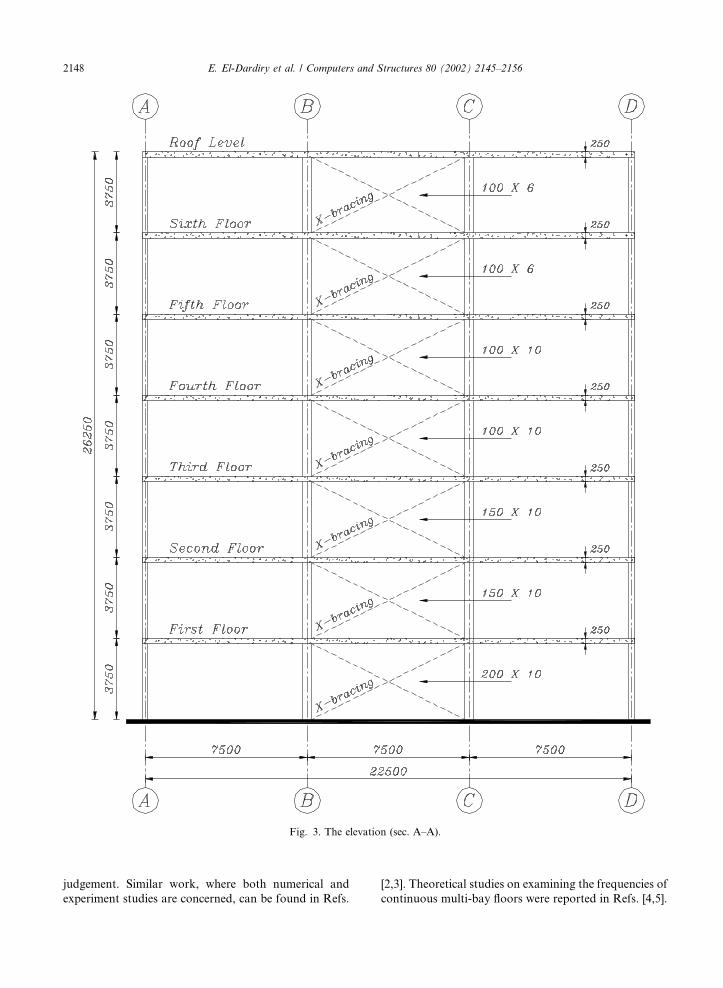
The building consists of seven storeys of 3.75 m each
in height, giving a total height of 26.25 m. The building
has three bays of 7.50 m constituting a width of 22.50 m
and four bays of 7.50 m making a length of 30.00 m. The
building has been designed to Eurocode 2. The building
was built on pad foundation supported on the existing
floor. The cross-sections of the columns are kept con-
stant throughout the height of the building. High
strength concrete C85 is used in the first three storeys
and C37 concrete is used from the fourth floor up
to the roof level. In the absence of cross walls or dia-
phragms, the lateral stiffness of the building is enhanced
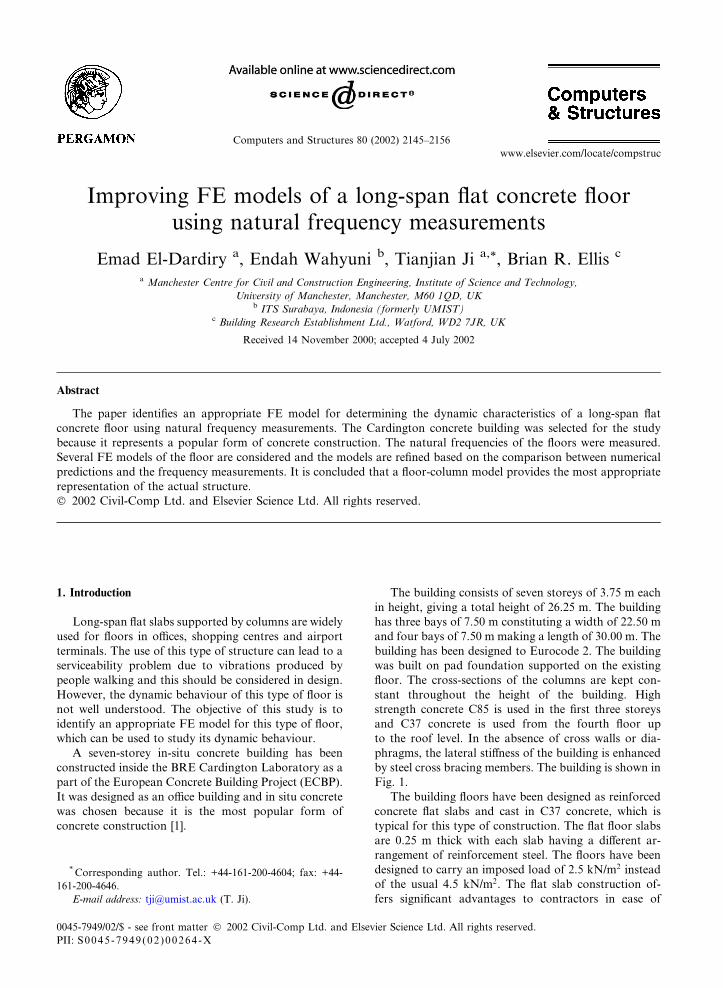
by steel cross bracing members. The building is shown in
Fig. 1.
The building floors have been designed as reinforced
concrete flat slabs and cast in C37 concrete, which is
typical for this type of construction. The flat floor slabs
are 0.25 m thick with each slab having a different ar-
rangement of reinforcement steel. The floors have been
designed to carry an imposed load of 2.5 kN/m2 instead
of the usual 4.5 kN/m2. The flat slab construction of-
fers significant advantages to contractors in ease of
*Corresponding author. Tel.: +44-161-200-4604; fax: +44-
161-200-4646.
E-mail address: [email protected] (T. Ji).
0045-7949/02/$ - see front matter � 2002 Civil-Comp Ltd. and Elsevier Science Ltd. All rights reserved.
PII: S0045-7949 (02 )00264-X
Computers and Structures 80 (2002) 2145–2156
www.elsevier.com/locate/compstruc
construction and to building owners and users, and
flexibility in fitting out buildings.
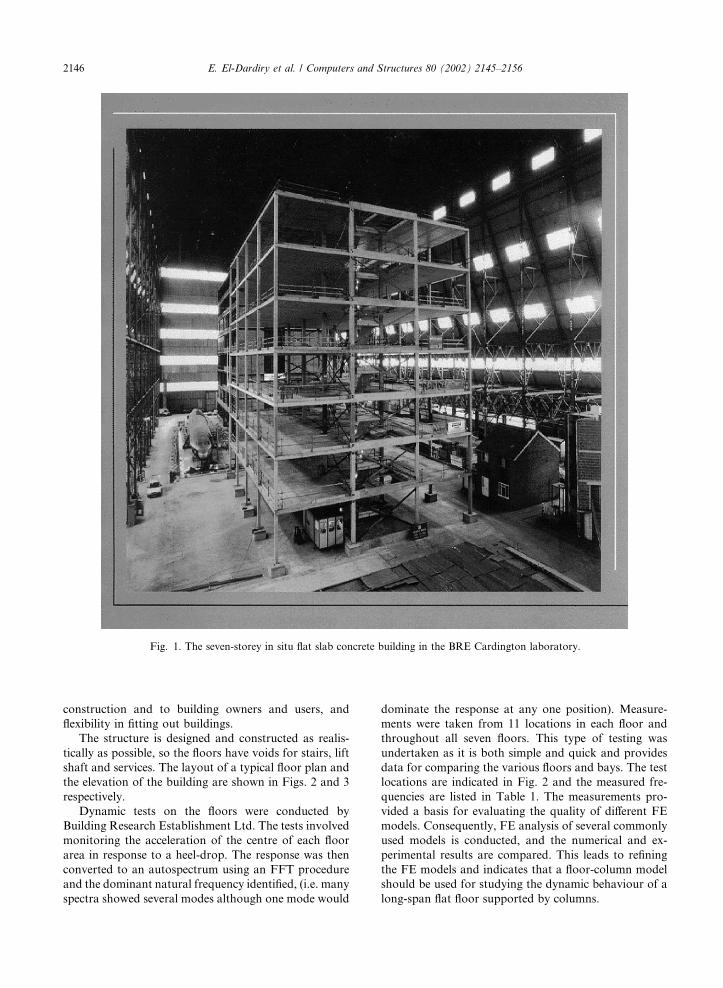
The structure is designed and constructed as realis-
tically as possible, so the floors have voids for stairs, lift
shaft and services. The layout of a typical floor plan and
the elevation of the building are shown in Figs. 2 and 3
respectively.
Dynamic tests on the floors were conducted by
Building Research Establishment Ltd. The tests involved
monitoring the acceleration of the centre of each floor
area in response to a heel-drop. The response was then
converted to an autospectrum using an FFT procedure
and the dominant natural frequency identified, (i.e. many
spectra showed several modes although one mode would
dominate the response at any one position). Measure-
ments were taken from 11 locations in each floor and
throughout all seven floors. This type of testing was
undertaken as it is both simple and quick and provides
data for comparing the various floors and bays. The test
locations are indicated in Fig. 2 and the measured fre-
quencies are listed in Table 1. The measurements pro-
vided a basis for evaluating the quality of different FE
models. Consequently, FE analysis of several commonly
used models is conducted, and the numerical and ex-
perimental results are compared. This leads to refining
the FE models and indicates that a floor-column model
should be used for studying the dynamic behaviour of a
long-span flat floor supported by columns.
Fig. 1. The seven-storey in situ flat slab concrete building in the BRE Cardington laboratory.
2146 E. El-Dardiry et al. / Computers and Structures 80 (2002) 2145–2156
The numerical and experimental studies on the floor
have been conducted independently. The improvement
of the numerical models is based on the comparison be-
tween the predictions and measurements and engineering
Fig. 2. The plan of a typical floor, the panel numbers and the test locations.
E. El-Dardiry et al. / Computers and Structures 80 (2002) 2145–2156 2147
judgement. Similar work, where both numerical and
experiment studies are concerned, can be found in Refs.
[2,3]. Theoretical studies on examining the frequencies of
continuous multi-bay floors were reported in Refs. [4,5].
Fig. 3. The elevation (sec. A–A).
2148 E. El-Dardiry et al. / Computers and Structures 80 (2002) 2145–2156
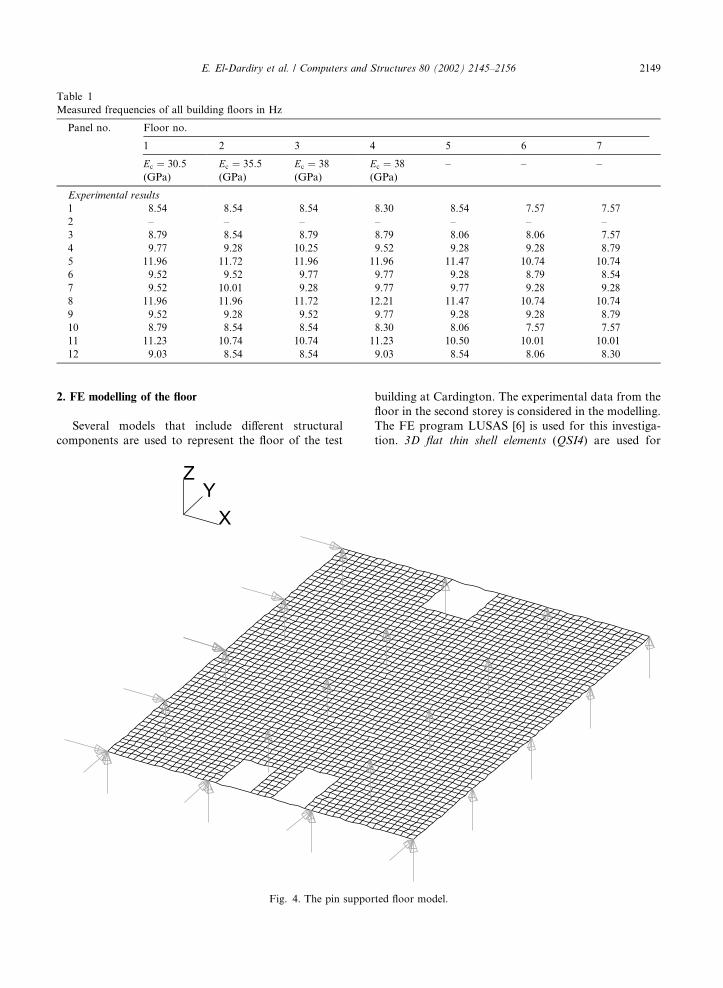
2. FE modelling of the floor
Several models that include different structural
components are used to represent the floor of the test
building at Cardington. The experimental data from the
floor in the second storey is considered in the modelling.
The FE program LUSAS [6] is used for this investiga-
tion. 3D flat thin shell elements (QSI4) are used for
Fig. 4. The pin supported floor model.
Table 1
Measured frequencies of all building floors in Hz
Panel no. Floor no.
1 2 3 4 5 6 7
Ec ¼ 30:5
(GPa)
Ec ¼ 35:5
(GPa)
Ec ¼ 38
(GPa)
Ec ¼ 38
(GPa)
– – –
Experimental results
1 8.54 8.54 8.54 8.30 8.54 7.57 7.57
2 – – – – – – –
3 8.79 8.54 8.79 8.79 8.06 8.06 7.57
4 9.77 9.28 10.25 9.52 9.28 9.28 8.79
5 11.96 11.72 11.96 11.96 11.47 10.74 10.74
6 9.52 9.52 9.77 9.77 9.28 8.79 8.54
7 9.52 10.01 9.28 9.77 9.77 9.28 9.28
8 11.96 11.96 11.72 12.21 11.47 10.74 10.74
9 9.52 9.28 9.52 9.77 9.28 9.28 8.79
10 8.79 8.54 8.54 8.30 8.06 7.57 7.57
11 11.23 10.74 10.74 11.23 10.50 10.01 10.01
12 9.03 8.54 8.54 9.03 8.54 8.06 8.30
E. El-Dardiry et al. / Computers and Structures 80 (2002) 2145–2156 2149
modelling the floor slab. These elements take into ac-
count both membrane and flexural deformations. The
3D thick beam elements (BMS3) are used for represent-
ing columns and beams. An element of this type can
resist axial stretching, bending and transverse shear
force in the three directions. For all of the FE models,
necessary constraints in the floor plane are provided to
prevent rigid body movements.
The FE models of the floor considered in the study
include:
• A floor model with pinned supports from columns.
• A floor model with fixed supports from columns.
• A floor-column model.
• A floor-column model considering the effect of rein-
forcement in columns.
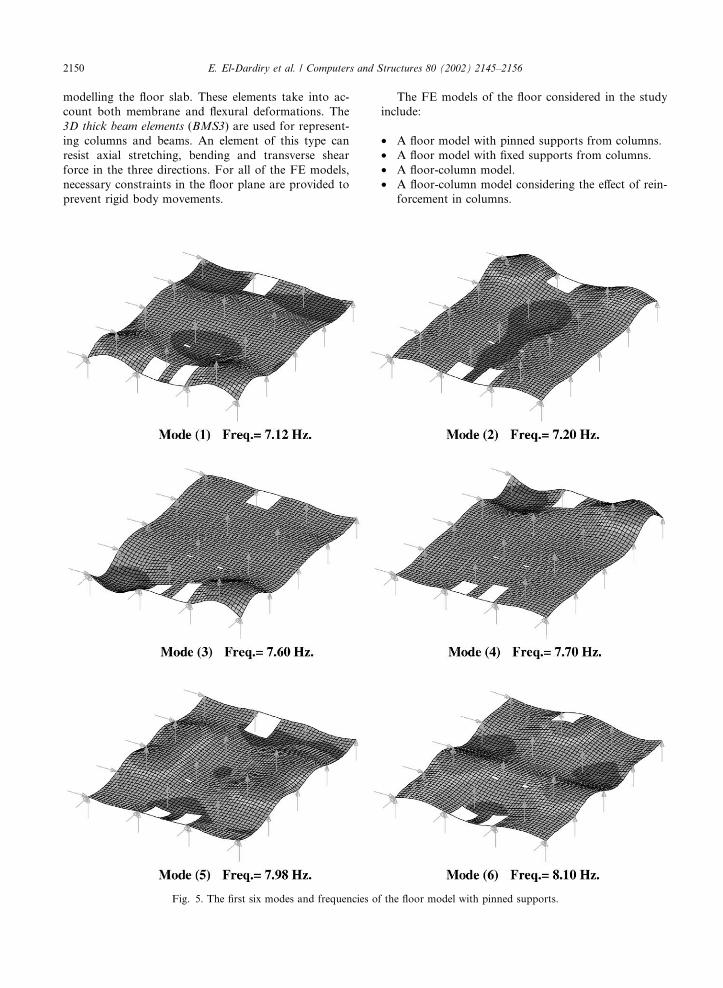
Fig. 5. The first six modes and frequencies of the floor model with pinned supports.
2150 E. El-Dardiry et al. / Computers and Structures 80 (2002) 2145–2156
Initially the effect of mesh sizes on the dynamic be-
haviour was studied. Three different meshes were con-
sidered but they had a negligible effect on the natural
frequencies, although they affected the appearance of the
mode shapes. Thus a fine mesh (see Fig. 4) was adopted.
The basic data used in the modelling was
The natural frequencies obtained from analysis and
experiment will be compared for each FE model con-
sidered. It is important to identify the correct modes for
comparison. The measurements were taken from heel
drop tests at the centre of each panel. As a result, the test
generated the mode with the maximum response at the
centre of the panel. When vibration modes are calcu-
lated, the maximum relative displacements are found out
in order to compare with the experimental measure-
ments.
It is recognised that the measurement of the mode
shapes would have provided further information for
comparison with theory. However, mode shape mea-
surement for each mode throughout the building would
require a far more comprehensive test programme, and
it was thought that much could be gained using the
measured frequencies.
2.1. A floor model with pinned supports from columns
(model 1)
In the floor model with pinned supports the columns
are assumed to be completely stiff in the vertical direc-
tion but to provide no rotational restraints to the slab.
Therefore, they are modelled as vertical pinned supports
that are commonly considered in practice. The FE mesh
and the boundary supports of the floor are shown in Fig.
4. The calculated first six natural frequencies and the
mode shapes are summarised in Fig. 5.
The comparison between the natural frequencies of
the 12 modes extracted from the numerical analysis and
the measurements is summarised in Table 2.
Table 2 shows that the calculated natural frequencies
of the pin supported floor model are consistently lower
than the measured values. This is probably due to the
assumption that the columns do not provide any rota-
tional restraint. Thus, the slab-column joints are not
sufficiently rigid and the pin supported floor model has
less stiffness than the real floor. This assumes that the
mass of the floor is modelled accurately, which is rea-
sonable for this experimental building where quality
control was closely monitored. The ratios of numerical
to experimental results change between 75% and 91% for
the first 12 modes.
2.2. A floor model with fixed supports from columns
(model 2)
Since the floor is less stiff using the pin supported
floor model, a floor model with fixed supports from the
columns is considered. In this model columns provide
complete fixed supports, both translational and rota-
tional.
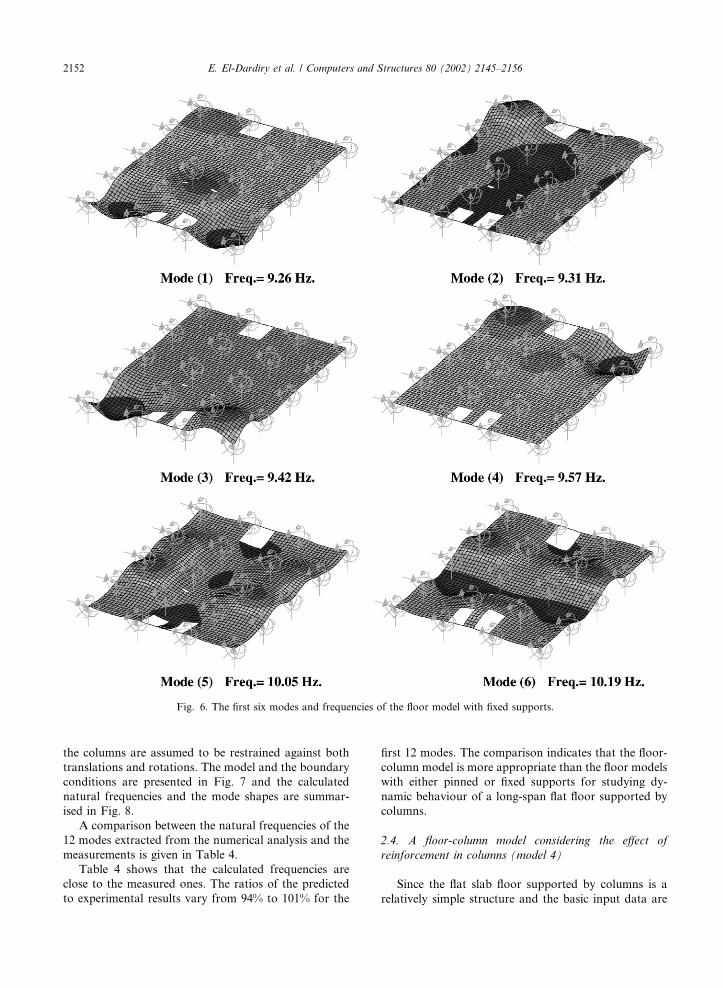
The boundary conditions of this model and the cor-
responding results are shown in Fig. 6. In comparison
with the first model, it can be seen that there are no
significant changes in the mode shapes of the floor, but
the natural frequencies of the floor have increased. A
similar comparison is considered in which the FE and
the experimental results are given in Table 3.
Table 3 shows that the natural frequencies of the
fixed floor model are higher than the measurements.
This indicates that the slab-column joints are too rigid.
Consequently, the floor model with fixed supports is
stiffer than the real floor. The ratios of numerical to
experimental results range from 95% to 112% for the
first 12 modes and are greater than 1.0 for nine of the 10
modes compared.
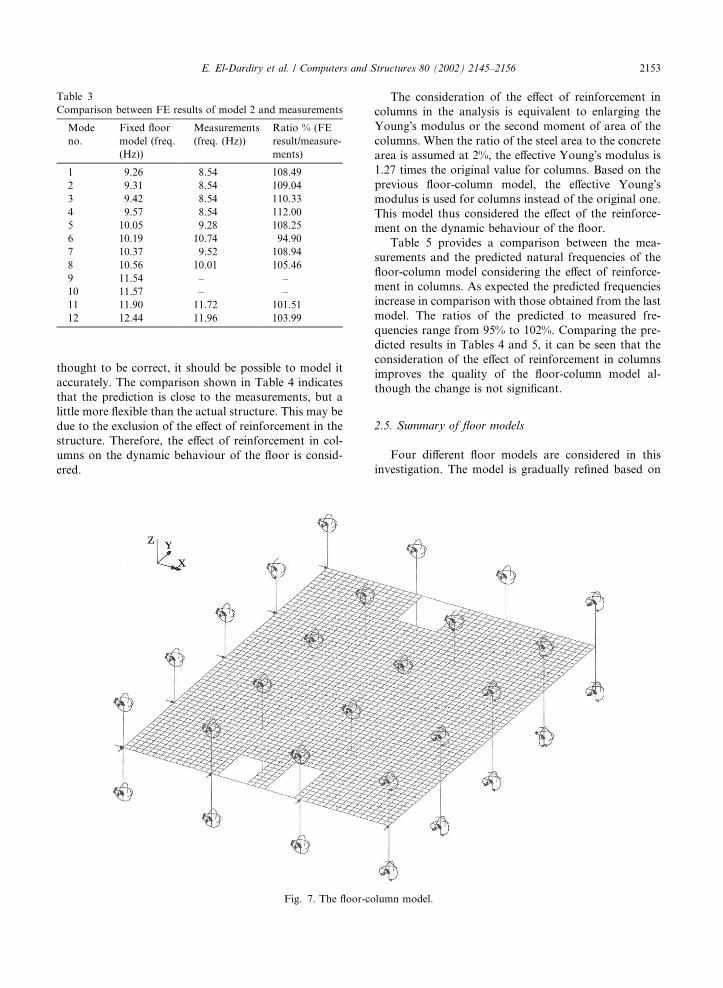
2.3. A floor-column model (model 3)
The floor model with pinned supports is less stiff and
the floor model with fixed supports is stiffer than the
actual floor. This observation indicates that a floor-
column model may be appropriate and this is considered
here.
The floor-column model consists of the flat slab floor
and the full-length columns that connect to the floors
from the upper and lower storeys. The upper and lower
columns have the same height of 3.75 m. The far ends of
the thickness of the floor 25 cm,
the cross-sections of columns 40� 25 cm and
40� 40 cm,
the Young�s modulus 35.5 GPa,
the Poisson ratio 0.20,
the material density 2400 Kg/m3.
Table 2
Comparison between FE results of model 1 and measurements
Mode
no.
Pinned floor
model (freq.
(Hz))
Measure-
ments (freq.
(Hz))
Ratio % (FE
result/measure-
ments)
1 7.12 8.54 83.39
2 7.20 8.54 84.34
3 7.60 8.54 88.95
4 7.70 8.54 90.12
5 7.98 9.28 85.99
6 8.10 10.74 75.42
7 8.75 9.52 91.95
8 8.82 10.01 88.14
9 9.76 – –
10 10.21 – –
11 10.50 11.72 89.55
12 10.94 11.96 91.50
E. El-Dardiry et al. / Computers and Structures 80 (2002) 2145–2156 2151
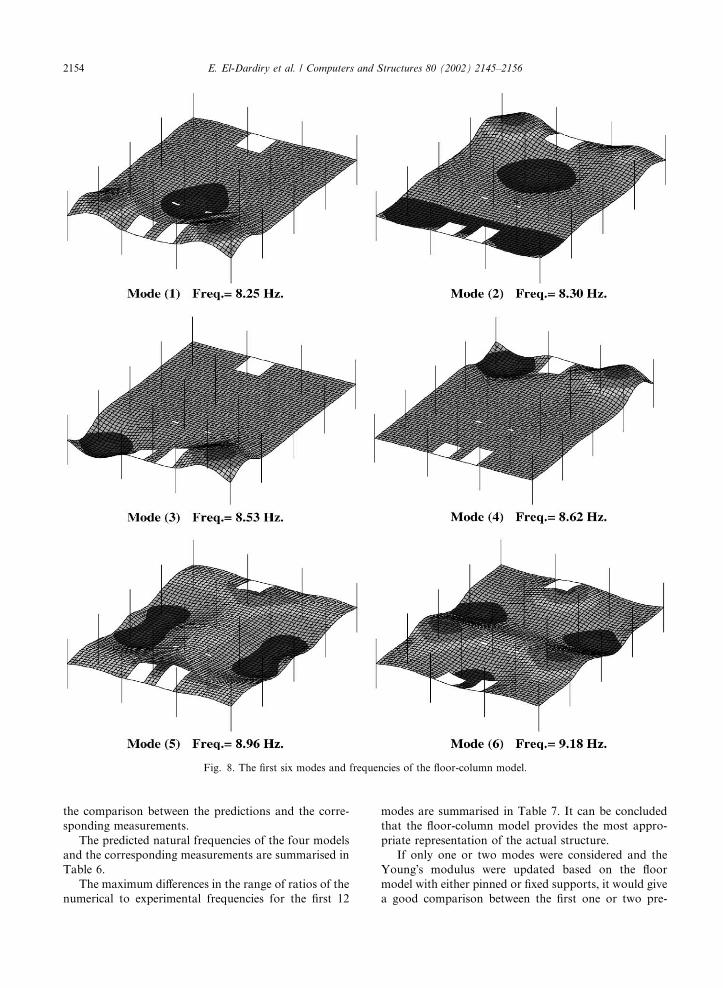
the columns are assumed to be restrained against both
translations and rotations. The model and the boundary
conditions are presented in Fig. 7 and the calculated
natural frequencies and the mode shapes are summar-
ised in Fig. 8.
A comparison between the natural frequencies of the
12 modes extracted from the numerical analysis and the
measurements is given in Table 4.
Table 4 shows that the calculated frequencies are
close to the measured ones. The ratios of the predicted
to experimental results vary from 94% to 101% for the
first 12 modes. The comparison indicates that the floor-
column model is more appropriate than the floor models
with either pinned or fixed supports for studying dy-
namic behaviour of a long-span flat floor supported by
columns.
2.4. A floor-column model considering the effect of
reinforcement in columns (model 4)
Since the flat slab floor supported by columns is a
relatively simple structure and the basic input data are
Fig. 6. The first six modes and frequencies of the floor model with fixed supports.
2152 E. El-Dardiry et al. / Computers and Structures 80 (2002) 2145–2156
thought to be correct, it should be possible to model it
accurately. The comparison shown in Table 4 indicates
that the prediction is close to the measurements, but a
little more flexible than the actual structure. This may be
due to the exclusion of the effect of reinforcement in the
structure. Therefore, the effect of reinforcement in col-
umns on the dynamic behaviour of the floor is consid-
ered.
The consideration of the effect of reinforcement in
columns in the analysis is equivalent to enlarging the
Young�s modulus or the second moment of area of the
columns. When the ratio of the steel area to the concrete
area is assumed at 2%, the effective Young�s modulus is
1.27 times the original value for columns. Based on the
previous floor-column model, the effective Young�smodulus is used for columns instead of the original one.
This model thus considered the effect of the reinforce-
ment on the dynamic behaviour of the floor.
Table 5 provides a comparison between the mea-
surements and the predicted natural frequencies of the
floor-column model considering the effect of reinforce-
ment in columns. As expected the predicted frequencies
increase in comparison with those obtained from the last
model. The ratios of the predicted to measured fre-
quencies range from 95% to 102%. Comparing the pre-
dicted results in Tables 4 and 5, it can be seen that the
consideration of the effect of reinforcement in columns
improves the quality of the floor-column model al-
though the change is not significant.
2.5. Summary of floor models
Four different floor models are considered in this
investigation. The model is gradually refined based on
Fig. 7. The floor-column model.
Table 3
Comparison between FE results of model 2 and measurements
Mode
no.
Fixed floor
model (freq.
(Hz))
Measurements
(freq. (Hz))
Ratio % (FE
result/measure-
ments)
1 9.26 8.54 108.49
2 9.31 8.54 109.04
3 9.42 8.54 110.33
4 9.57 8.54 112.00
5 10.05 9.28 108.25
6 10.19 10.74 94.90
7 10.37 9.52 108.94
8 10.56 10.01 105.46
9 11.54 – –
10 11.57 – –
11 11.90 11.72 101.51
12 12.44 11.96 103.99
E. El-Dardiry et al. / Computers and Structures 80 (2002) 2145–2156 2153
the comparison between the predictions and the corre-
sponding measurements.
The predicted natural frequencies of the four models
and the corresponding measurements are summarised in
Table 6.
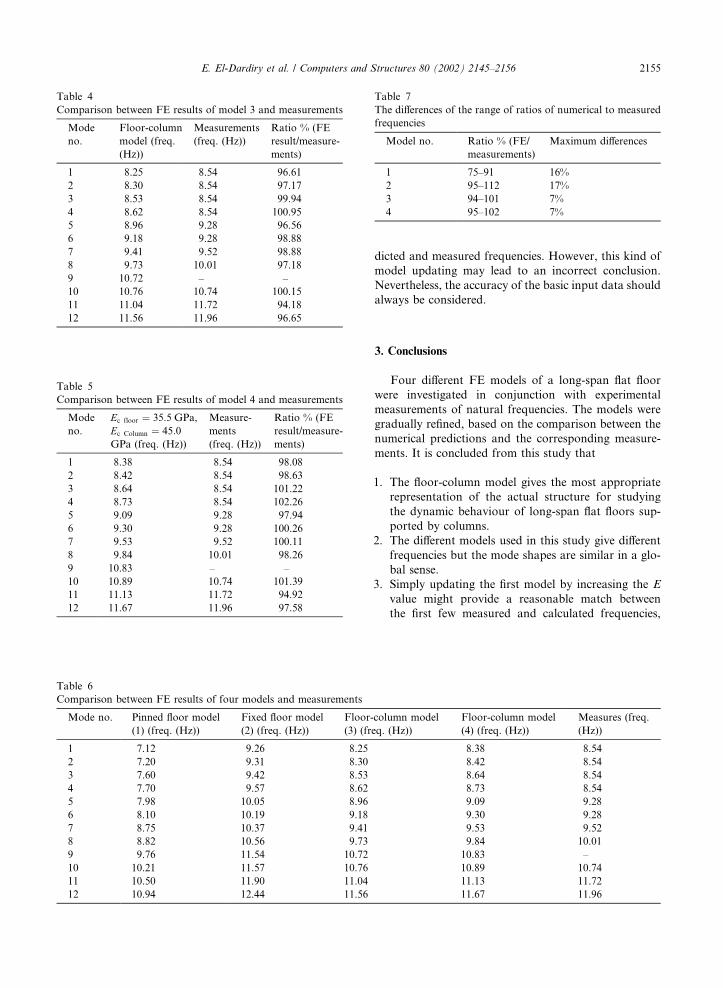
The maximum differences in the range of ratios of the
numerical to experimental frequencies for the first 12
modes are summarised in Table 7. It can be concluded
that the floor-column model provides the most appro-
priate representation of the actual structure.
If only one or two modes were considered and the
Young�s modulus were updated based on the floor
model with either pinned or fixed supports, it would give
a good comparison between the first one or two pre-
Fig. 8. The first six modes and frequencies of the floor-column model.
2154 E. El-Dardiry et al. / Computers and Structures 80 (2002) 2145–2156
dicted and measured frequencies. However, this kind of
model updating may lead to an incorrect conclusion.
Nevertheless, the accuracy of the basic input data should
always be considered.
3. Conclusions
Four different FE models of a long-span flat floor
were investigated in conjunction with experimental
measurements of natural frequencies. The models were
gradually refined, based on the comparison between the
numerical predictions and the corresponding measure-
ments. It is concluded from this study that
1. The floor-column model gives the most appropriate
representation of the actual structure for studying
the dynamic behaviour of long-span flat floors sup-
ported by columns.
2. The different models used in this study give different
frequencies but the mode shapes are similar in a glo-
bal sense.
3. Simply updating the first model by increasing the E
value might provide a reasonable match between
the first few measured and calculated frequencies,
Table 6
Comparison between FE results of four models and measurements
Mode no. Pinned floor model
(1) (freq. (Hz))
Fixed floor model
(2) (freq. (Hz))
Floor-column model
(3) (freq. (Hz))
Floor-column model
(4) (freq. (Hz))
Measures (freq.
(Hz))
1 7.12 9.26 8.25 8.38 8.54
2 7.20 9.31 8.30 8.42 8.54
3 7.60 9.42 8.53 8.64 8.54
4 7.70 9.57 8.62 8.73 8.54
5 7.98 10.05 8.96 9.09 9.28
6 8.10 10.19 9.18 9.30 9.28
7 8.75 10.37 9.41 9.53 9.52
8 8.82 10.56 9.73 9.84 10.01
9 9.76 11.54 10.72 10.83 –
10 10.21 11.57 10.76 10.89 10.74
11 10.50 11.90 11.04 11.13 11.72
12 10.94 12.44 11.56 11.67 11.96
Table 4
Comparison between FE results of model 3 and measurements
Mode
no.
Floor-column
model (freq.
(Hz))
Measurements
(freq. (Hz))
Ratio % (FE
result/measure-
ments)
1 8.25 8.54 96.61
2 8.30 8.54 97.17
3 8.53 8.54 99.94
4 8.62 8.54 100.95
5 8.96 9.28 96.56
6 9.18 9.28 98.88
7 9.41 9.52 98.88
8 9.73 10.01 97.18
9 10.72 – –
10 10.76 10.74 100.15
11 11.04 11.72 94.18
12 11.56 11.96 96.65
Table 5
Comparison between FE results of model 4 and measurements
Mode
no.
Ec floor ¼ 35:5 GPa,
Ec Column ¼ 45:0
GPa (freq. (Hz))
Measure-
ments
(freq. (Hz))
Ratio % (FE
result/measure-
ments)
1 8.38 8.54 98.08
2 8.42 8.54 98.63
3 8.64 8.54 101.22
4 8.73 8.54 102.26
5 9.09 9.28 97.94
6 9.30 9.28 100.26
7 9.53 9.52 100.11
8 9.84 10.01 98.26
9 10.83 – –
10 10.89 10.74 101.39
11 11.13 11.72 94.92
12 11.67 11.96 97.58
Table 7
The differences of the range of ratios of numerical to measured
frequencies
Model no. Ratio % (FE/
measurements)
Maximum differences
1 75–91 16%
2 95–112 17%
3 94–101 7%
4 95–102 7%
E. El-Dardiry et al. / Computers and Structures 80 (2002) 2145–2156 2155
but this could fail to model the whole system cor-
rectly.
The experimental data were obtained quickly using a
simple test scheme that could be used on a wide range of
structures. However the measurements provided ade-
quate information for the purposes of this project.
References
[1] Allen JD. Reengineering the design and construction
process. Struct Eng 1998;76(9):175–9.
[2] Ellis BR, Ji T. Dynamic testing and numerical modelling of
the Cardington steel framed building from construction to
completion. Struct Eng 1996;74(11):186–92.
[3] Reynolds P, Pavic A, Waldron P. Model testing, FE analysis
and FE model correlation of a 600 tonne post-tensioned
concrete floor, 23rd International Seminar on Model Anal-
ysis (ISMA 23), vol. 3, p. 1129–1136. Leuven, Belgium, 1998.
[4] Petyt M, Mirza WH. Vibration of columns-supported floor
slabs. J Sound Vib 1972;21(3):335–64.
[5] Zhou D, Cheung YK. Free vibration of line supported
rectangular plates using a set of static beam functions.
J Sound Vib 1999;223(2):231–45.
[6] FEA Ltd., LUSAS User Manual. Kingston-upon-Thames,
1993.
2156 E. El-Dardiry et al. / Computers and Structures 80 (2002) 2145–2156
Related Documents