International Journal of Medical Informatics 51 (1998) 1 – 11 Improving clinical pathway design: lessons learned from a computerised prototype Stephen Chu *, Branko Cesnik Centre of Medical Informatics, Faculty of Medicine, Monash Uni6ersity, Peninsula Campus, McMahons Road, Frankston, Victoria 3199, Australia Received 9 September 1997; received in revised form 9 November 1997; accepted 20 December 1997 Abstract Increasing costs of health care, fuelled by demand for high quality, cost-efficient health care has propelled hospitals to restructure their patient care delivery systems. One such effort is the adaptation of an engineering project management methodology, the critical path method (CPM), as a tool to organise, standardise and improve the quality of healthcare delivery and hence patient outcomes [1]. However, the two-dimensional nature and the size of paper impose severe limitations on the manual clinical pathways currently in use by hospitals. This paper analyses these inherent limitations and discusses some of the problems encountered in an attempt in early 1996 to create an electronic care map planner (CMP) based on the precedence diagramming method (PDM) model. It also reports on a current project to create a computerised clinical pathway tool to resolve the identified problems. © 1998 Elsevier Science Ireland Ltd. All rights reserved. Keywords: Clinical pathways; Clinical protocols; Critical path method; Decision support; Patient care modelling 1. Introduction Since the 1980s, the health care industry borrowed the engineering project manage- ment technique of critical path and developed the clinical pathways as a tool to organise and better standardise patient care delivery. Such a tool has been widely used in acute care units, ambulatory care departments and community care areas in North America. It has also been developed and implemented in many acute care institutions in Australia. Despite the much reported advantages, cer- tain deficiencies of manual clinical pathways has imposed significant limitations to the ef- fectiveness of this tool. The size of paper medium on which manual clinical pathways * Corresponding author. Tel.: +61 3 99044694; fax: +61 3 99044010. 1386-5056/98/$19.00 © 1998 Elsevier Science Ireland Ltd. All rights reserved. PII S1386-5056(98)00003-3

Welcome message from author
This document is posted to help you gain knowledge. Please leave a comment to let me know what you think about it! Share it to your friends and learn new things together.
Transcript
International Journal of Medical Informatics 51 (1998) 1–11
Improving clinical pathway design: lessons learned from acomputerised prototype
Stephen Chu *, Branko Cesnik
Centre of Medical Informatics, Faculty of Medicine, Monash Uni6ersity, Peninsula Campus, McMahons Road, Frankston,Victoria 3199, Australia
Received 9 September 1997; received in revised form 9 November 1997; accepted 20 December 1997
Abstract
Increasing costs of health care, fuelled by demand for high quality, cost-efficient health care has propelled hospitalsto restructure their patient care delivery systems. One such effort is the adaptation of an engineering projectmanagement methodology, the critical path method (CPM), as a tool to organise, standardise and improve the qualityof healthcare delivery and hence patient outcomes [1]. However, the two-dimensional nature and the size of paperimpose severe limitations on the manual clinical pathways currently in use by hospitals. This paper analyses theseinherent limitations and discusses some of the problems encountered in an attempt in early 1996 to create anelectronic care map planner (CMP) based on the precedence diagramming method (PDM) model. It also reports ona current project to create a computerised clinical pathway tool to resolve the identified problems. © 1998 ElsevierScience Ireland Ltd. All rights reserved.
Keywords: Clinical pathways; Clinical protocols; Critical path method; Decision support; Patient care modelling
1. Introduction
Since the 1980s, the health care industryborrowed the engineering project manage-ment technique of critical path and developedthe clinical pathways as a tool to organiseand better standardise patient care delivery.
Such a tool has been widely used in acutecare units, ambulatory care departments andcommunity care areas in North America. Ithas also been developed and implemented inmany acute care institutions in Australia.
Despite the much reported advantages, cer-tain deficiencies of manual clinical pathwayshas imposed significant limitations to the ef-fectiveness of this tool. The size of papermedium on which manual clinical pathways
* Corresponding author. Tel.: +61 3 99044694; fax: +61 399044010.
1386-5056/98/$19.00 © 1998 Elsevier Science Ireland Ltd. All rights reserved.
PII S1386-5056(98)00003-3
S. Chu, B. Cesnik / International Journal of Medical Informatics 51 (1998) 1–112
are printed severely limits the amount ofinformation that can be carried or docu-mented on this tool. This limitation renders itunsuitable to function as the patient’s recordof notes. The two-dimensional characteristicof the paper medium prevents effective link-age of patient’s health problems, plannedoutcome targets, care activities carried outand assessment results to form meaningfulsets of clinical information. Due to the recita-tory nature of the paper medium, it is ex-tremely difficult for manual clinical pathwaysto present trending information reflectingchanging patient states. It is the inter-related-ness of these data sets reflecting changingpatient clinical status that form powerful in-formation for clinical decision support. In-deed, the manual critical path method (CPM)alone had been criticised as being of limitedvalue in improving performance and quality[2].
The intent of this paper is to explore theuse of a three-dimensional approach in com-puterised clinical pathway design to improvesome of the inherent deficiencies of manualclinical pathways. While the computerisedapproach is aimed at providing the trendingfunctionality to facilitate mapping of patientstate transition, the third dimension isplanned to establish the crucial link betweenpatient problems, planned outcome targetsand changing patient status.
2. CPMs and clinical pathways concepts
CPMs are used to aid the management ofengineering or production projects. They in-volve both a graphical representation of in-ter-relationships among the elements of aproject and an arithmetic procedure whichidentifies the relative importance of each ele-ment in the overall schedule. These tools areuseful for:
� Identifying and visually representing agood/workable plan of activities that makeup the project, including a specification oftheir inter-relationship.
� Scheduling these activities in an acceptabletime span, taking into account the man-power and other resources required tocarry out the planned activities as theyprogress in time.
� Monitoring the expenditure of time andmoney in carrying out the scheduledactivities.The Gantt bar chart and the Pert network
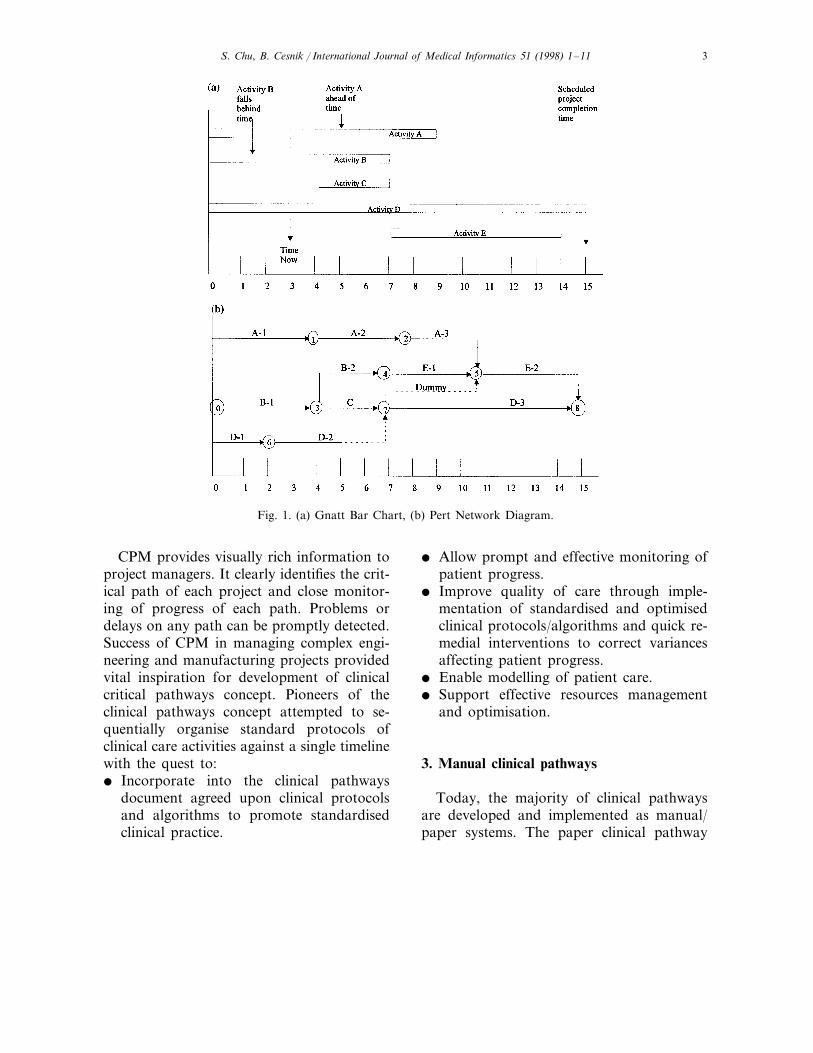
diagram [3] have emerged as the most com-monly used CPM tools (Fig. 1) in projectmanagement. The bar chart is essentially agraphical procedure. It is easy to set up butdoes not show explicitly the dependency rela-tionships among the activities. Hence, it isdifficult to impute the effects of individualactivity delays on project completion. Thenetwork based method shows the dependencyrelationship among the project activities us-ing the simple logic that all activities preced-ing a given activity must be completed beforethe given activity may begin.
In Fig. 1b, activities are presented as eithersolid arrows or arrows with last portion ofline dashed. Based on estimated activity du-ration times, the dashed lined arrows denoteactivities that could be completed prior to theoccurrence time of their succeeding events(activities A-3; D-2; E-2). Hence, the pathsalong which these activities lie are known asslack paths, or paths with float time. Thesepaths require less time to complete than thetime allowed for them. By contrast, activitiesB-1; C; and D-3 have no dashed portion onthe arrows. The sum of expected completiontime for these tasks equals the time allowedfor them. This path is referred to as thecritical path. It is the longest path throughthe network.
S. Chu, B. Cesnik / International Journal of Medical Informatics 51 (1998) 1–11 3
Fig. 1. (a) Gnatt Bar Chart, (b) Pert Network Diagram.
CPM provides visually rich information toproject managers. It clearly identifies the crit-ical path of each project and close monitor-ing of progress of each path. Problems ordelays on any path can be promptly detected.Success of CPM in managing complex engi-neering and manufacturing projects providedvital inspiration for development of clinicalcritical pathways concept. Pioneers of theclinical pathways concept attempted to se-quentially organise standard protocols ofclinical care activities against a single timelinewith the quest to:� Incorporate into the clinical pathways
document agreed upon clinical protocolsand algorithms to promote standardisedclinical practice.
� Allow prompt and effective monitoring ofpatient progress.
� Improve quality of care through imple-mentation of standardised and optimisedclinical protocols/algorithms and quick re-medial interventions to correct variancesaffecting patient progress.
� Enable modelling of patient care.� Support effective resources management
and optimisation.
3. Manual clinical pathways
Today, the majority of clinical pathwaysare developed and implemented as manual/paper systems. The paper clinical pathway
S. Chu, B. Cesnik / International Journal of Medical Informatics 51 (1998) 1–114
systems do not implement Gantt bar chart orPert network diagram methods. Instead, theyare built on the premise that patient manage-ment (project) for a particular patient/diag-nostic type comprises a number of atomiccare activities or interventions. These careactivities can be spread across a predeter-mined timeline which is the average length ofstay (LOS) for that diagnostic type. Thus, theclinical pathway document contains lists ofkey standardised interventions displayedacross a daily timeline. Desirable outcometargets may or may not be incorporated inthe same document. Most paper clinicalpathways do include designated spaces forvariances documentation.
Manual clinical pathways are most oftenprinted on A4 sized paper and occasionallyon A3 paper. The limited paper real estaterestricts amount of data that can be recordedon it. Details of patient assessments (includ-ing observation results) and subsequent ad-justments in patient management details, arerecorded on separate charts. No physicallinkage exists between data recorded on dif-ferent paper charts. Paper systems are typi-cally recitatory (data in and data out) innature. Extracting relevant clinical data tobuild accurate trending information about apatient’s condition requires extensive manualprocessing through many paper charts andsynthesis of extracted data by clinicians tobuild the relevant information. Retrospectiveauditing of care activities to determine out-comes and whether certain clinical protocolshave been followed is also extremely labourintensive.
Implementing the principles of CPMs toclinical care in managing a patient’s healthproblems involves managing a number ofinter-dependent clinical paths. While a clini-cal path deals with one specific clinical prob-lem, it can be inter-related to and/orinter-dependent on the progress of other
paths. For example, care of a patient withacute myocardial infarction (AMI) may in-volve a number of clinical paths includingangina/infarct management, haemodynamicstabilisation and management, cardiac dys-rhythmia management, cardiac rehabilitationand discharge planning paths, etc. Currentpaper documents merge all paths into a sim-plified task list. Individual paths are notmodelled and displayed on paper documents,let alone the inter-dependency relations be-tween different paths.
Although paper clinical pathways havebeen hailed as a success in streamlining thepatient management processes, their deficien-cies have severely limited their usefulness as adecision support tool. The two-dimensionalcharacteristic, recitatory nature and smallsurface area of the paper system severelycurtails the extent to which manual clinicalpathways can be improved upon and hencethe possibility to address the deficiencies.
4. Computerised clinical pathways
One possible solution to overcome prob-lems related to the paper-based system is toredesign the current clinical pathway con-cepts for implementation as computerisedclinical pathways. Effective information pro-cessing and decision support capability, scrol-lable and multiple screen features andimproved accessibility of computerised sys-tems provide the crucial functionality to helpovercome inherent defects of paper clinicalpathways.
4.1. What benefits does it offer?
For a computerised clinical pathways sys-tem to be useful as a clinical decision supporttool, it must offer certain crucial features andbenefits, it should:
S. Chu, B. Cesnik / International Journal of Medical Informatics 51 (1998) 1–11 5
� Provide rapid prototyping capability: itmust provide intuitive and easy to use toolsets to support quick modelling of clinicalpathways design and incorporation ofstandard clinical protocols into the elec-tronic system.
� Provide quick feedback to expert cliniciansand project officers for speedy revision ofany clinical pathway designs.
� Support iterative, preventive patient man-agement: it must provide clinicians withaccurate and speedy clinical trending andearly alert information. Such informationwill be crucial for facilitating accurate andeffective clinical decision making and earlymicro management of patient.
� Be self documenting: this feature aims atproviding an automated audit of when andthe circumstances under which, certainclinical care activity deviates from thestandard clinical protocols, together withthe associated outcomes. It provides im-portant information for future re-mod-elling of clinical pathway designs.
4.2. The current status
Before embarking upon a computerisationeffort, the authors undertook a review pro-cess to examine all computerised clinicalpathway systems on display at the 1995 Inter-national Medical Informatics Conference andthe Australian Health Informatics Confer-ence. Visits to hospitals and meetings withsystems designers/informaticians in Australiawas also conducted in addition to an exten-sive literature search on the computerisedclinical pathways efforts. Two publicationson this area were identified [4,5].
These activities revealed that the reviewedproducts were basically electronic clones ofpaper documents with different levels of cus-tomisation to suit individual hospitals. Someof them provided the capability of ordering
interventions and reviewing tests results.Many of the deficiencies of paper clinicalpathways, however, remained unresolved.The Institute of Medicine had criticised that‘‘merely automating current paper recordswill perpetuate their deficiencies and will notbe sufficient to satisfy emerging user de-mands’’ [6].
An examination of off-the-shelf projectmanagement tools such as Microsoft Projectfor its suitability as a clinical pathways imple-mentation tool was also carried out. Al-though it has the ability to organise/sequencepatient care activities and track resources re-quired for implementation of the scheduledcare activities, it is similar in every otheraspects to paper Gantt bar chart or Pertnetwork diagramming methods. Defects ofthe two-dimensional characteristic of paperstill persist with such tools.
These problems prompted the Clinical In-formation Systems (CIS) research team inlate 1995 to search for better methods andtechnology to design a robust electronic clini-cal pathway tool. It was determined that inaddition to benefits identified in the previoussection, this tool should possess extra fea-tures to:� Support hospitals to design, develop and
customise hospital-, clinical-unit-, clini-cian- and patient-specific clinicalpathways.
� Function as record of notes (documenta-tion of all clinical care activities as per caremap).
� Display clear inter-dependencies betweenrelated clinical paths.
� Provide trending information to supportclinical decision making.The immediate challenge created was to
identify a methodology for representinggroups of care events as networks whichcould be manipulated and re-organised onscreen into inter-related paths of care. The
S. Chu, B. Cesnik / International Journal of Medical Informatics 51 (1998) 1–116
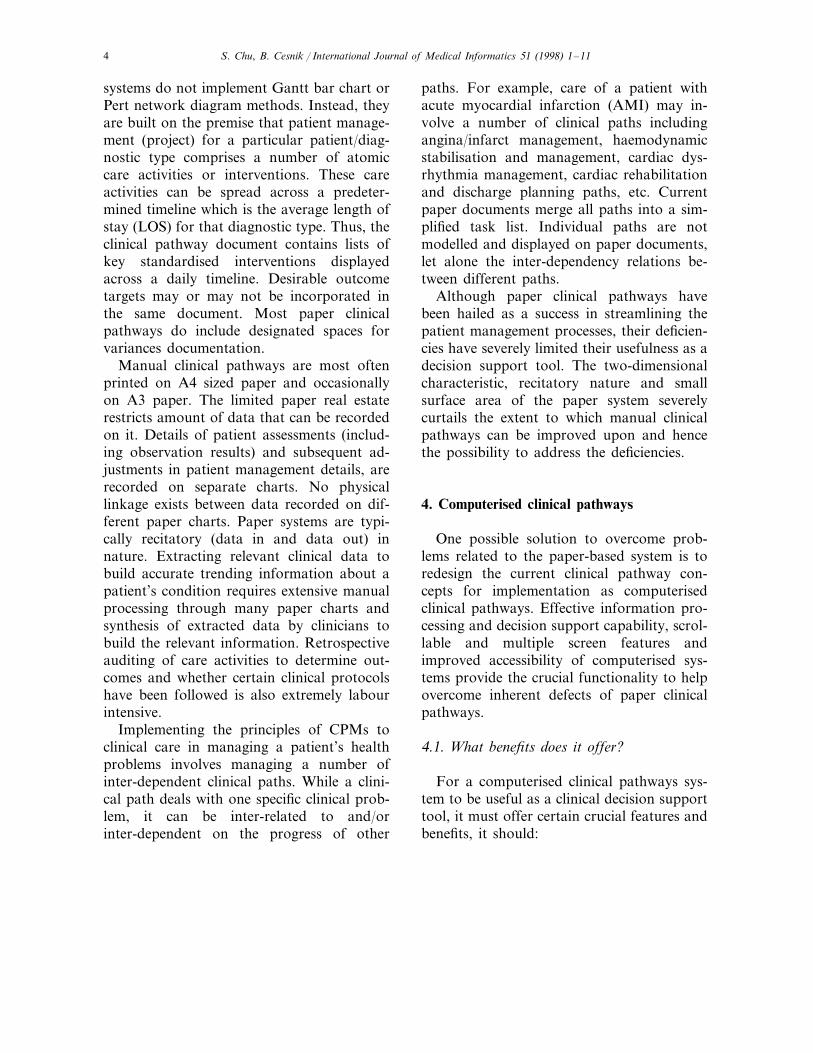
Fig. 2. Precedence diagram.
CIS team elected to use the precedence dia-gramming method (PDM) to model andbuild the electronic care map planner (CMP)prototype.
5. PDM
The PDM, with its activity-on-node net-work and precedence relationships represen-tation method, offers an easy and flexibleapproach to model large projects [7,8]. InPDM, activities are shown as nodes ratherthan arrows and precedence relationships areindicated by arrows connecting nodes. Thefinish-to-start (FS) relationship in PERT net-works, where a successor task (e.g. throm-bolytic therapy) cannot begin unless itspredecessor (e.g. bleeding/clotting indicestests) has been completed, is augmented bytwo additional relationships (the finish-to-finish (FF) and start-to-start (SS) constraints(Fig. 2). The finish-to-finish relationship dic-tates that two tasks (e.g. Task 3 and Task 6in Fig. 2) must complete within the allowedlag time (4 days in this case). For example,the finish if intravenous infusion must lagbehind the finish of intravenous cytotoxicdrug administration by 2 h. The start-to-startconstraint allows two tasks to start simulta-neously, or start one after another within the
specified lag time. For example, Heparinstarted concurrently with alteplase in AMImanagement.
In early 1996 a CMP prototype was de-signed and built based on the PDM model.The CIS team used PDM as the modellingtechnique for a number of reasons:� The model allowed identified care events/
activities to be organised into networks ofinter-related clinical paths.
� Precedence constraints could be easily im-plemented on individual nodes of careevent.
� Lead-lag time could be specified allowingeasy identification of critical clinicalpath(s).The CMP prototype was intended as an
electronic tool for hospitals to implementtheir own computerised clinical pathways.
On paper clinical pathways, patient careactivities or interventions are organised intogroups such as assessment; treatments; speci-mens/tests; medications; hygiene; education.Progression of a patient along the timeline isreflected by changes to interventions given tothe patient. For example, in the case of AMImanagement, the Medication group of careactivities specifies that a patient will receivedrug treatments including, analgesics, vaso-dilators, anticoagulant therapy or throm-bolytic therapy, beta blockers, etc. As time
S. Chu, B. Cesnik / International Journal of Medical Informatics 51 (1998) 1–11 7
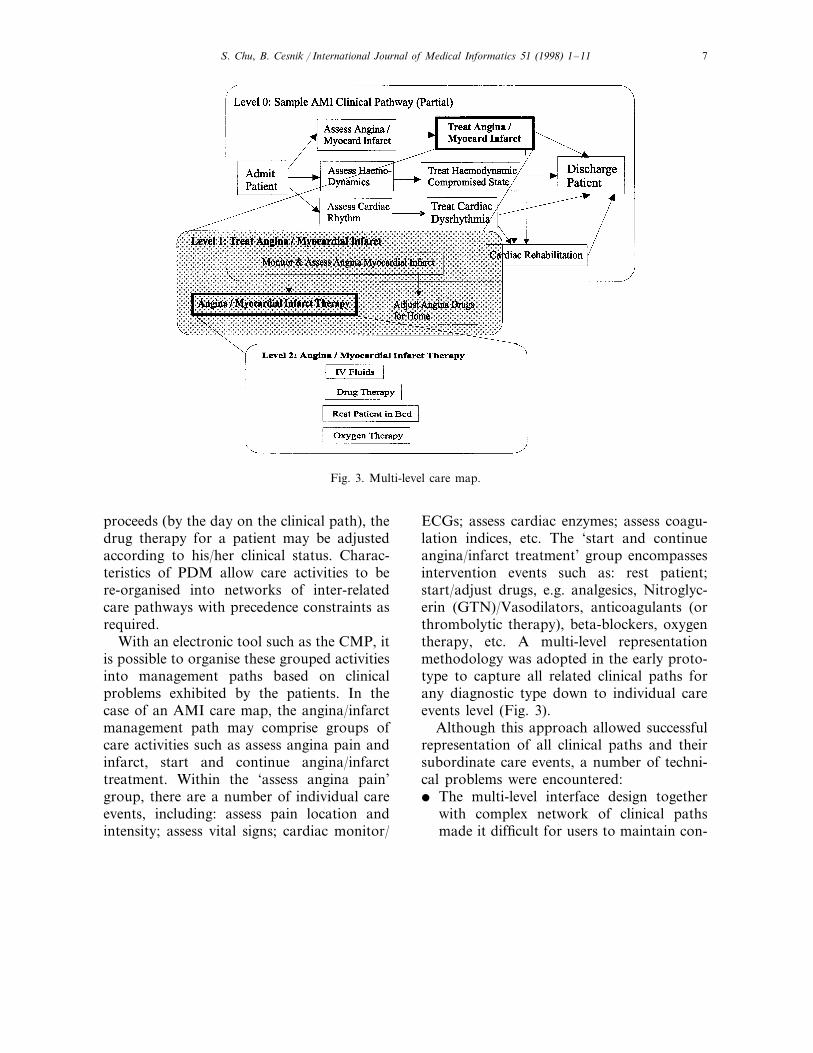
Fig. 3. Multi-level care map.
proceeds (by the day on the clinical path), thedrug therapy for a patient may be adjustedaccording to his/her clinical status. Charac-teristics of PDM allow care activities to bere-organised into networks of inter-relatedcare pathways with precedence constraints asrequired.
With an electronic tool such as the CMP, itis possible to organise these grouped activitiesinto management paths based on clinicalproblems exhibited by the patients. In thecase of an AMI care map, the angina/infarctmanagement path may comprise groups ofcare activities such as assess angina pain andinfarct, start and continue angina/infarcttreatment. Within the ‘assess angina pain’group, there are a number of individual careevents, including: assess pain location andintensity; assess vital signs; cardiac monitor/
ECGs; assess cardiac enzymes; assess coagu-lation indices, etc. The ‘start and continueangina/infarct treatment’ group encompassesintervention events such as: rest patient;start/adjust drugs, e.g. analgesics, Nitroglyc-erin (GTN)/Vasodilators, anticoagulants (orthrombolytic therapy), beta-blockers, oxygentherapy, etc. A multi-level representationmethodology was adopted in the early proto-type to capture all related clinical paths forany diagnostic type down to individual careevents level (Fig. 3).
Although this approach allowed successfulrepresentation of all clinical paths and theirsubordinate care events, a number of techni-cal problems were encountered:� The multi-level interface design together
with complex network of clinical pathsmade it difficult for users to maintain con-
S. Chu, B. Cesnik / International Journal of Medical Informatics 51 (1998) 1–118
textual orientation. This problem was uni-formly reflected by all clinicians participat-ing in Stage 1 of the research project.Details of this interface design problemwill be reported in a separate paper.
� Each care event could precede or followother event(s). The precedence relationshipcould traverse different levels within sameor different care paths. It proved to beextremely difficult, if not impossible, toprogrammatically implement such crosslevel visual links representing all prece-dence constraints.
� It was also very difficult to visually repre-sent planned and actual outcomes andtheir relationships to individual care eventswithout further cluttering the screen.
6. The reconceptualised clinical pathwayssystem design
To address the problems stated in the pre-vious section of this paper, the computerisedclinical pathway system was conceptually re-developed. A number of previously usedstrategies were abandoned and a new ap-proach adopted.
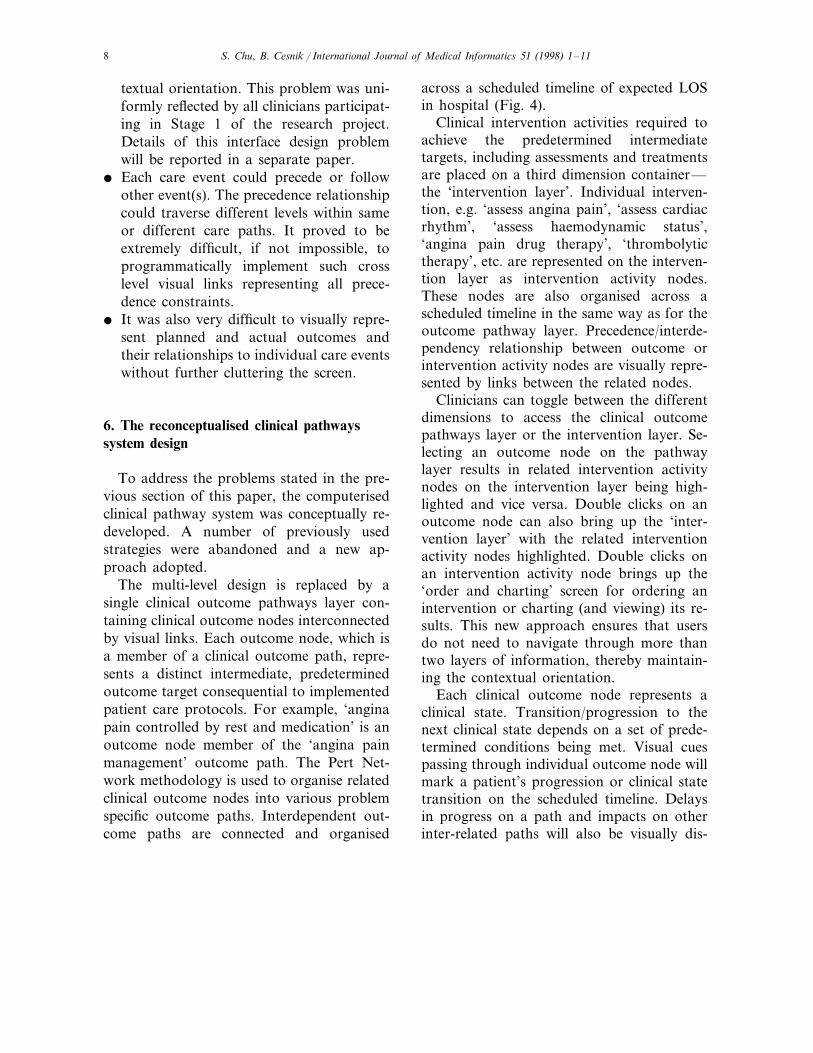
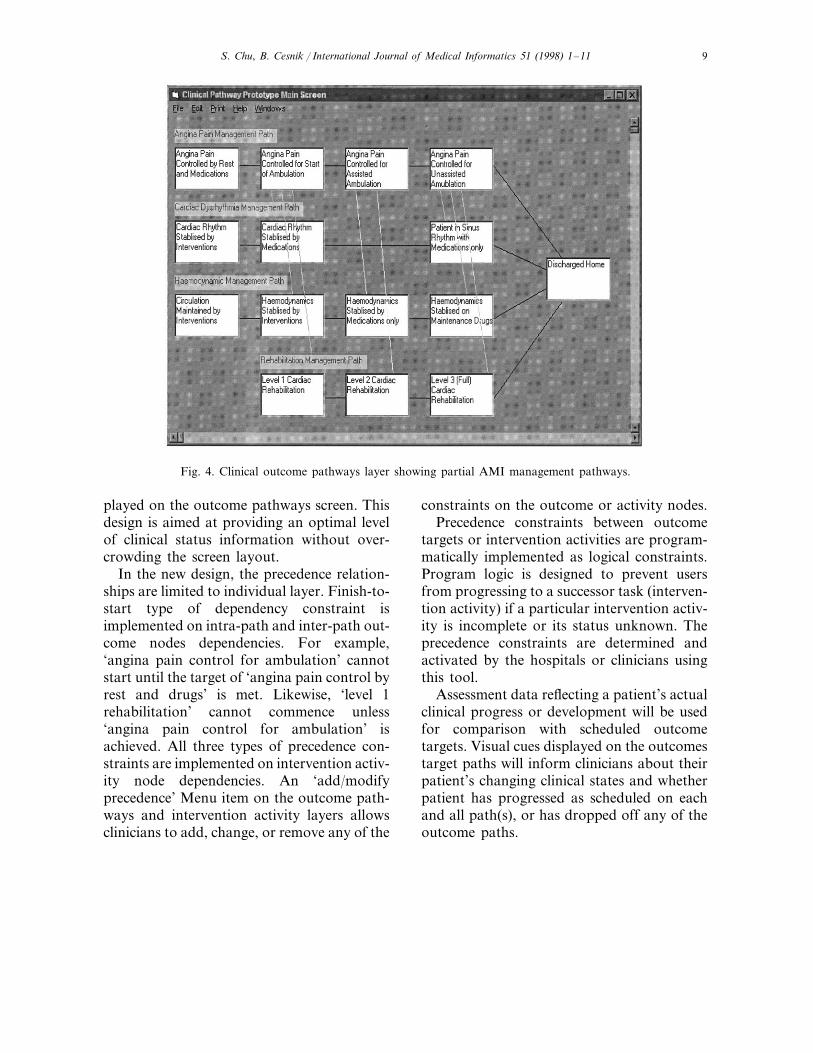
The multi-level design is replaced by asingle clinical outcome pathways layer con-taining clinical outcome nodes interconnectedby visual links. Each outcome node, which isa member of a clinical outcome path, repre-sents a distinct intermediate, predeterminedoutcome target consequential to implementedpatient care protocols. For example, ‘anginapain controlled by rest and medication’ is anoutcome node member of the ‘angina painmanagement’ outcome path. The Pert Net-work methodology is used to organise relatedclinical outcome nodes into various problemspecific outcome paths. Interdependent out-come paths are connected and organised
across a scheduled timeline of expected LOSin hospital (Fig. 4).
Clinical intervention activities required toachieve the predetermined intermediatetargets, including assessments and treatmentsare placed on a third dimension container—the ‘intervention layer’. Individual interven-tion, e.g. ‘assess angina pain’, ‘assess cardiacrhythm’, ‘assess haemodynamic status’,‘angina pain drug therapy’, ‘thrombolytictherapy’, etc. are represented on the interven-tion layer as intervention activity nodes.These nodes are also organised across ascheduled timeline in the same way as for theoutcome pathway layer. Precedence/interde-pendency relationship between outcome orintervention activity nodes are visually repre-sented by links between the related nodes.
Clinicians can toggle between the differentdimensions to access the clinical outcomepathways layer or the intervention layer. Se-lecting an outcome node on the pathwaylayer results in related intervention activitynodes on the intervention layer being high-lighted and vice versa. Double clicks on anoutcome node can also bring up the ‘inter-vention layer’ with the related interventionactivity nodes highlighted. Double clicks onan intervention activity node brings up the‘order and charting’ screen for ordering anintervention or charting (and viewing) its re-sults. This new approach ensures that usersdo not need to navigate through more thantwo layers of information, thereby maintain-ing the contextual orientation.
Each clinical outcome node represents aclinical state. Transition/progression to thenext clinical state depends on a set of prede-termined conditions being met. Visual cuespassing through individual outcome node willmark a patient’s progression or clinical statetransition on the scheduled timeline. Delaysin progress on a path and impacts on otherinter-related paths will also be visually dis-
S. Chu, B. Cesnik / International Journal of Medical Informatics 51 (1998) 1–11 9
Fig. 4. Clinical outcome pathways layer showing partial AMI management pathways.
played on the outcome pathways screen. Thisdesign is aimed at providing an optimal levelof clinical status information without over-crowding the screen layout.
In the new design, the precedence relation-ships are limited to individual layer. Finish-to-start type of dependency constraint isimplemented on intra-path and inter-path out-come nodes dependencies. For example,‘angina pain control for ambulation’ cannotstart until the target of ‘angina pain control byrest and drugs’ is met. Likewise, ‘level 1rehabilitation’ cannot commence unless‘angina pain control for ambulation’ isachieved. All three types of precedence con-straints are implemented on intervention activ-ity node dependencies. An ‘add/modifyprecedence’ Menu item on the outcome path-ways and intervention activity layers allowsclinicians to add, change, or remove any of the
constraints on the outcome or activity nodes.Precedence constraints between outcome
targets or intervention activities are program-matically implemented as logical constraints.Program logic is designed to prevent usersfrom progressing to a successor task (interven-tion activity) if a particular intervention activ-ity is incomplete or its status unknown. Theprecedence constraints are determined andactivated by the hospitals or clinicians usingthis tool.
Assessment data reflecting a patient’s actualclinical progress or development will be usedfor comparison with scheduled outcometargets. Visual cues displayed on the outcomestarget paths will inform clinicians about theirpatient’s changing clinical states and whetherpatient has progressed as scheduled on eachand all path(s), or has dropped off any of theoutcome paths.
S. Chu, B. Cesnik / International Journal of Medical Informatics 51 (1998) 1–1110
At the time of writing, this re-conceptu-alised design is still in the development phase.Technical and functional problems are yet tobe identified through vigorous testing at alater stage. However, the concept appears tohave been accepted by clinicians participatingin earlier interviews. Users’ reactions to thetwo designs will be further gauged in the nextphase of the project when there will be testingof the new prototype and comparison madeto the earlier design.
7. Further work
For the computerised clinical pathways tobecome an integral part of CIS, it must beable to provide decision support functional-ity, not merely serve as a record of notes.Assessment-intervention-outcome relation-ships form a continuous cycle of patient man-agement activities. Data documenting eachactivity reflects a snap-shot of a patient’sclinical state at a specific point in time. Disre-garding whether the documentation tool is anelectronic or a paper system, such data oftenappear as discrete data store. Connections donot exist in currently available systems to linkthe discrete nodes of data into a continuouschain of meaningful information. This chainof information will resemble a movie scriptwith successive nodes of information reflect-ing changing patient clinical state (state-tran-sition) against scheduled timeline of clinicalcare. Such clinical state-transition (trending)information, if available to clinicians, will bean extremely useful clinical decision supporttool.
In actual practice, clinical data generatedfrom each of the assessment, intervention,outcome evaluation (assessment) activities areoften documented as discrete chunks. It isnot a common practice of clinicians to explic-itly identify links between different chunks of
data they capture. Certain techniques are re-quired to automate this data linking processand to organise interventions and assessmentdata into meaningful and inter-related setsthat can then be compared with the pre-setoutcome targets.
A state-transition model will be imple-mented to support automated creation of acontinuous data chain from discrete chunksof clinical data to reflect a patient’s changingclinical state. A focus of the current stage ofresearch is to investigate how such model canbe utilised to facilitate/implement the auto-mated creation of a continuous data chainand to demonstrate successive clinical statetransition. It is relatively trivial to implementvisual links between inter-dependent outcomepaths because they all exist on a single levelof screen layout. However, further work isrequired to determine reliable and efficientprogram logic/techniques for implementinglogical links between assessment-interventiondata and all outcome paths and to accuratelymap inter-dependencies between differentoutcome targets paths as clinical data setschange.
8. Conclusion
Research work and prototype developmentcompleted so far on computerised clinicalpathways revealed a number of problems re-lated to the use of PDM model and multi-level care activities presentation in userinterface design. These problems led to are-conceptualisation and re-design of the clin-ical pathway prototype. Informaticians andclinicians interviewed so far expressed posi-tive responses toward a single level outcometargets path network diagram with interven-tion activities compartmentalised in a thirddimension to be presented as pop-up displayson demand.
S. Chu, B. Cesnik / International Journal of Medical Informatics 51 (1998) 1–11 11
Further work is required to identify tech-niques to implement logical links for map-ping inter-dependent relationships betweendifferent outcome paths. The effectiveness ofthis new prototype as a clinical decision sup-port tool will be tested in next phase of theresearch project.
Acknowledgements
This paper reports on the backgroundwork of Stephen Chu’s PhD project at theCentre of Medical Informatics, Monash Uni-versity. The PhD project is a re-conceptuali-sation and extension of a concluded CISresearch project previously based at VictoriaUniversity of Technology. The authors wouldlike to thank Mr James Thom, Ms LesleyMcCrann and Mr Peter Summers for theirvaluable input that assisted in completion ofthe early prototype. This foundation workimpacts significantly on the re-conceptualisa-tion and design of the current ComputerisedClinical Pathways project.
References
[1] D.B. Pyor, D.F. Fortin, Managing the delivery ofhealth care: Care plans/managed care/practiceguidelines, Int. J. Bio-Med. Comput. 39 (1) (1995)105–109.
[2] R.J. Lutterman, The critical path method alonedoes nothing to improve performance, Qual. Rev.Bull. 5 (1993) 142 Letter.
[3] S.A. Suhail, R.H. Neale, CPM/LOB: New method-ology to integrate CPM and line of balance, J.Constr. Eng. Manage. 120 (3) (1994) 667–684.
[4] L. DiJerome, The nursing care management com-puterized system: Meeting the challenge of healthcare delivery through technology, Comput. Nurs. 10(6) (1992) 250–258.
[5] S. Tidwell, A graphic tool for tracking variancesand comorbidities in cardiac surgery case manage-ment, Prog. Cardiovasc. Nurs. 8 (2) (1993) 6–19.
[6] R.S. Dick, E.B. Steen (Eds.), The Computer-BasedPatient Record. Institute of Medicine Committee onImproving Patient Records, National AcademyPress, Washington DC, 1991.
[7] K. Crandall, Project planning with precedence lead-lag factors, Proj. Manage. Q. 4 (3) (1973) 243–258.
[8] J.D. Wiest, Precedence diagramming method: Someunusual characteristics and their implications forproject managers, J. Oper. Manage. 1 (3) (1981)121–130.
..
Related Documents