ORIGINAL ARTICLE Improving alloreactive CTL immunotherapy for malignant gliomas using a simulation model of their interactive dynamics Natalie Kronik Yuri Kogan Vladimir Vainstein Zvia Agur Received: 2 May 2007 / Accepted: 7 August 2007 Ó Springer-Verlag 2007 Abstract Glioblastoma (GBM), a highly aggressive (WHO grade IV) primary brain tumor, is refractory to traditional treatments, such as surgery, radiation or che- motherapy. This study aims at aiding in the design of more efficacious GBM therapies. We constructed a mathematical model for glioma and the immune system interactions, that may ensue upon direct intra-tumoral administration of ex vivo activated alloreactive cytotoxic-T-lymphocytes (aCTL). Our model encompasses considerations of the interactive dynamics of aCTL, tumor cells, major histo- compatibility complex (MHC) class I and MHC class II molecules, as well as cytokines, such as TGF-b and IFN-c, which dampen or increase the pro-inflammatory environ- ment, respectively. Computer simulations were used for model verification and for retrieving putative treatment scenarios. The mathematical model successfully retrieved clinical trial results of efficacious aCTL immunotherapy for recurrent anaplastic oligodendroglioma and anaplastic astrocytoma (WHO grade III). It predicted that cellular adoptive immunotherapy failed in GBM because the administered dose was 20-fold lower than required for therapeutic efficacy. Model analysis suggests that GBM may be eradicated by new dose-intensive strategies, e.g., 3 · 10 8 aCTL every 4 days for small tumor burden, or 2 · 10 9 aCTL, infused every 5 days for larger tumor burden. Further analysis pinpoints crucial bio-markers relating to tumor growth rate, tumor size, and tumor sensitivity to the immune system, whose estimation enables regimen personalization. We propose that adoptive cellular immu- notherapy was prematurely abandoned. It may prove efficacious for GBM, if dose intensity is augmented, as prescribed by the mathematical model. Re-initiation of clinical trials, using calculated individualized regimens for grade III–IV malignant glioma, is suggested. Keywords Mathematical model Glioblastoma (GBM) Adoptive immunotherapy TGF-b Interferon-c Introduction Adult primary malignant gliomas (MG) are among the most deadly forms of cancer. Median survival for high grade MG varies from 1 year for GBM (Grade IV) to 3 to 5 years for grade III MG [21, 22]. Due to their genomic instability, heterogeneity, and infiltrative behavior in their sequestered location beyond the blood brain barrier (BBB), MG are refractory to conventional treatments, including surgery, radiation, and chemotherapy. Thus, novel thera- pies are sought, notably immunotherapy, in the hope they offer a survival advantage. Systemic immunotherapy by vaccination [38], exoge- nous administration of immune cells or immunoregulatory factors, has been tested as a treatment for many types of cancer, so far with limited success [27, 28, 30, 43, 46]. A different approach was employed by Kruse et al. [24] and Kruse and Rubinstein [25], who report six patients treated by aCTL, three of whom were recurrent grade III MG patients (anaplastic astrocytoma and anaplastic oligoden- droglioma) and the other three were recurrent GBM patients. All six patients underwent tumour debulking operations prior to the start of the adjuvant immunotherapy. The six patients were treated with periodic intra-tumoral N. Kronik Y. Kogan V. Vainstein Z. Agur (&) Institute for Medical BioMathematics (IMBM), 10 Hate’ena St., P.O. Box 282, Bene Ataroth 60991, Israel e-mail: [email protected] N. Kronik e-mail: [email protected] 123 Cancer Immunol Immunother DOI 10.1007/s00262-007-0387-z

Welcome message from author
This document is posted to help you gain knowledge. Please leave a comment to let me know what you think about it! Share it to your friends and learn new things together.
Transcript

ORIGINAL ARTICLE
Improving alloreactive CTL immunotherapy for malignantgliomas using a simulation model of their interactive dynamics
Natalie Kronik Æ Yuri Kogan Æ Vladimir Vainstein ÆZvia Agur
Received: 2 May 2007 / Accepted: 7 August 2007
� Springer-Verlag 2007
Abstract Glioblastoma (GBM), a highly aggressive
(WHO grade IV) primary brain tumor, is refractory to
traditional treatments, such as surgery, radiation or che-
motherapy. This study aims at aiding in the design of more
efficacious GBM therapies. We constructed a mathematical
model for glioma and the immune system interactions, that
may ensue upon direct intra-tumoral administration of
ex vivo activated alloreactive cytotoxic-T-lymphocytes
(aCTL). Our model encompasses considerations of the
interactive dynamics of aCTL, tumor cells, major histo-
compatibility complex (MHC) class I and MHC class II
molecules, as well as cytokines, such as TGF-b and IFN-c,
which dampen or increase the pro-inflammatory environ-
ment, respectively. Computer simulations were used for
model verification and for retrieving putative treatment
scenarios. The mathematical model successfully retrieved
clinical trial results of efficacious aCTL immunotherapy
for recurrent anaplastic oligodendroglioma and anaplastic
astrocytoma (WHO grade III). It predicted that cellular
adoptive immunotherapy failed in GBM because the
administered dose was 20-fold lower than required for
therapeutic efficacy. Model analysis suggests that GBM
may be eradicated by new dose-intensive strategies, e.g.,
3 · 108 aCTL every 4 days for small tumor burden, or 2 ·109 aCTL, infused every 5 days for larger tumor burden.
Further analysis pinpoints crucial bio-markers relating to
tumor growth rate, tumor size, and tumor sensitivity to the
immune system, whose estimation enables regimen
personalization. We propose that adoptive cellular immu-
notherapy was prematurely abandoned. It may prove
efficacious for GBM, if dose intensity is augmented, as
prescribed by the mathematical model. Re-initiation of
clinical trials, using calculated individualized regimens for
grade III–IV malignant glioma, is suggested.
Keywords Mathematical model � Glioblastoma (GBM) �Adoptive immunotherapy � TGF-b � Interferon-c
Introduction
Adult primary malignant gliomas (MG) are among the
most deadly forms of cancer. Median survival for high
grade MG varies from 1 year for GBM (Grade IV) to 3 to
5 years for grade III MG [21, 22]. Due to their genomic
instability, heterogeneity, and infiltrative behavior in their
sequestered location beyond the blood brain barrier (BBB),
MG are refractory to conventional treatments, including
surgery, radiation, and chemotherapy. Thus, novel thera-
pies are sought, notably immunotherapy, in the hope they
offer a survival advantage.
Systemic immunotherapy by vaccination [38], exoge-
nous administration of immune cells or immunoregulatory
factors, has been tested as a treatment for many types of
cancer, so far with limited success [27, 28, 30, 43, 46]. A
different approach was employed by Kruse et al. [24] and
Kruse and Rubinstein [25], who report six patients treated
by aCTL, three of whom were recurrent grade III MG
patients (anaplastic astrocytoma and anaplastic oligoden-
droglioma) and the other three were recurrent GBM
patients. All six patients underwent tumour debulking
operations prior to the start of the adjuvant immunotherapy.
The six patients were treated with periodic intra-tumoral
N. Kronik � Y. Kogan � V. Vainstein � Z. Agur (&)
Institute for Medical BioMathematics (IMBM), 10 Hate’ena St.,
P.O. Box 282, Bene Ataroth 60991, Israel
e-mail: [email protected]
N. Kronik
e-mail: [email protected]
123
Cancer Immunol Immunother
DOI 10.1007/s00262-007-0387-z

aCTL infusions given with a subgleal Rickham reservoir/
catheter system 2–3 times within 2 weeks, followed by a
rest period of 6 weeks. This process could be repeated up
to five times. The total doses of administered aCTL varied
between 108 and 5.2 · 109 cells [25].
Although technically more complicated, passive aCTL
immunotherapy overcomes two major problems encoun-
tered with systemic immunotherapy: (1) it is independent
of the patient’s own often anergic immune system, and (2)
the use of intracranial infusion bypasses the BBB. Indeed,
the above clinical trial showed success in that two of the
grade III patients survived for at least 12 years after
treatment [Prof. Carol Kruse (Sidney Kimmel Cancer
Center), personal communication] and one survived for
40 months post-treatment. However, all GBM patients died
within several months. This discrepancy between the suc-
cess in curing grade III MG and the failure of GBM
immunotherapy points to a crucial difference between the
characteristic system dynamics in the two indications. This
difference may be clarified by analyzing the reaction rates
governing the two processes.
The dynamics of tumor-immune system interactions are
complex, involving cytotoxic processes, cytokine modula-
tion and extra-cellular matrix proteins implicated in tumor
and immune cell migration, as well as negative and posi-
tive feedbacks by paracrine and autocrine factors. Tumor
cells use different ways to evade the immune attack. One of
them is a dramatic reduction in the expression of major
histocompatibility complex (MHC) molecules on their
surface [35, 48], which weakens their detection by cyto-
toxic T-lymphocytes (CD8+). Tumor-produced factors,
such as TGF-b, prostaglandin E and interleukin (IL)-10 can
suppress helper T lymphocytes (CD4+), as well as stimu-
late and mobilize regulatory T cells (Tregs). TGF-b is
especially important in immunotherapy resistance, partic-
ularly with regard to aCTL treatment resistance [9, 12, 13,
44], and also shows negative correlation with response to
immunotherapy by dendritic cells [27].
In the central nervous system (CNS), cancer–immune
system cellular interactions are influenced by the presence
of the selective BBB. Only activated T lymphocytes gain
entry to the brain [17]. Lymphocytes infiltrating the brain
may lose activated status or may be largely of the immu-
nosuppressive Treg type [2, 18, 34, 39]. Furthermore, the
cytokine, TGF-b, whose levels are naturally high in the
CNS can influence their function [17]. TGF-b suppresses
the production of both IL-1 and MHC class II by antigen-
presenting cells (APCs), and also suppresses the activation
and proliferation of CTLs [40, 42]. This down-regulation
can be balanced by other cytokines, such as IFN-c, which
can increase expression of MHC class I and class II mol-
ecules on the surface of tumor cells and microglia [8, 31,
37, 47]. In addition, IFN-c increases T cell migration across
the BBB [17]. To study the delicate balance between
activation of the immune response to the tumor and its
suppression, a quantitative description of these dynamics is
required.
Although the latter seems a daunting task, over the past
30 years complex biological dynamics involved in cancer
growth and therapeutics have been studied successfully by
mathematical modelling. Consequently, improved chemo-
therapy and supportive treatment methods have been put
forward [1, 3, 11, 36]. In particular, theoretical models of
cancer immunology and immunotherapy have been sug-
gested, describing an innate CTL response to the growth of
an immunogenic tumor [20, 26] and predicting the efficacy
of adoptive immunotherapy [4]. Other models describe
immunotherapy using autologous natural killer cells and
CD8+ cells [32], or include the effects of chemotherapy and
vaccination [33]. Recently, a mathematical model for
immunotherapy by IL-21 was suggested and retrospec-
tively validated by experimental results in cancer-bearing
animals [7].
In this work we construct a mathematical model for MG
adoptive immunotherapy, which describes the complex
interactions of tumor cells with aCTL and MHC receptors,
mediated by TGF-b and IFN-c. We supply the model with
parameters we have evaluated from in vitro and in vivo
results in animals and in humans. The complete model is
then used to retrieve various immunotherapeutic scenarios
and its predictions are validated by their comparison with
two sets of empirical results, those of Burger et al. [6] and
those of Kruse et al. [24] and Kruse and Rubinstein [25].
We then complement the study by simulations for identi-
fying improved immunotherapy schedules and for
indicating where intervention can lead to a cure.
Methods
Mathematical model
A mathematical model is aimed at yielding a simplified
description of the biological process. By singling out the
crucial forces in the system and deliberately disregarding
secondary effects, the analytical power of the model is
significantly sharpened. Our model (Fig. 1) focuses on the
main interactions between MG grade III or GBM tumor
cells and the host’s immune system; brain and peripheral
blood are considered as two compartments that are sepa-
rated by the BBB. The mathematical model, describing
treatment with aCTL, takes into account two immune cell
sources: adoptive transfer of ex vivo activated lymphocytes
placed intracranially in passive immunotherapy and
endogenously activated lymphocytes in cell-mediated
response. Total number of CTL in the system will be
Cancer Immunol Immunother
123

denoted C. We assume further that tumor cells that are
injured by CTL are phagocytosed by APCs. In the thymus,
the APC present tumor-associated antigens (TAA) that are
aligned with their proper MHC antigen to naıve T cells.
The maturation and proliferation of the TAA-restricted
CTL proceeds in the pro-inflammatory environment. The
activated T cells cross the BBB and gain access to the
tumor cells. Tumor cells or Tregs, produce anti-inflam-
matory cytokines, such as TGF-b, that subsequently
dampen the immune responses. Figure 1 is a simplified
diagram of the immune responses as described in our
model. A system of six ordinary differential equations (1–
6) accounts for these dynamics, as described below. We
use the following notation for our six-variable system: T,
tumor cell number; C, total CTL number; Fb, amount of
TGF-b in the tumor site; Fc, amount of IFN-c in the tumor;
MI, number of MHC class I receptors per cell; MII, number
of MHC class II receptors per cell.
The mathematical expressions we have chosen for rep-
resenting the model conform with standards of mathematical
immunology set by works such as Refs. [16, 26, 29].
Tumor dynamics
Equation (1) describes the tumor (T) dynamics,
dT
dt¼ rT 1� T
K
� �� aT
MI
MI þ eT� aT ;b þ
eT ;bð1� aT ;bÞFb þ eT ;b
� �
� C � ThT þ T
; ð1Þ
The first term on the right hand side (RHS) of Eq. (1)
stands for tumor growth with no immune intervention,
using classical logistic expression with T representing
tumor cell numbers at any moment. This expression uses
the concept of ‘‘carrying capacity’’, i.e., maximal tumor
cell burden, K. The term r stands for tumor growth rate.
The second term on the RHS of Eq. (1) represents tumor
elimination by CTL, C, based on the assumption that it is
proportional to both T and C, with saturation for large T.
The saturation is represented by a linear denominator with
parameter hT standing for the accessibility of the tumor
cells to CTL. The saturation factor also allows for the
immunosuppressive effect of Tregs together with other
known cellular immunosuppressive mechanisms. The
maximal efficiency of a CTL is denoted aT. Two other
multiplicands in the elimination term introduce the effect
on CTL efficiency of MHC class I receptors (MI) and TGF-
b (Fb) which is assumed to be a major immunosuppressive
factor for CTL activity. Both effects are assumed to follow
Michaelis–Menten saturation dynamics. The dependence
on MI is increasing from 0 to 1 with a Michaelis constant
eT. The dependence on Fb is decreasing from 1 to aT,b with
Michaelis constant eT,b.
CTL dynamics
CTL (C) dynamics are described by Eq. (2), below.
dC
dt¼ aC;MII
MII � TMII � T þ eC;MII
� �� aC;b þ
eC;bð1� aC;bÞFb þ eC;b
� �
� lc � C þ S: ð2Þ
The first summand on the RHS of Eq. (2) stands for CTL
recruitment from the peripheral blood system. The
recruitment function [20] is positively affected by MII, and
the number of tumor cells, T. The dependence is imple-
mented by Michaelis–Menten-type saturated functions.
The first term increases from 0 to aC;MIIwith respect to
Fig. 1 MG-immune cell interactions. For a long term effective active
immune response endogenous CD4+ T lymphocytes (cross) may have
to cross the BBB (black bar) and bind MHC II molecules (crescent)on the surface of APCs (crab shaped cells) or astrocytes (stretched-cornered cell). This encounter eventually activates the transition of
CD8+ lymphocytes into CTL, (spiky star). A CTL attaches itself to an
MHC class I molecule (four-point star) on the surface of a tumor cell,
hence destroying it. The tumor cells in turn produce high levels of
TGF-b (top droplets) reducing BBB permeability, expression of MHC
II molecules and the activity of T lymphocytes. IFN-c (bottomdroplets) produced by CTL, increases the BBB permeability, T
lymphocyte activation of MHC I and II molecules. A system of six
ordinary differential equations (1–6) accounts for these dynamics
Cancer Immunol Immunother
123

MII� T. The latter expression is the total amount of MHC
class II receptors on the surface of APCs. The Michaelis
parameter of this function is eC;MII: The cytokine TGF-b
suppresses the proliferation and activation of T lympho-
cytes, as well as leukocyte migration across the BBB [17].
Therefore, the second term in the recruitment function is
decreasing in Fb from 1 to aC,b with Michaelis parameter
eC,b. Although inflammatory reaction in the brain stimu-
lates also Tregs to end the immune response [15, 23] for
simplicity we assumed a constant death rate, lc for
the CTL, C. The term S describes the rate of infusion of
primed CTL directly to the tumor site. In the absence
of immunotherapy S was set to 0.
Cytokine dynamics
Cytokine dynamics are described by Eqs. (3, 4). Equation (3)
describes the dynamics of TGF-b (Fb) in the brain com-
partment. Equation (4) describes the dynamics of IFN-c (Fc).
dFb
dt¼ gb þ ab;T � T � lb � Fb; ð3Þ
dFc
dt¼ ac;C � C � lc � Fc; ð4Þ
The first term on the RHS of Eq. (3), gb, represents the
natural basal level production of bioactive TGF-b in the
CNS, known to be higher than in the rest of the body [17].
The second term is the other source of TGF-b, which is the
tumor [5]. We assume it to be proportional to the tumor
size, ab,T being the release rate per tumor cell. The last term
is the degradation of TGF-b, with constant rate, lb. In Eq.
(4) the first term on the RHS is a linear production of
IFN-c, Fc, where ac, C is the release rate per single CTL.
We assume that the only source of IFN-c is CTL [13, 14,
19] under normal circumstances. Therefore, the amounts of
IFN-c present in the CNS are insignificant in the absence
of CTL. The second term is the degradation of Fc with
constant rate, lc.
MHC dynamics
MHC dynamics are described by Eqs. (5, 6). Equation (5)
represents the dynamics of MHC class I (MI) receptor
molecules on a single tumor cell. Equation (6) represents
the dynamics of MHC class II (MII) receptor on a single
APC.
dMI
dt¼ gMI
þ aMI;c � Fc
Fc þ eMI;c� lMI
�MI; ð5Þ
dMII
dt¼ aMII;c �Fc
Fcþ eMII;c�
eMII;b � 1�aMII;b� �
Fbþ eMII;bþaMII;b
� ��lMII
�MII;
ð6Þ
The first term on the RHS of Eq. (5) is the basal rate of MI
receptor expression per tumor cell, gMI: The second term
represents the stimulation by IFN-c of MI expression on the
surface of a GBM cell [47]. We use a Michaelis–Menten-
type saturated function, where the maximal effect of IFN-cis aMI;c and the Michaelis parameter is denoted eMI;c: The
last term in Eq. (5) is the degradation of MI with constant
rate, lMI:
The first summand on the RHS of Eq. (6) represents the
production rate of MII per tumor cell which is a function of
both IFN-c and TGF-b. The dependence on Fc is described
by an increasing saturated function of Michaelis–Menten
type with minimal value 0, maximal value aMII;c and
Michaelis parameter eMII;c: The influence of Fb is repre-
sented by a Michaelis–Menten function decreasing from 1
to aMII;b and Michaelis parameter eMII;b: The second sum-
mand on the RHS of Eq. (6) is the degradation of MII with
constant rate, lMII:
Computer simulations
To use the model for retrieving potential therapeutic
effects, it was implemented in the computer using a C++
code and simulated using an Euler scheme with the inte-
gration step of 0.001 h, a typical run time being a minute
per simulation. The parameters had been evaluated based
on published in vitro and in vivo animal and human results.
The full list of references for parameter evaluation
(Table 2) and the methods we applied are given in the
Appendix. Two parameters, hT and eC;MII; were estimated
roughly. For the simulations of untreated tumor growth we
estimated tumor cell number at the time of diagnosis and
maximal tumor cell burden. Swanson et al. [41] indicate
that the minimal diameter of a tumor at the time of diag-
nosis is 3 cm, whereas at 6 cm the patient dies. We
assumed that the tumor cell density does not change during
the disease progression, and that the tumor increases only
in total volume, i.e., cell number. Arciero et al. [4] assume
the maximal tumor cell burden to be 109 tumor cells per
cm3 tissue. Combining information from Arciero et al. [4]
and from Swanson et al. [41] we can translate tumor size
into cell numbers. Thus, a 3 cm diameter tumor at the time
of diagnosis, would contain a tumor cell population of ca.
1010 cells. In the same manner, the tumor cells in a 6 cm
diameter tumor would constitute maximal tumor cell
burden of 1011 cells.
Cancer Immunol Immunother
123

For the simulations of Kruse et al. trial we assumed that
a residual tumor contains a number of cells comparable to
the minimal detectable size. This assumption is justified
even for cases where treatment followed a debulking
operation on the recurrent tumor (see ‘‘Discussion’’).
Therefore, we used 1010 cells as an initial population size
for these simulations as well.
Results
Retrieval of experimental results
To validate our model, we first simulated untreated grade
III and GBM tumor progression. We distinguished between
grade III and GBM tumors by their maximal growth rate,
r = 0.00035 h–1 or r = 0.001 h–1, respectively (for details
see ‘‘Appendix’’). Figure 2a shows simulation results of
grade III and GBM natural tumor growth, initial population
sizes being two CTL and two tumor cells. Fast decline of
CTL to zero ensues (not shown) and the tumor growth is
uninterrupted.
Results presented in Fig. 2a are corroborated by the
Burger et al. [6] estimation that a grade III tumor requires
about 3–5 years to progress from the size at diagnosis to
maximal size at death. Following our estimations, this
correlates to growth from 1010 cells to 1011 cells (Fig. 2a,
thick line). Burger et al. [6] report that GBM tumor
requires about a year to progress from diagnosis size to
maximal size at death, which is also in agreement with
results presented in Fig. 2a (thin line).
In Fig. 2b we present the results of a simulated suc-
cessful treatment for a grade III tumor arbitrarily using
three infusates of 3 · 108 aCTL, infused every 5 days,
followed by a 45-day interval. This treatment cycle is
repeated five times over a period of 9 months (below we
use the following notation to describe such a schedule: (3 ·(3 · 108 aCTL q5d) + 45d rest) · 5). This regimen, sim-
ulating the one used by Kruse et al. [24] for grade III MG,
predicts success in tumor eradication, as was, indeed,
achieved in the pilot trial. We used an initial tumor pop-
ulation size of 1010 cells and small endogenous CTL initial
population of 2 · 106 cells.
Next, we simulated the failure of the above regimen for
GBM patients. Kruse and Rubinstein [25] report that two
GBM patients died within 4 months from treatment onset.
Only two aCTL infusions every 7 days per cycle were
applied to these patients, and only for two cycles. We
simulated this treatment, assuming a rough similarity to the
untreated case, we evaluated tumor size of these GBM
patients at onset to be 8 · 1010 cells. Figure 2c shows that
the tumor (thick line) is hardly affected by the treatment.
0
25
50
75
100
0 5 10 15 20 25 30 35 40
Time (months)
Cel
l Nu
mb
ers
MG grade III cells (x109) GBM cells (x109)
0
25
50
75
100
0 2 4 6 8 10 12
Time (months)
Cel
l Nu
mb
ers
CTLs (x107) Tumor Cells (x108)
0
20
40
0 1 2 3 4
Time (months)
Cel
l Nu
mb
ers
CTLs (x107) Tumor Cells (x1010)
0
25
50
75
100
0 5 10 15 20 25 30 35 40
Time (months)
Cel
l Nu
mb
ers
CTLs (x107) Tumor Cells (x109)
(A) (B)
(C) (D)
Fig. 2 Simulations retrieving experimental data. a Time dependent
tumor growth from T(0) = 2, C(0) = 2 for grade III, r = 0.00035 h–1
(thick line), and grade IV MG, r = 0.001 h–1 (thin line). For b–d tumor
cell number (thick line) and total CTL cell number (dotted line) are
shown. b Predicted annihilation of MG Grade III by aCTL
immunotherapy. aCTL immunotherapy schedule: (3 · (3 · 108 aCTL
q5d) + 45d rest) · 5. Key parameter values were r = 0.00035 h–1,
T(0) = 1010, C(0) = 2 · 106, hT = 5 · 108 cells. c Inefficient
treatment of GBM (MG grade IV) by aCTL immunotherapy. aCTL
immunotherapy schedule: (2 · (3 · 108 aCTL q7d) + 45d rest) · 2.
Key parameter values were r = 0.001 h–1, T(0) = 8 · 1010, C(0) =
2 · 106. All other parameters as in b. d Inefficient treatment of MG
grade III by aCTL immunotherapy due to large initial tumor size.
aCTL immunotherapy schedule: (3 · (3 · 108 aCTL q5d) + 45d
rest) · 5. Key parameter values were r = 0.00035 h–1, T(0) =
2.5 · 1010, C(0) = 2 · 106. All other parameters as in b
Cancer Immunol Immunother
123

Model predictions
Interpretation of treatment failure
Following validation, the model was employed both for
analyzing putative causes underlying the response failure
of one patient in the Kruse et al. experiments, and for
suggesting improved aCTL immunotherapy schedules.
Simulated schedules, described below, are compared in
Table 1 for their total aCTL dose and efficacy.
Kruse and Rubinstein [25] report the death of one MG
grade III patient, 40 months after treatment initiation. We
used our model to examine possible explanations for why
the patient initially responded to treatment but later suc-
cumbed to tumor. First, we investigated the hypothesis that
tumor burden of this patient at onset was considerably
larger. Note that Swanson et al. [41] report a tumor size at
diagnosis between 3 and 6 cm, and our above treatment
simulations employed the lower estimation. We next sim-
ulated tumor growth for a tumor whose initial volume was
2.5 times larger (corresponding to a diameter of ca. 4 cm)
than that simulated in Fig. 2b. As a result the applied
treatment was rendered futile (Fig. 2d). Figure 2d shows
that the model also reproduced Kruse and Rubinstein [25]
results, namely patient’s death at 40 months following
treatment onset.
Another possible reason for the variable success of the
MG grade III immunotherapy, is the heterogeneity of
patients’ tumors and their sensitivity to the innate immune
system (hT). Larger hT values reflect reduced CTL effi-
ciency, due to various processes. Some are hypoxia-driven,
for example angiogenesis or necrosis, and are determined
by surface to volume ratio. Other processes, such as Treg
activation, are immunosuppressive [12]. To examine the
latter possibility we simulated again the system in Fig. 2b,
except that now, the tumor sensitivity is smaller, hT = 5 ·109. Results presented in Fig. 3a show that a larger hT
value hinders the success of aCTL immunotherapy and the
tumor reaches fatal levels about 40 months after initial
treatment.
An alternative cause for failure of GBM treatments,
reported in Kruse et al. [24] and Kruse and Rubinstein [25]
clinical trial, can be the less intensive regimen these
patients received [24, 25]. To examine this possibility, we
simulated treatment of GBM patients by the slightly more
intensive regimens, successfully used for grade III patients
(Fig. 2b). In these simulations we assumed minimal
detectable tumor size at treatment onset, about 1010 cells.
Even under this assumption, as we show in Fig. 3b, the
treatment fails to eradicate the tumor, and patient’s death is
predicted to occur within 12 months.
Overcoming treatment failure
Due to the apparent inefficiency of immunotherapy in some
grade III MG and all GBM patients we used our model to
search for more efficacious immunotherapy regimens.
First, we checked the dose intensity required for elimi-
nating refractory grade III tumors. Simulations showed that
an increase in aCTL dose from 3 · 108 to 5 · 108, leaving
all other regimen characteristics the same as in Fig. 2b,
Table 1 The effect of regimen on treatment success: comparison of simulation results
MG grade T(0) hT CTL dose Inf interval (days) Cycles Total aCTL dose Erad
III 1010 5 · 108 3 · 108 5 5 45 · 108 Yes
IV 8 · 1010 5 · 108 3 · 108 7 2 12 · 108 No
III 2.5 · 1010 5 · 108 3 · 108 5 5 45 · 108 No
III 1010 5 · 109 3 · 108 5 5 45 · 108 No
IV 1010 5 · 108 3 · 108 5 5 45 · 108 No
III 2.5 · 1010 5 · 108 5 · 108 5 5 75 · 108 Yes
III 2.5 · 1010 5 · 108 3 · 108 3 5 75 · 108 Yes
III 2.5 · 1010 5 · 108 3 · 108 4 7 84 · 108 Yes
III 1010 5 · 109 2 · 109 5 5 30 · 109 Yes
III 1010 5 · 109 3 · 108 1 5 22.5 · 109 Yes
III-TGF–b 1010 5 · 108 2 · 108 5 5 30 · 108 Yes
III 1010 5 · 108 1 · 108 2 5 35 · 108 Yes
IV 8 · 1010 5 · 108 2 · 109 5 5 30 · 109 Yes
IV 1010 5 · 108 3 · 108 4 5 60 · 108 Yes
IV 8 · 1010 5 · 108 3 · 108 1 6 27 · 109 Yes
Inf infusion, Erad eradication
Cancer Immunol Immunother
123
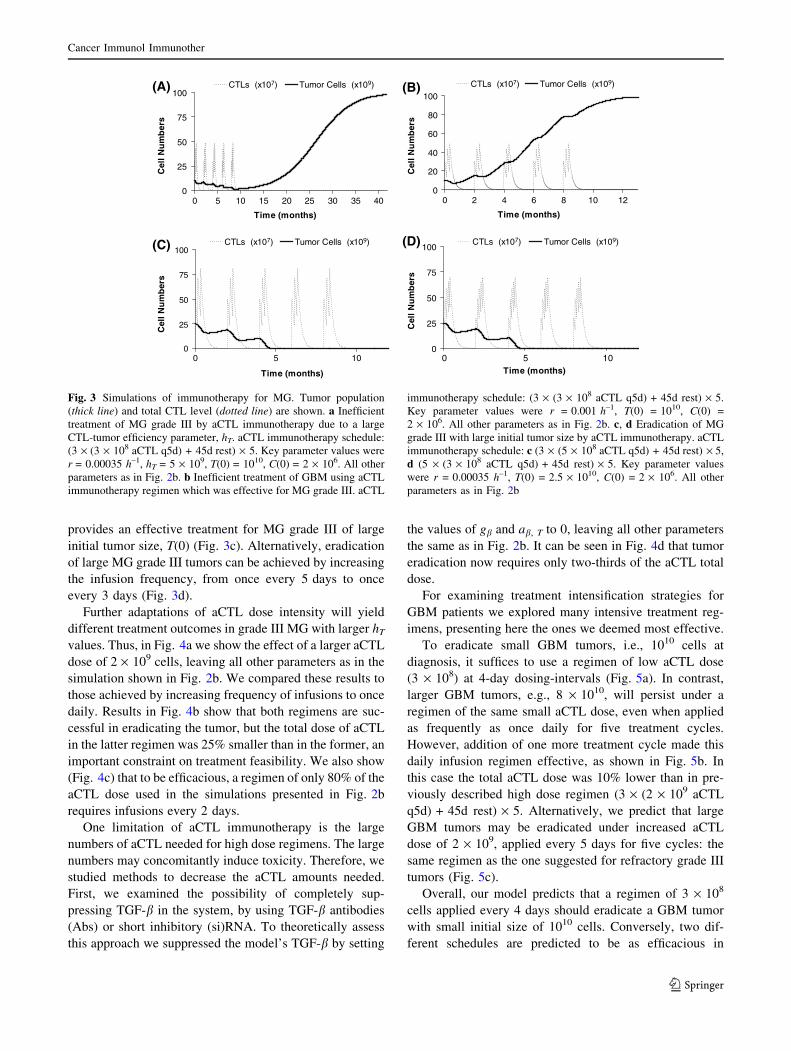
provides an effective treatment for MG grade III of large
initial tumor size, T(0) (Fig. 3c). Alternatively, eradication
of large MG grade III tumors can be achieved by increasing
the infusion frequency, from once every 5 days to once
every 3 days (Fig. 3d).
Further adaptations of aCTL dose intensity will yield
different treatment outcomes in grade III MG with larger hT
values. Thus, in Fig. 4a we show the effect of a larger aCTL
dose of 2 · 109 cells, leaving all other parameters as in the
simulation shown in Fig. 2b. We compared these results to
those achieved by increasing frequency of infusions to once
daily. Results in Fig. 4b show that both regimens are suc-
cessful in eradicating the tumor, but the total dose of aCTL
in the latter regimen was 25% smaller than in the former, an
important constraint on treatment feasibility. We also show
(Fig. 4c) that to be efficacious, a regimen of only 80% of the
aCTL dose used in the simulations presented in Fig. 2b
requires infusions every 2 days.
One limitation of aCTL immunotherapy is the large
numbers of aCTL needed for high dose regimens. The large
numbers may concomitantly induce toxicity. Therefore, we
studied methods to decrease the aCTL amounts needed.
First, we examined the possibility of completely sup-
pressing TGF-b in the system, by using TGF-b antibodies
(Abs) or short inhibitory (si)RNA. To theoretically assess
this approach we suppressed the model’s TGF-b by setting
the values of gb and ab, T to 0, leaving all other parameters
the same as in Fig. 2b. It can be seen in Fig. 4d that tumor
eradication now requires only two-thirds of the aCTL total
dose.
For examining treatment intensification strategies for
GBM patients we explored many intensive treatment reg-
imens, presenting here the ones we deemed most effective.
To eradicate small GBM tumors, i.e., 1010 cells at
diagnosis, it suffices to use a regimen of low aCTL dose
(3 · 108) at 4-day dosing-intervals (Fig. 5a). In contrast,
larger GBM tumors, e.g., 8 · 1010, will persist under a
regimen of the same small aCTL dose, even when applied
as frequently as once daily for five treatment cycles.
However, addition of one more treatment cycle made this
daily infusion regimen effective, as shown in Fig. 5b. In
this case the total aCTL dose was 10% lower than in pre-
viously described high dose regimen (3 · (2 · 109 aCTL
q5d) + 45d rest) · 5. Alternatively, we predict that large
GBM tumors may be eradicated under increased aCTL
dose of 2 · 109, applied every 5 days for five cycles: the
same regimen as the one suggested for refractory grade III
tumors (Fig. 5c).
Overall, our model predicts that a regimen of 3 · 108
cells applied every 4 days should eradicate a GBM tumor
with small initial size of 1010 cells. Conversely, two dif-
ferent schedules are predicted to be as efficacious in
0
25
50
75
100
0 5 10 15 20 25 30 35 40
Time (months)
Cel
l Nu
mb
ers
CTLs (x107) Tumor Cells (x109)
0
20
40
60
80
100
0 2 4 6 8 10 12
Time (months)
Cel
l Nu
mb
ers
CTLs (x107) Tumor Cells (x109)
0
25
50
75
100
0 5 10
Time (months)
Cel
l Nu
mb
ers
CTLs (x107) Tumor Cells (x109)
0
25
50
75
100
0 5 10Time (months)
Cel
l Nu
mb
ers
CTLs (x107) Tumor Cells (x109)
(B)
(C) (D)
(A)
Fig. 3 Simulations of immunotherapy for MG. Tumor population
(thick line) and total CTL level (dotted line) are shown. a Inefficient
treatment of MG grade III by aCTL immunotherapy due to a large
CTL-tumor efficiency parameter, hT. aCTL immunotherapy schedule:
(3 · (3 · 108 aCTL q5d) + 45d rest) · 5. Key parameter values were
r = 0.00035 h–1, hT = 5 · 109, T(0) = 1010, C(0) = 2 · 106. All other
parameters as in Fig. 2b. b Inefficient treatment of GBM using aCTL
immunotherapy regimen which was effective for MG grade III. aCTL
immunotherapy schedule: (3 · (3 · 108 aCTL q5d) + 45d rest) · 5.
Key parameter values were r = 0.001 h–1, T(0) = 1010, C(0) =
2 · 106. All other parameters as in Fig. 2b. c, d Eradication of MG
grade III with large initial tumor size by aCTL immunotherapy. aCTL
immunotherapy schedule: c (3 · (5 · 108 aCTL q5d) + 45d rest) · 5,
d (5 · (3 · 108 aCTL q5d) + 45d rest) · 5. Key parameter values
were r = 0.00035 h–1, T(0) = 2.5 · 1010, C(0) = 2 · 106. All other
parameters as in Fig. 2b
Cancer Immunol Immunother
123

eliminating a larger tumor of ca. 8 · 1010 cells: (1) an
increased dose regimen, of 2 · 109 aCTL, applied every
5 days for five cycles; and (2) daily infusion of 3 · 108
aCTL for six cycles.
Treatment sensitivity to parameter change
An important area of exploration for developing strategies
to attack this persistant tumor is to analyse which of the
parameters used are the most influential on the treatment
outcomes. Put in other words this analysis checks which
changes in the parameters would turn, for example, a
failing treatment into a successful one. From this analysis
we can also learn about the treatment tolerance to errors in
parameter estimation, or to patient variability. Figure 6
shows that the suggested treatment is most sensitive to the
following parameters: lC, T(0), and r. However, the
treatment is tolerant to as much as 30% change in any of
the model parameters, which leaves us ample margins for
estimation error.
Discussion
Current MG immunotherapy research includes systemic
approaches, such as virus or peptide vaccines, dendritic cells,
and whole cell vaccines [27, 28, 30, 38, 43, 46]. Immuno-
therapy by intra-tumoral application of aCTL is less
common, even though it may overcome two shortcomings of
systemic MG immunotherapy, namely, the patient’s anergic
immune system and BBB impermeability. Nevertheless, this
method has fallen out of favor in recent years, mainly due to
its mixed clinical study achievements [24]. Motivated by the
need to find an efficacious therapeutic method we decided to
analyze these mixed results using a mathematical model
whose parameters were evaluated by published experimental
data (see ‘‘Appendix’’). The predictions of the model con-
cerning the life-span of patients having different MG grade
tumors were confirmed by Burger et al. [6]. Notably, our
predictions, relating treatment success to the patient’s dis-
ease grade, were corroborated by Kruse and Rubinstein
clinical trial [25]. Our predictive model will be further
evaluated during a dose escalation trial, soon to be resumed.
The model will be used to calculate treatment response rel-
ative to the individual tumor burden along with standardized
aCTL dosages and dosing intervals.
The main conclusion of the present study is that aCTL
immunotherapy is a promising therapeutic method, which
may have been prematurely abandoned. Lacking better
computational tools, the human treatment dosages were
calculated by scaling up from pre-clinical rat experiments,
regardless of tumor grade or initial tumor size [24].
0
25
50
75
100
0 2 4 6 8 10 12
Time (months)
Cel
l Nu
mb
ers
CTLs (x10 ) Tumor Cells (x10 )
0
25
50
75
100
0 2 4 6 8 10 12
Time (months)
Cel
l Nu
mb
ers
CTLs (x10 ) Tumor Cells (x10 )88
0
25
50
75
100
0 2 4 6 8 10 12
Time (months)
Cel
l Nu
mb
ers
CTLs (x10 ) Tumor Cells (x10 )87
0
25
50
75
100
0 5 10
Time (months)
Cel
l Nu
mb
ers
CTLs (x10 ) Tumor Cells (x10 )87
(A) (B)
(C) (D)
8 8
Fig. 4 Suggested immunotherapy for MG grade III. Simulation
results showing tumor population (thick line) and total CTL level
(dotted line) over time. a, b Eradication of MG grade III with large
CTL-tumor efficiency parameter hT by aCTL immunotherapy: aLarge aCTL dose. aCTL immunotherapy schedule: (3 · (2 · 109
aCTL q5d) + 45d rest) · 5. b Shorter inter-dosing interval. aCTL
immunotherapy schedule: (15 · (3 · 108 aCTL q1d) + 45d rest) · 5.
Key parameter values were r = 0.00035 h–1, hT = 5 · 109,
T(0) = 1010, C(0) = 2 · 106. All other parameters as in Fig. 2b.
c Eradication of MG grade III by aCTL immunotherapy with an
alternative regimen. aCTL immunotherapy schedule: (7 · (1 · 108
aCTL q2d) + 45d rest) · 5. Key parameter values were r =
0.00035 h–1, T(0) = 1010, C(0) = 2 · 106. All other parameters as
in Fig. 2B. d Eradication of MG grade III by aCTL immunotherapy
excluding the effect of TGF-b. aCTL immunotherapy schedule:
(3 · (2 · 108 aCTL q5d) + 45d rest) · 5. Key parameter values were
gb = 0, ab,T = 0, r = 0.00035 h–1, T(0) = 1010, C(0) = 2 · 106
Cancer Immunol Immunother
123

Consequently, the clinically administered total aCTL dos-
age to GBM patients, ca. 12 · 108 aCTL, was about 20-fold
smaller than that predicted by our mathematical model to be
effective (27 · 109). Our results show that different grade
gliomas have different characteristic growth rates and hence
warrant different, calculable, treatment intensities.
Our model suggests that the death of one MG grade III
patient in Kruse’s experiments 40 months after treatment
initiation could be due to a larger initial tumor size, T(0), or
a reduced sensitivity to the immune system, hT. The
parameter hT may be influenced by angiogenesis, Tregs,
tumor surface to volume ratio, and additional factors that
include the diffusive tumor growth, which may be affected
differently than solid tumor growth of the same size.
The parameters r and T(0) can be directly evaluated in
individual patients, e.g., from imaging. The parameter hT
can be evaluated from anatomical information considering
the surface to volume ratio, amount of necrosis in the
tumor, proximity to blood vessels, etc. It appears, then, that
our mathematical model can be an instrumental constituent
of a new theranostic method for tailoring immunotherapy
regimens to individual GBM patients.
Having verified (Figs. 2b–d, 3a, b) the success of the MG
aCTL immunotherapy model in retrieving different clinical
scenarios of Kruse et al. [24], we used it to identify improved
immunotherapy schedules (Figs. 3c, d, 4a–c, 5a–c). Our
model suggests thateffective aCTLimmunotherapyforGBM
is available and that the interplay between dose, infusion
frequency, and number of treatment cycles allows great
flexibility in selecting the desired treatment (Fig. 5a–c). We
have also shown that higher frequency of aCTL infusions can
improve treatment, leading to 10–25% decrease in total aCTL
doserequired(Fig. 4c).However, thisstrategymayproveless
practical due to the logistic difficulties of a 2-week period of
daily infusions. To reduce CTL availability constraints we
have shown that suppression of native TGF-b, by using anti
TGF-b Abs or si-RNA, can reduce the CTL requirement by
one-third (Fig. 4d).
An important advantage of local intra-tumoral infusion
of immune cells is their mobility. Unlike common
0
25
50
75
100
0 2 4 6 8 10Time (months)
sreb
mu
N lleC
CTLs (x10 ) Tumor Cells (x10 )98
0
25
50
75
100
0 2 4 6 8 10 12Time (months)
sreb
mu
N lleC
CTLs (x10 ) Tumor Cells (x10 )87
0
25
50
75
100
0 2 4 6 8 10 12 14
Time (months)
sreb
mu
N lleC
CTLs (x10 ) Tumor Cells (x10 )98
(A)
(B)
(C)
Fig. 5 Suggested immunotherapy for GBM. Simulation results
showing tumor population (thick line) and total CTL level (dottedline) over time. a Eradication of GBM of small initial size by short
inter-dose interval aCTL immunotherapy. aCTL immunotherapy
schedule: (4 · (3 · 108 aCTL q4d) + 45d rest) · 5. Key parameter
values: r = 0.001 h–1, T(0) = 1010, C(0) = 106. All other parameters as
in Fig. 2b. b Treatment of GBM of large initial size by aCTL
immunotherapy at short intervals and adding one treatment cycle.
aCTL immunotherapy schedule: (15 · (3 · 108 aCTL q1d) + 45d
rest) · 6. Key parameter values were r = 0.001 h–1, T(0) = 8 · 1010,
C(0) = 6 · 106. All other parameters as in Fig. 2b. c Eradication of
GBM of large initial size by high dose aCTL immunotherapy. aCTL
immunotherapy schedule: (3 · (2· 109 aCTL q5d) + 45d rest) · 5.
Key parameter values were r = 0.001 h–1, T(0) = 8 · 1010, C(0)
= 2 · 106. All other parameters as in Fig. 2b
Fig. 6 Sensitivity analysis. A failed GBM treatment of small initial
size T(0) = 1010 and standard aCTL schedule (3 · (3 · 108 aCTL
q5d) + 45d rest) · 5 becomes successful if the following parameters
are changed. Each parameter was changed separately while keeping
all other parameters as in Fig 2b. See appendix for parameter
definitions
Cancer Immunol Immunother
123

chemotherapy or therapy by small molecules that move
only by diffusion within a small radius, T cells are motile
and can penetrate through large areas of the brain. Also the
mode of application, using a brain canula, was designed to
maximize depth of penetration and spread of T cells in
tissue [Prof. Carol Kruse (Sidney Kimmel Cancer Center),
personal communication]. Moreover, elimination of the
major part of a tumor can make subsequent adjuvant sys-
temic treatment (such as chemo- or radio-therapy) more
effective. This concept of tumor reduction proved useful in
ovarian cancer [10]. Removal of tumor mass significantly
lowers the level of tumor-produced TGF-b, which, in turn,
improved the host intrinsic immune response to the
remaining residual cancer cells.
Overall survival of MG patients varies widely. Untreated
patients survive half as long as treated patients and patients
can sometimes survive with tumors larger than 6 cm in
diameter, or, regretfully, die at a much smaller tumor size.
Patients who participated in the Kruse et al. [24] and Kruse
and Rubinstein [25] clinical trial were recurrent patients.
Recurrent GBM and grade III MG patients survive only 6–
9 months and 14 months, respectively [Prof. Roger Stupp
(University of Lausanne Hospitals), personal communica-
tion]. This variability raises the possibility that we may have
underestimated the value of maximal growth rate, r, and the
maximal tumor cell burden, K. To study this possibility we
have performed additional simulations with GBM growth
rate values, r, corresponding to tumors at double the growth
rate, and a K value ten times larger than the one used in the
above-presented simulations. These simulations (not
shown) were similar to the former in suggesting the same
basic strategies for increasing treatment efficacy. A com-
prehensive study of the effect of changes in parameter
values, e.g., by extension of CTL life span, on the treatment
outcomes is underway.
Using aCTL in high doses should also be evaluated in light
of the resultant inflammation in the CNS, a side effect caused
by CTL-produced IFN-c [45]. This side effect, along with
limited availability of donor aCTL, may hinder the appli-
cation of our model-suggested regimens, in cases where
these involve large treatment intensification. The alternative
regimens we have proposed can be used when large doses of
aCTL cause an intolerable inflammatory reaction. As sug-
gested above, the use of anti-TGF-b therapy may reduce the
effective aCTL dose by up to one-third, or in cases where a
larger aCTL dose will be required but unavailable. In another
study, we investigate methods of circumventing the aCTL
high dose requirement by increasing tumor sensitivity to
aCTL as suggested by our model.
We also analyzed model sensitivity to parameters. The
parameters that show the highest influence on treatment
success are the death rate of aCTL, the initial size of the
tumor, and its maximal growth rate. These findings hint at
the direction we should follow to improve cellular immu-
notherapy. We can search for adjuvant treatments that
would increase CTL life span. An alternative option to
improve treatment success is to enhance diagnosis sensi-
tivity and to allow for early detection. For example, the
analysis shows that reducing tumor initial size by 40%
would render a failed treatment successful. Yet another
possible option is to reduce tumor growth rate by about
one-half of its normal value, e.g., by intensive cytostatic
chemotherapy. Model sensitivity analysis also suggests that
the qualitative conclusions, discussed above, remain
unchanged under reasonable errors in parameter estima-
tions and inter-patient variability.
It should also be noted that the patients in the Kruse
et al. trial underwent a tumor debulking operation prior to
the onset of adjuvant immunotherapy. The residual tumor,
remaining for the aCTL immunotherapy, taken here as the
initial tumor population size, T(0), could have varied, due
to the unknown extent of resection for all the treated
patients. Because of the diffusely infiltrative nature of the
tumor cells into the healthy brain tissue, it may be unde-
tected on an enhanced MRI scan. However, even after a
gross total resection it is estimated that at least a billion
tumor cells may remain. In order to allow personalized
treatment, future clinical studies should accurately assess
tumor burden, perhaps by tumor volumetric analyses by
MRI or PET scans.
We believe that the ability of our model to predict a
patient response to a suggested treatment regimen and its
alterations, will aid in the development of aCTL immu-
notherapy. We also believe that the aCTL avenue of
treatment harbors great potential, as it has already shown
for grade III patients. This strategy offers bypasses to the
BBB and to the patient’s own weak immune system, which
other immunotherapy methods are still confronting. In light
of the analysis put forth in this work, we believe that fur-
ther clinical trials are warranted, using mathematically
calculated treatment schedules.
Acknowledgments We thank C.A. Kruse and R. Stupp for critical
reading of this paper, for suggesting important corrections to the text
and for contributing valuable information. We are also grateful to M.
Elishmereni and to the referees for valuable revision of the manu-
script. This work has been financially supported by an EU Marie
Curie grant no. MRTN-CT-2004-503661 to Natalie Kronik, and by
the Chai Foundation. Natalie Kronik is supported by EU Marie-Curie
grant no.MRTN-CT-2004-503661. Yuri Kogan, Vladimir Vainstein,
and Zvia Agur are supported by the Chai Foundation.
Appendix: Parameter estimation
In this section we present a list of all evaluated model
parameters, the detailed methods and the literature sources
for their evaluation (Table 2).
Cancer Immunol Immunother
123

The method for evaluating model parameters
Maximal growth rate of the tumor, r. Swanson et al. [41]
assume a MG is diagnosed at 3 cm diameter and when it
reaches a 6 cm diameter the patient dies. Assuming a
spherical shape, the final to diagnosis initial volume ratio is63
� �3¼ 8: We assumed that the number of tumor cells is
proportional to the tumor volume. Using Eqs. (1–6), r was
scaled so an untreated grade III MG (e.g., anaplastic oli-
godendroglioma) would grow eightfold within 3 years [6].
Thus, for grade III MG we estimated r = 0.00035 h–1 . A
GBM tumor grows from 3 cm diameter to a 6 cm diameter
in about a year [41]. Using Eqs. (1–6), r was scaled to
predict eightfold tumor growth within a year. Hence, for
grade IV tumor we estimated r = 0.001 h–1.
Tumor carrying capacity (maximal tumor burden), K.
Arciero et al. [4] takes the carrying capacity of tumor cells
to be 109 cells/ml. Taking a maximal tumor diameter of
6 cm we got a volume of roughly 100 ml, which gave us an
estimation of total carrying capacity of 1011 cells.
Maximal efficiency of CTL aT. Wick et al. [60] report
that a CTL kills 0.7–3 target cells per day. A mean value of
two target cells per day gives the rate of 0.0833 cells/h.
The experiment was done with 5 · 105 target cells/ml in
2 ml wells. For this calculation we used hT value deter-
mined by Arciero et al. [4] for mice. This hT value was
smaller than the one we used later in simulations, because
in vitro the contact frequency and efficacy of CTLs would
be higher. Here we took hT to be 105 cells/ml and multi-
plied it by the volume of the well. Substituting the former
values into aT � ThTþT ¼ 0:0833 h�1; we got aT = 0.12 h–1.
Michaelis constant for the dependence of CTL efficiency
on MI amount, eT. Kageyama et al. [51] report the number
of MHC I receptors per target cell to be between fewer than
ten to several thousands. The value of eT is the number of
MI receptors that brings the CTLs efficacy to half of its
maximum value. Taking into account that MHC I receptors
expression is suppressed in MGs, we estimated eT to be
50 rec/cell.
Maximal reduction effect of TGF-b on CTL efficiency,
aT,b. Thomas and Massague [42] report that under high
concentrations of TGF-b CTL efficacy in target cell
lysis has dropped to one-third after 3 h. Thus,
aT ;b ¼ffiffi½
p3�1
3h�1 � 0:69 h�1:
Table 2 Parameter estimation used in the current model
Parameter Value Units Reference
r 0.00035 or 0.001 h–1 Based on data from Swanson et al. [41] and Burger et al. [6]
K 1 · 1011 cell Arciero et al. [49]
aT 0.12 h–1 Based on data from Arciero et al. [49] and Wick et al. [60]
eT 50 rec�cell–1 Based on data from Kageyama et al. [51]
aT,b 0.69 None Thomas and Massague [42]
eT,b 104 pg Based on data from Peterson et al. [55]
hT 5 · 108 or 5 · 109 cell Estimation fits data from Kruse et al. [24], Kruse and Rubinstein [25]
aC;MII4.8 · 10–11 cell�h–1�rec–1 Based on data from Phillips and Lampson [57] and Bosshart and Jarrett [50]
eC;MII1014 rec Estimation
aC,b 0.8 None Based on data from Thomas and Massague [42]
eC,b 104 pg Based on data from Peterson et al. [55]
lC 0.007 h–1 Taylor et al. [58]
gb 6.3945 · 104 pg�h–1 Peterson et al. [55]
ab,T 5.75 · 10– 6 pg�cell–1�h–1 Peterson et al. [55]
lb 7 h–1 Coffey et al. [50]
ac,C 1.02 · 10– 4 pg�cell–1�h–1 Kim et al. [19]
lc 0.102 h–1 Turner et al. [59]
gMI1.44 rec�cell–1�h–1 Based on data from Kageyama et al. [51]
aMI ;c 2.88 rec�cell–1�h–1 Based on data from and Yang et al. [47]
eMI ;c 3.38 · 105 pg Based on data from Yang et al. [47], and Pharmingen manufacturer information
lMI0.0144 h–1 Milner et al. [54]
aMII ;c 8660 rec�cell–1�h–1 Based on data from Phillips et al. [56], and Bosshart and Jarrett [50]
eMII ;c 1420 pg Based on data from Phillips et al. [56], and Bosshart and Jarret [50]
aMII ;b 0.012 None Based on data from Suzumura et al. [40]
eMII ;b 105 pg Based on data from Suzumura et al. [40]
lMII0.0144 h–1 Based on data from Lazarski et al. [52]
Cancer Immunol Immunother
123

Michaelis constant for the dependence of CTL efficiency
on TGF-b amount, eT,b. We took this value to be of order of
magnitude of the base line found by Peterson et al. [55],
multiplied by the volume of the CNS. Thus,
eT ;b ¼ 60:9 pg �ml�1 � 150 ml � 104pg:
Parameter for CTL efficiency saturation due to large
tumor size, hT. We estimated it to be 5 · 108 cells, or 5
· 109 cells by fitting the model predictions to the the
results of Kruse et al. [24], Kruse and Rubinstein [25].
Maximal effect of MII on CTL recruitment, aC;MII: To
estimate the migration of CD8+ cells across the BBB, we
used Marcondes et al. [53] reporting that the number of
migrating CD4+ cells is similar to that of CD8+ cells.
According to Phillips and Lampson [57], who investigated
the migration of CD4+ cells, within 2 days about 40 CD4+
T cells cross the BBB within a volume of a slide. We
calculated the volume of a slide as its cross section area
multiplied its depth: 9.2 · 10– 6m2�6 · 10– 6m = 55.2 · 10–
6ml. Therefore, for a 100 ml tumor the maximal number of
the CD8+ cells recruited per hour is:
100 ml � 40 cells
55:2� 10�6ml � 48 h� 1:5� 106 cells/h:
To obtain the estimation for aC;MII; we had to divide the
latter number by the estimated number of MHC II recep-
tors, which can be calculated as: (number of M II per
cell) · (number of tumor cells).
Bosshart and Jarrett [49] found that the MHC II density
on cell surface is about 2 · 103 rec/lm2. We assumed half
of that density (because there is poor presentation on tumor
cells) and took the surface area of a cell of a diameter of
5 lm to be about 314 lm2. For this calculation, we esti-
mated the number of tumor cells to be 1011, in agreement
with the earlier assumption of 100 ml tumor volume. Thus,
aC;MII¼ 1:5� 106cell � h�1
314 mm2 � cell�1 � 103 rec �mm�2 � 1011cells
� 4:8� 10�11 cell=ðh � recÞ:
Michaelis constant for the effect of MII on CTL
recruitment, eC;MII: We estimated that number to be
1014 rec. This is a rough estimation of the total number
of receptors on all the tumor cells, whose number is
estimated to be between 1010 and 1011 cells, while there are
hundreds to thousands of receptors on each cell.
Maximal reduction effect of TGF-b on CTL recruit-
ment, aC,b. Thomas and Massague [42] found that excess
of TGF-b inhibits the proliferation of CTLs up to 50%
within 3 h. Therefore, we estimated the maximal inhibi-
tion of CTL recruitment per hour by TGF-b to beffiffi½
p3�1
2h�1 � 0:8 h�1:
Michaelis coefficient for the reduction effect of TGF-bon CTL recruitment, eC,b. Similarly to eT,b, we took this
value to be of order of magnitude of the base line found by
Peterson et al. [55] multiplied by the volume of the CNS.
Thus, eC;b ¼ 60:9 pgml� 150 ml � 104pg:
Death rate of CTLs, lC. Taylor et al. [58] find CTL half
life to be 3.9 days so its hourly death rate was estimated to
be ln 2
72 h� 0:007 h�1:
Degradation rate of TGF-b, lb. Coffey et al. [50] find
that the hepatic half life of TGF-b is 2.2 min. Because of
the distance of the liver from the and because of the
necessity to pass the BBB, the actual brain TGF-b break-
down rate will be slower. We estimated it to be 6 min.
Thus, the hourly breakdown rate is ln 2
0:1 h�1 � 7 h�1:
Constant base level production of TGF-b, gb. Peterson
et al. [55] found the concentration of TGF-b to be 609 pg/
ml in the cerebral spinal fluid (CSF) of a GBM patient,
which was tenfold higher than the level found in healthy
subjects. We assumed that the volume of the CSF is
150 ml. In a healthy subject there is no tumor production of
TGF-b, therefore at steady state we obtained:
0 ¼ gb � lb � Fb:
Thus, using previously calculated parameter values
gb ¼ 7 h�1 � 60:9 pgml� 150 ml ¼ 63; 945 pg/h:
Production rate of TGF-b by a single tumor cell, ab,T.
Using Peterson et al. [55] we found that for a GBM patient
the mean level of TGF-b is 609 pg �ml�1 � 150 ml ¼91; 350 pg: We used previously calculated parameter val-
ues: lb = 7 h–1, T = 1011 cells. Using Eq. (3) at steady
state, we got
ab;T ¼91; 350 pg � 7 h�1 � 63; 945 pg � h�1
1011 cells
� 5:75� 10�6 pg=ðcells � hÞ:
Production rate of IFN-c by a single CTL, ac,C. Kim
et al. [19] report expression of 200 pg/ml of IFN-c by
CTLs. We assumed there were 2�105 CTL/ml and using lc
= 0.102 h–1 we obtained from Eq. (4) at steady state
ac;C ¼ 0:102 h�1�200 pg�ml
�1
2�105 cells�ml�1 ¼ 1:02 � 10�4 pg=ðcells � hÞ:
Degradation rate of IFN-c, lc. Turner et al. [59] find the
median half life of IFN-c to be 6.8 h. Thus,
lc ¼ ln 2
6:8 h¼ 0:102 h�1:
Constant base level production of MHC I, gMI: Kagey-
ama et al. [51] find that the number of MI receptors on cell
surface varies from less than ten to several thousands. For
the purpose of the following calculation we assumed MI
= 100 rec/cell. In the absence of IFN-c, taking
lMI¼ 0:0144 h�1 and substituting into Eq. (5) at steady
state, we obtained: gMI¼ 100 rec � cell�1 � lMI
¼ 1:44 rec=
ðcells � hÞ:
Cancer Immunol Immunother
123

Maximal production rate of MHC I induced by IFN-c,
aMI;c: According to Yang et al. [47] the expression of MHC
I receptors on some GBM tumor cells is increased threefold
when subjected to excess of IFN-c. This gave us the fol-
lowing ratio: aMI;c ¼ 2� gMI; therefore aMI;c ¼ 2:88 rec=h:
Michaelis constant for the production rate of MHC I
induced by IFN-c,eMI;c: Yang et al. [47] find a range of MI
values as a result of IFN-c treatment. However, they display
their results using a scoring scale of MHC I expression which
needs to be re-scaled to receptor number. We calibrated MI in
the absence of IFN-c to be equivalent to a scoring level of 1.5.
Next we took the value of IFN-c to be 100 units/ml for MHC
I expression level of 2.5 according to the above score.
Substituting into Eq. (5) we obtain: for Fc = 0
gI
lI
¼ 1:5;
and for Fc = 100 U
gI þaMI ;c�Fc
FcþeMI ;c
lI
¼ 2:5:
From these two equations we obtain:
eMI;c ¼ Fc �3
2
aMI;c
gMI
� 1
� �:
As mentioned above, the value ofaMI ;c
gMI
is 2. According to
Pharmingen manufacturer information, the relation
between the used units and IFN-c quantities is in
0.6 · 108 units/mg. Thus, Fc ¼ 100 units=ml0:6�108units=mg
¼ 1:67�10�6 mg=ml: Substituting into the previous and taking
into account the volume of 100 ml, we obtain:
eMI;c ¼ Fc � 2 � 100 ml ¼ 5 � 10�4mg ¼ 3:38 � 105 pg:
Degradation rate of MHC I receptors, lMI: Milner et al.
[54] find that the half life of MHC I molecules varies
between 6 and 96 h. We take a representative value to be
48 h. Therefore, the degradation rate is: ln 2
48 h� 0:0144 h�1:
Parameters for the influence of IFN-c on MHC II
expression, aMII;c; eMII;c: Phillips et al. [56] use IFN-cinjections to the brain and increase expression of MHC
class II 5 fold. To scale this immunoreactivity we used data
from Bosshart and Jarrett [49] who found a fourfold vari-
ation in MHC class II expression. Substituting into Eq. (6)
at steady state, we obtained the following equation with
two unknown variables aMII;c and eMII;c :
aMII;c � Fc
Fc þ eMII;c� lMII
�MII ¼ 0;
and with two sets of parameters values:
1. Fc ¼ 10; 000 U=site; MII ¼ 1:9 � 103 recmm2 � 314 lm2
ð314 lm2 being the area of cell surface) and
lMII¼ 0:0144 h�1;
2. Fc ¼ 30 U=site;MII ¼ 0:5 � 103 recmm2 � 314 mm2 and
lMII¼ 0:0144 h�1:
IFN-c unit is given by 0.6 · 108 u/mg we obtained:
aMII;gc ¼ 8; 660 rec=ðcells � hÞ::eMII;c ¼ 1; 420 pg:
Parameters for the influence of TGF-b on MHC II
expression, aMII;b; eMII;b: Suzumura et al. [40] report a drop
of 98.8% in MHC expression when using 100 ng/ml TGF-
b. We interpreted this result as maximal inhibition and
estimated: aMII;b ¼ 0:012:
Suzumura et al. [40] report also that a dose of 10 ng/ml
of TGF-b we get a drop of 89.8% in MHC expression. This
gave the following equation:
ð1� aMII;bÞeMII;b
Fb þ eMII;bþ aMII;b ¼ 0:102
Substituting into the above equation Fb ¼ 10 ngml� 100 ml we
obtained:
eMII;b ¼ 105 pg:
Degradation rate of MHC II receptors, lMII: According
to Lazarski et al. [52], MHC class II molecule half life
varies between 10 and 150 h. We assumed a representing
half life of 48 h and therefore lMII¼ ln 2
48 h� 0:0144 h�1:
References
1. Agur Z, Arnon R, Schechter B (1988) Reduction of cytotoxicity
to normal tissues by new regimes of phase-specific drugs. Math
Biosci 9:1–15
2. Andaloussi AE, Lesniak MS (2006) An increase in CD4+ CD25
FOXP3+ regulatory T cells in tumor-infiltrating lymphocytes of
human glioblastoma multiforme. Neurooncol 8:234–243
3. Arakelyan L, Merbl Y, Agur Z (2005) Vessel maturation effects
on tumor growth: validation of a computer model in implanted
human ovarian carcinoma spheroids. Eur J Cancer 41:159–167
4. Arciero JC, Jackson TL, Kirschner DE (2004) A mathematical
model of tumor-immune evasion and siRNA treatment. Discret
Contin Dyn S B 4:39–58
5. Bodmer S, Strommer K, Frei K, Siepl C, de Tribolet N, Heid I,
Fontana A (1989) Immunosuppression and transforming growth
factor-beta in glioblastoma. Preferential production of trans-
forming growth factor-beta 2. J Immunol 143:3222–3229
6. Burger PC, Vogel FS, Green SB, Strike TA (1985) Glioblastoma
multiforme and anaplastic astrocytoma, pathologic criteria and
prognostic implications. Cancer 56:1106–1111
7. Cappuccio A, Elishmereni M, Agur Z (2006) Cancer immuno-
therapy by interleukin-21 potential treatment startegies evaluated
in a mathematical model. Cancer Res 66:7293–7300
Cancer Immunol Immunother
123

8. Carpentier PA, Begolka WS, Olson JK, Elhofy A, Karpus WJ,
Miller SD (2005) Differential activation of astrocytes by innate
and adaptive immune stimuli. Glia 49:360–374
9. Fine HA (2004) Toward a glioblastoma vaccine: promise and
potential pitfalls. J Neurooncol 22:4240–4243
10. Goff BA, Matthews BJ, Wynn M, Muntz HG, Lishner DM,
Baldwin LM (2006) Ovarian cancer: patterns of surgical care
across the United States. Gyneocol Oncol 103:383–390
11. Cojocaru L, Agur Z (1992) Theoretical analysis of interval drug
dosing for cell-cycle-phase-specific drugs. Math Biosci 109:85–97
12. Gomez GG, Kruse CA (2006) Mechanisms of malignant glioma
immune resistence and sources of immunosupression. Gene Ther
Gene Mol Biol 10:133–146
13. Gomez GG, Kruse CA (2007) Cellular and functional charac-
terization of immunoresistant human glioma cell clones selected
with alloreactive cytotoxic T lymphocytes reveals their up reg-
ulated synthesis of biologically active TGF-b. J Immunother
30:261–273
14. Gomez GG, Varella-Garcia M, Kruse CA (2006) Isolation of
immunoresistant human glioma cell clones after selection with
alloreactive cytotoxic T lymphocytes: cytogenetic and molecular
cytogenetic characterization. Cancer Genet Cytogenet 165:121–
134
15. Graf MR, Sauer JT, Merchant RE (2005) Tumor infiltration by
myeloid suppressor cells in response to T cell activation in rat
gliomas. J Neurooncol 73:29–36
16. Gunther N, Hoffman GW (1982) Qualitative dynamics of a net-
work model of regulation of the immune system: a rationale for
the IgM to IgG switch. J Theor Biol, pp 815–855
17. Hickey WF (2001) Basic principles of immunological surveil-
lance of the normal central nervous system. Glia 36:118–124
18. Hussain SF, Yang D, Suki D, Aldape K, Grimm E, Heimberger
AB (2006) The role of human glioma-infiltrating microglia/
macrophages in mediating antitumor immune responses. Neuro-
oncol 8:261–279
19. Kim JJ, Nottingham LK, Sin JI, Tsai A, Morrison L, Oh J, Dang
K, Hu Y, Kazahaya K, Bennett M, Dentchev T, Wilson DM,
Chalian AA, Boyer JD, Agadjanyan MG, Weiner DB (1998) CD8
positive T cells influence antigen-specific immune responses
through the expression of chemokines. J Clin Invest 102:1112–
1124
20. Kirschner D, Panetta JC (1998) Modelling immunotherapy of the
tumor-immune interaction. J Math Biol 37:235–252
21. Kleihues P, Soylemazoglu F, Schauble B, Schniethauer BW,
Bruger PC (1995) Histopathology, classification, and grading of
gliomas. Glia 15:211–221
22. Kleihues P, Louis DN, Scheithauer BW, Rorke LB, Reifenberger
G, Burger PC, Cavenee WK (2002) The WHO classification of
tumors of the nervous system. J Neuropathol Exp Neurol 61:215–
225
23. Kreschmer K, Apostolou I, Jaeckel E, Khazaie K, von Boehmer
H (2006) Making regulatory T cells with defined antigen speci-
ficity: role in autoimmunity and cancer. Immunol Rev 212:163–
169
24. Kruse CA, Cepeda L, Owens B, Johnson SD, Stears J, Lillehei
KO (1997) Treatment of recurrent glioma with intracavitary al-
loreactive cytotoxic T lymphocytes and Interleukin-2. Cancer
Immunol Immnother 45:77–87
25. Kruse CA, Rubinstein D (2001) Cytotoxic T-lymphcytes reactive
to patient major histocompatibility complex proteins for therapy
of brain tumors. In: Liau LM, Becker DP, Cloughesy TF, Bigner
DD (eds) Brain Tumor Immunotherapy. Humana, Totowa, pp
149–170
26. Kuznetzov VA, Makalkin IA, Taylor MA, Perelson AS (1994)
Nonlinear dynamics of immunologenic tumors: parameters
estimation and global bifurcation analysis. Bull Math Biol
56:295–321
27. Liau LM, Prins RM, Kiertscher SM, Odesa SK, Kremen TJ,
Giovannone AJ, Lin JW, Chute DJ, Mischel PS, Cloughesy TF,
Roth MD (2005) Dendritic cell vaccination in glioblastoma
patients systemic and intracranial T-cell response modulated by
the local central nervous system tumor microenvironment. Clin
Cancer Res 11:5515–5524
28. Lopez M, Aguilera R, Perez C, Mendoza-Naranjo A, Pereda C,
Ramirez M, Ferrada C, Aguillon JC, Salazar-Onfray F (2006) The
role of regulatory T lymphocytes in the induced immune response
mediated by biological vaccines. Immunobiology 211:127–136
29. Marchuk GI, Petrov RV, Romanyukha AA, Bocharov GA (1991)
Mathematical model of antiviral immune response. I. Data
analysis, generalized picture construction and parameters evalu-
ation for hepatitis B. J Theor Biol 7–151(1):1–40
30. Morgan RA, Dudley ME, Wunderlich JR, Hughes MS, Yang JC,
Sherry RM, Royal RE, Topalian SL, Kammula US, Restifo NP,
Zheng Z, Nahvi A, de Vries CR, Rogers-Freezer LJ, Mavroukakis
SA, Rosenberg SA (2006) Cancer regression in patients after
transfer of genetically engineered lymphocytes. Science
314:126–129
31. Panek RB,Benveniste EN (1995) Class II MHC gene expression
in microglia. J Immunol 154:2846–2854
32. de Pillis LG, Radunskaya AE, Wiseman CL (2005) A validated
mathematical model of cell-mediated immune response to tumor
growth. Cancer Res 65:7950–7958
33. de Pillis LG, Gu W, Radunskaya AE (2006) Mixed immuno-
therapy and chemotherapy of tumors: modeling, applications and
biological interpretations. J Theor Biol 238:841–862
34. Proescholdt MA, Merrill MJ, Ikejiri B, Walbridge S, Akbasak A,
Jacobson S, Oldfield EH (2001) Site-specific immune response to
implanted gliomas. J Neurosurg 95:1012–1019
35. Read SB, Kulprathipanja NV, Gomez GG, Paul DB, Winston KR,
Robbins JM, Kruse CA (2003) Human alloreactive CTL inter-
actions with gliomas and with those having upregulated HLA
expression from exogenous IFN-c or IFN-c gene modification. J
Interferon Cytokine Res 23:379–393
36. Skomorovski K, Harpak H, Ianovski A, Vardi M, Visser TP,
Hartong SC, van Vliet HH, Wagemaker G, Agur Z (2003) New
TPO treatment schedules of increased safety and efficacy: pre
clinical validation of a thrombopoiesis simulation model. Br J
Haematol 123:683–691
37. Soos JM, Krieger JI, Stuve O, King CL, Patarroyo JC, Aldape K,
Wosik K, Slavin AJ, Nelson PA, Antel JP, Zamvil SS (2001)
Malignant glioma cells use MHC class II transactivator (CIITA)
promoters III and IV to direct IFN-c-inducible CIITA expression
and can function as nonprofessional antigen presenting cells in
endocytic processing and CD4+ T-cell activation. Glia 36:391–
405
38. Steiner HH, Bonsanto MM, Beckhove P, Brysch M, Geletneky K,
Ahmadi R, Schuele-Freyer R, Kremer P, Ranaie G, Matejic D,
Bauer H, Kiessling M, Kunze S, Schirrmacher V, Herold-Mende
C (2004) Antitumor vaccination of patients with glioblastoma
multiforme: a pilot study to assess feasibility, safety, and clinical
benefit. J Clin Oncol 22:4272–4281
39. Strik HM, Stoll M, Meyermann R (2004) Immune cell infiltration
of intrinsic and metastatic intracranial tumors. Anticancer Res
24:37–42
40. Suzumura A, Sawada M, Yamamoto H, Marunouchi T (1993)
Transforming growth factor-b suppresses activation and prolif-
eration of microglia in vitro. J Immunol 151:2150–2158
41. Swanson KR, Bridge C, Murray JD, Alvord EC Jr (2003) Virtual
and real brain tumors: using mathematical modeling to quantify
glioma growth and invasion. J Neurol Sci 216:1–10
Cancer Immunol Immunother
123

42. Thomas DA and Massague J (2005) TGF-b directly targets
cytotoxic T cell functions during tumor evasion of immune sur-
veillance. Cancer Cell 8:369–380
43. de Vleeschouwer S, Rapp M, Sorg R, Steiger H, van Gool S,
Sabel M (2006) Dendritic cell vaccination in patients with
malignant gliomas: current status and future directions. Neuro-
surgery 59:988–999
44. Weller M, Fontana A (1995) The failure of current immuno-
therapy for malignant glioma. Tumor-derived TGF-beta, T-cell
apoptosis, and the immune privilege of the brain. Brain Res Brain
Res Rev 21:128–151
45. Wheeler RD, Zehntner SP, Kelly LM, Bourbonniere L, Owens T
(2006) Elevated interferon gamma expression in the central
nervous system of tumor necrosis factor receptor 1-deficient mice
with experimental autoimmune encephalomyelitis. Immunology
118:527–538
46. Wiseman CL, Kharazi A (2006) Objective clinical regression of
metastatic breast cancer in disparate sites after use of whole cell
vaccine genetically modified to release Sargarmostim. Breast J
12:475–480
47. Yang I, Kremen TJ, Giovannone AJ, Paik E, Odesa SK, Prins
RM, Liau LM (2004) Modulation of major histocompatibility-
complex class I molecules and major histocompatibility complex-
bound immunogenic peptides induced by interferon a and inter-
feronc treatment of human glioblastoma multiforme. J Neurosurg
100:310–319
48. Zagzag D, Salnikow K, Chiriboga L, Yee H, Lan L, Ali MA,
Garcia R, Demaria S, Newcomb EW (2005) Downregulation of
major histocompatibility complex antigens in invading glioma
cells: stealth invasion of the brain. Lab Invest 85:328–341
49. Bosshart H and Jarrett RF (1998) Deficient major histocopati-
bility complex class II antigen presentation in a subset of
Hodgkin’s disease tumor cells. Blood 92:2252–2259
50. Coffey RJ, Kost LJ, Lyons RM, Moses HL, LaRusso NF (1987)
Hepatic processing of transforming growth factor b in the rat
uptake, metabolism, and biliary excretion. J Clin Invest 80:750–
757
51. Kageyama S, Tsomides TJ, Sykulev Y, Eisen HN (1995) Varia-
tions in the number of peptide–MHC class I complexes required
to activate cytotoxic T cell responses. J Immunol 154:567–576
52. Lazarski CA, Chaves FA, Jenks SA, Wu S, Richards KA, Weaver
JM, Sant AJ (2005) The Kinetic stability of MHC class II: peptide
complexes is a key parameter that dictates immunodominance.
Immunity 23:29–40
53. Marcondes MC, Burudi EM, Huitron-Resendiz S, Sanchez-Al-
avez M, Watry D, Zandonatti M, Henriksen SJ, Fox HS (2001)
Highly activated CD8+T cells in the brain correlate with early
central nervous system dysfunction in simian immunodeficiency
virus infection. J Immunol 167:5421–5438
54. Milner E, Barnea E, Beer I, Admon A (2006) The turnover
kinetics of MHC peptides of human cancer cells. Mol Cell Pro-
teomics 5:366–378
55. Peterson PK, Chao CC, Hu S, Thielen K, Shaskan E (1992)
Glioblastoma, transforming growth factor-b, and Candida men-
ingitis: a potential link. Am J Med 92:262–264
56. Phillips LM, Simon PJ, Lampson LA (1999) Site-specific
immune regulation in the brain: differential modulation of major
histocompatibility complex (MHC) proteins in brainstem vs.
hippocampus. J Comp Neurol 405:322–333
57. Phillips LM, Lampson LA (1999) Site-specific control of T
cell traffic in the brain: T cell entry to brainstem vs. hippo-
campus after local injection of IFN-c. J Neuroimmunol
96:218–227
58. Taylor GP, Hall SE, Navarrete S, Michie CA, Davis R, Witkover
AD, Rossor M, Nowak MA, Rudge P, Matutes E, Bangham CR,
Weber JN (1999) Effect of Lamivudine on human T-cell leuke-
mia virus type 1 (HTLV-1) DNA copy number, T-cell phenotype,
and anti-tax cytotoxic T-cell frequency in patients with HTLV-1-
associated myelopathy. J Virol 73:10289–10295
59. Turner PK, Houghton JA, Petak I, Tillman DM, Douglas L,
Schwartzberg L, Billups CA, Panetta JC, Stewart CF (2004)
Interferon-gamma pharmacokinetics and pharmacodynamics in
patients with colorectal cancer. Cancer Chemother Pharmacol
53:253–260
60. Wick WD, Yang OO, Corey L, Self SG (2005) How many human
immunodeficiency virus type 1-infecfted target cells can a cyto-
toxic T-lymphocyte kill? J Virol 79:13579–13586
Cancer Immunol Immunother
123
Related Documents