International Journal of Aviation, International Journal of Aviation, Aeronautics, and Aerospace Aeronautics, and Aerospace Volume 1 Issue 4 Article 3 10-23-2014 Improving Airplane Touchdown Control by Utilizing the Adverse Improving Airplane Touchdown Control by Utilizing the Adverse Elevator Effect Elevator Effect Nihad E. Daidzic Ph.D., Sc.D. AAR Aerospace Consulting, LLC, [email protected] Follow this and additional works at: https://commons.erau.edu/ijaaa Part of the Aeronautical Vehicles Commons, Control Theory Commons, Dynamic Systems Commons, Navigation, Guidance, Control and Dynamics Commons, and the Ordinary Differential Equations and Applied Dynamics Commons Scholarly Commons Citation Scholarly Commons Citation Daidzic, N. E. (2014). Improving Airplane Touchdown Control by Utilizing the Adverse Elevator Effect. International Journal of Aviation, Aeronautics, and Aerospace, 1(4). https://doi.org/10.15394/ ijaaa.2014.1032 This Article is brought to you for free and open access by the Journals at Scholarly Commons. It has been accepted for inclusion in International Journal of Aviation, Aeronautics, and Aerospace by an authorized administrator of Scholarly Commons. For more information, please contact [email protected], [email protected].

Welcome message from author
This document is posted to help you gain knowledge. Please leave a comment to let me know what you think about it! Share it to your friends and learn new things together.
Transcript
International Journal of Aviation, International Journal of Aviation,
Aeronautics, and Aerospace Aeronautics, and Aerospace
Volume 1 Issue 4 Article 3
10-23-2014
Improving Airplane Touchdown Control by Utilizing the Adverse Improving Airplane Touchdown Control by Utilizing the Adverse
Elevator Effect Elevator Effect
Nihad E. Daidzic Ph.D., Sc.D. AAR Aerospace Consulting, LLC, [email protected]
Follow this and additional works at: https://commons.erau.edu/ijaaa
Part of the Aeronautical Vehicles Commons, Control Theory Commons, Dynamic Systems Commons,
Navigation, Guidance, Control and Dynamics Commons, and the Ordinary Differential Equations and
Applied Dynamics Commons
Scholarly Commons Citation Scholarly Commons Citation Daidzic, N. E. (2014). Improving Airplane Touchdown Control by Utilizing the Adverse Elevator Effect. International Journal of Aviation, Aeronautics, and Aerospace, 1(4). https://doi.org/10.15394/ijaaa.2014.1032
This Article is brought to you for free and open access by the Journals at Scholarly Commons. It has been accepted for inclusion in International Journal of Aviation, Aeronautics, and Aerospace by an authorized administrator of Scholarly Commons. For more information, please contact [email protected], [email protected].

Thousands of landings in commercial transport-category (FAA, 2013)
airplanes are executed every single day all over the world. Accurate touchdowns
are crucial in saving excessive wear and tear on brakes, tires, and airplane
structure. They are especially critical when landing on wet and/or contaminated
runways or during LAHSO operations. Despite so much operational experience,
the control of landing flare and touchdown accuracy is still a “hit or miss” event.
The statistics on touchdown points and the large scatter of data indicates that
landings are not very accurate even when full auto-land capabilities are used
(FAA, 2007). Large operational cushions (67% for dry DLDR and 92% for wet
WLDR runway) are provided over (un-factored gross measured) demonstrated
dry landing distance (gross DDLD) for airplanes used in commercial air
transportation (e.g., Title 14 CFR 121). Contaminated runways may require 2-3
times longer runway lengths than DDLD (Daidzic & Shrestha, 2008; Daidzic,
2011a). The highest frequency of transport-category airplane incident/accidents
occurs indeed during the landing/rollout phase.
In normal daily operations, various studies over many decades have shown
the standard deviation (SD) of touchdown points in manual landings to be roughly
1000 feet for any particular transport-category airplane type. This indicates that
more than 30% of touchdowns are actually exceeding even these large
uncertainties. A significant percentage of touchdowns occurs beyond the 3,000 ft
markers (touchdown zone) which reduces the margin for error when landing on
slippery runways. The lowering of the nose gear often takes unnecessarily long
time in line operations further reducing the distance margins for subsequent
deceleration (Daidzic & Shresta, 2008). Not every long-landing results in a
runway overrun, but in every overrun accident, landing long and having poor
touchdown control was a major contributing factor (Daidzic & Shresta, 2008;
Daidzic 2009a, 2009b, 2009c, 2011a, 2013). Contemporary conventional flight
control design and pilot training does not address landing touchdown accuracy
and control sufficiently well.
The main gear touchdown point depends on many factors, such as, proper
vertical flight-path, airspeed, crossing threshold at appropriate height, proper
thrust management, height and flight load in flare, atmospheric turbulence and
wind, etc. The landing maneuver can be seen as a management of the airplane’s
total energy. A conventional landing flare maneuver involves pitching airplane
slightly up while simultaneously closing the throttles when the gear height is
“about right” (Blake and Elliott, 1991; Daidzic, 2011b; Davis, 1971; Denton,
1993; Lowery, 2001; Schiff, 1997; Webb and Walker, 2004). To pitch the
airplane up, a pilot must pull elevator up which initially generates unbalanced
downward force thereby rotating airplane’s nose up and ultimately increasing the
1
Daidzic: Adverse Elevator Effect
Published by Scholarly Commons, 2014

pitch angle, the Angle-of-Attack (AOA), and reducing the flight path angle (must
still be negative for positive touchdown). However, before an airplane starts
pitching up, increasing AOA and lift, the initial airplane’s reaction will be
downward acceleration due to unbalanced tail down lift increment (Phillips, 1979;
Grantham et al, 1987). This phenomenon is called Adverse Elevator Effect
(AEE). There is nothing peculiar about it as all conventional flight controls
initially exhibit adverse responses.
In a cruise flight one is not much concerned about the AEE and small
altitude loss (several feet at maximum) before an airplane actually starts climbing.
However, in landing approach several feet could mean a difference between a
smooth and a hard landing with possible bounce, balloon, extended float, runway
overrun, etc. But even worse than this well-known reverse-altitude response is the
time-lag (dead-time) introduced by the AEE and the “nothing-happening-when-
pulling-elevator” syndrome. As many studies have shown and almost every pilot
knows, it is almost impossible to make consistent (manual or automatic) landings
and touchdowns. Landing flare maneuver in transport-category airplanes is
somewhat mechanical although many would not admit it. Landing flare is indeed
of very short duration and thus very difficult to practice and refine.
The abbreviated review of some important publications on landing flare
presented here is neither exhaustive nor complete. A whole article would be
required just to review all the work done in the past 50+ years on landing
dynamics of jet airplane. One of the first studies of landing touchdowns in
turboprop and turbojet-type airplanes was conducted by Stickle (1961). The
author found that most of the touchdowns occurred at airspeeds of 22.5 to 26.6%
above the stalling speed. He also found that 1-in-100 touchdowns occurred
beyond 2,800 ft from the runway threshold in turbojet-type airplanes. White
(1968) presented a very simple model of landing flare which did not have the
sophistication required to model the AEE. The AEE was known, but not
understood or appreciated well enough before the arrival of the large airplanes
and the onset of the “jet-age”. To the best of our knowledge, the first serious
theoretical analysis of landing flare was presented by Pinsker (1969). The author
used the Laplace transform on the simplified linear 3-DOF longitudinal airplane
dynamics model to obtain the short-term aircraft response after step and ramp
elevator control applications. Unfortunately, Pinsker’s original work on AEE had
some typographical errors in equations used. The author himself was truly a giant
of aircraft stability, control, and performance theory who made numerous
important contributions to the field and who also provided inspiration to the
author of this article. Cleveland (1970) discussed handling qualities of
conventional aircraft designs. As Cleveland pointed out, reverse altitude response
2
International Journal of Aviation, Aeronautics, and Aerospace, Vol. 1 [2014], Iss. 4, Art. 3
https://commons.erau.edu/ijaaa/vol1/iss4/3DOI: https://doi.org/10.15394/ijaaa.2014.1032

(i.e., AEE) can be accepted if the longitudinal time-lag of response does not
exceed 2 seconds criterion. As an example Cleveland used C-5A with a dead-time
in pitch response of about 0.8 s. The conclusion made is that future very large
aircraft may indeed need canard surface and perhaps Direct Lift Control (DLC)
due to unacceptable dead-time in pitch response. Lykken and Shah (1972)
discussed the use of DLC to improve the pitch response lag times and better
vertical response control in large airplanes (Lockheed’s L-1011). This was
especially important for the precise glideslope control and tracking during
Category III ILS approaches where almost instantaneous lift management is
critical. Seckel (1975) presented his study of the landing flare in light GA airplane
(variable-stability Navion) and did not mention AEE as relevant to landing flare.
Phillips (1979) presented his in-depth analysis of altitude response based on the
impulse, step and ramp elevator application. The author used the case of Space
Shuttle orbiter and other four (military) aircraft of which some were used in
power-off landing scenarios to investigate approach and landing dynamics. The
author used 3-DOF linearized equations of longitudinal aircraft dynamics. His
results predicted altitude loss and time-delay of proverse flight-controls effect of
1-2 seconds. Phillips made no connection between the reverse altitude response
and the landing flare. Grantham et al (1987) performed full 6-DOF simulation and
piloted study of handling qualities in pitch response lag for a large transport-
category airplane (Lockheed’s L-1011). Abzug and Larrabee (1997) discussed,
among many other things, the handling properties and reverse altitude response of
very large aircraft during landing flare. The authors merely repeated the
arguments already given by Cleveland (1970) and Phillips (1979) and were using
STS’s space shuttle orbiter’s sluggish and inadequate longitudinal dynamic and
time-lags in pitch response that exceeds 2 seconds. Merat (2008) considered the
use of DLC in Airbus 380 due to its anticipated sluggish longitudinal dynamics in
landing. Merat showed the existence of the reverse altitude response and the way
to mitigate it using the DLC. Merat employed the standard small-perturbation 3-
DOF state space analysis of longitudinal dynamics. It may still be too early to
determine if A380 may indeed need DLC in the future. Zaal et al (2008) studied
the effect of pitch and heave motion cues in a pitch control task. Detecting AEE
accurately may be critical in our ability to use it for our advantage. The issue of
AEE was revisited in publications by Daidzic (2010, 2011b), where for the first
time it was suggested to be used to pilot’s advantage during landing flare and a
new landing technique for large airplanes has been proposed. Very recently
Malmquist et al (2014) presented their study of kinematic effects in large
transport aircraft mentioning the reverse altitude response. Authors also
recommended incorporating training concerning kinematic issues for operators of
large aircraft.
3
Daidzic: Adverse Elevator Effect
Published by Scholarly Commons, 2014

Historically, very little “science” existed in pilot education, training and
execution of the landing flare maneuver. This led to large scatter in touchdown
points and much too frequently a runway overrun (Daidzic, 2009b, 2009c, 2011a,
2011c). Typically, an airplane travels horizontally about 200-250 feet every
second in flare maneuver. Any prolonged float, bounce, and/or ballooning uses
runway excessively and makes overrun or subsequent heavy breaking more
probable and dramatic.
An illustration of landing flare (round-out) maneuver is shown in Figure 1.
It is assumed that a constant flight load is maintained during flare curve which
then represents a segment of a circle. One has to be very careful with the
definition of the flare height which is not the same as a runway threshold crossing
height (TCH). Any horizontal distance covered in actual flare must be added to
the distance covered to descend from the TCH to flare height (if lower). Proper
flare height and accompanied horizontal flare distance can theoretically be zero if
no-flare touchdown is made. Once the airplane’s gear height achieves
“appropriate” flare height, the pilot starts the pull-up maneuver while
simultaneously closing the throttles. So much latitude exists here as various flare
heights with different pitch-up load profiles of various durations are used. The
purpose of a good landing flare is to progressively pitch up an airplane to a proper
touchdown attitude and arresting the sink rate, while simultaneously avoiding
bounce, float, and/or ballooning. This is by no means a simple task as the
maneuver is very short and the human and airplane inertia makes the feedback
process complicated and sluggish at best.
Figure 1. Flare maneuver. Not to scale. Angles and distances are highly
exaggerated for better visual representation.
4
International Journal of Aviation, Aeronautics, and Aerospace, Vol. 1 [2014], Iss. 4, Art. 3
https://commons.erau.edu/ijaaa/vol1/iss4/3DOI: https://doi.org/10.15394/ijaaa.2014.1032

The rounding out maneuver can be executed using infinite combinations
of flight load profiles of different durations. Often, the pilot is interested in gentle
rounding-out maneuver which offers more time to monitor progress for “normal”
touchdowns. However, gentle flare will result in touching down long and wasting
usable runway. If the runway is contaminated and/or LAHSO operations are in
use, this could cause serious problems in subsequent ground-roll braking efforts,
as well-documented accidents history has unfortunately shown. An additional
horizontal distance will be covered in curved path beyond the point of straight
descent (glidepath) and runway intercept as shown in Figure 1. The operational
practice of many operators uses fixed flare height (e.g., 30-ft for wide-body and
15-20 ft for narrow-body) which pilots are then instructed to follow. There is
rarely any compensation for variable conditions and everything is left to the
pilot’s experience of how to flare and control touchdown.
The flare height can be estimated from Daidzic & Shrestha (2008), by
assuming constant (or averaged) instantaneous flare flight-load:
FL
TDAPPTDAPP
FL
FLFLFL
ng
RODROD
ng
vh
2)1(2
2222
22
(1)
Where:
11
FLFLFLFLFLGS
TAS
wFL nnvv
v
v
The “proper” flare heights versus approach rate-of-descent (ROD) and
various flight loads for touchdown vertical of 200 and 100 fpm respectively using
Equation 1 is shown in Figures 2 and 3. Since the normal landing reference
airspeed is 30% over the stall speed in a given configuration, the maximum
vertical flight load allowed is 1.69 which is depicted as dashed line. Similar
results are shown in Figure 4, only this time for the zero-sink or tangential
(“greaser”) touchdown. If the touchdown angle is the same as the approach angle
the “proper” flare height is obviously zero. While instantaneous application of
constant flare load was assumed here, Pinsker (1969) considered time evolution of
pitch response.
Computations of the flare height as a function of approach ROD (just
before flare starts), pull-up g-force in flare, and touchdown RODs of 200 fpm and
zero-sink (in parenthesis) at ground speed of 250 fps (148 knots) are summarized
in Table 1. Again, great sensitivity of the proper flare height on the actual descent
5
Daidzic: Adverse Elevator Effect
Published by Scholarly Commons, 2014
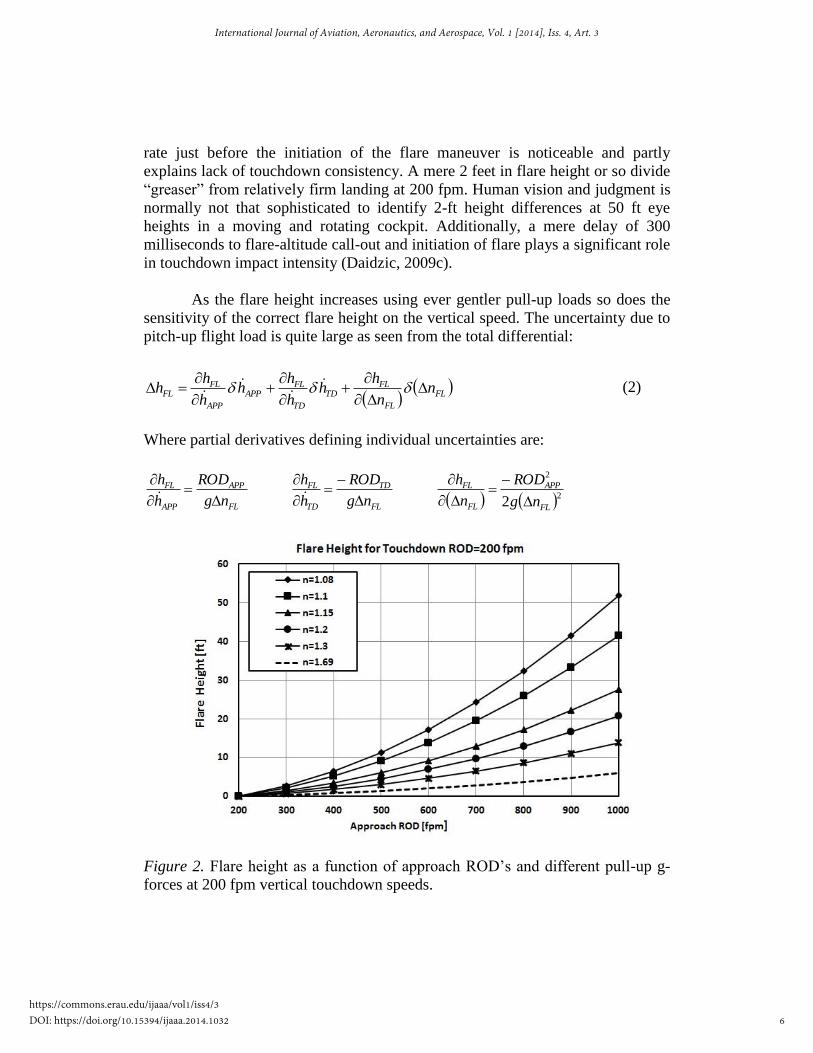
rate just before the initiation of the flare maneuver is noticeable and partly
explains lack of touchdown consistency. A mere 2 feet in flare height or so divide
“greaser” from relatively firm landing at 200 fpm. Human vision and judgment is
normally not that sophisticated to identify 2-ft height differences at 50 ft eye
heights in a moving and rotating cockpit. Additionally, a mere delay of 300
milliseconds to flare-altitude call-out and initiation of flare plays a significant role
in touchdown impact intensity (Daidzic, 2009c).
As the flare height increases using ever gentler pull-up loads so does the
sensitivity of the correct flare height on the vertical speed. The uncertainty due to
pitch-up flight load is quite large as seen from the total differential:
FL
FL
FLTD
TD
FLAPP
APP
FLFL n
n
hh
h
hh
h
hh
(2)
Where partial derivatives defining individual uncertainties are:
22
2 FL
APP
FL
FL
FL
TD
TD
FL
FL
APP
APP
FL
ng
ROD
n
h
ng
ROD
h
h
ng
ROD
h
h
Figure 2. Flare height as a function of approach ROD’s and different pull-up g-
forces at 200 fpm vertical touchdown speeds.
6
International Journal of Aviation, Aeronautics, and Aerospace, Vol. 1 [2014], Iss. 4, Art. 3
https://commons.erau.edu/ijaaa/vol1/iss4/3DOI: https://doi.org/10.15394/ijaaa.2014.1032

Figure 3. Flare height as a function of approach ROD’s and different pull-up g-
forces at 100 fpm vertical touchdown speeds.
Figure 4. Flare height as a function of approach ROD’s and different pull-up g-
forces at 0 fpm (tangential, zero-sink) vertical touchdown speeds.
As seen in Figures 2, 3 and 4 and particularly from the third partial
derivative above (Equation 2), the flare height is very sensitive on the magnitude
7
Daidzic: Adverse Elevator Effect
Published by Scholarly Commons, 2014
of the pull-up load. The horizontal distance in flare can be calculated from
Daidzic & Shrestha (2008):
TDAPP
FL
FLGSTDAPP
FL
FLGSFL
ng
v
ng
vL
22
sin (3)
The total air distance covered from crossing the runway threshold (at
TCH) to the touchdown point is:
FL
APP
FLTD L
hTCHL
tan (4)
The minimum distance in flare is actually no-flare ( APPTD ) landing
where, 0min APPFLFL hL . This is really hard and damaging on landing gear
and occupants and is avoided at all cost. If the flare height is finite positive value,
the extra distance covered in flare beyond the point of the straight descent is:
TDAPP
TDAPP
APP
FLFLFL
hLLL
min (5)
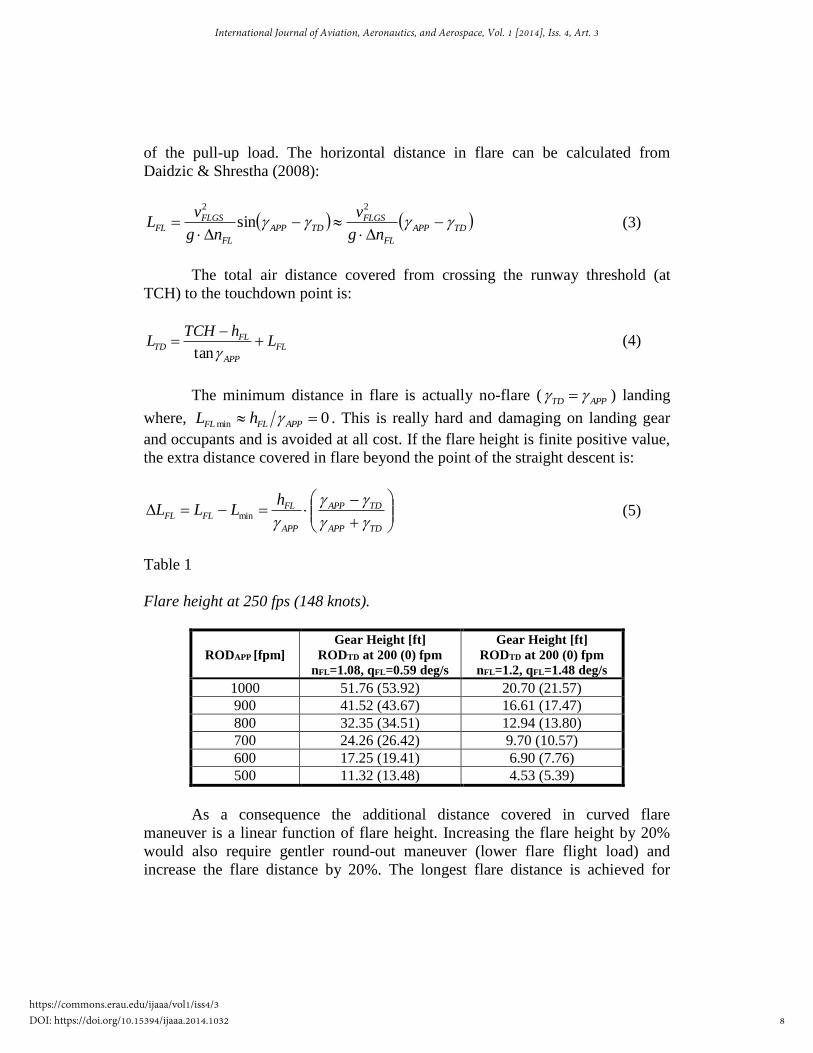
Table 1
Flare height at 250 fps (148 knots).
RODAPP [fpm]
Gear Height [ft]
RODTD at 200 (0) fpm
nFL=1.08, qFL=0.59 deg/s
Gear Height [ft]
RODTD at 200 (0) fpm
nFL=1.2, qFL=1.48 deg/s
1000 51.76 (53.92) 20.70 (21.57)
900 41.52 (43.67) 16.61 (17.47)
800 32.35 (34.51) 12.94 (13.80)
700 24.26 (26.42) 9.70 (10.57)
600 17.25 (19.41) 6.90 (7.76)
500 11.32 (13.48) 4.53 (5.39)
As a consequence the additional distance covered in curved flare
maneuver is a linear function of flare height. Increasing the flare height by 20%
would also require gentler round-out maneuver (lower flare flight load) and
increase the flare distance by 20%. The longest flare distance is achieved for
8
International Journal of Aviation, Aeronautics, and Aerospace, Vol. 1 [2014], Iss. 4, Art. 3
https://commons.erau.edu/ijaaa/vol1/iss4/3DOI: https://doi.org/10.15394/ijaaa.2014.1032

tangential touchdowns where, 0TD , and assuming the uniform flare flight load.
Equation 5 can be rewritten in the following form which also accounts for wind:
2
22
12 APP
TD
FLAPP
APPFL
ng
RODL
(6)
The horizontal distance covered in flare is proportional to the square of the
approach ROD. It is simultaneously inversely proportional to the approach
vertical flight path and the constant flare flight load.
For example, an airplane flying a no-wind approach at 250 ft/s (148 kts)
and 3o glidepath has approach ROD of 13.1 ft/s or 786 ft/min. The minimum
horizontal distance covered from the 30 ft flare height is then 572 ft while
maintaining glidepath angle. The “proper” flare height according to Equation 1
would be 33.3 ft at flare load of 0.08 to deliver a constant-radius arc for tangential
touchdown.
If the airplane achieves zero-sink touchdown (“greaser”) in a smooth
curved path, the horizontal distance covered in flare will be 1,270 ft from the 33.3
ft flare height with flare flight load of 1.080 ( 08.0 FLn ) or constant pull-up
load of 0.59 degrees/s. In reality, ground effect and its influences on vortex drag,
pitching moment, tail effectiveness, etc., must be taken into account. If the
airplane landing gear crossed runway threshold at 50 ft on a 30 glidepath,
additional 319 ft will be covered in air before starting flare, resulting in the total
air distance to touchdown of 1589 ft – assuming perfect conditions.
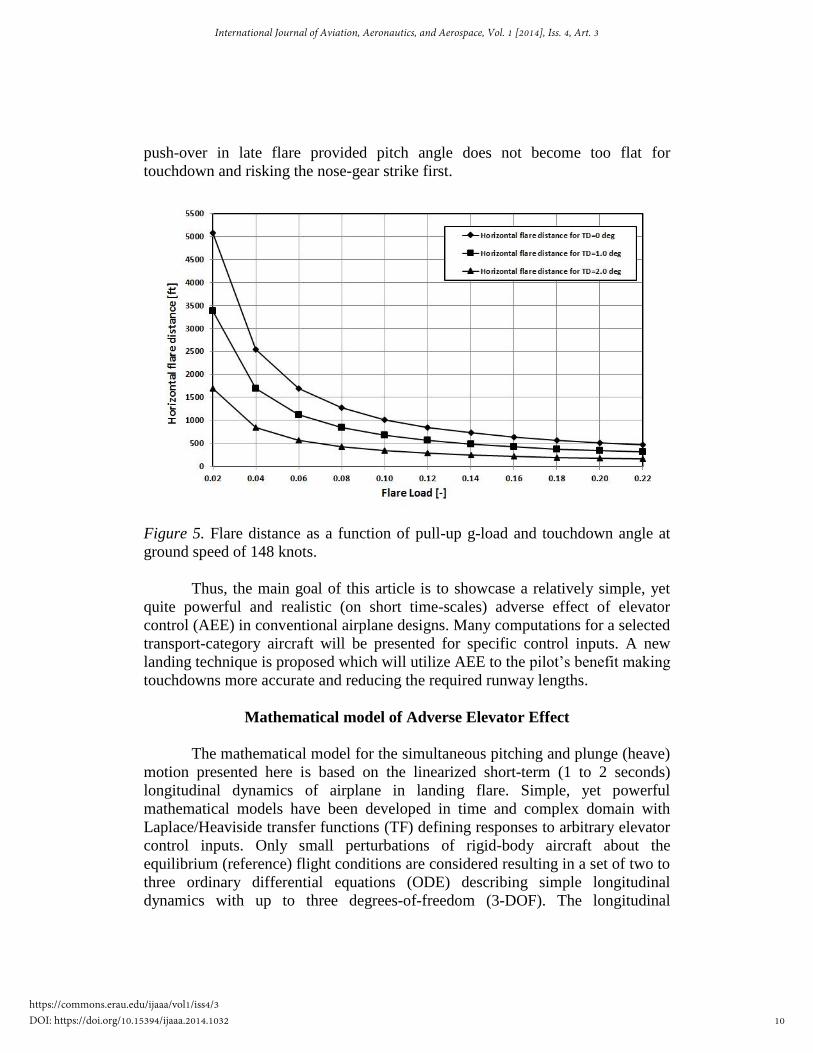
The horizontal flare distance versus flare flight load at selected 250 fps
(148 knots) flare airspeed is presented in Figure 5 for three different touchdown
angles using the Equation 3. Obviously, gentle flare starting at higher flare heights
would require excessively longer horizontal distances. This analysis does not take
into account any ballooning, excessive floating, and bouncing which would add
additional distance and possibly result in an overrun.
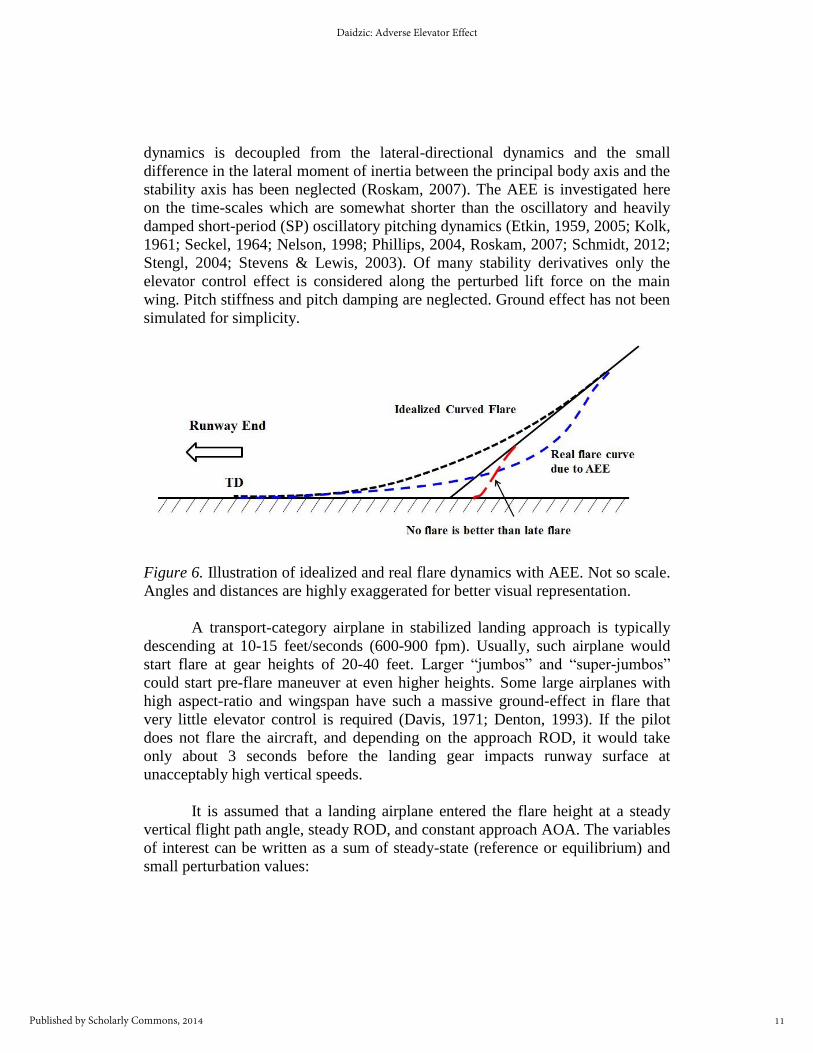
However, the real flight trajectory during the landing flare looks more like
the one presented in Figure 6. The illustration in Figure 1 is just an idealization of
the flare maneuver. The initial response to elevator up control input is in airplane
accelerating downward, increasing ROD, and losing altitude (or going below the
glidepath/glideslope). It also becomes clear why no-flare is sometimes better than
late flare. And as it will be shown later, rather than pull-up it is often better to
9
Daidzic: Adverse Elevator Effect
Published by Scholarly Commons, 2014
push-over in late flare provided pitch angle does not become too flat for
touchdown and risking the nose-gear strike first.
Figure 5. Flare distance as a function of pull-up g-load and touchdown angle at
ground speed of 148 knots.
Thus, the main goal of this article is to showcase a relatively simple, yet
quite powerful and realistic (on short time-scales) adverse effect of elevator
control (AEE) in conventional airplane designs. Many computations for a selected
transport-category aircraft will be presented for specific control inputs. A new
landing technique is proposed which will utilize AEE to the pilot’s benefit making
touchdowns more accurate and reducing the required runway lengths.
Mathematical model of Adverse Elevator Effect
The mathematical model for the simultaneous pitching and plunge (heave)
motion presented here is based on the linearized short-term (1 to 2 seconds)
longitudinal dynamics of airplane in landing flare. Simple, yet powerful
mathematical models have been developed in time and complex domain with
Laplace/Heaviside transfer functions (TF) defining responses to arbitrary elevator
control inputs. Only small perturbations of rigid-body aircraft about the
equilibrium (reference) flight conditions are considered resulting in a set of two to
three ordinary differential equations (ODE) describing simple longitudinal
dynamics with up to three degrees-of-freedom (3-DOF). The longitudinal
10
International Journal of Aviation, Aeronautics, and Aerospace, Vol. 1 [2014], Iss. 4, Art. 3
https://commons.erau.edu/ijaaa/vol1/iss4/3DOI: https://doi.org/10.15394/ijaaa.2014.1032
dynamics is decoupled from the lateral-directional dynamics and the small
difference in the lateral moment of inertia between the principal body axis and the
stability axis has been neglected (Roskam, 2007). The AEE is investigated here
on the time-scales which are somewhat shorter than the oscillatory and heavily
damped short-period (SP) oscillatory pitching dynamics (Etkin, 1959, 2005; Kolk,
1961; Seckel, 1964; Nelson, 1998; Phillips, 2004, Roskam, 2007; Schmidt, 2012;
Stengl, 2004; Stevens & Lewis, 2003). Of many stability derivatives only the
elevator control effect is considered along the perturbed lift force on the main
wing. Pitch stiffness and pitch damping are neglected. Ground effect has not been
simulated for simplicity.
Figure 6. Illustration of idealized and real flare dynamics with AEE. Not so scale.
Angles and distances are highly exaggerated for better visual representation.
A transport-category airplane in stabilized landing approach is typically
descending at 10-15 feet/seconds (600-900 fpm). Usually, such airplane would
start flare at gear heights of 20-40 feet. Larger “jumbos” and “super-jumbos”
could start pre-flare maneuver at even higher heights. Some large airplanes with
high aspect-ratio and wingspan have such a massive ground-effect in flare that
very little elevator control is required (Davis, 1971; Denton, 1993). If the pilot
does not flare the aircraft, and depending on the approach ROD, it would take
only about 3 seconds before the landing gear impacts runway surface at
unacceptably high vertical speeds.
It is assumed that a landing airplane entered the flare height at a steady
vertical flight path angle, steady ROD, and constant approach AOA. The variables
of interest can be written as a sum of steady-state (reference or equilibrium) and
small perturbation values:
11
Daidzic: Adverse Elevator Effect
Published by Scholarly Commons, 2014
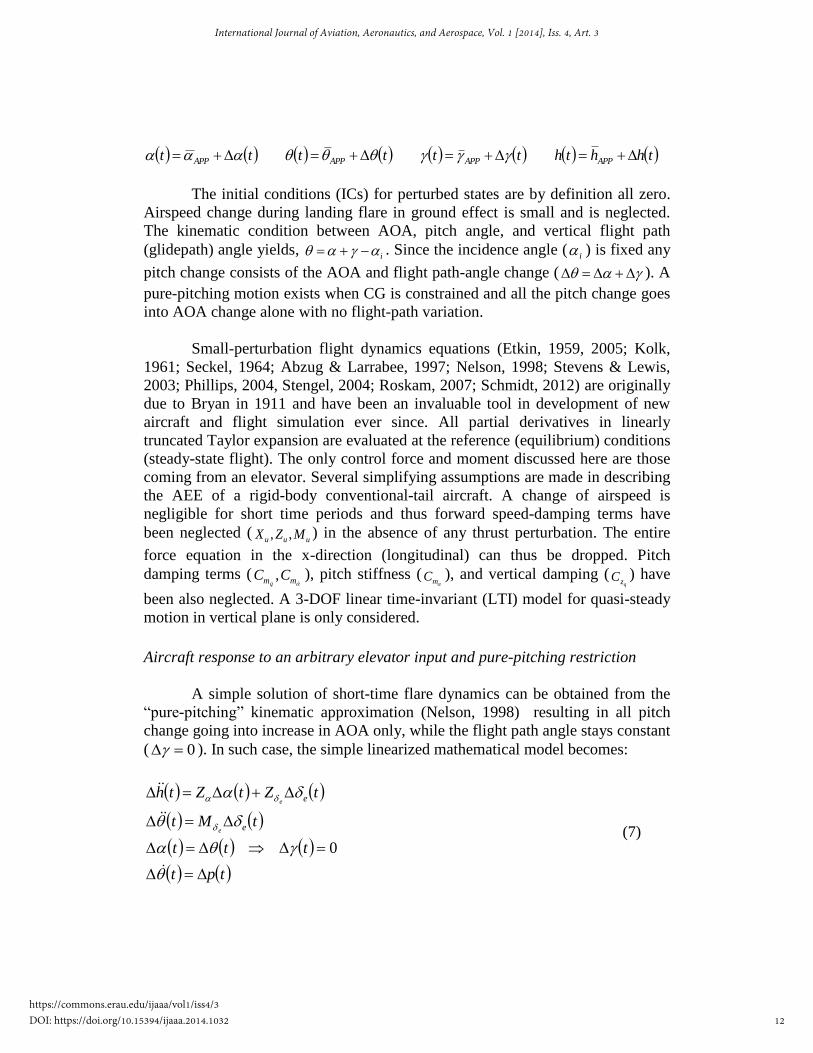
thhthtttttt APPAPPAPPAPP
The initial conditions (ICs) for perturbed states are by definition all zero.
Airspeed change during landing flare in ground effect is small and is neglected.
The kinematic condition between AOA, pitch angle, and vertical flight path
(glidepath) angle yields, i . Since the incidence angle (
i ) is fixed any
pitch change consists of the AOA and flight path-angle change ( ). A
pure-pitching motion exists when CG is constrained and all the pitch change goes
into AOA change alone with no flight-path variation.
Small-perturbation flight dynamics equations (Etkin, 1959, 2005; Kolk,
1961; Seckel, 1964; Abzug & Larrabee, 1997; Nelson, 1998; Stevens & Lewis,
2003; Phillips, 2004, Stengel, 2004; Roskam, 2007; Schmidt, 2012) are originally
due to Bryan in 1911 and have been an invaluable tool in development of new
aircraft and flight simulation ever since. All partial derivatives in linearly
truncated Taylor expansion are evaluated at the reference (equilibrium) conditions
(steady-state flight). The only control force and moment discussed here are those
coming from an elevator. Several simplifying assumptions are made in describing
the AEE of a rigid-body conventional-tail aircraft. A change of airspeed is
negligible for short time periods and thus forward speed-damping terms have
been neglected (uuu MZX ,, ) in the absence of any thrust perturbation. The entire
force equation in the x-direction (longitudinal) can thus be dropped. Pitch
damping terms (mm CC
q, ), pitch stiffness (
mC ), and vertical damping (qzC ) have
been also neglected. A 3-DOF linear time-invariant (LTI) model for quasi-steady
motion in vertical plane is only considered.
Aircraft response to an arbitrary elevator input and pure-pitching restriction
A simple solution of short-time flare dynamics can be obtained from the
“pure-pitching” kinematic approximation (Nelson, 1998) resulting in all pitch
change going into increase in AOA only, while the flight path angle stays constant
( 0 ). In such case, the simple linearized mathematical model becomes:
tpt
ttt
tMt
tZtZth
e
e
e
e
0 (7)
12
International Journal of Aviation, Aeronautics, and Aerospace, Vol. 1 [2014], Iss. 4, Art. 3
https://commons.erau.edu/ijaaa/vol1/iss4/3DOI: https://doi.org/10.15394/ijaaa.2014.1032
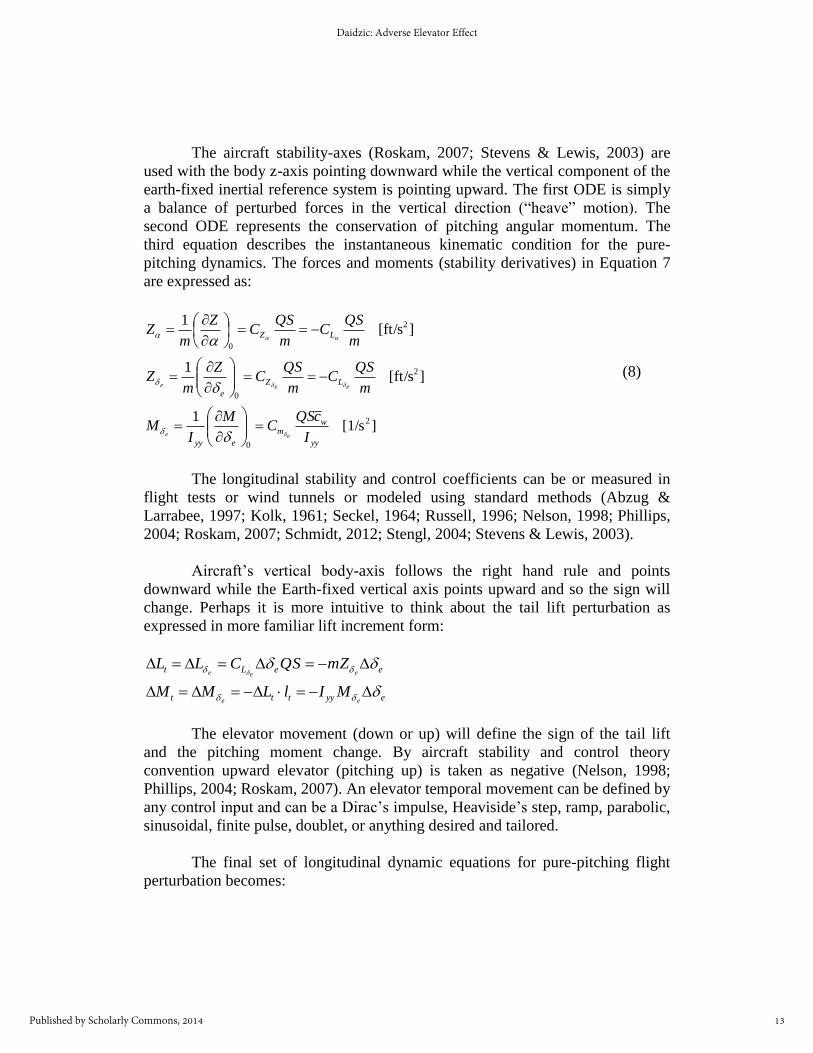
The aircraft stability-axes (Roskam, 2007; Stevens & Lewis, 2003) are
used with the body z-axis pointing downward while the vertical component of the
earth-fixed inertial reference system is pointing upward. The first ODE is simply
a balance of perturbed forces in the vertical direction (“heave” motion). The
second ODE represents the conservation of pitching angular momentum. The
third equation describes the instantaneous kinematic condition for the pure-
pitching dynamics. The forces and moments (stability derivatives) in Equation 7
are expressed as:
][1/s1
][ft/s1
][ft/s1
2
0
2
0
2
0
yy
wm
eyy
LZ
e
LZ
I
cQSC
M
IM
m
QSC
m
QSC
Z
mZ
m
QSC
m
QSC
Z
mZ
ee
eee
(8)
The longitudinal stability and control coefficients can be or measured in
flight tests or wind tunnels or modeled using standard methods (Abzug &
Larrabee, 1997; Kolk, 1961; Seckel, 1964; Russell, 1996; Nelson, 1998; Phillips,
2004; Roskam, 2007; Schmidt, 2012; Stengl, 2004; Stevens & Lewis, 2003).
Aircraft’s vertical body-axis follows the right hand rule and points
downward while the Earth-fixed vertical axis points upward and so the sign will
change. Perhaps it is more intuitive to think about the tail lift perturbation as
expressed in more familiar lift increment form:
eyyttt
eeLt
ee
eee
MIlLMM
ZmSQCLL
The elevator movement (down or up) will define the sign of the tail lift
and the pitching moment change. By aircraft stability and control theory
convention upward elevator (pitching up) is taken as negative (Nelson, 1998;
Phillips, 2004; Roskam, 2007). An elevator temporal movement can be defined by
any control input and can be a Dirac’s impulse, Heaviside’s step, ramp, parabolic,
sinusoidal, finite pulse, doublet, or anything desired and tailored.
The final set of longitudinal dynamic equations for pure-pitching flight
perturbation becomes:
13
Daidzic: Adverse Elevator Effect
Published by Scholarly Commons, 2014
ttu
tPtKth
tt
tRt
e
e
e
(9)
The function tu is control input (elevator deflection). The direction of
elevator deflection will define the sign (positive or negative) so that both elevator-
up ( 0 e ) and elevator-down ( 0 e ) deflections can be simulated. Up
elevator has negative sign but induces positive pitching moment and rate
(increasing pitch angle). The various constants in Equation 9 are defined as:
0
2
02
1
v
Kb
I
lLR
m
LP
m
CSQK
vQC
Cg
Wm
yy
tttL
LL
(10)
The parameter K can be described as the acceleration due to main wing
lift increment, parameter P is the vertical acceleration due to tail elevator lift
change, and R is the pitching angular acceleration. Important parameter in main
wing lift production is the product, RK . For many transport-category airplanes
this product of vertical and angular (pitching) accelerations is almost constant.
Pinsker (1969) arrived to similar set of equations as we did.
Aircraft response to an arbitrary elevator input and free flight path
In this analysis the restriction of pure-pitching motion will be removed
and the vertical flight-path angle will become independent (free flight). The
conservation of angular momentum along airplane’s lateral axis (pitch rotation)
for arbitrary elevator input becomes:
tulLMtI
dt
dI tttyyyy
2
2
The balance of vertical forces will include the increase in the elevator
downward force and the time-dependent increase in main-wing lift:
14
International Journal of Aviation, Aeronautics, and Aerospace, Vol. 1 [2014], Iss. 4, Art. 3
https://commons.erau.edu/ijaaa/vol1/iss4/3DOI: https://doi.org/10.15394/ijaaa.2014.1032

tuLSQtCth
g
W
dt
hd
g
WtL
2
2
The third ODE describing vertical flight path (glidepath) change is
obtained from the kinematic condition and constant-airspeed approximation:
FLnv
g
v
h
v
h
v
h
0000
andsin
The kinematic condition in free flight is very different from the one in
pure-pitching mode:
00
andv
h
v
hq
(11)
The final set of ODEs describing the short-term AEE longitudinal flight
dynamics in free-flight at small flight angle is:
tuPtKthv
htuRt
0
(12)
The free-flight longitudinal dynamics model is more complex than for
pure-pitching approximation as it allows for the change of the AOA and flight
path angles independently.
Methods and Materials
Aircraft-response based on the particular pilot-controlled elevator input
are investigated. Impulse and step control inputs were used to investigate aircraft
longitudinal dynamics and AEE. Although these simple control inputs are just an
approximation of how pilots normally would command pitch changes, they
nevertheless unravel the mystery behind AEE. Other delays in control system are
neglected.
The system of coupled linear ODEs describing rigid-airplane longitudinal
dynamics can be conveniently solved using the powerful space-state analysis
(Nelson, 1998; Phillips, 2004; Stengl, 2004; Schmidt, 2012). However, for the
simple single-input system (elevator deflection), the Laplace transforms (Spiegel,
1965) are chosen. The Laplace transformation is also a very powerful
15
Daidzic: Adverse Elevator Effect
Published by Scholarly Commons, 2014
mathematical technique with a beautiful property that it converts ODE into
algebraic functions in Laplace complex domain. Without describing details of the
Laplace transform properties, the transform-pairs used here are defined as:
sULtutuLsUsHLththLsH
sALttLsAsTLttLsT
11
11
)(,)(;)(,)(
)(,)(;)(,)(
An interested reader is welcome to consult many great mathematical
books written on integral transforms and Laplace transform in particular. A good,
simple, and very popular introductory text used here is by Spiegel (1965).
Solution to pure-pitching longitudinal flight dynamics approximation
In Laplace domain the system of ODE (Equation 9) becomes a system of
three algebraic equations with three unknowns. If the elevator is up then the
deflection is negative and the incremental tail-lift is directed downward
generating a positive pitching motion (upward). The Laplace transforms of system
given by Equation 9 becomes:
sUPsAKsHssTsAsURsTs 22 (13)
and:
222 s
sUP
s
sTKsHsTsA
s
sURsT (14)
The TFs for elevator control input can be defined for pitch, AOA, and
altitude responses:
2422 s
P
s
RK
sU
sH
s
R
sU
sT
sU
sA
s
R
sU
sT
(15)
For an impulse input, the Laplace transform of the elevator control
function is simply 1sU (elevator up) or 1sU (elevator down).
Performing the inverse Laplace transform of Equation 15 for the impulse elevator
up deflection (approximating quick jerk back and release) results in time-domain:
tPtRK
thtRtt 3
6 (16)
16
International Journal of Aviation, Aeronautics, and Aerospace, Vol. 1 [2014], Iss. 4, Art. 3
https://commons.erau.edu/ijaaa/vol1/iss4/3DOI: https://doi.org/10.15394/ijaaa.2014.1032

For an impulse elevator down control input 1sU (approximating
quick jerk forward and release), the temporal solution for pure-pitching altitude
and pitch (also AOA) change is:
tPtRK
thtRtt 3
6 (17)
If the elevator control input is unit step up (elevator suddenly up and hold
that deflection) or, ssU 1 , the temporal height and pitch changes are:
2242
24
2 tPt
RKth
tRtt (18)
For unit step down or, ssU 1 , the temporal height and pitch changes
in pure-pitching mode become:
2242
24
2 tPt
RKth
tRtt (19)
Since all the above functions are analytic, the derivatives with respect to
time can be easily found. The characteristic duration (time-constant) of the AEE
or inverse altitude response to step control input during which an airplane
essentially only rotates around lateral axis is:
tL
yy
steplCSQ
I
RK
P
(20)
For a B747-200 airplane this time constant is about 365 milliseconds (ms)
at 148 knots approach speed and SL density altitude. All three important time
scales defining the duration of loss of altitude (reverse altitude response),
increased (adverse) ROD, and downward acceleration from the moment step
elevator input are (Pinsker, 1969):
stephh
hsteph
hsteph
ttt
ttt
41.126
,23
,46.3 00
0
0
00
17
Daidzic: Adverse Elevator Effect
Published by Scholarly Commons, 2014

Interestingly, the characteristic step-response time step does not depend on
the magnitude of the elevator force or deflection (up or down), but only on the
specific aerodynamic parameters. In the case of impulse input the respective time
constant is about 71% of the step time constant for AEE.
Solution of free-flight longitudinal dynamics
Applying the Laplace transform to all three ODE (Equation 12) results in
the system of three algebraic equations for three unknown functions:
sUPsAKsHsv
sHssTssAssURsTs 2
0
22
The functions for pitch, height and AOA in Laplace domain for arbitrary
control input and free-flight condition become:
bss
sUP
bss
sURKsH
v
sHssTsA
s
sURsT
3
0
2
(21)
The transfer functions for pitch, AOA, and altitude/height response can be
now defined as:
bss
P
bss
RK
sU
sH
sU
sH
v
s
sU
sT
sU
sA
s
R
sU
sT
3
0
2 (22)
Only impulse and step responses for elevator-up control input will be
examined. Elevator down is just a mirror image of elevator up control input. For
an elevator-up impulse response, where, 1sU , the solution to Laplace
inversions yields:
btbt
btbt
eb
Pe
b
RK
b
tt
b
RKth
ev
Pe
b
Rt
tRt
112
2
1
3
2
0
(23)
18
International Journal of Aviation, Aeronautics, and Aerospace, Vol. 1 [2014], Iss. 4, Art. 3
https://commons.erau.edu/ijaaa/vol1/iss4/3DOI: https://doi.org/10.15394/ijaaa.2014.1032
The above analytic solutions (Equation 23) yield values at zero-time:
bPhPhh 0000
For an elevator-up step response, where ssU 1 , the solutions for
altitude, pitch and AOA, after some quite tedious Laplace inversions and
algebraic reductions, yields:
btbt
bt
eb
P
b
Pte
b
RK
b
t
b
tt
b
RKth
K
P
b
Re
b
tRt
tRt
1163
6
1
2
242
23
2
2
(24)
These analytic solutions (Equation 24) yield values at initial- or zero-time:
Phhh 00000
In order to find various inverse-transforms, many Laplace transform
properties have been used including the convolution integral, transform of the
derivative function, etc. (Spiegel, 1965). Again, all functions are analytic and
continuous in the entire time domain and the temporal derivatives can be easily
found and are thus not explicitly given here. The free-flight kinematic condition
(Equation 11) is satisfied by both (impulse and step) solutions given with
Equations 23 and 24.
Results and Discussion
The responses for an impulse and a step elevator up and down control
inputs of various magnitudes in pure-pitching and free-flight are presented. The
AAE and the reverse altitude response is clearly present for the initial short-period
after the flight control application as will be shown below.
The evaluation of height, vertical speed, and vertical acceleration for two
different impulse elevator up and down inputs is examined first. The acceleration
in pitch is constant since pitch stiffness and damping were neglected for short
time scales. A geometrical and aerodynamic characteristics of B747-200 have
been used as that data is readily available (Nelson, 1998; Philipps, 2004) although
19
Daidzic: Adverse Elevator Effect
Published by Scholarly Commons, 2014
no great accuracy is claimed. The landing weight used is 550,000 lb, wing
reference area is 5,500 ft2 with the wingspan of 195 feet, the pitching moment of
inertia is 30,000,000 slug-ft2 and the horizontal-tail-to-CG arm is 100 ft. The
reference/flare speed was taken as 148 knots (250 fps) at SL density altitude.
Tail lift perturbations due to elevator (up or down) applications have been
arbitrarily taken as 50,000 and 100,000 lb respectively. In terms of elevator
deflection angle where elevator is assumed to be symmetric airfoil with maximum
up and down deflections of 450 in slow speed regime, one obtains:
c
lCC
cSQC
lL
cSQC
M
SQC
L tZm
m
tt
m
te
Z
te
ee
eee
If the elevator power is calculated for B747-200 to be 4.0e
ZC
and
43.1e
mC
at a given approach airspeed and SL ISA conditions, the 50,000 lb
tail vertical lift increment corresponds to elevator (up or down) deflection of
17.50. For 100,000 lb tail-lift increment, a 350 elevator deflection is
correspondingly required. These forces and deflections are, in fact, excessive for
normal landings, but serve to show that AEE’s pitch time-lag does not depend on
the magnitude of tail lift perturbation.
The first result of computations will be height, vertical speed and
acceleration for impulse upward elevator movement for pure-pitching motion and
50,000 and 100,000 lb tail-lift increments as shown in Figure 7. Similar results are
shown in Figure 8, but this time the elevator deflection is downward creating
initially an upward motion, a sort of, proverse elevator effect. The initial upward
motion is just a mirror image of downward motion (AEE) and will thus not be
repeated for every case. As expected, the time delay (lag) due to AEE is
independent of the tail lift magnitude. The results for the pure-pitching flight
dynamics and elevator step up and down control deflections are shown in Figures
9 and 10 respectively. Again, the AEE is clearly noticeable and the time-lag is
actually longer than for the case of impulse control input (about 1.25 s versus 0.9
s for the impulse control input). Elevator-down control input is just a mirror-
image of elevator-up response.
Analog results for free-flight longitudinal dynamics are shown in Figures
11 and 12 for impulse and step elevator-up response. Again, the same 50,000 and
100,000 lb tail lift increments were used. Since the effect of elevator down is just
a mirror image of the elevator-up response that was presented earlier it has not
been simulated separately. A response in pitch, AOA and height for an impulse
20
International Journal of Aviation, Aeronautics, and Aerospace, Vol. 1 [2014], Iss. 4, Art. 3
https://commons.erau.edu/ijaaa/vol1/iss4/3DOI: https://doi.org/10.15394/ijaaa.2014.1032

elevator up control input is shown in Figure 11. A step response is shown in
Figure 12. Again, the AEE is quite obvious introducing longer delay in step
response than for impulse control input. The magnitude of the time-lag is
somewhat moderated compared to pure-pitching motion, but not much,
suggesting that the initial response to elevator control input is a linear
combination of downward acceleration and pure rotation around the lateral axis.
Figure 7. Height, vertical speed, and vertical acceleration perturbations due to
impulse elevator-up 50,000 (LHS) and 100,000 lb (RHS) tail lift change input for
pure-pitching restricted flight dynamics.
Figure 8. Height, vertical speed, and vertical acceleration perturbations due to
impulse elevator-down 50,000 (LHS) and 100,000 lb (RHS) tail lift change input
for pure-pitching restricted flight dynamics.
Another useful observation is that short impulses (jerks) on elevator
introduce less adverse effects than step input (pull and hold). As will be shown in
subsequent articles, ramp elevator input (progressively increasing elevator up)
introduces even larger AEE lag times. This certainly has to do with the amount of
energy introduced by the elevator deflection.
21
Daidzic: Adverse Elevator Effect
Published by Scholarly Commons, 2014
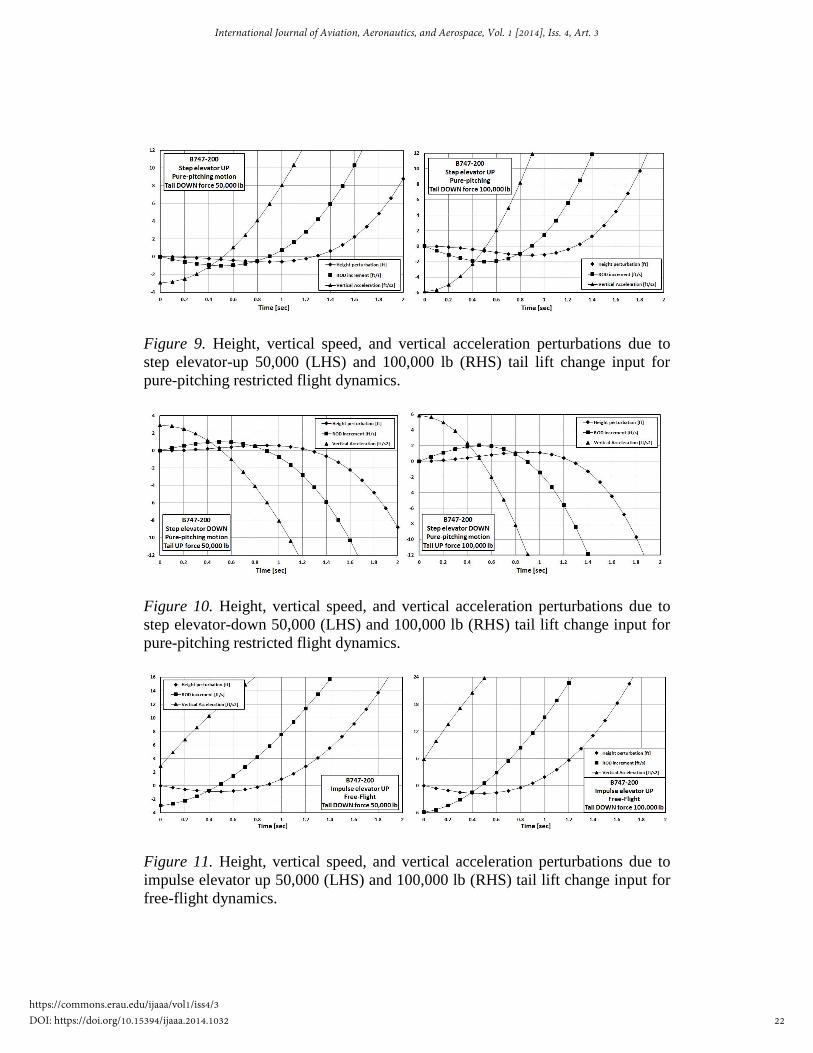
Figure 9. Height, vertical speed, and vertical acceleration perturbations due to
step elevator-up 50,000 (LHS) and 100,000 lb (RHS) tail lift change input for
pure-pitching restricted flight dynamics.
Figure 10. Height, vertical speed, and vertical acceleration perturbations due to
step elevator-down 50,000 (LHS) and 100,000 lb (RHS) tail lift change input for
pure-pitching restricted flight dynamics.
Figure 11. Height, vertical speed, and vertical acceleration perturbations due to
impulse elevator up 50,000 (LHS) and 100,000 lb (RHS) tail lift change input for
free-flight dynamics.
22
International Journal of Aviation, Aeronautics, and Aerospace, Vol. 1 [2014], Iss. 4, Art. 3
https://commons.erau.edu/ijaaa/vol1/iss4/3DOI: https://doi.org/10.15394/ijaaa.2014.1032
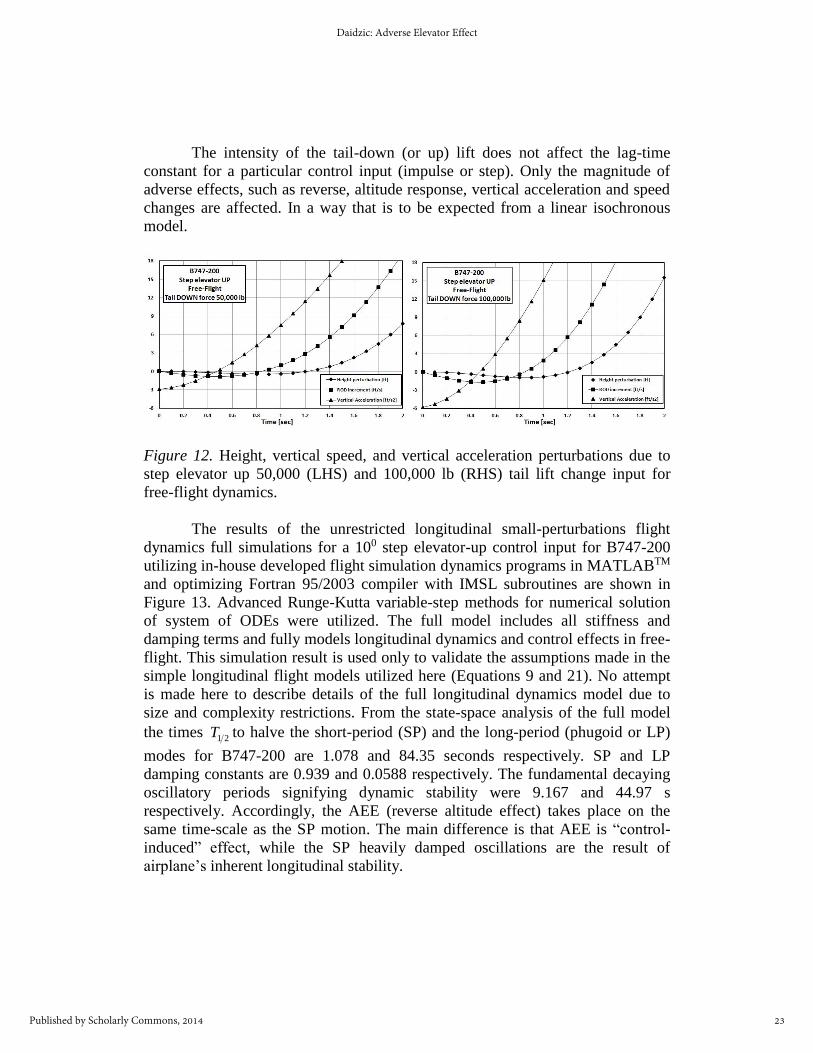
The intensity of the tail-down (or up) lift does not affect the lag-time
constant for a particular control input (impulse or step). Only the magnitude of
adverse effects, such as reverse, altitude response, vertical acceleration and speed
changes are affected. In a way that is to be expected from a linear isochronous
model.
Figure 12. Height, vertical speed, and vertical acceleration perturbations due to
step elevator up 50,000 (LHS) and 100,000 lb (RHS) tail lift change input for
free-flight dynamics.
The results of the unrestricted longitudinal small-perturbations flight
dynamics full simulations for a 100 step elevator-up control input for B747-200
utilizing in-house developed flight simulation dynamics programs in MATLABTM
and optimizing Fortran 95/2003 compiler with IMSL subroutines are shown in
Figure 13. Advanced Runge-Kutta variable-step methods for numerical solution
of system of ODEs were utilized. The full model includes all stiffness and
damping terms and fully models longitudinal dynamics and control effects in free-
flight. This simulation result is used only to validate the assumptions made in the
simple longitudinal flight models utilized here (Equations 9 and 21). No attempt
is made here to describe details of the full longitudinal dynamics model due to
size and complexity restrictions. From the state-space analysis of the full model
the times 21T to halve the short-period (SP) and the long-period (phugoid or LP)
modes for B747-200 are 1.078 and 84.35 seconds respectively. SP and LP
damping constants are 0.939 and 0.0588 respectively. The fundamental decaying
oscillatory periods signifying dynamic stability were 9.167 and 44.97 s
respectively. Accordingly, the AEE (reverse altitude effect) takes place on the
same time-scale as the SP motion. The main difference is that AEE is “control-
induced” effect, while the SP heavily damped oscillations are the result of
airplane’s inherent longitudinal stability.
23
Daidzic: Adverse Elevator Effect
Published by Scholarly Commons, 2014

Figure 13. Unrestricted longitudinal dynamics flight perturbations due to step 100
elevator up (-) control input using the full 3-DOF state-space model with
kinematic relationships of free-flight for B747-200.
Clearly, the forward speed change in flare with no thrust inputs and for
short periods is small (one knot deceleration after 1.86 s). The pitch angle (#4
graph in Figure 13) and the AOA (#2) increased by about 2 degrees each after
about 1 second in the pull-up maneuver indicating that the flight path angle
change (#6) is zero (as in pure-pitching mode). Obvious is also the initial loss of
altitude (0.2 ft) and steepening the approach (-0.10 at 0.5 s) inducing downward
vertical acceleration and speed increments. While altitude loss and downward
acceleration are not that significant, the real problem is in creating the dead-time
(lag) during a flare with the time-scales of about 1.18 seconds for height loss and
0.80 seconds for vertical airspeed (flight-path angle) reversal. This is about the
same result as was obtained in a simple analytical model developed here. This is
to be compared to 1.263 and 0.73 s as calculated for the altitude-loss and the
vertical speed reversal times for the same airplane and conditions. Thus all the
assumptions made and the results obtained from the simple model are validated. It
is also possible to add atmospheric disturbances (horizontal and vertical gusts) as
well as ground effect aerodynamics to get very faithful airplane response provided
all design data are known.
24
International Journal of Aviation, Aeronautics, and Aerospace, Vol. 1 [2014], Iss. 4, Art. 3
https://commons.erau.edu/ijaaa/vol1/iss4/3DOI: https://doi.org/10.15394/ijaaa.2014.1032

To summarize, the all three important height parameters are initially
reversed. This is the consequence of the traditional tail elevator actually being the
“wrong” control initially and for short period. This effect makes consistent
accurate landings and touchdowns very difficult. Interestingly, regardless of the
elevator force magnitude, the reversal duration does not change for a particular
airplane type. The worst AEE consequence thus is to introduce the dead-time or
the time-delay in pitch response. The landing flare occurs on the time-scale of few
seconds and 1-2 seconds time-delays are essential.
Armed with the better understanding of the airplane longitudinal dynamics
during flare maneuver and especially the inevitable occurrence of the AEE, it is
now investigated how this “adverse” phenomenon can be used to actually
improve landing control and accuracy.
The new proposed landing technique, illustrated in Figures 6 and 14,
would start with the flare about 10 feet lower than usual for a particular airplane
type (say, 20 ft instead of 30 ft gear height) utilizing somewhat faster pull-up of
perhaps 1.20-1.25 g which is still well below the landing stall margin of 1.69 g.
This will result in achieving the pitch angle of perhaps 7-8 degrees (from 2-3
degrees nose-up in stabilized approach), and then almost instantaneously followed
by a push-over pulse for about 600-800 ms relax and expect main gear
touchdown. The push-over maneuver will be initiated when the airplane is about
4-6 feet above the ground. The main gear touchdown would still occur with the
pitch (deck) angle of 5+ degrees and the vertical touchdown speeds in the range of
100-200 fpm. The scatter of landing touchdowns is expected to be significantly
smaller with more consistent landings and significant runway distance savings
achieved. Such accurate touchdowns would be crucial for landings on
contaminated runways and for LAHSO operations.
In the push-over maneuver a pilot is trying to accomplish two things:
Reduce the rate-of-descent by relying on the short-term AEE’s reverse-
altitude response and reduction in ROD.
Reduce the pitch angle and set the airplane in the pitch down motion
which is going to save few seconds in lowering the nose gear down after
main-gear touchdown.
In order to estimate the reduction in ROD by push-over maneuver, the law of
conservation of linear momentum is employed for the vertical axis only:
25
Daidzic: Adverse Elevator Effect
Published by Scholarly Commons, 2014

2
1
2
1
2
1
t
t
z
v
v
z
K
K
zzz dtFdv
g
WdKF
dt
dK z
z
z
z
(25)
From where it follows:
tPtW
LgRODtLRODROD
g
W tt
12
(26)
For example, assuming the initial pull that reduced the approach ROD
from 720 (12 fps) to 300 fpm (5 fps) and airplane at the pitch angle of 8 degrees
nose up while only about 5 ft above the runway. A pilot then generates a 50,000
lb upward (push-over) vertical pulse on the tail (elevator down) of an aircraft
weighing 550,000 lb lasting about 800 ms (0.8 s) by pushing the control column
forward and then neutralizing. Such push-over pulse will create maximum climb
ROD of 141 fpm (2.34 fps) that must be added to the descent rate of 300 fpm
resulting in the net ROD of 160 fpm (2.66 fps). This must be timed appropriately
so that the airplane is about touching down at that moment.
Simultaneously, the pitch angle of the aircraft will decrease according to
the law of conservation of angular momentum:
tttyyyy lLMdt
dqI
dt
dI
2
2 (27)
The pitch rate will change:
tRtI
Mqt
I
Mdt
I
Mdq
yy
t
yy
t
t
yy
t
q
00
1
(28)
For example, if a pilot applies forward pressure pulse for 800 ms, creating
downward pitching moment of, lbft000,000,5100000,50 , in an airplane with
lateral-axis moment of inertia of 27 ftslug100.3 , it will result in the final pitch
rate of about 7.64 deg/s. The total pitch angle change in 800 ms pulse will be
about 3 degrees or final 5 degrees nose-up pitch attitude (from 8 degrees after
pull-up) at main-gear touchdown:
22
22
00
tRt
I
Mdttqdtq
dt
d
yy
t
t
(29)
26
International Journal of Aviation, Aeronautics, and Aerospace, Vol. 1 [2014], Iss. 4, Art. 3
https://commons.erau.edu/ijaaa/vol1/iss4/3DOI: https://doi.org/10.15394/ijaaa.2014.1032
This analysis neglects pitch stiffness and damping as well as changing
aerodynamics in ground effect. However, as it was seen from the full model the
difference is not large and the assumptions made are quite reasonable. Another
added benefit to executing push-over maneuver when at appropriate height and
just before touchdown is that the landing gear located behind the CG will be
rotated away from the runway surface therefore minimizing vertical speed at the
moment of touchdown. However, that only reduces the initial impact, but does not
affect the vertical speed of CG. For example, if the landing gear is about 20 feet
beyond the instantaneous point of rotation with the nose-down rotation of 6 deg/s
at the time of touchdown, the vertical speed decreases by additional 126 fpm.
Accordingly, the AEE and the rotation of the landing gear can both combined
reduce the vertical touchdown impact by additional 200-300 fpm. A maneuver of
short push-over pulse can be beneficial when within 1 s of touchdown and at the
heights not greater than 4-6 feet. Detailed full flight simulator (FFS) study
involving pilots of various experiences and in different aircraft will have to be
conducted to validate the main proposal in this article. The remaining question is
if the FFS flight models running in real-time have the accuracy and fidelity to
properly simulate AEE.
Standard flare technique involving starting flare higher to account for the
AEE-induced time-lag carries some negative implications. First, it is more
difficult to judge the height and it also implies shallower round-out (flare) which
is perhaps preferred by crew, but it consumes excessive horizontal distance.
Letting the aircraft settle gently onto runway may be preferred by pilots and
passengers, but it often leads to landing long increasing the probability of overrun,
excessive subsequent wear and tear of brakes and needlessly overstressing the
entire airplane structure during heavy braking and thrust-reversing. Building
longer runways is clearly not an option due to excessive cost and pilots could get
even more complacent and losing touchdown control discipline.
The new proposed landing technique, which was perhaps “discovered”
accidentally by some pilots could not have been consistently reproduced as the
main causes were never understood properly. Taking everything into account it is
believed that this new proposed landing/touchdown technique can save about 500-
1,000 feet of runway in average in regular daily line-operations. It will be of
course most beneficial when landing on short contaminated runways and with
LAHSO procedures where touchdown precision and prompt lowering of the nose
gear is paramount.
It has been said that some pilots operating venerable tri-jet Boeing B727s
used the “pull-push” method as a standard landing technique. It somehow worked
27
Daidzic: Adverse Elevator Effect
Published by Scholarly Commons, 2014

despite the fact that many wrong explanations were given to explain it. The
B727’s operating manual does not explicitly endorse such technique for normal
landings. However, because all three engines are installed in the tail, the
airplane’s CG (and wing) was quite behind and the arm of the elevator was
relatively short. As a consequence, the powerful tail down force would create
significant downward acceleration while the pitch response was taking time due
to relatively weak control pitching moments. Accordingly a push-over maneuver
created significant upward acceleration (reduced ROD) which B727 pilots
apparently used frequently. It is possible that pull-push technique was also used
by some pilots flying older airplanes which were “tail-heavy” having short tail-to-
CG arm (B727, Hawker Siddeley Trident, Vickers-Armstrong VC10, BAC 1-11,
DC9/MD80, etc.). An airplane that had many landing accidents due to late flare is
MD11. Supersonic and hypersonic airplanes of the future will be especially prone
to AEE and landing/touchdown problems.
Figure 14. An illustration of the proposed new landing technique utilizing AEE.
Not to scale. Angles and distances are highly exaggerated.
Although seemingly a peculiar phenomenon that could be dismissed as
irrelevant, the AEE does exist every time an airplane with conventional tail is
rotated for takeoff or in landing-flare pitch-up. There are few other lessons that
can be learned by understanding the AEE and the short-term landing flare
dynamics. When very close to ground with excessive ROD, a sudden pull-up to
arrest the vertical descent rate could only make things worse and accelerate
airplane downward even faster. At best there will be no effect of pitch-up
correction as perhaps many pilots have already discovered in late flare (Daidzic,
28
International Journal of Aviation, Aeronautics, and Aerospace, Vol. 1 [2014], Iss. 4, Art. 3
https://commons.erau.edu/ijaaa/vol1/iss4/3DOI: https://doi.org/10.15394/ijaaa.2014.1032
2010, 2011b). As much as it seems counter-intuitive, actually pushing over will
rapidly create upward lift increment that will slow down descend. AEE is only a
short-term effect and can be used only when close to ground, i.e., landing.
Since the pull-push landing technique involves two pitch rotations during
which the glidepath is not significantly altered, an airplane utilizing this technique
would essentially touch down very close (within 100-200 ft) to the minimum
horizontal distance or where the glideslope/glidepath intercepts the runway. On
the other hand, the “conventional” landing technique frequently results in
touchdowns which are 500 to 1000+ feet away from the glideslope runway
intercept (no-flare touchdown) point. This is mostly due to the gradual flare and
near-tangential touchdowns where the rounding slopes become too shallow. Such
conventional landing technique causes large scattering in touchdown points. If
two airplanes conducting “conventional” and “pull-push” landing enter the same
gear-height at the same airspeed and ROD (glidepath), the normal landing
technique would involve one rotation and slow gradual shallow descent toward
the runway. The pull-push flare’s two pitch rotations at lower altitudes actually
involve maintaining the glidepath while the ROD decreases to acceptable 100-200
fpm touchdown.
More in-depth study and publications on AEE is planned in the near
future. The ramp, parabolic, harmonic, rectified sine, finite pulse, doublet, and
any arbitrary elevator control inputs will be used to investigate airplane’s
longitudinal dynamics. A full 6-DOF rigid-airplane nonlinear models and
linearized coupled lateral-longitudinal small-perturbation airplane models will be
used to model an arbitrary elevator pull-push landing flare maneuver with the
complications of ground effect, atmospheric turbulence and gusty winds. It is also
envisioned to conduct a piloted-study utilizing real airplanes and FFS to validate
some of the theoretical results and develop the new landing technique for large
airplanes. Optimization of the new pull-push landing technique and defining its
envelope of use is of prime importance. Today’s modern fly-by-wire airplanes
utilize flare-mode for touchdown and that may appear to interfere with the “pull-
push” technique explored here. However, if the new touchdown technique is
found to be superior to the conventional one there should be no difficulty in
modifying the flare-mode software and adapt to new realities. However, at this
point we do not want to delve on too many speculations. Further research, flight-
path integrations, and piloted studies will hopefully provide some more definite
answers.
29
Daidzic: Adverse Elevator Effect
Published by Scholarly Commons, 2014
Conclusions
A simple longitudinal flight dynamics model for rigid-body airplane
landings was introduced. Only the short-period response to elevator up or down
deflections were evaluated. Pitch stiffness, pitch damping, and vertical damping
were neglected. The forward airspeed is essentially constant during the short term
flare maneuver. Laplace integral transform was used to convert the differential
model in time domain into the algebraic complex domain which after algebraic
reductions, applications of control inputs, and solutions was then inverted back
into the time domain. Only impulse and step control inputs were investigated in
this study. Two different magnitudes of tail lift forces, corresponding to different
elevator displacements were utilized to evaluate the effect on short-term height,
AOA, vertical motion, and pitching dynamics. As expected, the simple model
faithfully revealed the adverse elevator effect and the well-known reverse altitude
response. A more complex mathematical models that were developed but not
shown here due to complexity and size constraints validated and confirmed results
of simple model used here. The AEE phenomenon was known for quite some
time but often dismissed as irrelevant during flight at altitudes. However, during
few seconds of landing flare and touchdown this adverse effect plays a prominent
role which not only introduces initially reversed responses, but also generates
substantial effective dead-times which are accounted for in operational practice by
initiating round-out at higher altitudes and gentler than actually possible or
desired. Today’s standard manual landing and touchdown techniques actually
introduce large scattering and significant uncertainties in touchdown accuracy. No
flare touchdowns would be unacceptable due to severe landing gear structural
loads. A new pull-push landing technique which utilizes AEE to pilot’s advantage
has been introduced and described. It is believed that the proposed landing and
touchdown technique, in the absence of sophisticated direct-lift-control, would
save, on average, 500 to 1,000 feet of runway which is especially important when
landing on contaminated runways and during LAHSO operations. More results
will be presented in subsequent publications involving full 6-DOF nonlinear and
small-perturbation models while incorporating ground effect, atmospheric
turbulence and wind. Experimental piloted studies in full-flight simulators,
variable-stability, and real transport-category airplanes are required before the
results and the proposed landing technique could be validated and perhaps
implemented in daily operations. Experimental landing flare studies are difficult
due to short duration of the maneuver.
30
International Journal of Aviation, Aeronautics, and Aerospace, Vol. 1 [2014], Iss. 4, Art. 3
https://commons.erau.edu/ijaaa/vol1/iss4/3DOI: https://doi.org/10.15394/ijaaa.2014.1032
Author Bios
Dr. Nihad E. Daidzic is president of AAR Aerospace Consulting, L.L.C. He is also a full
professor of Aviation, adjunct professor of Mechanical Engineering, and research
graduate faculty at Minnesota State University. His Ph.D. is in fluid mechanics and Sc.D.
in mechanical engineering. He was formerly a staff scientist at the National Center for
Microgravity Research and the National Center for Space Exploration and Research at
NASA Glenn Research Center in Cleveland, OH. He also held various faculty
appointments at Vanderbilt University, University of Kansas, and Kent State University.
His current research interest is in theoretical, experimental, and computational fluid
dynamics, micro- and nano-fluidics, aircraft stability, control, and performance,
mechanics of flight, piloting techniques, and aerospace propulsion. Dr. Daidzic is ATP
and “Gold Seal” CFII/MEI/CFIG with flight experience in airplanes, helicopters, and
gliders.
31
Daidzic: Adverse Elevator Effect
Published by Scholarly Commons, 2014
References
Abzug, M. J., & Larrabee, E. E. (1997). Airplane stability and control: A history
of the technologies that made aviation possible. Cambridge, UK:
Cambridge University Press.
Blake, W., & Elliott, R. L. (1991, January). The last two minutes, Boeing Airliner,
1-9.
Cleveland, F.A. (1970). Size Effects in Conventional aircraft Design, Journal of
Aircraft, 7(6), 483-512
Daidzic, N. E., & Shrestha, J. (2008). Airplane landing performance on
contaminated runways in adverse conditions. Journal of Aircraft, 45,
2131-2144. doi: 10.2514/1.38056
Daidzic, N. E. (2009a, September). Avoiding veer-off accidents on contaminated
runways, Professional Pilot, 43(9), 54-58.
Daidzic, N. E. (2009b, December). Avoiding overrun accidents on contaminated
runways, Professional Pilot, 43(12), 104-107.
Daidzic, N. E. (2009c). Aircraft landing operations on contaminated runways,
WATS 2009, World Aviation Training Symposium and Tradeshow,
WATS Pilot Stream, Session 5: Air Carrier Training Insights, Rosen
Shingle Creek Resort, Orlando, Florida, April 28-30, 2009.
Daidzic, N.E. (2010). Adverse elevator effect in landing flare, Paper WATS 5.3,
WATS 2010, World Aviation Training Conference, Rosen Shingle Creek
Resort, Orlando, Florida, April 27-29, 2010.
Daidzic, N. E. (2011a, March). Dealing with contaminated runways. The Journal
for Civil Aviation Training (CAT), 2/2011, 29-32.
Daidzic, N. E. (2011b, May). Point of flare - the last five seconds, Professional
Pilot, 45(5), 110-114.
Daidzic, N.E. (2011c) Some considerations for regional airline operations on
contaminated runways, WATS 2011, World Aviation Training Conference,
Rosen Shingle Creek Resort, Orlando, Florida, Paper RATS 6.3, April 19-21,
2011.
32
International Journal of Aviation, Aeronautics, and Aerospace, Vol. 1 [2014], Iss. 4, Art. 3
https://commons.erau.edu/ijaaa/vol1/iss4/3DOI: https://doi.org/10.15394/ijaaa.2014.1032

Daidzic, N. E. (2013, August). T/O overruns and veer-offs on slippery runways
with crosswinds, Professional Pilot, 47(8), 54-58.
Davis, D.P. (1971). Handling the Big Jets. 3rd ed., London, UK: Civil Aviation
Authority.
Denton, J. (1993). Airline Pilot: A guide to good practices and techniques,
Auckland, New Zealand: DFT Publishing.
van Es, G. W. H., van der Geest, P. J., Cheng, A., Hackler, L., Dillard, A. E.
(2007). A study of normal operational landing performance on subsonic,
civil, narrow-body jet aircraft during instrument landing system
approaches (Final Report DOT/FAA/AR-07/7), Washington, DC:
USDOT, FAA.
Etkin, B. (1959). Dynamics of flight: Stability and control. New York, NY: John
Wiley & Sons.
Etkin, B. (2005). Dynamics of atmospheric flight. Mineola, NY: Dover.
Grantham, W. D., Smith, P. M., Person, L. H. Jr., Meyer, R. T., & Tingas, S. A.
(1987). Piloted simulator study of allowable time delays in large-airplane
response (NASA TP-2652), Hampton, VA: NASA Langley Research
Center.
Kolk, R. W. (1961). Modern flight dynamics. Englewood Cliffs, NJ: Prentice-
Hall, Inc.
Lykken, L. O., & Shah, N. M. (1972). Direct Lift Control for Improved
Automatic Landing and Performance of Transport Aircraft, Journal of
Aircraft, 9, 325-332.
Lowery, J. (2001). Professional Pilot, 2nd ed., Ames, IA: Iowa State University
Press.
Malmquist, S., Vincenzi, D. A., Liu, D. (2014). Kinematic effects in large
transport aircraft. Int. J. Aviation Aeronautics Aerospace, 1(3), 1-16.
Merat, R. (2008). Study of a Direct Lift Control System Based on the A380
Aircraft, (AIAA paper 2008-1432), 46th AIAA Aerospace Sciences
Meeting and Exhibit, January 7-10 2008, Reno, Nevada.
33
Daidzic: Adverse Elevator Effect
Published by Scholarly Commons, 2014
Nelson, R. C. (1998). Flight stability and automatic control. 2nd ed., New York,
NY: McGraw-Hill.
Phillips, W. F. (2004). Mechanics of flight. New York, NY: John Wiley & Sons.
Pinsker, W. J. G. (1969). The Landing Flare of Large Transport Aircraft (R. &
M. 3602), UK Ministry of Technology, Aeronautical Research Council,
UK: Her Majesty’s Stationery Office.
Phillips, W.H. (1979) Altitude response of several aircraft during landing
approach (NASA TM 80186), Hampton, VA: NASA Langley Research
Center.
Roskam, J. (2007). Airplane flight dynamics and automatic flight controls. Part I,
Lawrence, KS: DAR Corporation.
Russell, J. B. (1996). Performance and stability of aircraft. London, UK: Arnold.
Schiff, B. (1997). The Proficient Pilot. Volume 3, Newcastle, WA: Aviation
Supplies & Academics, Inc.
Seckel, E. (1964). Stability and control of airplanes and helicopters. New York,
NY: Academic Press.
Seckel, E., (1975) The Landing Flare: An Analysis and Flight-Test Investigation
(NASA Contractor Report CR-2517), Princeton University for NASA
Langley Research Center, Washington, DC: NASA
Spiegel, M. R. (1965). Laplace Transforms, New York, NY: McGraw-Hill.
Schmidt, D. K. (2012). Modern fight dynamics. New York, NY: McGraw-Hill.
Stengl, R. F. (2004). Flight dynamics. Princeton, NJ: Princeton University Press.
Stevens, B. L., & Lewis, F. L. (2003). Aircraft control and simulation. 2nd ed.,
Hoboken, NJ: John Wiley & Sons, Inc.
Stickle, J. W. (1961). An investigation of landing-contact conditions for two large
turbojet transports and a turboprop transport during routine daylight
operations (NASA TN D-899), Langley Field, VA: NASA Langley
Research Center.
34
International Journal of Aviation, Aeronautics, and Aerospace, Vol. 1 [2014], Iss. 4, Art. 3
https://commons.erau.edu/ijaaa/vol1/iss4/3DOI: https://doi.org/10.15394/ijaaa.2014.1032

US Department of Transportation, Federal Aviation Administration. (2013). Part
25, Airworthiness Standards: Transport Category Airplanes. Washington,
DC: Author.
Webb, J., & Walker, B. (2004). Fly the Wing. 3rd ed., Ames, IA: Blackwell
Publishing.
White, M. D. (1968). Proposed analytical Model for the final stages of landing a
transport airplane (NASA TN D-4438), Moffett Field, CA: NASA Ames
Research Center.
Zaal P. M. T., Pool D. M., de Bruin, J., Mulder, M., & van Paassen M. M. (2008).
Pilot’s use of pitch and heave motion cues in a pitch control task (AIAA
paper 2008-6537), AIAA Modeling and Simulation Technologies
Conference and Exhibit, August 18-21 2008, Honolulu, Hawaii.
35
Daidzic: Adverse Elevator Effect
Published by Scholarly Commons, 2014
Related Documents