Improving Adhesive Bonding of Composites Through Surface Characterization Using Inverse Gas Chromatography (IGC) Methods Rita Taitano Johnson Brian Flinn University of Washington Anaheim Convention Center | Anaheim, California, USA

Welcome message from author
This document is posted to help you gain knowledge. Please leave a comment to let me know what you think about it! Share it to your friends and learn new things together.
Transcript
Improving Adhesive Bonding of Composites Through Surface Characterization
Using Inverse Gas Chromatography (IGC) Methods
Rita Taitano JohnsonBrian Flinn
University of Washington
Anaheim Convention Center | Anaheim, California, USA
Participants Federal Aviation Administration
David Westland, Curtis DaviesCenter of Excellence in Advance Materials in Transport Aircraft Structures
The Boeing CompanyKay Blohowiak, John Osborne, Ryan Wilson, Gail Hahn
University of Washington Material Science EngrDr. Brian Flinn

Outline– Motivation & Key Issues – Introduction
– Measuring Surface Energy– Objective– Contact Angle Methodology – IGC Methodology
– Experimentation – Results
– Contact Angle Measurements – IGC Measurements
– Conclusions/Discussions– Future Work
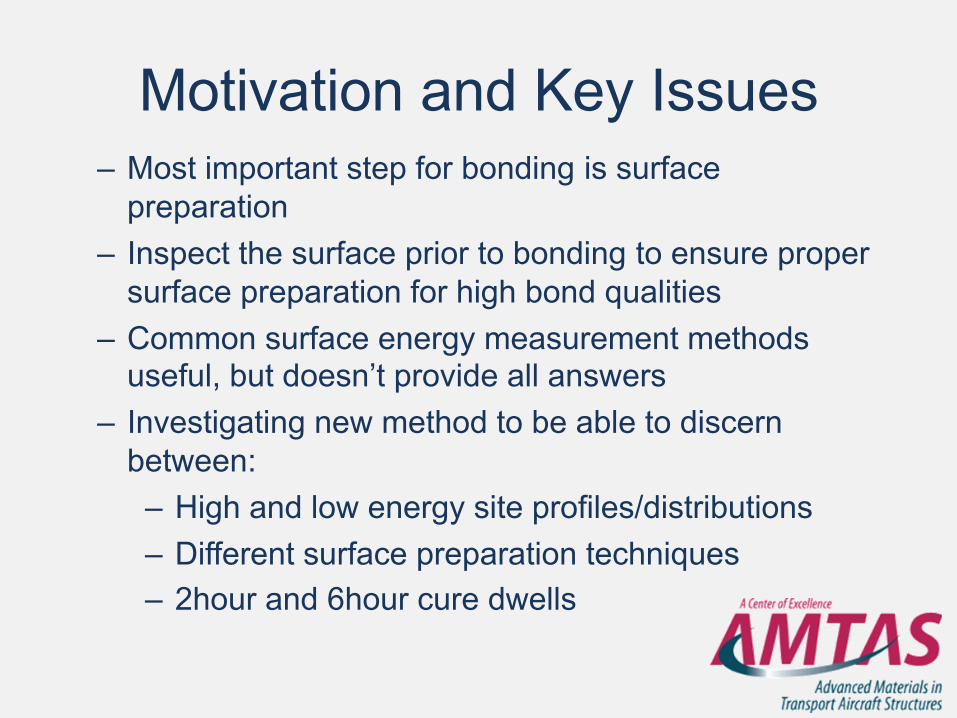
Motivation and Key Issues– Most important step for bonding is surface
preparation– Inspect the surface prior to bonding to ensure proper
surface preparation for high bond qualities – Common surface energy measurement methods
useful, but doesn’t provide all answers – Investigating new method to be able to discern
between:– High and low energy site profiles/distributions – Different surface preparation techniques– 2hour and 6hour cure dwells
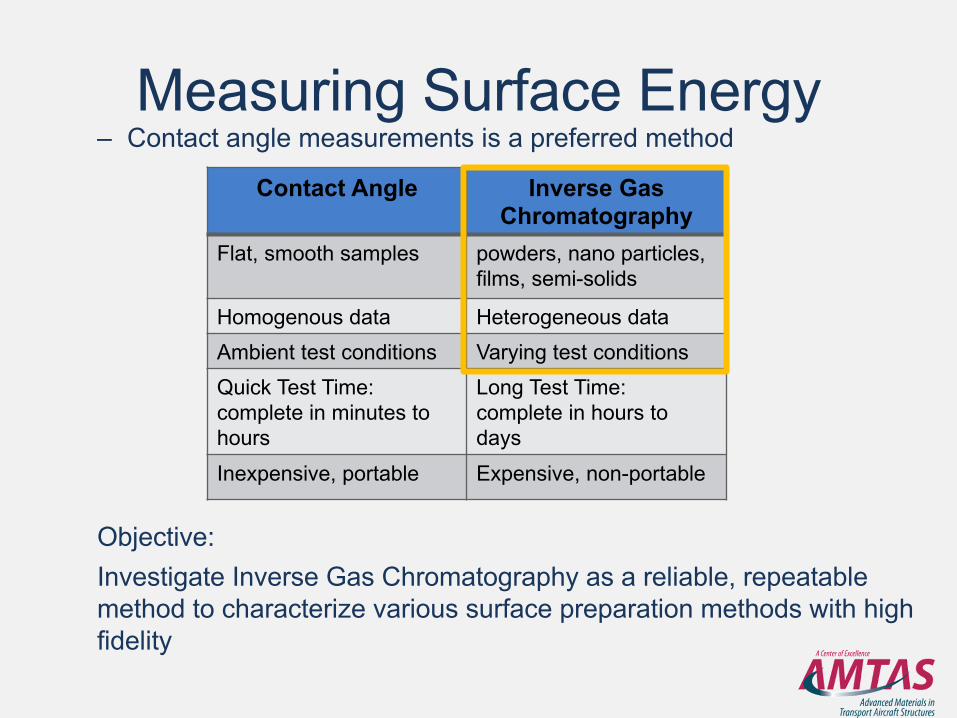
Measuring Surface Energy – Contact angle measurements is a preferred method
Objective: Investigate Inverse Gas Chromatography as a reliable, repeatable method to characterize various surface preparation methods with high fidelity
Contact Angle Inverse Gas Chromatography
Flat, smooth samples powders, nano particles, films, semi-solids
Homogenous data Heterogeneous data Ambient test conditions Varying test conditions Quick Test Time:complete in minutes to hours
Long Test Time: complete in hours to days
Inexpensive, portable Expensive, non-portable
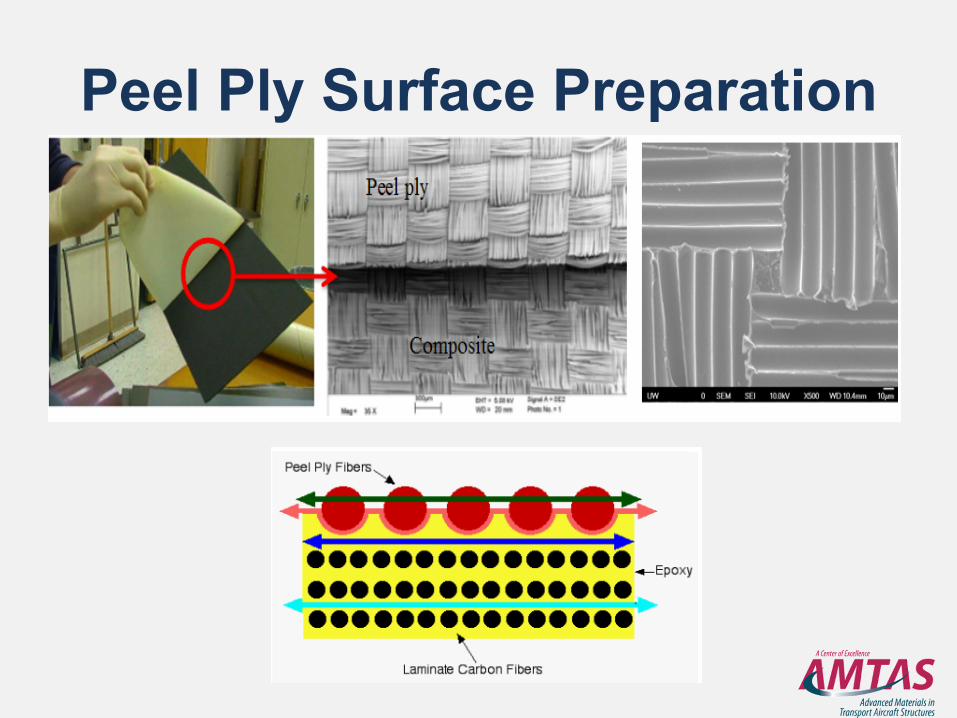
Peel Ply Surface Preparation
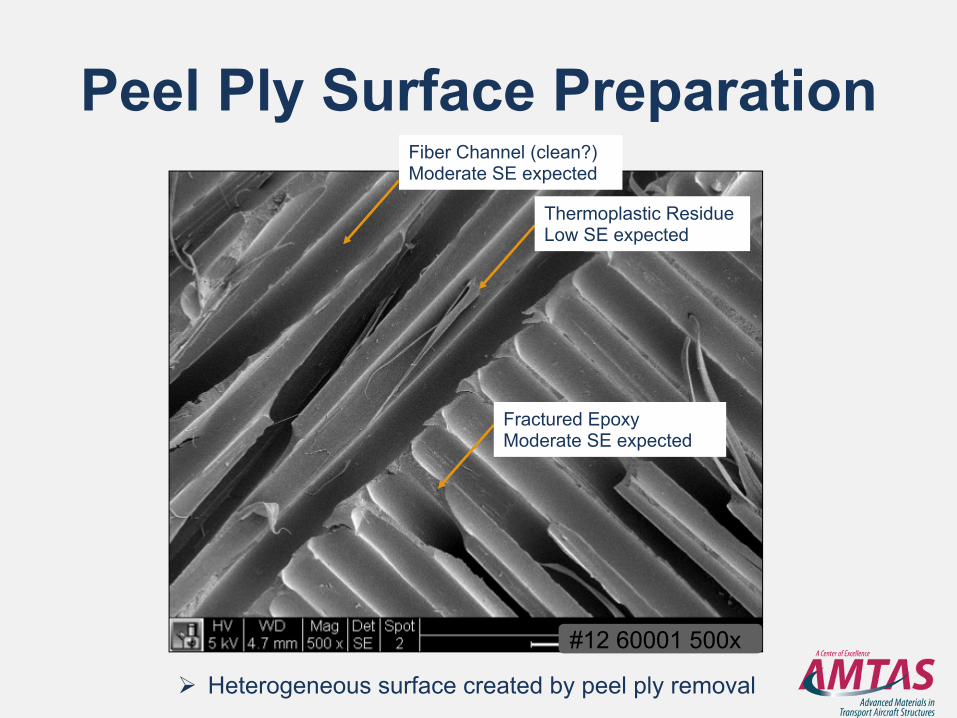
Peel Ply Surface Preparation
#12 60001 500x
Fractured EpoxyModerate SE expected
Fiber Channel (clean?)Moderate SE expected
Thermoplastic ResidueLow SE expected
Ø Heterogeneous surface created by peel ply removal
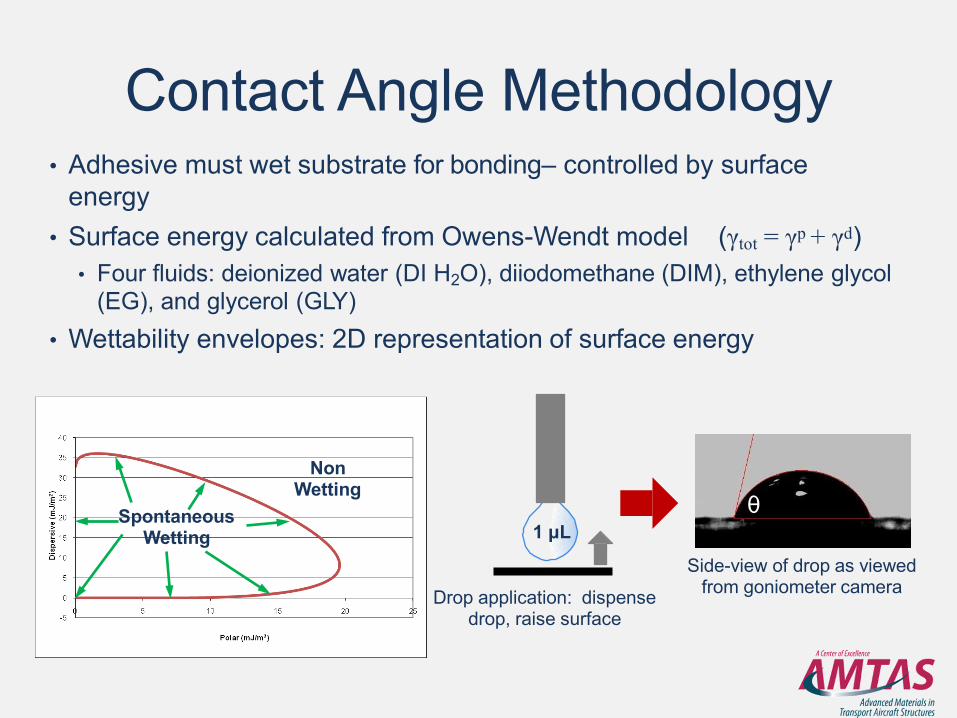
Contact Angle Methodology• Adhesive must wet substrate for bonding– controlled by surface
energy• Surface energy calculated from Owens-Wendt model (γtot = γp + γd)
• Four fluids: deionized water (DI H2O), diiodomethane (DIM), ethylene glycol(EG), and glycerol (GLY)
• Wettability envelopes: 2D representation of surface energy
Side-view of drop as viewed from goniometer camera
θ
Drop application: dispense drop, raise surface
1 μLSpontaneous
Wetting
Non Wetting
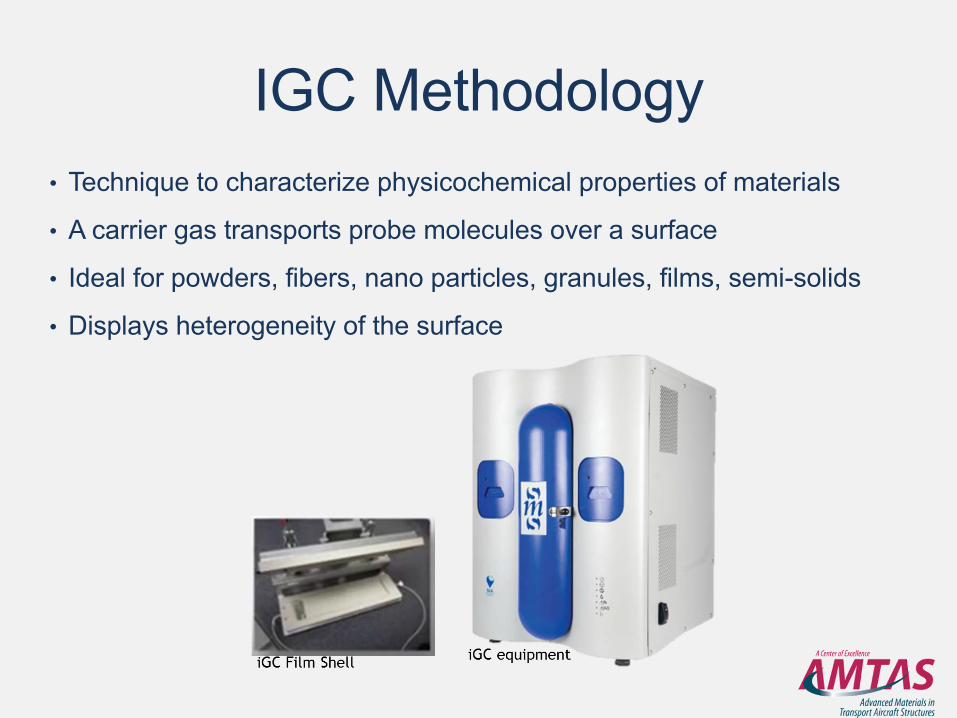
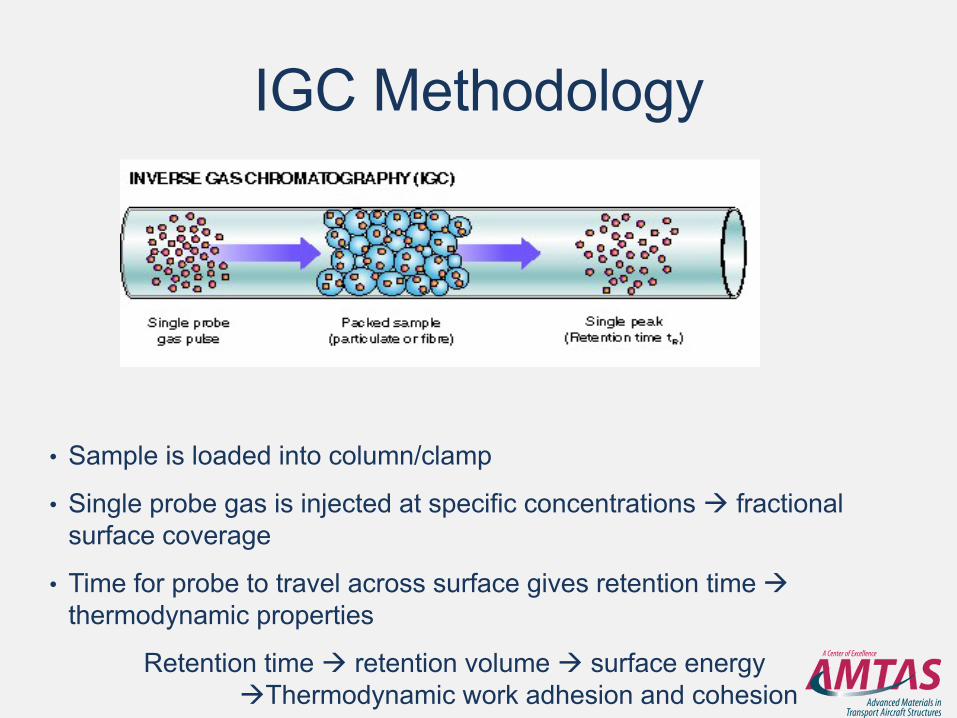
IGC Methodology• Technique to characterize physicochemical properties of materials
• A carrier gas transports probe molecules over a surface
• Ideal for powders, fibers, nano particles, granules, films, semi-solids
• Displays heterogeneity of the surface
IGC Methodology
• Sample is loaded into column/clamp
• Single probe gas is injected at specific concentrations à fractional surface coverage
• Time for probe to travel across surface gives retention time àthermodynamic properties
Retention time à retention volume à surface energyàThermodynamic work adhesion and cohesion
0.01,
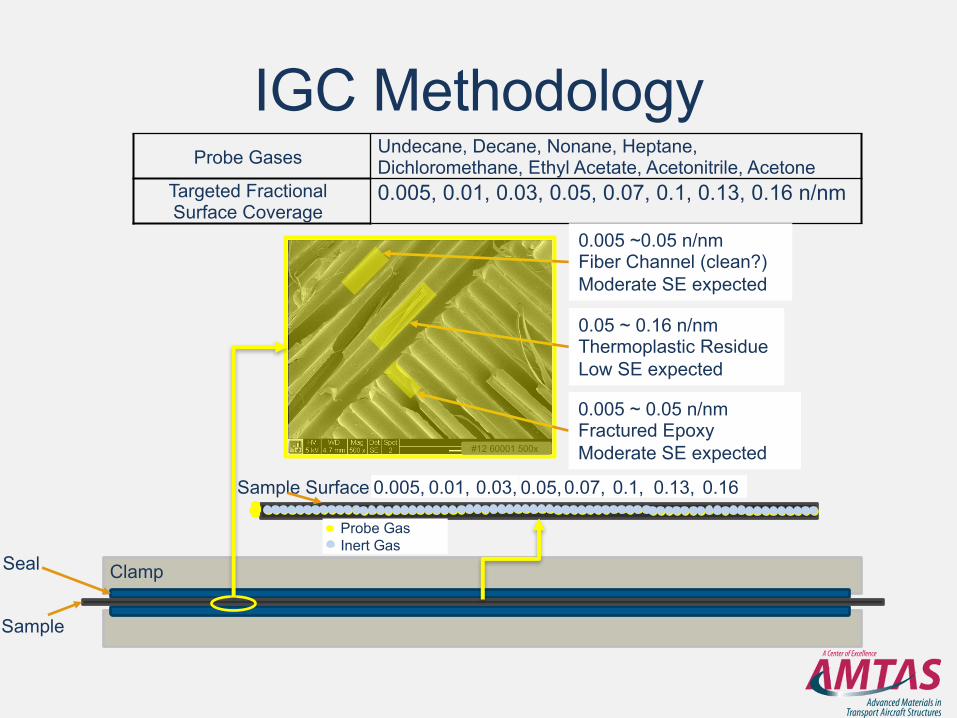
IGC MethodologyProbe Gases Undecane, Decane, Nonane, Heptane,
Dichloromethane, Ethyl Acetate, Acetonitrile, AcetoneTargeted Fractional Surface Coverage
0.005, 0.01, 0.03, 0.05, 0.07, 0.1, 0.13, 0.16 n/nm
#12 60001 500x
0.005 ~ 0.05 n/nmFractured EpoxyModerate SE expected
0.005 ~0.05 n/nmFiber Channel (clean?)Moderate SE expected
0.05 ~ 0.16 n/nmThermoplastic ResidueLow SE expected
Clamp
Sample
Seal
Sample Surface 0.0050.005, 0.03, 0.05,0.07, 0.1, 0.13, 0.16
Probe GasInert Gas
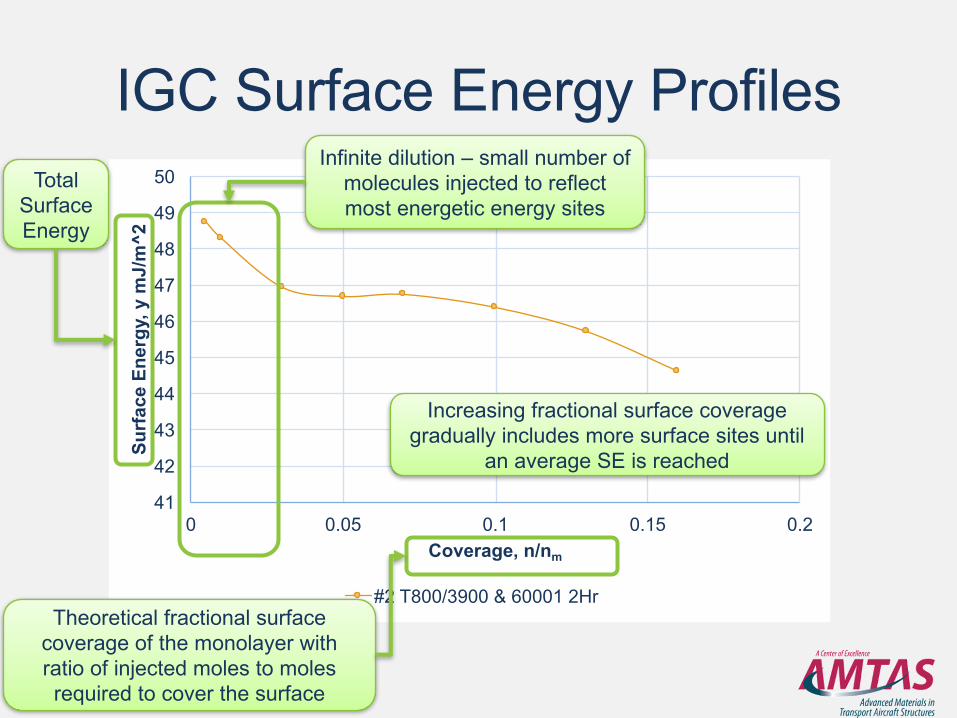
IGC Surface Energy Profiles
41
42
43
44
45
46
47
48
49
50
0 0.05 0.1 0.15 0.2
Surf
ace
Ener
gy, y
mJ/
m^2
Coverage, n/nm
#2 T800/3900 & 60001 2Hr
Total Surface Energy
Theoretical fractional surface coverage of the monolayer with ratio of injected moles to moles required to cover the surface
Infinite dilution – small number of molecules injected to reflect most energetic energy sites
Increasing fractional surface coverage gradually includes more surface sites until
an average SE is reached
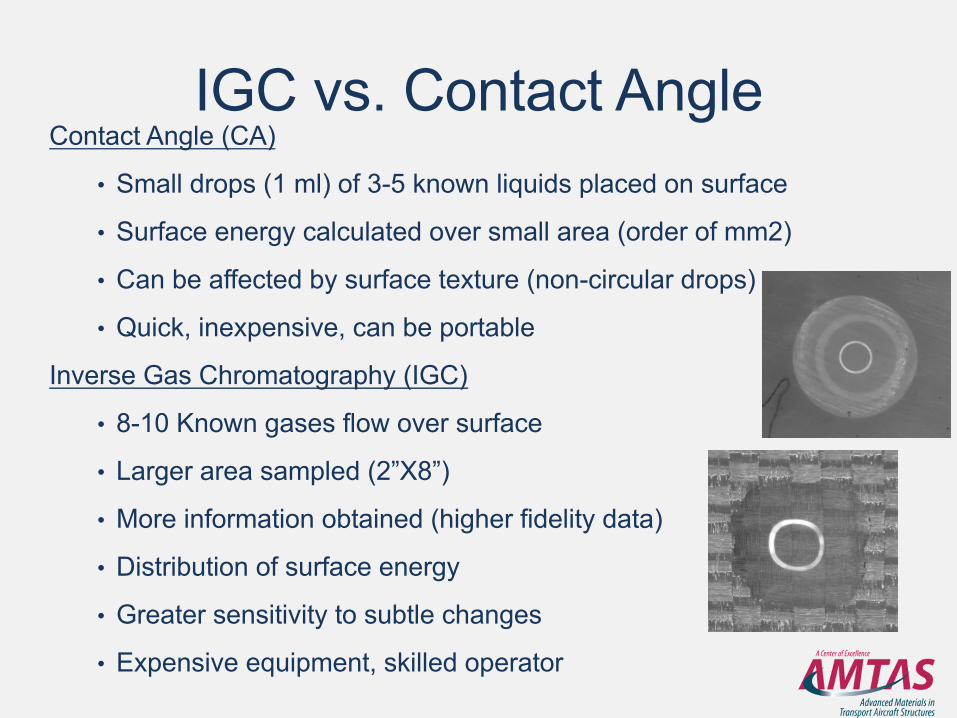
IGC vs. Contact AngleContact Angle (CA)
• Small drops (1 ml) of 3-5 known liquids placed on surface
• Surface energy calculated over small area (order of mm2)
• Can be affected by surface texture (non-circular drops)
• Quick, inexpensive, can be portable
Inverse Gas Chromatography (IGC)
• 8-10 Known gases flow over surface
• Larger area sampled (2”X8”)
• More information obtained (higher fidelity data)
• Distribution of surface energy
• Greater sensitivity to subtle changes
• Expensive equipment, skilled operator
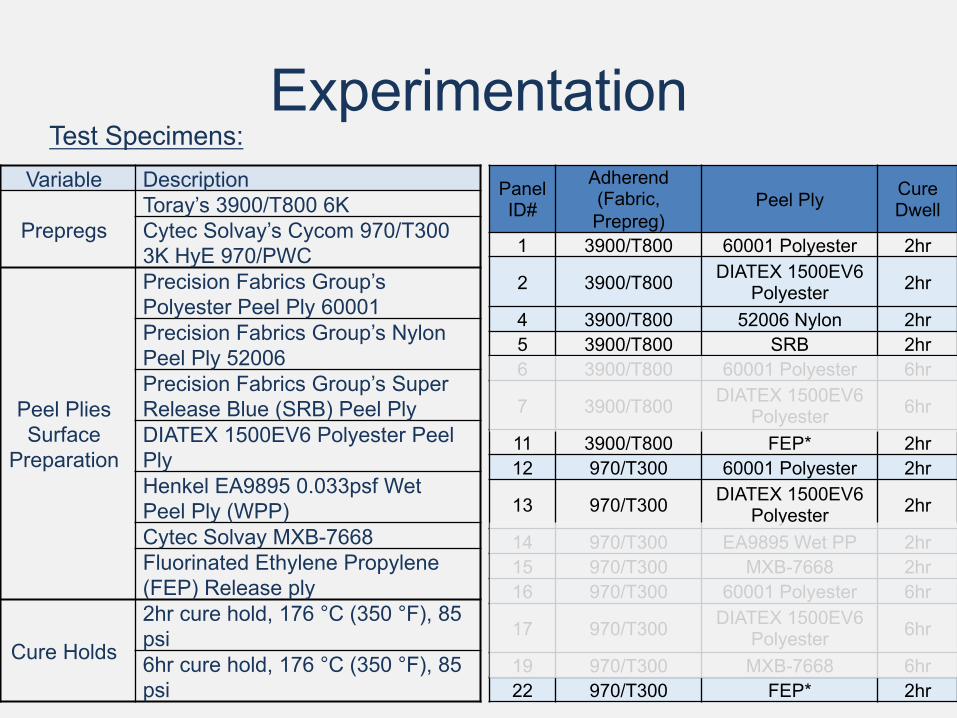
ExperimentationTest Specimens:
Panel ID#
Adherend(Fabric, Prepreg)
Peel Ply Cure Dwell
1 3900/T800 60001 Polyester 2hr
2 3900/T800 DIATEX 1500EV6 Polyester 2hr
4 3900/T800 52006 Nylon 2hr5 3900/T800 SRB 2hr6 3900/T800 60001 Polyester 6hr
7 3900/T800 DIATEX 1500EV6 Polyester 6hr
11 3900/T800 FEP* 2hr12 970/T300 60001 Polyester 2hr
13 970/T300 DIATEX 1500EV6 Polyester 2hr
14 970/T300 EA9895 Wet PP 2hr15 970/T300 MXB-7668 2hr16 970/T300 60001 Polyester 6hr
17 970/T300 DIATEX 1500EV6 Polyester 6hr
19 970/T300 MXB-7668 6hr22 970/T300 FEP* 2hr
Variable Description
PrepregsToray’s 3900/T800 6KCytec Solvay’s Cycom 970/T300 3K HyE 970/PWC
Peel Plies Surface
Preparation
Precision Fabrics Group’s Polyester Peel Ply 60001Precision Fabrics Group’s Nylon Peel Ply 52006Precision Fabrics Group’s Super Release Blue (SRB) Peel PlyDIATEX 1500EV6 Polyester Peel PlyHenkel EA9895 0.033psf Wet Peel Ply (WPP)Cytec Solvay MXB-7668Fluorinated Ethylene Propylene (FEP) Release ply
Cure Holds
2hr cure hold, 176 °C (350 °F), 85 psi6hr cure hold, 176 °C (350 °F), 85 psi
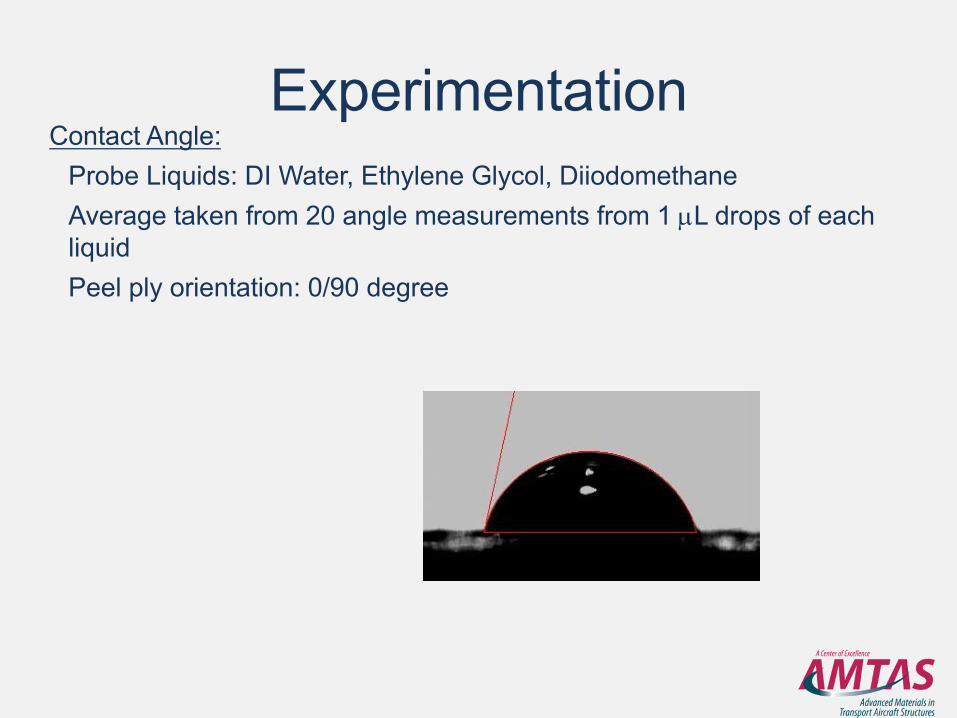
ExperimentationContact Angle:
Probe Liquids: DI Water, Ethylene Glycol, Diiodomethane Average taken from 20 angle measurements from 1 µL drops of each liquid Peel ply orientation: 0/90 degree
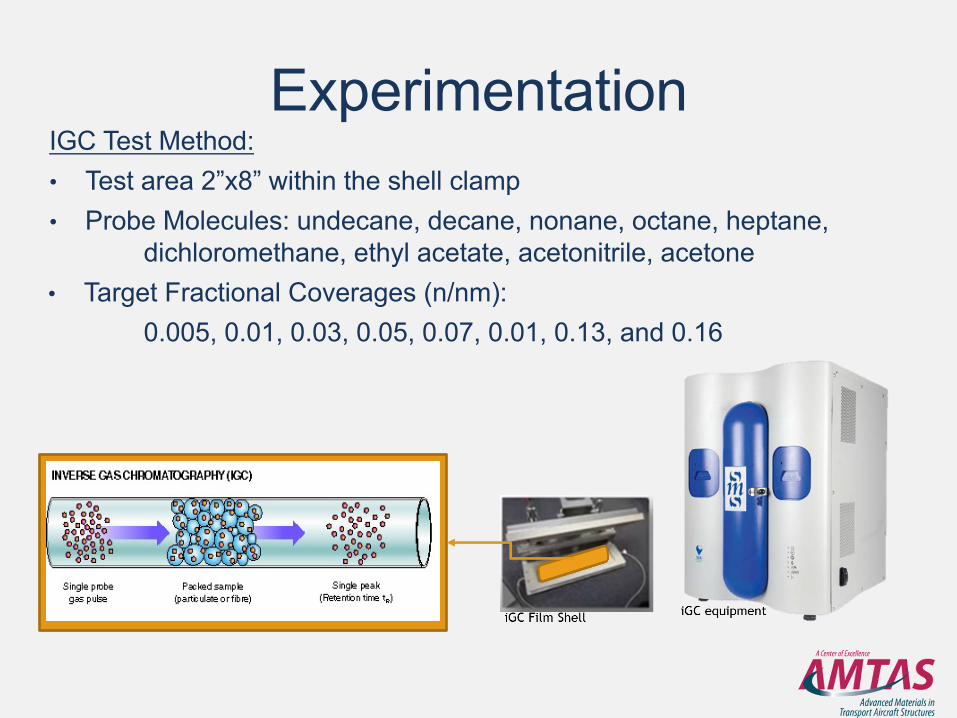
ExperimentationIGC Test Method:• Test area 2”x8” within the shell clamp • Probe Molecules: undecane, decane, nonane, octane, heptane,
dichloromethane, ethyl acetate, acetonitrile, acetone • Target Fractional Coverages (n/nm):
0.005, 0.01, 0.03, 0.05, 0.07, 0.01, 0.13, and 0.16
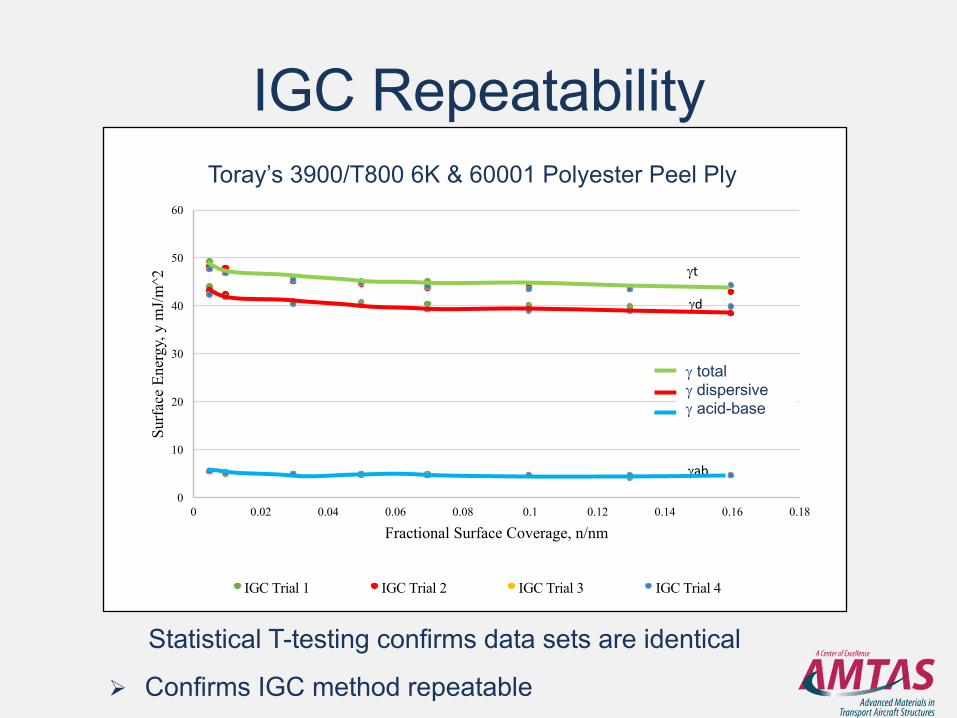
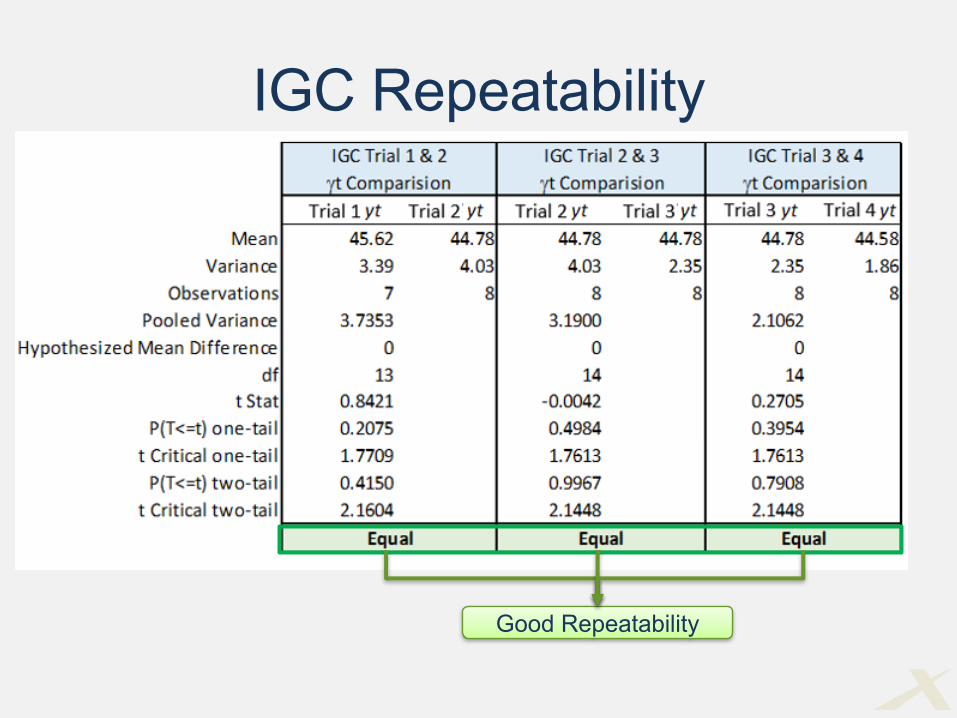
IGC Repeatability
IGC Repeatability
0
10
20
30
40
50
60
0 0.02 0.04 0.06 0.08 0.1 0.12 0.14 0.16 0.18
Surf
ace
Ener
gy, y
mJ/
m^2
Fractional Surface Coverage, n/nm
IGC Trial 1 IGC Trial 2 IGC Trial 3 IGC Trial 4
gt
gd
gab
g totalg dispersiveg acid-base
Statistical T-testing confirms data sets are identical
Ø Confirms IGC method repeatable
Toray’s 3900/T800 6K & 60001 Polyester Peel Ply
IGC and Contact Angle Comparison
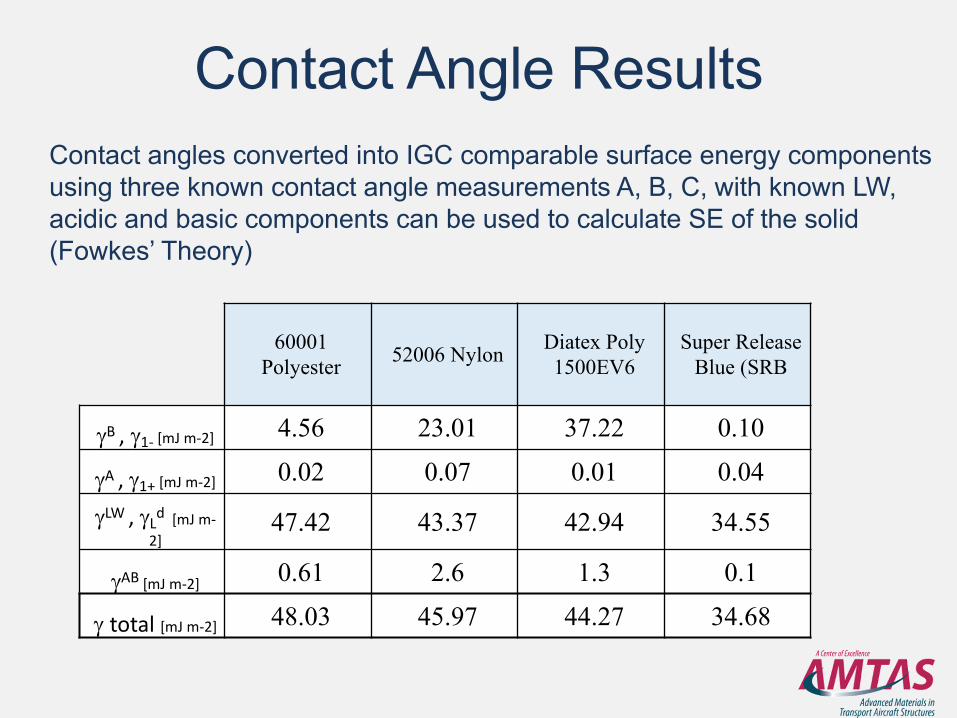
Contact Angle ResultsContact angles converted into IGC comparable surface energy components using three known contact angle measurements A, B, C, with known LW, acidic and basic components can be used to calculate SE of the solid (Fowkes’ Theory)
60001 Polyester 52006 Nylon Diatex Poly
1500EV6Super Release
Blue (SRB
gB, g1- [mJm-2] 4.56 23.01 37.22 0.10
gA,g1+[mJm-2] 0.02 0.07 0.01 0.04
gLW,gLd[mJm-2]
47.42 43.37 42.94 34.55
gAB[mJm-2] 0.61 2.6 1.3 0.1
g total[mJ m-2] 48.03 45.97 44.27 34.68
32
37
42
47
52
0 0.02 0.04 0.06 0.08 0.1 0.12 0.14 0.16
Surf
ace
Ene
rgy,
y m
J/m
^2
Fractional Surface Coverage, n/nm
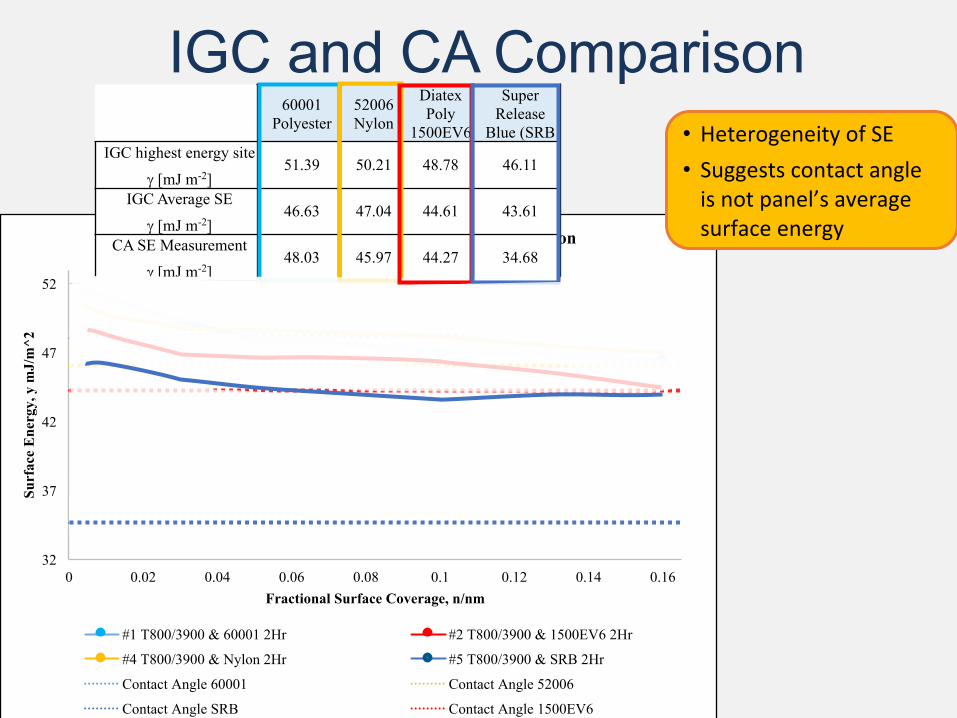
Contact Angle & IGC Surface Energy Profile Comparison
#1 T800/3900 & 60001 2Hr #2 T800/3900 & 1500EV6 2Hr
#4 T800/3900 & Nylon 2Hr #5 T800/3900 & SRB 2Hr
Contact Angle 60001 Contact Angle 52006
Contact Angle SRB Contact Angle 1500EV6
IGC and CA Comparison60001
Polyester52006 Nylon
DiatexPoly
1500EV6
Super Release
Blue (SRBIGC highest energy site
g [mJ m-2]51.39 50.21 48.78 46.11
IGC Average SE
g [mJ m-2]46.63 47.04 44.61 43.61
CA SE Measurement
g [mJ m-2]48.03 45.97 44.27 34.68
• HeterogeneityofSE• Suggestscontactangleisnotpanel’saveragesurfaceenergy

IGC and CA Comparison
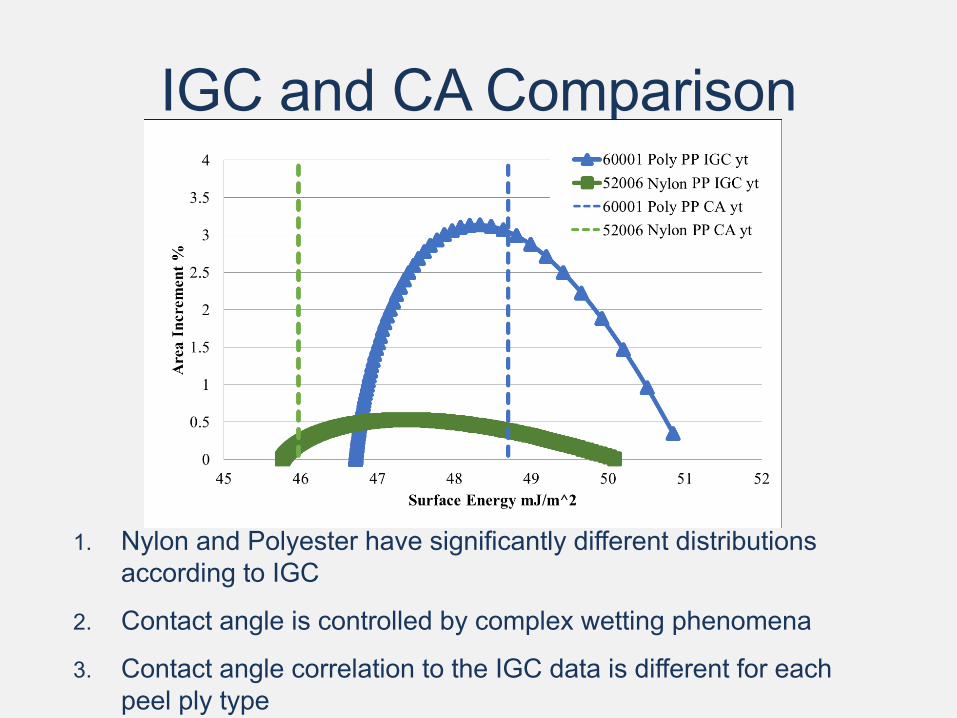
1. Nylon and Polyester have significantly different distributions according to IGC
2. Contact angle is controlled by complex wetting phenomena
3. Contact angle correlation to the IGC data is different for each peel ply type
43
44
45
46
47
48
49
50
51
52
0 0.05 0.1 0.15
Surfa
ce E
nerg
y, y
mJ/
m^2
Fractional Surface Coverage, n/nm
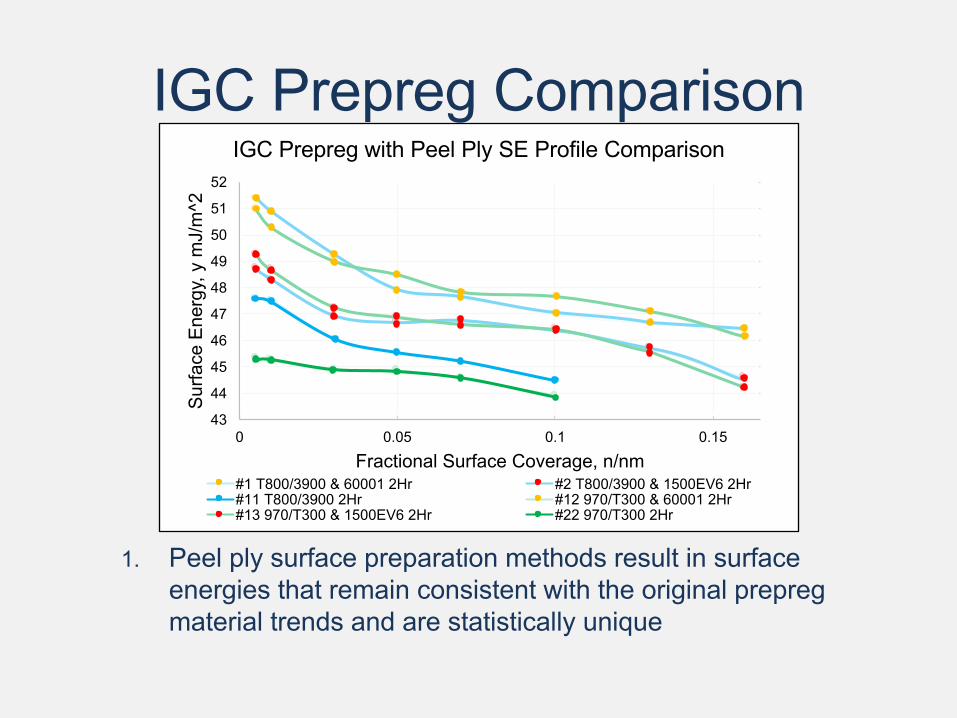
IGC Prepreg with Peel Ply SE Profile Comparison
#1 T800/3900 & 60001 2Hr #2 T800/3900 & 1500EV6 2Hr #11 T800/3900 2Hr #12 970/T300 & 60001 2Hr#13 970/T300 & 1500EV6 2Hr #22 970/T300 2Hr
IGC Prepreg Comparison
1. Peel ply surface preparation methods result in surface energies that remain consistent with the original prepregmaterial trends and are statistically unique
Conclusions/DiscussionIGC Repeatability:
• IGC statically replicated data over several tests of a given peel ply
• Trials were statistically identical
• Highest energy sites are represented by fractional surface coverages under 0.05 n/nm
• Small variability likely from panel fabrication and actual versus target fractional surface coverage areas
Conclusions/DiscussionIGC Compared to Contact Angle Surface Energy Values:
• Contact angle measurements allow only a homogeneous representation
• Different interactions between fluids (contact angle) and gases (IGC) with textured surfaces
• IGC is able to show the heterogeneous nature of the surface
• Distribution of the surface energy measurements show the contact angles are within IGC measured ranges
• Distributions indicate the degree to which the panels are heterogeneous
• Suggests contact angles do not necessarily represent the average surface energy
Future WorkContinued research is recommended to study the applications of IGC:
• Understand the advance models of wetting versus gas interactions
• Characterize additional surface preparation methods with IGC
• Relate surface preparation to bond quality types
• Additional statistical data and material coupon testing for a more complete representation of the bonding surface
• X-ray photoelectron spectroscopy (XPS)• Scanning electron microscopy (SEM)• Double cantilever beam (DCB)
Although IGC is able to provide more information on surface energies related to various surface preparations techniques, other components contributing to the quality of the bonding surface need to be investigated.

Questions?
References
θ
1.Satterwhite, J., J. Aubin, and B.D. Flinn. “Partial Laminate Curing for use in Peel Ply- Prepared Adhesive Bonding.” SAMPE 2009 – Baltimore, MD May 18 – 21, 2009.
2.Burnett, Dan. "Surface Characterization of Nanomaterials by Inverse Gas Chromatography -Surface Measurement Systems." Surface Measurement Systems. Surface Measurement Systems, 7 Oct. 2015. Web. 17 Apr. 2016.
3.Van Oss, C.J., et al., Interfacial Lifshitz-van der Waal and polar interactions in macroscopic systems. Chemical Reviews., 1988. 88 p. 927-941
4.Fowkes, F.M., Acid-base interactions in polymer adhesion, in Physicochemical Aspects of Polymer Surfaces, K.L. Mittal, Editor. 1981, Plenum Press: New York. P 583-603
5.Cognard, Philippe. Adhesives and Sealants: General Knowledge, Application Techniques, New Curing Techniques. Amsterdam: Elsevier, 2006. N. pag. Print.
6.Lee, Lieng-Huang. Fundamentals of Adhesion. New York: Plenum, 1991. Print.
7.Tracey, Ashley C., and Brian D. Flinn. IMPROVING ADHESIVE BONDING OF COMPOSITES THROUGH SURFACE CHARACTERIZATION - Variables That Affect Contact Angle Measurements on Peel Ply Surfaces. Thesis. U. Washington - Seattle, 2014. Seattle: JAMS, 2014. Print.

Backup Slides
IGC Repeatability
Good Repeatability
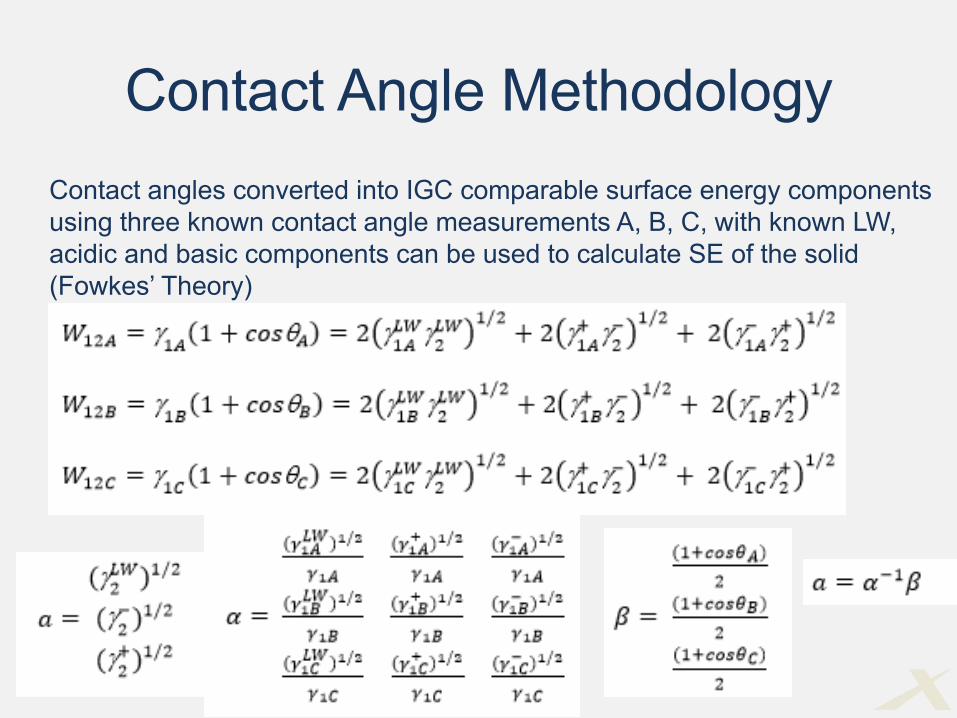
Contact Angle MethodologyContact angles converted into IGC comparable surface energy components using three known contact angle measurements A, B, C, with known LW, acidic and basic components can be used to calculate SE of the solid (Fowkes’ Theory)
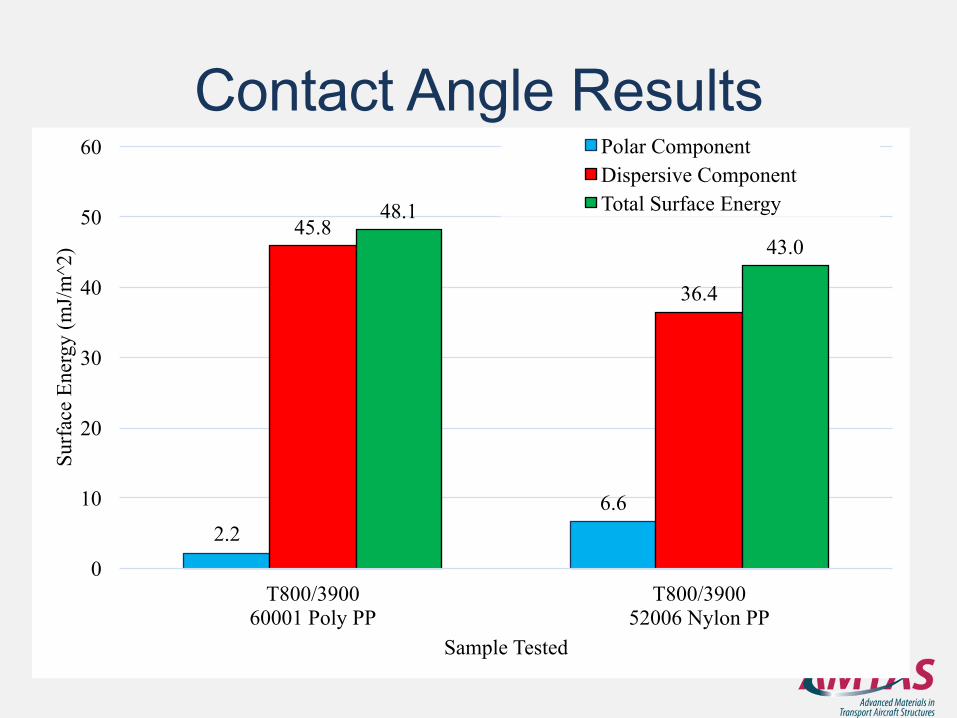
Contact Angle Results
2.26.6
45.8
36.4
48.1
43.0
0
10
20
30
40
50
60
T800/390060001 Poly PP
T800/390052006 Nylon PP
Surf
ace
Ener
gy (m
J/m
^2)
Sample Tested
Polar ComponentDispersive ComponentTotal Surface Energy
IGC and CA Comparison
45
46
47
48
49
50
51
0 0.05 0.1 0.15
Surf
ace
Ene
rgy,
y m
J/m
^2
Fractional Surface Coverage, n/nm
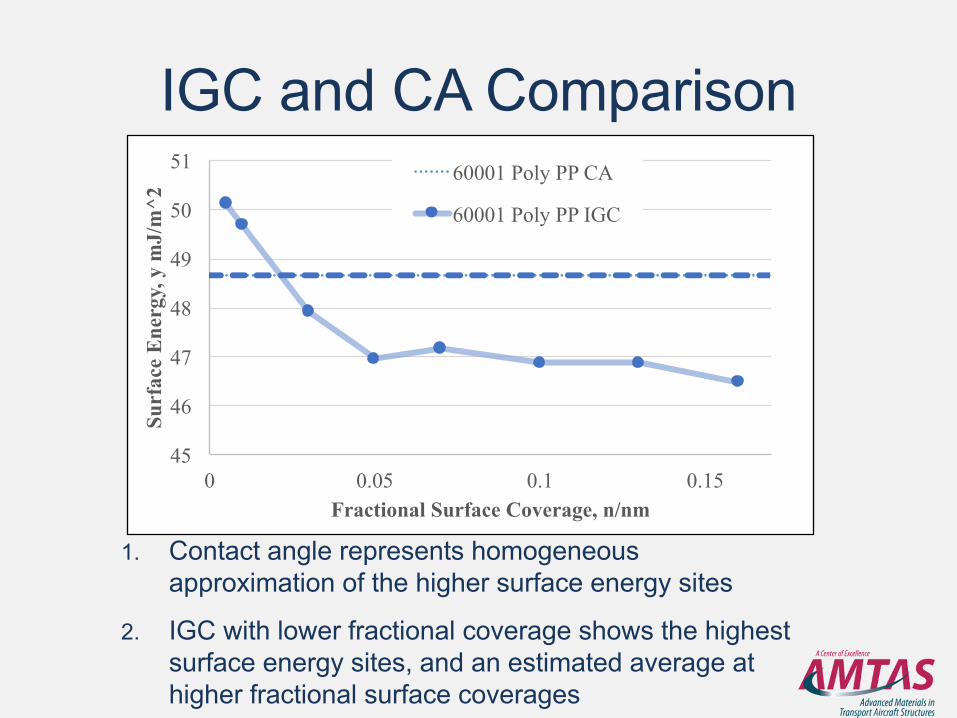
60001 Poly PP CA
60001 Poly PP IGC
1. Contact angle represents homogeneous approximation of the higher surface energy sites
2. IGC with lower fractional coverage shows the highest surface energy sites, and an estimated average at higher fractional surface coverages
IGC and CA Comparison
45.00
46.00
47.00
48.00
49.00
50.00
51.00
0 0.05 0.1 0.15
Surf
ace
Ene
rgy,
y m
J/m
^2
Fractional Surface Coverage, n/nm
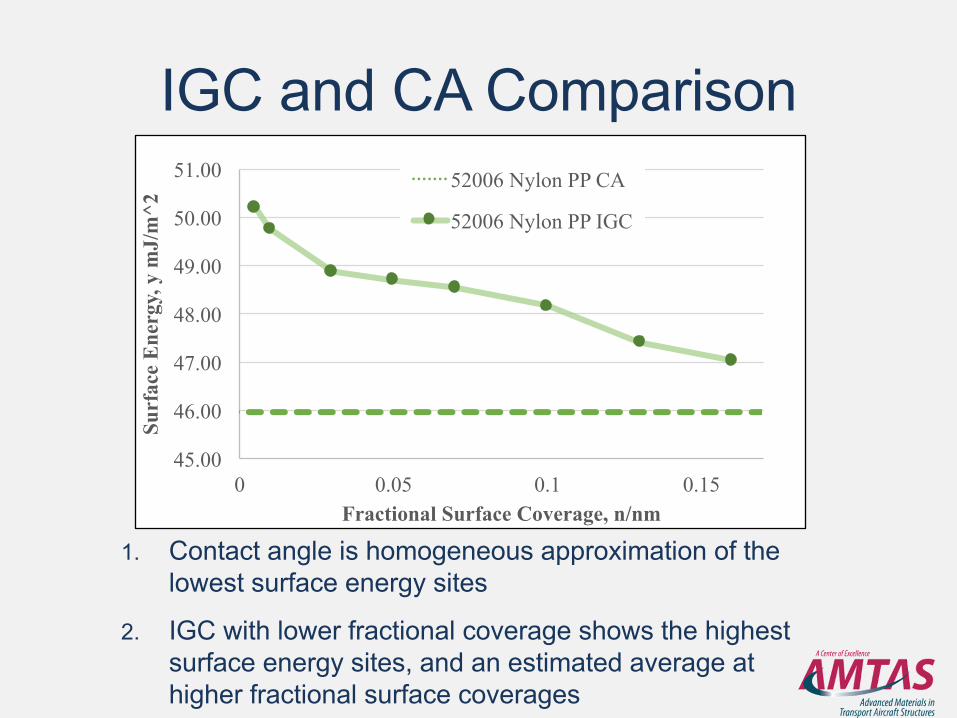
52006 Nylon PP CA
52006 Nylon PP IGC
1. Contact angle is homogeneous approximation of the lowest surface energy sites
2. IGC with lower fractional coverage shows the highest surface energy sites, and an estimated average at higher fractional surface coverages
IGC and CA Comparison
1. Nylon and Polyester have significantly different distributions according to IGC
2. Contact angle is controlled by complex wetting phenomena
3. Contact angle correlation to the IGC data is different for each peel ply type
Related Documents