proteins STRUCTURE O FUNCTION O BIOINFORMATICS Improving accuracy of protein contact prediction using balanced network deconvolution Hai-Ping Sun, 1,2 Yan Huang, 3 Xiao-Fan Wang, 1,2 Yang Zhang, 4 and Hong-Bin Shen 1,2,4 * 1 Institute of Image Processing and Pattern Recognition, Shanghai Jiao Tong University, Shanghai, 200240, China 2 Key Laboratory of System Control and Information Processing, Ministry of Education of China, Shanghai, 200240, China 3 National Laboratory for Infrared Physics, Shanghai Institute of Technical Physics, Chinese Academy of Science, Shanghai, 200083, China 4 Department of Computational Medicine and Bioinformatics, University of Michigan, Ann Arbor, Michigan, 48109 ABSTRACT Residue contact map is essential for protein three-dimensional structure determination. But most of the current contact pre- diction methods based on residue co-evolution suffer from high false-positives as introduced by indirect and transitive con- tacts (i.e., residues A–B and B–C are in contact, but A–C are not). Built on the work by Feizi et al. (Nat Biotechnol 2013; 31:726–733), which demonstrated a general network model to distinguish direct dependencies by network deconvolution, this study presents a new balanced network deconvolution (BND) algorithm to identify optimized dependency matrix with- out limit on the eigenvalue range in the applied network systems. The algorithm was used to filter contact predictions of five widely used co-evolution methods. On the test of proteins from three benchmark datasets of the 9th critical assessment of protein structure prediction (CASP9), CASP10, and PSICOV (precise structural contact prediction using sparse inverse covariance estimation) database experiments, the BND can improve the medium- and long-range contact predictions at the L/5 cutoff by 55.59% and 47.68%, respectively, without additional central processing unit cost. The improvement is statisti- cally significant, with a P-value < 5.93 3 10 23 in the Student’s t-test. A further comparison with the ab initio structure pre- dictions in CASPs showed that the usefulness of the current co-evolution-based contact prediction to the three-dimensional structure modeling relies on the number of homologous sequences existing in the sequence databases. BND can be used as a general contact refinement method, which is freely available at: http://www.csbio.sjtu.edu.cn/bioinf/BND/. Proteins 2015; 83:485–496. V C 2014 Wiley Periodicals, Inc. Key words: protein structure prediction; residue contact map; residue co-evolution; transitive noise; filter; predictor. INTRODUCTION The three-dimensional (3D) structure of proteins is often represented by a two-dimensional residue contact map matrix, where the nodes represent the protein residues and the edges are used to represent the spatial relationship between residues. The contact map contains important con- straints for determining protein structures. 1–8 Typically, when the spatial distance of two residues is close enough, for example, 8 A ˚ , its corresponding entry in the contact map matrix is set to 1, or otherwise 0. Because wet-lab experi- ments are extremely time-consuming and expensive, specifi- cally designed automated computational methods have been widely used to predict the protein residue contact map. For instance, based on the hypothesis that the contacted residues will co-mutate, 9–15 the mutual information (MI)-based approach 16 and its variant, mutual information without the Additional Supporting Information may be found in the online version of this article. Abbreviations: 3D, three-dimensional; BND, balanced network deconvolution; CASP, critical assessment of protein structure prediction; DCA, direct-cou- pling analysis; gDCA, Gaussian DCA; MI, mutual information; MIp, mutual information without the influence of phylogeny or entropy; MSA, multiple sequence alignment; ND, network deconvolution; PSICOV, precise structural contact prediction using sparse inverse covariance estimation. Grant sponsor: National Natural Science Foundation of China; Grant numbers: 61222306; 91130033; 61175024; Grant sponsor: Shanghai Science and Technology Commission; Grant number: 11JC1404800; Grant sponsor: Author of National Excellent Doctoral Dissertation of PR China; Grant number: 201048; Grant spon- sor: National Institute of General Medical Sciences; Grant number: GM083107. *Correspondence to: H.B. Shen, Institute of Image Processing and Pattern Recog- nition, Shanghai Jiao Tong University and Key Laboratory of System Control and Information Processing, Ministry of Education of China, Shanghai 200240, China. E-mail: [email protected] Received 31 August 2014; Revised 20 November 2014; Accepted 2 December 2014 Published online 18 December 2014 in Wiley Online Library (wileyonlinelibrary. com). DOI: 10.1002/prot.24744 V V C 2014 WILEY PERIODICALS, INC. PROTEINS 485

Welcome message from author
This document is posted to help you gain knowledge. Please leave a comment to let me know what you think about it! Share it to your friends and learn new things together.
Transcript

proteinsSTRUCTURE O FUNCTION O BIOINFORMATICS
Improving accuracy of protein contactprediction using balanced networkdeconvolutionHai-Ping Sun,1,2 Yan Huang,3 Xiao-Fan Wang,1,2 Yang Zhang,4 and Hong-Bin Shen1,2,4*1 Institute of Image Processing and Pattern Recognition, Shanghai Jiao Tong University, Shanghai, 200240, China
2 Key Laboratory of System Control and Information Processing, Ministry of Education of China, Shanghai, 200240, China
3 National Laboratory for Infrared Physics, Shanghai Institute of Technical Physics, Chinese Academy of Science, Shanghai, 200083, China
4 Department of Computational Medicine and Bioinformatics, University of Michigan, Ann Arbor, Michigan, 48109
ABSTRACT
Residue contact map is essential for protein three-dimensional structure determination. But most of the current contact pre-
diction methods based on residue co-evolution suffer from high false-positives as introduced by indirect and transitive con-
tacts (i.e., residues A–B and B–C are in contact, but A–C are not). Built on the work by Feizi et al. (Nat Biotechnol 2013;
31:726–733), which demonstrated a general network model to distinguish direct dependencies by network deconvolution,
this study presents a new balanced network deconvolution (BND) algorithm to identify optimized dependency matrix with-
out limit on the eigenvalue range in the applied network systems. The algorithm was used to filter contact predictions of
five widely used co-evolution methods. On the test of proteins from three benchmark datasets of the 9th critical assessment
of protein structure prediction (CASP9), CASP10, and PSICOV (precise structural contact prediction using sparse inverse
covariance estimation) database experiments, the BND can improve the medium- and long-range contact predictions at the
L/5 cutoff by 55.59% and 47.68%, respectively, without additional central processing unit cost. The improvement is statisti-
cally significant, with a P-value < 5.93 3 1023 in the Student’s t-test. A further comparison with the ab initio structure pre-
dictions in CASPs showed that the usefulness of the current co-evolution-based contact prediction to the three-dimensional
structure modeling relies on the number of homologous sequences existing in the sequence databases. BND can be used as
a general contact refinement method, which is freely available at: http://www.csbio.sjtu.edu.cn/bioinf/BND/.
Proteins 2015; 83:485–496.VC 2014 Wiley Periodicals, Inc.
Key words: protein structure prediction; residue contact map; residue co-evolution; transitive noise; filter; predictor.
INTRODUCTION
The three-dimensional (3D) structure of proteins is often
represented by a two-dimensional residue contact map
matrix, where the nodes represent the protein residues and
the edges are used to represent the spatial relationship
between residues. The contact map contains important con-
straints for determining protein structures.1–8 Typically,
when the spatial distance of two residues is close enough, for
example, 8 A, its corresponding entry in the contact map
matrix is set to 1, or otherwise 0. Because wet-lab experi-
ments are extremely time-consuming and expensive, specifi-
cally designed automated computational methods have been
widely used to predict the protein residue contact map. For
instance, based on the hypothesis that the contacted residues
will co-mutate,9–15 the mutual information (MI)-based
approach16 and its variant, mutual information without the
Additional Supporting Information may be found in the online version of this
article.
Abbreviations: 3D, three-dimensional; BND, balanced network deconvolution;
CASP, critical assessment of protein structure prediction; DCA, direct-cou-
pling analysis; gDCA, Gaussian DCA; MI, mutual information; MIp, mutual
information without the influence of phylogeny or entropy; MSA, multiple
sequence alignment; ND, network deconvolution; PSICOV, precise structural
contact prediction using sparse inverse covariance estimation.
Grant sponsor: National Natural Science Foundation of China; Grant numbers:
61222306; 91130033; 61175024; Grant sponsor: Shanghai Science and Technology
Commission; Grant number: 11JC1404800; Grant sponsor: Author of National
Excellent Doctoral Dissertation of PR China; Grant number: 201048; Grant spon-
sor: National Institute of General Medical Sciences; Grant number: GM083107.
*Correspondence to: H.B. Shen, Institute of Image Processing and Pattern Recog-
nition, Shanghai Jiao Tong University and Key Laboratory of System Control and
Information Processing, Ministry of Education of China, Shanghai 200240, China.
E-mail: [email protected]
Received 31 August 2014; Revised 20 November 2014; Accepted 2 December 2014
Published online 18 December 2014 in Wiley Online Library (wileyonlinelibrary.
com). DOI: 10.1002/prot.24744
VVC 2014 WILEY PERIODICALS, INC. PROTEINS 485

influence of phylogeny or entropy (MIp),17 have been
widely used.
Although much progress has been obtained on develop-
ing computational algorithms for predicting residue con-
tacts, the prediction quality is usually low. For instance,
one of the observations is that the contact network from
predictors is noisy and inaccurate because of the data being
contaminated by the variable indirect relationship.18,19
The transitive effects of correlations are considered as a
main source of indirect contacts.18 If there are true con-
tacts between sites AB and BC, it will result in observed
false correlations between AC with a high probability. The
network data quality will significantly affect the resolution
of the modeled 3D structure; thus, separating the direct
contact from indirect contact is an essential but tough
task, especially with a shortage of prior knowledge.
Many groups have developed different approaches to find
direct information flows from the initially observed contact
data by filtering the transitive noise. For example, the precise
structural contact prediction using sparse inverse covariance
estimation (PSICOV),19 which uses an inversed partial corre-
lation matrix, the direct-coupling analysis (DCA),20 which
employs a Potts model, and Gaussian DCA (gDCA),21 which
is a variant of DCA, are three outstanding methods in separat-
ing direct dependencies from indirect dependencies in the res-
idue contact map. Recently, the network deconvolution
(ND)18 approach formulates the problem of removing transi-
tive relationships as the inverse of network convolution. Its
hypothesis is that the observed data are the sum of both direct
and indirect contacts, which can be reflected by summing all
direct matrix powers. Compared with other existing
approaches, ND is a cutting-edge method in terms of its effi-
ciency and general application capability.
In the ND algorithm, the noise model is represented by the
sum of all direct matrix powers. The result is that the eigenval-
ues of the initially observed (predicted) matrix must be scaled
to make the eigenvalues of the direct matrix meet the conver-
gence requirement of the infinite series. The reason is that the
items of even powers in the infinite series will make all trans-
formed eigenvalues positive, making the eigenvalues (kobs) of
the observed matrix Gobs in a narrow range (kobs > 20:5).
Consequently, in order to cope with various potential kobs in
the real observed matrix, a network-dependent parameter has
to be used to enlarge the range of eigenvalues of the observed
contact maps in the ND algorithm.
To solve this problem, in this article, a new balanced
network deconvolution (BND) algorithm was proposed
to remove transitive relationships. The BND will keep
the balanced distribution of eigenvalues, endowing it
with robustness without needing an optimized scaling
parameter. Instead of representing the observed matrix
data as the sum of direct matrix and all its powers, only
the direct matrix and its odd powers are considered as
the noise model. By doing this, we can infer 8kobs 2 R
from kdir in the range of jkdirj < 1. In this case, there is,
therefore, no further need of scaling parameters in BND.
Experimental results on the benchmark 9th critical
assessment of protein structure prediction (CASP9),
CASP10, and PSICOV datasets demonstrate BND as a
much more accurate filter than the ND approach. The
best merit of the BND for protein residue contact map
prediction is that it is a parameter-free postprocessing
step and independent of the prediction algorithms, which
can therefore generate an additional benefit at no cost of
changing the prediction algorithms.
DATASETS AND METHODS
Benchmark datasets
Three benchmark datasets were used to evaluate the
proposed BND algorithm. The first one is the set of 147
proteins in the CASP9 competition, the second is the set
of 121 proteins in the CASP10 competition, and the third
is the set of 150 proteins used in PSICOV.19 Contacts are
defined as those pairs of residues where the spatial distance
of their C-batoms (C-a in the case of glycine) is <8 A.22
Initial observed contact matrix
Given a query protein sequence of L residues, five
sequence-based residue–residue contact predictors were
used to generate the initial observed contact matrix Gobs,
which is a symmetry matrix of L3L with the Gobsði; jÞentries, indicating the contact probability between the i-th
and the j-th residues. The five predictors are MI,16
MIp,17 DCA,20 its recent variant gDCA,21 and PSICOV.19
Here, we give their brief introductions separately.
The idea of MI-based residue contact prediction algo-
rithm is to estimate the co-evolution probability though
the MI statistic between two residues calculated from the
multiple sequence alignment (MSA), which is generated
by searching the query sequence against a large sequence
database, for example, searching the query sequence
using PSI-BLAST program against the NR (nonredun-
dant) database. The MI between positions Sa and Sb
along the sequence can be calculated as:
MIðSa; SbÞ ¼ HðSaÞ1HðSbÞ-HðSa; SbÞ (1)
where, HðSaÞ and HðSbÞ are the entropy of positions Sa
and Sb derived from the MSA, respectively:
HðSaÞ ¼ 2X
xpðx; SaÞlog10pðx; SaÞ
HðSbÞ ¼ 2X
xpðx; SbÞlog10pðx; SbÞ
8<: (2)
where, pðx; SaÞ and pðx; SbÞ represent the frequencies of
occurrence of amino acid x at columns Sa and Sb in the
MSA. HðSa; SbÞ in Eq. (1) is the joint entropy of col-
umns Sa and Sb.
An improved version of MI-based algorithm called
MIp was proposed on the consideration of reduction of
the influence of phylogeny or entropy.17 The MIp uses
H.-P. Sun et al.
486 PROTEINS
Eq. (3) to estimate the background MI shared by posi-
tions Sa and Sb:
BðSa; SbÞ ¼MIðSa; �ÞMIðSb; �Þ
MI(3)
where, MIðSa; �Þ and MIðSb; �Þ represent the mean MI of
columns Sa and Sb, respectively. MIðSa; �Þ is defined by1
M�1
Pi¼1:Mi 6¼a
MIðSa; SiÞ, where M is the number of columns in
the MSA. Similarly, MI represents the overall mean MI
in the MSA. Then the MIp of Sa and Sb is:
MIpðSa; SbÞ ¼ MIðSa; SbÞ2BðSa; SbÞ (4)
DCA20 and PSICOV19 are two methods proposed
recently trying to remove the transitive contact effects.
PSICOV attempts to correct indirect coupling effect by
calculating partial correlation coefficient, whereas DCA
tries to correct indirect coupling effect by maximizing
entropy using the Potts model. For a further develop-
ment on DCA, gDCA21 used a multivariate Gaussian
modeling approach to replace discrete amino acid states
with continuous Gaussian random variables.
Given a query protein sequence, the above five predic-
tors, that is, MI, MIp, DCA, gDCA, and PSICOV, will be
used to generate the initial residue contact maps Gobs,
and the aim of this study was to filter the transitive
noises from the Gobs to get the true contact matrix Gdir.
Network deconvolution
The ND model18 formulates the transitive closure of a
network as an infinite sum of true direct network, which
can be written in a closed infinite-series sum. The rela-
tionship between the true network matrix (Gdir) and the
observed network matrix (Gobs) in the ND algorithm is
shown in Eq. (5):
Gobs ¼ Gdir1G2dir1G3
dir1 � � �1Gndir (5)
where, n!1. The infinite series of Eq. (5) can be writ-
ten as the following closed form18:
Gobs ¼ GdirðI2GdirÞ21(6)
where, I is the identity matrix. From Eq. (5), the Gdir
can be calculated as:
Gdir ¼ GobsðI1GobsÞ-1
kobs ¼kdir
12kdir
kdir ¼kobs
11kobs
8>>>>>><>>>>>>:
(7)
where, kobs is the eigenvalue of the observed network,
and kdir the eigenvalue of the true network. From Eq.
(7), when the observed matrixGobs is given, the Gdir can
be reconstructed. After eigenvalue decomposition, rela-
tionship between kdir and kobs is also obtained (refer to
the Balanced Network Deconvolution section for details).
The transformation of eigenvalues is the core of the
transformation of matrices in ND.
Actually, to guarantee the infinite series of Eq. (5) con-
verge, the kdir must meet the condition that jkdirj < 1.
However, to meet this condition, all the eigenvalues of
the Gobs must have kobs > 20:5 [Fig. 1(a)], according to
kobs ¼ kdir
12kdirin Eq. (7) as illustrated in Figure 1(a), which
obviously cannot be satisfied in the real-world applica-
tions, because in actuality the eigenvalue of the Gobs can
be any value in the range of ð21;11Þ.To solve this problem, in the original ND model, a
tuning parameter was introduced to linearly scale the
kobs to cover more regions [Fig. 1(a)]:
kdir ¼akobs
11akobs
a � minð b
ð12bÞk1ðmaxÞobs
;2b
ð11bÞk2ðminÞobs
Þ
8>>><>>>:
(8)
where, k1ðmaxÞobs and k2ðminÞ
obs are the biggest positive and
the smallest negative eigenvalues of Gobs. The b parame-
ter is network dependent. Different values have been sug-
gested on different input networks in the ND approach.
For instance, on the protein contact map network, a rec-
ommended b value was 0.99, whereas 0.5 was suggested
on the gene regulator network and 0.95 was suggested
on the social network.
Balanced network deconvolution
Why the ND approach needs an additional parameter to
scale kobs? If we inspect the ND noise model [Eq. (5)] care-
fully, it is clear that it contains the even and odd powers of
the direct matrix. The odd powers will maintain the plus
or minus signs of the eigenvalues, whereas the even powers
will make all eigenvalues positive. This phenomenon will
make the eigenvalue distributions imbalanced. As we will
show later, if we remove the even powers in the infinite-
series, the eigenvalues of the rebuilt noise matrix will be
closer to the eigenvalues of observed matrix. In return, the
solved true network will be more precise. So, the noise
model of our proposed BND algorithm is as follows:
Gobs ¼ Gdir1G3dir1G5
dir1 � � �1G2n21dir (9)
where, n!1.The infinite series of Eq. (9) can be writ-
ten as the following closed form:
Gobs ¼ GdirðI2G2dirÞ
21(10)
By solving the quadratic equation of Eq. (10) for Gdir,
we get:
Gdir ¼ ð2I1
ffiffiffiffiffiffiffiffiffiffiffiffiffiffiffiffiffiI14G2
obs
qÞ � ð2GobsÞ21
(11)
Let U and Edir represent eigenvectors and a diagonal
matrix of eigenvalues of Gdir, where kidir is the i-th
Protein Residue Contact Map Prediction
PROTEINS 487
diagonal component of the matrix Edir. By using the
eigen decomposition principle, we get:
Gobs ¼ Gdir1Gindir
¼ðaÞ
Gdir1G3dir1G5
dir1 � � �1G2n21dir
¼ðbÞðUEdirU21Þ1ðUE3
dirU21Þ1ðUE5dirU21Þ
1 � � �1ðUE2n21dir U21Þ
¼ UðEdir1E3dir1E5
dir1 � � �1E2n21dir ÞU21
¼ U
Xn
i¼1
ðk1dirÞ
2i21 . . . 0
� . ..
�
0 � � �Xn
i¼1
ðkLdirÞ
2i21
0BBBBBBBBBB@
1CCCCCCCCCCA
U21
5ðcÞ
U
k1dir
12ðk1dirÞ
2. . . 0
� . ..
�
0 � � � kLdir
12ðkLdirÞ
2
0BBBBBBBBBB@
1CCCCCCCCCCA
U21
(12)
where, (a) is inferred from the definition of the diffusion
model of Eq. (9); (b) follows from the eigen decomposi-
tion of matrix Gdir; and (c) makes use of the character of
geometric series to compute the infinite summation on
the assumption of jkdirj < 1 similar to the assumption
proposed in ND.
Actually, from Eq. (11), if we use Gobs ¼ UEobsU21 to
represent the eigenvalue decomposition of Gobs, where
Eobs ¼
k1obs . . . 0
� . ..
�
0 � � � kLobs
0BBB@
1CCCA (13)
we get:
kiobs ¼
kidir
12ðkidirÞ
2; 81 � i � L (14)
and
kiobs � ðki
dirÞ21ki
dir2kiobs ¼ 0 (15)
When jkidirj < 1 for all i, we can derive any ki
obs 2 ð21;11Þ from Eq. (14) as illustrated in Figure 1(a). This
means that Eq. (14) can suit all the observed matrix Gobs
in the real-world applications. So, unlike the ND model,
the proposed BND model does not need an additional
tuning parameter to linearly scale kobs for meeting the
assumption of jkidirj < 1 anymore.
By solving the quadratic Eq. (15) for kidir, we will get
two possible solutions:
kidir ¼
211
ffiffiffiffiffiffiffiffiffiffiffiffiffiffiffiffiffiffiffiffiffiffi114ðki
obsÞ2
q
2kiobs
kidir ¼
212
ffiffiffiffiffiffiffiffiffiffiffiffiffiffiffiffiffiffiffiffiffiffi114ðki
obsÞ2
q
2kiobs
8>>>>>><>>>>>>:
(16)
As shown in Figure 1(b), the solution of kidir
¼ 211ffiffiffiffiffiffiffiffiffiffiffiffiffiffiffiffi114ðki
obsÞ2
p2ki
obs
satisfies the condition of
8kiobs 2 ð21;11Þ; jki
dirj < 1, which is finally used in
the BND model.
RESULTS
Comparison of ND and BND models
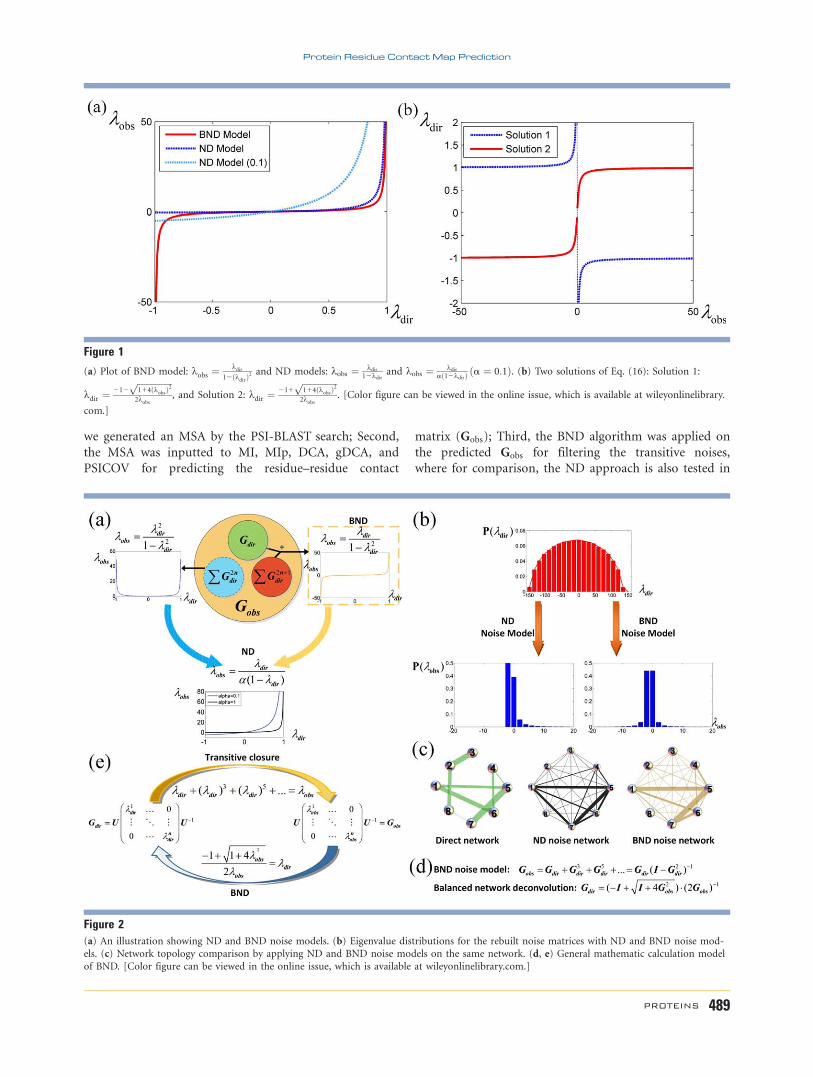
Figure 2(a) illustrates the difference between the ND and
BND noise models. To quantitatively examine both the dif-
ference and similarity of the noise models between ND and
the proposed BND, we did two intuitive experiments.
First, we constructed a 5000 3 5000 symmetric matrix
containing random values obeying a standard normal dis-
tribution, which is considered as Gdir. The distribution of
its eigenvalues obeys Wigner’s semicircle law.23 Then, the
eigenvalues of Gdir were used to rebuild the noise matrix
Gobs with the ND and BND noise models separately [Eq.
(5) and Eq. (9)]. The difference of eigenvalue distributions
of the rebuilt Gobs by the two models is obvious [Fig.
2(b)]: the BND noise model has maintained the balanced
eigenvalue distribution, whereas the ND noise model
made almost all kobs eigenvalues positive.
Second, we simulated an 8 3 8 symmetric matrix con-
taining pseudorandom weight values [see Fig. 2(c) and Sup-
porting Information for details), which is considered as
Gdir. New edges were added to the network by applying the
ND and BND noise models, respectively, generating new
network topologies. Two interesting results were observed:
the first was that the two new network topologies derived
from ND and BND are very comparable, indicating that the
odd powers can cover the information in the even powers;
and the second was that compared with the true topology,
the BND noise network can keep the strong edge weights
better, for example, edge between Nodes 5 and 7 [Fig. 2(c)].
Results of filtering noise from the predictedresidue contact maps
There are three steps of conducting the experiments of
removing the transitive noises contained in the residue
contacted map matrix. First, given a protein sequence,
H.-P. Sun et al.
488 PROTEINS
we generated an MSA by the PSI-BLAST search; Second,
the MSA was inputted to MI, MIp, DCA, gDCA, and
PSICOV for predicting the residue–residue contact
matrix (Gobs); Third, the BND algorithm was applied on
the predicted Gobs for filtering the transitive noises,
where for comparison, the ND approach is also tested in
Figure 2(a) An illustration showing ND and BND noise models. (b) Eigenvalue distributions for the rebuilt noise matrices with ND and BND noise mod-els. (c) Network topology comparison by applying ND and BND noise models on the same network. (d, e) General mathematic calculation model
of BND. [Color figure can be viewed in the online issue, which is available at wileyonlinelibrary.com.]
Figure 1
(a) Plot of BND model: kobs ¼kdir
12ðkdirÞ2 and ND models: kobs ¼ kdir
12kdirand kobs ¼ kdir
að12kdirÞ ða ¼ 0:1Þ. (b) Two solutions of Eq. (16): Solution 1:
kdir ¼212
ffiffiffiffiffiffiffiffiffiffiffiffiffiffiffiffi114ðkobsÞ
2p
2kobs, and Solution 2: kdir ¼
211ffiffiffiffiffiffiffiffiffiffiffiffiffiffiffiffi114ðkobsÞ
2p
2kobs. [Color figure can be viewed in the online issue, which is available at wileyonlinelibrary.
com.]
Protein Residue Contact Map Prediction
PROTEINS 489
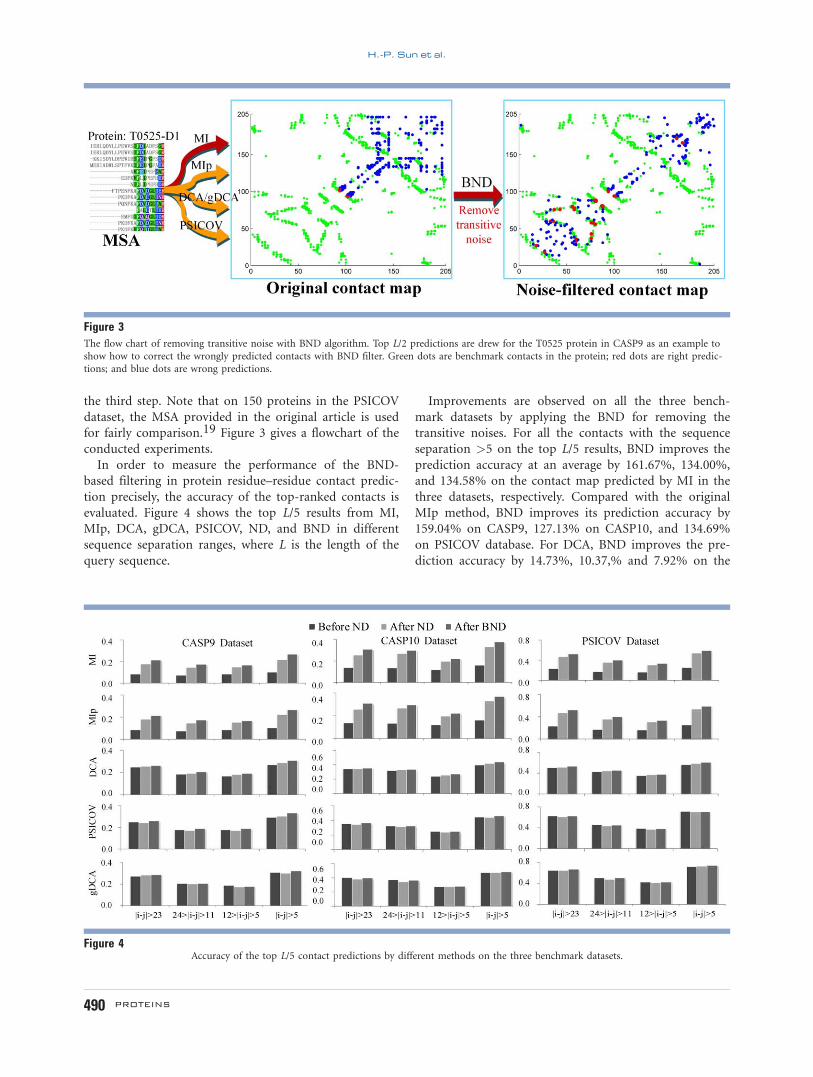
the third step. Note that on 150 proteins in the PSICOV
dataset, the MSA provided in the original article is used
for fairly comparison.19 Figure 3 gives a flowchart of the
conducted experiments.
In order to measure the performance of the BND-
based filtering in protein residue–residue contact predic-
tion precisely, the accuracy of the top-ranked contacts is
evaluated. Figure 4 shows the top L/5 results from MI,
MIp, DCA, gDCA, PSICOV, ND, and BND in different
sequence separation ranges, where L is the length of the
query sequence.
Improvements are observed on all the three bench-
mark datasets by applying the BND for removing the
transitive noises. For all the contacts with the sequence
separation >5 on the top L/5 results, BND improves the
prediction accuracy at an average by 161.67%, 134.00%,
and 134.58% on the contact map predicted by MI in the
three datasets, respectively. Compared with the original
MIp method, BND improves its prediction accuracy by
159.04% on CASP9, 127.13% on CASP10, and 134.69%
on PSICOV database. For DCA, BND improves the pre-
diction accuracy by 14.73%, 10.37,% and 7.92% on the
Figure 3The flow chart of removing transitive noise with BND algorithm. Top L/2 predictions are drew for the T0525 protein in CASP9 as an example to
show how to correct the wrongly predicted contacts with BND filter. Green dots are benchmark contacts in the protein; red dots are right predic-tions; and blue dots are wrong predictions.
Figure 4Accuracy of the top L/5 contact predictions by different methods on the three benchmark datasets.
H.-P. Sun et al.
490 PROTEINS
three datasets; and for its variant gDCA, BND improves
the prediction accuracy by 4.43%, 3.13%, and 2.86% on
the three datasets. For PSICOV, BND improves the accu-
racy by 13.01% and 3.69% on the two CASP datasets,
but the precision drops a little bit of 0.75% on PSICOV
dataset, which was originally applied in the PSICOV
article.19 However, BND outperforms ND with all the
evaluations on the PSICOV dataset. For instance, the
long-range contacts (residue separation distance larger
than 23) prediction accuracy on top L/5 is 60.69% when
applying the ND on the original PSICOV output,
whereas this number is 62.42% when applying BND on
PSICOV’s output (see Supporting Information for
details).
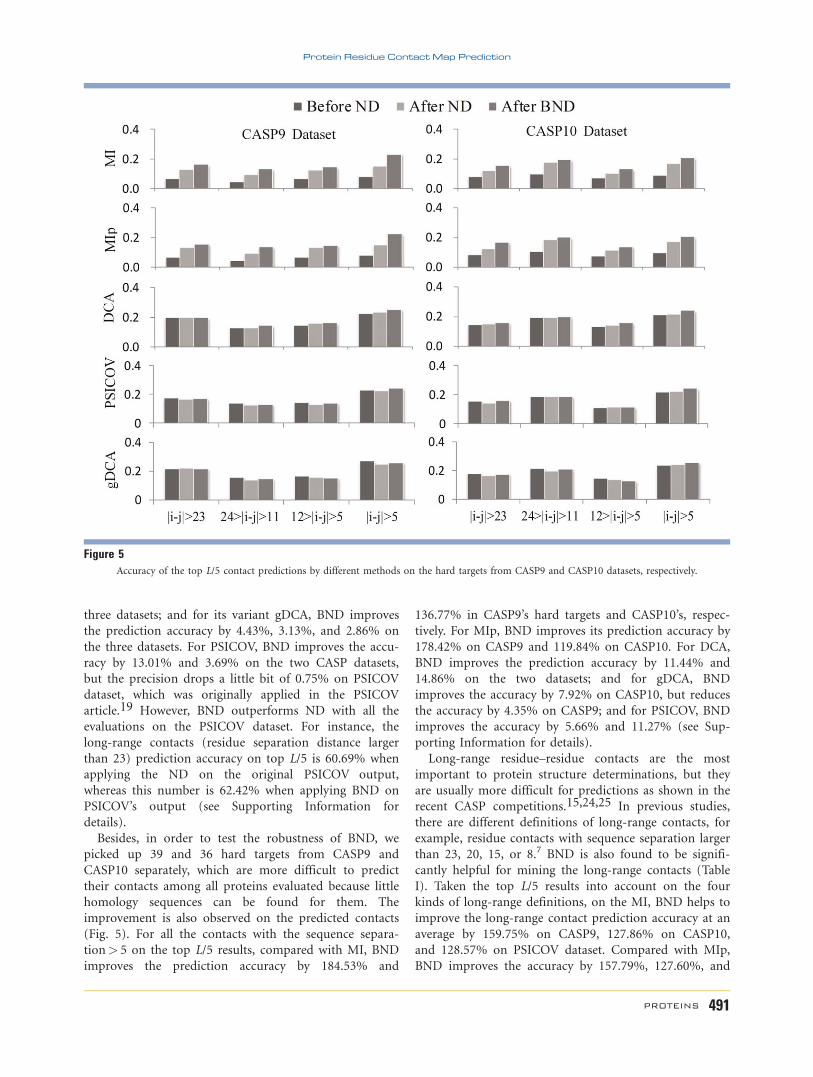
Besides, in order to test the robustness of BND, we
picked up 39 and 36 hard targets from CASP9 and
CASP10 separately, which are more difficult to predict
their contacts among all proteins evaluated because little
homology sequences can be found for them. The
improvement is also observed on the predicted contacts
(Fig. 5). For all the contacts with the sequence separa-
tion> 5 on the top L/5 results, compared with MI, BND
improves the prediction accuracy by 184.53% and
136.77% in CASP9’s hard targets and CASP10’s, respec-
tively. For MIp, BND improves its prediction accuracy by
178.42% on CASP9 and 119.84% on CASP10. For DCA,
BND improves the prediction accuracy by 11.44% and
14.86% on the two datasets; and for gDCA, BND
improves the accuracy by 7.92% on CASP10, but reduces
the accuracy by 4.35% on CASP9; and for PSICOV, BND
improves the accuracy by 5.66% and 11.27% (see Sup-
porting Information for details).
Long-range residue–residue contacts are the most
important to protein structure determinations, but they
are usually more difficult for predictions as shown in the
recent CASP competitions.15,24,25 In previous studies,
there are different definitions of long-range contacts, for
example, residue contacts with sequence separation larger
than 23, 20, 15, or 8.7 BND is also found to be signifi-
cantly helpful for mining the long-range contacts (Table
I). Taken the top L/5 results into account on the four
kinds of long-range definitions, on the MI, BND helps to
improve the long-range contact prediction accuracy at an
average by 159.75% on CASP9, 127.86% on CASP10,
and 128.57% on PSICOV dataset. Compared with MIp,
BND improves the accuracy by 157.79%, 127.60%, and
Figure 5Accuracy of the top L/5 contact predictions by different methods on the hard targets from CASP9 and CASP10 datasets, respectively.
Protein Residue Contact Map Prediction
PROTEINS 491

128.69% on the three datasets. For DCA, BND helps to
improve the accuracy by 7.45%, 4.31%, and 5.82%; for
gDCA, BND helps to improve the accuracy by 4.89%,
0.17%, and 2.28%; and for PSICOV, improvements of
6.58% on CASP9 and 1.76% on CASP10, but 0.41%
decrease compared with PSICOV on this dataset were
observed.
Not only for the top L/5 rankings, the enhancement
by BND is also found generally in top L/10, L/2, and L
rankings. Tables II, III, and IV show the long-range resi-
due–residue (residue contacts with sequence separation
larger than 23) contact prediction results of different
rankings on CASP9, CASP10, and PSICOV datasets,
respectively. In all the tables, we can find that BND out-
performs ND on all the experiments. Taking the CASP9
dataset for an example, with the same Gobs matrix gener-
ated by MI approach, where its accuracy for predicting
the top L/5 contacts with the sequence separation> 5 is
10.32%, BND will improve the accuracy to 26.99%,
whereas ND will only improve it to 21.95%.
In order to reveal the reason for the better perform-
ance of BND, we looked closely at the eigenvalue distri-
butions on the CASP9 dataset, where Figure 6(a) shows
the distribution of the real contact map Gdir. In the Gobs
of the predicted contact map by MI, its kobs 2 ½21:94;117:97� [Fig. 6(b)], which violates the required range of
ND (bigger than 20.5) as discussed in Eq. (7). So, ND
applied a parameter b 5 0.99 [a=0.256 as calculated
from Eq. (8) to adjust the kobs, which will be rescaled to
kNDobs 2 ½20:497; 30:20�. Then, according to Eq. (7), the
ND will infer the eigenvalues in the direct matrix as:
kNDdir 2 ½20:9870; 0:9679�. By contrast, BND does not
need a scaling parameter but uses Eq. (16) directly
to infer the eigenvalues of the direct matrix as: kBNDdir
2 ½20:7750; 0:9958� from kobs 2 ½21:94; 117:97�. BND
keeps the absolute value of minimum transformed
Table IThe improvements of four different long range contact definitions
achieved in the top L/5 predictions by applying BND on five predictionalgorithms.
Dataset Method |i-j|>23 |i-j|>20 |i-j|>15 |i-j|>8
CASP9 MI1BND 156.71% 160.92% 158.30% 162.63%MIp1BND 151.36% 162.53% 157.95% 158.99%DCA1BND 5.63% 5.84% 7.06% 10.95%PSICOV1BND 4.75% 4.96% 6.55% 9.58%gDCA1BND 5.06% 4.21% 5.11% 5.16%
CASP10 MI1BND 122.62% 110.59% 145.07% 133.89%MIp1BND 124.18% 113.50% 142.97% 130.52%DCA1BND 3.33% 4.44% 4.12% 5.18%PSICOV1BND 1.76% 0.91% 3.24% 1.15%gDCA1BND -1.11% 0.04% 0.22% 1.33%
PSICOV MI1BND 125.60% 128.86% 129.01% 130.53%MIp1BND 125.84% 129.13% 129.42% 130.13%DCA1BND 5.73% 5.76% 5.72% 6.04%PSICOV1BND -0.22% -0.69% -0.29% -0.42%gDCA1BND 2.60% 2.02% 1.67% 2.81%
Table IIILong-range residue contact (residue separation>23) prediction accura-
cies on CASP 10 dataset by applying the BND to filtering transitivenoises on five prediction algorithms.
Method Top L/10 Top L/5 Top L/2 Top L
MI 15.82% 13.82% 9.97% 7.71%MI1ND 30.63% 25.45% 18.89% 14.15%MI1BND 36.78% 30.77% 22.63% 16.69%MIp 15.82% 13.82% 10.02% 7.69%MIp1ND 30.81% 25.77% 19.24% 14.32%MIp1BND 36.53% 30.99% 22.88% 16.98%DCA 40.74% 34.48% 25.94% 19.13%DCA1ND 38.98% 34.24% 25.96% 18.79%DCA1BND 41.42% 35.62% 26.80% 19.51%PSICOV 41.45% 35.87% 26.72% 18.90%PSICOV1ND 39.89% 34.75% 24.81% 17.14%PSICOV1BND 41.55% 36.50% 25.99% 17.94%gDCA 45.22% 40.11% 30.36% 22.25%gDCA1ND 42.78% 38.26% 27.57% 19.16%gDCA1BND 45.13% 39.67% 29.35% 20.65%
Table IILong-range residue contact (residue separation>23) prediction accura-cies on CASP 9 dataset by applying the BND to filtering transitive
noises on five prediction algorithms.
Method Top L/10 Top L/5 Top L/2 Top L
MI 10.39% 8.41% 6.12% 5.16%MI1ND 21.60% 17.73% 12.95% 10.05%MI1BND 26.29% 21.58% 15.49% 11.86%MIp 10.39% 8.46% 6.16% 5.19%MIp1ND 21.60% 18.13% 13.19% 10.25%MIp1BND 26.29% 21.26% 15.81% 12.38%DCA 29.88% 24.93% 17.69% 12.71%DCA1ND 29.86% 25.59% 17.82% 13.24%DCA1BND 31.34% 26.34% 18.87% 14.00%PSICOV 31.94% 25.02% 17.53% 13.18%PSICOV1ND 31.57% 24.47% 16.35% 12.21%PSICOV1BND 33.70% 26.21% 17.38% 12.94%gDCA 34.29% 27.66% 20.71% 15.23%gDCA1ND 35.32% 28.57% 20.02% 14.89%gDCA1BND 35.87% 29.06% 20.10% 14.68%
Table IVLong-range residue contact (residue separation>23) prediction accura-
cies on PSICOV dataset by applying the BND to filter transitive noiseson five prediction algorithms.
Method Top L/10 Top L/5 Top L/2 Top L
MI 29.12% 23.15% 16.33% 12.42%MI1ND 55.04% 46.89% 33.58% 24.18%MI1BND 60.76% 52.23% 38.61% 27.99%MIp 29.12% 23.15% 16.33% 12.42%MIp1ND 55.15% 46.96% 33.86% 24.35%MIp1BND 60.20% 52.29% 38.73% 28.11%DCA 54.92% 50.55% 40.00% 29.18%DCA1ND 56.06% 51.42% 40.81% 29.58%DCA1BND 58.03% 53.44% 42.39% 30.72%PSICOV 71.77% 62.56% 44.74% 31.48%PSICOV1ND 70.53% 60.69% 42.10% 28.60%PSICOV1BND 71.22% 62.42% 44.05% 29.91%gDCA 72.86% 64.70% 50.61% 36.90%gDCA1ND 72.86% 64.31% 47.27% 32.24%gDCA1BND 73.62% 66.38% 50.39% 35.19%
H.-P. Sun et al.
492 PROTEINS
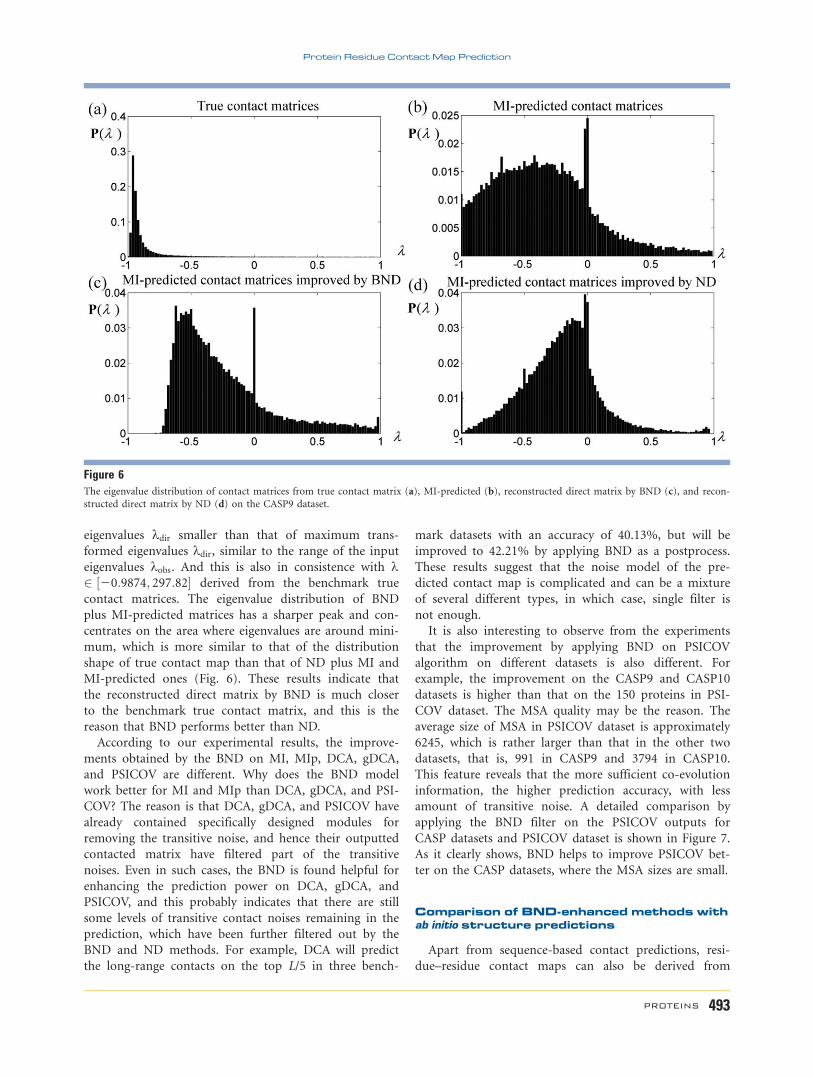
eigenvalues kdir smaller than that of maximum trans-
formed eigenvalues kdir, similar to the range of the input
eigenvalues kobs. And this is also in consistence with k2 ½20:9874; 297:82� derived from the benchmark true
contact matrices. The eigenvalue distribution of BND
plus MI-predicted matrices has a sharper peak and con-
centrates on the area where eigenvalues are around mini-
mum, which is more similar to that of the distribution
shape of true contact map than that of ND plus MI and
MI-predicted ones (Fig. 6). These results indicate that
the reconstructed direct matrix by BND is much closer
to the benchmark true contact matrix, and this is the
reason that BND performs better than ND.
According to our experimental results, the improve-
ments obtained by the BND on MI, MIp, DCA, gDCA,
and PSICOV are different. Why does the BND model
work better for MI and MIp than DCA, gDCA, and PSI-
COV? The reason is that DCA, gDCA, and PSICOV have
already contained specifically designed modules for
removing the transitive noise, and hence their outputted
contacted matrix have filtered part of the transitive
noises. Even in such cases, the BND is found helpful for
enhancing the prediction power on DCA, gDCA, and
PSICOV, and this probably indicates that there are still
some levels of transitive contact noises remaining in the
prediction, which have been further filtered out by the
BND and ND methods. For example, DCA will predict
the long-range contacts on the top L/5 in three bench-
mark datasets with an accuracy of 40.13%, but will be
improved to 42.21% by applying BND as a postprocess.
These results suggest that the noise model of the pre-
dicted contact map is complicated and can be a mixture
of several different types, in which case, single filter is
not enough.
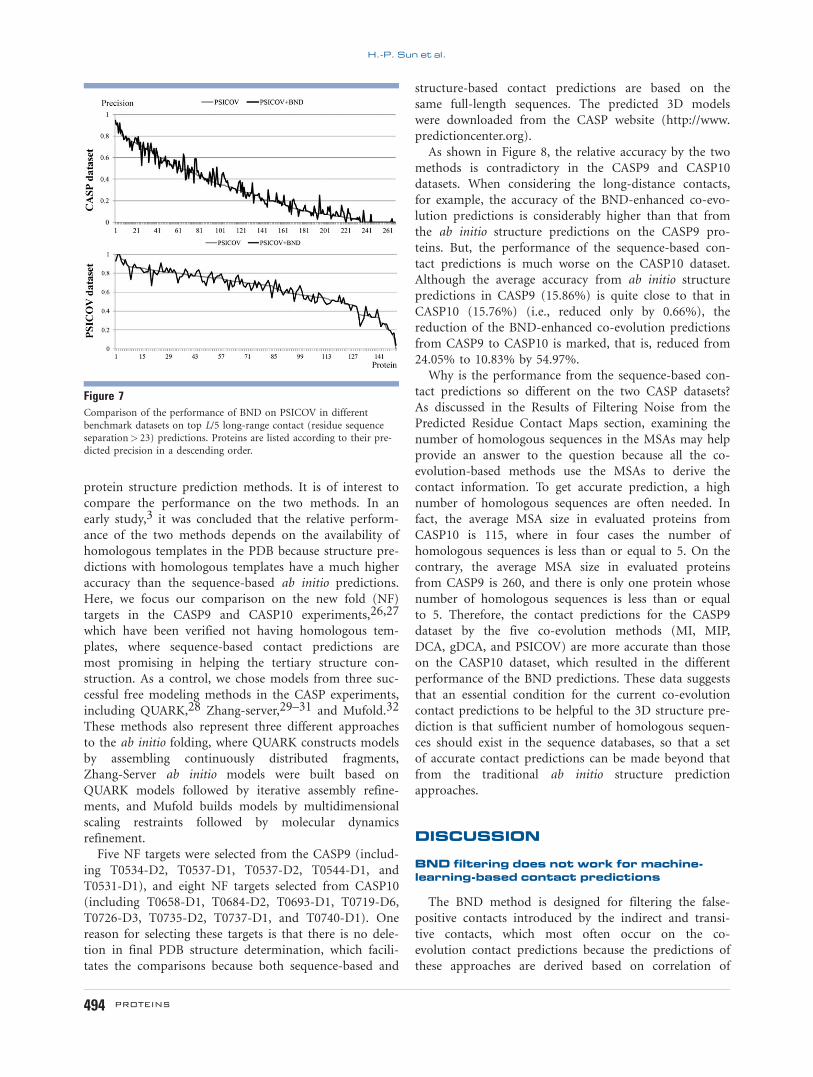
It is also interesting to observe from the experiments
that the improvement by applying BND on PSICOV
algorithm on different datasets is also different. For
example, the improvement on the CASP9 and CASP10
datasets is higher than that on the 150 proteins in PSI-
COV dataset. The MSA quality may be the reason. The
average size of MSA in PSICOV dataset is approximately
6245, which is rather larger than that in the other two
datasets, that is, 991 in CASP9 and 3794 in CASP10.
This feature reveals that the more sufficient co-evolution
information, the higher prediction accuracy, with less
amount of transitive noise. A detailed comparison by
applying the BND filter on the PSICOV outputs for
CASP datasets and PSICOV dataset is shown in Figure 7.
As it clearly shows, BND helps to improve PSICOV bet-
ter on the CASP datasets, where the MSA sizes are small.
Comparison of BND-enhanced methods withab initio structure predictions
Apart from sequence-based contact predictions, resi-
due–residue contact maps can also be derived from
Figure 6The eigenvalue distribution of contact matrices from true contact matrix (a), MI-predicted (b), reconstructed direct matrix by BND (c), and recon-
structed direct matrix by ND (d) on the CASP9 dataset.
Protein Residue Contact Map Prediction
PROTEINS 493
protein structure prediction methods. It is of interest to
compare the performance on the two methods. In an
early study,3 it was concluded that the relative perform-
ance of the two methods depends on the availability of
homologous templates in the PDB because structure pre-
dictions with homologous templates have a much higher
accuracy than the sequence-based ab initio predictions.
Here, we focus our comparison on the new fold (NF)
targets in the CASP9 and CASP10 experiments,26,27
which have been verified not having homologous tem-
plates, where sequence-based contact predictions are
most promising in helping the tertiary structure con-
struction. As a control, we chose models from three suc-
cessful free modeling methods in the CASP experiments,
including QUARK,28 Zhang-server,29–31 and Mufold.32
These methods also represent three different approaches
to the ab initio folding, where QUARK constructs models
by assembling continuously distributed fragments,
Zhang-Server ab initio models were built based on
QUARK models followed by iterative assembly refine-
ments, and Mufold builds models by multidimensional
scaling restraints followed by molecular dynamics
refinement.
Five NF targets were selected from the CASP9 (includ-
ing T0534-D2, T0537-D1, T0537-D2, T0544-D1, and
T0531-D1), and eight NF targets selected from CASP10
(including T0658-D1, T0684-D2, T0693-D1, T0719-D6,
T0726-D3, T0735-D2, T0737-D1, and T0740-D1). One
reason for selecting these targets is that there is no dele-
tion in final PDB structure determination, which facili-
tates the comparisons because both sequence-based and
structure-based contact predictions are based on the
same full-length sequences. The predicted 3D models
were downloaded from the CASP website (http://www.
predictioncenter.org).
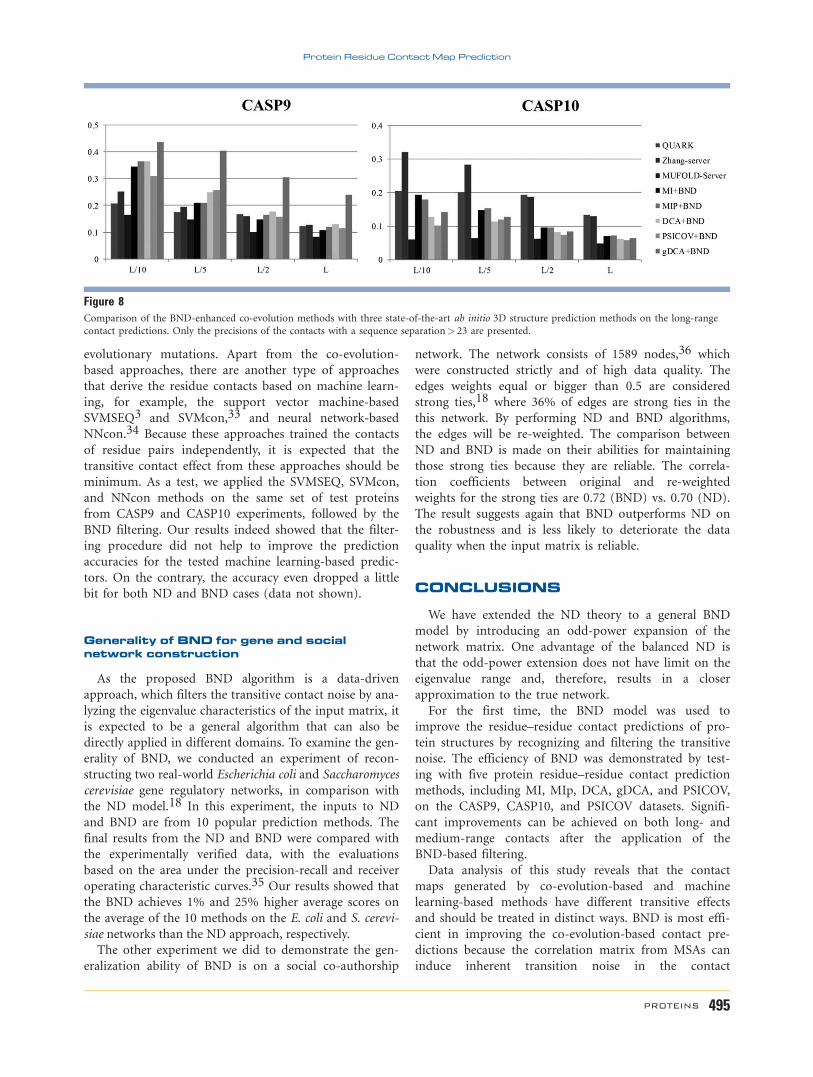
As shown in Figure 8, the relative accuracy by the two
methods is contradictory in the CASP9 and CASP10
datasets. When considering the long-distance contacts,
for example, the accuracy of the BND-enhanced co-evo-
lution predictions is considerably higher than that from
the ab initio structure predictions on the CASP9 pro-
teins. But, the performance of the sequence-based con-
tact predictions is much worse on the CASP10 dataset.
Although the average accuracy from ab initio structure
predictions in CASP9 (15.86%) is quite close to that in
CASP10 (15.76%) (i.e., reduced only by 0.66%), the
reduction of the BND-enhanced co-evolution predictions
from CASP9 to CASP10 is marked, that is, reduced from
24.05% to 10.83% by 54.97%.
Why is the performance from the sequence-based con-
tact predictions so different on the two CASP datasets?
As discussed in the Results of Filtering Noise from the
Predicted Residue Contact Maps section, examining the
number of homologous sequences in the MSAs may help
provide an answer to the question because all the co-
evolution-based methods use the MSAs to derive the
contact information. To get accurate prediction, a high
number of homologous sequences are often needed. In
fact, the average MSA size in evaluated proteins from
CASP10 is 115, where in four cases the number of
homologous sequences is less than or equal to 5. On the
contrary, the average MSA size in evaluated proteins
from CASP9 is 260, and there is only one protein whose
number of homologous sequences is less than or equal
to 5. Therefore, the contact predictions for the CASP9
dataset by the five co-evolution methods (MI, MIP,
DCA, gDCA, and PSICOV) are more accurate than those
on the CASP10 dataset, which resulted in the different
performance of the BND predictions. These data suggests
that an essential condition for the current co-evolution
contact predictions to be helpful to the 3D structure pre-
diction is that sufficient number of homologous sequen-
ces should exist in the sequence databases, so that a set
of accurate contact predictions can be made beyond that
from the traditional ab initio structure prediction
approaches.
DISCUSSION
BND filtering does not work for machine-learning-based contact predictions
The BND method is designed for filtering the false-
positive contacts introduced by the indirect and transi-
tive contacts, which most often occur on the co-
evolution contact predictions because the predictions of
these approaches are derived based on correlation of
Figure 7Comparison of the performance of BND on PSICOV in different
benchmark datasets on top L/5 long-range contact (residue sequenceseparation> 23) predictions. Proteins are listed according to their pre-
dicted precision in a descending order.
H.-P. Sun et al.
494 PROTEINS
evolutionary mutations. Apart from the co-evolution-
based approaches, there are another type of approaches
that derive the residue contacts based on machine learn-
ing, for example, the support vector machine-based
SVMSEQ3 and SVMcon,33 and neural network-based
NNcon.34 Because these approaches trained the contacts
of residue pairs independently, it is expected that the
transitive contact effect from these approaches should be
minimum. As a test, we applied the SVMSEQ, SVMcon,
and NNcon methods on the same set of test proteins
from CASP9 and CASP10 experiments, followed by the
BND filtering. Our results indeed showed that the filter-
ing procedure did not help to improve the prediction
accuracies for the tested machine learning-based predic-
tors. On the contrary, the accuracy even dropped a little
bit for both ND and BND cases (data not shown).
Generality of BND for gene and socialnetwork construction
As the proposed BND algorithm is a data-driven
approach, which filters the transitive contact noise by ana-
lyzing the eigenvalue characteristics of the input matrix, it
is expected to be a general algorithm that can also be
directly applied in different domains. To examine the gen-
erality of BND, we conducted an experiment of recon-
structing two real-world Escherichia coli and Saccharomyces
cerevisiae gene regulatory networks, in comparison with
the ND model.18 In this experiment, the inputs to ND
and BND are from 10 popular prediction methods. The
final results from the ND and BND were compared with
the experimentally verified data, with the evaluations
based on the area under the precision-recall and receiver
operating characteristic curves.35 Our results showed that
the BND achieves 1% and 25% higher average scores on
the average of the 10 methods on the E. coli and S. cerevi-
siae networks than the ND approach, respectively.
The other experiment we did to demonstrate the gen-
eralization ability of BND is on a social co-authorship
network. The network consists of 1589 nodes,36 which
were constructed strictly and of high data quality. The
edges weights equal or bigger than 0.5 are considered
strong ties,18 where 36% of edges are strong ties in the
this network. By performing ND and BND algorithms,
the edges will be re-weighted. The comparison between
ND and BND is made on their abilities for maintaining
those strong ties because they are reliable. The correla-
tion coefficients between original and re-weighted
weights for the strong ties are 0.72 (BND) vs. 0.70 (ND).
The result suggests again that BND outperforms ND on
the robustness and is less likely to deteriorate the data
quality when the input matrix is reliable.
CONCLUSIONS
We have extended the ND theory to a general BND
model by introducing an odd-power expansion of the
network matrix. One advantage of the balanced ND is
that the odd-power extension does not have limit on the
eigenvalue range and, therefore, results in a closer
approximation to the true network.
For the first time, the BND model was used to
improve the residue–residue contact predictions of pro-
tein structures by recognizing and filtering the transitive
noise. The efficiency of BND was demonstrated by test-
ing with five protein residue–residue contact prediction
methods, including MI, MIp, DCA, gDCA, and PSICOV,
on the CASP9, CASP10, and PSICOV datasets. Signifi-
cant improvements can be achieved on both long- and
medium-range contacts after the application of the
BND-based filtering.
Data analysis of this study reveals that the contact
maps generated by co-evolution-based and machine
learning-based methods have different transitive effects
and should be treated in distinct ways. BND is most effi-
cient in improving the co-evolution-based contact pre-
dictions because the correlation matrix from MSAs can
induce inherent transition noise in the contact
Figure 8Comparison of the BND-enhanced co-evolution methods with three state-of-the-art ab initio 3D structure prediction methods on the long-range
contact predictions. Only the precisions of the contacts with a sequence separation> 23 are presented.
Protein Residue Contact Map Prediction
PROTEINS 495
predictions. But, for the machine learning-based contact
predictions, because the pair-wise contacts were trained
independently, there are much less transitive
contaminations.
A further comparison was made on the sequence-
based contact prediction with the contact maps derived
from the ab initio folding simulations. The results
showed that the relative performance by the two
approaches is sensitive to the number of homologous
sequences available in the sequence databases, which, as
an essential factor, influences the usefulness of the
sequence-based contact predictions on the ab initio 3D
structure constructions.
Overall, the BND can be used as a general filtering
method to improve the accuracy of the co-evolution-
based contact prediction without additional central proc-
essing unit cost. The BND program is freely available at
http://www.csbio.sjtu.edu.cn/bioinf/BND/.
ACKNOWLEDGMENTS
The authors are grateful to Dr. Jeffrey Brender and Dr.
Richard Jang for reading the manuscript.
REFERENCES
1. Di Lena P, Fariselli P, Margara L, Vassura M, Casadio R. Fast over-
lapping of protein contact maps by alignment of eigenvectors. Bio-
informatics 2010;26:2250–2258.
2. Yang J, Jang R, Zhang Y, Shen HB. High-accuracy prediction of
transmembrane inter-helix contacts and application to GPCR 3D
structure modeling. Bioinformatics 2013;29:2579–2587.
3. Wu S, Zhang Y. A comprehensive assessment of sequence-based and
template-based methods for protein contact prediction. Bioinfor-
matics 2008;24:924–931.
4. Vassura M, Margara L, Di Lena P, Medri F, Fariselli P, Casadio R.
Reconstruction of 3D structures from protein contact maps. IEEE/
ACM Trans Comput Biol Bioinform 2008;5:357–367.
5. Nugent T, Jones DT. Predicting transmembrane helix packing
arrangements using residue contacts and a force-directed algorithm.
PLoS Comput Biol 2010;6:e1000714.
6. Taylor WR, Jones DT, Sadowski MI. Protein topology from pre-
dicted residue contacts. Protein Sci 2012;21:299–305.
7. Gromiha MM, Selvaraj S. Inter-residue interactions in protein fold-
ing and stability. Prog Biophys Mol Biol 2004;86:235–277.
8. Schlessinger A, Punta M, Rost B. Natively unstructured regions in
proteins identified from contact predictions. Bioinformatics 2007;
23:2376–2384.
9. Izarzugaza JM, Vazquez M, del Pozo A, Valencia A. wKinMut: an
integrated tool for the analysis and interpretation of mutations in
human protein kinases. BMC Bioinformatics 2013;14:345.
10. G€obel U, Sander C, Schneider R, Valencia A. Correlated mutations
and residue contacts in proteins. Proteins 1994;18:309–317.
11. Olmea O, Valencia A. Improving contact predictions by the combi-
nation of correlated mutations and other sources of sequence infor-
mation. Fold Des 1997;2:S25–S32.
12. de Juan D, Pazos F, Valencia A. Emerging methods in protein co-
evolution. Nat Rev Genet 2013;14:249–261.
13. Berenger F, Zhou Y, Shrestha R, Zhang KY. Entropy-accelerated
exact clustering of protein decoys. Bioinformatics 2011;27:939–945.
14. Berenger F, Shrestha R, Zhou Y, Simoncini D, Zhang KY. Durandal:
fast exact clustering of protein decoys. J Comput Chem 2012;33:
471–474.
15. Kajan L, Hopf TA, Kalas M, Marks DS, Rost B. FreeContact: fast
and free software for protein contact prediction from residue co-
evolution. BMC Bioinformatics 2014;15:85.
16. Chiu DK, Kolodziejczak T. Inferring consensus structure from
nucleic acid sequences. Comput Appl Biosci 1991;7:347–352.
17. Dunn SD, Wahl LM, Gloor GB. Mutual information without the
influence of phylogeny or entropy dramatically improves residue
contact prediction. Bioinformatics 2008;24:333–340.
18. Feizi S, Marbach D, Medard M, Kellis M. Network deconvolution as
a general method to distinguish direct dependencies in networks.
Nat Biotechnol 2013;31:726–733.
19. Jones DT, Buchan DW, Cozzetto D, Pontil M. PSICOV: precise
structural contact prediction using sparse inverse covariance estima-
tion on large multiple sequence alignments. Bioinformatics 2012;28:
184–190.
20. Morcos F, Pagnani A, Lunt B, Bertolino A, Marks DS, Sander C,
Zecchina R, Onuchic JN, Hwa T, Weigt M. Direct-coupling analysis
of residue coevolution captures native contacts across many protein
families. Proc Natl Acad Sci USA 2011;108:E1293–E1301.
21. Baldassi C, Zamparo M, Feinauer C, Procaccini A, Zecchina R,
Weigt M, Pagnani A. Fast and accurate multivariate Gaussian mod-
eling of protein families: predicting residue contacts and protein-
interaction partners. PloS One 2014;9:e92721.
22. Ezkurdia I, Grana O, Izarzugaza JM, Tress ML. Assessment of
domain boundary predictions and the prediction of intramolecular
contacts in CASP8. Proteins 2009;77(S9):196–209.
23. Wigner EP. Random matrices in physics. SIAM Rev 1967;9:1–23.
24. Monastyrskyy B, D’Andrea D, Fidelis K, Tramontano A,
Kryshtafovych A. Evaluation of residue-residue contact prediction in
CASP10. Proteins 2014;82(Suppl 2):138–153.
25. Karthikraja V, Suresh A, Lulu S, Kangueane U, Kangueane P. Types
of interfaces for homodimer folding and binding. Bioinformation
2009;4:101.
26. Kinch L, Yong Shi S, Cong Q, Cheng H, Liao Y, Grishin NV. CASP9
assessment of free modeling target predictions. Proteins 2011;
79(Suppl 10):59–73.
27. Tai CH, Bai H, Taylor TJ, Lee B. Assessment of template-free mod-
eling in CASP10 and ROLL. Proteins 2013;82(Suppl 2):57–83.
28. Xu D, Zhang Y. Ab initio protein structure assembly using continu-
ous structure fragments and optimized knowledge-based force field.
Proteins 2012;80:1715–1735.
29. , Zhang Y. ITASSER server for protein 3D structure prediction.
BMC Bioinformatics 2008;9:40.
30. Roy A, Kucukural A, Zhang Y. ITASSER: a unified platform for
automated protein structure and function prediction. Nat Protocols
2010;5:725–738.
31. Roy A, Yang J, Zhang Y. COFACTOR: an accurate comparative algo-
rithm for structure-based protein function annotation. Nucleic
Acids Res 2012;40(Web Server issue):W471–W477.
32. Zhang J, Wang Q, Barz B, He Z, Kosztin I, Shang Y, Xu D.
MUFOLD: a new solution for protein 3D structure prediction. Pro-
teins 2010;78:1137–1152.
33. Cheng J, Baldi P. Improved residue contact prediction using support
vector machines and a large feature set. BMC Bioinformatics 2007;
8:113.
34. Tegge AN, Wang Z, Eickholt J, Cheng J. NNcon: improved protein
contact map prediction using 2D-recursive neural networks. Nucleic
Acids Res 2009;37(Web Server issue):W515–W518.
35. Marbach D, Costello JC, K€uffner R, Vega NM, Prill RJ, Camacho
DM, Allison KR, Kellis M, Collins JJ, Stolovitzky G. Wisdom of
crowds for robust gene network inference. Nat Methods 2012;9:796–
804.
36. Newman ME. Scientific collaboration networks. II. Shortest paths,
weighted networks, and centrality. Phys Rev E 2001;64:016132.
H.-P. Sun et al.
496 PROTEINS
Related Documents