Improvement proposals for uncontrolled inventory Sebastian Coloka Markus Janetzky Final thesis 2020 Sustainable Supply Chain Management & Industrial Logistics and Management The advantages with connecting uncontrolled material to the enterprise resource planning system through reordering points.

Welcome message from author
This document is posted to help you gain knowledge. Please leave a comment to let me know what you think about it! Share it to your friends and learn new things together.
Transcript
Improvement proposals for uncontrolled inventory
Sebastian Coloka
Markus Janetzky
Final thesis 2020
Sustainable Supply Chain Management
&
Industrial Logistics and Management
The advantages with connecting uncontrolled material to the enterprise resource planning system through reordering points.
1
Acknowledgements
This bachelor thesis has been the final step in our programs within the area of industrial engineering at Jönköping University.
First, we would like to thank our supervisor and the employees of the inventory department at the case company for supporting and guiding us throughout the project. By working alongside with the case company several lessons have been learned. For instance, that theories cannot be applied without preparatory work and that even smaller units like inventory departments can have a major impact on an organization’s performance.
We would also like to thank the case company for trusting us with this task and providing us with the opportunity to perform this thesis.
Finally, we would like to thank Jönköping University for three years of rewarding studies.
Jönköping 2020-06-01
Sebastian Coloka Markus Janetzky
This thesis has been carried out at Tekniska Högskolan in Jönköping within inventory handling. The authors themselves are responsible for expressed opinions, conclusions, and results. Examiner: Leif-Magnus Jensen Supervisor: Peter Hugoson Scope: 15 ECTS Date: 2020-06-01
Summary
Objective - The objective of this research study is to develop improvement proposals for an ordering handling system of uncontrolled packaging materials. By analysing data from related products in combination with observations and interviews the following research questions were answered to reach the purpose of the study:
• How can reordering points and inventory handling of uncontrolled packaging materials be structured?
• What would be the advantage of implement and plan uncontrolled packaging materials in an ERP system?
Method - By studying a business phenomenon without firstly determine a theoretical background, the approach of this report has been through inductive research. By first observing the problem and connecting it to related theories the problem could be analysed and processed according to a theoretical approach.
Results - The findings of the study show that data of uncontrolled materials can be derived through the connection of relevant products by using a breakdown structure. By this approach data and forecasts of related products could be summarized and used as a calculation basis for a reordering point system. The advantages of implementing reordering points of uncontrolled materials into an ERP system resulted in a reduction of non-value adding activities, reduction of maximal inventory, reduced tied-up capital, and to a controlled ordering handling.
Implications - To further the study area of uncontrolled materials the researchers suggest that studies within other areas than packaging material is examined with a similar approach. Parts of the study, such as the combined demand and product-mapping, could be applied in projects with more complex structures to explore the limitations of the method. This would increase the knowledge base on how to structure and control materials that do not follow any system. Furthermore, the scope of the report has been to focus on high volume packaging materials and therefore it would be interesting to see the approach applied to low volume products or materials.
Restrictions - As data of this study is created by connection of related products it entails that similar circumstances exist if the project is to be replicated. Furthermore, the study is solely focused on the inventory department which could be a delimitation.
Charts and data illustrations – In the report charts and data are manipulated according to the confidentiality agreement with the case company. The provided examples illustrate the relation between different factors although does not reveal any true data derived from the case company.
Keywords: SPM - Standard packaging material ROP – Reordering point ERP – Enterprise research planning
Contents
1 Introduction ................................................................ 1
1.1 BACKGROUND .................................................................................................................... 1
1.2 PROBLEM DESCRIPTION..................................................................................................... 2
1.3 PURPOSE AND ISSUES ......................................................................................................... 3
1.4 SCOPE AND BOUNDARIES ................................................................................................... 3
1.5 OUTLINE ........................................................................................................................... 4
2 Method ....................................................................... 5
2.1 RESEARCH PURPOSE AND LINK BETWEEN QUESTIONS AND METHOD ................................... 5
2.2 RESEARCH STUDY .............................................................................................................. 5
2.3 RESEARCH APPROACH ........................................................................................................ 6
2.4 DATA COLLECTION ............................................................................................................. 7
2.4.1 Primary data .................................................................................................................... 7
2.4.1.1 Interviews .................................................................................................................. 7
2.4.1.2 Observation of storage ............................................................................................. 8
2.4.2 Secondary data ................................................................................................................ 8
2.4.2.1 ERP system ............................................................................................................... 8
2.5 LITERATURE RESEARCH ..................................................................................................... 8
2.6 VALIDITY ........................................................................................................................... 9
2.7 CREDIBILITY ...................................................................................................................... 9
3 Theoretical framework .............................................. 10
3.1 LINK BETWEEN QUESTIONS AND THEORY ......................................................................... 10
3.2 WAREHOUSING................................................................................................................. 11
3.3 REORDERING POINT SYSTEM ............................................................................................. 11
3.3.1 The Wilson formula with discount ........................................................................... 12
3.2.2 Safety stock .................................................................................................................... 13
3.2.2.1 Estimated safety stock ............................................................................................ 13
3.2.2.2 Proportionality method ......................................................................................... 13
3.2.2.3 Quantity method (safety stock during lead time) ................................................ 13
3.2.2.4 SERV1 ..................................................................................................................... 14
3.4 ABC ANALYSIS ................................................................................................................. 14
3.5 LEAN MANUFACTURING ................................................................................................... 14
3.5.1 Lean seven plus one waste ........................................................................................ 14
3.5.3 The Japanese sea ........................................................................................................... 16
3.5.4 Genchi Genbutsu ........................................................................................................... 16
3.5.5 Pareto’s principle........................................................................................................... 17
3.6 ERP SYSTEM .................................................................................................................... 17
3.6.1 Automation ................................................................................................................ 17
3.7 PRODUCT CONTENT ......................................................................................................... 17
3.7.1 Product structure ........................................................................................................... 17
3.7.2 Packaging materials ...................................................................................................... 18
3.7.3 Tied up capital ............................................................................................................... 18
4 Empirical data ........................................................... 19
4.1 CASE COMPANY ................................................................................................................ 19
4.2 CURRENT STATE ANALYSIS ............................................................................................... 19
4.3 COLLECTED AND PROCESSED DATA .................................................................................. 20
4.3.1 Identification of products ............................................................................................ 20
4.3.2 Differentiate standard and specific packaging materials .......................................... 20
4.3.3 Product structure of associated standard packaging materials ................................. 21
4.3.4 Creating forecast from the product structure .............................................................. 21
4.3.5 Categorizing forecast with ABC analysis ..................................................................... 22
4.3.6 Interviews and data collection ..................................................................................... 22
5 Calculations of processed data ................................. 23
5.1 EOQ FORMULA WITH DISCOUNT ...................................................................................... 23
5.2 SAFETY STOCK ................................................................................................................. 24
5.3 REORDERING POINT SYSTEM ............................................................................................ 24
5.4 COMPARISON BETWEEN CURRENT STATE AND CALCULATED RECOMMENDATIONS ............. 25
6 Analysis and discussion ............................................ 26
6.1 HOW CAN REORDERING POINTS AND INVENTORY HANDLING OF UNCONTROLLED PACKAGING
MATERIALS BE STRUCTURED? ....................................................................................................... 26
6.1.1 Links between products and packaging materials ....................................................... 26
6.1.2 Safety stock .................................................................................................................... 27
6.1.3 How often and in what quantity .................................................................................. 28
6.2 WHAT WOULD BE THE ADVANTAGE OF IMPLEMENT AND PLAN UNCONTROLLED PACKAGING
MATERIALS IN THE ERP SYSTEM? ................................................................................................ 29
6.2.1 Reduction and elimination of non-value adding activities ......................................... 29
6.3 FURTHER DEVELOPMENTS OF THE IMPROVEMENT PROPOSALS ........................................ 30
6.3.1 Scanners ........................................................................................................................ 30
6.3.2 SERV1 ........................................................................................................................... 30
7 Conclusion ................................................................ 32
7.1 RESULTS .......................................................................................................................... 32
7.2 THEORETICAL AND EMPIRICAL CONTRIBUTION ................................................................ 32
7.3 METHOD DISCUSSION ...................................................................................................... 33
7.4 IMPLICATIONS AND FURTHER RESEARCH ......................................................................... 33
8 References ................................................................ 34
Table of figures Figure 1 Scope. ................................................................................................................................. 3
Figure 2 Link between research questions and method. .............................................................. 5
Figure 3 Time frame. ...................................................................................................................... 6
Figure 4 Planned data collection. .................................................................................................. 8
Figure 5 Keywords. ......................................................................................................................... 8
Figure 6 Connection between theory and research questions. .................................................. 10
Figure 7 Reordering point. ........................................................................................................... 12
Figure 8 Japanese sea (Harrison, 1994). .................................................................................... 16
Figure 9 Product structure. .......................................................................................................... 17
Figure 10 Identification of products. .......................................................................................... 20
Figure 11 Product structure of associated standard packaging materials............................... 21
Figure 12 Creating forecast from the product structure. ........................................................... 21
Figure 13 Categorizing forecast with ABC analysis. .................................................................. 22
Figure 14 Data collection. ............................................................................................................. 22
Figure 15 EOQ calculations with comparison. ............................................................................ 23
Figure 16 Safety stock calculations. ............................................................................................. 24
Figure 17 Reordering point calculation. ...................................................................................... 24
Figure 18 Comparison between current state and improvement proposals. ........................... 25
Figure 19 Product structure with forecast .................................................................................. 26
Figure 20 Safety stock comparison ............................................................................................. 27
Figure 21 Reordering point system, type one. ........................................................................... 28
1
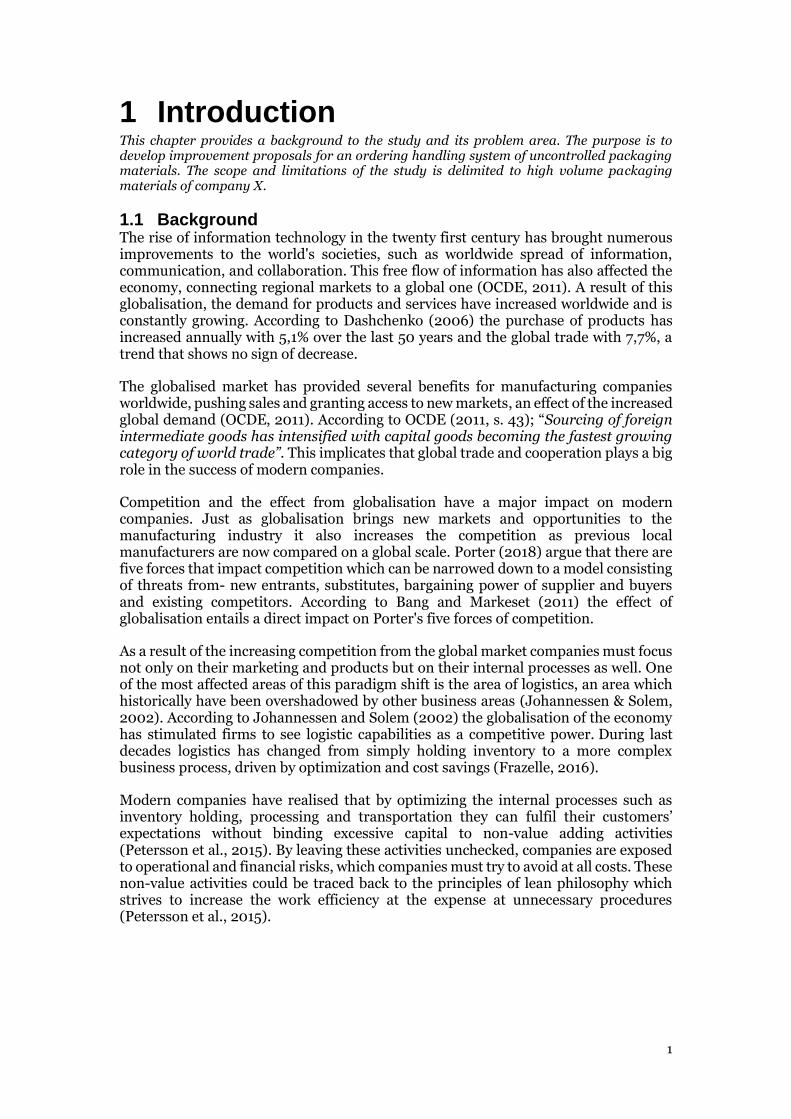
1 Introduction
This chapter provides a background to the study and its problem area. The purpose is to develop improvement proposals for an ordering handling system of uncontrolled packaging materials. The scope and limitations of the study is delimited to high volume packaging materials of company X.
1.1 Background The rise of information technology in the twenty first century has brought numerous improvements to the world's societies, such as worldwide spread of information, communication, and collaboration. This free flow of information has also affected the economy, connecting regional markets to a global one (OCDE, 2011). A result of this globalisation, the demand for products and services have increased worldwide and is constantly growing. According to Dashchenko (2006) the purchase of products has increased annually with 5,1% over the last 50 years and the global trade with 7,7%, a trend that shows no sign of decrease.
The globalised market has provided several benefits for manufacturing companies worldwide, pushing sales and granting access to new markets, an effect of the increased global demand (OCDE, 2011). According to OCDE (2011, s. 43); “Sourcing of foreign intermediate goods has intensified with capital goods becoming the fastest growing category of world trade”. This implicates that global trade and cooperation plays a big role in the success of modern companies.
Competition and the effect from globalisation have a major impact on modern companies. Just as globalisation brings new markets and opportunities to the manufacturing industry it also increases the competition as previous local manufacturers are now compared on a global scale. Porter (2018) argue that there are five forces that impact competition which can be narrowed down to a model consisting of threats from- new entrants, substitutes, bargaining power of supplier and buyers and existing competitors. According to Bang and Markeset (2011) the effect of globalisation entails a direct impact on Porter's five forces of competition.
As a result of the increasing competition from the global market companies must focus not only on their marketing and products but on their internal processes as well. One of the most affected areas of this paradigm shift is the area of logistics, an area which historically have been overshadowed by other business areas (Johannessen & Solem, 2002). According to Johannessen and Solem (2002) the globalisation of the economy has stimulated firms to see logistic capabilities as a competitive power. During last decades logistics has changed from simply holding inventory to a more complex business process, driven by optimization and cost savings (Frazelle, 2016).
Modern companies have realised that by optimizing the internal processes such as inventory holding, processing and transportation they can fulfil their customers’ expectations without binding excessive capital to non-value adding activities (Petersson et al., 2015). By leaving these activities unchecked, companies are exposed to operational and financial risks, which companies must try to avoid at all costs. These non-value activities could be traced back to the principles of lean philosophy which strives to increase the work efficiency at the expense at unnecessary procedures (Petersson et al., 2015).
2
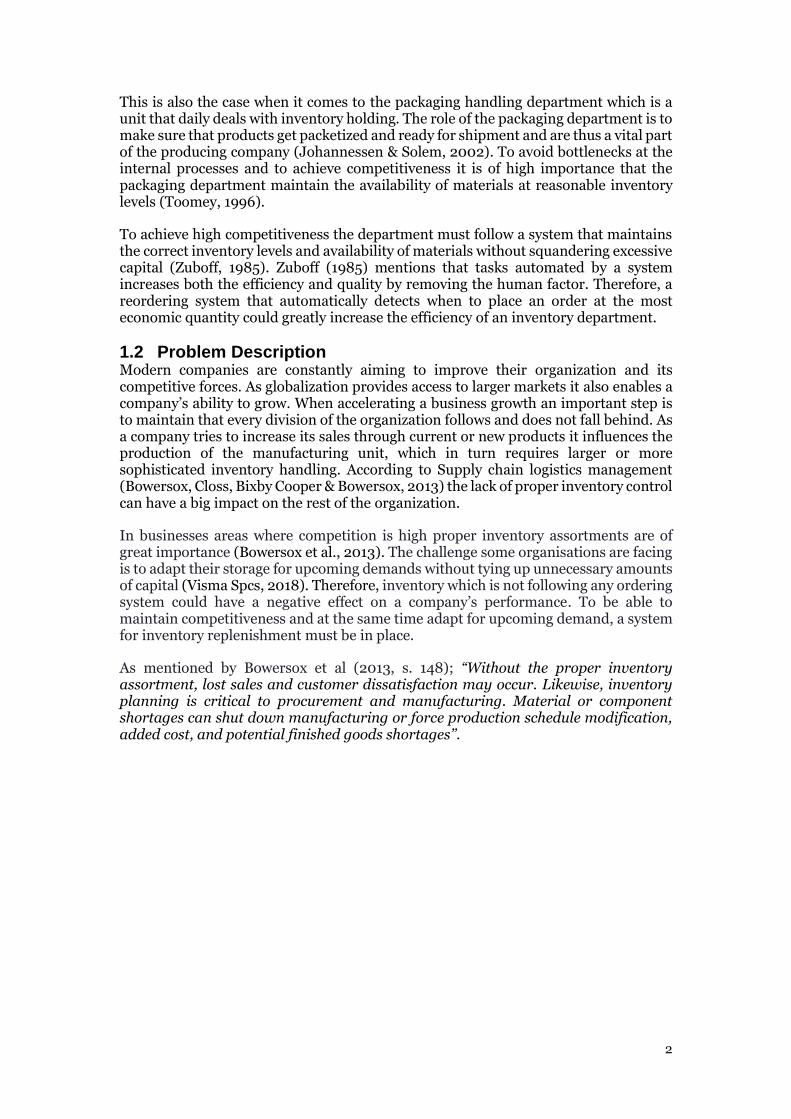
This is also the case when it comes to the packaging handling department which is a unit that daily deals with inventory holding. The role of the packaging department is to make sure that products get packetized and ready for shipment and are thus a vital part of the producing company (Johannessen & Solem, 2002). To avoid bottlenecks at the internal processes and to achieve competitiveness it is of high importance that the packaging department maintain the availability of materials at reasonable inventory levels (Toomey, 1996).
To achieve high competitiveness the department must follow a system that maintains the correct inventory levels and availability of materials without squandering excessive capital (Zuboff, 1985). Zuboff (1985) mentions that tasks automated by a system increases both the efficiency and quality by removing the human factor. Therefore, a reordering system that automatically detects when to place an order at the most economic quantity could greatly increase the efficiency of an inventory department.
1.2 Problem Description Modern companies are constantly aiming to improve their organization and its competitive forces. As globalization provides access to larger markets it also enables a company’s ability to grow. When accelerating a business growth an important step is to maintain that every division of the organization follows and does not fall behind. As a company tries to increase its sales through current or new products it influences the production of the manufacturing unit, which in turn requires larger or more sophisticated inventory handling. According to Supply chain logistics management (Bowersox, Closs, Bixby Cooper & Bowersox, 2013) the lack of proper inventory control can have a big impact on the rest of the organization.
In businesses areas where competition is high proper inventory assortments are of great importance (Bowersox et al., 2013). The challenge some organisations are facing is to adapt their storage for upcoming demands without tying up unnecessary amounts of capital (Visma Spcs, 2018). Therefore, inventory which is not following any ordering system could have a negative effect on a company’s performance. To be able to maintain competitiveness and at the same time adapt for upcoming demand, a system for inventory replenishment must be in place.
As mentioned by Bowersox et al (2013, s. 148); “Without the proper inventory assortment, lost sales and customer dissatisfaction may occur. Likewise, inventory planning is critical to procurement and manufacturing. Material or component shortages can shut down manufacturing or force production schedule modification, added cost, and potential finished goods shortages’’.
3
1.3 Purpose and issues The purpose of this study:
To develop improvement proposals for an ordering handling system of uncontrolled packaging materials.
The purpose will be investigated by analysing historical data from related products and developing a decision basis for further improvements. This will be achieved by answering the following research questions:
• How can reordering points and inventory handling of uncontrolled packaging materials be structured?
• What would be the advantage of implement and plan uncontrolled packaging materials in an ERP system?
To answer the questions, and thus fulfil the purpose, a case study will be carried out at company X.
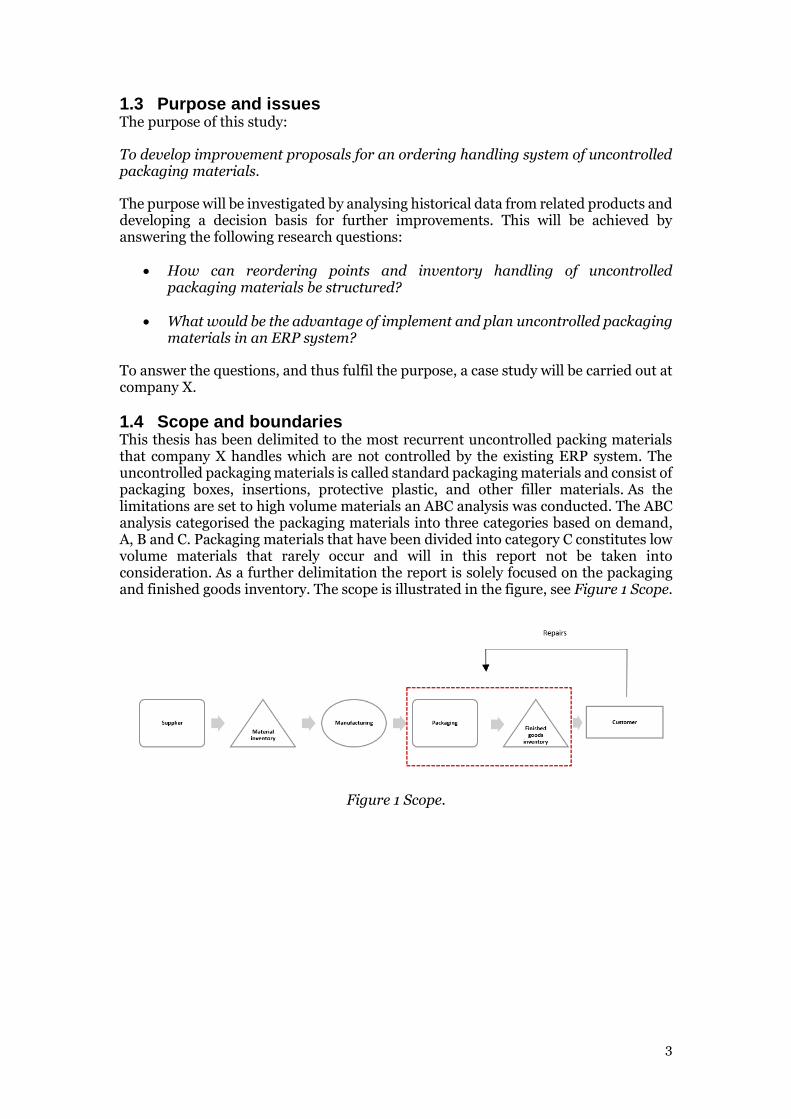
1.4 Scope and boundaries This thesis has been delimited to the most recurrent uncontrolled packing materials that company X handles which are not controlled by the existing ERP system. The uncontrolled packaging materials is called standard packaging materials and consist of packaging boxes, insertions, protective plastic, and other filler materials. As the limitations are set to high volume materials an ABC analysis was conducted. The ABC analysis categorised the packaging materials into three categories based on demand, A, B and C. Packaging materials that have been divided into category C constitutes low volume materials that rarely occur and will in this report not be taken into consideration. As a further delimitation the report is solely focused on the packaging and finished goods inventory. The scope is illustrated in the figure, see Figure 1 Scope.
Figure 1 Scope.
4
1.5 Outline This thesis takes its start with an introduction of global manufacturing companies and the high level of competitiveness that permeates the industry, with a focus on logistics and packaging handling. Following the introduction there is information of what specific logistical and packaging handling problem this report focuses on. The problem area is described generally with connection to a case company that is facing a logistical problem in their packaging department. Further on the scope and boundaries are presented to specify the problem area.
The second chapter introduce the research approach that has been carried out. The approach contains the connection between the research questions, purpose, and method. Chosen method consist of interviews and observation with several stakeholders within and without the case company. Chapter two ends with an evaluation regarding the validity and credibility of the thesis.
The third chapter consist of the theoretical framework that has been used throughout the report. Theories and methods in the framework have been used as a basis for calculations and different approaches.
The fourth chapter present the empirical data which have been collected through interviews and observations mentioned in chapter two. Secondary data is also presented in the chapter and have been the basis for the collection and calculations of primary data.
The fifth chapter presents the calculations of a reordering point system, as well as a comparison between the current state and the improvement proposals.
The sixth chapter consist of a discussion and analysis which aims to answer the study’s research questions by comparing the empirical data with the theoretical framework. The chapter ends with suggestions for further improvements.
In the last and final chapter, there is a conclusion presented containing the result of the study, theoretical and empirical contribution, method discussion as well as implications and further research.
5
2 Method This chapter provides an overview of the study's work process. Furthermore, the study's data collection and data analysis are described. The chapter concludes with a discussion about the study's validity and credibility.
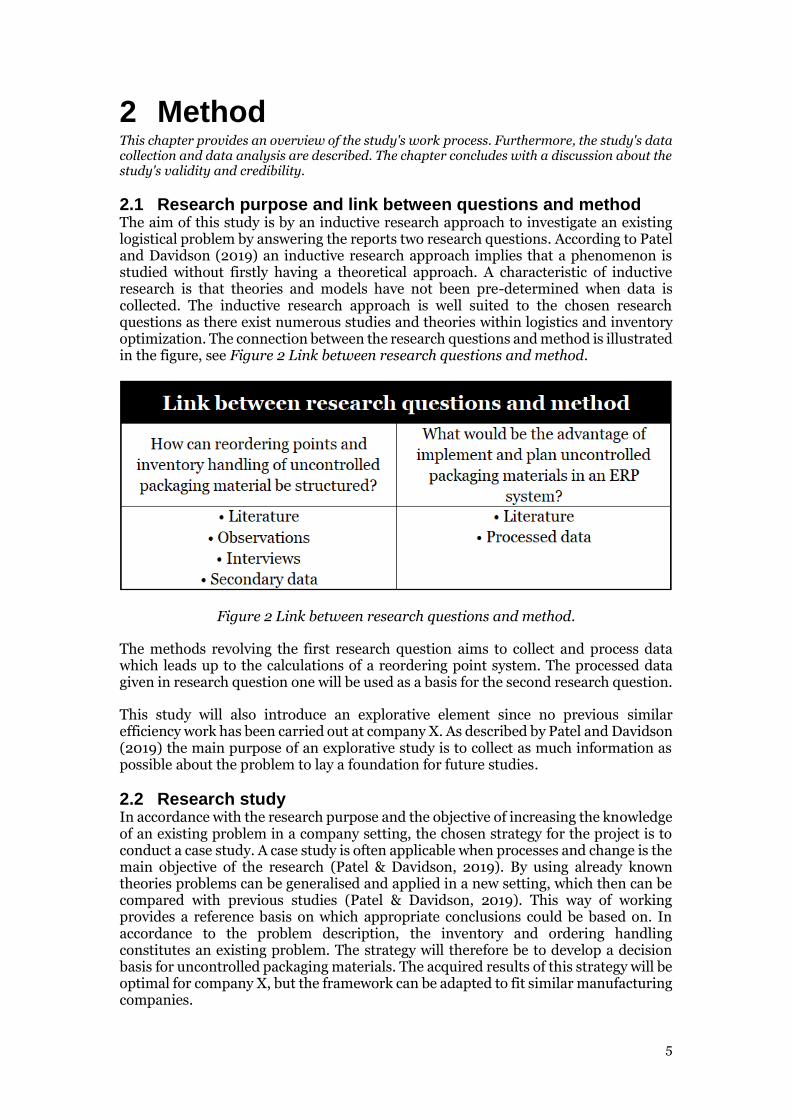
2.1 Research purpose and link between questions and method The aim of this study is by an inductive research approach to investigate an existing logistical problem by answering the reports two research questions. According to Patel and Davidson (2019) an inductive research approach implies that a phenomenon is studied without firstly having a theoretical approach. A characteristic of inductive research is that theories and models have not been pre-determined when data is collected. The inductive research approach is well suited to the chosen research questions as there exist numerous studies and theories within logistics and inventory optimization. The connection between the research questions and method is illustrated in the figure, see Figure 2 Link between research questions and method.
Figure 2 Link between research questions and method.
The methods revolving the first research question aims to collect and process data which leads up to the calculations of a reordering point system. The processed data given in research question one will be used as a basis for the second research question.
This study will also introduce an explorative element since no previous similar efficiency work has been carried out at company X. As described by Patel and Davidson (2019) the main purpose of an explorative study is to collect as much information as possible about the problem to lay a foundation for future studies.
2.2 Research study In accordance with the research purpose and the objective of increasing the knowledge of an existing problem in a company setting, the chosen strategy for the project is to conduct a case study. A case study is often applicable when processes and change is the main objective of the research (Patel & Davidson, 2019). By using already known theories problems can be generalised and applied in a new setting, which then can be compared with previous studies (Patel & Davidson, 2019). This way of working provides a reference basis on which appropriate conclusions could be based on. In accordance to the problem description, the inventory and ordering handling constitutes an existing problem. The strategy will therefore be to develop a decision basis for uncontrolled packaging materials. The acquired results of this strategy will be optimal for company X, but the framework can be adapted to fit similar manufacturing companies.
6
2.3 Research approach In line with the research purpose the study will consist of both quantitative and qualitative elements. This way of working enables the use of data driven statistics which in combination with interviews and observations result in a holistic approach (Bell & Waters, 2014). The quantitative data will be collected from the case company’s ERP system, focusing on sales, returns and forecasts. The qualitative data will be collected by using observations and interviews of stakeholders within and without the case company. To be able to reach the purpose of developing logistical improvements for uncontrolled packaging materials, several steps will be taken to ensure that the project have a holistic view.
The first step of the project will be to identify all products the packaging department handles. By analysing sales data provided by the case company’s ERP system in combination with interviews of relevant stakeholders an overview of products can be created. Following the identification of products, a current state analysis will be conducted to determine what packaging materials that are being used. To limit the packaging materials to the scope of the report and enable calculations, the materials will be categorized in specific and uncontrolled packaging materials. Specific packaging materials refers to material bound to a designated product which is already controlled by the ERP system and are thus not of interest for this study. When products and uncontrolled packaging materials have been identified the next step will be to connect them into a product structure, showing what products uses which uncontrolled packaging material. By using forecasts of the connected products an estimated demand for uncontrolled packaging materials can be derived. As the scope of the study is to specifically focus on the high-volume materials their forecasts in combination with ABC analysis will be used to categorize them according to estimated demand.
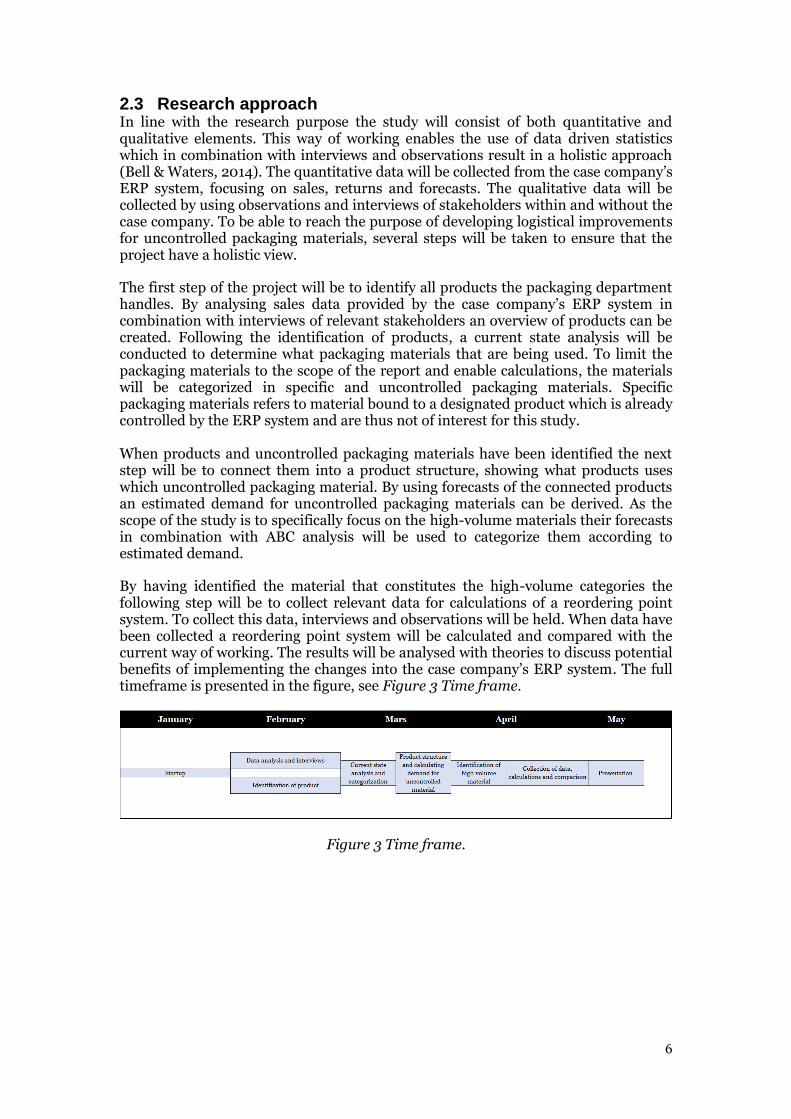
By having identified the material that constitutes the high-volume categories the following step will be to collect relevant data for calculations of a reordering point system. To collect this data, interviews and observations will be held. When data have been collected a reordering point system will be calculated and compared with the current way of working. The results will be analysed with theories to discuss potential benefits of implementing the changes into the case company’s ERP system. The full timeframe is presented in the figure, see Figure 3 Time frame.
Figure 3 Time frame.
7
2.4 Data collection The collected data will consist of both primary and secondary data. Primary data is according to Patel and Davidson (2019) data that have been collected on a first-hand basis. This means that the data is generated by conducting own research, the data can thus not be provided by someone or something else. In contrast to primary data, secondary data relies on data generated by other sources of which the researcher are in no control off. For example, secondary data can be forecasts and sales history generated by a company's ERP system.
2.4.1 Primary data
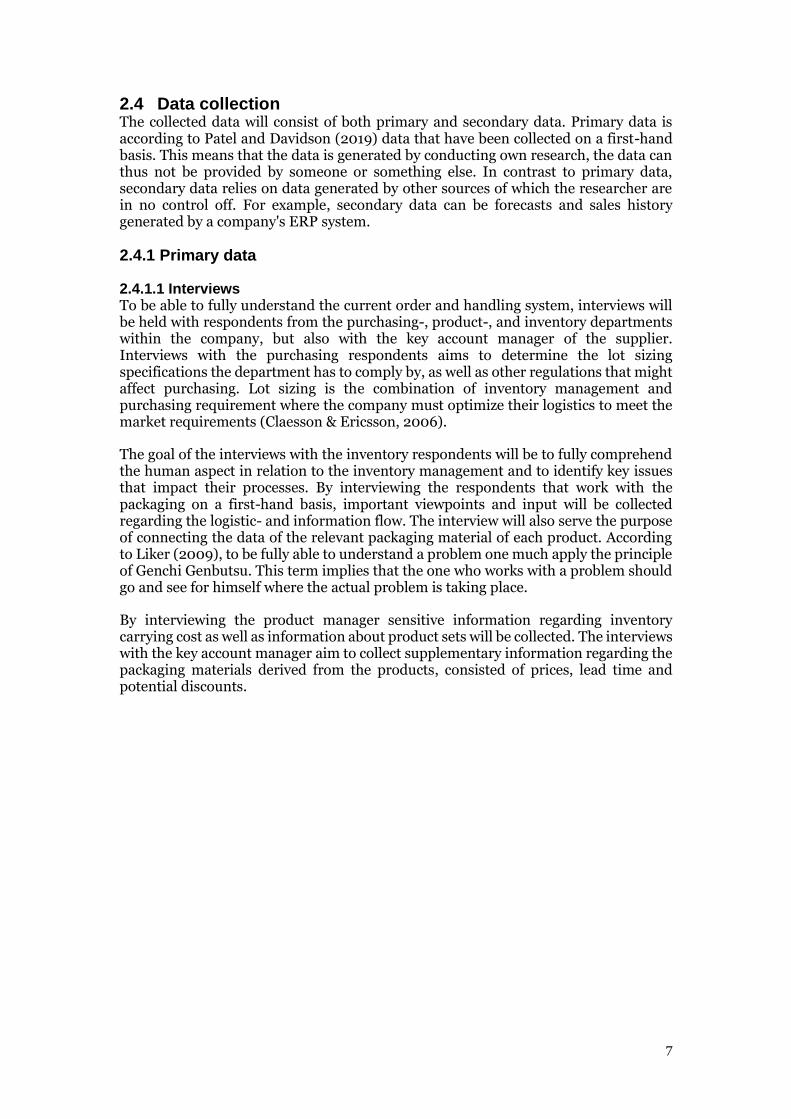
2.4.1.1 Interviews To be able to fully understand the current order and handling system, interviews will be held with respondents from the purchasing-, product-, and inventory departments within the company, but also with the key account manager of the supplier. Interviews with the purchasing respondents aims to determine the lot sizing specifications the department has to comply by, as well as other regulations that might affect purchasing. Lot sizing is the combination of inventory management and purchasing requirement where the company must optimize their logistics to meet the market requirements (Claesson & Ericsson, 2006).
The goal of the interviews with the inventory respondents will be to fully comprehend the human aspect in relation to the inventory management and to identify key issues that impact their processes. By interviewing the respondents that work with the packaging on a first-hand basis, important viewpoints and input will be collected regarding the logistic- and information flow. The interview will also serve the purpose of connecting the data of the relevant packaging material of each product. According to Liker (2009), to be fully able to understand a problem one much apply the principle of Genchi Genbutsu. This term implies that the one who works with a problem should go and see for himself where the actual problem is taking place.
By interviewing the product manager sensitive information regarding inventory carrying cost as well as information about product sets will be collected. The interviews with the key account manager aim to collect supplementary information regarding the packaging materials derived from the products, consisted of prices, lead time and potential discounts.
8
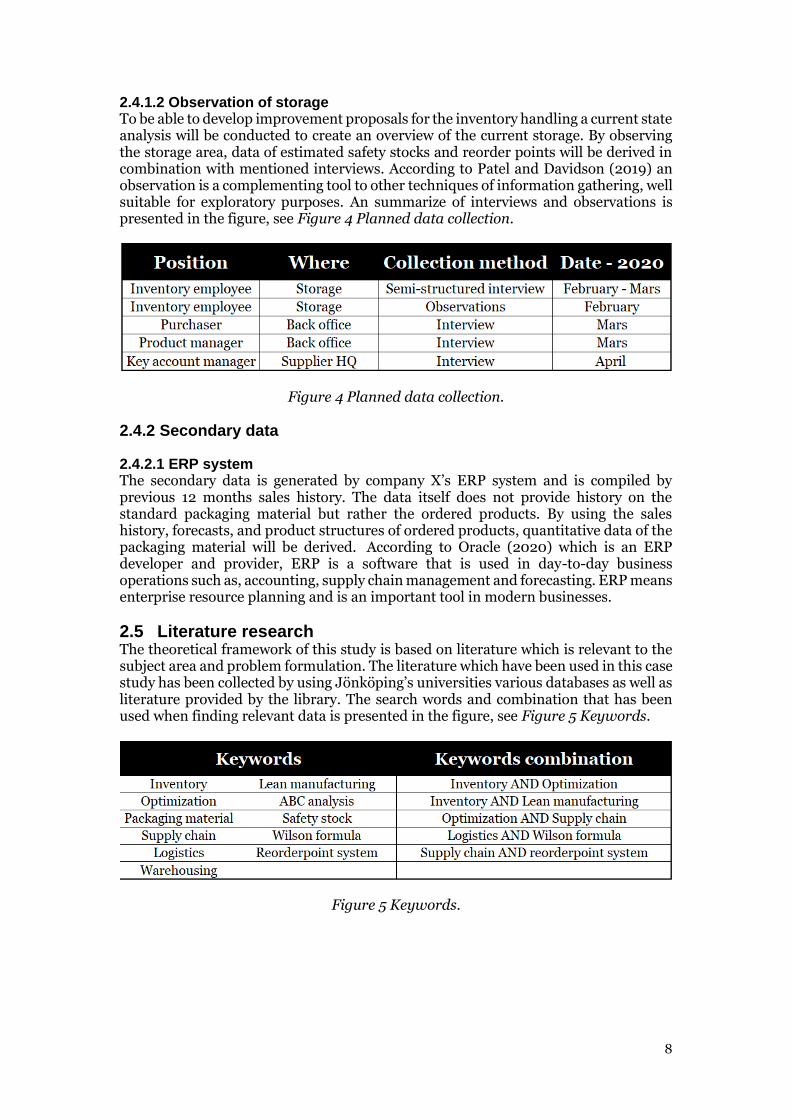
2.4.1.2 Observation of storage To be able to develop improvement proposals for the inventory handling a current state analysis will be conducted to create an overview of the current storage. By observing the storage area, data of estimated safety stocks and reorder points will be derived in combination with mentioned interviews. According to Patel and Davidson (2019) an observation is a complementing tool to other techniques of information gathering, well suitable for exploratory purposes. An summarize of interviews and observations is presented in the figure, see Figure 4 Planned data collection.
Figure 4 Planned data collection.
2.4.2 Secondary data
2.4.2.1 ERP system The secondary data is generated by company X’s ERP system and is compiled by previous 12 months sales history. The data itself does not provide history on the standard packaging material but rather the ordered products. By using the sales history, forecasts, and product structures of ordered products, quantitative data of the packaging material will be derived. According to Oracle (2020) which is an ERP developer and provider, ERP is a software that is used in day-to-day business operations such as, accounting, supply chain management and forecasting. ERP means enterprise resource planning and is an important tool in modern businesses.
2.5 Literature research The theoretical framework of this study is based on literature which is relevant to the subject area and problem formulation. The literature which have been used in this case study has been collected by using Jönköping’s universities various databases as well as literature provided by the library. The search words and combination that has been used when finding relevant data is presented in the figure, see Figure 5 Keywords.
Figure 5 Keywords.
9
2.6 Validity The level of validity is based on the projects ability to measure and present data that are relevant to the research strategy and approach. The validity of the primary data which includes the interviews and observations, will be strengthened by thorough planning within the subject area. The interview questions and observations points will be pre-determined and evaluated against a theoretical background (Patel & Davidson, 2019). To maintain high validity of primary data interviews will be conducted with stakeholders with an in-depth knowledge of their area.
The secondary data which is provided by the case company’s ERP system is based on previous sales history, forecasts, and repairs, which have a high validity as it is generated by the investigated company. The data also have a high traceability both internally and externally since the company use the Seiban system to track its products. Seiban which means “manufacturing number” in Japanese is a way for a company to track materials, products, and purchase orders by giving them a specific number (Clarity visual management, 2020).
2.7 Credibility According to Patel and Davidson (2019) credibility describes how well the data collection withstands elements of chance which might affect the data. Therefore, the choice of data collection constitutes an important part of the report.
The credibility of this thesis can be measured through the data collection and choice of approaches. To strengthen the credibility of the theoretical background of the study triangulation methods have been applied, meaning that different sources have been compared to ensure that the information at hand have a wide scientific consensus (Patel & Davidson, 2019). Observations were held in groups of three people, one employee and two observers. During interviews, the respondent was answering questions given by the interviewer whilst the other researcher took notes. According to Patel and Davidson (2019), a way to increase the credibility is to be more than one investigator present at both observations and interviews, this was applied at every occasion.
The second-hand data this report was based on were raw data extracted directly from the ERP system without going through a middleman. This ensured that the data was not intentionally manipulated by someone at the case company. There might still exist an error margin in the generation of the data, as technical errors are uncommon but still a possibility.
10
3 Theoretical framework This chapter provides a theoretical foundation and explanatory approach to the study. The facts and theories introduced in this chapter are central to inventory handling and logistics which aim is to act like a basis as the project progress.
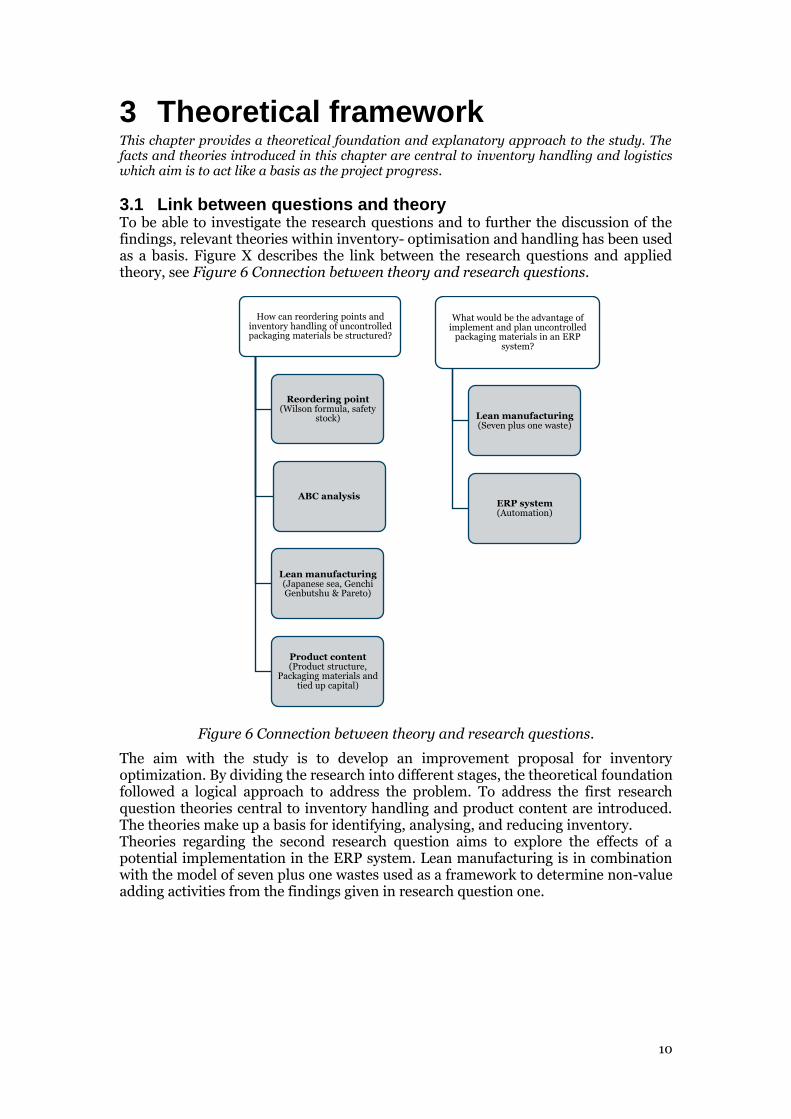
3.1 Link between questions and theory To be able to investigate the research questions and to further the discussion of the findings, relevant theories within inventory- optimisation and handling has been used as a basis. Figure X describes the link between the research questions and applied theory, see Figure 6 Connection between theory and research questions.
Figure 6 Connection between theory and research questions.
The aim with the study is to develop an improvement proposal for inventory optimization. By dividing the research into different stages, the theoretical foundation followed a logical approach to address the problem. To address the first research question theories central to inventory handling and product content are introduced. The theories make up a basis for identifying, analysing, and reducing inventory. Theories regarding the second research question aims to explore the effects of a potential implementation in the ERP system. Lean manufacturing is in combination with the model of seven plus one wastes used as a framework to determine non-value adding activities from the findings given in research question one.
How can reordering points and inventory handling of uncontrolled packaging materials be structured?
Reordering point (Wilson formula, safety
stock)
ABC analysis
Lean manufacturing (Japanese sea, Genchi Genbutshu & Pareto)
Product content (Product structure,
Packaging materials and tied up capital)
What would be the advantage of implement and plan uncontrolled
packaging materials in an ERP system?
Lean manufacturing(Seven plus one waste)
ERP system(Automation)
11
3.2 Warehousing Warehousing is a central function within logistics that traditionally has been used as a place to hold inventory. The function of holding inventory comes with several perks such as reduced transportation costs, higher availability, and the consolidation of products.
According to the Logistics bureau (2020) warehouses help businesses work towards at least three different business objectives. The first advantage of investing in a warehouse is that it helps smoothening unpredicted changes in supply and demand. By acting as a buffer, the warehouse ensures that a high product availability is maintained, even though there might have been problems earlier in the supply chain (O’Byrne, 2017).
The second advantage with using a warehouse is the ability to build up an investment stock. In business areas where prices fluctuate, companies can choose to utilize their storage in a way that maximise profits. By treating the stock as an investment, the company can reduce the uncertainty and thus minimise risk (O’Byrne, 2017).
The third advantage of using a warehouse is its ability to reduce overall costs. An investment in a warehouse is often a strategic decision as it enables the users to utilize market fluctuations to their advantage. For example, a warehouse might allow a manufacturing company to take advantage of low raw material prices, resulting in lower production cost and a higher profit. This could also result in lower labour costs as the planning of production gets more predictable (O’Byrne, 2017).
3.3 Reordering point system To maintain the accessibility for materials at certain times a strategy for ordering and inventory replenishment is necessary. According to Aronsson, Ekdahl and Oskarsson (2004) there are three perspectives that must be considered and answered when structuring an inventory system:
• When should the order be placed?
• In what quantity should the order be placed?
• How can uncertainty be minimized or eliminated?
A reordering point system is a technique for ordering handling that incorporate these three perspectives. The system function by automatically placing orders consisting of desired quantities when inventory reaches a predetermined storage level (Jonsson &
Mattsson, 2005). The order point is connection to the lead time to be able to cover demand whilst waiting for the replenishment order to arrive. In case of uncertainty by varying demands or lead time, the reordering point system includes a safety stock to maintain the availability of materials. As the safety stock binds capital and has a direct impact on a company’s cash flow, the storage level must be as low as possible without compromising the availability of products (Gustavsson & Strömberg, 2018). The formula for calculating reordering points is:
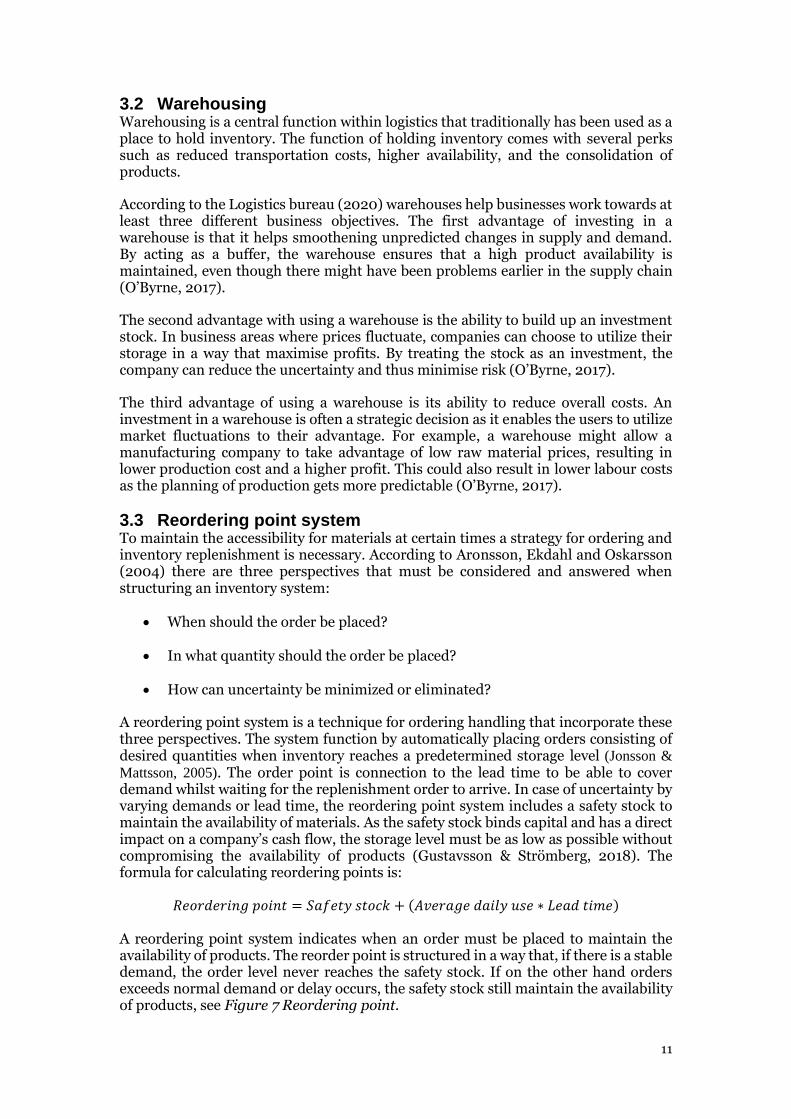
𝑅𝑒𝑜𝑟𝑑𝑒𝑟𝑖𝑛𝑔 𝑝𝑜𝑖𝑛𝑡 = 𝑆𝑎𝑓𝑒𝑡𝑦 𝑠𝑡𝑜𝑐𝑘 + (𝐴𝑣𝑒𝑟𝑎𝑔𝑒 𝑑𝑎𝑖𝑙𝑦 𝑢𝑠𝑒 ∗ 𝐿𝑒𝑎𝑑 𝑡𝑖𝑚𝑒) A reordering point system indicates when an order must be placed to maintain the availability of products. The reorder point is structured in a way that, if there is a stable demand, the order level never reaches the safety stock. If on the other hand orders exceeds normal demand or delay occurs, the safety stock still maintain the availability of products, see Figure 7 Reordering point.
12
Figure 7 Reordering point.
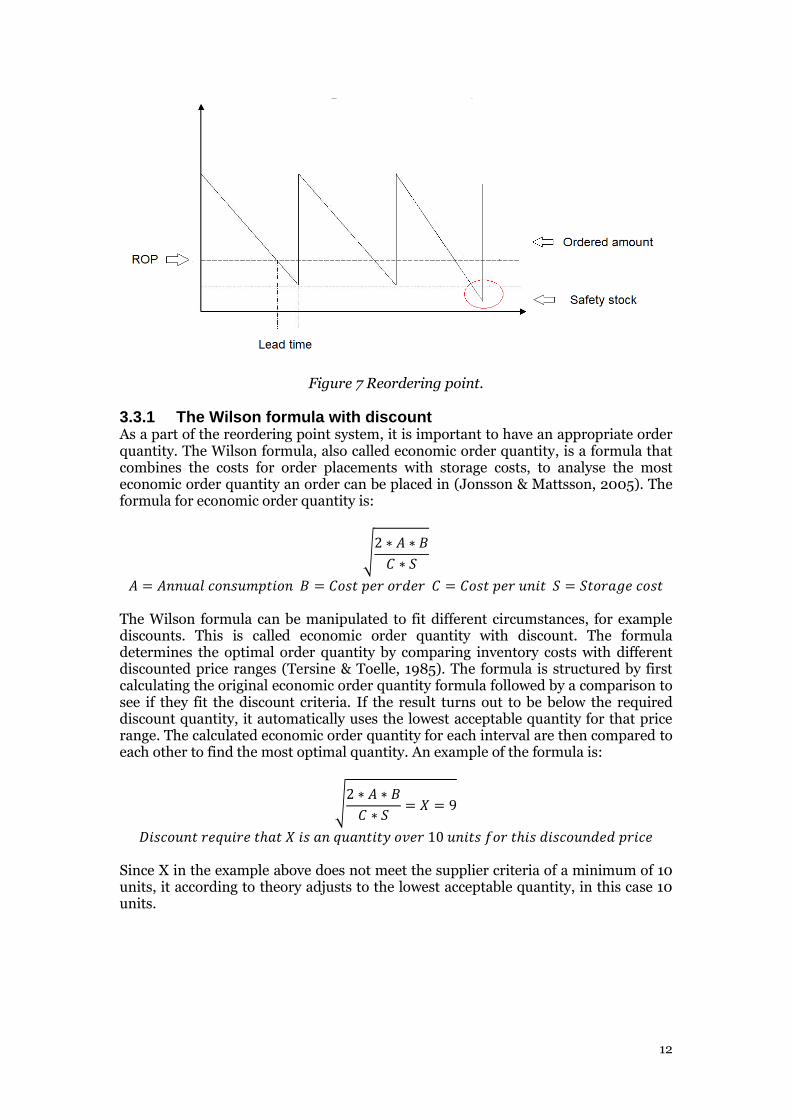
3.3.1 The Wilson formula with discount As a part of the reordering point system, it is important to have an appropriate order quantity. The Wilson formula, also called economic order quantity, is a formula that combines the costs for order placements with storage costs, to analyse the most economic order quantity an order can be placed in (Jonsson & Mattsson, 2005). The formula for economic order quantity is:
√2 ∗ 𝐴 ∗ 𝐵
𝐶 ∗ 𝑆
𝐴 = 𝐴𝑛𝑛𝑢𝑎𝑙 𝑐𝑜𝑛𝑠𝑢𝑚𝑝𝑡𝑖𝑜𝑛 𝐵 = 𝐶𝑜𝑠𝑡 𝑝𝑒𝑟 𝑜𝑟𝑑𝑒𝑟 𝐶 = 𝐶𝑜𝑠𝑡 𝑝𝑒𝑟 𝑢𝑛𝑖𝑡 𝑆 = 𝑆𝑡𝑜𝑟𝑎𝑔𝑒 𝑐𝑜𝑠𝑡 The Wilson formula can be manipulated to fit different circumstances, for example discounts. This is called economic order quantity with discount. The formula determines the optimal order quantity by comparing inventory costs with different discounted price ranges (Tersine & Toelle, 1985). The formula is structured by first calculating the original economic order quantity formula followed by a comparison to see if they fit the discount criteria. If the result turns out to be below the required discount quantity, it automatically uses the lowest acceptable quantity for that price range. The calculated economic order quantity for each interval are then compared to each other to find the most optimal quantity. An example of the formula is:
√2 ∗ 𝐴 ∗ 𝐵
𝐶 ∗ 𝑆= 𝑋 = 9
𝐷𝑖𝑠𝑐𝑜𝑢𝑛𝑡 𝑟𝑒𝑞𝑢𝑖𝑟𝑒 𝑡ℎ𝑎𝑡 𝑋 𝑖𝑠 𝑎𝑛 𝑞𝑢𝑎𝑛𝑡𝑖𝑡𝑦 𝑜𝑣𝑒𝑟 10 𝑢𝑛𝑖𝑡𝑠 𝑓𝑜𝑟 𝑡ℎ𝑖𝑠 𝑑𝑖𝑠𝑐𝑜𝑢𝑛𝑑𝑒𝑑 𝑝𝑟𝑖𝑐𝑒 Since X in the example above does not meet the supplier criteria of a minimum of 10 units, it according to theory adjusts to the lowest acceptable quantity, in this case 10 units.
13
3.2.2 Safety stock A safety stock is a buffer that makes up a part of the inventory to maintain product availability at temporary increases of demand or delays in the ordering process. All companies are faced with a certain amount of uncertainty and therefore there exist several methods for calculation of safety stock. The methods differ in complexity and required data. Four common methods are; Manual assessment method, Quantity method, Proportionality method and SERV1 (Ekholm & Grahn, 2018).
3.2.2.1 Estimated safety stock The method of using manual estimation of safety stock is commonly used by organisations whose products has no automatic connection to the ERP system. The method is easy to use as it is based in experience of the personnel managing the stock. By estimating safety stocks and manually connecting them to the ERP system the organisation can reduce uncertainty, although with no statistical basis. This way of estimating safety stock is very sensitive for deviations in supply and demand, requiring revision of each deviation which makes it very labour intensive (Jonsson & Mattsson, 2005).
3.2.2.2 Proportionality method The proportionality method provides both benefits and disadvantages when setting up a suitable safety stock. Benefits are that the method is proportional to the asked demand of products, meaning that calculation is meant to cover average demand during weeks, months or as a percentage during the lead time. The users of this method decide by them self what they find as a reasonable timeframe. Disadvantages given by the method are connected to tied up capital since products with larger demand automatically created bigger storage. A further drawback is that the method does not consider variations in changing demand or lead time (Ekholm & Grahn, 2018). An example when setting up a safety stock by proportionality method is:
𝑆𝑎𝑓𝑒𝑡𝑦 𝑠𝑡𝑜𝑐𝑘 = 𝑀𝑜𝑛𝑡ℎ𝑙𝑦 𝑑𝑒𝑚𝑎𝑛𝑑
3.2.2.3 Quantity method (safety stock during lead time) The quantity method is very common as it enables businesses to calculate a safety stock without having in depth data about each product. The quantity method is based in the products daily demand and multiplied by the days the organisation wants to cover. A common practice is to multiply the demand with the lead time for the replenishment order, this to make sure that the run-out time is covered in case of a late order placement. Drawbacks with using this method is that it does not take demand variances into account, risking holding too much inventory if deviations are low or a stockout if they are high. An example when setting up a safety stock by quantity method is:
𝑆𝑎𝑓𝑒𝑡𝑦 𝑠𝑡𝑜𝑐𝑘 = 𝐶ℎ𝑜𝑠𝑒𝑛 𝑐𝑜𝑣𝑒𝑟 𝑡𝑖𝑚𝑒 ∗ 𝐷𝑎𝑖𝑙𝑦 𝑑𝑒𝑚𝑎𝑛𝑑 𝑑𝑢𝑟𝑖𝑛𝑔 𝑤𝑜𝑟𝑘𝑑𝑎𝑦𝑠
14
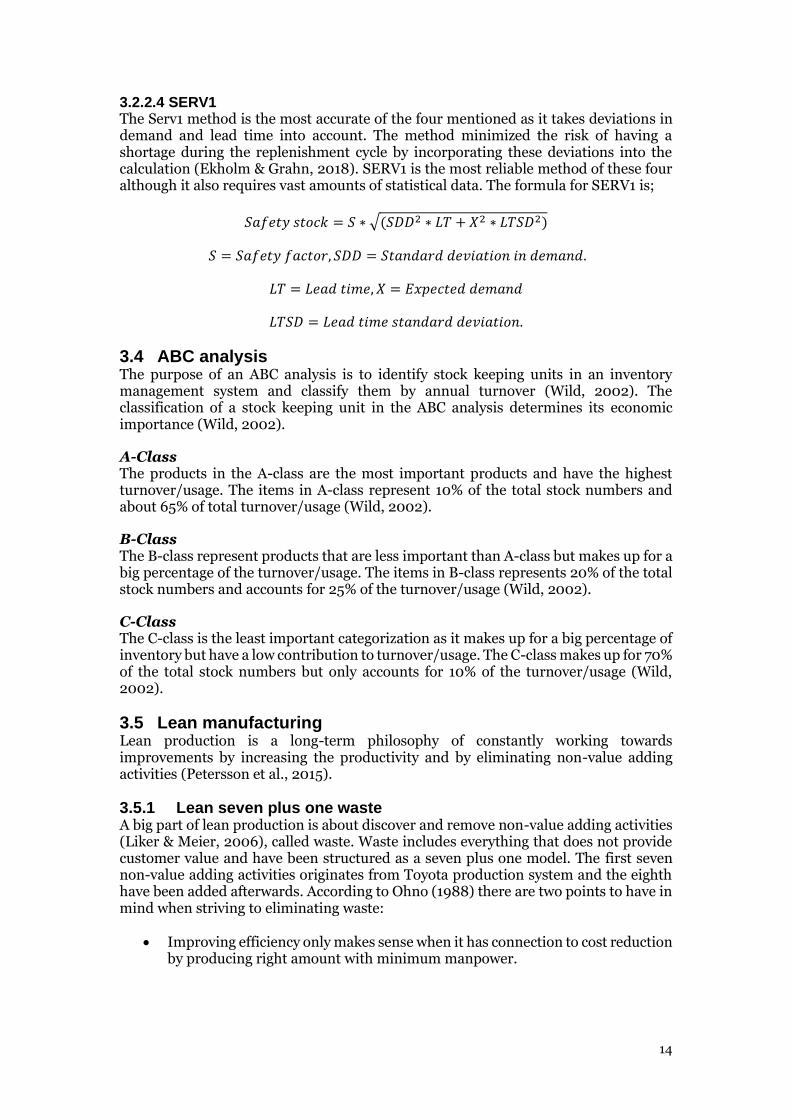
3.2.2.4 SERV1 The Serv1 method is the most accurate of the four mentioned as it takes deviations in demand and lead time into account. The method minimized the risk of having a shortage during the replenishment cycle by incorporating these deviations into the calculation (Ekholm & Grahn, 2018). SERV1 is the most reliable method of these four although it also requires vast amounts of statistical data. The formula for SERV1 is;
𝑆𝑎𝑓𝑒𝑡𝑦 𝑠𝑡𝑜𝑐𝑘 = 𝑆 ∗ √(𝑆𝐷𝐷2 ∗ 𝐿𝑇 + 𝑋2 ∗ 𝐿𝑇𝑆𝐷2)
𝑆 = 𝑆𝑎𝑓𝑒𝑡𝑦 𝑓𝑎𝑐𝑡𝑜𝑟, 𝑆𝐷𝐷 = 𝑆𝑡𝑎𝑛𝑑𝑎𝑟𝑑 𝑑𝑒𝑣𝑖𝑎𝑡𝑖𝑜𝑛 𝑖𝑛 𝑑𝑒𝑚𝑎𝑛𝑑.
𝐿𝑇 = 𝐿𝑒𝑎𝑑 𝑡𝑖𝑚𝑒, 𝑋 = 𝐸𝑥𝑝𝑒𝑐𝑡𝑒𝑑 𝑑𝑒𝑚𝑎𝑛𝑑
𝐿𝑇𝑆𝐷 = 𝐿𝑒𝑎𝑑 𝑡𝑖𝑚𝑒 𝑠𝑡𝑎𝑛𝑑𝑎𝑟𝑑 𝑑𝑒𝑣𝑖𝑎𝑡𝑖𝑜𝑛.
3.4 ABC analysis The purpose of an ABC analysis is to identify stock keeping units in an inventory management system and classify them by annual turnover (Wild, 2002). The classification of a stock keeping unit in the ABC analysis determines its economic importance (Wild, 2002).
A-Class The products in the A-class are the most important products and have the highest turnover/usage. The items in A-class represent 10% of the total stock numbers and about 65% of total turnover/usage (Wild, 2002).
B-Class The B-class represent products that are less important than A-class but makes up for a big percentage of the turnover/usage. The items in B-class represents 20% of the total stock numbers and accounts for 25% of the turnover/usage (Wild, 2002).
C-Class The C-class is the least important categorization as it makes up for a big percentage of inventory but have a low contribution to turnover/usage. The C-class makes up for 70% of the total stock numbers but only accounts for 10% of the turnover/usage (Wild, 2002).
3.5 Lean manufacturing Lean production is a long-term philosophy of constantly working towards improvements by increasing the productivity and by eliminating non-value adding activities (Petersson et al., 2015).
3.5.1 Lean seven plus one waste A big part of lean production is about discover and remove non-value adding activities (Liker & Meier, 2006), called waste. Waste includes everything that does not provide customer value and have been structured as a seven plus one model. The first seven non-value adding activities originates from Toyota production system and the eighth have been added afterwards. According to Ohno (1988) there are two points to have in mind when striving to eliminating waste:
• Improving efficiency only makes sense when it has connection to cost reduction by producing right amount with minimum manpower.
15
• Analyse the efficiency of each operator separately, then as a group and last as an entire plant. Improvements must be made at each step, simultaneously and for the entire plant.
The seven plus one model consist of wastes within inventory, motion, waiting, transportation, defects, overproduction, extra processing, and unused competence (Petersson et al., 2015).
• Inventory in a manufacturing company refers to the waiting time of products and can be found in stocks, buffers and in the inventory for finished products (Petersson et al., 2015). An excessive inventory has a negative impact on the company's cash flow as it results in tied up capital (Jonsson & Mattson, 2011).
• Motion is connected to all the movements that does not provide value in the organization (Petersson et al., 2015). Motion constitutes movements for getting tools and keeping materials far away from the workstation.
• Waiting refers to the time that an organization must stop their operations because of lack of materials, decision making or information flow. Waiting in a manufacturing unit often refers to materials not being available at the right time (Petersson et al., 2015).
• Transportations connection to non-value activities consists of internal transports. Transportation inside an organization does not provide value for the final customer and is therefore a waste of resources. Transportation can be simplified and improved but according to the model the only transportation that adds value is shipping to customer (Petersson et al., 2015).
• Producing defect products that are not manufactured correctly from start is time consuming and does not provide any value. Mistakes in production should always be minimised to avoid rework and disposal (Petersson et al., 2015).
• Not producing the right amount according to what the customer demand. Overcapacity can be identified in lack of balance between supply and demand but also by producing for storage (Petersson et al., 2015).
• Extra processing is connected to quality. By providing services that the customer is not willing to pay for constitutes a non-value adding service (Petersson et al., 2015).
• Unused competence is the last and non-value adding activity. This activity does not originate from the Toyota production system like the first seven but have been added afterwards. Unused competence refers to not utilizing the competence of the employees in the best way (Petersson et al., 2015).
16
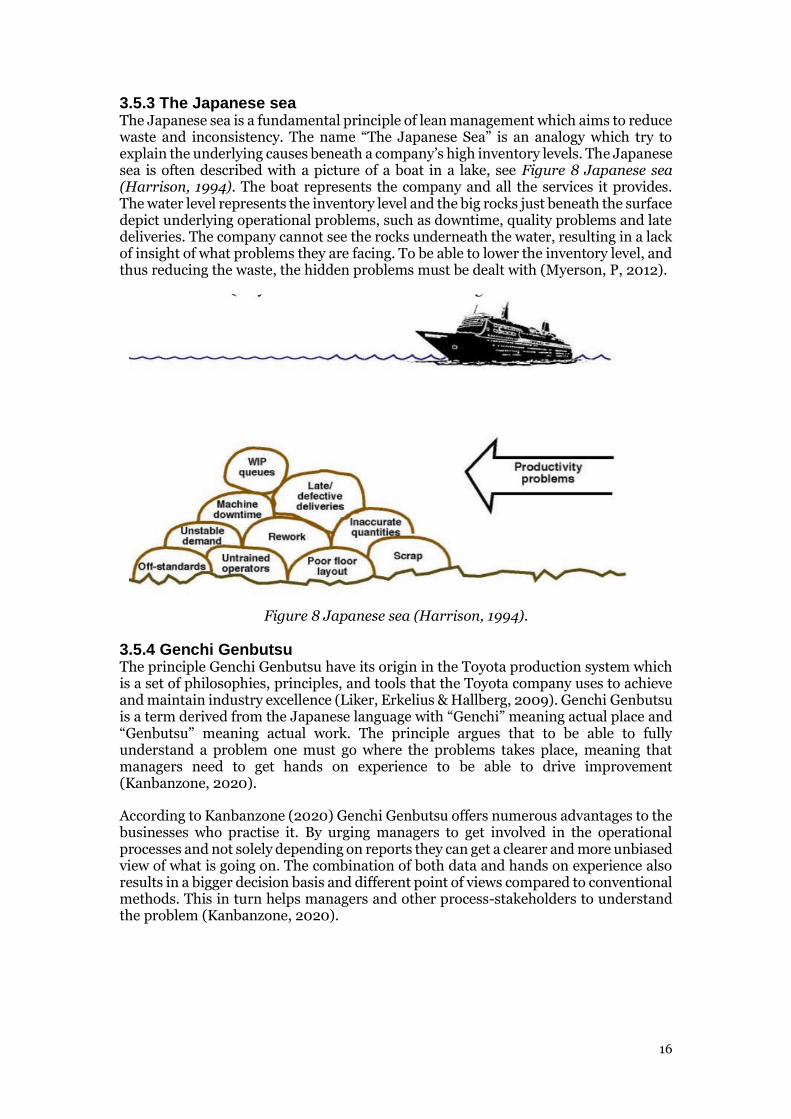
3.5.3 The Japanese sea The Japanese sea is a fundamental principle of lean management which aims to reduce waste and inconsistency. The name “The Japanese Sea” is an analogy which try to explain the underlying causes beneath a company’s high inventory levels. The Japanese sea is often described with a picture of a boat in a lake, see Figure 8 Japanese sea (Harrison, 1994). The boat represents the company and all the services it provides. The water level represents the inventory level and the big rocks just beneath the surface depict underlying operational problems, such as downtime, quality problems and late deliveries. The company cannot see the rocks underneath the water, resulting in a lack of insight of what problems they are facing. To be able to lower the inventory level, and thus reducing the waste, the hidden problems must be dealt with (Myerson, P, 2012).
Figure 8 Japanese sea (Harrison, 1994).
3.5.4 Genchi Genbutsu The principle Genchi Genbutsu have its origin in the Toyota production system which is a set of philosophies, principles, and tools that the Toyota company uses to achieve and maintain industry excellence (Liker, Erkelius & Hallberg, 2009). Genchi Genbutsu is a term derived from the Japanese language with “Genchi” meaning actual place and “Genbutsu” meaning actual work. The principle argues that to be able to fully understand a problem one must go where the problems takes place, meaning that managers need to get hands on experience to be able to drive improvement (Kanbanzone, 2020).
According to Kanbanzone (2020) Genchi Genbutsu offers numerous advantages to the businesses who practise it. By urging managers to get involved in the operational processes and not solely depending on reports they can get a clearer and more unbiased view of what is going on. The combination of both data and hands on experience also results in a bigger decision basis and different point of views compared to conventional methods. This in turn helps managers and other process-stakeholders to understand the problem (Kanbanzone, 2020).
17
3.5.5 Pareto’s principle Pareto’s principle which is also called the 80/20 rule is a common business phenomenon which are based on observations in different business areas (Bowersox et al., 2013). The Pareto principle states that in general 80% of the company's sales are generated by 20% of its products, implying that some products play a more important role than others when it comes to the success of the company. According to Kruse (2016), the pareto rule have a big variety of application areas, such as production, logistics and economics.
3.6 ERP system Enterprise resource planning systems are software that help companies track data and communicate more efficient. ERP systems integrate different business operations with each other which in turn results in a clearer overview of the company (Epicor, 2020). For manufacturing companies, the ERP systems ability to track data in real time is especially important as it allows them to track the current movement of goods (Epicor, 2020). The ERP systems ability to track past data can also be used to create advanced forecasts which companies can use as a basis in different strategic decision processes (Microsoft, 2020).
3.6.1 Automation By integrating processes into the ERP system operations that normally requires an employee becomes automated. Automation standardize the working processes and secures a consistent and reliable result unaffected by the human factor. According to Patil (2018) control system ensure higher level of performance compared to humans. By making a system automated quality and productivity increases simultaneously as product costs decrease.
3.7 Product content The product content contributes relevant information and theories that is connected to a product and its structure.
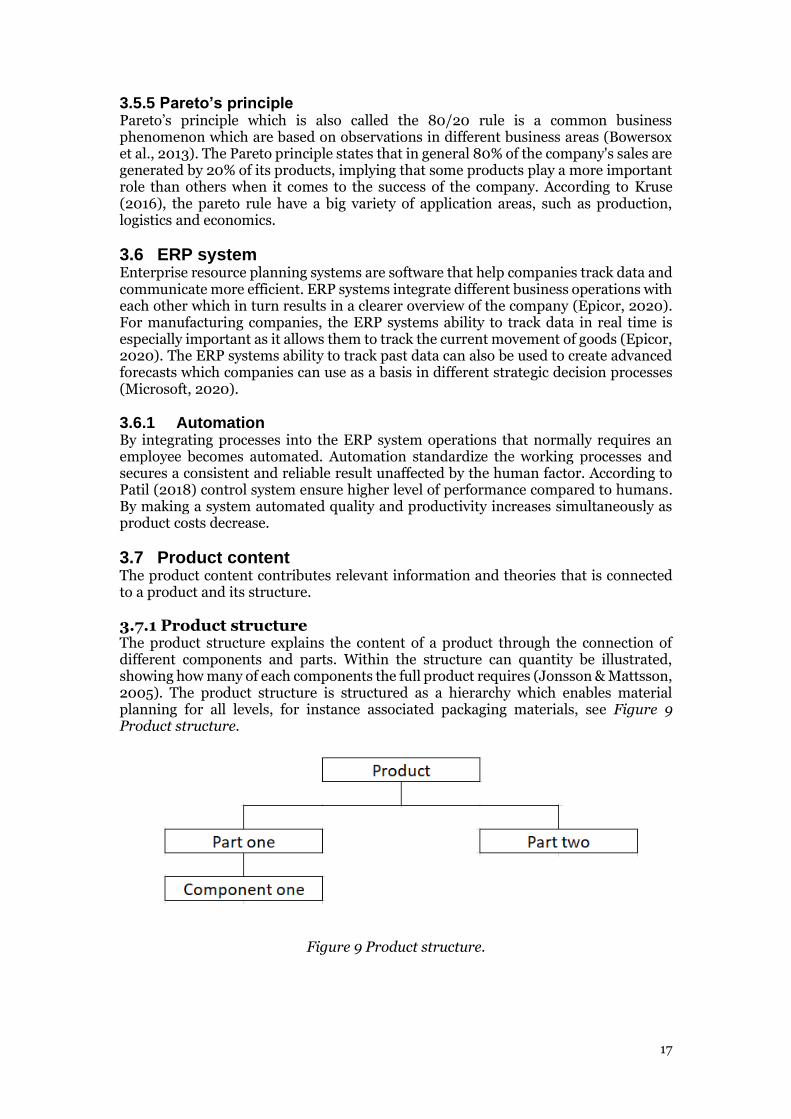
3.7.1 Product structure The product structure explains the content of a product through the connection of different components and parts. Within the structure can quantity be illustrated, showing how many of each components the full product requires (Jonsson & Mattsson, 2005). The product structure is structured as a hierarchy which enables material planning for all levels, for instance associated packaging materials, see Figure 9 Product structure.
Figure 9 Product structure.
18
3.7.2 Packaging materials There exist several different types of packaging materials. One of the more common are cardboard boxes made from corrugated cardboard which has become a Swedish standard (Kord & Pazirandeh, 2008). Packaging material provides protection for products while they are being stored and during transport (Jonsson & Mattsson, 2005).
3.7.3 Tied up capital The term tied up capital are often used when calculating monetary values that does not exist in the form of currency. Tied up capital refers to the cost related to all business operations that require investment, such as production materials, manufacturing tools and warehousing (Jonsson & Mattsson, 2005). According to Jonsson & Mattsson (2005) the amount of tied up capital have a direct impact on the liquidity of a company. Liquidity refers to the financial means that a company have at their disposal. By having a liquidity that exceeds their standard running costs companies can use the remaining cash reserves for other investments such as product development and expansion (Visma Spcs, 2018).
19
4 Empirical data To be able to answer this study’s research questions both qualitative and quantitative data collection was carried out. Qualitative data collection is based on interviews and observations with stakeholders both within and outside the case company. The quantitative data was derived from the company's ERP system, which consisted of previous sales, repairs, and forecasts. Data presented in the empirical chapter consist of both collected and processed data.
4.1 Case company Company X is a Swedish company that serves the global market with products, services, and solutions within military defence and civil security. The strategy to growth is to work with three key priorities; market, efficiency, and innovation where the aim is to create long-term value. Since company X is a manufacturing company sustainability constitutes a significant part of the entire business.
The case company are facing difficulties in the ordering and inventory handling. The ordering process for standard packaging materials does not follow any system that maintain the availability of materials. Materials are thereby ordered by estimated demand with the objective to cover weeks or months. The standard packaging materials consist of several different cardboard boxes that are not specified to any product. Selection of which box that will be used depends on which order quantity the delivery consist of. Therefore, different products could use a variety of boxes depending on what quantity of products the customer has ordered. The problem with this way of working is that every type of standard packaging material is ordered in large quantities which in turn put a strain on the limited inventory and ties up unnecessary capital.
The case company is planning to increase its position on the global market. As Bang and Markeset (2011) mentioned, the globalisation brings both opportunities and increased competition. As the case company expands its business there it is of high importance that every department adapt to cope with the changes. As for the inventory department, more sophisticated inventory control is required to stay competitive.
4.2 Current state analysis In the beginning of the empirical collection a current state analysis was used to fully grasp the current situation in the packaging department. The observation and interviews revealed several operations that laid the basis for the presented problem of the case company.
The packaging department handles a variety of packaging materials that are being stored and transported. Products that enters the department are being packaged in either specific packaging material or/and in standard packaging materials. The material used for packaging varies depending on the product that is being packed, with some products having specific material and some unspecified. The standard packaging material are not registered in the case company's ERP system, which means that it lacks traceability. Employees of the inventory department are therefore responsible for keeping the standard packaging materials available by themselves. As this is a time-consuming procedure this is being done by keeping large quantities in storage and by placing orders based on estimated demand. This way of working has previously led to employees forgetting to place new orders, resulting in a lack of packaging material. The department does not follow any calculations or models for safety stock or reorder points, which means that the inventory is likely to be unoptimized. This have resulted in the accumulation of excessive inventory, which is stored in a secondary area. The secondary area is not meant for storing materials or products but as result of the high inventory levels it has been used out of necessity.
20
4.3 Collected and processed data
4.3.1 Identification of products At the start of the project secondary data was given in an excel file consisting of products sales history for the last year. The file consisted of unsorted data of all previous sales, including new products, internal manufacturing parts and customer returns.
To be able to develop improvement proposals for the packaging department the first step was to differentiate between the different types of orders that were included in the data. As only customer orders and returns were processed at the packaging department, the internal orders of manufacturing parts had to be excluded.
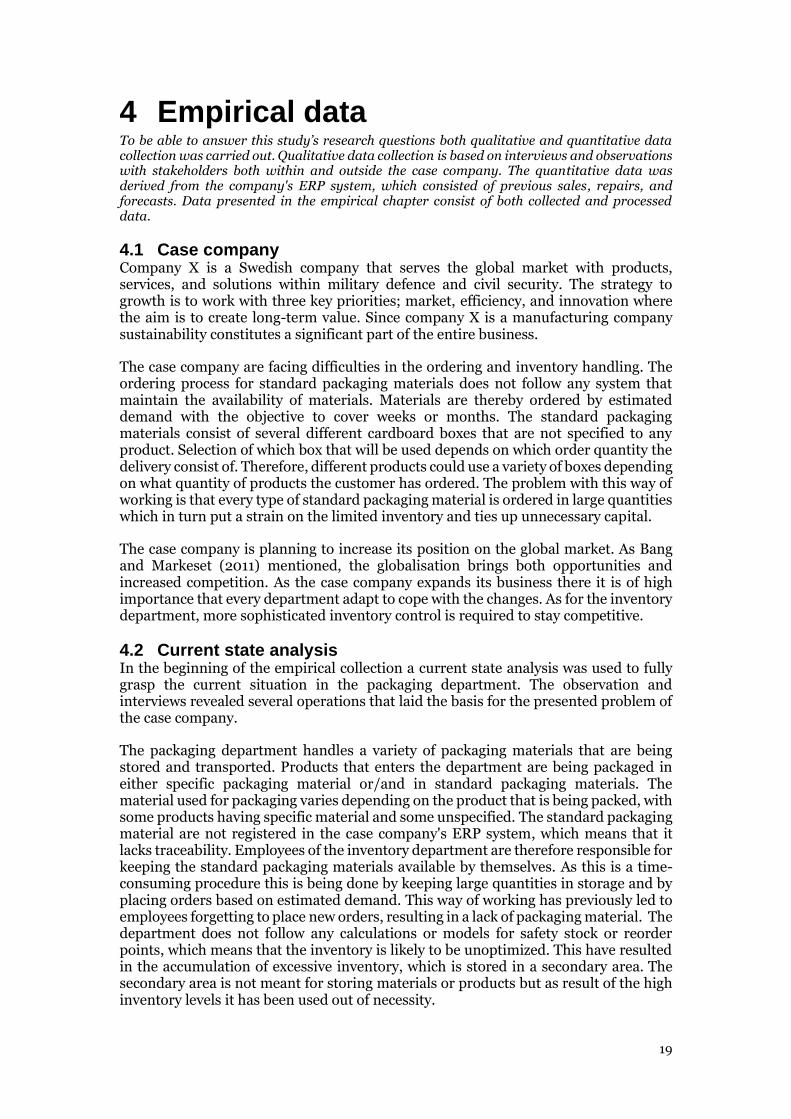
The data was now sorted by outgoing products consisting of finished products and returns. As some product were to be included in a product set which were sent as a single unit, the next step was to compile a list of finished products and product sets. To be able to differentiate between already finished product and product sets, interviews with both the employees of packaging department as well as product owners were held. By consulting the employees and showing them the data set with all finished products and sets, a list of finished products and whole sets could be derived. The final list consisted of 35 products and sets that was packed and transported by the packaging department. An example of the data compilation can be seen in the figure. The figure shows how different parts in different quantities makes up a finished product, see Figure 10 Identification of products.
Figure 10 Identification of products.
4.3.2 Differentiate standard and specific packaging materials By having identified the 35 products that were handled by the packaging department the next step would be to categorise them according to what packaging material they used. As products that used specific packaging material already was controlled by the ERP system they would be removed from the calculations. By doing this categorisation a total of 25 products and sets were found and could be associated to eight different standard packaging materials. To maintain the reliability of the given data for standard packaging materials it was backed up with interviews with employees of the packaging department, ensuring that the packaging material that remained was indeed standard packaging material.
21
4.3.3 Product structure of associated standard packaging materials When the products and standard packaging material was identified and compiled into a list the next step where to connect each product to their associated packaging material. As different products could use the same packaging material an adequate product structure had to be formalized.
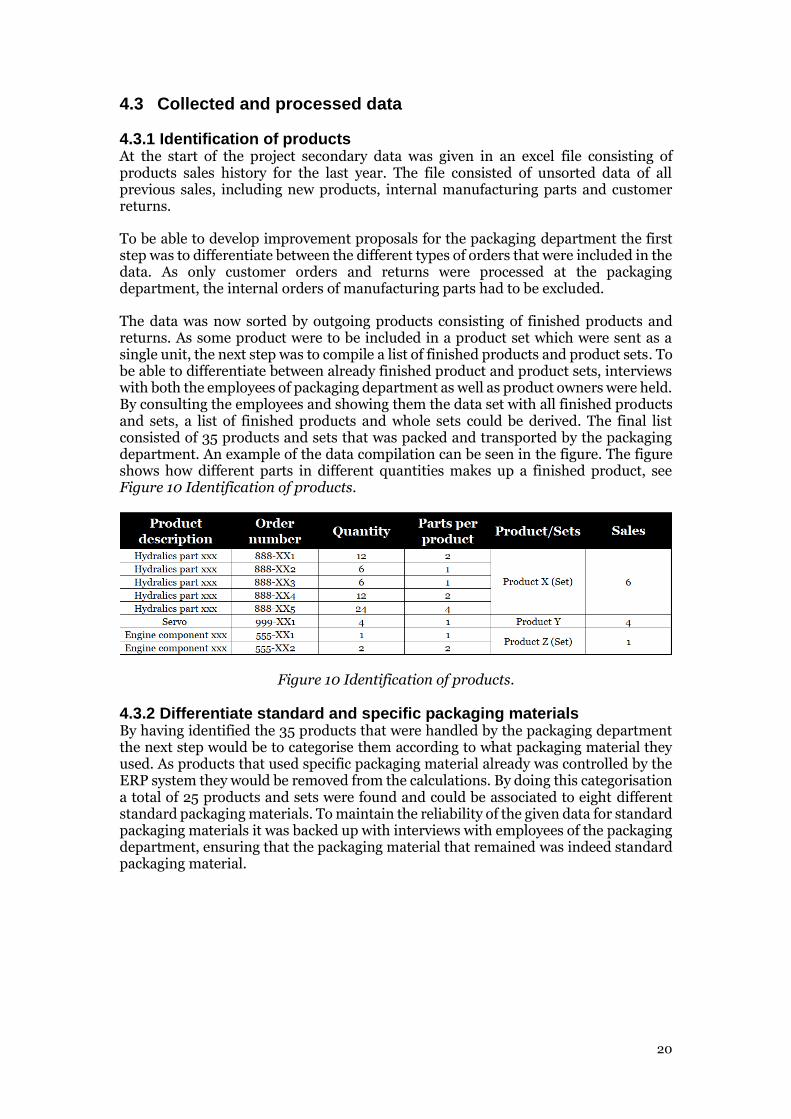
To ensure a high level of reliability the product structuring was conducted in close collaboration with the packaging personnel. By doing semi-structured interviews in combination with observations the products could be connected to a specific packaging material. This showed that the choice of standard packaging material depended on what product that were being shipped and in what quantity. Therefore, the historical data was analyzed to get an overview of the previous distribution of order quantities. According to the findings different products often utilized the same packaging material, see Figure 11 Product structure of associated standard packaging materials.
Figure 11 Product structure of associated standard packaging materials.
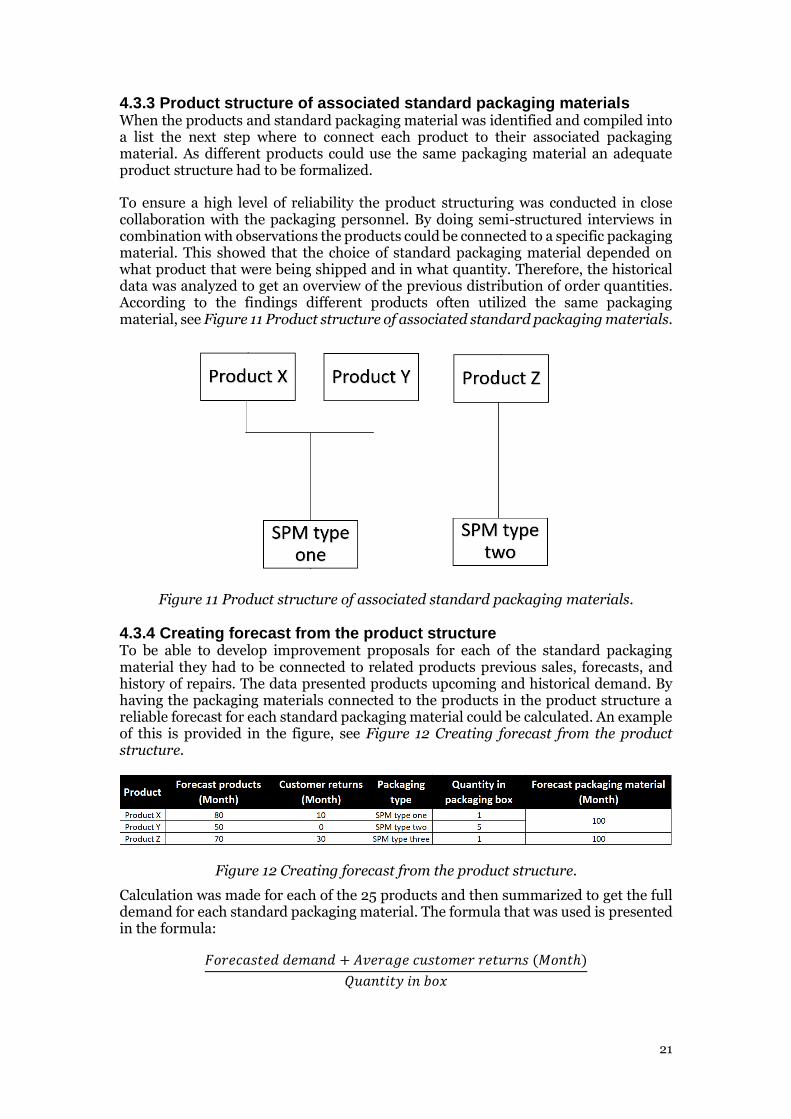
4.3.4 Creating forecast from the product structure To be able to develop improvement proposals for each of the standard packaging material they had to be connected to related products previous sales, forecasts, and history of repairs. The data presented products upcoming and historical demand. By having the packaging materials connected to the products in the product structure a reliable forecast for each standard packaging material could be calculated. An example of this is provided in the figure, see Figure 12 Creating forecast from the product structure.
Figure 12 Creating forecast from the product structure.
Calculation was made for each of the 25 products and then summarized to get the full demand for each standard packaging material. The formula that was used is presented in the formula:
𝐹𝑜𝑟𝑒𝑐𝑎𝑠𝑡𝑒𝑑 𝑑𝑒𝑚𝑎𝑛𝑑 + 𝐴𝑣𝑒𝑟𝑎𝑔𝑒 𝑐𝑢𝑠𝑡𝑜𝑚𝑒𝑟 𝑟𝑒𝑡𝑢𝑟𝑛𝑠 (𝑀𝑜𝑛𝑡ℎ)
𝑄𝑢𝑎𝑛𝑡𝑖𝑡𝑦 𝑖𝑛 𝑏𝑜𝑥
22
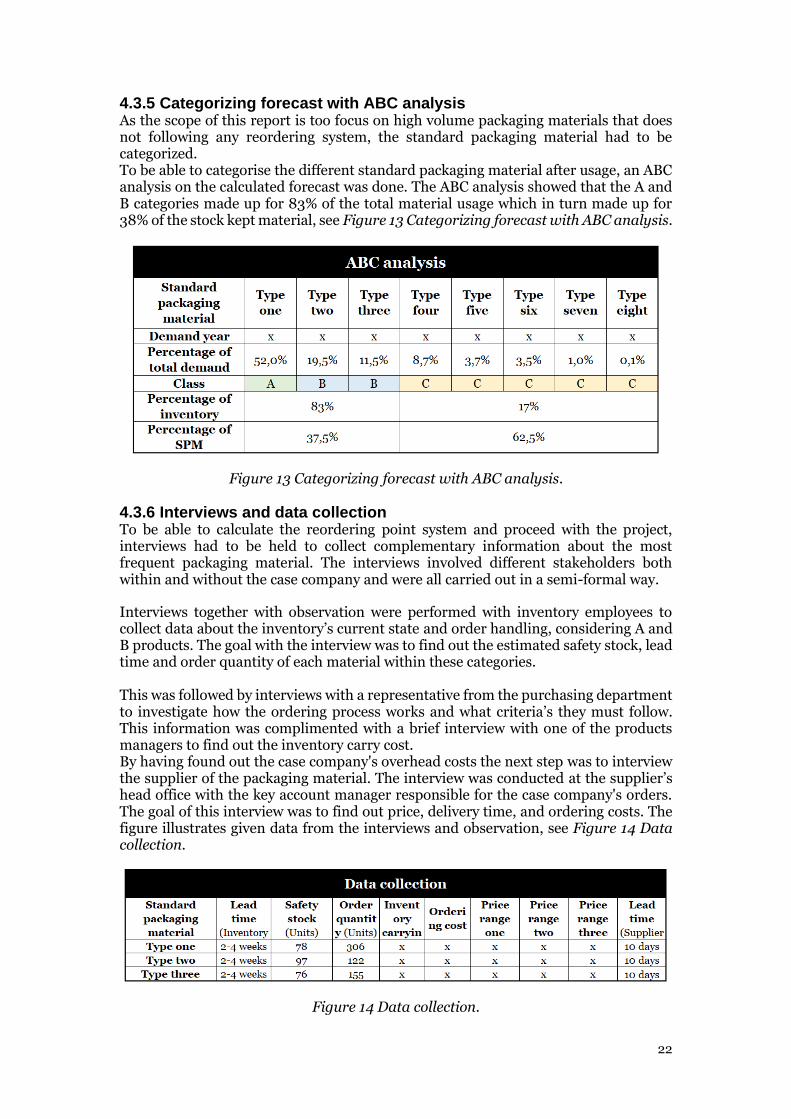
4.3.5 Categorizing forecast with ABC analysis As the scope of this report is too focus on high volume packaging materials that does not following any reordering system, the standard packaging material had to be categorized. To be able to categorise the different standard packaging material after usage, an ABC analysis on the calculated forecast was done. The ABC analysis showed that the A and B categories made up for 83% of the total material usage which in turn made up for 38% of the stock kept material, see Figure 13 Categorizing forecast with ABC analysis.
Figure 13 Categorizing forecast with ABC analysis.
4.3.6 Interviews and data collection To be able to calculate the reordering point system and proceed with the project, interviews had to be held to collect complementary information about the most frequent packaging material. The interviews involved different stakeholders both within and without the case company and were all carried out in a semi-formal way.
Interviews together with observation were performed with inventory employees to collect data about the inventory’s current state and order handling, considering A and B products. The goal with the interview was to find out the estimated safety stock, lead time and order quantity of each material within these categories. This was followed by interviews with a representative from the purchasing department to investigate how the ordering process works and what criteria’s they must follow. This information was complimented with a brief interview with one of the products managers to find out the inventory carry cost. By having found out the case company's overhead costs the next step was to interview the supplier of the packaging material. The interview was conducted at the supplier’s head office with the key account manager responsible for the case company's orders. The goal of this interview was to find out price, delivery time, and ordering costs. The figure illustrates given data from the interviews and observation, see Figure 14 Data collection.
Figure 14 Data collection.
23
5 Calculations of processed data By having the data collection finished and all numbers in place the final reordering point system could be calculated for each standard packaging material. Data that was presented by the preparatory work showed the different packaging materials; lead time, administration cost, price of inventory, yearly demand, and price at different order quantities, which would constitute the basis for the calculations.
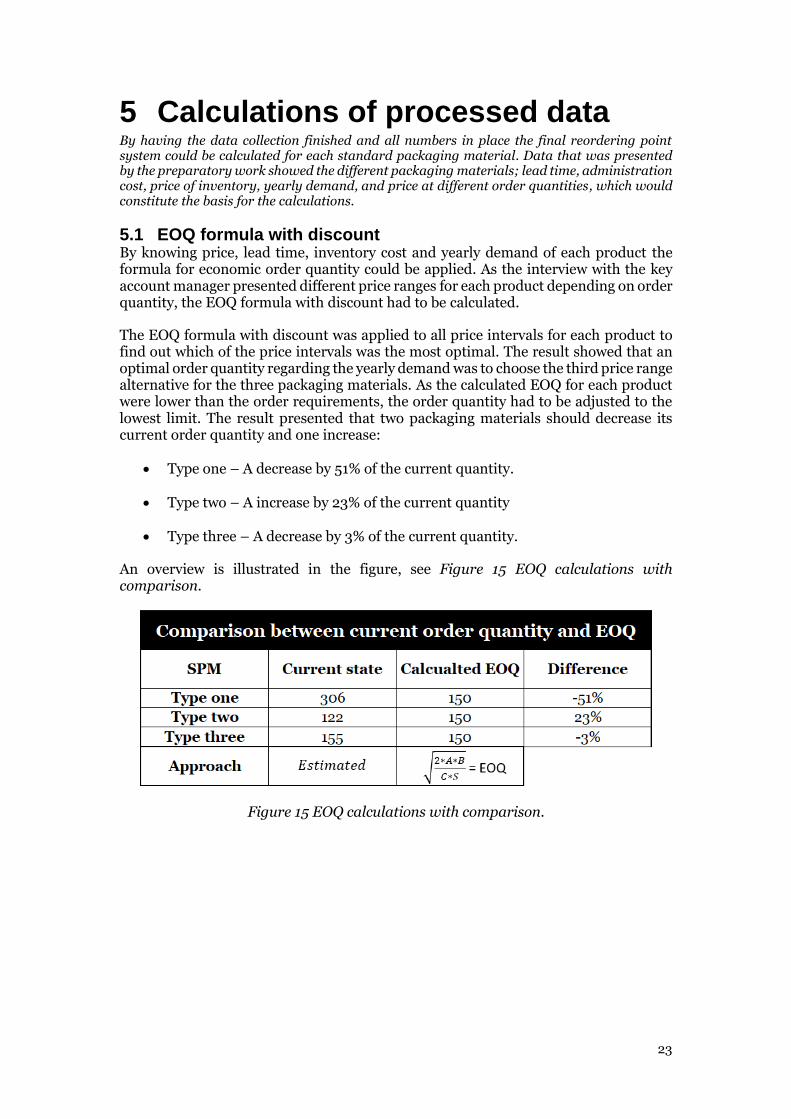
5.1 EOQ formula with discount By knowing price, lead time, inventory cost and yearly demand of each product the formula for economic order quantity could be applied. As the interview with the key account manager presented different price ranges for each product depending on order quantity, the EOQ formula with discount had to be calculated.
The EOQ formula with discount was applied to all price intervals for each product to find out which of the price intervals was the most optimal. The result showed that an optimal order quantity regarding the yearly demand was to choose the third price range alternative for the three packaging materials. As the calculated EOQ for each product were lower than the order requirements, the order quantity had to be adjusted to the lowest limit. The result presented that two packaging materials should decrease its current order quantity and one increase:
• Type one – A decrease by 51% of the current quantity.
• Type two – A increase by 23% of the current quantity
• Type three – A decrease by 3% of the current quantity.
An overview is illustrated in the figure, see Figure 15 EOQ calculations with comparison.
Figure 15 EOQ calculations with comparison.
24
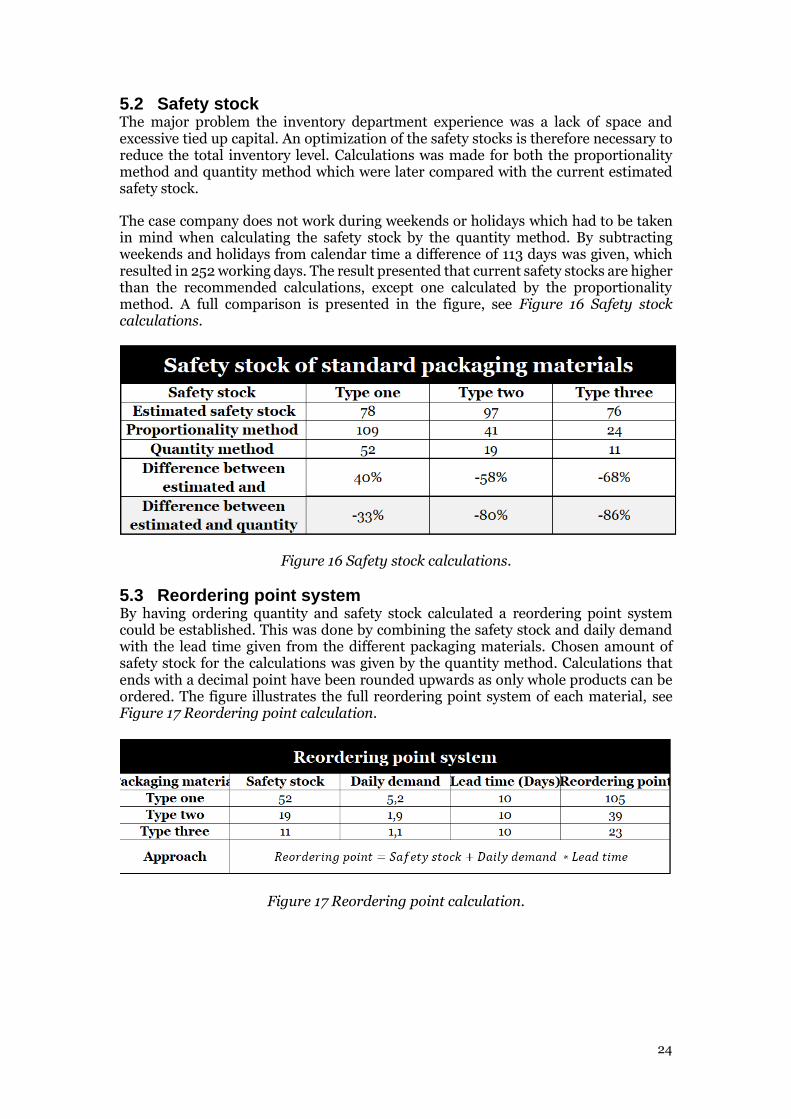
5.2 Safety stock The major problem the inventory department experience was a lack of space and excessive tied up capital. An optimization of the safety stocks is therefore necessary to reduce the total inventory level. Calculations was made for both the proportionality method and quantity method which were later compared with the current estimated safety stock.
The case company does not work during weekends or holidays which had to be taken in mind when calculating the safety stock by the quantity method. By subtracting weekends and holidays from calendar time a difference of 113 days was given, which resulted in 252 working days. The result presented that current safety stocks are higher than the recommended calculations, except one calculated by the proportionality method. A full comparison is presented in the figure, see Figure 16 Safety stock calculations.
Figure 16 Safety stock calculations.
5.3 Reordering point system By having ordering quantity and safety stock calculated a reordering point system could be established. This was done by combining the safety stock and daily demand with the lead time given from the different packaging materials. Chosen amount of safety stock for the calculations was given by the quantity method. Calculations that ends with a decimal point have been rounded upwards as only whole products can be ordered. The figure illustrates the full reordering point system of each material, see Figure 17 Reordering point calculation.
Figure 17 Reordering point calculation.
25
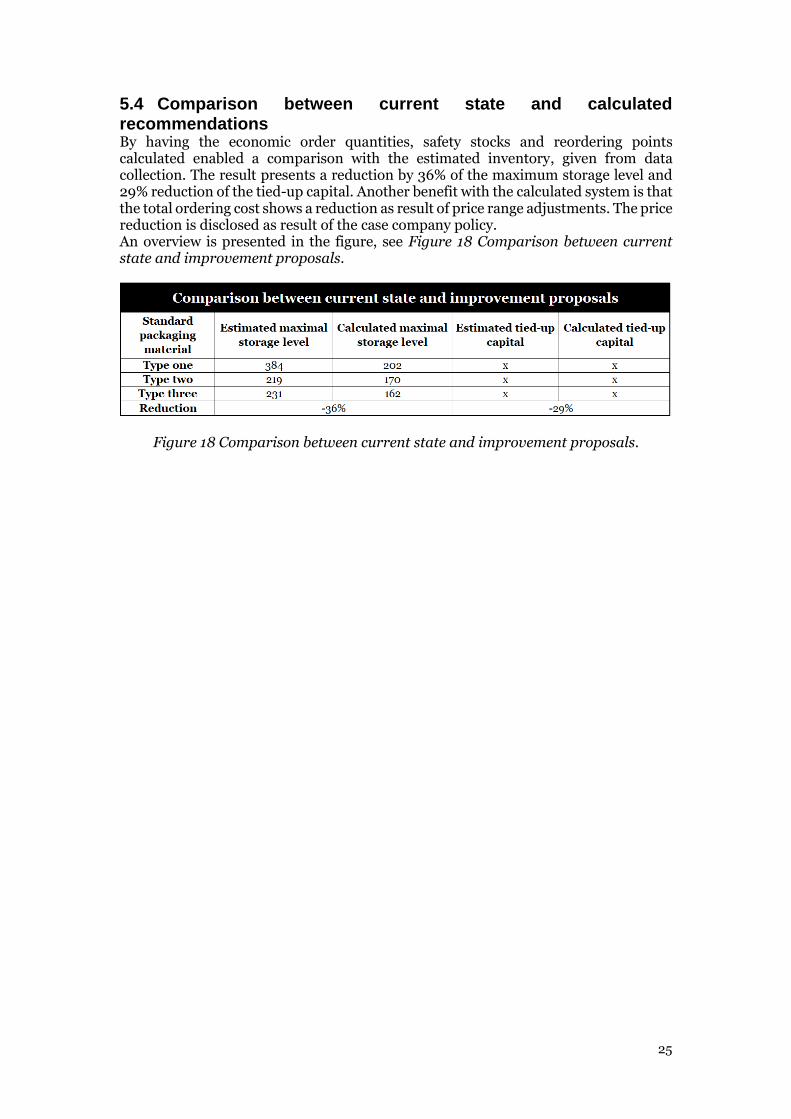
5.4 Comparison between current state and calculated recommendations By having the economic order quantities, safety stocks and reordering points calculated enabled a comparison with the estimated inventory, given from data collection. The result presents a reduction by 36% of the maximum storage level and 29% reduction of the tied-up capital. Another benefit with the calculated system is that the total ordering cost shows a reduction as result of price range adjustments. The price reduction is disclosed as result of the case company policy. An overview is presented in the figure, see Figure 18 Comparison between current state and improvement proposals.
Figure 18 Comparison between current state and improvement proposals.
26
6 Analysis and discussion In this chapter the study’s research questions are discussed and compared to the collected empirical data and theoretical framework. The chapter compare current way of working with the desired condition that has been calculated.
6.1 How can reordering points and inventory handling of uncontrolled packaging materials be structured?
6.1.1 Links between products and packaging materials Products that is being stored or transported requires protection in terms of packaging materials. Case company X uses two different ways to protect their products during transportation. This is done by either packaging the products directly in a product specific packaging material or/and in a standard packaging material. This way of working means that different products could use the same standard packaging material and are therefore not structured into the ERP system. This have led to a lack of control by the case company, resulting in standard packaging materials being ordered by estimated demand with no statistical background. O’Byrne (2017) mentions that there are numerous advantages for companies using warehousing, such as ensuring a high product availability and holding an investment stock. A case could be made that holding an investment stock is not applicable in the case company as the packaging materials is a supplement to the offered products. The inventory levels should thus follow the demand of their designated products or else risk unnecessary tied up capital (Jonsson & Mattsson, 2005).
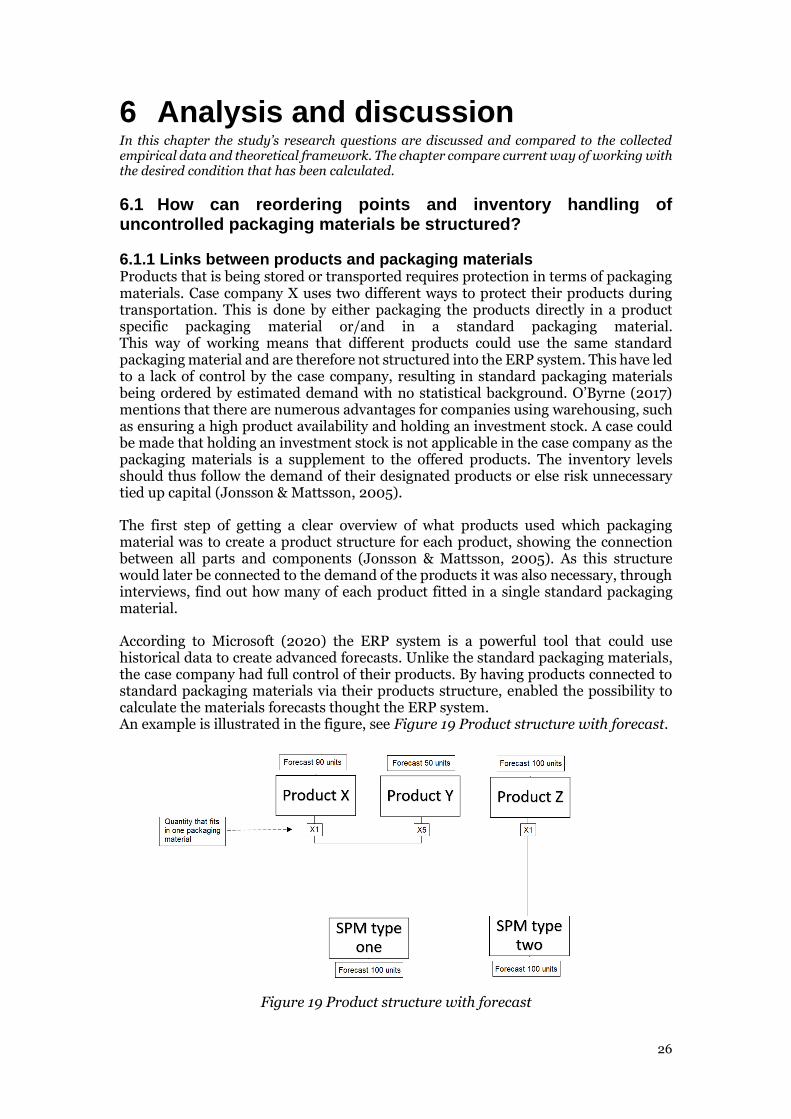
The first step of getting a clear overview of what products used which packaging material was to create a product structure for each product, showing the connection between all parts and components (Jonsson & Mattsson, 2005). As this structure would later be connected to the demand of the products it was also necessary, through interviews, find out how many of each product fitted in a single standard packaging material.
According to Microsoft (2020) the ERP system is a powerful tool that could use historical data to create advanced forecasts. Unlike the standard packaging materials, the case company had full control of their products. By having products connected to standard packaging materials via their products structure, enabled the possibility to calculate the materials forecasts thought the ERP system. An example is illustrated in the figure, see Figure 19 Product structure with forecast.
Figure 19 Product structure with forecast
27
When having expected forecast for each material determined, the method of ABC analysis was applied. The theory divides high- against low volume materials and goes well in hand with the given data. According to Wild (2002) the A and B products should represent 35% of the products and 90% of the total turnover, which compared to the case company was 38% respectively 83%. This division confirm the Pareto’s principle which argue that the minority of products stand for most sales (Bowersox et al., 2013).
By having the materials categorized in A and B classes the scope of the study was met as they included the most frequent uncontrolled materials. When knowing that the materials made up for 83% of the total turnover, the theory of the Japanese sea was applied, to eliminate the biggest top first (Myerson, P, 2012).
6.1.2 Safety stock The function of safety stock is to make sure that the availability of goods and materials is undisturbed. By acting as a buffer for uncertainty companies can use a safety stock to ensure a high service level, unaffected by delays and unexpected increases in demand (Jonsson & Mattsson, 2005).
As a result of the interviews with the inventory employees a conclusion can be made that the case company does not have any calculated safety stock for the standard packaging materials. At the time of the study the case company ensure that the availability criteria are met by always having a lot of inventory and by placing new orders based on estimated demand. This way of dealing with demand variations works but comes at the cost of higher inventory levels and a reduction of storage space. As the safety stock contribute to the overall tied up capital it affects the plans of growth which the case company strives for.
To be able to calculate the appropriate safety stock several formulas were taken into consideration. The formulas that were considered were the proportionality method, quantity method and SERV1. As the SERV1 method relies on historical data about the variations in demand and lead time this method could not be used as the standard packaging material were not controlled by the ERP system.
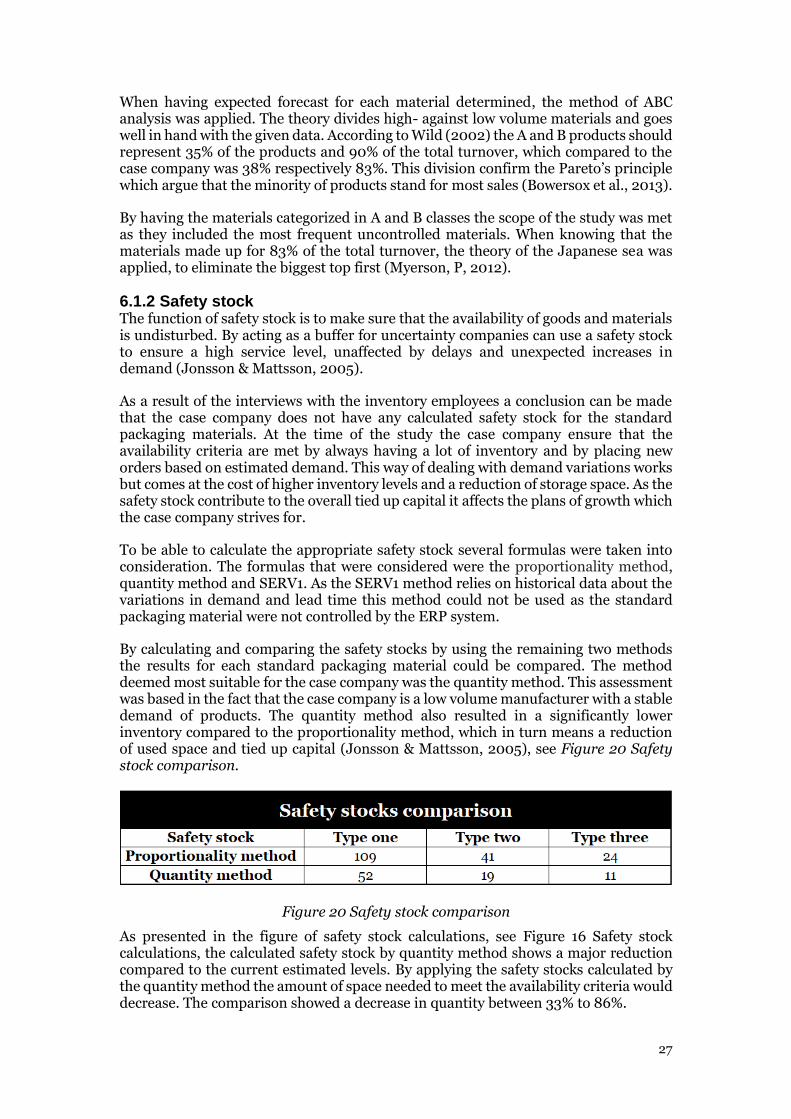
By calculating and comparing the safety stocks by using the remaining two methods the results for each standard packaging material could be compared. The method deemed most suitable for the case company was the quantity method. This assessment was based in the fact that the case company is a low volume manufacturer with a stable demand of products. The quantity method also resulted in a significantly lower inventory compared to the proportionality method, which in turn means a reduction of used space and tied up capital (Jonsson & Mattsson, 2005), see Figure 20 Safety stock comparison.
Figure 20 Safety stock comparison
As presented in the figure of safety stock calculations, see Figure 16 Safety stock calculations, the calculated safety stock by quantity method shows a major reduction compared to the current estimated levels. By applying the safety stocks calculated by the quantity method the amount of space needed to meet the availability criteria would decrease. The comparison showed a decrease in quantity between 33% to 86%.
28
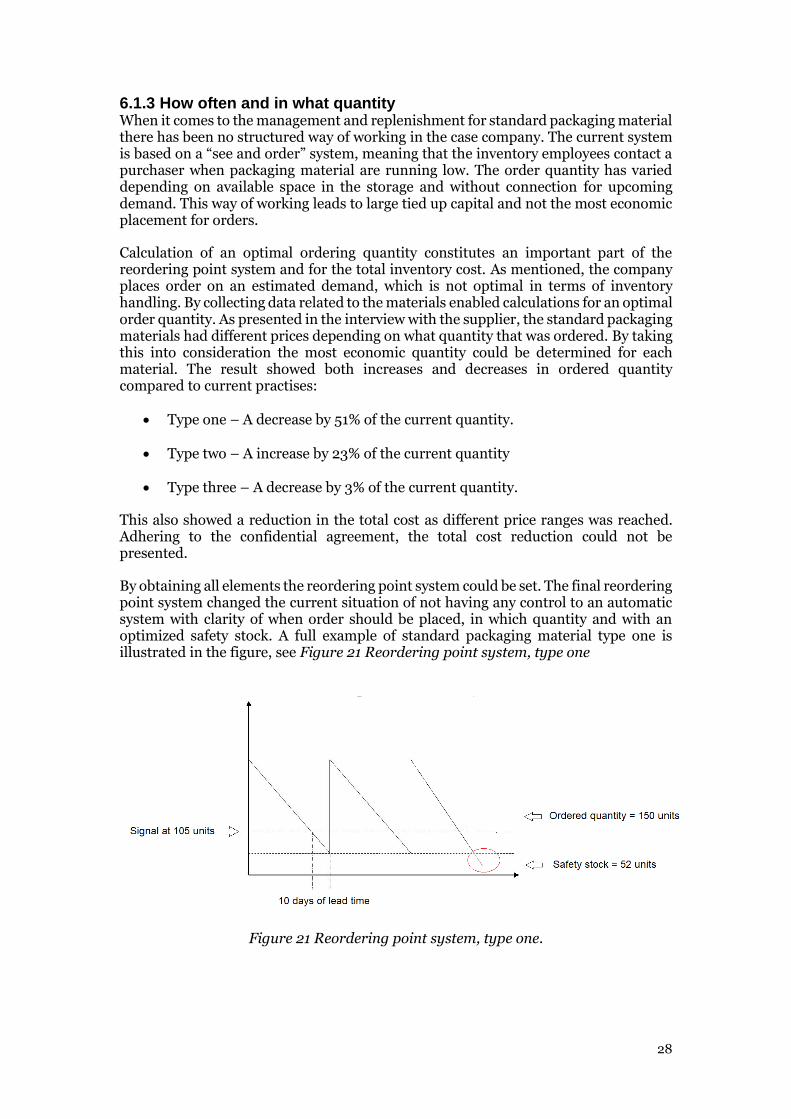
6.1.3 How often and in what quantity When it comes to the management and replenishment for standard packaging material there has been no structured way of working in the case company. The current system is based on a “see and order” system, meaning that the inventory employees contact a purchaser when packaging material are running low. The order quantity has varied depending on available space in the storage and without connection for upcoming demand. This way of working leads to large tied up capital and not the most economic placement for orders.
Calculation of an optimal ordering quantity constitutes an important part of the reordering point system and for the total inventory cost. As mentioned, the company places order on an estimated demand, which is not optimal in terms of inventory handling. By collecting data related to the materials enabled calculations for an optimal order quantity. As presented in the interview with the supplier, the standard packaging materials had different prices depending on what quantity that was ordered. By taking this into consideration the most economic quantity could be determined for each material. The result showed both increases and decreases in ordered quantity compared to current practises:
• Type one – A decrease by 51% of the current quantity.
• Type two – A increase by 23% of the current quantity
• Type three – A decrease by 3% of the current quantity.
This also showed a reduction in the total cost as different price ranges was reached. Adhering to the confidential agreement, the total cost reduction could not be presented.
By obtaining all elements the reordering point system could be set. The final reordering point system changed the current situation of not having any control to an automatic system with clarity of when order should be placed, in which quantity and with an optimized safety stock. A full example of standard packaging material type one is illustrated in the figure, see Figure 21 Reordering point system, type one
Figure 21 Reordering point system, type one.
29
6.2 What would be the advantage of implement and plan uncontrolled packaging materials in the ERP system?
6.2.1 Reduction and elimination of non-value adding activities According to Petersson et al (2015) there exist seven plus one non-value activities in the philosophy of lean. Companies should always strive to minimize or eliminate activities that do not provide value for their customers (Petersson et al., 2015). By comparing the current state of the case company with the suggested proposals three non-value adding activities could be found as well as a reduction of total the inventory level and tied up capital. With an implementation of the suggested changes these activities would be minimized or eliminated.
Inventory form the first non-added value activity that the current way of working creates and refers to the waiting of products (Petersson et al., 2015). By placing large orders and keeping them as stocks causes unnecessary tied up capital (Jonsson & Mattsson, 2005) and lack of space. The main challenge the case company faced was to adapt the current inventory since it was not enough room available. By binding products and their forecasts to standard packaging materials, their upcoming demands could be derived. The outcome of this led to the calculations of optimized safety stocks, storage levels and order quantities.
Waiting constitutes the second activity that were not value adding and that could be eliminated by the improvement proposals. Waiting within lean production occurs when materials are not available for the employees (Petersson et al., 2015). The employees of the inventory department have by themselves been responsible for controlling inventory levels and reordering standard packaging materials. By not having an automated system that controls the availability it has previously led to mistakes of not remembering placing new orders or placing them at the wrong time and quantity. By implementing a system that automatically places orders of appropriate quantity the case company can ensure that the availability of products increases as well as removing a whole sub-operation from the packaging department.
Motion is the last non-value adding activity that were found and could be reduced by the improvement proposals. Motion is connected to movements that must be made within the workstation (Petersson et al., 2015). The case company experience a lack of space because of the large inventory levels. As a result of this the case company at the time of the study use a second room as storage to compliment the current inventory. By implementing the suggested reordering point system, the storage levels will decrease and result in that standard packaging materials will fit in the ordinary storage area. The effect of the improvement proposals results in the reduction of unnecessary movements, which in terms has a direct impact on the effectiveness.
If the calculations of reorder points were to be implemented, it would have a big impact on both tied up capital and maximum storage level compared to the current state. As seen in figure 18, see Figure 18 Comparison between current state and , the maximum storage level would decrease by 36% compared to the estimated levels. The tied-up capital would also see a reduction of 29% which would enable the case company to invest in other areas and continue with their plans of growth.
The problem with implementing these changes without connecting them to the ERP system is that businesses are not static entities that stay the same. Business are complex with ever changing prices, products, and people. To make the changes provided in the calculations applicable over a long time they must be connected to the company's ERP system. The benefits of connecting the standard packaging material to the ERP system are numerous as it automates the time-consuming steps (Patil, 2018)
30
that laid the foundation for the calculations in this report. A successfully pairing of the standard packaging material with the ERP system would mean that more reliable data could be generated. The generated demand of standard packaging material would be on a first-hand basis and not a combined calculation of the product structures (Jonsson & Mattsson, 2005). By having first-hand data about the standard packaging material, the case company would be able to use more advanced forecasts and tools.
6.3 Further developments of the improvement proposals As previously mentioned, a successful implementation of the improvement proposals would result in numerous advantages for the case company. The benefits with these implementations are not only that they increase the operational efficiency at the case company, but they also lay the foundation for further improvements.
6.3.1 Scanners The connection of the standard packaging material to the ERP system would have numerous advantages, such as better control, smaller inventory levels, cost savings, less tied up capital and the elimination of waste. The fact that different products are sent in the standard packaging material presents a challenge for how to successfully connect them to the ERP system without imposing any time-consuming operations. To enable the connection to the ERP system without disturbing the workflow of the packaging department an easy solution must be presented.
The use of interviews and Genchi Genbutsu (Liker, Erkelius & Hallberg, 2009) resulted in the realisation that the usage of standard packaging material could never be fully automated without supplement. The reason for this was the complexity of the packaging structure, based in the fact that the standard packing material had no designated products. The problem with not having designated products is that the ERP system would not know what packaging material that was being used, thus leading to faulty data.
A solution to this problem could be to introduce a semi-automatic system which would enable the packaging department to scan the boxes that were being used each day. By connecting the packaging material to the ERP system without fully automating the reporting of their daily use would drastically change the situation in the packaging department. The use of scanners would enable the system to track both the standard packaging material as well as automatically placing orders once the quantity reach the reorder point.
6.3.2 SERV1 In the first research question a reordering point system were established, containing a safety stock. Optimization were made by a method called the quantity method which is the most applied method for calculation of a safety stock. Disadvantages given by the method is that it does not regard uncertainties of demand and variance during lead time. The case company are not aware of the variance since limited historical data of standard packaging materials exists.
During the interviews with the storage employees and the key account manager representing the supplier, an oral variance of lead time was identified. Inventory employees within the case company argued that the lead time were between two to four weeks while the key account management claimed that the total lead time were 10 workdays. As the case company apparently have a variance of lead time this also affect how effective the safety measures of the calculated safety stock will be. To be able to calculate a safety stock regarding variances, the method SERV1 could be applied. SERV1 is a formula that takes variance into consideration by comparing historical data of placed and delivered orders (Ekholm & Grahn, 2018). This method was not

31
applicable for this study since no such historical data existed. A further improvement of this study would therefore be to analyse the variance given by the ERP system if the suggested implementation were to be made. As data of variances will be created by the ERP implementation the use of SERV1 will be possible to be calculated. This improvement of safety stock calculation would maintain the availability of standard packaging materials even if circumstances changed.
32
7 Conclusion This chapter provides a summary description to the main findings of the study. Furthermore, the study's implications and limitations are described. In addition, the study's conclusions and recommendations are presented. The chapter concludes with suggestions for further research.
7.1 Results The purpose of the study is to develop improvement proposals for an ordering handling system of uncontrolled packaging materials. As an effect of increased global competition manufacturing companies experience a need for optimisation in every part of their business. The business area of logistics, especially inventory handling has been greatly affected by the increased focus on optimization (Frazelle, 2016).
By having insight into the case company’s inventory handling, it turned out that packaging materials experience a variety of control. Parts of the packaging material, called standard packaging material, are not registered in the ERP system due to its difficulty to track. The uncontrolled material constitutes a minor share of the total amount of packaging material but is still an inaccuracy in the logistic area. Of that reason, to maintain its competitiveness, two research question was structured to fulfil the purpose. The first research question was to investigate;
• How can reordering points and inventory handling of uncontrolled packaging materials be structured?
The findings of the study show that data of uncontrolled materials can be derived through the connection of relevant products by using a breakdown structure. By this approach data and forecasts of related products could be summarised and used as a calculation basis for a reordering point system. By having a clear overview of how to structure the uncontrolled materials the second research questions of the report could be investigated;
• What would be the advantage of implement and plan uncontrolled packaging materials in an ERP system?
To be able to reason about the effects of a potential ERP implementation the calculated logistical data was compared to the current state of the inventory handling. This was done by using theories within waste reduction. The advantages of implementing reordering points of uncontrolled materials into an ERP system led to the reduction of non-value adding activities, reduction of maximal inventory, reduced tied-up capital and to a controlled ordering handling.
7.2 Theoretical and empirical contribution By analysing different methods and data collection practices, the report has in a progressive way resulted in a new method for the calculation of demand when it comes to uncontrolled material. By formulating a product structure, with the uncontrolled material as a subgroup, the total demand of the uncontrolled material can be derived. This method has numerous application areas and enables optimisation and calculations of previously unknown data.
33
7.3 Method discussion To investigate the research questions and fulfil the purpose of the report several steps have been taken. As the report has an inductive approach by investigating an existing problem emphasis have been on the preparatory data collection. The data collection has consisted of both primary and secondary data. The primary data have been collected through observations and interviews both within and outside the case company.
Improvements suggestions that could be applied for the method of primary data are to increase the number of interviews and observations. By conducting a higher amount would lead to more points of views and larger span of data. A second improvement would be to conduct measurements in terms of test packaging for every product.
By first collecting primary and secondary data enabled the application of relevant theories. The theoretical approach has been processed through a triangulation method to increase its reliability. The combination of different data collection methods has resulted in answered research questions and a fulfilled purpose.
The secondary data has been analysed by two researchers with no previous experience in the case company’s ERP system. An argument could be made that this might affect the reliability of the data as inconsistencies might have gone unnoticed in the work process. If it were not for the time frame of the project an expert within the system would have been contacted to ensure that potential faulty data was identified.
7.4 Implications and further research To further the study area of uncontrolled materials the researchers suggest that studies within other areas than packaging material is examined with similar approach. Parts of the study, such as the combined product and demand mapping, could be applied in projects with more complex structures. This would increase the knowledgebase of how to structure and control materials that does not follow any system. Furthermore, the reports scope has been to focus on high volume materials and therefore it would be interesting to see the approach applied on low volume products or materials.
Implications case company - By implementing suggested improvement proposals at the case company enables a follow up for further analysing and readjustments. The proposals laid the foundation for more advanced methods which can be applied once the connection to the ERP system is made, for example SERV1. A successful connection would also benefit the operational aspects of inventory handling as it automates certain work procedures.
34
8 References Aronsson, H., Ekdahl, B., & Oskarsson, B. (2004). Modern logistik - För ökad lönsamhet. Malmö: Liber Ekonomi
Bell, J., & Waters, S. (2014). Doing your research project: a guide for first-time researchers. Maidenhead, Berkshire, England: McGraw-Hill Education.
Claesson, A. & Ericsson, E (2006). Effektiv partiformning Retrieved from Divaportal.org http://www.diva-portal.org/smash/get/diva2:4211/FULLTEXT01.pdf
Closs, D., Bowersox, D., Cooper, M., & Bowersox, J. (2013). Supply chain logistics management. New York: McGraw-Hill Education.
Dashchenko, A. (2006). Reconfigurable Manufacturing Systems. New York: Springer.
Ekholm, M., Grahn, A. (2018). Beräkningsmetoder för säkerhetslager. Retrieved from Diva http://www.diva-portal.org/smash/get/diva2:1229645/FULLTEXT01.pdf
Frazelle, E. (2016). World-class warehousing and material handling. New York: McGraw-Hill Education.
Genchi Genbutsu: Go to the Source. (2020, April 19). Retrieved April 26, 2020, from https://kanbanzone.com/resources/lean/toyota-production-system/genchi-genbutsu/
Gustavsson, O., & Strömberg, O. (2018). Direct Material Safety stock standard (A study at IKEA Industry). Retrieved from Lund university http://lup.lub.lu.se/luur/download?func=downloadFile&recordOId=8947082&fileOId=8947090
HARRISON A., 1994, “Just-in-Time Manufacturing”, in “New Wave Manufacturing Strategies: Organizational and Human Resource Management Dimensions” J. Storey (Ed.), Paul Chapman Publishing, London.
Jonsson, P., & Mattsson, S.-A. (2005). Logistik: Läran om effektiva materialflöden. Lund: Studentlitteratur.
Kord, H., Pazirandeh, A. (2008) Comparison of Different Packaging Materials and Solutions on a Cost Basis for Volvo Logistic Corporation. Retrieved from Diva https://www.diva-portal.org/smash/get/diva2:1310850/FULLTEXT01.pdf
Kruse, K. (2016, March 8). The 80/20 Rule And How It Can Change Your Life. Retrieved from https://www.forbes.com/sites/kevinkruse/2016/03/07/80-20-rule/#32f3fd343814
Lean definition, Clarity visual management. (2020). Retrieved 3 March 2020, from https://www.clarityvisualmanagement.com/definition/seiban/
Liker, J., Erkelius, L., & Hallberg, J. (2009). The Toyota way. Malmö: Liber.
Microsoft. (n.d.). Programvara för ekonomihantering: Microsoft Dynamics 365. Retrieved April 30, 2020, from https://dynamics.microsoft.com/sv-se/finance/overview/
35
O'Byrne, R. (2017, October 31). A Definition and Basic Explanation of Warehousing in Supply Chain. Retrieved April 22, 2020, from https://www.logisticsbureau.com/about-warehousing/
OECD (2011), Globalisation, Comparative Advantage and the Changing Dynamics of Trade, OECD Publishing, Paris, https://doi.org/10.1787/9789264113084-en.
Ohno, T. (1988). Toyota Production System beyond Large-scale Production. crc Press.
Johannessen, S., & Solem, O. (2002). Logistics Organizations: Ideologies, Principles and Practice | Emerald Insight. Retrieved 31 March 2020, from https://www.emerald.com/insight/content/doi/10.1108/09574090210806342/full/pdf?title=logistics-organizations-ideologies-principles-and-practice
Patel, R., & Davidson, B. (2019). Forskningsmetodikens grunder: att planera, genomföra och rapportera en undersökning. Lund: Studentlitteratur.
Patil, A. (2018). Factory Automation Market Size and Share.
Petersson, P., Olsson, B., Lundström, T., Johansson, O., Broman, M., Blucher, D., & Alsterman, H. (2015). Lean, Gör avvikelse till framgång (3rd ed.). Bromma: Part Media.
Porter, Michael E. "The Five Competitive Forces That Shape Strategy." Special Issue on HBS Centennial. Harvard Business Review 86, no. 1 (January 2008): 78–93.
Tersine, R. and Toelle, R. (1985). Lot size determination with quantity discounts, Production and Inventory management, 3rd Qtr.
Toomey. J.W. (1996) The Role of Inventory Management. Springer, Boston, MA.
Vad är ERP? (n.d.). Retrieved April 30, 2020, from https://www.epicor.com/sv-se/resource-center/articles/what-is-erp/
Vismaspcs.se. 2018. Likviditet – Vad Är Likviditet?. [online] Available at: <https://vismaspcs.se/ekonomiska-termer/vad-ar-likviditet> [Accessed 30 April 2020].
What is ERP?, Oracle. (2020). Retrieved 3 March 2020, from https://www.oracle.com/applications/erp/what-is-erp.html
Wild, T. (2002). Best practice in inventory management. Oxford .: Butterworth Heinemann.
Zuboff, S. (1988). In the age of the smart machine: The future of work and power. Oxford: Heinemann Professional.
Related Documents