IMPROVEMENT OF LOW FAT CHEDDAR CHEESE TEXTURE USING WHEY PROTEIN ISOLATE AGGREGATES A THESIS SUBMITTED TO THE FACULTY OF THE GRADUATE SCHOOL OF THE UNIVERSITY OF MINNESOTA BY Molly Ann Erickson IN PARTIAL FULFILLMENT OF THE REQUIREMENTS FOR THE DEGREE OF MASTER OF SCIENCE Tonya Schoenfuss, Ph.D. January 2015

Welcome message from author
This document is posted to help you gain knowledge. Please leave a comment to let me know what you think about it! Share it to your friends and learn new things together.
Transcript

IMPROVEMENT OF LOW FAT CHEDDAR CHEESE TEXTURE USING WHEY PROTEIN ISOLATE AGGREGATES
A THESIS SUBMITTED TO THE FACULTY OF THE GRADUATE SCHOOL
OF THE UNIVERSITY OF MINNESOTA BY
Molly Ann Erickson
IN PARTIAL FULFILLMENT OF THE REQUIREMENTS FOR THE DEGREE OF MASTER OF SCIENCE
Tonya Schoenfuss, Ph.D.
January 2015

Molly Ann Erickson 2015

i
Acknowledgements
I would like to thank my advisor, Dr. Tonya Schoenfuss, for her help and
guidance throughout this project. With no previous food experience, I was an
unlikely candidate for a master’s in food science, but, in August of 2012, I was
lucky enough to knock on Dr. Schoenfuss’ door. In accepting me into her lab, Dr.
Schoenfuss gave me the opportunity of a lifetime. I feel very fortunate to have
been able to learn about the field of food science from such an accomplished and
caring mentor. I would also like to thank my committee members, Dr. Baraem
(Pam) Ismail and Dr. Roger Ruan, for their assistance throughout the graduation
process.
A huge thank you goes to Dr. Catrin Tyl, whose reassurance and
guidance gave me the confidence to bring this project to completion. Throughout
countless coffee breaks to discuss food science hot topics and thesis woes, Dr.
Tyl taught me how to be a better scientist. I would like to thank Ray Miller, who
taught me the fine art of cheese making. I couldn’t possibly have had a better
and more knowledgeable teacher. I would also like to thank my coworkers, Liz
Reid, Madeline Brandt, Chelsey Hinnenkamp, Henriett Zahn, and Brian Folger,
for being a great source of help and making the last two years so much fun. In
addition, I would like to thank my mentor, Rusty Nelson, for his guidance and
constant humor. He has given me a wonderful introduction to the world of food
science.
Finally, I would like to thank my friends and family. Throughout my
graduate studies, my husband Justin has shown an unbelievable amount of
support in helping through the tough obstacles. He has listened to my
excitement, troubles, and fun facts with enthusiasm. I would also like to thank my
parents, Paul and Laurie Wernli, who have been nothing but encouraging and
supportive since day one. I would also like to thank Rick and Cindy Erickson for
their unwavering support throughout the past two years.

ii
Dedication
This thesis is dedicated to my parents, Paul and Laurie Wernli, who taught me to
dream big, and to my husband, Justin Erickson, who pushed me to follow
through with those dreams.

iii
Table of Contents
List of Figures ................................................................................................... v
List of Tables .................................................................................................... xi
1. Introduction ................................................................................................... 1 2. Literature Review .......................................................................................... 2 2.1 Improving the Texture of Low Fat Cheddar Cheese ....................... 2 2.1.1. Cheddar Cheese .................................................................. 2 2.1.1.1. Milk Constituents .................................................... 2 2.1.1.2. Cheese-Making Procedure ..................................... 3 2.1.1.3. Cheddar Cheese Characteristics ............................ 5 2.1.1.4. Low Fat Cheddar Cheese Characteristics ............... 6 2.1.1.5. Low Fat Modifications-Cheese Make ...................... 7 2.1.2. Fat Replacers ....................................................................... 8 2.1.2.1. Protein Based Fat Replacers .................................. 9 2.1.2.2. Polysaccharide Based Fat Replacers ................... 11 2.1.2.3. Microparticulated Whey and Processing…………..11 2.1.2.4. Protein:Polysaccharide Based Fat Replacers….....12 2.2. Whey Protein:Polysaccharide Interactions .................................. 15 2.2.1. Whey Protein ...................................................................... 15 2.2.1.1. Structure ............................................................... 15 2.2.1.2. Whey Protein Functionality ................................... 17 2.2.2. Lamdba Carrageenan ........................................................ 19 2.2.2.1. Structure ............................................................... 19 2.2.2.2. Properties ............................................................. 20 2.2.3. Whey Protein:Polysaccharide Interactions ......................... 21 2.3. Rheological Properties of Low Fat Cheddar Cheese and Impact of Whey Protein:Polysaccharide Fat Replacer .............................................. 25 2.3.1. Rheological Measurements ................................................ 25 2.3.2. Gel Formation .................................................................... 28 2.3.3. Understanding Cheese Texture Through Rheology ............ 30 2.3.4. Additional Methods of Evaluating Cheese Texture…….......32 3. Fat Replacer Formulation and Its Impact on Gel Formation Properties .. 34 3.1. Introduction .................................................................................... 34 3.2. Materials and Methods .................................................................. 35 3.2.1. Materials ............................................................................ 35 3.2.2. Pretrial Experiments for Fat Replacer Formulation ............. 36
3.2.3. Determination of Protein:Polysaccharide Interactions Through Gel Electrophoresis ........................................................ 39
3.2.4. Gel Rheological Evaluation…………………………………...41 3.2.5. Statistical Analysis ............................................................. 42 3.3. Results and Discussion ................................................................ 43 3.3.1. Fat Replacers Formulation ................................................. 43 3.3.2. Protein:Polysaccharide Interactions ................................... 56
iv
3.3.3. Gel Properties .................................................................... 62 3.4. Conclusions ................................................................................... 68 4. Fat Replacers in Low Fat Cheddar Cheese…………………..………………68 4.1. Introduction .................................................................................... 68 4.2. Materials and Methods .................................................................. 69 4.2.1. Materials ............................................................................ 69 4.2.2. Cheese Production ............................................................. 70 4.2.3. Compositional Analysis ...................................................... 72 4.2.4. Texture Analysis ................................................................. 72 4.2.5. Microscopy ......................................................................... 75 4.2.6. Statistical Analysis……………………………..………………75 4.3. Results and Discussion ................................................................ 76 4.3.1. Composition ....................................................................... 76 4.3.2. Texture Analysis Using the Texture Profile Analyzer .......... 80 4.3.3. Textural Characterization Using the AR-G2……...………....98 4.3.4. Microscopy.…………………………………………..………..113 4.4. Conclusion ................................................................................... 115 5. Concluding Remarks................................................................................. 117 6. References ................................................................................................. 114 7. Appendix .................................................................................................... 126 7.1. Chapter 3 Extended Methods ...................................................... 126 7.1.1. Fat Replacers Preparation and Particle Size Analysis ...... 126 7.1.2. Gel Electrophoresis .......................................................... 128 7.1.3. Analysis of Gel Formation by Rheology ............................ 131 7.2. Chapter 4 Extended Methods ...................................................... 134 7.2.1. Cheese Production ........................................................... 134 7.2.2. Babcock Method .............................................................. 140 7.2.3. Texture Profile Analysis Method ....................................... 141 7.2.4. Moisture Analysis Method ................................................ 142 7.2.5. Proteolysis Method ........................................................... 144 7.2.6. Protein Method ................................................................. 144 7.2.7. Ashing Method ................................................................. 145 7.2.8. Cheese pH Method .......................................................... 146 7.2.9. Cheese Rheology Method ................................................ 146 7.2.10. Microscopy Method…………………….……………………149 7.2.11. Statistics Code……………………………………………….150

v
List of Figures
Figure 1: Visual description of stress/strain rheometer output. Typical responses
for solids, liquids, and viscoelastic materials (Gunasekaran & Ak, 2003). ... 27
Figure 2: SDS-PAGE process of sample preparation to determine bonding types
................................................................................................................... 41
Figure 3: Analysis of Provon and Perham protein constituents using SDS-PAGE,
run with β-mercaptoethanol ........................................................................ 52
Figure 4: Particle diameter (μm) distribution curves showing percent particles
present for A) Provon with and without λ-carrageenan and B) Perham with
and without λ-carrageenan for specified heating times at 95ºC ................... 54
Figure 5: Protein particles A) Perham Only, B) Provon Only, C) Perham + λ-
carrageenan, D) Provon + λ-carrageenan at varying heat times--clockwise
from black marker: 5 min, 10 min, 15 min, 20 min heat treatment at 95ºC .. 55
Figure 6: A) Perham, with and without λ-carrageenan, without heat treatment B)
Perham, with and without λ-carrageenan, with heat treatment (95ºC for 5
minutes). Lane designations (O, S, P) found in Figure 1. ............................ 60
Figure 7: SDS-PAGE of fat replacers subjected to 1% SDS and BME. Provon
and Perham Only as control. Molecular weights of the molecular marker
listed (kDa). Lane designations as described in Figure 2. ........................... 61
Figure 8: Changes in G’ and G’’ (Pa) of low fat milk with no fat replacers after
rennet addition. Gel point is identified as the G’-G’’ cross over. G’ and G’’
shown in log scale ...................................................................................... 67
Figure 9: Storage modulus (G’) shown during gel formation of low fat milk with
varying levels of fat replacers. ..................................................................... 67
Figure 10: A typical graph with calculations of a texture profile analysis curve
using a two bit compression test for Cheddar cheese (Ltd., 2014) .............. 75
Figure 11: Hasse Diagram of nested design in cheese statistical analysis ........ 76
Figure 12: Box plot of cheese hardness values tested at month 1 (n=3). Full Fat
Control (FF), Low Fat Control (LF), Low fat with high perham fat replacer
addition (Pe H), Low fat with low perham fat replacer addition (Pe L), low fat

vi
with high provon fat replacer addition (Pr H), low fat with low fat replacer
addition (Pr L) ............................................................................................. 85
Figure 13: Box plot of cheese hardness values tested at month 2 (n=3). Full Fat
Control (FF), Low Fat Control (LF), Low fat with high perham fat replacer
addition (Pe H), Low fat with low perham fat replacer addition (Pe L), low fat
with high provon fat replacer addition (Pr H), low fat with low fat replacer
addition (Pr L). ............................................................................................ 85
Figure 14: Box plot of cheese hardness values, month 1 and month 2 testing
combined (n=6). Full Fat Control (FF), Low Fat Control (LF), Low fat with
high perham fat replacer addition (Pe H), Low fat with low perham fat
replacer addition (Pe L), low fat with high provon fat replacer addition (Pr H),
low fat with low fat replacer addition (Pr L). ................................................. 86
Figure 15: Cheese hardness of all cheese samples tested at Month 1 and Month
2 of age....................................................................................................... 86
Figure 16: Box plot of cheese springiness values at month 1 of age (n=3). Full
Fat Control (FF), Low Fat Control (LF), Low fat with high perham fat replacer
addition (Pe H), Low fat with low perham fat replacer addition (Pe L), low fat
with high provon fat replacer addition (Pr H), low fat with low fat replacer
addition (Pr L). ............................................................................................ 87
Figure 17: Box plot of cheese springiness values at month 2 of age (n=3). Full
Fat Control (FF), Low Fat Control (LF), Low fat with high perham fat replacer
addition (Pe H), Low fat with low perham fat replacer addition (Pe L), low fat
with high provon fat replacer addition (Pr H), low fat with low fat replacer
addition (Pr L). ............................................................................................ 87
Figure 18: Box plot of cheese springiness values, month 1 and month 2 testing
combined (n=6). Full Fat Control (FF), Low Fat Control (LF), Low fat with
high perham fat replacer addition (Pe H), Low fat with low perham fat
replacer addition (Pe L), low fat with high provon fat replacer addition (Pr H),
low fat with low fat replacer addition (Pr L). ................................................. 88
Figure 19: Cheese springiness of all cheese samples tested at Month 1 and

vii
Month 2 of age ............................................................................................ 88
Figure 20: Box plot of cheese cohesiveness values at month 1 of age (n=3). Full
Fat Control (FF), Low Fat Control (LF), Low fat with high perham fat replacer
addition (Pe H), Low fat with low perham fat replacer addition (Pe L), low fat
with high provon fat replacer addition (Pr H), low fat with low fat replacer
addition (Pr L). ............................................................................................ 90
Figure 21: Box plot of cheese cohesiveness values at month 2 of age (n=3). Full
Fat Control (FF), Low Fat Control (LF), Low fat with high perham fat replacer
addition (Pe H), Low fat with low perham fat replacer addition (Pe L), low fat
with high provon fat replacer addition (Pr H), low fat with low fat replacer
addition (Pr L). ............................................................................................ 90
Figure 22: Cheese cohesiveness of all cheese samples tested at Month 1 and
Month 2 of age ............................................................................................ 91
Figure 23: Box plot of cheese resilience values at month 1 of age (n=3). Full Fat
Control (FF), Low Fat Control (LF), Low fat with high perham fat replacer
addition (Pe H), Low fat with low perham fat replacer addition (Pe L), low fat
with high provon fat replacer addition (Pr H), low fat with low fat replacer
addition (Pr L). ............................................................................................ 92
Figure 24: Box plot of cheese resilience values at month 2 of age (n=3). Full Fat
Control (FF), Low Fat Control (LF), Low fat with high perham fat replacer
addition (Pe H), Low fat with low perham fat replacer addition (Pe L), low fat
with high provon fat replacer addition (Pr H), low fat with low fat replacer
addition (Pr L). ............................................................................................ 92
Figure 25: Box plot of cheese resilience values of both month 1 and month 2
combined (n=6). Full Fat Control (FF), Low Fat Control (LF), Low fat with
high perham fat replacer addition (Pe H), Low fat with low perham fat
replacer addition (Pe L), low fat with high provon fat replacer addition (Pr H),
low fat with low fat replacer addition (Pr L). ................................................. 93
Figure 26: Cheese resilience of all cheese samples tested at Month 1 and Month
2 of age....................................................................................................... 93

viii
Figure 27: Box plot of cheese adhesiveness values at month 1 of age (n=3). Full
Fat Control (FF), Low Fat Control (LF), Low fat with high perham fat replacer
addition (Pe H), Low fat with low perham fat replacer addition (Pe L), low fat
with high provon fat replacer addition (Pr H), low fat with low fat replacer
addition (Pr L). ............................................................................................ 94
Figure 28: Box plot of cheese adhesiveness values at month 2 of age (n=3). Full
Fat Control (FF), Low Fat Control (LF), Low fat with high perham fat replacer
addition (Pe H), Low fat with low perham fat replacer addition (Pe L), low fat
with high provon fat replacer addition (Pr H), low fat with low fat replacer
addition (Pr L). ............................................................................................ 95
Figure 29: Box plot of cheese adhesiveness values at month 1 and 2 of age
combined (n=6). Full Fat Control (FF), Low Fat Control (LF), Low fat with
high perham fat replacer addition (Pe H), Low fat with low perham fat
replacer addition (Pe L), low fat with high provon fat replacer addition (Pr H),
low fat with low fat replacer addition (Pr L). ................................................. 95
Figure 30: Cheese adhesiveness of all cheese samples tested at Month 1 and
Month 2 of age ............................................................................................ 96
Figure 31: Cheese yield stress as determined by a stress sweep test at 1 month
of age. Full Fat control (FF), Low fat control (LF), Low fat with low Perham fat
replacer (Pe L), Low fat with high Perham fat replacer (Pe H), Low fat with
low Provon fat replacer (Pr L), Low fat with high fat replacer (Pr H). ......... 102
Figure 32: Cheese yield stress as determined by a stress sweep test at 2 months
of age. Full Fat control (FF), Low fat control (LF), Low fat with low Perham fat
replacer (Pe L), Low fat with high Perham fat replacer (Pe H), Low fat with
low Provon fat replacer (Pr L), Low fat with high fat replacer (Pr H). ......... 102
Figure 33: Cheese yield stress as determined by a stress sweep test.
Comparison of all cheeses at month 1 and month 2 of age. ...................... 103
Figure 34: Cheese average G’ as determined by a stress sweep test at 1 month
of age. Full Fat control (FF), Low fat control (LF), Low fat with low Perham fat
replacer (Pe L), Low fat with high Perham fat replacer (Pe H), Low fat with

ix
low Provon fat replacer (Pr L), Low fat with high fat replacer (Pr H). ......... 103
Figure 35: Cheese average G’ as determined by a stress sweep test at 2 months
of age. Full Fat control (FF), Low fat control (LF), Low fat with low Perham fat
replacer (Pe L), Low fat with high Perham fat replacer (Pe H), Low fat with
low Provon fat replacer (Pr L), Low fat with high fat replacer (Pr H). ......... 104
Figure 36: Cheese average G’ as determined by a stress sweep test.
Comparison of all cheeses at month 1 and month 2 of age. ...................... 104
Figure 37: Cheese average G’’ as determined by a stress sweep test at 1 month
of age. Full Fat control (FF), Low fat control (LF), Low fat with low Perham fat
replacer (Pe L), Low fat with high Perham fat replacer (Pe H), Low fat with
low Provon fat replacer (Pr L), Low fat with high fat replacer (Pr H). ......... 105
Figure 38: Cheese average G’’ as determined by a stress sweep test at 2 months
of age. Full Fat control (FF), Low fat control (LF), Low fat with low Perham fat
replacer (Pe L), Low fat with high Perham fat replacer (Pe H), Low fat with
low Provon fat replacer (Pr L), Low fat with high fat replacer (Pr H). ......... 105
Figure 39: Cheese average G’’ as determined by a stress sweep test.
Comparison of all cheeses at month 1 and month 2 of age. ...................... 106
Figure 40: G’ of stress sweep test at 1 month of age. Full Fat control (FF), Low
fat control (LF), Low fat with low Perham fat replacer (Per Low), Low fat with
high Perham fat replacer (Per High), Low fat with low Provon fat replacer
(Pro Low), Low fat with high fat replacer (Pro High). ................................. 106
Figure 41: G’’ of stress sweep test at 1 month of age. Full Fat control (FF), Low
fat control (LF), Low fat with low Perham fat replacer (Per Low), Low fat with
high Perham fat replacer (Per High), Low fat with low Provon fat replacer
(Pro Low), Low fat with high fat replacer (Pro High). ................................. 107
Figure 42: G’ of stress sweep test at 2 months of age. Full Fat control (FF), Low
fat control (LF), Low fat with low Perham fat replacer (Per Low), Low fat with
high Perham fat replacer (Per High), Low fat with low Provon fat replacer
(Pro Low), Low fat with high fat replacer (Pro High). ................................. 107
Figure 43: G’’ of stress sweep test at 2 months of age. Full Fat control (FF), Low

x
fat control (LF), Low fat with low Perham fat replacer (Per Low), Low fat with
high Perham fat replacer (Per High), Low fat with low Provon fat replacer
(Pro Low), Low fat with high fat replacer (Pro High). ................................. 108
Figure 44: Compression test of cheeses at 2.5 months of age. Full Fat control
(FF), Low fat control (LF), Low fat with low Perham fat replacer (Per L), Low
fat with high Perham fat replacer (Per H), Low fat with low Provon fat
replacer (Pro L), Low fat with high fat replacer (Pro H). ............................. 111
Figure 45: Young’s Modulus of cheeses as determined by a compression test at
2.5 months of age. Full Fat control (FF), Low fat control (LF), Low fat with low
Perham fat replacer (Pe L), Low fat with high Perham fat replacer (Pe H),
Low fat with low Provon fat replacer (Pr L), Low fat with high fat replacer (Pr
H). ............................................................................................................. 111
Figure 46: Cheese samples, tested at 2.5 months of age, before and after
compression on the AR-G2 rheometer showing no evidence of fracture. A)
Low Fat Control, B) Perham Low. All other cheese treatments appeared the
same ......................................................................................................... 112
Figure 47: Confocal microscopy images of Cheddar cheese. Protein shown in
green, lipids shown in red. A-Full Fat Control, B-Low Fat Control, C-Low Fat
with Perham Low, D- Low Fat with Perham High, E-Low Fat with Provon
Low, F- Low Fat with Provon High ............................................................ 113
xi
List of Tables
Table 1: Pretrial experiment conditions for protein micropariculation ................. 38
Table 2: Pretrial experimental conditions and observations for protein
microparticulation ........................................................................................ 45
Table 3: Specified composition of the two whey protein isolates as reported by
manufacturer............................................................................................... 51
Table 4: Average band percentage of Provon and Perham protein constituents as
determined by SDS-PAGE and band analysis ............................................ 52
Table 5: Average particle size (µm) of fat replacers (Provon and Perham) with
and without λ-carrageenan at varying heating times ................................... 53
Table 6: Effects of fat replacer protein source and amount added on lowfat milk
gel formation, strength, and fracture rheological properties1 ....................... 66
Table 7: Results of cheese composition testing at month 1 and month 2 of aging
................................................................................................................... 79
Table 8: Analysis of variance summary of cheese composition at month 1 and
month 2 of aging ......................................................................................... 80
Table 9: Cheese texture results as determined by the texture profile analyzer for
months 1 and 2 of testing. Full Fat control (FF), Low Fat control (LF), Low fat
with low perham fat replacer (Per L), low fat with high perham fat replacer
(Per H), low fat with low provon fat replacer (Pro L), low fat with high provon
fat replacer (Pro H). .................................................................................... 83
Table 10: Analysis of variance summary of texture profile analyzer (TPA) values
for cheese ages month 1 and month 2 ........................................................ 84
Table 11: Results of stress sweep test on AR-G2, testing cheese at 1 and 2
months of age. Full Fat control (FF), Low fat control (LF), Low fat with low
Perham fat replacer (Per L), Low fat with high Perham fat replacer (Per H),
Low fat with low Provon fat replacer (Pro L), Low fat with high fat replacer
(Pro H). ..................................................................................................... 101
Table 12: Young’s modulus from compression testing of cheeses at 2.5 months

xii
of age. Full Fat control (FF), Low fat control (LF), Low fat with low Perham fat
replacer (Per L), Low fat with high Perham fat replacer (Per H), Low fat with
low Provon fat replacer (Pro L), Low fat with high fat replacer (Pro H). ..... 112
1
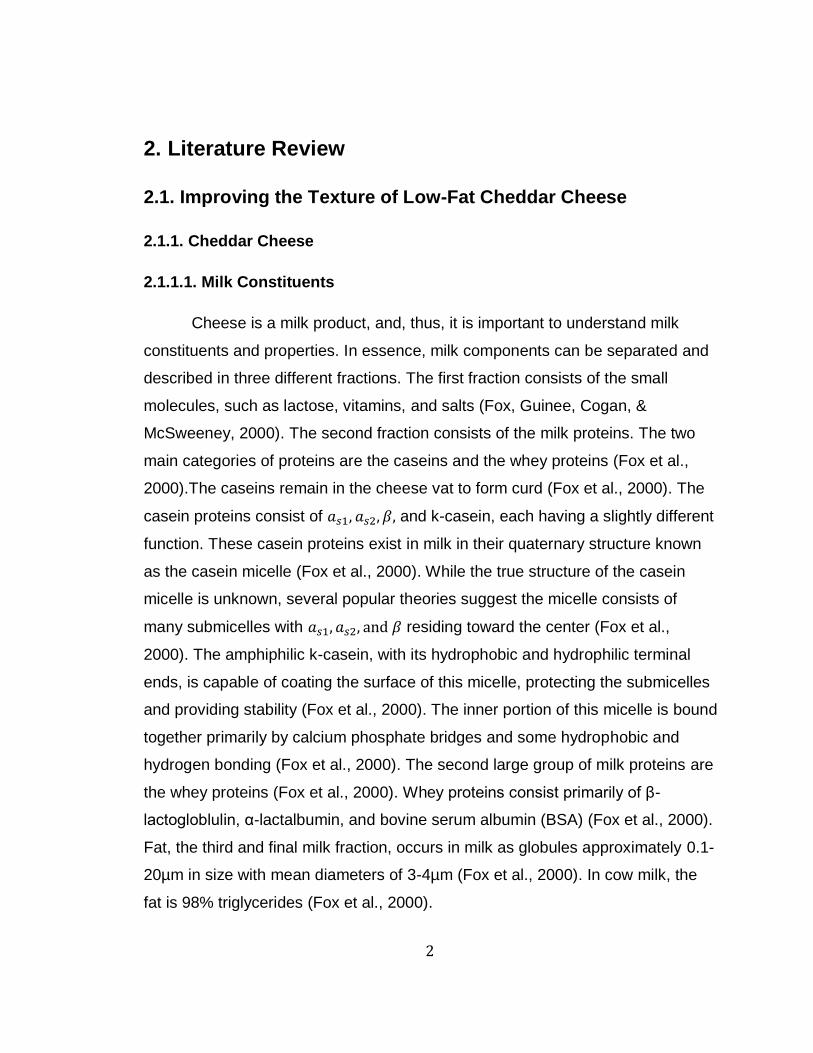
1. Introduction
The U.S. Department of Health and Human Services has issued
recommendations for a healthy diet. The diet recommendations call for eating a
variety of foods, increasing exercise, and, critically, reducing fat intake (Dietary
Guidelines for Americans, 2010). According to the National Health and Nutrition
Survey, 2009-2010, 35.7% of adults in the U.S. are considered obese
(Overweight and Obesity, 2012). In addition, the Centers for Disease Control and
Prevention has warned that obesity can lead to a number of diseases: heart
disease, cancer, and stroke (Overweight and Obesity, 2012). Faced with the
pressure to create healthier products, the food industry has responded with a
myriad of low-fat food options for consumers, received with varying degrees of
success. Designing low-fat foods that meet consumer demands without
compromising flavor and texture can be challenging. Cheese, in particular,
presents numerous challenges as fat is an important and vital ingredient to both
its flavor and texture. Over 50% of the calories in most cheese results from the
fat (Armstrong & Rainey, 1995). Cheese is also a large source of fat in the U.S.
diet. A study by the National Cancer Institute, 2005-2006, indicated that full-fat
cheese contributes 8.5% of saturated fats in the U.S. diet, higher, even, than
sausages and bacon at 4.9%. Cheddar cheese is also one of the most popular
natural cheeses in the U.S.(Serrano, Velazquez, Lopetcharat, Ramirez, & Torres,
2005). According to Food and Drug Administration regulations, a cheese can be
considered low fat when it contains 3g of fat or less per serving (Regulations,
2013). Cheddar cheese has 17g of fat per 50g serving, 66% of which are
saturated fats (O'Connor & O'Brien, 2000). It should be no surprise that Cheddar
cheese has become a target of low-fat research.
2
2. Literature Review
2.1. Improving the Texture of Low-Fat Cheddar Cheese
2.1.1. Cheddar Cheese
2.1.1.1. Milk Constituents
Cheese is a milk product, and, thus, it is important to understand milk
constituents and properties. In essence, milk components can be separated and
described in three different fractions. The first fraction consists of the small
molecules, such as lactose, vitamins, and salts (Fox, Guinee, Cogan, &
McSweeney, 2000). The second fraction consists of the milk proteins. The two
main categories of proteins are the caseins and the whey proteins (Fox et al.,
2000).The caseins remain in the cheese vat to form curd (Fox et al., 2000). The
casein proteins consist of and k-casein, each having a slightly different
function. These casein proteins exist in milk in their quaternary structure known
as the casein micelle (Fox et al., 2000). While the true structure of the casein
micelle is unknown, several popular theories suggest the micelle consists of
many submicelles with residing toward the center (Fox et al.,
2000). The amphiphilic k-casein, with its hydrophobic and hydrophilic terminal
ends, is capable of coating the surface of this micelle, protecting the submicelles
and providing stability (Fox et al., 2000). The inner portion of this micelle is bound
together primarily by calcium phosphate bridges and some hydrophobic and
hydrogen bonding (Fox et al., 2000). The second large group of milk proteins are
the whey proteins (Fox et al., 2000). Whey proteins consist primarily of β-
lactogloblulin, α-lactalbumin, and bovine serum albumin (BSA) (Fox et al., 2000).
Fat, the third and final milk fraction, occurs in milk as globules approximately 0.1-
20µm in size with mean diameters of 3-4µm (Fox et al., 2000). In cow milk, the
fat is 98% triglycerides (Fox et al., 2000).

3
2.1.1.2. Cheese-Making Procedure
Cheese making involves the removal of water from milk, and several steps
are used to allow this to happen, although the processes vary widely depending
on the cheese type. The production begins with milk, which has been
standardized for fat and solids and could also involve heat treating
(pasteurization) (Law & Johnson, 1999). The next step in cheese-making is the
acidification of the milk (Fox et al., 2000). This is done with the addition of a
starter culture, or direct addition of food grade acid. When culture is added, it
ferments the milk’s lactose and produces lactic acid (Fox et al., 2000). When
starter culture is added, it has a dual function: acidification and flavor
development (Fox et al., 2000). In acid coagulated varieties like cottage cheese
and fresh cheeses, the milk is acidified to a pH of 4.6, which causes the
coagulation of the caseins and allows the separation of the soluble milk proteins
(Fox et al., 2000). In this method, acidification by the starter culture is very
important (Fox et al., 2000). In rennet-coagulated cheeses, less acidification is
necessary and acidification is mainly to improve the strength of the rennet gel.
The next step is adding the rennet. Rennet is an enzyme found in the stomach of
calves, and it targets the k-casein surrounding the casein micelle (Fox et al.,
2000). As discussed previously, the amphiphilic nature of k-casein allows it to
protect and stabilize the micelle. The stabilization of the casein micelle in the milk
is compromised as the rennet enzyme hydrolyzes the k-casein at the Phe105-
Met106 bond (Fox et al., 2000). The portion the k-casein that is cleaved is the
hydrophilic caseino macro peptide, also known as glycomacropeptide (GMP)
(Fox et al., 2000). As the enzyme hydrolyzes k-casein, the micelles continue to
destabilize and start to aggregate via mainly hydrophobic interations. Once 85%
or more of the k-casein has been cleaved, the micelles will begin to coagulate,
4
forming a milk gel, trapping fat and expelling whey (Fox et al., 2000).
Initially, the coagulum is a soft gel which traps fat and whey (Law &
Johnson, 1999). As the process continues, the coagulum becomes firmer (Law &
Johnson, 1999). The point in this continuum that the coagulum is cut is crucial to
the final cheese properties. For high moisture fresh cheeses, the curd is not
actually cut but instead scooped out into forms to remove whey. The following is
a discussion of cheeses that are meant to be slightly lower in moisture with a
longer shelf-life. When the coagulum is cut, the curds begin to heal, a process in
which a layer of casein micelles come together at the cut surface, forming a skin
(Law & Johnson, 1999). This skin is porous and is capable of expelling small
whey liquid but continues to trap the large fat particles (Law & Johnson, 1999).
Cutting too early can cause the curd can fracture, producing small curd particles
called fines (Law & Johnson, 1999). These fines will often become lost with the
whey, resulting in lower cheese yield, and can also cause fat loss (Law &
Johnson, 1999). Cutting the curd too late, however, can result in fines because
the curd is not able to heal properly (Law & Johnson, 1999). The size of the curd
is also important. The smaller the curd, the more surface area will be present.
This results in higher amounts of whey expulsion and a lower moisture cheese
(Law & Johnson, 1999).
The next step is stirring and heating the curd. During this time, acid
continues to be produced, the curd becomes firmer, and whey is expelled (Law &
Johnson, 1999). Higher temperatures and lower pH result in greater syneresis,
greater calcium losses, and lower moisture contents (Law & Johnson, 1999).
Agitation of the curd through stirring will also encourage whey expulsion (Law &
Johnson, 1999). After this cooking phase, the whey is removed. This is often
done in stages, allowing the curd to remain warm (Law & Johnson, 1999). The
curd might also be washed with water to further remove lactose. Shaping the
curd into a form can occur by placing them in a mold and letting the force of
gravity knit the curds, or external pressure can be used as in Cheddar cheese
5
production. Salt can be added by either dry salting in the vat or to formed
cheese, or by holding the cheese in a brine solution. The addition of salt
encourages more whey expulsion (Law & Johnson, 1999).
2.1.1.3. Cheddar Cheese Characteristics
The vast variety in cheese is a result of altering one or more steps of the
cheese making procedure. The type of culture, heating rates, acidification, and
others can be adjusted to create the final cheese texture and flavor associated
with a specific variety. In this study, Cheddar cheese will be examined. The
starter cultures for acidifying Cheddar cheese are Lactococcus lactis subs. lactis
and Lactococcous lactis subs. cremoris , either singly or combined (Fox et al.,
2000). Annatto, a food coloring, is often used to give Cheddar its characteristic
light yellow-orange color and it is added to the milk prior to cheese making (Fox
et al., 2000). Another unique characteristic of Cheddar production is the
Cheddaring process. Cheddaring involves the stacking, piling, and rotating of
blocks of curd after the whey is drained (Fox et al., 2000). This process allows
further whey expulsion and additional acidification (Fox et al., 2000). The
stacking of the curd also causes pressure, which encourages the knitting of the
curd, forming the hard texture associated with Cheddar cheese (Fox et al., 2000).
Once the pH has reached approximately 5.4, the stacked, knitted curds are
milled, forming small curds about 2 inches in length (Fox et al., 2000). These
curds are then salted and pressed. There are variations of Cheddar that do not
involve this "Cheddaring" procedure and instead the curds are stirred (stirred
curd Cheddar) until the desired acidity is developed. They could also be washed
with water to reduce the amount of lactose so the cheese is milder and less acid
can be developed (washed curd Cheddar).
Cheddar cheese originated in Cheddar, England but is produced
6
worldwide (Kosikowski & Mistry, 1997). Because of this, a wide variety of flavors
are associated with Cheddar (Kosikowski & Mistry, 1997). Traditional English
Cheddar is often more acidic and develops a sharp flavor whereas American
Cheddar is more clean and bland (Kosikowski & Mistry, 1997). American
Cheddar should have a clean flavor and a smooth texture that breaks down
easily between the fingers (Kosikowski & Mistry, 1997). It is also known to have
walnut notes and minimal gas holes (Kosikowski & Mistry, 1997). In general,
Cheddar is classified as a hard cheese that is internally bacterially-ripened (Fox).
Cheddar is aged anywhere from four to 24 months, developing a sharper flavor
over time (Kosikowski & Mistry, 1997). Cheese curds, fresh from the vat, will be
soft, smooth, and bland (Kosikowski & Mistry, 1997).
2.1.1.4. Low Fat Cheddar Cheese Characteristics
At 9g of fat per 28g serving of Cheddar cheese, it is evident that fat play
will play an important role in cheese structure. This role is best described by the
filled gel model in which cheese is defined as a matrix of proteins disrupted by a
filler (Amelia, Drake, Nelson, & Barbano, 2013). In full fat cheese, the filler is fat,
existing as globules that disrupt the casein matrix, producing an open structure
(Amelia et al., 2013). For the filler gel model, the ratio between casein proteins
and fat is an important factor in determining the final texture of cheese (Amelia et
al., 2013; Mistry, 2001). Without the same amount of fat, the texture is dominated
by the casein proteins, which no longer exists as an open matrix (Amelia et al.,
2013). The fat is no longer able to disrupt casein-casein interactions (Amelia et
al., 2013) The resulting cheese is dense, firm, and rubbery (Amelia et al., 2013;
Law & Johnson, 1999).
Texture is not the only characteristic that suffers in a low-fat cheese. Low-
fat cheese is reported as having low flavor and several off-flavors (Banks &
Weimer, 2007). The cause of this phenomenon is complex. First, fat globules act
as carriers for flavor compounds. In the absence of fat, these compounds are not
present. Starter cultures, initially responsible for acid development, play a key

7
role during cheese ripening as they are capable of proteolysis and flavor
development. (Laloy, Vuillemard, ElSoda, & Simard, 1996). A study by Laloy et
al. suggests a relationship between fat content and starter culture retention. The
study found the 50% reduced fat and fat-free Cheddar cheese to be lower in
starter culture retention and less flavorful as compared to the full-fat cheese
(Haque, Kucukoner, & Aryana, 2007).
The third complaint of low-fat cheese is cost. The methods of cheese
production required to produce a desirable low-fat cheese often result in fat loss
and cheese fines (Law & Johnson, 1999). This, in turn, results in low cheese
yields, driving up the price of low-fat cheese (Law & Johnson, 1999). Solutions to
this problem have included the addition of milk solids in an attempt to increase
yields (Law & Johnson, 1999). While this has found some success, flavor and
texture remain a continuing concern.
2.1.1.5. Low-Fat Modifications- Cheese Make
The majority of the current methods of producing desirable low-fat cheese
involve altering the cheese-make procedure to increase the moisture of the final
cheese. A higher moisture cheese will have a softer texture. Higher moisture can
be achieved in a number of ways. One study found that increasing the
pasteurization temperature of the cheese milk and targeting a higher pH at the
time of milling resulted in a higher moisture Cheddar cheese (Guinee, Fenelon,
Mulholland, O'Kennedy, & O'Briend, 1998). The higher pasteurization
temperature denatures the whey proteins in the milk, which are capable of
binding water (Law & Johnson, 1999). A coagulum that is cut late will have higher
moisture, however, this method results in fat loss and cheese fines (Law &
Johnson, 1999). Washing the curd with cold water is also a method that has
been found successful in increasing moisture content and improving texture
(Mistry, 2001). While many studies have noted the benefits of increasing
moisture in low-fat cheese to improve texture, the result is a bland flavor (Aryana
& Haque, 2001; J. Banks & Weimer, 2007). In addition to low flavor, off flavors

8
such as brothy and bitter have been found in high moisture, low-fat cheeses
during aging (J. Banks & Weimer, 2007). One study found altering cooking
temperature and stirring rates was successful in improving the texture of reduced
fat cheeses, but low-fat cheese remained undesirable (Banks, Brechany, &
Christie, 1989).
Another approach involves increasing the number of fat globules by
reducing their size. The increase in the number of fat globules is thought to be
able to disrupt the casein matrix more often than fewer, larger fat globules (L. E.
Metzger & Mistry, 1995). Indeed, in a study by Metzger et al., homogenization of
the cream was used to reduce fat globule size to 1µm or less. The study
suggests that the smaller fat globules were able to better disrupt the casein
matrix of a reduced fat Cheddar cheese and produce an improved, smoother
texture (Metzger & Mistry, 1995). Homogenization has also been used for
Mozzarella cheese. It was found to improve the appearance of reduced fat
Mozzarella by giving it a whiter color; However, the mozzarella was more difficult
to melt and browned more easily when baked (Rudan, Barbano, Guo, &
Kindstedt, 1998). Another method of reducing fat globule size is through
microfiltration of milk. It was found that microfiltration was capable of reducing fat
globule size in a similar manner as homogenization (Mistry, 2001).
Several other methods attempt to address the flavor issues associated
with low-fat cheese. Preventing too much acid development is important. This
can be done by selecting a slow starter culture, which allows the acid
development to be more easily controlled (Banks & Weimer, 2007). Targeting a
higher pH can be beneficial. At low pH, calcium phosphate will leave the curd but
at higher pH, it will remain (Law & Johnson, 1999). The phosphate is capable of
acting as a buffer, and encouraging to remain in the curd is beneficial for ripening
as it can assist in buffering the pH to prevent the cheese from becoming too
acidic (Law & Johnson, 1999). However, increased Ca in the cheese can cause
the curd to have a firmer texture as is the case with Swiss cheese. The higher

9
moisture content of low-fat cheese can have an adverse effect on starter cultures
(Mistry, 2001). Non-starter cultures and enzymes can be added to encourage
proteolysis , furthering flavor development and encouraging a better texture
(Mistry, 2001).
2.1.2. Fat Replacers
The use of fat replacers in cheese revolves around the idea of the filled
gel model. In the model, fat is the filler, disrupting the casein matrix and
producing an open structure that results in desirable cheese texture (Amelia et
al., 2013). To replace the functions of fat, a different filler may be used in the
hopes of disrupting the casein-casein interactions in a similar manner as fat
(Mistry, 2001). There are two major types of fat replacers: substitutes and
mimetics (Omayma & Youssef, 2007). Substitutes are fat based, yet they do not
have the same caloric value as fat (Omayma & Youssef, 2007). Mimetics are
protein or carbohydrate based and are used to impart a similar functionality as fat
(Omayma & Youssef, 2007). Examples of current commercial fat mimetics
include Simplesse (CPKelco), a microparticulated whey protein, Avicel (FMC
Biopolymer), made from microcrystalline cellulose, and Lita (Opta Food
Ingredients Inc.), which uses corn gluten (Omayma & Youssef, 2007). Cheese is
not the only product that has been attempting to use fat replacers as a way to
improve texture or mouthfeel. Fat replacers will appear in a wide variety of
products from bread to meat (Omayma & Youssef, 2007). These gums, pectins,
starches, and proteins are attempting to mimic fat functionality, and the type of
fat replacer chosen is based on the characteristic that the scientist is attempting
to improve (Omayma & Youssef, 2007).
2.1.2.1. Protein Based Fat Replacers
Protein based fat replacers have been used in many food applications with
varied success. Two common commercial fat replacers, Dairy-Lo (Parmalat
Ingredients) and Simplesse, have been tested in a number of applications

10
(Arango, Trujillo, & Castillo, 2013; Aryana & Haque, 2001; Ma & Drake, 1997;
Romeih, Michaelidou, Biliaderis, & Zerfiridis, 2002). Dairy-Lo is a whey protein
based fat replacer consisting of 35% denatured whey protein and 52% lactose
(Ma & Drake, 1997). In many cases, these whey proteins are chosen for their
ability to bind water, which has been found in numerous studies to produce a
softer texture in cheese (Bastian, 1996; Nurcan & Metin, 2004). In a study of low
fat kashar cheese, both Dairy-Lo and Simplesse were used in an attempt to
produce a better texture (Nurcan & Metin, 2004). Simplesse was able to impart a
softer texture, yet the use of Dairy-Lo showed no improvement (Nurcan & Metin,
2004). The distinction between the two is the microparticulation of whey protein
to make Simplesse, which produces larger particle sizes of 0.1-2µm (McMahon,
Alleyne, Fife, & Oberg, 1996). This finding is consistent with several other cheese
studies, which find the increased particle size necessary for causing
discontinuities in the casein matrix. In a study of low-fat Cheddar cheese,
Simplesse (CPKelco) and Novagel (FMC Biopolymer), a fat replacer made from
microcrystalline cellulose, guar gum, and carrageenan, were both found to break
up the casein matrix (Aryana & Haque, 2001). Novagel, which has a particle size
of 50µm, was able to produce a few large discontinuities, whereas Simplesse, at
an average of 0.75µm, was able to produce many, small discontinuities (Aryana
& Haque, 2001). While Novagel was effective, it was found that Simplesse
actually produced the softer cheese (Aryana & Haque, 2001). A similar finding
was reported for reduced fat Gouda cheese. Due to its increased particle size,
Simplesse was again able to disrupt the dense casein matrix and produce a
softer, more desirable texture (Schenkel, Samudrala, & Hinrichs, 2013). A study
of low-fat Mozzarella also suggests that the improved performance of Simplesse
is due in part to its ability to remain within the curd (McMahon et al., 1996). The
study examined both Dairy-Lo and Simplesse and found that, due to its small
particle size, much of the Dairy-Lo was lost to the whey fraction (McMahon et al.,
1996). In low-fat Manchego cheese, however, Simplesse was found to produce a
harder, undesirable texture (Lobato-Calleros, Robles-Martinez, Caballero-Perez,
11
Aguirre-Mandujano, & Vernon-Carter, 2001). While this approach to low-fat
cheese seems promising, the success is truly marginal and results vary among
different types of cheese.
2.1.2.2. Polysaccharide Based Fat Replacers
Similar to the protein based fat replacers, the use of carbohydrates has
met varying success. In general, carbohydrates are able to impart a softer texture
by binding water and increasing moisture content (Laneuville, Paquin, &
Turgeon, 2000). However, polysaccharides are not truly capable of replacing fat
in structure as they are typically in the form of long chains (Laneuville et al.,
2000). In a study of low fat Cheddar cheese, Novagel was found to improve the
rheological properties but was unable to replace fat in other functional aspects
(Ma & Drake, 1997). Another study of low fat Cheddar found similar results in
that Novagel was able to disrupt the casein matrix due to its large particle size
(Aryana & Haque, 2001). However, as discussed previously, it was not as
successful in improving texture as Simplesse, which has more numerous, smaller
particles (Aryana & Haque, 2001). A study of low fat Mozzarella also found the
large particle size of Novagel to be beneficial in opening the casein matrix, and it
was found to bind more moisture than the protein based fat replacers (McMahon
et al., 1996). Another fat replacer made of inulin, Raftiline (Orafti), improved the
texture of low fat kashar cheese, but, after 30 days, the texture became too soft
and the cheese developed off-flavors (Nurcan & Metin, 2004).
2.1.2.3. Microparticulated Whey and Processing
As discussed previously, some success in protein based fat replacers has
been seen in the use of micorparticulated whey. Microparticulation is the process
of adjusting the particle size of protein, typically using high heat to denature and
shearing to the desired aggregate size (Onwulata, Konstance, & Tomasula,
2002). As will be discussed in later sections, the aggregation of whey protein can
be difficult to control (Laneuville et al., 2000). Without denaturation and

12
aggregation, whey protein exists as very small particles. Once denatured and
aggregated, however, very large particles will form (Laneuville et al., 2000). The
particle size of the protein used in fat replacement is very important as it can
affect the sensory properties it is imparting. For instance, below 0.1μm, proteins
are perceived as watery (Bhushan). However, above 10μm, the particles will be
perceived as gritty (Bhushan). The ideal range is between 0.1-3μm, where the
particles are perceived as creamy and can impart a desirable texture in a food
system (Bhushan).
Microparticulated whey protein can be produced in several ways, and
some commercial microparticulated whey proteins are available. SPX Flow
Technologies uses a shear agglomerator to produce a microparticulated whey
they call Lean Creme (Corporation, 2014). This process involves passing a 60%
whey protein concentrate product through a plate heat exchanger and then
through their shear agglomerator (Corporation, 2014). SPX Flow Technologies
reports a number of applications for their Lean Creme, from dairy beverages and
salad dressings to cheese (Corporation, 2014). GEA Liquid Processing also
produces equipment for the production of microparticulated whey. Their Micro
Formula machinery produces a microparticulated whey that they report as
creamy, white, and has a particle size between 1-10μm (Bhushan). CP Kelco has
produced a commercial whey protein concentrate called Simplesse (Kelco,
2014). They also report producing the microparticulated whey protein through a
heating and shearing process which produces a particle size around 1μm (Kelco,
2014).
2.1.2.4. Protein:Polysaccharide Based Fat Replacers
Although the careful heating and shearing of whey protein is a common
method of producing microparticulated whey, it is not the only method in which
the aggregate size of whey protein can be controlled. As protein and
carbohydrate based fat replacers alone have found varying degrees of success
in reduced and low-fat cheese production, recent research has begun to explore

13
the possibility of a combination, producing a protein:carbohydrate based fat
replacer (Ledward, 1993). This method has the possibility of incorporating the
functionalities of both proteins and carbohydrates as well as producing new
characteristics through interactions. Proteins and carbohydrates can interact in a
number of ways. In general, proteins and carbohydrates can be involved in two
types of interactions. The first is thermodynamic incompatibility, in which the
properties of the proteins and carbohydrates, for example, similar charges,
causes a phase separation (Laneuville et al., 2000). In thermodynamic
incompatibility, the protein and carbohydrate are separated, isolated in their own
phases within the system (Laneuville et al., 2000). Thermodynamic compatibility
describes a system in which the proteins and carbohydrates can exist in one
phase (Laneuville et al., 2000). It is possible for the proteins and carbohydrates
to exist in the same phase but not interact. However, if they do interact, it is
known as complex coacervation, which is typically due to the interaction between
an anionic polysaccharide and a positively charged protein (Laneuville et al.,
2000). Each of these systems can be altered through the manipulation of pH, salt
content, and protein to carbohydrate ratio (Laneuville et al., 2000). Several
studies have noted the existence of these interactions and the possibility of new
functionalities being produced. A study of whey protein and dextran conjugates
found that the complex between these two was able to produce better
emulsification properties than whey protein or general emulsifier alone (Akhtar &
Dickinson, 2003). This complex was achieved through a combination of heat
treatment and optimizing the whey protein to dextran ratio (Akhtar & Dickinson,
2003). Another study found the conjugation of whey protein with pectin was able
to improve the solubility of the protein at low pH as well as increase
emulsification and gelling properties (Mishra, Mann, & Joshi, 2001).
A common benefit reported for carbohydrate addition to whey protein is
the improved stability of the whey protein and reduced aggregation (Laneuville et
al., 2000; Zhang & Foegeding, 2003). Whey proteins can work well as fat
replacers because their shape and size when aggregated are capable of

14
replacing fat better than the long-chained carbohydrates (Laneuville et al., 2000).
However, whey protein aggregation can be difficult to control and achieving the
correct particle size is essential in producing a successful fat replacer, as in the
production of microparticulated whey (Laneuville et al., 2000). A particle size of
.1-10µm is targeted and any aggregates above 40µm are avoided as this is the
size at which the particles can be detected in the mouth (Laneuville et al., 2000).
A carbohydrate can be used to control the aggregation of whey protein in one of
two ways. First, the carbohydrate can increase the viscosity of the system,
reducing mobility and thus the possibility of protein-protein interactions
(Laneuville et al., 2000). Second, the carbohydrate could interact with the protein
itself, blocking the active site that would be used in protein aggregation
(Laneuville et al., 2000). A study of whey protein in the presence of either
carrageenan, dextran, or dextran sulfate found low concentrations of sulfated
polysaccharides to be successful at decreasing protein aggregation (Zhang &
Foegeding, 2003). The work suggests that dextran sulfate was able to prevent
this aggregation by preventing the exposure of whey protein’s hydrophobic
interior and the presence of sulfate groups played a role in decreasing
aggregation (Zhang & Foegeding, 2003). The correct ratio of whey protein to
polysaccharide must be researched carefully, however, as the study found that
higher concentrations of polysaccharide actually increased aggregation, causing
phase separation (Zhang & Foegeding, 2003).
Thus far, the possibility of a protein:carbohydrate combination fat replacer
and its applications has not been thoroughly researched. One study of
carrageenan and whey protein explored this possibility and found that the mixture
was able to produce improved sensory qualities for a low fat yogurt product
(Shenana, El-Nagar, El-Shibiny, & Abdou, 2007). Protein:carbohydrate
combinations have shown to have unique properties and functionalities, making
them promising as potential fat replacers. However, their applications in food
products need to be further explored.

15
The incorporation of a microparticulated protein:carbohydrate fat replacer
into a cheese matrix could result in a number of outcomes. As stated previously,
the idea of a fat replacer revolves around it behaving as a filler within the cheese
matrix. Whether or not this filler is interacting with the matrix can have an effect
on the textural outcomes (Luyten & van Vliet, 1990). Luyten et al. found those
filler gel particles which interacted with food matrices produced firmer gels. A
similar idea is presented in an article by Yang et al. This research suggests that a
filler can behave either as active or inactive (Yang, Rogers, Berry, & Foegeding,
2011). An active filler is one that will interact with the surrounding matrix. If the
filler is firmer than the matrix, it will impart strength (Yang et al., 2011). Inactive
fillers will not impart strength (Yang et al., 2011).
2.2. Understanding Whey Protein:Polysaccharide Interactions
2.2.1. Whey Protein
2.2.1.1. Structure
Whey is a by-product of cheese production (Schmidt, Packard, & Morris,
1984). Acid whey is produced from acid coagulated cheese varieties such as
cottage cheese, Greek yogurt, and some fresh cheeses. "Sweet whey is
produced from rennet-coagulated cheese and it is called sweet because it has
less lactic acid in the whey (Schmidt et al., 1984). The primary proteins in whey
are β-lactoglobulin (BLG), α-lactalbumin, bovine serum albumin (BSA), and
immunoglobulins (Fox et al., 2000). In sweet whey, glycomacropeptide is also
present due to the rennet coagulation process (Etzel, 2004). Directly after
production, sweet whey and acid whey are primarily water (Law & Johnson,
1999). In order to achieve individual fractions, further processing is needed (Law
& Johnson, 1999). Whey protein concentrate, which is 30-80% protein, is
16
produced through ultrafilatration with the addition of diafiltration for the higher
concentrations of protein (Abd El-Salam, El-Shibiny, & Salem, 2009). The protein
is then concentrated using evaporation (Abd El-Salam et al., 2009). Whey protein
isolate, which has a protein content equal or higher than 90%, is produced
through ion exchange chromatography or microfiltration. The specialized
processing is required to remove the small amounts and fat and lactose that still
remain, and further lower the mineral concentration. The method in which each
protein is produced may play a role in the ultimate behavior of the proteins.
Provon 190 (Glanbia Nuritionals) and Perham (Bongard’s Creameries), whey
protein isolates, are produced through cross flow microfiltration, which is a
combination of micro and ultra-filtration (Punidadas & Rizvi, 1998). Microfiltration
is used to remove fat and ultrafiltration further concentrates the whey protein
(Fox et al., 2000). The term cross flow describes the way in which the whey
passes over the membrane, which is parallel in cross flow microfiltration as
opposed to perpendicular (Belfort, Davis, & Zydney, 1994). Differences in whey
protein constituents has been found to produce different types of aggregates
(Havea, Singh, & Creamer, 2001).
Whey proteins have a globular structure (Fox et al., 2000). The
interactions of BLG are largely controlled by its structure. BLG consists primarily
of β-sheets, which have folded to bury the hydrophobic region of the protein
(Swaisgood, 1996). However, a small hydrophobic region remains on the surface
of the folded protein, which aids in the interaction between the protein and small
hydrophobic molecules (Swaisgood, 1996). Disulfide bonds and a sulfhydryl
group are also buried when BLG is folded (Swaisgood, 1996). When denatured,
the sulfhydryl group is exposed and sulfhydryl-disulfide interchange reactions
have the potential to occur (Swaisgood, 1996). The state of BLG is very
dependent on pH and temperature (Swaisgood, 1996). BLG can be irreversibly
denatured at high temperatures, a property important for milk processing
(Swaisgood, 1996). At a pH above 7.5, BLG exists as a monomer (Swaisgood,
1996). At milk pH, around 6.7, the protein becomes a dimer (Swaisgood, 1996).
17
At lower pH, between 3.5 and 5.2, BLG becomes an octomer (Swaisgood, 1996).
At very low pH, below 3.5, whey protein exists, again, as a monomer
(Swaisgood, 1996).
The other major whey protein, α-Lactalbumin has similar properties to
BLG. It is also a globular protein (Swaisgood, 1996). α-Lactalbumin denatures at
a lower temperature than BLG; however, unlike BLG, this reaction is reversible if
the temperatures remain low (Swaisgood, 1996). Also, unlike BLG, α-
Lactalbumin contains primarily α-helices (Swaisgood, 1996).
2.2.1.2. Whey Protein Functionality
Whey proteins are chosen as additional ingredients in food products for a
number of reasons. They are highly nutritious and can improve the nutritive value
of a product (Abd El-Salam et al., 2009). They are also considered safe to use
and are recognizable and perceived positively by consumers (Abd El-Salam et
al., 2009). Most importantly, they posesses many functional properties that can
be manipulated until desired qualities are obtained (Abd El-Salam et al., 2009). In
general, whey proteins are known for their ability to emulsify, foam, whip, and gel
(Foegeding, Davis, Doucet, & McGuffey, 2002). These properties can be
changed through hydrolyzing the proteins, denaturing or aggregating them, or
attaching them to carbohydrates (Foegeding et al., 2002). The collective
properties of whey proteins lie in their constituents. For instance, BLG has good
emulsifying, foaming, and gelling properties whereas α-lactalbumin does not
have good gelling properties (Abd El-Salam et al., 2009). The ratio of these two
proteins will affect final functionality. The way in which the whey protein
ingredient is produced will have a profound effect. Whey protein produced by
microfiltration, which yields higher concentrations of glycomacropeptide, can
exhibit weaker emulsification and gelling properties whey protein produced with a
lower concentration of glycomacropeptide.
Whey protein isolates are produced through either micro or ultra

18
filtration or through ion exchange (Smith, 2008). All of these processing methods
involve concentrating the starting material, whey, to produce whey protein
isolate. Whey protein isolate is typically produced from sweet whey, which is the
waste stream from a dairy product made with rennet (Smith, 2008). Compared to
acid whey, sweet whey will have less lactose converted to lactic acid, and is,
thus, a less acidic product (Smith, 2008). This starting sweet whey product will
contain approximately 13% protein, 73% lactose, 5% moisture, 8% ash, and 1%
ash (Smith, 2008). In making whey protein isolate, this sweet whey product has
been filtered and concentrated to a point in which at least 90% whey protein is
present (Smith, 2008).
Perham and Provon are both whey protein isolates but may behave
differently due to differences in processing conditions and protein constituents.
Provon 190, produced by Glanbia Nutritionals, is processed using a cross-flow
microfiltration system (Nutritionals, 2014). It contains all the whey protein
constituents in their undenatured state and is produced by sweet dairy whey
(Nutritionals, 2014). Provon contains 92% protein, on a dry basis, 3% ash, and
3.72% moisture (Nutritionals, 2014). It also contains less than 1% lactose and
less than .7% fat (Nutritionals, 2014). Perham is processed through micro and
ultra filtration (Wilkinson & Boutiette, 2013). The Perham whey protein isolate
used in this research was instantized and, thus, contains soy lecithin at less than
1.5% (Smith, 2008).
Much of the functional properties of whey proteins lie in their ability to
denature. Left denatured, their hydrophobic and hydrophilic regions allow them to
be good emulsifiers and foaming agents as they can lie at an interface (Schmidt
et al., 1984). If they are allowed to aggregate, further functionalities are achieved
as is evidenced by the commercial microparticulated whey protein fat replacer,
Simplesse (Lieske & Konrad, 1994). The heat denaturing process of BLG, the
protein that is typically present in the highest concentration, occurs in three
stages. First, BLG dissociates from dimers into monomers (Abd El-Salam et al.,
19
2009). This stage exposes an inner free sulfhydryl group (Abd El-Salam et al.,
2009). Next, the exposed sulfhydryl groups becomeaq involved in sulfhydryl
disulfide bonding, creating BLG aggregates (Abd El-Salam et al., 2009). The
aggregates cease to form when reactive groups are no longer available (Abd El-
Salam et al., 2009). Heat denaturation begins between 60-70ºC, with whey
protein fully denatured when exposed to temperatures of 90ºC for ten minutes
(Fox et al., 2000). Many factors affect protein aggregation including the
temperature exposure, pH, and protein concentration (Abd El-Salam et al.,
2009). For instance, a higher protein concentration yields larger aggregates as
does a higher pH (Abd El-Salam et al., 2009). In the realm of cheese making,
when BLG is denatured, it is capable of remaining within the cheese curd
(Swaisgood, 1996). Within the cheese curd, the BLG can bind to k-casein, which
may have an adverse effect on curd formation (Swaisgood, 1996). Therefore, the
quantity of denatured whey protein added to cheese milk must be minimized in
order to obtain a firm gel and moisture control for aged cheeses.
All of these functional properties lead to whey protein’s use in a number of
food products. These include breads, beverages, ice cream, and meat products
(Swaisgood, 1996). For a product requiring a good emulsifier, an undenatured
whey protein is best (Swaisgood, 1996). A whey protein product with fewer lipids
will be better for foaming or whipping (Swaisgood, 1996). In these ways, whey
protein can be manipulated and used in a number of applications.
2.2.2. Lambda Carrageenan
2.2.2.1. Structure
Carrageenans are extracted from the Rhodophyceae seaweed (Necas &
Bartosikova, 2013). Within the seaweed, carrageenans provide structure to the
plant (Imeson, 2000). This property, providing rigidity and structure, is what
makes carrageenans so valuable to the food industry. There are three main

20
types of carrageenans: kappa, iota, and lambda (Imeson, 2000). Each has a
unique set of properties, set apart by slight differences in structure. In general,
carrageenans are large, linear polysaccharides with repeating galactose units,
several sulfate groups, and a typical molecular weight of 400-560kDa (Imeson,
2000).
The differences between kappa, iota, and lambda carrageenan are the
varying levels of 3,6-anhydrogalactose and sulfate groups (Imeson, 2000).
Kappa has a 3,6-anhydrogalactose level of 34% and the lowest level of sulfate
groups at 25% (Imeson, 2000). Iota carrageenan contains slightly more sulfate
groups at 32% and 30% 3,6-anhydrogalactose (Imeson, 2000). Lambda
carrageenan has the most sulfate groups at 35% and no 3,6-anhydrogalactose
(Imeson, 2000). These subtle changes in chemical structure produce large
differences in function.
2.2.2.2. Properties
The properties of carrageenan depend upon the type. In general,
carrageenans are known for their thickening and gelling properties (Imeson,
2000). Kappa carrageenan can produce hard gels, iota carrageenan makes
softer, more stable gels, and lambda carrageenan is only capable of thickening
and increasing viscosity (BeMiller & Whistler, 1996; Imeson, 2000). Kappa
carrageenan produces stronger gels in the presence of potassium ions and iota
carrageenan will interact with calcium ions (Imeson, 2000). Lambda carrageenan
is largely unaffected by the presence of salts (Imeson, 2000).
The functionality of carrageenans may also depend on the interactions.
These interactions are largely fueled by the presence of the anionic sulfate
groups, causing electrostatic interactions (Necas & Bartosikova, 2013).
Carrageenans are most often used as stabilizers and emulsifiers. Kappa
carrageenan is used in a number of dairy products to prevent whey separation as
well as to disperse and stabilize cocoa particles in chocolate milk (Necas &

21
Bartosikova, 2013). A carrageenan gel has also been used in pasteurized
cheese to improve meltability and slicing (Imeson, 2000). Carrageenans appear
in a number of foods, from meat products and dog food to dressings and milk
(Imeson, 2000). Their functional properties and potential to interact with proteins
make them a great candidate for a number of applications.
2.2.3. Whey Protein:Polysaccharide Interactions
As mentioned previously, when protein and polysaccharides are mixed, a
number of interactions could occur, making protein:polysaccharide mixtures
suitable candidates for fat replacers. The promise of a protein:polysaccharide
mixture is not entirely new and various combinations have been studied in years
past. The most common type of interaction between proteins and
polysaccharides is electrostatic (Goh, Sarkar, & Singh, 2009). However other
interactions could occur, including hydrogen and some covalent bonding (Goh et
al., 2009). The type of interaction relies heavily on the conditions the mixture is
exposed to. These conditions include changes to pH, ionic strength, temperature,
protein:polysaccharide mixing ratio, and solids content. In a study of xanthan
gum and whey protein complexes, it was found that mixing ratios played a large
part in final complex properties (Laneuville et al., 2000). Complexes produced
from a whey protein:xanthan gum mixture of 5:1 produced small particle sizes of
20μm or less (Laneuville et al., 2000). In addition, a study of the different
fractions found that the xanthan gum and whey protein were indeed interacting
with each other at this ratio (Laneuville et al., 2000). The article suggested this
interaction was electrostatic in nature due to the reduced pH of the mixture
(Laneuville et al., 2000). In this same study, a whey protein:xanthan gum mixture
of 20:1 produced very large particles, measuring 300μm and above (Laneuville et
al., 2000). An analysis of this mixture found that the xanthan gum and whey
protein were not interacting. Rather, at this high protein ratio, the protein had
preferentially formed protein:protein aggregates instead of interacting with the
xanthan gum (Laneuville et al., 2000). The study did suggest, however, that
22
particle sizes would have been even higher at this ratio had xanthan gum not
been present (Laneuville et al., 2000). They reported that although the xanthan
gum was not directly interacting with the whey protein, it was reducing protein
aggregation by increasing the viscosity of the mixture, thus reducing the potential
for protein:protein collisions (Laneuville et al., 2000). A similar result was found in
a study of whey protein:dextran complexes (Zhu, Damadoran, & Lucey, 2008).
The study was able to covalently bond whey protein and dextran through heat
and reported reduced aggregation of whey protein due to its conjugation with the
dextran (Zhu et al., 2008). Further studies report additional interactions with whey
proteins. One study found whey protein to interact with pectin through hydrogen
bonding when mixed at a ratio of 1:1 (Kovacova, Synytsya, & Stetina, 2009).
Another study found that different conditions produced covalent bonding between
whey protein and pectin (Mishra et al., 2001). All of these studies show how
minor changes in conditions can drastically affect the outcome of a
protein:polysaccharide complex.
Lambda carrageenan, in particular, has been of interest in research. Due
to its three sulfate groups, it is an ideal candidate for protein complexation
through electrostatic interactions. A study on the complexation of a commercial
whey protein product and lambda carrageenan found electrostatic interactions
occurring across many pH levels (Weinbreck, Nieuwenhuijse, Robijn, & de Kruif,
2004). Below the isolectric point of whey protein, which is approximately pH 5.2,
the protein is positive and readily interacted with the lambda carrageenan
(Weinbreck et al., 2004). Above this point, some positive patches remain on the
protein’s surface and lambda carrageenan was still able to interact (Weinbreck et
al., 2004). The study also found that a small amount of NaCl encouraged
complexation (Weinbreck et al., 2004). Because lambda carrageenan is such a
highly charged polysaccharide, the whey protein is unable to bind
electrostatically to all the available sites (Weinbreck et al., 2004). The addition of
NaCl was found to block some of the sites on lambda carrageenan, reducing
repulsion (Weinbreck et al., 2004). Another study reported interactions between

23
lambda carrageenan and β-lactoglobulin that caused a decrease in protein
aggregation (Zhang, Foegeding, & Hardin, 2004). After studies of protein
denaturation using differential scanning calorimetry, it was found that the
presence of lambda carrageenan raised the denaturation temperature of β-
lactoglobulin (Zhang et al., 2004). K-Carrageenan has also been studied and its
effects on whey protein aggregation found to be similar to lambda carrageenan.
One study found the presence of k-carrageenan reduced the molecular weight of
whey protein aggregates and suggested this phenomenon occurred due to
increased viscosity of the mixture, reducing protein:protein collisions (de la
Fuente, Hemar, & Singh, 2003). Yet another study confirms this phenomenon as
they report the decreased aggregation of whey protein by k-carrageenan even at
neutral pH (Fiett & Corredig, 2009). While k-carrageenan has found to be
successful in reducing whey protein aggregation and participating in interactions,
a study involving the interaction of whey proteins with the three most common
carrageenan, kappa, iota, and lambda, found lambda to be the most active due
to its three sulfate groups (Stone & Nickerson, 2012).
How the mixture is interacting with itself will determine how available it is
to interact with its surroundings once it has been incorporated into a cheese
matrix as a fat replacer. Just as the polysaccharides may or may not be
interacting with the whey protein, possible interactions could occur with other
available milk proteins. A study of fat replacers in Cheddar cheese by Drake et
al., found that k-carrageenan interacting with casein micelles produced a
smoother cheese matrix (Ma & Drake, 1997). Yet another study examined the
effect that whey proteins had on casein micelles and the resulting properties of
the gel that was formed (Schorsch, Wilkins, Jones, & Norton, 2001). This study
consisted of two parts: adding the whey protein prior to denaturation and adding
the whey protein after it had been denatured and aggregated (Schorsch et al.,
2001). It was found that non-aggregated protein did not associate with the casein
at temperatures of 20ºC and the gel that formed had the properties of a typical
casein gel (C. Schorsch et al., 2001). The pre-denatured, aggregated protein
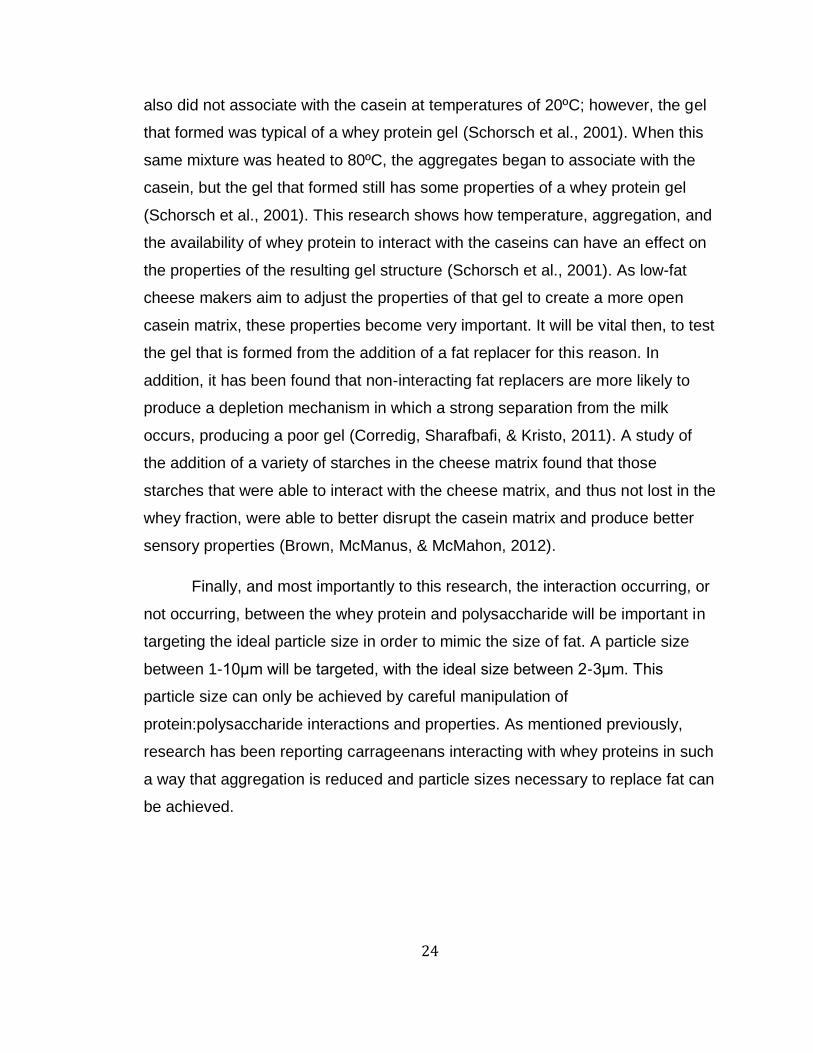
24
also did not associate with the casein at temperatures of 20ºC; however, the gel
that formed was typical of a whey protein gel (Schorsch et al., 2001). When this
same mixture was heated to 80ºC, the aggregates began to associate with the
casein, but the gel that formed still has some properties of a whey protein gel
(Schorsch et al., 2001). This research shows how temperature, aggregation, and
the availability of whey protein to interact with the caseins can have an effect on
the properties of the resulting gel structure (Schorsch et al., 2001). As low-fat
cheese makers aim to adjust the properties of that gel to create a more open
casein matrix, these properties become very important. It will be vital then, to test
the gel that is formed from the addition of a fat replacer for this reason. In
addition, it has been found that non-interacting fat replacers are more likely to
produce a depletion mechanism in which a strong separation from the milk
occurs, producing a poor gel (Corredig, Sharafbafi, & Kristo, 2011). A study of
the addition of a variety of starches in the cheese matrix found that those
starches that were able to interact with the cheese matrix, and thus not lost in the
whey fraction, were able to better disrupt the casein matrix and produce better
sensory properties (Brown, McManus, & McMahon, 2012).
Finally, and most importantly to this research, the interaction occurring, or
not occurring, between the whey protein and polysaccharide will be important in
targeting the ideal particle size in order to mimic the size of fat. A particle size
between 1-10μm will be targeted, with the ideal size between 2-3μm. This
particle size can only be achieved by careful manipulation of
protein:polysaccharide interactions and properties. As mentioned previously,
research has been reporting carrageenans interacting with whey proteins in such
a way that aggregation is reduced and particle sizes necessary to replace fat can
be achieved.
25
2.3. Rheological Properties of Low Fat Cheddar Cheese and
Impact of Whey Protein:Polysaccharide Fat Replacer
2.3.1. Rheological Measurements
To consider adding a fat replacer to improve the texture of a low-fat
cheese, the methods in which the final cheese will be evaluated needs to be
considered. A true sensory test can be expensive and time consuming to conduct
(Drake, Gerard, Truong, & Daubert, 1999). Instrumental techniques can also be
used to evaluate textural characteristics. A very common method for cheese is to
use texture profile analysis, a repeated compression method , which measures
general terms such as hardness, cohesiveness, and adhesiveness which can be
related to sensory methods. This method takes the cheese to its fracture point.
While this method provides valuable results, rheological measurements using
small oscillatory shear deformation can also provide insight into cheese texture.
Both cheese and the renneted milk gels are viscoelastic materials and the
rheological properties of both will be discussed in this section. A viscoelastic
material will exhibit both elastic and viscous properties (Gunasekaran & Ak,
2003). The three parameters involved with most rheological measurements are
stress, strain, and their relationship with time (Gunasekaran & Ak, 2003). Stress
can be thought of as the amount of force applied whereas strain is related to the
deformation of the sample (Gunasekaran & Ak, 2003). The responses used to
describe the texture of cheese and cheese gels are the shear moduli: storage
modulus, indicated by G’, and loss modulus, G’’ (Tunick, 2000). G’ will be a
measure of elasticity or the amount of energy stored (Tunick, 2000). G’’ is a
measure of viscosity or the amount of energy lost (Tunick, 2000). Two other
variables that describe different ratios of G’ and G’’ are known as phase angle
and tan δ (Gunasekaran & Ak, 2003). These terms will be used to describe the
types of tests that can be performed with cheese and milk gels as well as the
results and how they relate to cheese texture. The equations used to derive G’

26
and G’’ are shown in Equation 1. For both equations, the stress (σ) is divided by
the strain (γ). The typical responses of stress and strain on solids, liquids, and
viscoelastic materials is shown in Figure 1. The phase angle (δ) between the
stress and strain curves will affect the resulting G’ and G’’ responses. When
testing with small amplitude oscillatory shear, the testing is being performed
within the material’s linear viscoelastic (LVE) region (Gunasekaran & Ak, 2003).
As mentioned previously, testing within the LVE region will be non-destructive
and requires working with very small oscillatory movements (Gunasekaran & Ak,
2003). These techniques can be used to understand many different types of
materials. In this section, the use of rheology in studying gel formation and
cheese texture will be examined.

27
2.3.2. Gel Formation
Equation 1: Determination of G’ and G’’ from stress (σ) and strain (γ) responses (Gunasekaran & Ak, 2003).
ωt
δ=π/2
ωt
Strain Stress
δ=0
ωt
0<δ<π/2
Hookean Solid
Viscoelastic Material
Newtonian Liquid
Figure 1: Visual description of stress/strain rheometer output. Typical responses for solids, liquids, and viscoelastic materials (Gunasekaran & Ak, 2003).
28
2.3.2. Gel Formation
The incorporation of a fat replacer into milk may have adverse effects on
the resulting cheese coagulum. In order to determine how the fat replacer will
behave, it is vital to understand characteristics of the gel, and using rheology
may help elucidate the process of gel formation. As discussed previously, the
process of rennet coagulation begins with the cleavage of k-casein and
subsequent destabilization and aggregation of the casein micelles (Fox et al.,
2000). This process, from milk to gel, results in a dramatic change in the
viscoelastic properties.
The two common tests for understanding gelation properties involve the
determination of the gel point and determining the strength of the resulting gel.
Studies in which gelation point has been determined begin by adding a small
amount of milk into a coaxial cylinder attachment on a rheometer (Choi, Horne, &
Lucey, 2007; John A. Lucey, Tamehana, Singh, & Munro, 2000; Srinivasan &
Lucey, 2002). This cylinder inside of a cylinder attachment allows the milk and
rennet to sit inside the lower, stationary cylinder while the other cylinder rotates in
the milk and measure the force applied to it by the milk. The inverse also occurs
in some rheometers where the outer cylinder rotates, while the inner one is
stationary and measures the force the material applies to it. This force is
measured in Pa. The gelation point can be interpreted differently, but, typically, it
is described as the point at which a crossover in G’ and G’’ occurs and there is a
phase angle of 45º (Gunasekaran & Ak, 2003). At first, the milk and rennet will
exhibit more viscous properties and the G’’ will be higher (Gunasekaran & Ak,
2003). At the point of gelation however, the gel will be exhibiting more elastic
properties than viscous, and, thus, the G’ will increase (Gunasekaran & Ak,
2003). The G’ and G’’ will continue to increase as the gel becomes firmer, which
can be an indication of gel strength (Gunasekaran & Ak, 2003). Additional tests
can be conducted to test gel strength by applying a constant shear rate and

29
measuring the point at which the gel fractures (Srinivasan & Lucey, 2002).
Several studies have examined gelation properties of both acid and
rennet-induced gels. A study by Srinivasan et al. examined the effects of an
enzyme, plasmin, on rennet-induced gel formation (Srinivasan & Lucey, 2002).
Overall, the study found that the addition of plasmin had a negative effect on gel
formation (Srinivasan & Lucey, 2002). This was evident by a decrease in G’ in
gels containing plasmin, an indication of a weaker gel (Srinivasan & Lucey,
2002). In addition, the tan δ also increased with increasing plasmin addition, a
sign of a more viscous, rather than elastic, material (Srinivasan & Lucey, 2002).
The study also performed a test which took the gel to the point of fracture
(Srinivasan & Lucey, 2002). It found that the stress at fracture drastically
decreased with increasing plasmin content (Srinivasan & Lucey, 2002). Another
study examined the effects of heat treatment and added whey protein
concentrate on the rheological properties of acid milk gels (Lucey, Munro, &
Singh, 1999).The study found a decrease in gel strength with the addition of
native whey protein concentrate, suggesting that whey protein acted as an inert
filler in the gel (Lucey et al., 1999). However, when the milk had been exposed to
high heat and the whey protein denatured, it was found that the casein micelles
interacted with the whey proteins, resulting in an increase in gel strength (Lucey
et al., 1999). Another study supports the model of active and inactive fillers (Yang
et al., 2011) It defines an active filler as one that is interacting with the protein
matrix, while the inactive filler does not interact (Yang et al., 2011). One method
to classify a filler as active or inactive is to identify the effect it has on gel strength
(Yang et al., 2011). An inactive filler would be unable to increase gel strength
(Yang et al., 2011). The article suggests that fat behaves as an active filler and
this property should be considered as a fat replacer is developed (Yang et al.,
2011). Using rheology on milk gels is a useful tool in understanding the
mechanisms of gelation, the properties of the resultant gel, and the types of
interactions taking place.
30
2.3.3. Understanding Cheese Texture with Rheology
Like milk gels, cheese is a viscoelastic material. Therefore, small
amplitude oscillatory shear is a common choice for rheological measurements.
The first step in any cheese rheological measurements is to determine the LVE
region (Gunasekaran & Ak, 2003). Working within the LVE region allows for an
understanding of the cheese structure before it has been broken (Gunasekaran &
Ak, 2003). To determine this region, a stress or strain sweep is performed. In this
test, stress, or strain, on the cheese is increased over time (Gunasekaran & Ak,
2003). The point at which G’ and G’’ are no longer linear and begin to decrease
is the endpoint of the LVE region (Gunasekaran & Ak, 2003). The next common
step in cheese texture measurements is a frequency sweep. A stress, or strain,
determined to be within the LVE region, is applied while the frequency is
increased over time (Gunasekaran & Ak, 2003). Because cheese is viscoelastic,
the increasing frequency may produce a different G’ or G’’ response. In a study
of mozzarella and jack cheese, the cheeses were found to be more solid at high
frequencies and more fluid at low frequencies (J. A. Brown, Foegeding, Daubert,
Drake, & Gumpertz, 2003). In addition, tests are often repeated over time as
proteolysis can be a cause of significant changes in cheese texture during ageing
(Gunasekaran & Ak, 2003).
Several studies have found rheology to be a valuable method of
understanding cheese texture. A study on Cheddar cheese examined the textural
changes that occurred when fat mimetics were added to 60% reduced fat cheese
(Ma & Drake, 1997). Three commercial fat mimetics were chosen. These were a
carbohydrate based fat mimetic, Novagel, and two protein based fat mimetics,
Alacopals (New Zealand Milk Products) and Dairy Lo (Ma & Drake, 1997). In
general, the study found that the cheese containing the carbohydrate-based fat

31
replacer, Novagel, best mimicked the rheological properties of full fat cheese (Ma
& Drake, 1997). The study suggested that the carbohydrate’s ability to bind water
and also interact with the casein micelle was able to produce an improved
cheese matrix (Ma & Drake, 1997). While Novagel was selected as the most
successful, the creep and recovery tests found all three fat mimetics to be
successful in improving the reduced fat cheese texture (Ma & Drake, 1997).
Another study examined reduced fat cheese with added lecithin (Ma, Drake,
Barbosa-Canovas, & Swanson, 1996). During the stress sweep and frequency
sweep tests, full fat cheeses were found to have a higher G’ and G’’ than
reduced fat cheeses with or without the lecithin (Ma et al., 1996). In a creep and
recovery test, the reduced fat cheese without lecithin was found to have the
highest strain rates, whereas full fat and reduced fat with lecithin were not
significantly different (Ma et al., 1996). The lecithin appears to improve the
texture of the reduced fat cheese but could not fully mimic the qualities of full fat
cheese (Ma et al., 1996). A study by Ustunol et al. found different results for the
G’ and G’’ response in full fat Cheddar cheese (Ustunol, Kawachi, & Steffe,
1995). The study examined Cheddar cheese at two different fat contents: 34%,
27%, 20%, and 13% (Ustunol et al., 1995). Unlike Ma et al., it was found that the
higher fat Cheddar cheese had a lower G’ and G’’ compared to the lower fat
cheeses (Ustunol et al., 1995). In addition, rheological tests were repeated over
three months to examine the effects of proteolysis on cheese rheological
structure (Ustunol et al., 1995). In the first two weeks of aging, a change was not
seen. However, at three months of aging, the G’ and G’’ had decreased (Ustunol
et al., 1995).
While instrumental measurements, such as rheology, have been found to
be successful in understanding cheese texture, it is vital to know how these
instrumental results correlate with sensory attributes. Several studies have
addressed this concern. In examining mozzarella and Monterey jack cheese, a
study by Brown et al. found several correlations between rheological tests and
sensory results (J. A. Brown et al., 2003). For instance, results of the creep and
32
recovery tests were found to be correlated with mouth and hand firmness (J. A.
Brown et al., 2003). Overall, of the ten sensory terms studied, eight were able to
be correlated with five rheological terms (J. A. Brown et al., 2003). Another study
performed rheological and TPA testing on commercial natural cheese and
experimental process cheese (M.A. Drake et al., 1999). The creep and recovery
test was found to be correlated with elasticity (M.A. Drake et al., 1999). The
firmer commercial cheeses were found to be more elastic than the soft cheeses
(M.A. Drake et al., 1999). Rheological measurements of G’ and G’’ were found to
be correlated with the sensory terms firmness, stickiness, and cohesiveness
(M.A. Drake et al., 1999). The study also examined cheese using a texture profile
analyzer and found that this test correlated with sensory terms mouth and hand
firmness (M.A. Drake et al., 1999). Rheological testing can be vital in
understanding cheese texture and its ability to correlate with some sensory
measurements makes it valuable and useful tool.
2.3.4. Additional Methods of Evaluating Cheese Texture
Besides rheometers, several other tools can be used to elucidate cheese
texture. A very common method in analyzing cheese texture is through texture
profile analysis (TPA). A texture profile analyzer is capable of measuring
numerous cheese texture properties and a common method to use is a two-bite
compression test (Gunasekaran & Ak, 2003). This test involves applying a force
to compress a cylinder of cheese to a certain percentage of its original height,
withdrawing, waiting, and compressing the sample again, often to the point of
fracture (Gunasekaran & Ak, 2003). A number of useful textural properties can
be obtained using TPA, including hardness, cohesiveness, adhesiveness,
springiness, and resilience (Gunasekaran & Ak, 2003). Many studies have found
TPA to be a useful and accurate way of analyzing cheese texture (Drake, Herrett,
Boylston, & Swanson, 1996; Lobato-Calleros et al., 2001; Tunick, 2000). The
results of TPA are particularly valuable in assessing low fat cheese. Low fat
cheese is often perceived as hard and rubbery. A study by Lobato-Calleros et al.

33
found low fat Manchego cheese to be harder than full fat cheese as determined
by TPA (Lobato-Calleros et al., 2001). The same study also found that low fat
cheeses made with microparticulated whey had lower hardness values than the
low fat control cheese (Lobato-Calleros et al., 2001). Research by Drake et al.
analyzed the relationship between TPA results and texture results determined by
a sensory panel (Drake et al., 1999). The study found that TPA values of
hardness and springiness correlated with the sensory terms for firmness (M.A.
Drake et al., 1999).
Microscopy is another useful tool in understanding cheese texture. The
use of confocal scanning laser microscopy (CSLM) to visualize the cheese matrix
has been used in a number of studies (Auty, Twomey, Guinee, & Mulvihill, 2001;
Everett, Ding, Olson, & Gunasekaran, 1995; Lopez, Camier, & Gassi, 2007) .
The benefit of using confocal microscopy over other methods of visualization is
that it is capable of observing the cheese without disturbing the sample (Everett
et al., 1995). Confocal microscopy is also capable of imaging one section of the
cheese while ignoring other areas that are not in focus (Everett et al., 1995). In a
process known as z-series analysis, multiple photos can be reconstructed from
one sample to produce a 3-dimensional image (Everett et al., 1995). Dyes are
often used in CSLM to allow for visualization of specific cheese components.
Rhodamine B has been used to allow for the fluorescence of the cheese
background, leaving fat globules to be identified as black holes (Everett et al.,
1995). A study by Auty et al. used both Nile Red dye (Sigma Aldrich), which
stains lipids, and Fast Green dye (Sigma Aldrich), which stains proteins, in the
analysis of cheese (Auty et al., 2001). A study of Emmental cheese used
Acridine Orange dye (Adrich Chemical Company) to stain protein and Nile Red to
stain the lipids (Lopez et al., 2007).

34
3. Fat Replacer Formulation and Its Impact on Gel
Formation Properties
3.1 Introduction
Low fat Cheddar cheese is known for its poor textural qualities. When fat
is removed from cheese, the remaining matrix is dominated by casein proteins,
producing a dense, rubbery structure (Amelia et al., 2013). Fat replacers have
been developed to disrupt this matrix with the goal of producing a low fat cheese
with textural qualities of a full fat cheese (Amelia et al., 2013). Currently, there
are two categories of fat replacers: substitutes and mimetics (Omayma &
Youssef, 2007). Substitutes are fat-based but do not have as many calories as
fat, and mimetics are carbohydrates or proteins developed to impart a similar
functionality as fat (Omayma & Youssef, 2007).
Proteins are often selected as fat replacers because their shape and size
can be good for mimicking fat (Laneuville et al., 2000). However, carbohydrates
also make good fat replacers as they can often bind water, imparting a smoother
texture to the cheese (Imeson, 2000). Many commercial protein or carbohydrate
based fat replacers have been tested in reduced or low fat Cheddar cheeses with
varying levels of success (Aryana & Haque, 2001; Ma & Drake, 1997; Romeih et
al., 2002). Some researchers have suggested that a fat replacer should not be
solely protein or carbohydrate but rather a mixture of the two that bring forth the
best functionalities of each. In addition to their individual qualities, some studies
have shown that their interaction can produce entirely new functionalities.
Therefore, understanding the interactions occurring between the protein and
polysaccharide may also be of importance.
The first objective of this research was to develop a fat replacer using a
combination of whey proteins and polysaccharides that resulted in a compound
that mimicked cheese fat in size (approximately 2-10µm). To understand the
35
properties of this fat replacer, the second objective was to determine the
interactions occurring between the whey protein and polysaccharide. Finally, it
was necessary to determine how the fat replacer would affect gelling properties
of milk. The last objective was to observe the effects that different levels of fat
replacer had on milk coagulation and determine an acceptable fat replacer
incorporation rate for future cheese production trials.
3.2 Materials and Methods
Materials and methods required for fat replacer formulation, gel
electrophoresis, and milk gel formation rheology are recorded in this section.
Expanded and additional methods may be found in the Appendix, section 7.1.
3.2.1. Materials
In the fat replacer formulation trials, the following whey proteins were
tested: Simplesse 100, microparticulated whey protein concentrate (CP Kelco,
Atlanta, GA), Perham, whey protein isolate 90% instantized (Bongards’
Creameries, Perham, MN), BiPro JE 151-3-420, whey protein isolate (Davisco,
Le Sueur, MN), and Provon 190, whey protein isolate (Glanbia Nutritionals,
Fitchburg, WI). The following polysaccharides were tested: Grindsted Pectin XSS
100 (Danisco, New Century, KS), Pectin LC 710 (Danisco, New Century, KS),
Pectin RS 461 (Danisco, New Century, KS), Pectin LC 950 (Danisco, New
Century, KS), xanthan gum (Danisco, New Century, KS), Coyote Brand C Pro
Lambda Carrageenan (Gum Technology, Tucson, AZ), Genugel type CHP-200,
k-carrageenan (CPKelco, Cebu, Philippines), and Novagel, microcrystalline and
guar gum (FMC Corporation, Philadelphia, PA).
Particle size was analyzed on a Malvern Mastersizer particle analyzer
(Malvern Instruments, Ltd) in water on a polydisperse setting. Samples were run
at a 25% obscuration and dispersion unit set to 1,300. pH analysis was
performed using a Fisher Scientific Accumet Basic AB15 pH meter. Acid used in
pH adjustments was .1N hydrochloric acid SA54-1 (Fisher Scientific). The
36
homogenizer used for the mixture of some polysaccharides was the IKA Ultra-
Turrax homogenizer.
For protein interaction analysis, gel electrophoresis was performed on Bio-
Rad Criterion TGX 4-20%, 26-well, 15µl gels. The following protein standards
were used: bovine serum albumin lyophilized powder, 96% (Sigma-Aldrich, St.
Louis, MO), β-casein from bovine milk, 90% (Sigma-Aldrich, St. Louis, MO), β-
lactoglobulin from bovine milk, 90% (Sigma-Aldrich, St. Louis, MO),
caseinoglycopeptide from bovine casein (Sigma-Aldrich, St. Louis, MO), k-casein
from bovine, 80% (Sigma-Aldrich, St. Louis, MO), α-casein from bovine milk,
70% (Sigma-Alrich, St. Louis, MO), and α-lactalbumin from bovine milk, 85%
(Sigma-Aldrich, St. Louis, MO). Gels were run in diluted 10X Tris/Glycine/SDS
Buffer (Bio-Rad Laboratories, Inc., Hercules, CA) and 2X Laemmli Sample Buffer
(Bio-Rad) added to the samples. The gel was stained in Bio-Safe Coomassie G-
250 Stain (Bio-Rad). 2-mercaptoethanol, 98% (Sigma-Aldrich, St. Louis, MO)
was added to samples.
In the gel rheology evaluation studies, the milk used was Autumnwood
Farms unhomogenized whole milk and Autumnwood Farms skim milk
(Autumnwood Farms, Forest Lake, MN). The acid used to acidify the milk was
USP/FCC lactic acid diluted 10X (Fisher Scientific, Fair Lawn, NJ). The rennet
used was Chymax 73863 (CHR Hansen, Inc. Milwaukee, Wisconsin).
3.2.2. Pretrial Experiments for Fat Replacer Formulation
Multiple pretrial experiments were performed in order to create the
whey protein:polysaccharide fat replacer. A particle size ranging from 2-10µm
was targeted. Conditions investigated included reduction of pH with dilute
hydrochloric acid, adjusting whey protein and polysaccharide ratio and
concentration in solution, temperature and duration of heat treatment, whey
protein source, and type of polysaccharide. Polysaccharides were weighed,
mixed with deionized water, and stored in refrigerated conditions overnight to
37
hydrate. If necessary, the Ultra Turrax homogenizer was used to incorporate
polysaccharides into solution. The exact mixing and heating conditions for each
polysaccharide can be found in Table 1.Prior to whey protein addition,
polysaccharide solutions were brought to room temperature. Whey protein was
weighed and mixed with the polysaccharide solutions. 25mL of the whey
protein:polysaccharide solution were transferred into a 30mL, small glass vial
with a screw top lid. If necessary, pH was adjusted before adding the samples to
the water bath for heat treatment. Controls for each test included whey protein
and polysaccharide alone, with and without treatments. Once cool, samples were
mixed well and particle size was measured on the Malvern Mastersizer. Samples
were run at a 25% obscuration and dispersion unit set to 1,300.
Methods for xanthan gum pretrial experimental conditions, as shown in
Table 1, were chosen based on previous studies. For instance, Laneuville et al.
found a protein:polysaccharide ratio of 15:1 to be most successful in producing a
2-10μm protein precipitates (Laneuville et al., 2000). pH ranges were based on
previous research as well as the protein’s isoelectric point. Method for pectins
were chosen based on research by Mishra et al. and Zhang et al., which found
reduced pH and a 2:1 or 1:1 protein:polysaccharide ratio to be most successful in
producing aggregates (Mishra et al., 2001; S. Zhang, Zhang, Lin, &
Vardhanabhuti, 2012). Methods for Novagel and Simplesse conditions were
adapted from research by Romeih et al. (Romeih et al., 2002). Mixing conditions
for carrageenans was adapted from information provided by the Handbook of
Hydrocolloids (Imeson, 2000).
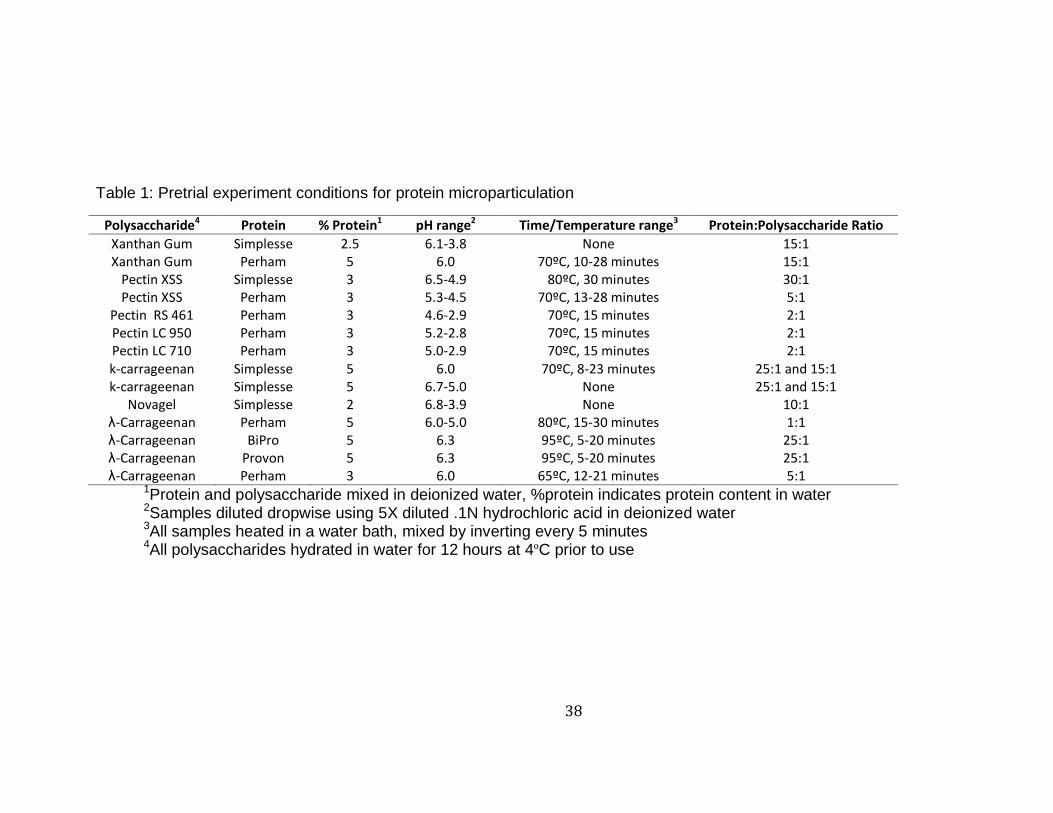
38
Table 1: Pretrial experiment conditions for protein microparticulation
Polysaccharide4 Protein % Protein1 pH range2 Time/Temperature range3 Protein:Polysaccharide Ratio
Xanthan Gum Simplesse 2.5 6.1-3.8 None 15:1 Xanthan Gum Perham 5 6.0 70ºC, 10-28 minutes 15:1
Pectin XSS Simplesse 3 6.5-4.9 80ºC, 30 minutes 30:1 Pectin XSS Perham 3 5.3-4.5 70ºC, 13-28 minutes 5:1
Pectin RS 461 Perham 3 4.6-2.9 70ºC, 15 minutes 2:1 Pectin LC 950 Perham 3 5.2-2.8 70ºC, 15 minutes 2:1 Pectin LC 710 Perham 3 5.0-2.9 70ºC, 15 minutes 2:1 k-carrageenan Simplesse 5 6.0 70ºC, 8-23 minutes 25:1 and 15:1 k-carrageenan Simplesse 5 6.7-5.0 None 25:1 and 15:1
Novagel Simplesse 2 6.8-3.9 None 10:1 λ-Carrageenan Perham 5 6.0-5.0 80ºC, 15-30 minutes 1:1 λ-Carrageenan BiPro 5 6.3 95ºC, 5-20 minutes 25:1 λ-Carrageenan Provon 5 6.3 95ºC, 5-20 minutes 25:1 λ-Carrageenan Perham 3 6.0 65ºC, 12-21 minutes 5:1
1Protein and polysaccharide mixed in deionized water, %protein indicates protein content in water 2Samples diluted dropwise using 5X diluted .1N hydrochloric acid in deionized water 3All samples heated in a water bath, mixed by inverting every 5 minutes 4All polysaccharides hydrated in water for 12 hours at 4ºC prior to use

39
The pretrial experiments results indicated Provon 190 and Perham, each
mixed with λ-carrageenan, to be most suitable for producing particle sizes
between 2-10µm. In the next experiment, each protein, Provon 190 and Perham,
was tested with and without the λ-carrageenan. Samples were prepared by
hydrating 1g of λ-carrageenan in 500mL deionized water overnight. The next
day, after bringing the λ-carrageenan and water mixture to room temperature,
25g of either Provon 190 or Perham were added and mixed. From this solution,
25mL was poured into a glass vial and heated in a 95ºC water bath for either 5,
10, 15, or 20 minutes. Samples were mixed briefly by inverting vials once every
five minutes. For analysis of protein constituents, an SDS-PAGE was performed
using a Bio-Rad Criterion TGX 18% gel. Samples were diluted to 0.02mg/10μl
and run in the presence of β-mercaptoethanol and repeated in four replicates.
3.2.3. Determination of Protein:Polysaccharide Interactions Through Gel Electrophoresis
The method for the determination of protein:polysaccharide
interactions is outlined in Figure 2. Sodium dodecyl sulfate polyacrylamide gel
electrophoresis (SDS-PAGE) was used to determine the bonding present
between whey protein and λ-carrageenan. Samples were prepared using a 25:1
whey protein:λ-carrageenan ratio at neutral pH in deionized water. Solutions
were heat treated for 5 minutes at 95ºC. Controls included whey protein only
samples as well as samples with and without heat treatment. The standards used
were β-casein, α-lactalbumin, β-lactoglobulin, bovine serum albumin, α-casein, k-
casein, and glycomacropeptide. All samples were diluted to a concentration of
0.02mg/10µl. After mixing samples, 1mL was transferred to a centrifuge tube. A
10µl sample was taken from this tube and placed in tube number 1. This sample
would be representative of the entire sample (designated as lane O). The original
tube was centrifuged at 15,682g for 10 minutes. A 10µl sample of supernatant
was removed and transferred to a centrifuge tube number 2 (S2). This fraction
represents any soluble, non-aggregated protein as any aggregated protein would
40
have migrated to the pellet during centrifugation. From the original tube, all
supernatant was removed. To the pellet, 990µl of 1% sodium dodecyl sulfate
(SDS) solution was added. The sample was well mixed until the pellet was
solubilized. A 10µl sample was removed and placed in centrifuge tube number 3
(P1). The presence of the SDS breaks electrostatic, non-covalent, and
hydrophobic bonds. This tube was centrifuged for 10 minutes at 15,862g. 10µl of
supernatant was removed and placed in a centrifuge tube number 4 (S2). This
fraction represented any protein broken down by the SDS. The rest of the
supernatant was removed from the original tube and discarded. To the pellet,
930µl of 1% SDS solution was added as well as 50µl of β-mercaptoethanol. The
tube was mixed to resolubilize the pellet. A 10µl sample was taken and placed in
centrifuge tube number 5 (P2). The original tube was centrifuged at 15,682g for
10 minutes. A 10µl sample was removed and placed in centrifuge tube number 6
(S3). This fraction represented any protein broken down by the presence of β-
mercaptoethanol, which breaks down disulfide bonds. The supernatant was
removed from the original centrifuge tube. Finally, 920µl of 1% SDS is added as
well as 50µl of β-mercaptoethanol. A 10µl sample was removed and placed in
centrifuge tube number 7 (P3). This sample preparation is shown in Figure 2.
Laemmli buffer was added to the samples at a 1:1 ratio and heated in boiling
water for 5 minutes. All samples were loaded onto a BioRad pre-cast 4-20%
polyacrylamide gel and run at 200V for approximately 40 minutes or until bands
reached the bottom of the gel. The gel was stained using BioSafe Coomassie
Blue stain (Bio-Rad Laboratories). For this procedure, the gel was first placed in
di water and gently rocked for five minutes on a shaker. This step was repeated
three times. 50mL of Bio-Safe Coomassie Blue stain was added to each gel. The
gels were allowed to stain for one hour. The Coomassie Blue stain was removed.
Water was again added and the gel allowed to gently shake. Gels were stored in
water. The gels were imaged on a BioRad Gel Doc XR (Bio-Rad Laboratories)
station and analyzed using the Quantity One Software (Bio-Rad Laboratories).

41
3.2.4. Gel Rheological Evaluation
The two fat replacers were added at different inclusion rates into renneted
milk to evaluate gel formation. Three inclusion rates were chosen to replace fat
1:0.5, 1:1 and 1:1.5 by volume. This was calculated by examining the fat volume
lost in producing a low fat cheese versus a full fat cheese. In a 50g 3.6% full fat
milk sample, as is the quantity used in this experiment, 1.85mL of fat would be
Fat Replacer Mixture (O)
Centrifuge
Supernatant (S1) Water soluble
protein
Pellet (P1) + 1% SDS
Centrifuge
Supernatant (S2) SDS soluble protein
Pellet (P2) + 1% SDS + BME
Centrifuge
Supernatant (S3) SDS + BME soluble
protein
Pellet (P3) + 1% SDS + BME
Figure 2: SDS-PAGE process of sample preparation to determine bonding types
42
present. After an 80% reduction in fat to achieve low fat, the fat volume lost is
approximately 1.5mL. Thus, in order to replace fat 1:1, 1.5mL of fat replacer
should be added. 0.785mL (1:0.05),1.57mL (1:1), and 2.355mL (1:15) of fat
replacer were added to 50 ml of milk. A low fat control, low fat milk without fat
replacer addition, was also tested. Before testing of the milk, each milk batch was
standardized to .54% milk fat, The pH of each milk batch was reduced to a pH of
6.2 using lactic acid diluted 10X in di water. 50g of the prepared milk was
weighed into labeled tubes and kept in refrigerated conditions (35ºF) until testing.
The AR-G2 rheometer (TA Instruments) was used for analysis. The
geometry used was a AR Series Peltier Concentric Cylinder (TA Instruments).
The fat replacer was added to the milk sample and placed in a 31.2ºC water bath
for approximately 11 minutes until it reach 31.2ºC A pipette was used to transfer
15mL of the milk to the instrument’s cup. This volume just covered the top of the
bob in the cup and bob configuration. The temperature of the cup was set to
31.2ºC and regulated with a circulating water bath. 72.5μL of rennet, diluted 1:50
with deionized water, was added to the milk samples in the cup. Once the rennet
was added, the mixture was briefly mixed using a pipet. The sample sat
quiescently for 2 minutes before proceeding with the first test. The first test
performed was a time sweep test. The %strain was set at 1.0 and frequency at
0.1 Hz. The bob was lowered into the cup and the time sweep test began. The
duration of this test was 30 minutes. This 30 minute time was set to ensure all
gels reached a maximum strength. The next test, which began directly after the
time sweep test to the same material, was the peak hold step. A shear rate (1/s)
of 0.006 for 10 minutes was applied. This measured the strength and fracture
point of the gel produced during the first time sweep test. All tests were
performed in triplicate.
3.2.5. Statistical Analysis
The University of Minnesota Statistical Consulting Service, specifically
Lindsey Dietz, assisted in the analysis of these experiments. Statistical analysis
43
for experiments on fat replacer formulation and particle size involved a
logarithmic transformation of data to improve normality. An ANOVA of this data,
followed by Tukey’s honest significant difference (HSD) test, was performed use
the R Studio statistical program (Studio, 2012). In addition, standard deviations of
non-transformed data were determined.
Rheology gel formation data was analyzed by performing an ANOVA
using the R Studio Statistical program (Studio, 2012). Further testing included a
Tukey HSD as needed to determine statistical differences.
3.3 Results and Discussion
3.3.1. Fat Replacer Formulation
Results and conditions of the pretrial experiments are shown in Table 2.
Xanthan gum produced large fibrous strands upon addition of dilute hydrochloric
acid with Simplesse protein and also had increasing particle sizes with increasing
amounts of heat treatment when combined with Perham whey protein. Pectins
produced varied results depending on the type. In general, pectin produced
either very small or very large protein particles. Pectin RS 461, a high ester
pectin was able to produce Perham whey protein particle sizes around 4μm at a
reduced pH. This is in agreement with Mishra et al., which reported that pectin
forms complexes with protein at low pH (Mishra et al., 2001). K-carrageenan also
found increased particle sizes with increased heat treatment when combined with
Simplesse. The combination of Novagel and Simplesse at neutral pH did not
produce any precipitates. However, at reduced pH, a gel occurred. This could be
expected as Novagel, containing microcrystalline cellulose, can be used as a
gelling agent in the right conditions (Iijima & Takeo, 2000) Treatments with λ-
carrageenan, paired with either Perham or Provon whey protein isolate,
produced protein aggregates around 10μm when heated treated for 5 minutes at
95ºC. Because λ-carrageenan is a highly sulfated polysaccharide, a number of
interactions could be occurring (Imeson, 2000). These possible interactions will

44
be discussed further in this chapter. Samples of λ-carrageenan and BiPro
produced no visible protein aggregates. These results are not surprising as BiPro
is designed to be very heat stable and soluble at any pH (International, 2014).

45
Table 2: Pretrial experimental conditions and observations for protein microparticulation
Polysaccharide Protein %
Protein pH
range Time/Temperature
range Protein:Polysaccharide
Ratio Observations
Xanthan Gum Simplesse 2.5 6.1-3.8 None 15:1 Produced large, visible protein precipitates upon acid addition
Xanthan Gum Perham 5 6.0 70ºC, 10-28 minutes 15:1 Increasing particle size with heating time, smaller particles than Perham
whey protein control
Pectin XSS Simplesse 3 6.5-4.9 80ºC, 30 minutes 30:1 Little to no precipitation, particle size <1um
Pectin LC 710 Perham 3 5.3-4.5 70ºC, 13-28 minutes 2:1 No difference in particle size for heating time, large increase in
particle size at pH 4.78
Pectin RS 461 Perham 3 4.6-2.9 70ºC, 15 minutes 2:1 No increase in particle size, <1um, until pH 3.79, which had a particle
size around 4um
Pectin LC 950 Perham 3 5.2-2.8 70ºC, 15 minutes 2:1 Large increase in particle size, >100um, between pH 5.2-4.6.
Decrease in particle size with pH decline
k-carrageenan Simplesse 5 6.0 70ºC, 8-23 minutes 25:1 and 15:1 1:25- 8-14 minutes produced 4um particle sizes, 17-23 minutes
produced particles >100μm. 1:15- gels formed at neutral pH, large
strands formed with increased heat
Table Continued…
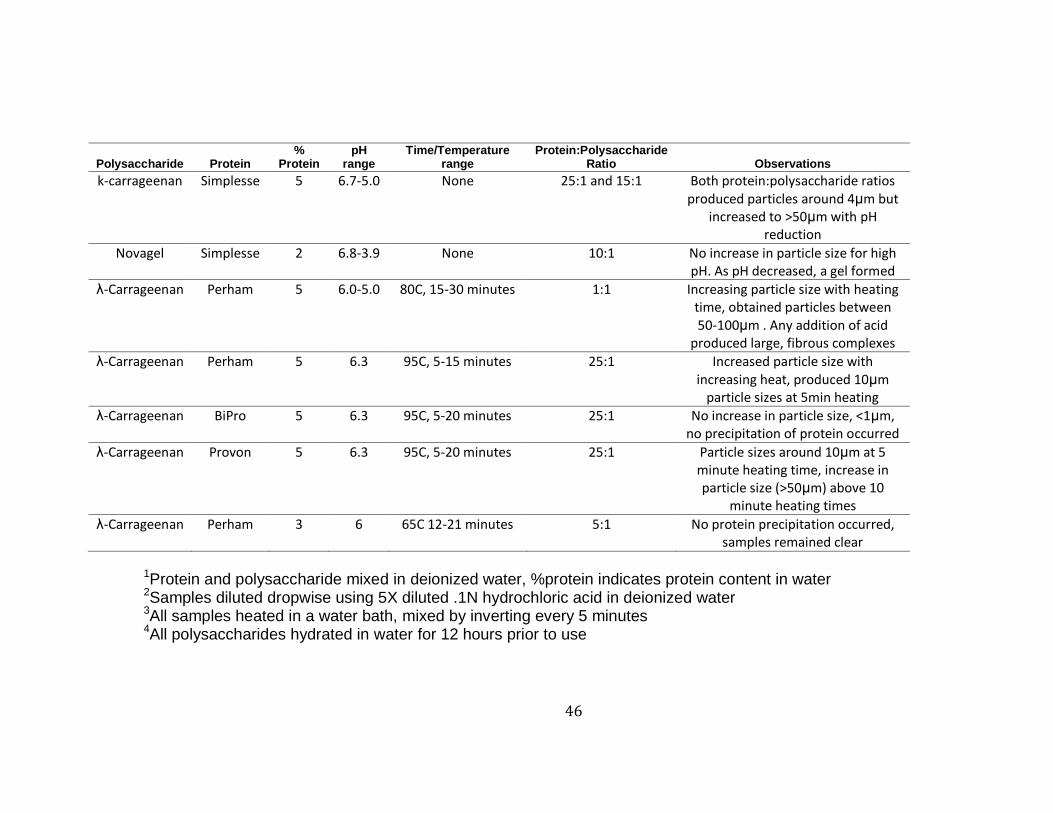
46
Polysaccharide Protein %
Protein pH
range Time/Temperature
range Protein:Polysaccharide
Ratio Observations
k-carrageenan Simplesse 5 6.7-5.0 None 25:1 and 15:1 Both protein:polysaccharide ratios produced particles around 4μm but
increased to >50μm with pH reduction
Novagel Simplesse 2 6.8-3.9 None 10:1 No increase in particle size for high pH. As pH decreased, a gel formed
λ-Carrageenan Perham 5 6.0-5.0 80C, 15-30 minutes 1:1 Increasing particle size with heating time, obtained particles between 50-100μm . Any addition of acid
produced large, fibrous complexes
λ-Carrageenan Perham 5 6.3 95C, 5-15 minutes 25:1 Increased particle size with increasing heat, produced 10μm
particle sizes at 5min heating
λ-Carrageenan BiPro 5 6.3 95C, 5-20 minutes 25:1 No increase in particle size, <1μm, no precipitation of protein occurred
λ-Carrageenan Provon 5 6.3 95C, 5-20 minutes 25:1 Particle sizes around 10μm at 5 minute heating time, increase in particle size (>50μm) above 10
minute heating times
λ-Carrageenan Perham 3 6 65C 12-21 minutes 5:1 No protein precipitation occurred, samples remained clear
1Protein and polysaccharide mixed in deionized water, %protein indicates protein content in water 2Samples diluted dropwise using 5X diluted .1N hydrochloric acid in deionized water 3All samples heated in a water bath, mixed by inverting every 5 minutes 4All polysaccharides hydrated in water for 12 hours prior to use

47
Results of the particle size analysis of Provon and Perham, as shown in
Table 5, show a general increased particle size with increased heat treatment.
This holds true for all treatments at a heating time of 20 minutes, with the
exception of Perham Only and Provon Only a. As indicated in Table 5, the
decline in particle size at this level of heat treatment is due to the increase in very
large particles which could not be detected by the instrument. At this high level of
heat treatment, large strands of protein were visible within the vials and the
particle size increased. This can be seen in Figure 5. In photos A and B of Figure
5, an increase in particle size is seen from the 5 minute sample up to 20 minutes.
At 20 minutes, very large strands and particles are present. Those heated for 15
and 20 minutes were significantly higher in particle size than those at 5 and 10
minutes. This increase in particle size over heating time is expected as whey
protein aggregates continue to grow over time. This is in agreement with other
studies of whey protein aggregation (Havea et al., 2001). Havea et al. found
increases in whey protein aggregate size with increasing heat time at 75ºC.
The full distribution of the sizes (diameter) of particles present in each
sample are shown in Figure 4. The first noticeable difference is the reduction in
particle size for those samples containing λ-carrageenan. In both the Provon and
Perham samples, those without λ-carrageenan show a large proportion of
particles at or less than 1μm. The remaining particles are very large and appear
between 100 and 1000μm. Those with λ-carrageenan show a decrease in
particles at 1μm. Those small particles have shifted to the range of 5-10μm, yet
without producing the very large particles seen in samples without λ-
carrageenan. These results are supported by Table 5. A significant difference is
found between treatments with and without λ-carrageenan. At five minutes heat
treatment, Pro Only and Per Only are significantly higher than PerC and ProC.
This trend also holds true for samples at 10 and 15 minutes heating time. At 20
minutes heating time, PerC is significantly different than ProC as PerC sees a
large increase in particle size. In general, the samples with λ-carrageenan show
a smaller particle size, regardless of protein type. The λ-carrageenan was able to

48
successfully inhibit whey protein aggregation, producing a reduced particle size.
The goal of this study was to create a particle size that could mimic the size of fat
at 2-10µm. At just 5 minutes of heating time, both the Provon Only and Perham
Only treatments were above this size. The λ-carrageenan was necessary in
creating the desired particle size. These results are consistent with previous
research. A study of whey protein aggregation in the presence of xanthan gum
found decreased aggregation compared to whey protein alone (Laneuville et al.,
2000). The study had involved a 20:1, protein:xanthan gum, solution and found
that the xanthan gum, while not interacting with the whey protein, had increased
the viscosity of solution and prevented whey protein aggregation (Laneuville et
al., 2000). Another study found dextran capable of conjugating with whey protein
and was also able to reduce whey protein aggregation (Zhu et al., 2008)
Finally, a significant difference was found between PerC and ProC at 20
minutes heating time. In general, a trend of larger particle sizes could be seen for
treatments with Perham whey protein. This is supported by photos A and B in
Figure 5. As in Table 5, in the treatment of PerC, the particle size means range
from 3.64-14.1µm with increased heat treatment, whereas the treatment of ProC
has a particle size range of 2.90-3.34µm. The λ-carrageenan was more effective
at reducing particle size for Provon whey protein than Perham whey protein at 20
minutes. The differences in protein constituents may be the cause of the different
particle sizes seen between the PerC and ProC samples. As shown in Table 3,
there are some differences in the protein profile between Provon and Perham
whey proteins as stated by the manufacturer. Most notably, there is a pH
difference between Provon and Perham. The manufacturers reported a pH of 6.3
for Provon and 6.0 for Perham. This was confirmed in this study. It was found
that Provon, in a 5% protein solution in water, had a pH of 6.29. The same pH
was observed in a 5% protein solution of Provon with λ-carrageenan. A 5%
Perham protein solution in water had a pH of 6.01. This pH remained the same
when λ-carrageenan was added. This difference in pH can have dramatic effects
on the amount precipitation that occurs. The isoelectric point of whey protein is

49
5.2, and the closer the pH reaches this point, the more likely electrostatic
interactions will occur between the whey protein and λ-carrageenan (Weinbreck
et al., 2004). As Perham has a lower pH than Provon, it is possible that the λ-
carrageenan is interacting more readily with the whey protein. Perham is also
reported to contain a higher percentage of β-lactoglobulin while Provon is
reported to contain a higher percentage of glycomacropeptide. Pure solutions of
β-lactoglobulin (BLG) are known to create aggregates in a specific way. When
the whey protein solution is not pure, as in Provon and Perham, a number of
interactions could be occurring between the protein constituents. The interactions
that dominate and the subsequent aggregates that form are dependent on the
protein constituents available, including α-lactalbumin (A-LAC), bovine serum
albumin (BSA), and glycomacropeptide (GMP) (Miguel Angel de la Fuente,
Singh, & Hemar, 2002). Once denatured, all of the major whey proteins are
available for various interactions. For instance, A-LAC is capable of participating
in interactions when one or more of its four disulfide bonds is broken (Calvo,
Leaver, & Banks, 1993). The breaking of the disulfide bonds is facilitated by any
protein which contains a free sulfhydryl group (Calvo et al., 1993). It has also
been found that the degree to which A-LAC aggregates is proportional to the
number of free sulfhdryl groups available to break its disulfide bonds (Calvo et
al., 1993). In the case of whey protein, BLG has a free sulfhydryl group which
may be available for this interaction. As Perham whey protein has 65.61% BLG
compared to Provon’s 54%, it may be that the additional BLG of Perham is
promoting A-LAC aggregation. Another possible explanation of the reduced
particle size in Provon whey protein is the high percentage of glycomacropeptide
present (GMP). A study by Croguennec et al., found the presence of GMP
increased the denaturation of BLG (Croguennec et al., 2014). The study also
found a decrease in BLG aggregation and size of aggregates with increasing
GMP (Croguennec et al., 2014). BLG formed small aggregates coated in GMP,
which prevented the small aggregates from producing larger aggregates
(Croguennec et al., 2014).
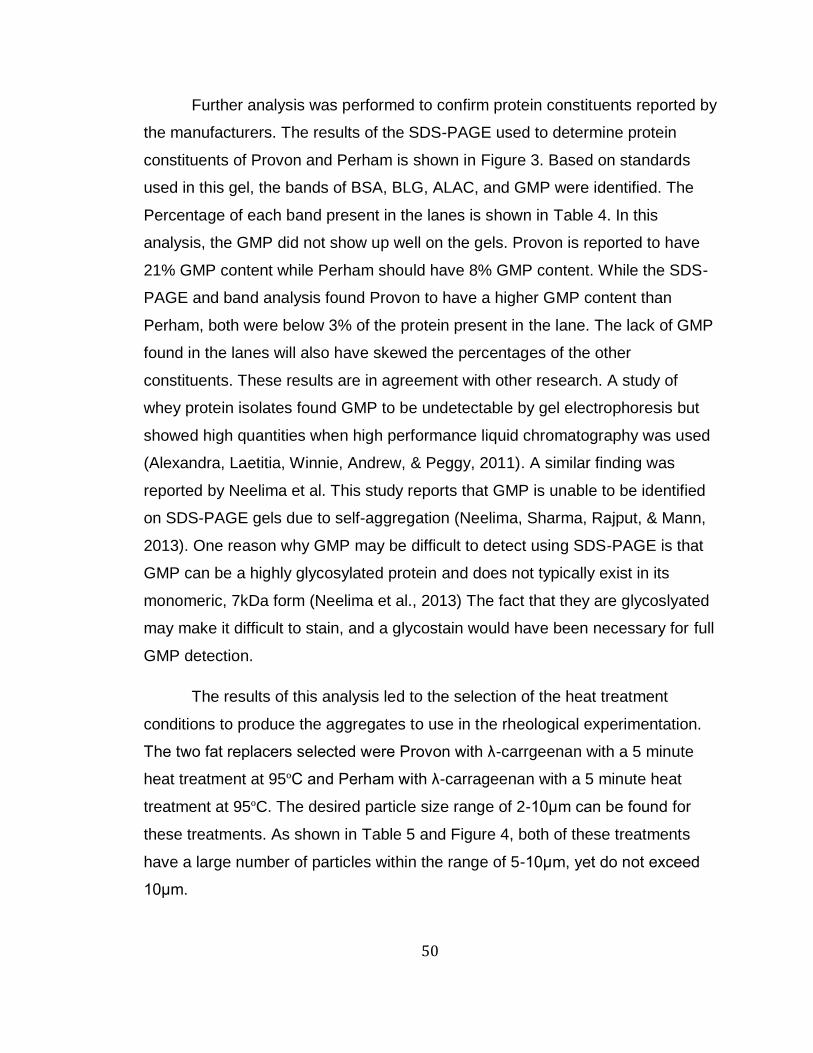
50
Further analysis was performed to confirm protein constituents reported by
the manufacturers. The results of the SDS-PAGE used to determine protein
constituents of Provon and Perham is shown in Figure 3. Based on standards
used in this gel, the bands of BSA, BLG, ALAC, and GMP were identified. The
Percentage of each band present in the lanes is shown in Table 4. In this
analysis, the GMP did not show up well on the gels. Provon is reported to have
21% GMP content while Perham should have 8% GMP content. While the SDS-
PAGE and band analysis found Provon to have a higher GMP content than
Perham, both were below 3% of the protein present in the lane. The lack of GMP
found in the lanes will also have skewed the percentages of the other
constituents. These results are in agreement with other research. A study of
whey protein isolates found GMP to be undetectable by gel electrophoresis but
showed high quantities when high performance liquid chromatography was used
(Alexandra, Laetitia, Winnie, Andrew, & Peggy, 2011). A similar finding was
reported by Neelima et al. This study reports that GMP is unable to be identified
on SDS-PAGE gels due to self-aggregation (Neelima, Sharma, Rajput, & Mann,
2013). One reason why GMP may be difficult to detect using SDS-PAGE is that
GMP can be a highly glycosylated protein and does not typically exist in its
monomeric, 7kDa form (Neelima et al., 2013) The fact that they are glycoslyated
may make it difficult to stain, and a glycostain would have been necessary for full
GMP detection.
The results of this analysis led to the selection of the heat treatment
conditions to produce the aggregates to use in the rheological experimentation.
The two fat replacers selected were Provon with λ-carrgeenan with a 5 minute
heat treatment at 95ºC and Perham with λ-carrageenan with a 5 minute heat
treatment at 95ºC. The desired particle size range of 2-10μm can be found for
these treatments. As shown in Table 5 and Figure 4, both of these treatments
have a large number of particles within the range of 5-10μm, yet do not exceed
10μm.

51
Table 3: Specified composition of the two whey protein isolates as reported by manufacturer
Attribute
β-lactoglobulin (%) 54 65.61
Glycomacropeptide (%) 21 8.13
Bovine Serum Albumin (%) 1 1.17
α-lactalbumin (%) 22 22.86
Immunoglobulins (%) 2 0.01
Lactoferrin (%) 0.49 0.01
Protein dry basis (%) 92.13 91.5
Moisture (%) 3.72 6.3
Ash (%) 3.00 2.8
Fat (%) <0.7 <1.0
pH3 6.31 6.0
Lactose (%) <1.0 1.6
Soy Lecithin No Yes
Calcium (mg/100g) 560 438
Sodium (mg/100g) 230 149
Potassium (mg/100g) 380 568
Magnesium (mg/100g) 120 75
1Nutritionals provided by Provon specification sheet (Glanbia, 2014) 2Nutritionals provided by Perham specification sheet (Wilkinson & Boutiette, 2013), protein constituents provided by analysis report (Regester, 1997)
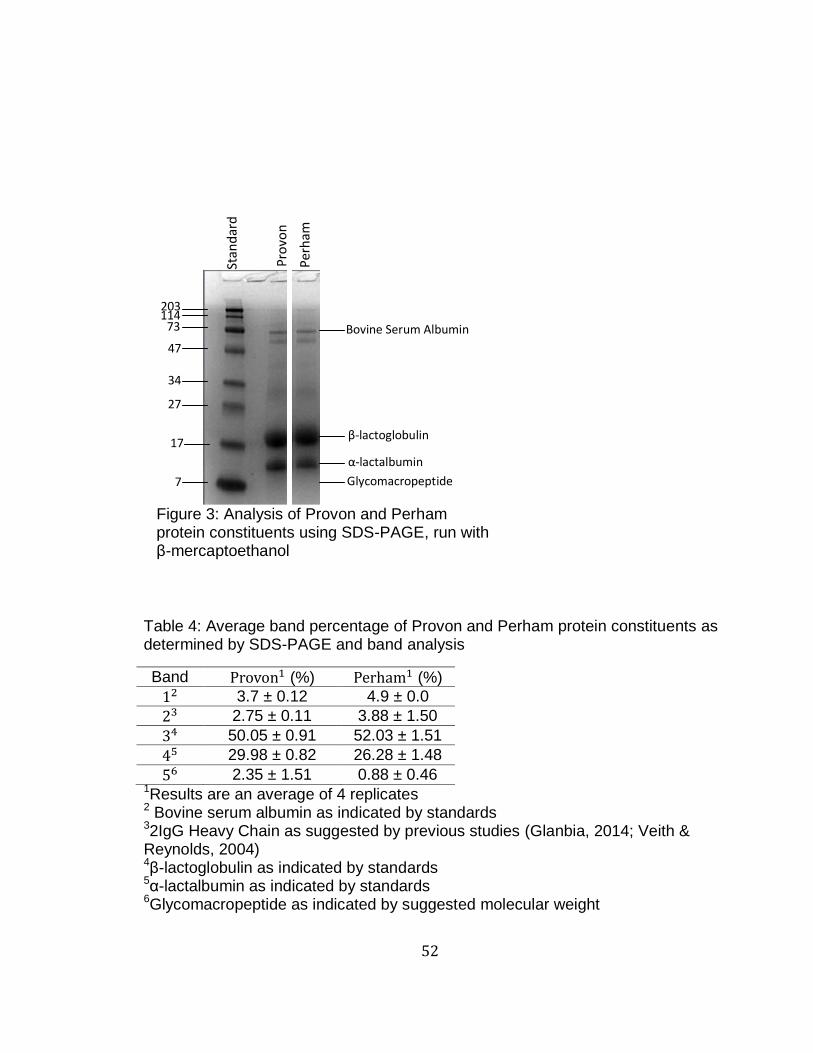
52
Table 4: Average band percentage of Provon and Perham protein constituents as determined by SDS-PAGE and band analysis
Band (%) (%)
3.7 ± 0.12 4.9 ± 0.0
2.75 ± 0.11 3.88 ± 1.50
50.05 ± 0.91 52.03 ± 1.51
29.98 ± 0.82 26.28 ± 1.48
2.35 ± 1.51 0.88 ± 0.46 1Results are an average of 4 replicates 2 Bovine serum albumin as indicated by standards 32IgG Heavy Chain as suggested by previous studies (Glanbia, 2014; Veith & Reynolds, 2004) 4β-lactoglobulin as indicated by standards 5α-lactalbumin as indicated by standards 6Glycomacropeptide as indicated by suggested molecular weight
203 114
73
47
34
27
17
7
Bovine Serum Albumin
β-lactoglobulin
α-lactalbumin
Glycomacropeptide
Stan
dar
d
Pro
von
Per
ham
Figure 3: Analysis of Provon and Perham protein constituents using SDS-PAGE, run with β-mercaptoethanol
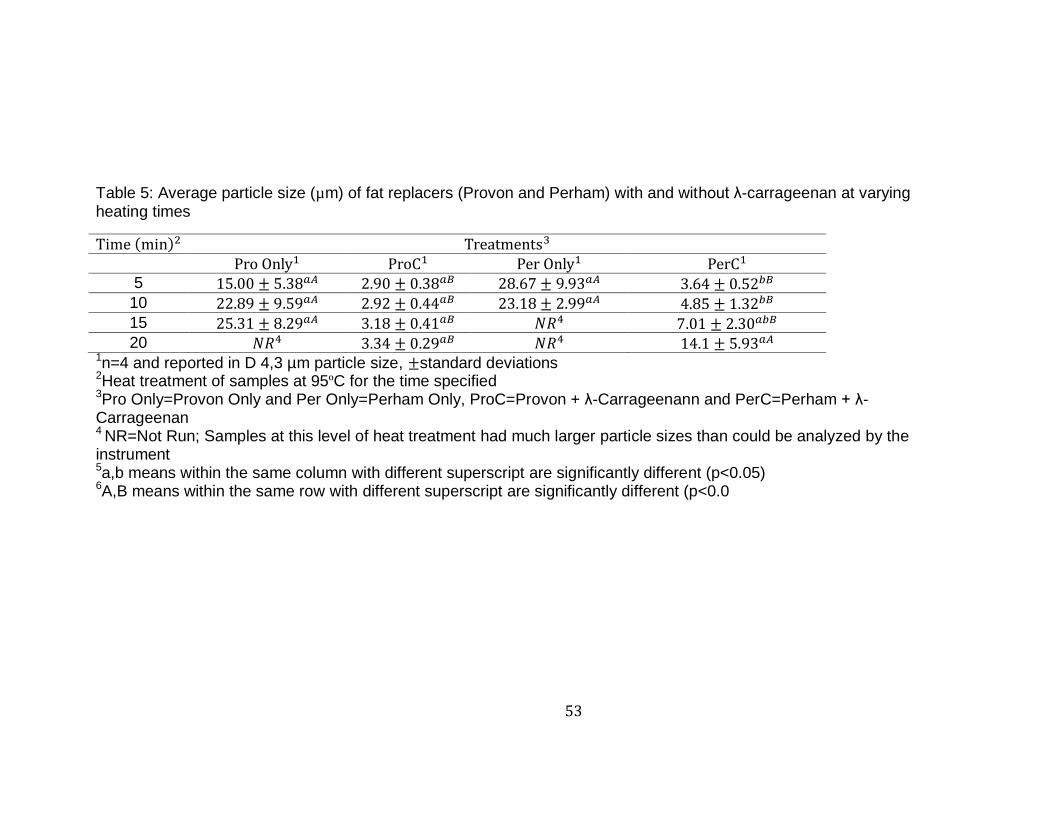
53
Table 5: Average particle size (µm) of fat replacers (Provon and Perham) with and without λ-carrageenan at varying heating times
5
10
15
20 1n=4 and reported in D 4,3 µm particle size, standard deviations 2Heat treatment of samples at 95ºC for the time specified 3Pro Only=Provon Only and Per Only=Perham Only, ProC=Provon + λ-Carrageenann and PerC=Perham + λ-Carrageenan 4 NR=Not Run; Samples at this level of heat treatment had much larger particle sizes than could be analyzed by the instrument 5a,b means within the same column with different superscript are significantly different (p<0.05) 6A,B means within the same row with different superscript are significantly different (p<0.0
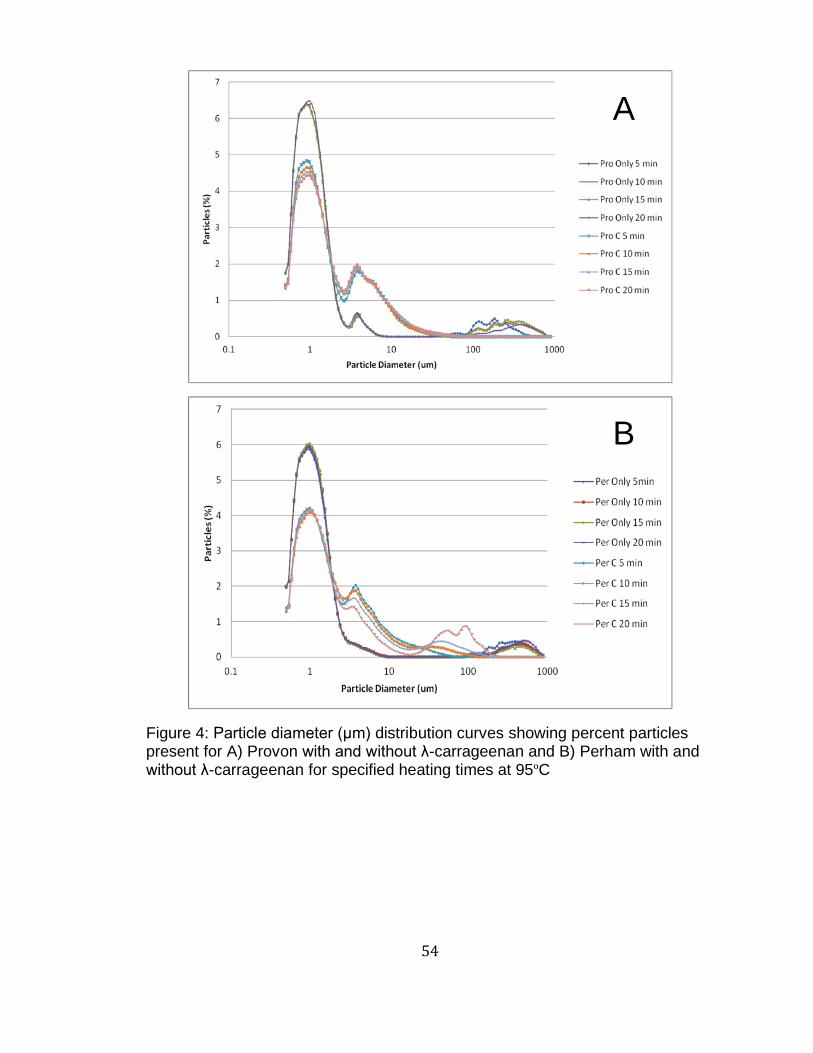
54
A
B
Figure 4: Particle diameter (μm) distribution curves showing percent particles present for A) Provon with and without λ-carrageenan and B) Perham with and without λ-carrageenan for specified heating times at 95ºC

55
B A
C D
Figure 5: Protein particles A) Perham Only, B) Provon Only, C) Perham + λ-carrageenan, D) Provon + λ-carrageenan at varying heat times--clockwise from black marker: 5 min, 10 min, 15 min, 20 min heat treatment at 95ºC

56
3.3.2 Protein:Polysaccharide Interactions
Without heat, one would expect few interactions to occur to occur between
proteins (Monahan, German, & Kinsella, 1995). In a study by Monahan et al.,
unheated whey protein evaluated by SDS-PAGE indicated very minimal amounts
of polymerization had occurred (Monahan et al., 1995). In gel A of Figure 6, the
typical whey protein banding pattern can be seen. The most prominent band,
BLG, typically occurs at around 18kDa, A-LAC should be at 14kDa, and bovine
serum albumin (BSA) occurs at 69kDa (Miguel Angel de la Fuente et al., 2002).
Each of these bands are present at the expected molecular weight in lane O of
gel A of Figure 6. Other bands present may be an indication of minor aggregates
occurring (Miguel Angel de la Fuente et al., 2002). These bands appearing in
lane O and S1 are soluble in water. Lanes P1 and S2 have been subjected to a
1% sodium dodecyl sulfate (SDS) solution which is meant to break down any
existing electrostatic, non-covalent, and hydrophobic interactions. These lanes in
gel A show a very light smear. This is an indication that, without heat treatment, a
very small amount of electrostatic, non-covalent, or hydrophobic interactions
occured. This is consistent with other studies, which found electrostatic
interactions occurring between whey proteins (Monahan et al., 1995). Lanes P2,
S3, and P3 all contained protein treated with β-mercaptoethanol (BME) to break
disulfide bonds. As no bands are present in these lanes in gel A, this is an
indication that no disulfide bonding was occurring between unheated whey
proteins. Additionally,the unheated whey protein lanes may be compared to the
lanes containing unheated whey protein and λ-carrageenan. Figure 6, gel A,
shows no differences between these two treatments. These results suggest that,
without heat treatment, the presence of λ-carrageenan has no effect on whey
protein.
In gel B of Figure 6, the same treatments as gel A have been subjected to
5 minutes of heat at 95ºC, allowing for the denaturation and subsequent
aggregation of whey protein. A dramatic difference between gel A and gel B can

57
be seen. In gel B, lane O has a similar banding pattern as gel A, but much of the
protein remains in the well and was too large to run through the gel. This
suggests that aggregation occurred; however, a small fraction remains
unaggregated and soluble in water. After the addition of 1% SDS, the aggregates
remain unaffected. They are still evident in the well of P1 and no bands appear.
This is an indication that heat treated whey proteins are participating in
polymerization reactions other than electrostatic, non-covalent, and hydrophobic
interactions. After the addition of BME, however, the aggregates are no longer
present in the well. As shown in lane P2, the aggregates have been successfully
broken down. This is evident as much of the BLG and A-LAC have been returned
to their monomeric states at molecular weights of 18 and 14kDa, respectively.
This indicates that interactions occurring had been disulfide bonds. It has been
found that some non-covalent interactions play a role in BLG aggregation
formation (Hoffmann & Mil, 1997). The presence of these non-covalent
interactions is supported by lanes P1 and S2 of gel A. After heating, however,
these non-covalent interactions disappear, as evident by lanes P1 and S2 of gel
B. This is an indication that, once whey proteins are heated, disulfide bonding
becomes the favored interaction which dominates aggregate formation. This
conclusion is supported by other research, which found non-covalent interactions
to be playing a minimal role compared to disulfide bonding (Hoffmann & Mil,
1997). Other studies suggest that while non-covalent interactions play a minimal
role in aggregate formation, this attribute is temperature dependent (Galani &
Apenten*, 1999; Photchanachai & Kitabatake, 2001). In fact, it was reported that
non-covalent interactions became more important for aggregates formed at
temperatures higher than 90ºC (Galani & Apenten*, 1999; Photchanachai &
Kitabatake, 2001). Samples in this experiment were subjected to a heat
treatment of 95ºC, yet non-covalent interactions were not present. Some banding
still appears between 47-73 kDa in lanes P2, S3, and P3 in addition to some
protein smearing. While one band may be BSA at 69kDa, the presence of the
other band suggests an unbroken, non-disulfide, covalent bond. These covalent

58
bonds could be a result of the glycosylation of whey protein. In samples of pure
BLG, A-LAC, or BSA, non-disulfide, covalent interactions are not reported
(Miguel Angel de la Fuente et al., 2002). However, both Provon and Perham are
not pure whey protein fractions. Although at a small percentage, lactose is
present. In a Maillard reaction, lactose has been found to react with the lysine
group of proteins (Jones, Tier, & Wilkins, 1998). Although typically this reaction
occurs between lactose and casein protein in milk, it has also been known to
occur with BLG (Jones et al., 1998; Van Boekel, 1998). A study by Roufik et al.,
also reported the presence of non-disulfide covalent interactions in commercial
whey protein concentrate aggregates, which were attributed to complexes
formed between the whey protein and lactose (Roufik, Paquin, & Britten, 2005).
In comparing heated whey protein samples with and without λ-carrageenan, gel
B shows an identical banding pattern. This experiment, therefore, suggests that
λ-carrageenan is not directly interacting with the whey protein.
Further studies were done to compare results between the whey protein
isolate sources. These results are shown in Figure 7. The smear of bands in
lanes P2 and P3 of Perham and Provon Only treatments suggest the presence of
large aggregates. As these smears are not as evident in treatments of Provon
and Perham with λ-carrgeenan, it can be concluded that the presence of λ-
carrageenan is preventing whey protein aggregation. The banding patterns
between treatments with Provon and treatments with Perham appear similar. As
shown in Figure 7, light bands appear in lanes P1 and S2 for Provon samples but
cannot be seen in those lanes of Perham. This is an indication that some
hydrophobic or electrostatic interactions may have occurred in samples
containing Provon, with or without λ-carrageenan. This could be explained by the
high proportion of GMP in Provon whey protein. As stated previously, GMP is
known to prevent the aggregation BLG (Croguennec et al., 2014). The study by
Croguennec et al. suggests that in the presence of GMP, BLG aggregation is
likely to occur by hydrophobic interaction. The GMP prevents the protein
aggregation at this stage before further disulfide bonding can occur (Croguennec
59
et al., 2014).
The results of this SDS-PAGE experiment may be used to
determine if interactions between whey protein and λ-carrageenan are occurring.
As discussed previously, this knowledge is important as it may determine how
the fat replacer will behave later in the cheese matrix. λ-Carrageenan has three
sulfate groups, making it an ideal candidate for electrostatic interactions with
whey proteins (Weinbreck et al., 2004). Typically, these interactions occur when
the protein is below the isoelectric point. At this point (pH 5.2 for whey protein),
the protein is positively charged and more likely to participate in electrostatic
interactions (Weinbreck et al., 2004). In this experiment, the pH of the samples
did not drop below pH 6.0, but electrostatic interactions may still occur as positive
patches on the surface of whey protein above their isoelectric point are still
available (Weinbreck et al., 2004). The results of this experiment suggest,
however, that no electrostatic, hydrophobic, or non-covalent interactions are
occurring. This is evident by the lack of bands in P1 and S2 for all samples.
Additionally, the banding patterns between the treatments with and without λ-
carrageenan appear identical. As shown in Figure 6 and Figure 7, the prominent
bands in the treatments appear at the same molecular weights, although some
smearing of aggregates appears in treatments with protein only. This suggests
that while λ-carrageenan is not interacting with the whey protein, it is likely
creating a barrier, preventing whey protein aggregation.
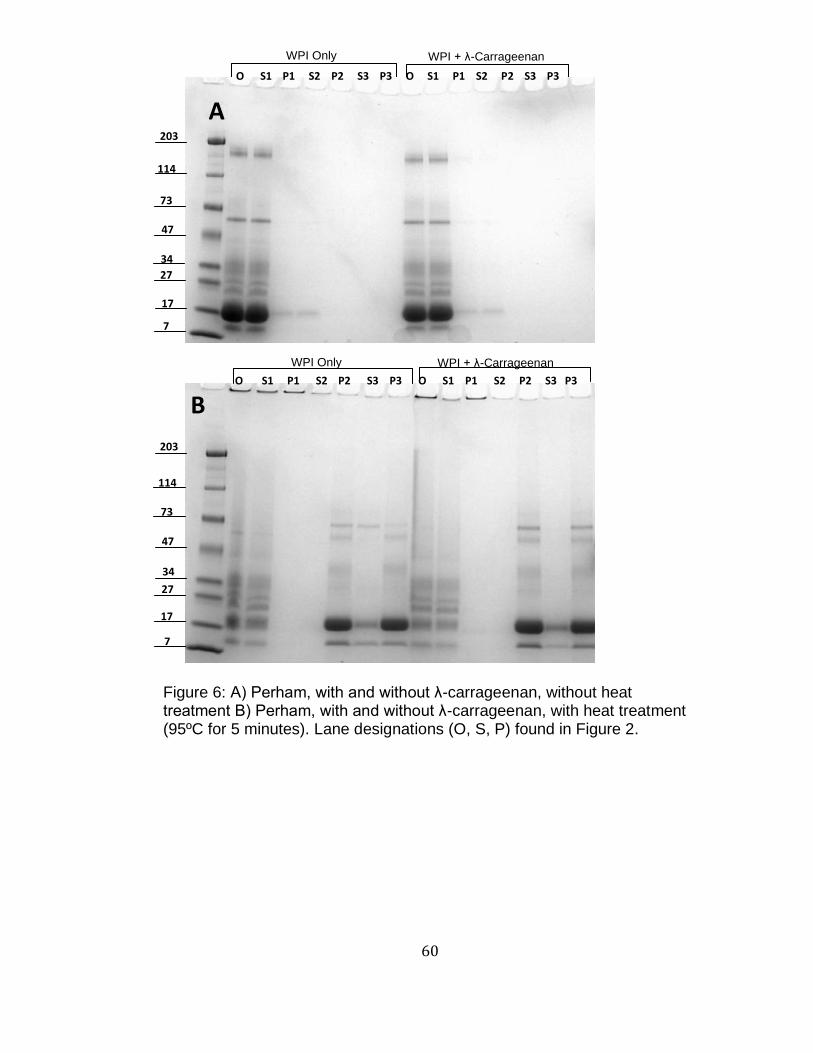
60
O S1 P1 S2 P2 S3 P3 O S1 P1 S2 P2 S3 P3
A 203
114
73
47
34
27
17
7
O S1 P1 S2 P2 S3 P3 O S1 P1 S2 P2 S3 P3
B
203
17
114
34
27
47
73
7
WPI Only WPI + λ-Carrageenan
WPI + λ-Carrageenan WPI Only
Figure 6: A) Perham, with and without λ-carrageenan, without heat treatment B) Perham, with and without λ-carrageenan, with heat treatment (95ºC for 5 minutes). Lane designations (O, S, P) found in Figure 2.

61
203
114
73
47
34
27
17
7
O S1 P1 S2 P2 S3 P3 O S1 P1 S2 P2 S3 P3 O S1 P1 S2 P2 S3 P3 O S1 P1 S2 P2 S3 P3
Perham + Carrageenan Perham Only Provon + Carrageenan Provon Only
Figure 7: SDS-PAGE of fat replacers subjected to 1% SDS and BME. Provon and Perham Only as control. Molecular weights of the molecular marker listed (kDa). Lane designations as described in Figure 2.

62
3.3.3. Gel Properties
Milk standardized to 0.54% fat with varied levels of fat replacer was
renneted and subjected to a time sweep test at a controlled % strain and
frequency for 30 minutes. Throughout this time, gelation of the milk occured and
the storage modulus (G’) and loss modulus (G’’) increased. G’, or storage
modulus, is a measure of the elastic and solid properties of the forming gel
(Gunasekaran & Ak, 2003). G’’, or the loss modulus, was a measure of the
viscous properties of the forming (Gunasekaran & Ak, 2003). Each fat replacer
was added at different levels to understand the effect that the fat replacers would
have on gel formation during renneted cheese making. Low fat milk, containing
no fat replacer, was used as a control. A sample curve of the control is shown in
Figure 8. This curve displays the typical progression of gel formation. This
sample curve matches well with milk gel curves described in literature (Uludogan,
1999). At around 200 seconds, a sharp increase in moduli is seen. This
phenomenon is explained by Walstra et al. as the increase in bonding between
micelles (Walstra, 1999). As aggregation of the micelles continue, the moduli
continue to increase, resulting in a firming of the gel (Lomholt & Qvist, 1999) In
this time sweep test, resultant gel strength was described by G’, at 30 minutes
(Lomholt & Qvist, 1999). At this point, in all gels, the moduli have reached a
plateau. A study of acid milk gels found the same plateau in gel firmness
occurring at 30 minutes (J.A. Lucey, Munro, & Singh, 1998). Gel time was
described as the point at which the storage modulus crosses over the loss
modulus, thus indicating an increase in elasticity and the domination of this
elasticity over more viscous properties (Gunasekaran & Ak, 2003).
As shown in Table 6, a general decrease in G’ at 30 minutes occurs with
the increase of fat replacer incorporation, regardless of fat replacer type. This
can also be seen in Figure 9.The control, low fat milk without fat replacer, had the
highest G’ at 30 minutes, indicating it had the firmest gel. To examine the effects
that the fat replacer incorporation had on the milk gel formation, comparisons
63
were made between the control and those with fat replacer. The control’s G’ at
30 minutes was significantly different (p<0.05) than Provon Medium, Provon
High, Perham Medium, and Perham High. However, the control was not
significantly different than Provon Low or Perham Low. Therefore, gels made
from low fat milk containing the lowest level of each fat replacer were able to
reach the firmness of the low fat control. The presence of the fat replacers at
higher concentrations, as in Provon High and Perham High, produced a weaker
gel at 30 minutes. Because the increasing elastic modulus is indicative of
increasing casein micelle aggregation, a weaker elastic modulus may be an
indication of reduced casein micelle aggregation. A study by Srinivasan et al.,
reported similar findings of decreased elastic modulus in milk gels in which
plasmin, an enzyme which breaks down casein, was present (Srinivasan &
Lucey, 2002). As plasmin content increased, casein degradation increased, and
the resulting milk gel became weaker (Srinivasan & Lucey, 2002).
The weaker gels produced by milk containing higher levels of fat replacers
could be due to a number of phenomena. The presence of whey protein may be
hindering gel formation between the caseins (van Vliet, Lakemond, & Wisschers,
2004). When denatured, they have the ability to bind with casein and form
bridges, thus increasing gel firmness (Lucey et al., 1998). This phenomenon has
been seen in acid milk gels that have been subjected to high heat treatment,
which allows for the denaturation of whey proteins (Lucey et al., 1998). A similar
effect of gel firming can be achieved by adding pre-denatured whey proteins to
milk (Catherine Schorsch, Deborah K. Wilkins, Malcolm G. Jones, & Ian T.
Norton, 2001). In the present experiment, the addition of fat replacers was found
to decrease gel firmness. The whey protein present, already subjected to heat
treatment, may exist primarily as aggregates and are, therefore, not available to
produce casein-whey bridges. Additionally, the whey protein content of the fat
replacers may not be sufficient to encourage casein-whey protein interactions.
Finally, research has suggested the fat replacers that produce a decrease in gel
firmness exist as inert fillers, not interacting with the surrounding gel matrix (J.A.
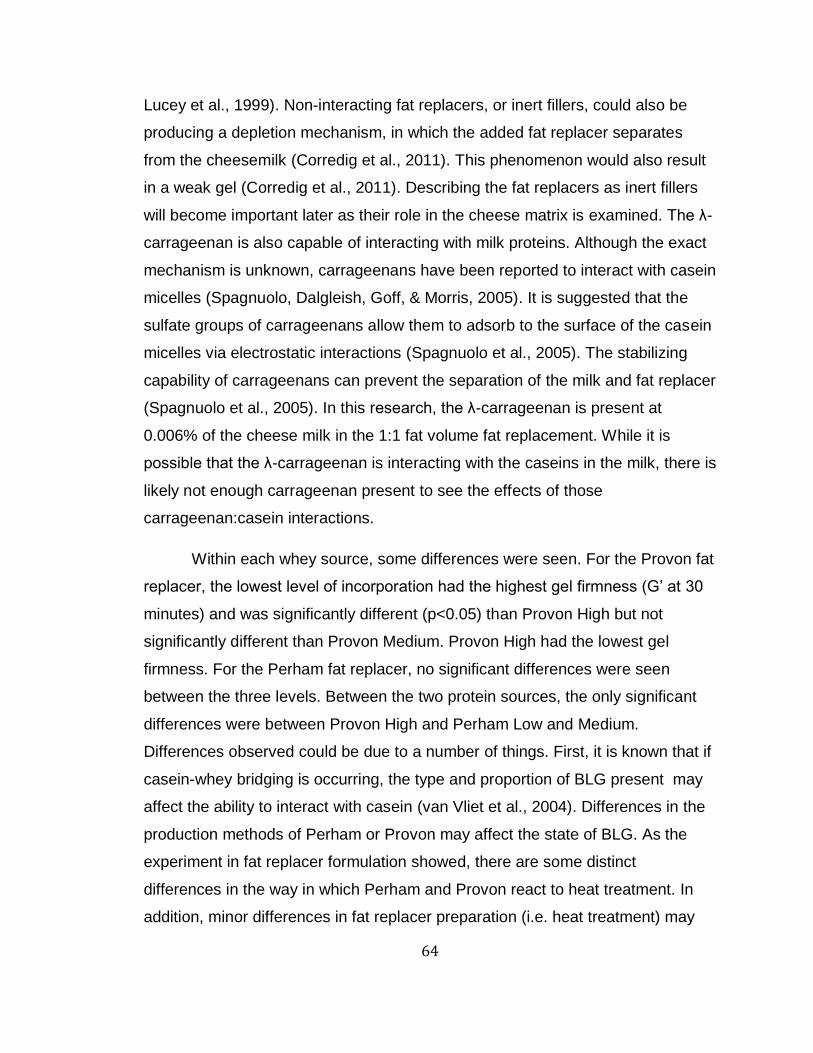
64
Lucey et al., 1999). Non-interacting fat replacers, or inert fillers, could also be
producing a depletion mechanism, in which the added fat replacer separates
from the cheesemilk (Corredig et al., 2011). This phenomenon would also result
in a weak gel (Corredig et al., 2011). Describing the fat replacers as inert fillers
will become important later as their role in the cheese matrix is examined. The λ-
carrageenan is also capable of interacting with milk proteins. Although the exact
mechanism is unknown, carrageenans have been reported to interact with casein
micelles (Spagnuolo, Dalgleish, Goff, & Morris, 2005). It is suggested that the
sulfate groups of carrageenans allow them to adsorb to the surface of the casein
micelles via electrostatic interactions (Spagnuolo et al., 2005). The stabilizing
capability of carrageenans can prevent the separation of the milk and fat replacer
(Spagnuolo et al., 2005). In this research, the λ-carrageenan is present at
0.006% of the cheese milk in the 1:1 fat volume fat replacement. While it is
possible that the λ-carrageenan is interacting with the caseins in the milk, there is
likely not enough carrageenan present to see the effects of those
carrageenan:casein interactions.
Within each whey source, some differences were seen. For the Provon fat
replacer, the lowest level of incorporation had the highest gel firmness (G’ at 30
minutes) and was significantly different (p<0.05) than Provon High but not
significantly different than Provon Medium. Provon High had the lowest gel
firmness. For the Perham fat replacer, no significant differences were seen
between the three levels. Between the two protein sources, the only significant
differences were between Provon High and Perham Low and Medium.
Differences observed could be due to a number of things. First, it is known that if
casein-whey bridging is occurring, the type and proportion of BLG present may
affect the ability to interact with casein (van Vliet et al., 2004). Differences in the
production methods of Perham or Provon may affect the state of BLG. As the
experiment in fat replacer formulation showed, there are some distinct
differences in the way in which Perham and Provon react to heat treatment. In
addition, minor differences in fat replacer preparation (i.e. heat treatment) may
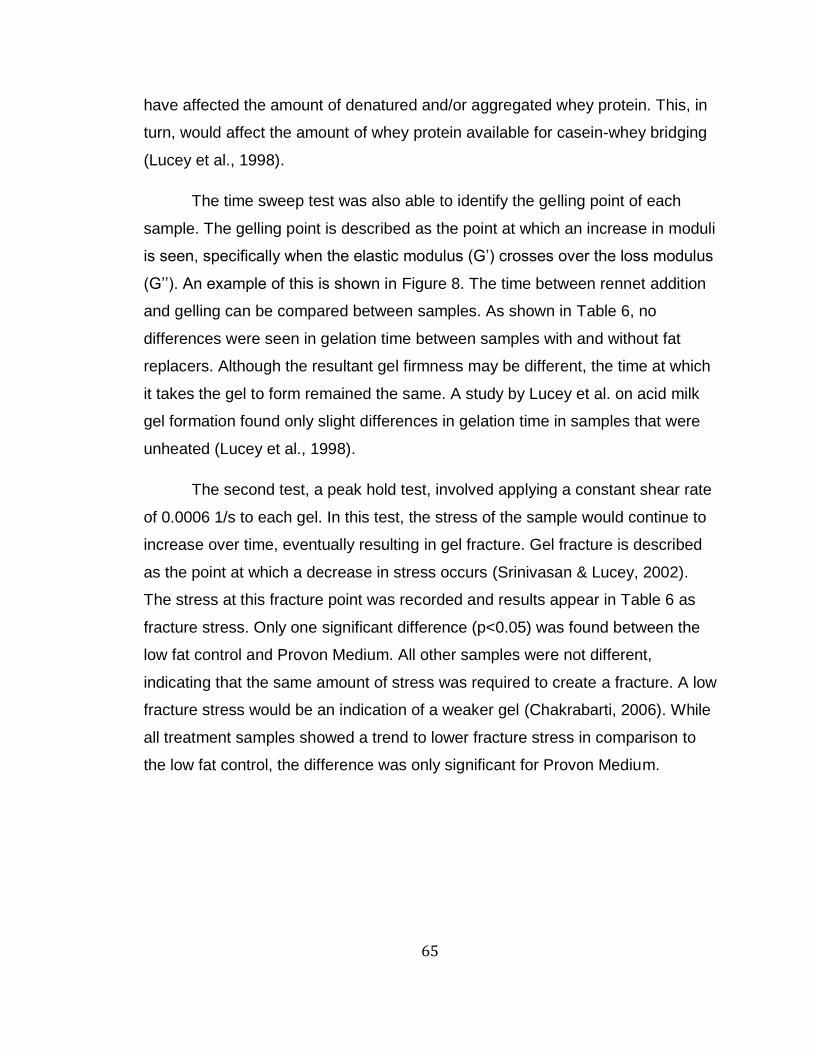
65
have affected the amount of denatured and/or aggregated whey protein. This, in
turn, would affect the amount of whey protein available for casein-whey bridging
(Lucey et al., 1998).
The time sweep test was also able to identify the gelling point of each
sample. The gelling point is described as the point at which an increase in moduli
is seen, specifically when the elastic modulus (G’) crosses over the loss modulus
(G’’). An example of this is shown in Figure 8. The time between rennet addition
and gelling can be compared between samples. As shown in Table 6, no
differences were seen in gelation time between samples with and without fat
replacers. Although the resultant gel firmness may be different, the time at which
it takes the gel to form remained the same. A study by Lucey et al. on acid milk
gel formation found only slight differences in gelation time in samples that were
unheated (Lucey et al., 1998).
The second test, a peak hold test, involved applying a constant shear rate
of 0.0006 1/s to each gel. In this test, the stress of the sample would continue to
increase over time, eventually resulting in gel fracture. Gel fracture is described
as the point at which a decrease in stress occurs (Srinivasan & Lucey, 2002).
The stress at this fracture point was recorded and results appear in Table 6 as
fracture stress. Only one significant difference (p<0.05) was found between the
low fat control and Provon Medium. All other samples were not different,
indicating that the same amount of stress was required to create a fracture. A low
fracture stress would be an indication of a weaker gel (Chakrabarti, 2006). While
all treatment samples showed a trend to lower fracture stress in comparison to
the low fat control, the difference was only significant for Provon Medium.

66
Table 6: Effects of fat replacer protein source and amount added on lowfat milk gel formation, strength, and fracture rheological properties1
Low Fat Provon Low
Provon Medium
Provon High
Perham Low
Perham Medium
Perham High
a-b Means within the same row with different superscript significantly differ (p<0.05) 1Measurements performed on the AR-G2 rheometer using cup/bob peltier concentric cylinder 2All tests performed in triplicate, standard deviations shown 3Samples were treated with one of two fat replacers: a 1:25 mixture of either λ-carrageenan:Provon or λ-carrageenan:Perham, both heat treated at 95ºC for 5 minutes. Low Fat is the control with no fat replacers. Low, Medium, and High treatment refer to fat replacement by volume 1:0.05, 1:1, and 1:1.5 respectively 4G’ (Pa) refers to the maximum G’ at 30 minutes of the time sweep test 5Gel Time (s) refers to the time at which G’ values cross over G’’ values in the time sweep test
6Fracture Stress (Pa) refers to the peak stress obtained in the peak hold test
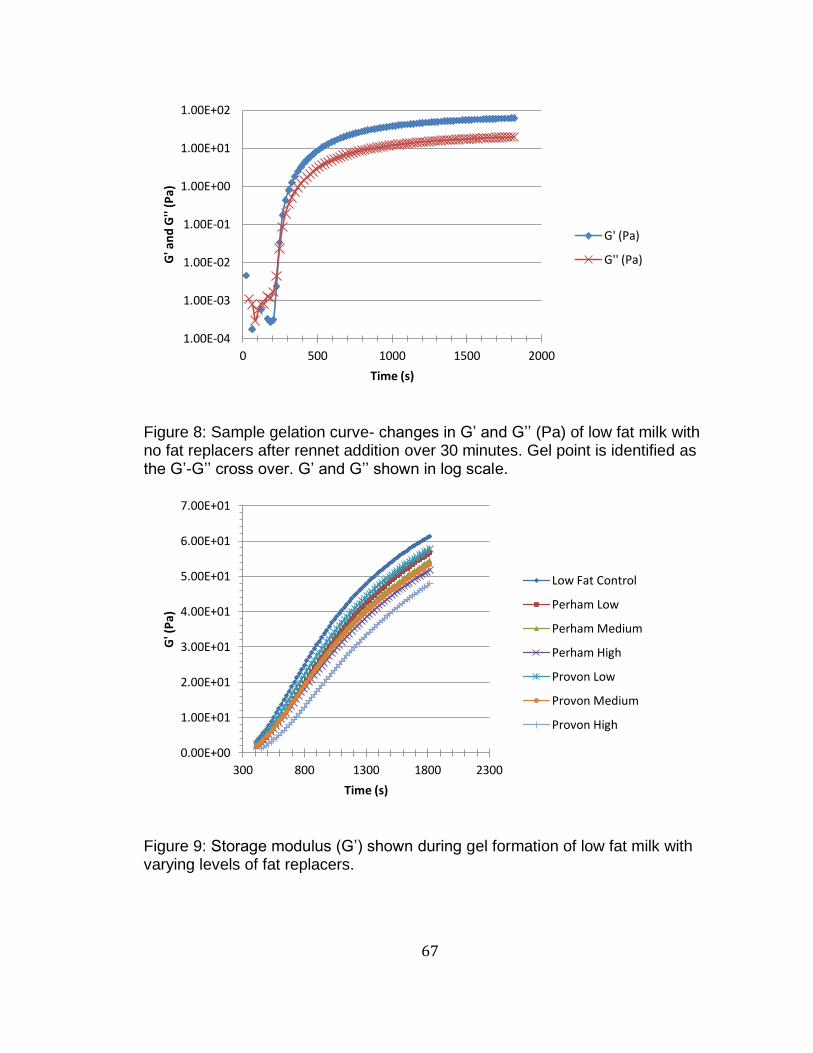
67
Figure 8: Sample gelation curve- changes in G’ and G’’ (Pa) of low fat milk with no fat replacers after rennet addition over 30 minutes. Gel point is identified as the G’-G’’ cross over. G’ and G’’ shown in log scale.
Figure 9: Storage modulus (G’) shown during gel formation of low fat milk with varying levels of fat replacers.
1.00E-04
1.00E-03
1.00E-02
1.00E-01
1.00E+00
1.00E+01
1.00E+02
0 500 1000 1500 2000
G' a
nd
G''
(Pa)
Time (s)
G' (Pa)
G'' (Pa)
0.00E+00
1.00E+01
2.00E+01
3.00E+01
4.00E+01
5.00E+01
6.00E+01
7.00E+01
300 800 1300 1800 2300
G' (
Pa)
Time (s)
Low Fat Control
Perham Low
Perham Medium
Perham High
Provon Low
Provon Medium
Provon High
68
3.4 Conclusions
The results of the fat replacer formulation experiments found that λ-
carrageenan was able to successfully inhibit whey protein aggregation. This
reduction in particle size is desirable to mimic fat properties. Both PerC and ProC
at 5 minutes of heating time at 95ºC were selected as fat replacers for further
studies. The results of the SDS-PAGE to characterize the interactions occurring
in these fat replacers suggests that the λ-carrageenan is not interacting with the
whey protein and the mechanism involved in decreased aggregation is due to
physically preventing whey protein aggregation. Few differences are seen
between samples containing Provon and Perham. Provon may contain more
hydrophobically or electrostatically combined whey protein aggregates due to its
increased GMP content. Finally, results of the gel formation studies showed that
higher levels of fat replacer incorporation produced weaker cheese gels.
However, the cheese gels formed by medium and high fat replacer incorporation
were still capable of producing firm enough gels for cheesemaking. Therefore,
these two levels of fat replacer addition will be studied in future experiments.
4. Fat Replacers in Low Fat Cheddar Cheese
4.1 Introduction
From the development of characteristic flavor to defining texture, fat plays
a key role in cheese (Fox et al., 2000). In Cheddar cheese, a 50g serving will
carry 17g of fat (Fox et al., 2000) If this key player is removed, a definite
reduction in quality can be observed (Fox et al., 2000). As fat is removed, the
protein matrix becomes more dense (Gunasekaran & Ak, 2003). The resulting
texture of low fat cheese is described as rubbery and firm (Chakrabarti, 2006;
Gunasekaran & Ak, 2003). In order to achieve a low fat claim, the fat in cheese
69
must be reduced to 6% or less.
To combat this issue, fat replacers, produced from either protein or
polysaccharides, have been utilized to mimic fat properties and produce a texture
in low fat cheese that is similar to its full fat counterpart (Law & Johnson, 1999).
Common fat replacers are produced from whey protein, microcrystalline
cellulose, lecithin, guar gum, and microparticulated protein (M. A. Drake,
Boylston, & Swanson, 1996; Law & Johnson, 1999). Thus far, studies have found
varying and disappointing results (Aryana & Haque, 2001; Chakrabarti, 2006;
Drake, Boylston, et al., 1996; Law & Johnson, 1999).
In the previous section, the possibility of a protein:polysaccharide
combination fat replacer was explored. This resulted in a fat replacer containing
non-interacting whey proteins and λ-carrageenan that produced particles similar
to the size of fat. We hypothesized that the protein:polysaccharide fat replacers
would improve the texture of a low fat Cheddar cheese, making the cheese less
firm and rubbery and more like that of a full fat Cheddar cheese. The objective of
this research was to evaluate the textural properties of cheeses with and without
fat replacers using instrumental techniques. In addition, microscopy would be
performed to evaluate cheese texture before and after compression of samples.
4.2 Materials and Methods
4.2.1. Materials
Milk was obtained from Autumnwood Farms (Forest Lake, MN). The milk
was unhomogenized whole milk and a homogenized skim milk. The culture used
was a bulk set culture of Lactococcus lactis subs. lactis and Lactococcus lactis
subs. cremoris (M30, Danisco) and added at a rate of 1% of the total cheese
milk. Chymax M1000, camel rennet, was used at a rate of 0.03mL/lb milk for the
low fat cheeses and 0.04mL/lb for the full fat cheeses and was diluted 50X with
deionized water before addition (CHR Hansen, Denmark). Salt was added at a
rate of 0.2% of the original cheese milk weight. The fat replacers were
70
formulated from either Provon 190 Whey Protein Isolate (Glanbia Nutritionals,
Fitchburg, WI) or Perham Instant Whey Protein Isolate (Bongards’ Creameries,
Bongards, MN). Both were mixed with Coyote Brand C-Pro λ-carrageenan (Gum
Technology, Tucson, AZ) at a polysaccharide:protein ratio of 1:25. Fat replacer
mixtures were heated at 95ºC for 5 minutes in 25mL glass tubes.
4.2.2. Cheese Production
The day prior to cheese production, fat replacers were prepared according
to Appendix 7.1.1. The two fat replacers used, determined by testing as
described in Chapter 3, were whey proteins, Provon 190 whey protein isolate
(Glanbia) and Perham whey proteins (Bongards’ Creamery), each combined at a
polysaccharide:protein ratio of 1:25 with Coyote Brand C Pro λ-carrageenan
(Gum Technology). After heat treatment, the fat replacers were stored at 4C until
use the next day. The fat replacers were added in a way to replace fat by volume
either 1:1 or 1:1.5 and referred to as low or high fat replacer inclusion,
respectively. This was calculated by examining the fat volume lost in producing a
low fat cheese versus a full fat cheese. In a 50g 3.6% full fat milk sample,
1.85mL of fat would be present. After an 80% reduction in fat to achieve low fat,
the fat volume lost is approximately 1.5mL. Thus, in order to replace fat 1:1,
1.5mL of fat replacer should be added. For the low, 1:1 inclusion rate, each fat
replacer was added at a rate of 3.1% of the cheese milk weight. At this rate, λ-
carrageenan was present at 0.006% of the total cheese milk weight and the whey
protein was present at 0.157% of the total cheese milk weight. At the high 1:1.5
inclusion rate, each fat replacer was added at a rate of 4.7% of the cheesemilk
weight. At this rate, λ-carrageenan was present at 0.009% of the cheesemilk
weight, and the protein was present at 0.235% of the cheese milk weight. The
bulk culture was prepared one day before cheese making. A frozen stock was
thawed in the refrigerator. 500mL of milk were heated in a water bath at 90ºC for
one hour, stirring periodically to prevent burning and to encourage even heat
71
distribution. After cooling to room temperature, the thawed M30 was added at a
rate of 1% (e.g.- 5mL culture for 500mL milk). The milk was stirred, covered, and
allowed to sit at room temperature overnight (at least 12 hours) until the pH was
4.4 or less.
Whole milk and skim milk were mixed to standardize the fat. For low fat
cheeses, the target fat was 0.54%. For full fat cheeses, the target was 3.5% fat.
These numbers were calculated using Pearson Square and confirmed using the
Babcock method of fat determination (Appendix 7.2.2.). Fat replacers were
produced the day prior to cheese making, refrigerated, and then added at the
desired inclusion rate. Fat replacers were added to the cheese milk once in the
vat but prior to heating the milk. Full fat and low fat control cheeses without any
fat replacers were also made. Each cheese type was made in triplicate, for a total
of 18 cheeses produced. Cheeses were made following either the full fat or low
fat stirred curd method, which can be found in Appendix 7.2.1. A 1:10 lactic
acid:distilled water solution was added to low fat cheese milk, prior to heating, to
reduce the starting pH to 6.2. Throughout the cheese making process, pH and
TA measurements were taken to ensure all cheeses reached the same targets.
Milk was warmed to 88ºF before culture addition. Both low fat and full fat stirred
curd methods began by adding the culture (130g culture in 13kg cheesemilk). A
drop in TA was expected to confirm the activity of the culture. Rennet was then
added and allowed to rest for approximately 20 minutes. The cheese gel was
tested using a knife to ensure proper firmness before cutting. Once the cheese
gel was cut, it was allowed to rest for 5 minutes to allow healing of the curds.
During the cooking period, temperatures were increased and the curds were
stirred periodically. For full fat cheese, the temperature is increased gradually to
102ºF. For low fat cheeses, the temperature is increased gradually to 96ºF. Once
the correct pH and TA had been reached (.14 TA for low fat, .12 TA for full fat),
draining of the whey began in increments. After all the whey had been drained,
salt was added in three separate increments. Cheese curds were hooped in a
cheesecloth lined cylindrical press, pressure was applied to 80 on the scale, and

72
the cheese was pressed overnight at room temperature conditions. The following
day, cheeses were removed from the hoops, vacuum sealed and stored in
refrigerated conditions until analysis.
4.2.3. Composition Analysis
Cheese composition was measured at one month and two months of
aging. At month one, the cheeses were tested for moisture, pH, fat, protein,
proteolysis, and ash. Moisture was determined based on the vacuum oven
method (Method 15.111 Class O) (Wehr & Frank, 2004) . Total protein was
analyzed by Dumas using the Buchi DuMaster, which measures nitrogen using
combustion at 960ºC (Buchi DuMaster D-480, Switzerland). Fat was measured
using the Babcock method for cheese (Method 18.8 Class O) and can be found
in appendix 7.2.2. (Case, Bradley, & Williams, 1985; Wehr & Frank, 2004).
Analysis of pH was performed using an Accumet Basic AB15 pH meter (Fisher
Scientific), and the method can be found in appendix 7.2.8. Total ash was
determined by muffle furnace according to Method 15.041 Class O (Hooi et al.,
2004; Wehr & Frank, 2004). Proteolysis was determined using a water-soluble
nitrogen extraction method (Kuchroo & Fox, 1982). After sample preparation,
nitrogen was analyzed using the Buchi DuMaster Dumas method. Protein,
proteolysis, and pH were repeated at month two of aging.
4.2.4. Texture analysis
Oscillatory stress was measured on 1 mm thick, 25 mm wide round
cheese samples on parallel plates on a AR-G2 rheometer (TA Instrument’s, New
Castle, DE) . Samples were sliced with a razor blade, and the thickness of the
sample was confirmed by measuring with calipers. The cheese samples were
placed in sealed plastic bags to avoid moisture loss. They were allowed to
equilibrate to room temperature for a minimum of one hour prior to analysis. The
top plate was serrated in a cross-hatched pattern and fiber-glass tape that had a

73
similar cross-hatched pattern was attached to the bottom plate with a
cyanoacrylate glue. Between each sample, the tape was removed using acetone
and a fresh piece of tape attached. The cheese sample was placed on the lower
plate and the gap adjusted to 1000 micrometers. The normal force was zeroed
and allowed to stabilize before testing began. A small amount of silicone oil was
applied to the exposed surface edge of the cheese to prevent drying during the
test. The first test performed was a stress sweep step. For low fat cheeses, the
oscillatory stress was ramped from 1.0 to 4,000 Pa with 10 points per decade.
The test was performed at room temperature and the frequency set at 0.5 Hz.
For full fat cheeses, the oscillatory stress was ramped from 1.0 to 300 Pa with 10
points per decade. The test was also performed at room temperature and the
frequency set at 0.5 Hz. This test was performed to determine the linear
viscoelastic region (LVE) of the cheese. Breakdown of cheese did not occur and
was confirmed by repetition of this test.
This same rheometer was also used in compression testing of
cheeses aged 2.5 months. The test performed was a squeeze/pull off test in
compression mode. Samples were cut to 15mm diameter using a cork borer.
Calipers were then used to measure and cut a height of 20mm. All samples were
stored in plastic bags until they reached room temperature. Light mineral oil was
used on both the top and bottom of the sample to prevent friction. Samples were
compressed by 30% of the starting height at a constant gap speed of 200
micrometers/second. The upper geometry of the instrument was a 40mm steel
parallel plate. The bottom geometry was a peltier plate set to room temperature.
Tests were performed in triplicate.
Texture profile analysis was performed using a TA XT plus Texture
Analyzer (Texture Technologies, Hamilton, MA). A number 12 cork borer (15 mm
diameter) was used to prepare plugs of each cheese sample. The cheese
samples were stored in sealed plastic bags and allowed to equilibrate to room
temperature for a minimum of 5 hours. At the time of testing, a parallel-wire
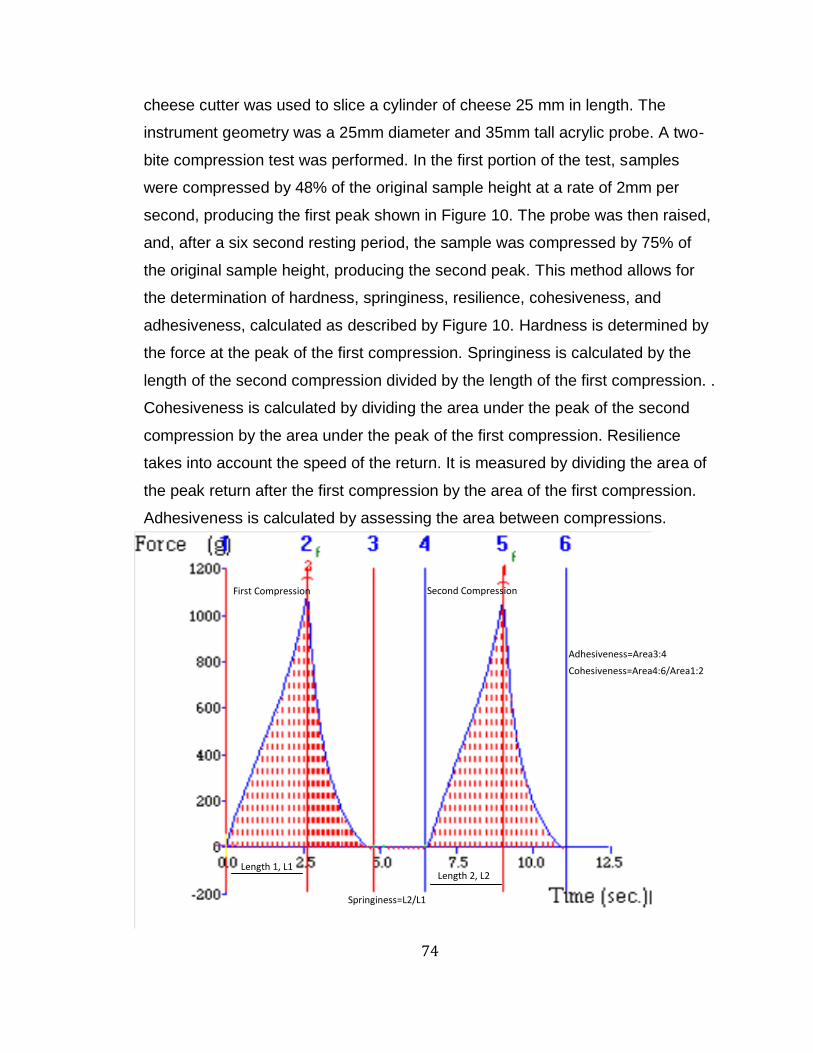
74
cheese cutter was used to slice a cylinder of cheese 25 mm in length. The
instrument geometry was a 25mm diameter and 35mm tall acrylic probe. A two-
bite compression test was performed. In the first portion of the test, samples
were compressed by 48% of the original sample height at a rate of 2mm per
second, producing the first peak shown in Figure 10. The probe was then raised,
and, after a six second resting period, the sample was compressed by 75% of
the original sample height, producing the second peak. This method allows for
the determination of hardness, springiness, resilience, cohesiveness, and
adhesiveness, calculated as described by Figure 10. Hardness is determined by
the force at the peak of the first compression. Springiness is calculated by the
length of the second compression divided by the length of the first compression. .
Cohesiveness is calculated by dividing the area under the peak of the second
compression by the area under the peak of the first compression. Resilience
takes into account the speed of the return. It is measured by dividing the area of
the peak return after the first compression by the area of the first compression.
Adhesiveness is calculated by assessing the area between compressions.
First Compression Second Compression
Springiness=L2/L1
Cohesiveness=Area4:6/Area1:2
Adhesiveness=Area3:4
Length 1, L1 Length 2, L2
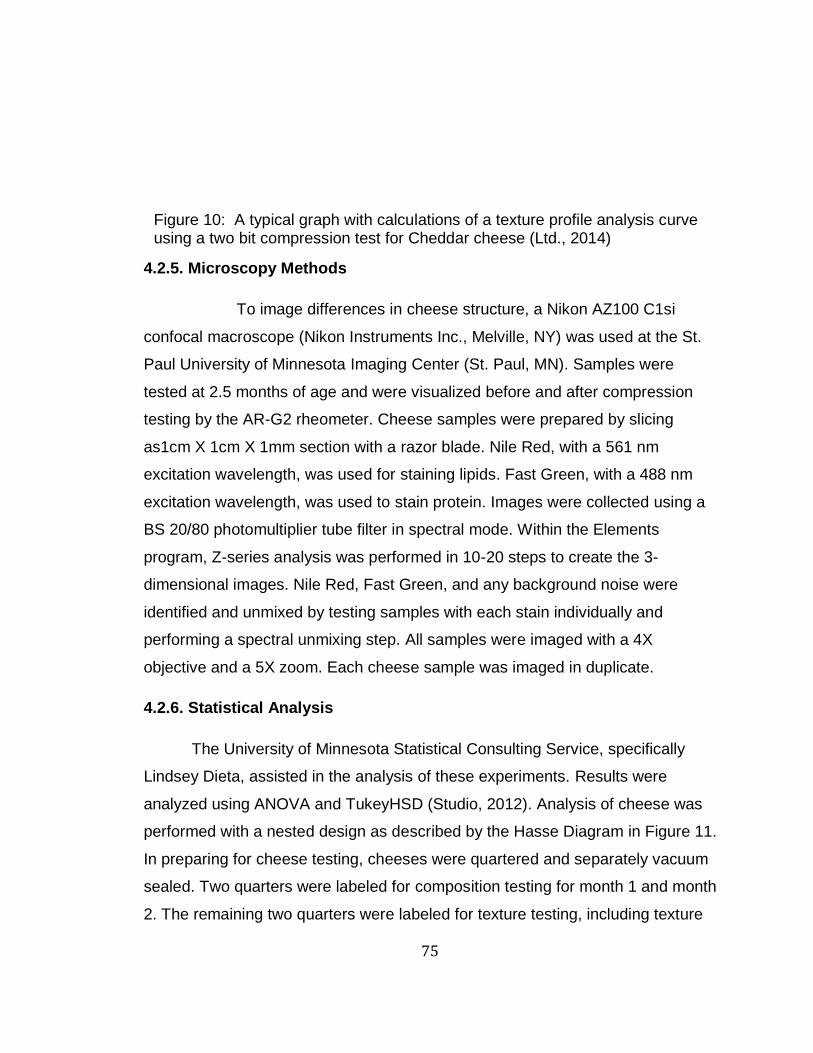
75
4.2.5. Microscopy Methods
To image differences in cheese structure, a Nikon AZ100 C1si
confocal macroscope (Nikon Instruments Inc., Melville, NY) was used at the St.
Paul University of Minnesota Imaging Center (St. Paul, MN). Samples were
tested at 2.5 months of age and were visualized before and after compression
testing by the AR-G2 rheometer. Cheese samples were prepared by slicing
as1cm X 1cm X 1mm section with a razor blade. Nile Red, with a 561 nm
excitation wavelength, was used for staining lipids. Fast Green, with a 488 nm
excitation wavelength, was used to stain protein. Images were collected using a
BS 20/80 photomultiplier tube filter in spectral mode. Within the Elements
program, Z-series analysis was performed in 10-20 steps to create the 3-
dimensional images. Nile Red, Fast Green, and any background noise were
identified and unmixed by testing samples with each stain individually and
performing a spectral unmixing step. All samples were imaged with a 4X
objective and a 5X zoom. Each cheese sample was imaged in duplicate.
4.2.6. Statistical Analysis
The University of Minnesota Statistical Consulting Service, specifically
Lindsey Dieta, assisted in the analysis of these experiments. Results were
analyzed using ANOVA and TukeyHSD (Studio, 2012). Analysis of cheese was
performed with a nested design as described by the Hasse Diagram in Figure 11.
In preparing for cheese testing, cheeses were quartered and separately vacuum
sealed. Two quarters were labeled for composition testing for month 1 and month
2. The remaining two quarters were labeled for texture testing, including texture
Figure 10: A typical graph with calculations of a texture profile analysis curve using a two bit compression test for Cheddar cheese (Ltd., 2014)

76
profile analysis, rheology, and compression testing. Samples were taken away
from the edges of the cheese and in various locations for different replicates.
Analysis of hardness, a texture attribute obtained from the texture profile
analyzer, was analyzed using a log transformation to improve normality of data.
In addition, a log transformation was performed on results of the compression
testing on the AR-G2.
4.3. Results and Discussion
4.3.1. Composition
The results of compositional analysis are shown in Table 7. For a full fat
Cheddar cheese, a fat content of around 33% is expected (Hill, 1995). The full fat
cheeses in this study had an average fat content of 30%. A low fat cheese,
meant to have an 80% reduction in fat content, should have 6% fat or less.
Although the cheese milk fat content was adjusted to target a 6% fat cheese, a
slightly higher fat average resulted. The low fat cheeses in this study were 6.9-
7.5% fat. As expected, the moisture content of the low fat cheeses was found to
be significantly higher than the full fat cheese. Low fat cheeses are produced in a
Mean
Cheese Type
Error
Cheese Rep
Figure 11: Hasse Diagram of nested design in cheese statistical analysis

77
way to increase moisture content in an attempt to improve texture and other
properties (McMahon et al., 1996). However, while the low fat cheeses with fat
replacers had an average higher moisture content than the low fat control, all low
fat cheese treatments were not significantly different from each other. Several
studies have found increased moisture contents in cheeses with fat replacers
(Drake, Boylston, et al., 1996; Lobato-Calleros et al., 2001). A study of low fat
Manchego cheese found carbohydrate based fat replacers had a higher
moisture content than the low fat cheese, while cheese with a protein based fat
replacer did not have a higher moisture content (Lobato-Calleros et al., 2001).
These results suggest that the carbohydrate in this study’s fat replacers, λ-
carrageenan, was either not binding water or there was not enough present to
increase the moisture content significantly. There were no significant differences
between cheeses in ash content or pH. The protein content of a full fat cheese is
expected to be around 25% (Hill, 1995). Indeed, the full fat cheeses in this study
were found to have an average of 26.9% protein. As expected, there was a
significant different in protein content between the full fat and all low fat treatment
cheeses. As fat is removed, the protein in low fat cheeses becomes more
concentrated, producing a high protein cheese. This result is in agreement with
other low fat cheese studies (Drake, Boylston, et al., 1996). The water soluble
nitrogen of the cheeses was also determined and is an indication of the level of
proteolysis that has occurred (Varnam & Sutherland, 1994). There were no
significant differences in proteolysis between cheeses. As proteolysis can have a
large effect on textural differences in cheese, it is important to note that all
cheeses experience the same amount of proteolysis over time.
Protein, water soluble nitrogen, and pH were measured at month 1 and
month 2. The comparison of this data is shown in Table 8. This data shows that
protein content and pH did not significantly change between month 1 and month
2. Water soluble nitrogen, however, did significantly change. Between month 1
and month 2, there was an increase in water soluble nitrogen in cheeses.
Proteolysis occurs as cheeses age (Varnam & Sutherland, 1994). It is expected,

78
then, that the proteolysis in the cheeses would increase in the second month of
aging.
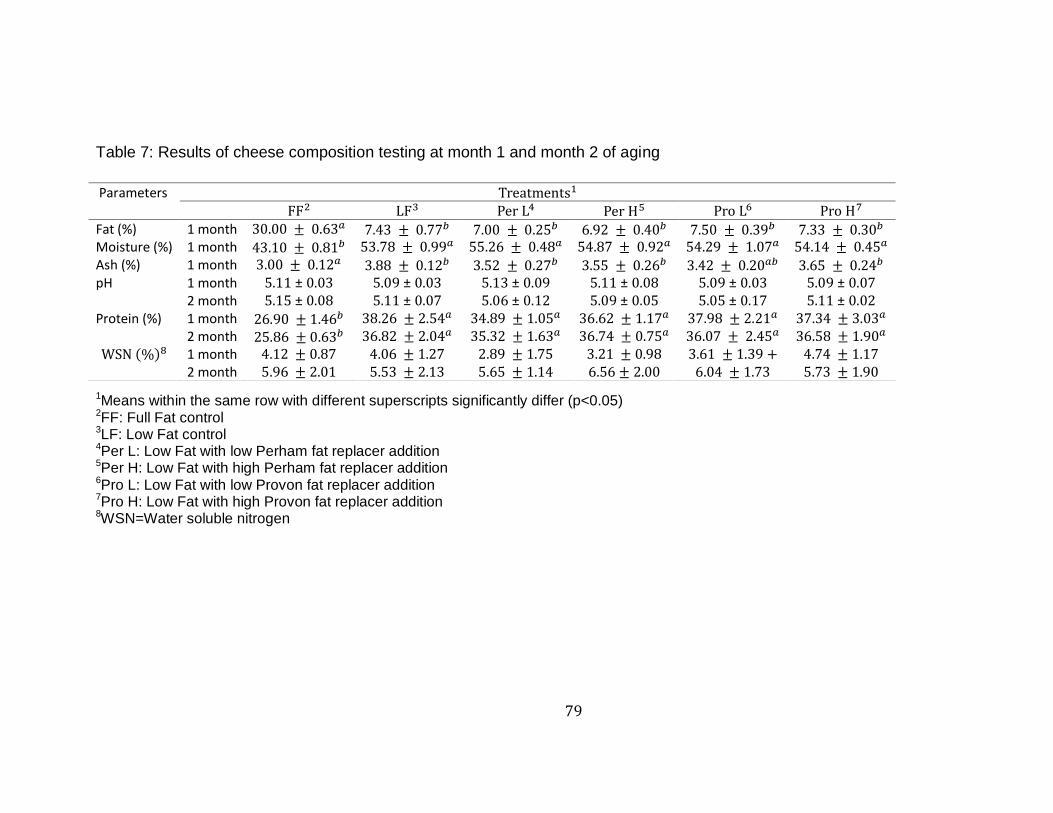
79
Table 7: Results of cheese composition testing at month 1 and month 2 of aging
1Means within the same row with different superscripts significantly differ (p<0.05) 2FF: Full Fat control 3LF: Low Fat control 4Per L: Low Fat with low Perham fat replacer addition 5Per H: Low Fat with high Perham fat replacer addition 6Pro L: Low Fat with low Provon fat replacer addition 7Pro H: Low Fat with high Provon fat replacer addition 8WSN=Water soluble nitrogen
Parameters
Fat (%) 1 month Moisture (%) 1 month Ash (%) 1 month pH 1 month 5.11 ± 0.03 5.09 ± 0.03 5.13 ± 0.09 5.11 ± 0.08 5.09 ± 0.03 5.09 ± 0.07 2 month 5.15 ± 0.08 5.11 ± 0.07 5.06 ± 0.12 5.09 ± 0.05 5.05 ± 0.17 5.11 ± 0.02 Protein (%) 1 month 2 month 1 month
2 month
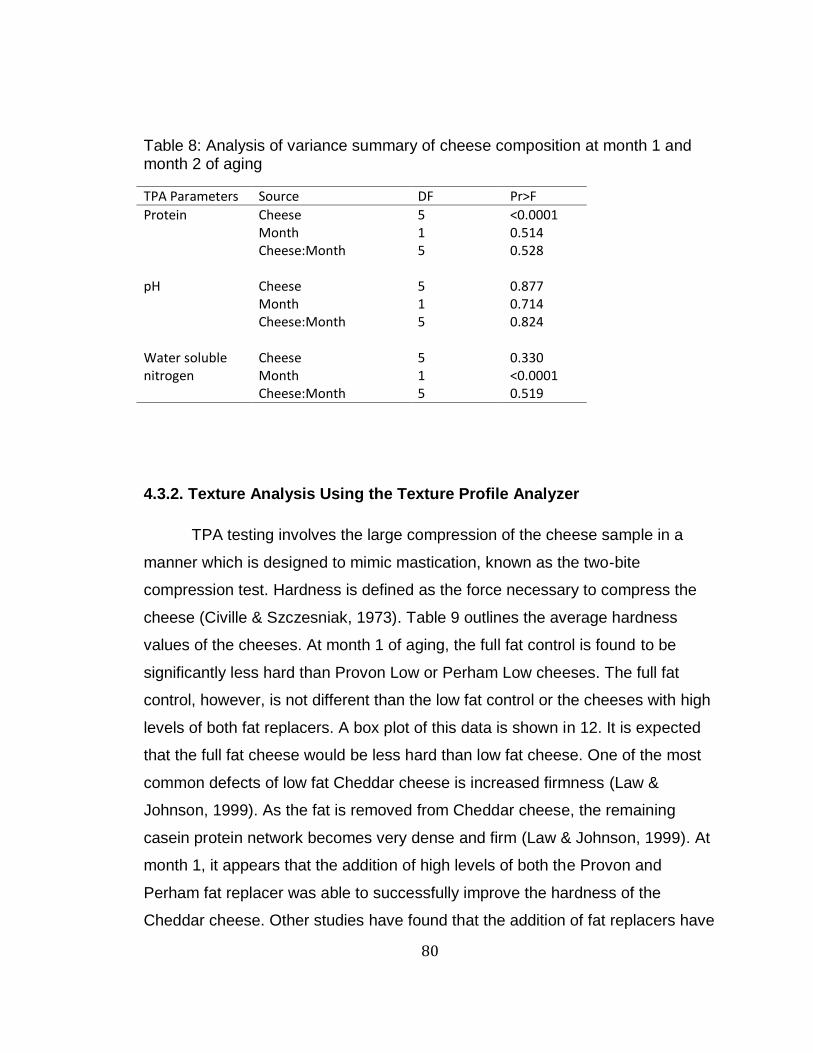
80
Table 8: Analysis of variance summary of cheese composition at month 1 and month 2 of aging
TPA Parameters Source DF Pr>F
Protein Cheese 5 <0.0001 Month 1 0.514 Cheese:Month 5 0.528
pH Cheese 5 0.877
Month 1 0.714 Cheese:Month 5 0.824
Water soluble nitrogen
Cheese 5 0.330 Month 1 <0.0001 Cheese:Month 5 0.519
4.3.2. Texture Analysis Using the Texture Profile Analyzer
TPA testing involves the large compression of the cheese sample in a
manner which is designed to mimic mastication, known as the two-bite
compression test. Hardness is defined as the force necessary to compress the
cheese (Civille & Szczesniak, 1973). Table 9 outlines the average hardness
values of the cheeses. At month 1 of aging, the full fat control is found to be
significantly less hard than Provon Low or Perham Low cheeses. The full fat
control, however, is not different than the low fat control or the cheeses with high
levels of both fat replacers. A box plot of this data is shown in 12. It is expected
that the full fat cheese would be less hard than low fat cheese. One of the most
common defects of low fat Cheddar cheese is increased firmness (Law &
Johnson, 1999). As the fat is removed from Cheddar cheese, the remaining
casein protein network becomes very dense and firm (Law & Johnson, 1999). At
month 1, it appears that the addition of high levels of both the Provon and
Perham fat replacer was able to successfully improve the hardness of the
Cheddar cheese. Other studies have found that the addition of fat replacers have

81
improved hardness values in low-fat cheeses. A study on low-fat Havarti cheese
found that the incorporation of whey protein produced a softer low-fat cheese
(Bastian, 1996). Another study of fresh cheese found decreased hardness values
in low-fat cheese containing protein-based fat replacers (Nurcan & Metin, 2004).
Also, another a study of Cheddar cheese found that addition of Simplesse, a
microparticulated whey protein fat replacer, was able to produce a softer low-fat
cheese (Aryana & Haque, 2001). The results of month 1 do present an
unexpected result, however. The low fat control was not significantly different
than the full fat control in terms of hardness. One would expect the low fat control
to be significantly harder than the full fat control. One factor that could have
contributed to this unexpected result is the variance within cheese the cheese
makes, and the variability of sample measurements by TPA. The low fat control,
as shown in Figure 12, had a high level of variance, which may have contributed
to these unexpected results. The results of month 1 are preliminary evidence that
the fat replacers, when added at high levels, are successful at improving low-fat
Cheddar cheese hardness. The fat replacers at low levels were not sufficient in
improving hardness values.
At month 2 of aging, the full fat control was found to be significantly softer
than all treatments except the cheese containing a high level of Provon fat
replacer (Pro H). A box plot of this data is shown in Figure 13. It is interesting to
note that the low fat control and Provon Low increased in hardness and are
significantly harder than the full fat control in month 2. In a comparison of month
1 and month 2 data, shown in Table 10, a significant increase in hardness is
seen for all cheeses between months 1 and 2. This data is depicted in Figure 15.
Typically, cheeses will decrease in hardness with aging due to proteolysis
(Varnam & Sutherland, 1994). This is due to the weaker casein structure with
increasing protein breakdown (Varnam & Sutherland, 1994). These unexpected
results could be attributed to a number of factors. Most importantly, one month of
age may not be sufficient enough to achieve a level of proteolysis that would
produce a decrease in hardness. It is possible, had these cheeses been

82
measured for 6 months or more, that a decrease in hardness would have
become evident. Overall, TPA hardness data shows in both month 1 and month
2, Provon High treatment was consistently capable of decreasing hardness in low
fat Cheddar cheese.
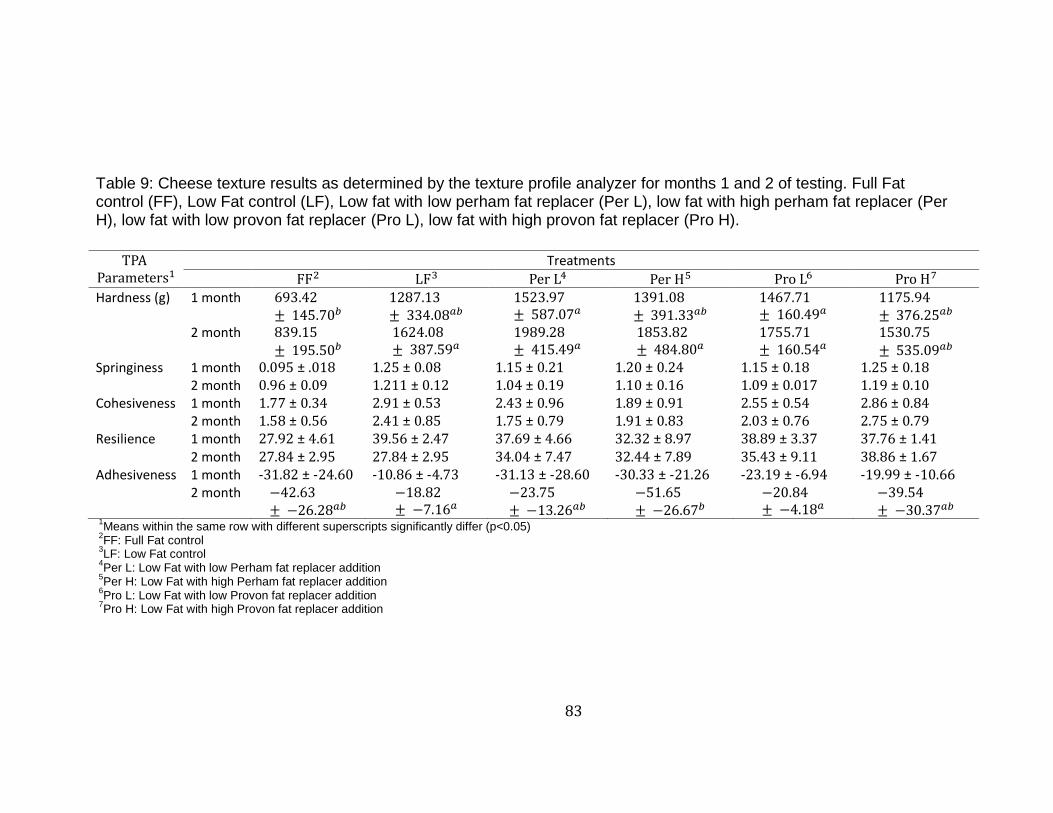
83
Table 9: Cheese texture results as determined by the texture profile analyzer for months 1 and 2 of testing. Full Fat control (FF), Low Fat control (LF), Low fat with low perham fat replacer (Per L), low fat with high perham fat replacer (Per H), low fat with low provon fat replacer (Pro L), low fat with high provon fat replacer (Pro H).
Treatments
Hardness (g) 1 month
2 month
Springiness 1 month 0.095 ± .018 1.25 ± 0.08 1.15 ± 0.21 1.20 ± 0.24 1.15 ± 0.18 1.25 ± 0.18 2 month 0.96 ± 0.09 1.211 ± 0.12 1.04 ± 0.19 1.10 ± 0.16 1.09 ± 0.017 1.19 ± 0.10 Cohesiveness 1 month 1.77 ± 0.34 2.91 ± 0.53 2.43 ± 0.96 1.89 ± 0.91 2.55 ± 0.54 2.86 ± 0.84 2 month 1.58 ± 0.56 2.41 ± 0.85 1.75 ± 0.79 1.91 ± 0.83 2.03 ± 0.76 2.75 ± 0.79 Resilience 1 month 27.92 ± 4.61 39.56 ± 2.47 37.69 ± 4.66 32.32 ± 8.97 38.89 ± 3.37 37.76 ± 1.41 2 month 27.84 ± 2.95 27.84 ± 2.95 34.04 ± 7.47 32.44 ± 7.89 35.43 ± 9.11 38.86 ± 1.67 Adhesiveness 1 month -31.82 ± -24.60 -10.86 ± -4.73 -31.13 ± -28.60 -30.33 ± -21.26 -23.19 ± -6.94 -19.99 ± -10.66 2 month
1Means within the same row with different superscripts significantly differ (p<0.05)
2FF: Full Fat control
3LF: Low Fat control
4Per L: Low Fat with low Perham fat replacer addition
5Per H: Low Fat with high Perham fat replacer addition
6Pro L: Low Fat with low Provon fat replacer addition
7Pro H: Low Fat with high Provon fat replacer addition
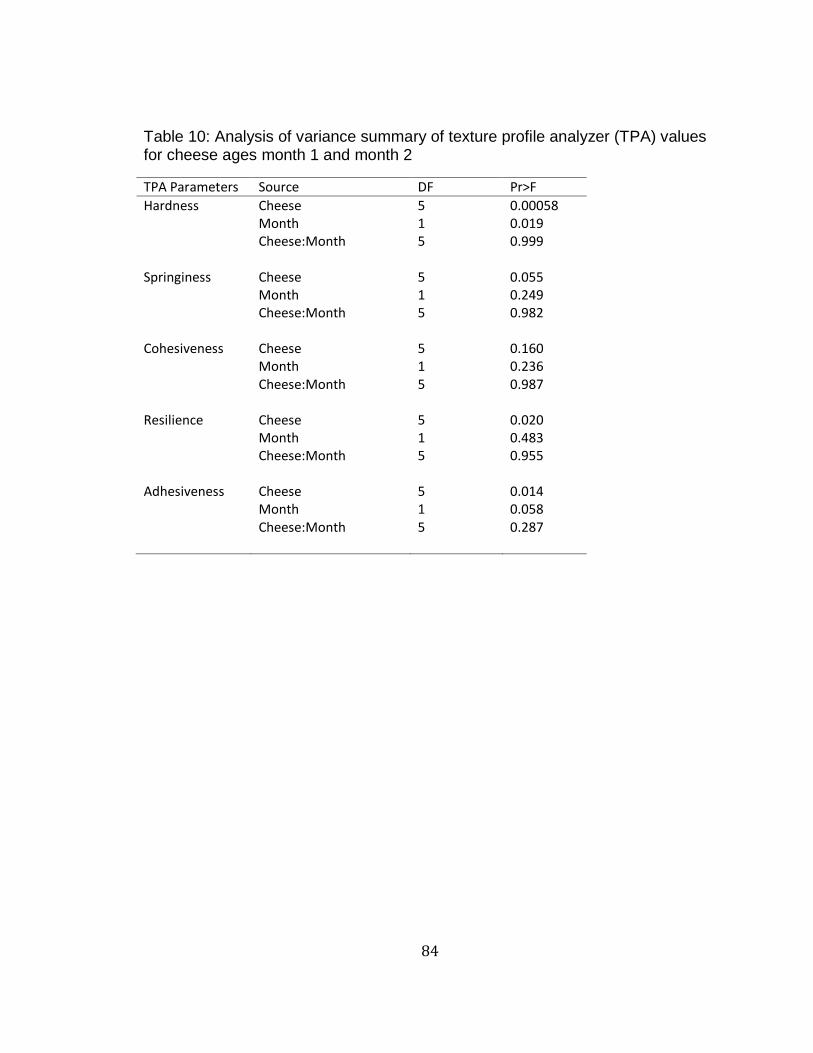
84
Table 10: Analysis of variance summary of texture profile analyzer (TPA) values for cheese ages month 1 and month 2
TPA Parameters Source DF Pr>F
Hardness Cheese 5 0.00058 Month 1 0.019 Cheese:Month 5 0.999
Springiness Cheese 5 0.055
Month 1 0.249 Cheese:Month 5 0.982
Cohesiveness Cheese 5 0.160
Month 1 0.236 Cheese:Month 5 0.987
Resilience Cheese 5 0.020
Month 1 0.483 Cheese:Month 5 0.955
Adhesiveness Cheese 5 0.014
Month 1 0.058 Cheese:Month 5 0.287

85
Figure 12: Box plot of cheese hardness values tested at month 1 (n=3). Full Fat Control (FF), Low Fat Control (LF), Low fat with high perham fat replacer addition (Pe H), Low fat with low perham fat replacer addition (Pe L), low fat with high provon fat replacer addition (Pr H), low fat with low fat replacer addition (Pr L)
Figure 13: Box plot of cheese hardness values tested at month 2 (n=3). Full Fat Control (FF), Low Fat Control (LF), Low fat with high perham fat replacer addition (Pe H), Low fat with low perham fat replacer addition (Pe L), low fat with high provon fat replacer addition (Pr H), low fat with low fat replacer addition (Pr L).
Har
dn
ess
(g)
Har
dn
ess
(g)
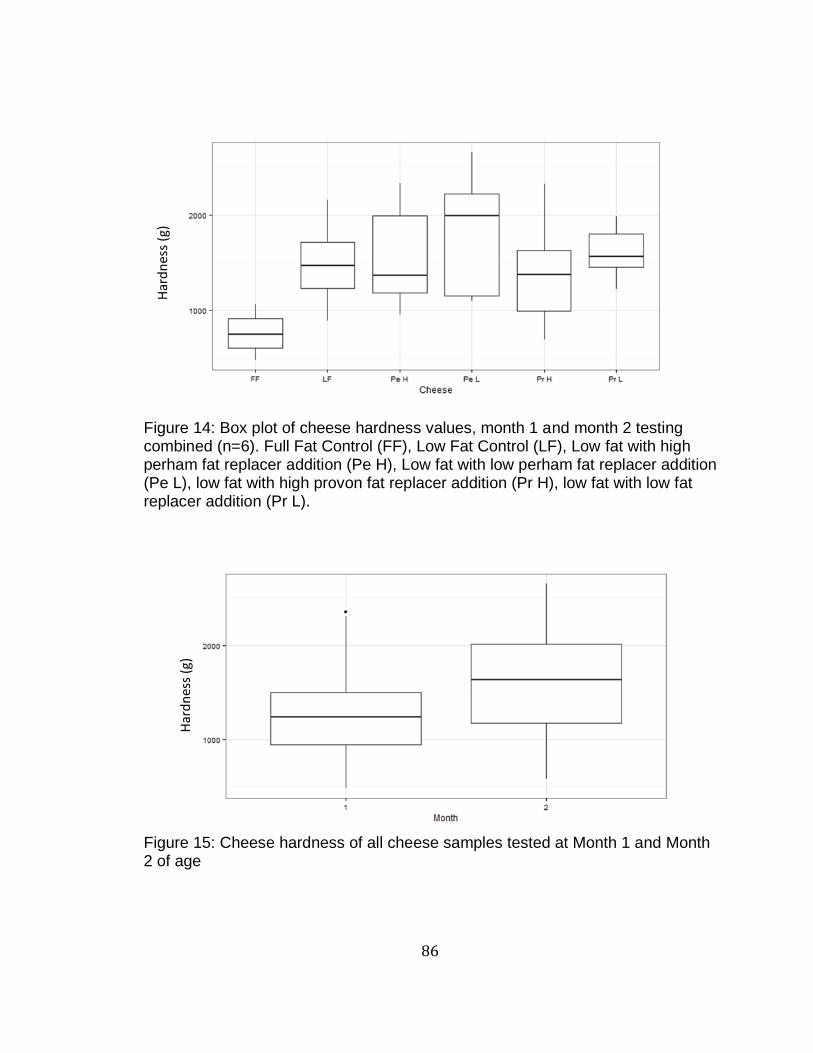
86
Figure 14: Box plot of cheese hardness values, month 1 and month 2 testing combined (n=6). Full Fat Control (FF), Low Fat Control (LF), Low fat with high perham fat replacer addition (Pe H), Low fat with low perham fat replacer addition (Pe L), low fat with high provon fat replacer addition (Pr H), low fat with low fat replacer addition (Pr L).
Figure 15: Cheese hardness of all cheese samples tested at Month 1 and Month 2 of age
Har
dn
ess
(g)
Har
dn
ess
(g)
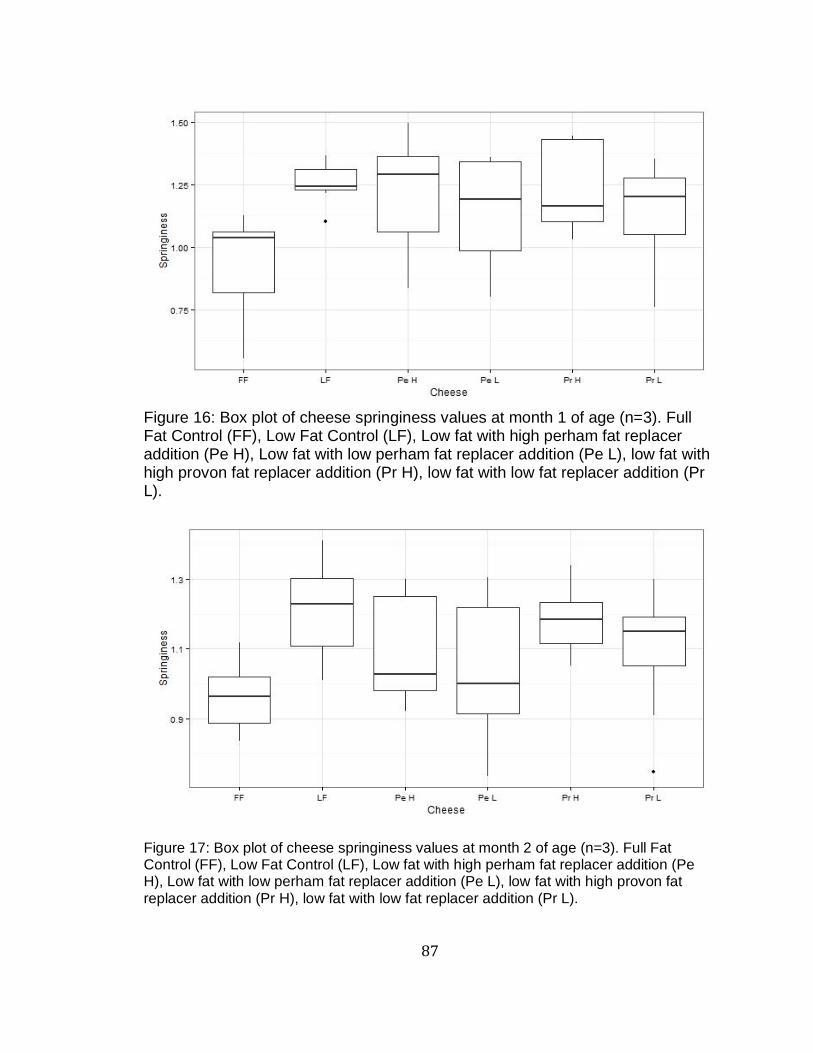
87
Figure 16: Box plot of cheese springiness values at month 1 of age (n=3). Full Fat Control (FF), Low Fat Control (LF), Low fat with high perham fat replacer addition (Pe H), Low fat with low perham fat replacer addition (Pe L), low fat with high provon fat replacer addition (Pr H), low fat with low fat replacer addition (Pr L).
Figure 17: Box plot of cheese springiness values at month 2 of age (n=3). Full Fat Control (FF), Low Fat Control (LF), Low fat with high perham fat replacer addition (Pe H), Low fat with low perham fat replacer addition (Pe L), low fat with high provon fat replacer addition (Pr H), low fat with low fat replacer addition (Pr L).

88
Figure 18: Box plot of cheese springiness values, month 1 and month 2 testing combined (n=6). Full Fat Control (FF), Low Fat Control (LF), Low fat with high perham fat replacer addition (Pe H), Low fat with low perham fat replacer addition (Pe L), low fat with high provon fat replacer addition (Pr H), low fat with low fat replacer addition (Pr L).
Figure 19: Cheese springiness of all cheese samples tested at Month 1 and Month 2 of age
89
Springiness is defined as the sample’s ability to return to its original height
after being compressed (Meullenet, Carpenter, Lyon, & Lyon, 1997). Springiness
can be a good measure of how rubbery a sample is (L. Metzger & Rosenberg,
2002). Low fat cheese are often found to have an undesirable, rubbery texture
(Law & Johnson, 1999). Results found, for both month 1 and month 2 of aging,
no significant differences between cheeses. The data associated with
springiness can be seen in Figure 16 and Figure 17. A high level of variance was
found within cheese replicates, which likely contributed to these results. The
sources of this variation will be discussed further in the chapter. A further
statistical test was performed to analyze the differences between the two months.
The results of this test can be seen in Table 10. The cheese source combines
replicate cheese types from both month 1 and month 2. With this increased
number of replicates (n=6 instead of n=3), a significant difference is found
between the full fat control and two other cheeses: low fat control and Perham
High. These results can be seen in Figure 18 and is further evidence of the large
variation within cheese replicates. No significant difference was found between
cheeses of difference months, indicating that no change in springiness occurred
with cheese aging (Figure 19). Because low fat cheeses are known for their
rubbery texture, it would be expected that full fat cheeses would have a lower
level of springiness compared to the low fat cheeses. In general, as shown in
Table 9, full fat cheese has a lower level of springiness. With the increased
number of replicates, the expected significant difference occurred between the
low fat control and full fat control. At the increased level of replicates, both levels
of Provon fat replacer and Perham Low were successful in decreasing the
springiness of low fat cheese.
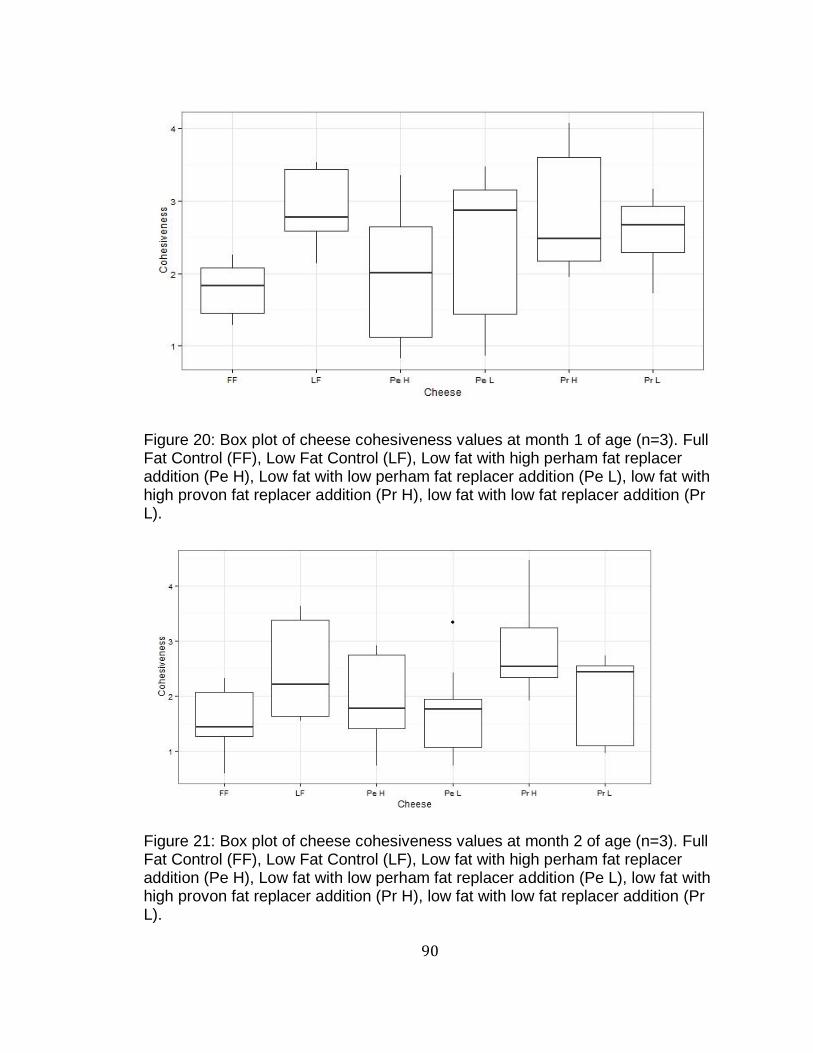
90
Figure 20: Box plot of cheese cohesiveness values at month 1 of age (n=3). Full Fat Control (FF), Low Fat Control (LF), Low fat with high perham fat replacer addition (Pe H), Low fat with low perham fat replacer addition (Pe L), low fat with high provon fat replacer addition (Pr H), low fat with low fat replacer addition (Pr L).
Figure 21: Box plot of cheese cohesiveness values at month 2 of age (n=3). Full Fat Control (FF), Low Fat Control (LF), Low fat with high perham fat replacer addition (Pe H), Low fat with low perham fat replacer addition (Pe L), low fat with high provon fat replacer addition (Pr H), low fat with low fat replacer addition (Pr L).
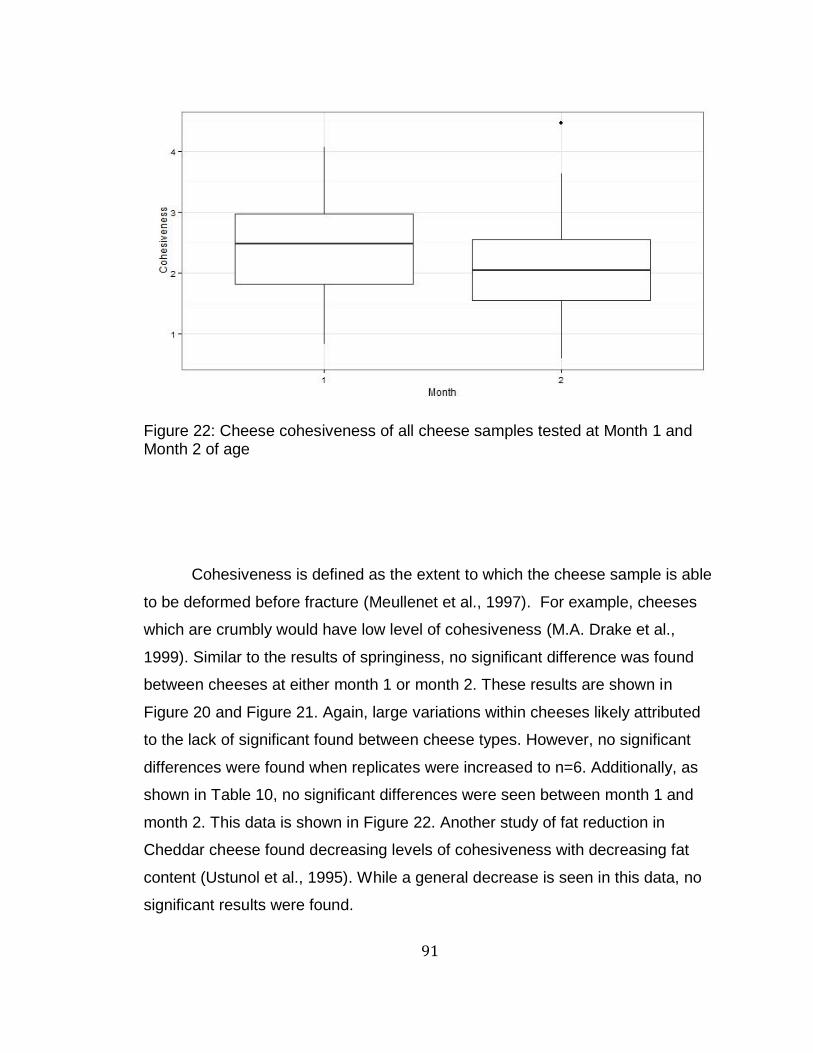
91
Figure 22: Cheese cohesiveness of all cheese samples tested at Month 1 and Month 2 of age
Cohesiveness is defined as the extent to which the cheese sample is able
to be deformed before fracture (Meullenet et al., 1997). For example, cheeses
which are crumbly would have low level of cohesiveness (M.A. Drake et al.,
1999). Similar to the results of springiness, no significant difference was found
between cheeses at either month 1 or month 2. These results are shown in
Figure 20 and Figure 21. Again, large variations within cheeses likely attributed
to the lack of significant found between cheese types. However, no significant
differences were found when replicates were increased to n=6. Additionally, as
shown in Table 10, no significant differences were seen between month 1 and
month 2. This data is shown in Figure 22. Another study of fat reduction in
Cheddar cheese found decreasing levels of cohesiveness with decreasing fat
content (Ustunol et al., 1995). While a general decrease is seen in this data, no
significant results were found.

92
Figure 23: Box plot of cheese resilience values at month 1 of age (n=3). Full Fat Control (FF), Low Fat Control (LF), Low fat with high perham fat replacer addition (Pe H), Low fat with low perham fat replacer addition (Pe L), low fat with high provon fat replacer addition (Pr H), low fat with low fat replacer addition (Pr L).
Figure 24: Box plot of cheese resilience values at month 2 of age (n=3). Full Fat Control (FF), Low Fat Control (LF), Low fat with high perham fat replacer addition (Pe H), Low fat with low perham fat replacer addition (Pe L), low fat with high provon fat replacer addition (Pr H), low fat with low fat replacer addition (Pr L).
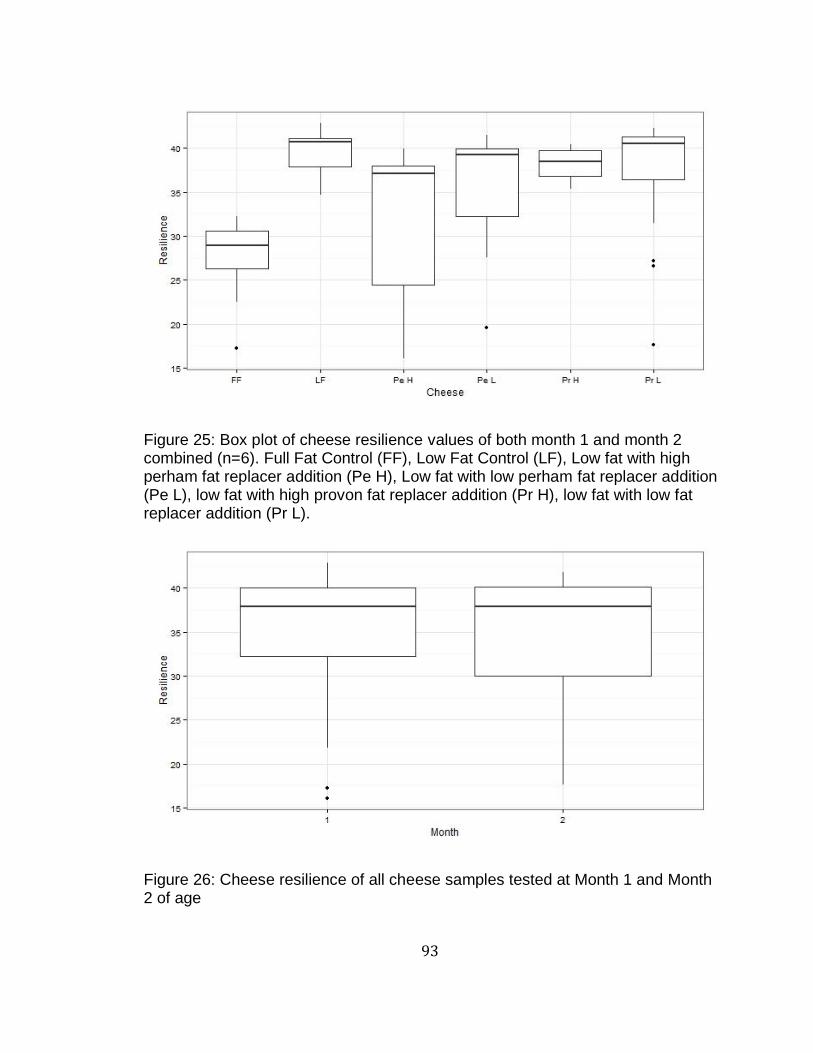
93
Figure 25: Box plot of cheese resilience values of both month 1 and month 2 combined (n=6). Full Fat Control (FF), Low Fat Control (LF), Low fat with high perham fat replacer addition (Pe H), Low fat with low perham fat replacer addition (Pe L), low fat with high provon fat replacer addition (Pr H), low fat with low fat replacer addition (Pr L).
Figure 26: Cheese resilience of all cheese samples tested at Month 1 and Month 2 of age
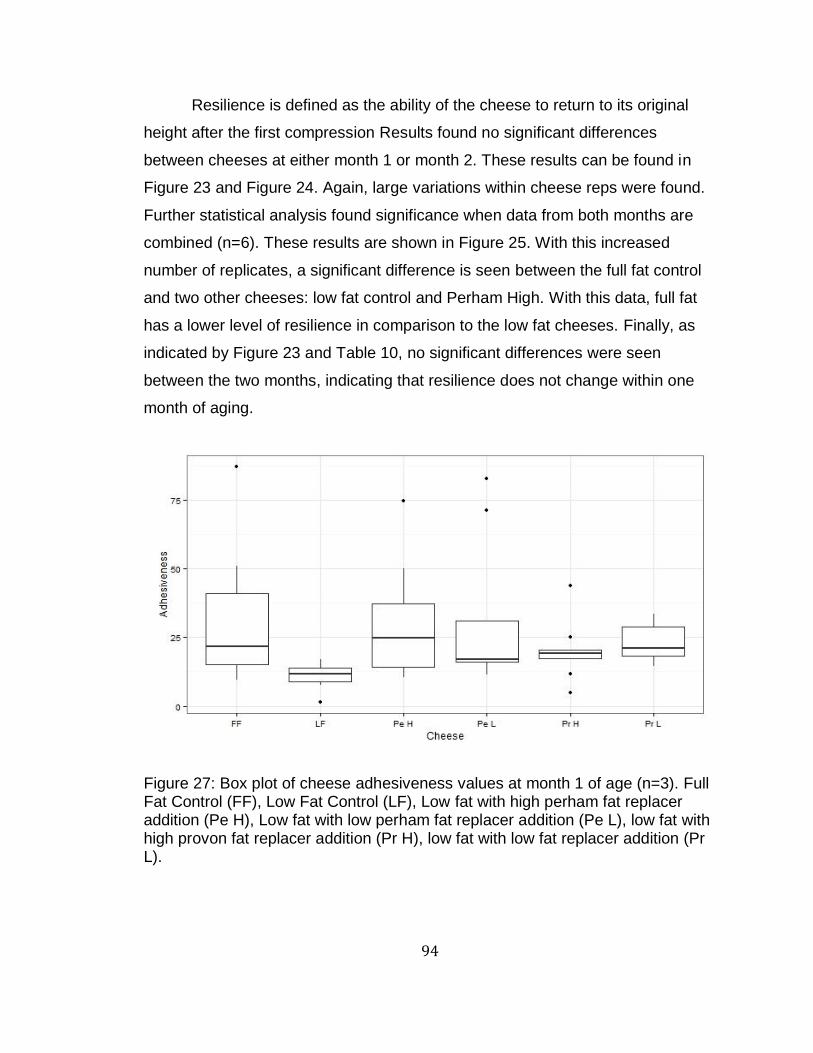
94
Resilience is defined as the ability of the cheese to return to its original
height after the first compression Results found no significant differences
between cheeses at either month 1 or month 2. These results can be found in
Figure 23 and Figure 24. Again, large variations within cheese reps were found.
Further statistical analysis found significance when data from both months are
combined (n=6). These results are shown in Figure 25. With this increased
number of replicates, a significant difference is seen between the full fat control
and two other cheeses: low fat control and Perham High. With this data, full fat
has a lower level of resilience in comparison to the low fat cheeses. Finally, as
indicated by Figure 23 and Table 10, no significant differences were seen
between the two months, indicating that resilience does not change within one
month of aging.
Figure 27: Box plot of cheese adhesiveness values at month 1 of age (n=3). Full Fat Control (FF), Low Fat Control (LF), Low fat with high perham fat replacer addition (Pe H), Low fat with low perham fat replacer addition (Pe L), low fat with high provon fat replacer addition (Pr H), low fat with low fat replacer addition (Pr L).

95
Figure 28: Box plot of cheese adhesiveness values at month 2 of age (n=3). Full Fat Control (FF), Low Fat Control (LF), Low fat with high perham fat replacer addition (Pe H), Low fat with low perham fat replacer addition (Pe L), low fat with high provon fat replacer addition (Pr H), low fat with low fat replacer addition (Pr L).
Figure 29: Box plot of cheese adhesiveness values at month 1 and 2 of age combined (n=6). Full Fat Control (FF), Low Fat Control (LF), Low fat with high perham fat replacer addition (Pe H), Low fat with low perham fat replacer addition (Pe L), low fat with high provon fat replacer addition (Pr H), low fat with low fat replacer addition (Pr L).
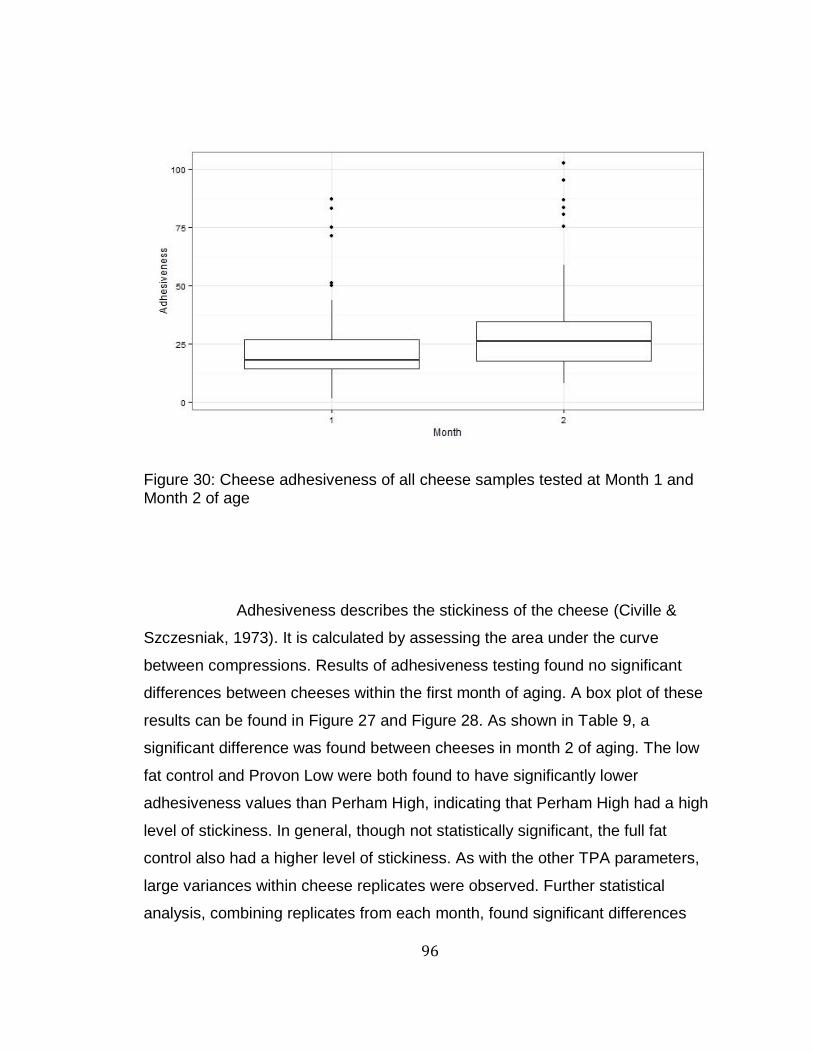
96
Figure 30: Cheese adhesiveness of all cheese samples tested at Month 1 and Month 2 of age
Adhesiveness describes the stickiness of the cheese (Civille &
Szczesniak, 1973). It is calculated by assessing the area under the curve
between compressions. Results of adhesiveness testing found no significant
differences between cheeses within the first month of aging. A box plot of these
results can be found in Figure 27 and Figure 28. As shown in Table 9, a
significant difference was found between cheeses in month 2 of aging. The low
fat control and Provon Low were both found to have significantly lower
adhesiveness values than Perham High, indicating that Perham High had a high
level of stickiness. In general, though not statistically significant, the full fat
control also had a higher level of stickiness. As with the other TPA parameters,
large variances within cheese replicates were observed. Further statistical
analysis, combining replicates from each month, found significant differences
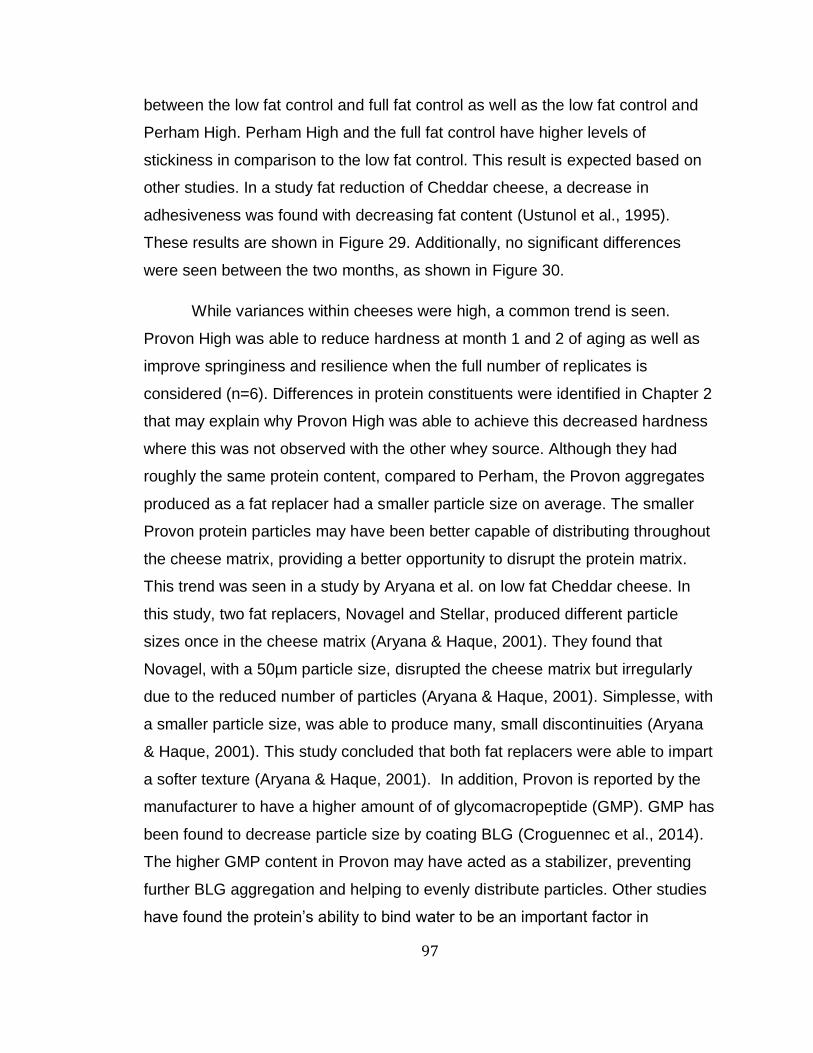
97
between the low fat control and full fat control as well as the low fat control and
Perham High. Perham High and the full fat control have higher levels of
stickiness in comparison to the low fat control. This result is expected based on
other studies. In a study fat reduction of Cheddar cheese, a decrease in
adhesiveness was found with decreasing fat content (Ustunol et al., 1995).
These results are shown in Figure 29. Additionally, no significant differences
were seen between the two months, as shown in Figure 30.
While variances within cheeses were high, a common trend is seen.
Provon High was able to reduce hardness at month 1 and 2 of aging as well as
improve springiness and resilience when the full number of replicates is
considered (n=6). Differences in protein constituents were identified in Chapter 2
that may explain why Provon High was able to achieve this decreased hardness
where this was not observed with the other whey source. Although they had
roughly the same protein content, compared to Perham, the Provon aggregates
produced as a fat replacer had a smaller particle size on average. The smaller
Provon protein particles may have been better capable of distributing throughout
the cheese matrix, providing a better opportunity to disrupt the protein matrix.
This trend was seen in a study by Aryana et al. on low fat Cheddar cheese. In
this study, two fat replacers, Novagel and Stellar, produced different particle
sizes once in the cheese matrix (Aryana & Haque, 2001). They found that
Novagel, with a 50µm particle size, disrupted the cheese matrix but irregularly
due to the reduced number of particles (Aryana & Haque, 2001). Simplesse, with
a smaller particle size, was able to produce many, small discontinuities (Aryana
& Haque, 2001). This study concluded that both fat replacers were able to impart
a softer texture (Aryana & Haque, 2001). In addition, Provon is reported by the
manufacturer to have a higher amount of of glycomacropeptide (GMP). GMP has
been found to decrease particle size by coating BLG (Croguennec et al., 2014).
The higher GMP content in Provon may have acted as a stabilizer, preventing
further BLG aggregation and helping to evenly distribute particles. Other studies
have found the protein’s ability to bind water to be an important factor in

98
improved textural attributes. A study of low fat Havarti cheese found the
incorporated whey proteins bound water, which produced a softer cheese
(Bastian, 1996)
4.3.3. Textural Characterization Using the AR-G2
In the stress sweep test, samples were subjected to increasing stress
while the G’ and G’’ responses were measured. G’ is also known as the storage
modulus, the amount of energy stored, and G’’ is known as the loss modulus, the
amount of energy lost (Gunasekaran & Ak, 2003). In order to compare samples,
average G’, average G’’, and stress at fracture were determined. The average G’
and G’’ were determined by selecting modulus values within the linear region of
the samples. For low fat, this region was at 50 Pa stress and full fat was at 8 Pa
stress. The fracture point of the samples was defined as the point at which the
curves dropped by 5% or more. The results of this analysis are shown in Table
11.
It is evident by the graphs in Figure 40 and Figure 41 that very different
linear viscoelastic regions are seen for full fat samples as compared to all low fat
samples. The full fat samples begin to yield at a much earlier stress, indicating a
softer structure. This data is represented in Table 11. At month 1, the full fat
cheese had a significantly lower yield stress than all low fat cheeses. This data is
shown in Figure 31. At month 2, however, the yield stress of full fat cheese is no
longer significantly different than Perham Low or Provon Low, indicating the
softening of these cheeses. It is not surprising that some cheeses would see a
softening with age. Proteolysis, the process of protein breakdown which occurs
with age, may have attributed to this softening (Varnam & Sutherland, 1994). It is
interesting, however, that the fat replacers at low levels show a softening when
previous texture analysis has found fat replacers at low levels were unable
improve hardness. Although a slight average decrease in yield stress occurred
between months, as would be expected with proteolysis, no significant
differences were seen between month 1 and month 2. This data is depicted in
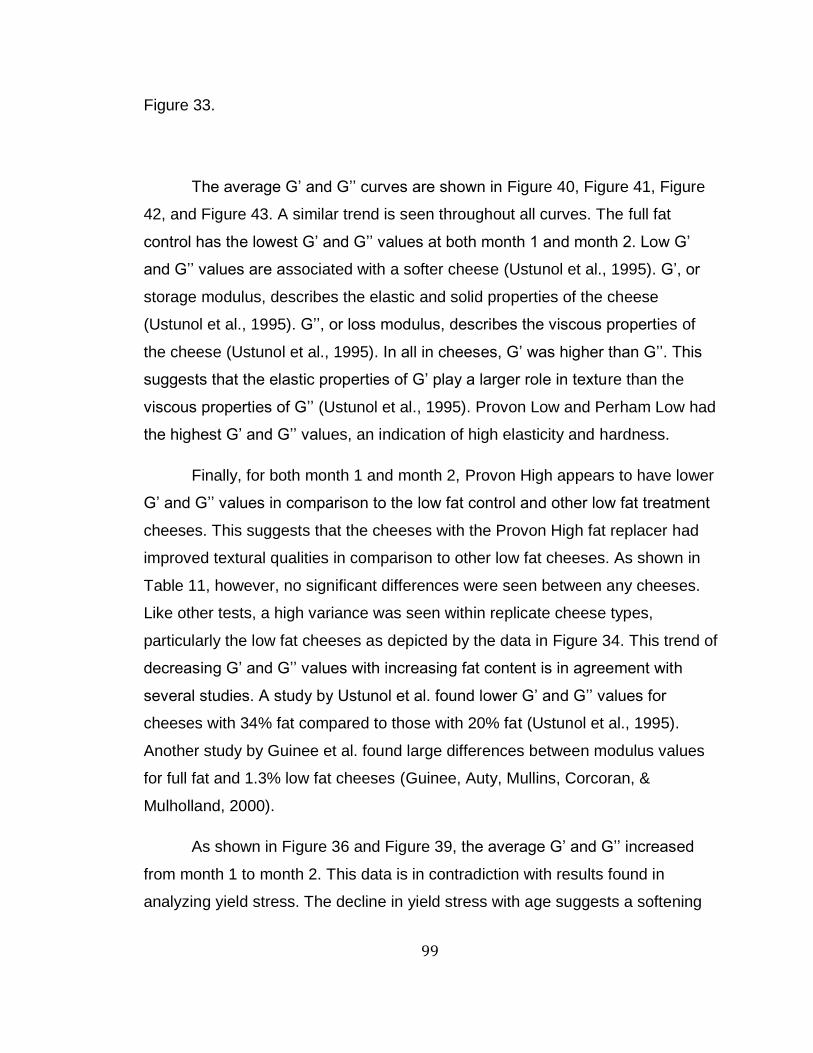
99
Figure 33.
The average G’ and G’’ curves are shown in Figure 40, Figure 41, Figure
42, and Figure 43. A similar trend is seen throughout all curves. The full fat
control has the lowest G’ and G’’ values at both month 1 and month 2. Low G’
and G’’ values are associated with a softer cheese (Ustunol et al., 1995). G’, or
storage modulus, describes the elastic and solid properties of the cheese
(Ustunol et al., 1995). G’’, or loss modulus, describes the viscous properties of
the cheese (Ustunol et al., 1995). In all in cheeses, G’ was higher than G’’. This
suggests that the elastic properties of G’ play a larger role in texture than the
viscous properties of G’’ (Ustunol et al., 1995). Provon Low and Perham Low had
the highest G’ and G’’ values, an indication of high elasticity and hardness.
Finally, for both month 1 and month 2, Provon High appears to have lower
G’ and G’’ values in comparison to the low fat control and other low fat treatment
cheeses. This suggests that the cheeses with the Provon High fat replacer had
improved textural qualities in comparison to other low fat cheeses. As shown in
Table 11, however, no significant differences were seen between any cheeses.
Like other tests, a high variance was seen within replicate cheese types,
particularly the low fat cheeses as depicted by the data in Figure 34. This trend of
decreasing G’ and G’’ values with increasing fat content is in agreement with
several studies. A study by Ustunol et al. found lower G’ and G’’ values for
cheeses with 34% fat compared to those with 20% fat (Ustunol et al., 1995).
Another study by Guinee et al. found large differences between modulus values
for full fat and 1.3% low fat cheeses (Guinee, Auty, Mullins, Corcoran, &
Mulholland, 2000).
As shown in Figure 36 and Figure 39, the average G’ and G’’ increased
from month 1 to month 2. This data is in contradiction with results found in
analyzing yield stress. The decline in yield stress with age suggests a softening

100
of the cheese, however, the increase in G’ and G’’ suggests a hardening of the
cheese. It has been found that G’ declines throughout cheese age due to
changes in proteolysis (Venugopal & Muthukumarappan, 2003). G’’ is also noted
to decline with age due to side reactions produced during proteolysis (Venugopal
& Muthukumarappan, 2003). One explanation of the increase in G’ and G’’ seen
in this cheese is the lack of proteolysis that occurred. As the cheese were only
tested at month 1 and month 2 of age, perhaps not enough proteolysis occurred
to produce a significant decline in G’ and G’’ that would be expected with age.
Another explanation of this could be the tendency of Cheddar cheese to become
more crumbly with age rather than soft (Varnam & Sutherland, 1994).This would
have resulted in an earlier yield stress of the cheese but not necessarily a
softening. Another study of reduced fat Cheddar cheese found similar results
(Mackey & Desai, 1995). The study reported an increase in G’ and G’’ between 6
weeks and 24 weeks of aging in reduced fat and full fat Cheddar (Mackey &
Desai, 1995).

101
Table 11: Results of stress sweep test on AR-G2, testing cheese at 1 and 2 months of age. Full Fat control (FF), Low fat control (LF), Low fat with low Perham fat replacer (Per L), Low fat with high Perham fat replacer (Per H), Low fat with low Provon fat replacer (Pro L), Low fat with high fat replacer (Pro H).
Rheology Parameter Month
G’ (kPa) 1 40.85 ± 15.85 49.35 ± 15.07 49.57 ± 20.62 50.64 ± 33.71 57.31 ± 7.82 47.30 ± 9.99 2 51.26 ± 10.84 71.28 ± 24.58 91.86 ± 63.80 80.37 ± 33.03 86.26 ± 24.80 66.54 ± 16.39
G’’ (kPa) 1 13.36 ± 2.18 16.23 ± 4.90 17.67 ± 5.9 16.41 ± 9.28 17.96 ± 2.26 15.09 ± 2.43 2 15.25 ± 2.93 24.09 ± 9.04 27.23 ± 18.22 24.13 ± 9.03 27.46 ± 4.98 19.52 ± 5.28
Yield Stress (kPa) 1 2
1Means within the same row with different superscripts significantly differ (p<0.05) 2FF: Full Fat control 3LF: Low Fat control 4Per L: Low Fat with low Perham fat replacer addition 5Per H: Low Fat with high Perham fat replacer addition 6Pro L: Low Fat with low Provon fat replacer addition 7Pro H: Low Fat with high Provon fat replacer addition
102
Figure 31: Cheese yield stress as determined by a stress sweep test at 1 month of age. Full Fat control (FF), Low fat control (LF), Low fat with low Perham fat replacer (Pe L), Low fat with high Perham fat replacer (Pe H), Low fat with low Provon fat replacer (Pr L), Low fat with high fat replacer (Pr H).
Figure 32: Cheese yield stress as determined by a stress sweep test at 2 months of age. Full Fat control (FF), Low fat control (LF), Low fat with low Perham fat replacer (Pe L), Low fat with high Perham fat replacer (Pe H), Low fat with low Provon fat replacer (Pr L), Low fat with high fat replacer (Pr H).
Stre
ss (
Pa)
St
ress
(P
a)

103
Figure 33: Cheese yield stress as determined by a stress sweep test. Comparison of all cheeses at month 1 and month 2 of age.
Figure 34: Cheese average G’ as determined by a stress sweep test at 1 month of age. Full Fat control (FF), Low fat control (LF), Low fat with low Perham fat replacer (Pe L), Low fat with high Perham fat replacer (Pe H), Low fat with low Provon fat replacer (Pr L), Low fat with high fat replacer (Pr H).
G’ (
Pa)
St
ress
(P
a)
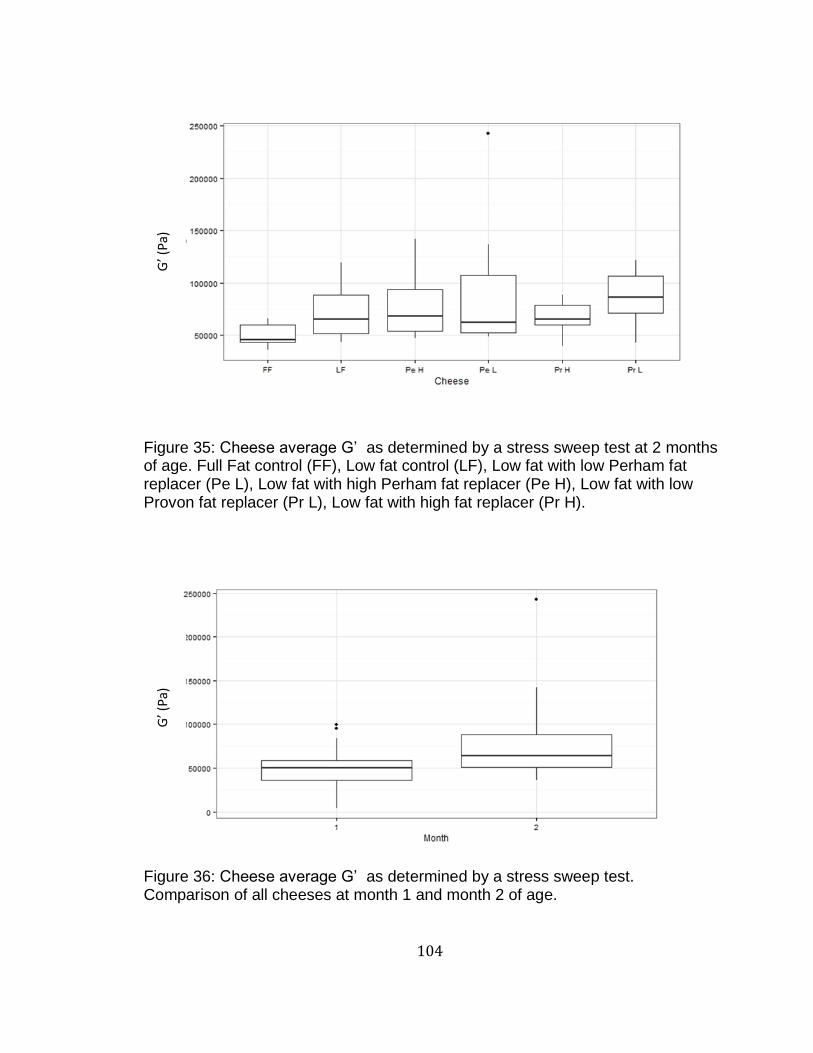
104
Figure 35: Cheese average G’ as determined by a stress sweep test at 2 months of age. Full Fat control (FF), Low fat control (LF), Low fat with low Perham fat replacer (Pe L), Low fat with high Perham fat replacer (Pe H), Low fat with low Provon fat replacer (Pr L), Low fat with high fat replacer (Pr H).
Figure 36: Cheese average G’ as determined by a stress sweep test. Comparison of all cheeses at month 1 and month 2 of age.
G’ (
Pa)
G
’ (P
a)

105
Figure 37: Cheese average G’’ as determined by a stress sweep test at 1 month of age. Full Fat control (FF), Low fat control (LF), Low fat with low Perham fat replacer (Pe L), Low fat with high Perham fat replacer (Pe H), Low fat with low Provon fat replacer (Pr L), Low fat with high fat replacer (Pr H).
Figure 38: Cheese average G’’ as determined by a stress sweep test at 2 months of age. Full Fat control (FF), Low fat control (LF), Low fat with low Perham fat replacer (Pe L), Low fat with high Perham fat replacer (Pe H), Low fat with low Provon fat replacer (Pr L), Low fat with high fat replacer (Pr H).
G’’
(P
a)
G’’
(P
a)

106
Figure 39: Cheese average G’’ as determined by a stress sweep test. Comparison of all cheeses at month 1 and month 2 of age.
Figure 40: G’ of stress sweep test at 1 month of age. Full Fat control (FF), Low fat control (LF), Low fat with low Perham fat replacer (Per Low), Low fat with high Perham fat replacer (Per High), Low fat with low Provon fat replacer (Pro Low), Low fat with high fat replacer (Pro High).
30000
35000
40000
45000
50000
55000
60000
0.5 5 50 500 5000
G' (
Pa)
Stress (Pa)
FF
LF
Per Low
Per High
Pro Low
Pro High
G’’
(P
a)
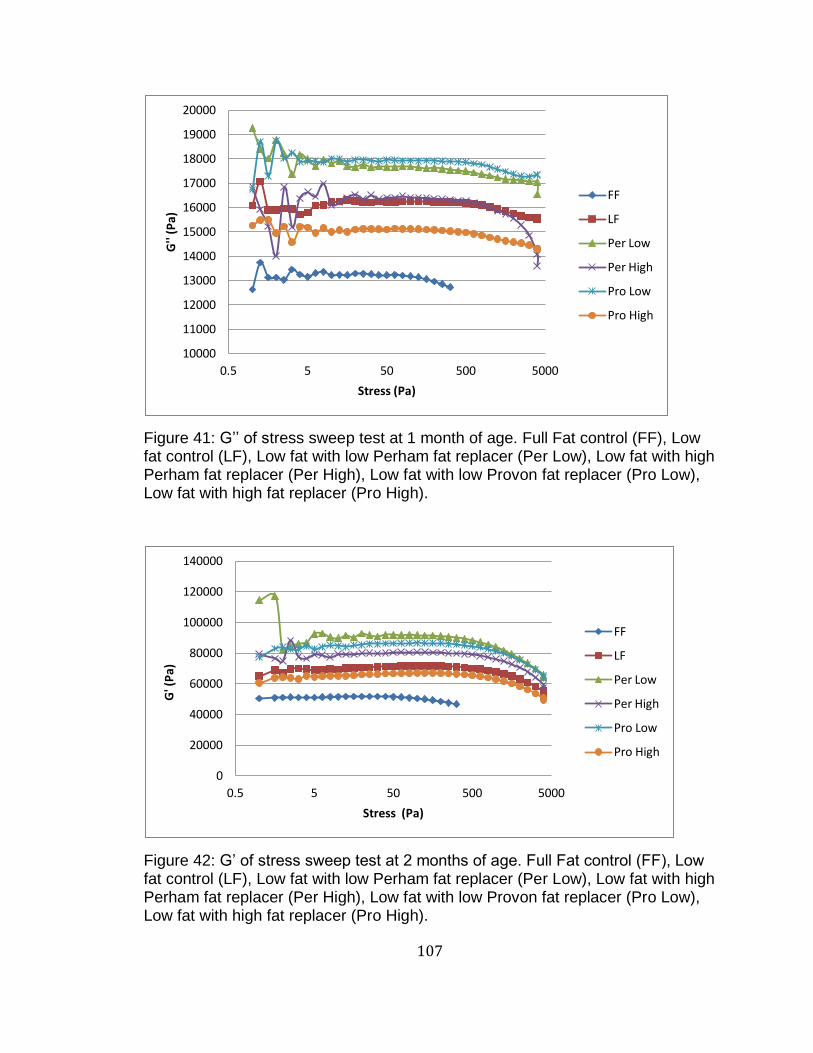
107
Figure 41: G’’ of stress sweep test at 1 month of age. Full Fat control (FF), Low fat control (LF), Low fat with low Perham fat replacer (Per Low), Low fat with high Perham fat replacer (Per High), Low fat with low Provon fat replacer (Pro Low), Low fat with high fat replacer (Pro High).
Figure 42: G’ of stress sweep test at 2 months of age. Full Fat control (FF), Low fat control (LF), Low fat with low Perham fat replacer (Per Low), Low fat with high Perham fat replacer (Per High), Low fat with low Provon fat replacer (Pro Low), Low fat with high fat replacer (Pro High).
10000
11000
12000
13000
14000
15000
16000
17000
18000
19000
20000
0.5 5 50 500 5000
G''
(Pa)
Stress (Pa)
FF
LF
Per Low
Per High
Pro Low
Pro High
0
20000
40000
60000
80000
100000
120000
140000
0.5 5 50 500 5000
G' (
Pa)
Stress (Pa)
FF
LF
Per Low
Per High
Pro Low
Pro High

108
Figure 43: G’’ of stress sweep test at 2 months of age. Full Fat control (FF), Low fat control (LF), Low fat with low Perham fat replacer (Per Low), Low fat with high Perham fat replacer (Per High), Low fat with low Provon fat replacer (Pro Low), Low fat with high fat replacer (Pro High).
In analyzing the AR-G2 compression data, results were converted to true
stress and Hencky strain. The calculation for true stress is shown in Equation 2
and the calculation for Hencky strain is shown in Equation 3. Hencky strain is
commonly use for studies of large deformation, such as compression
(Gunasekaran & Ak, 2003) Unlike typical strain, Hencky strain takes into account
the changing height of the sample (Gunasekaran & Ak, 2003). Young’s Modulus
was calculated by the slope of each curve in the linear region (Gunasekaran &
Ak, 2003).
10000
15000
20000
25000
30000
35000
0.5 5 50 500 5000
G''
(Pa)
Stress (Pa)
FF
LF
Per Low
Per High
Pro Low
Pro High

109
Equation 2: True stress for compression calculations
Equation 3: Hencky strain for compression calcuations
In these equations, h=current height, H=original height, R=samples radius,
and P=load (normal force).
In compression tests, there is concern that samples will go beyond their
fracture point. As can be seen in Figure 46, the cheese samples did not facture
after being subjected to a 30% compression.
The average stress/strain curve for each cheese type is shown in Figure
44. As can be seen, Provon Low shows the highest stress response, followed by
Perham High, and Perham Low. The low fat control and Provon High overlap.
The full fat control has the lowest stress response. The Young’s Modulus of each
curve is shown in Table 12. As expected, the full fat control shows the lowest
curve and lowest Young’s Modulus. A lower Young’s Modulus is associated with
a softer cheese (Chakrabarti, 2006). In a study by Chakrabarti, compression
testing was used to compare full fat and low fat cheese with fat replacers. In this
study, samples were tested under refrigerated conditions, and it was found that
the low fat cheeses had a lower Young’s Modulus (Chakrabarti, 2006). At
refrigerated temperatures, the fat in the full fat cheese contributed to its
hardness, and the fat replacers in the low fat cheese were unable to produce the
same effect (Chakrabarti, 2006). In the present study, the samples were tested at
room temperature. It is clear by the reduction in Young’s Modulus for the full fat
110
cheese that the fat at room temperature contributes to a softening of the cheese.
The low fat cheese, with and without fat replacer, were unable to impart this
softness. While the full fat control appears very different than the other cheeses,
the only significant difference found in this test was between the full fat control
and Provon Low. The data is depicted as a box plot in Figure 45. It is evident
here, as was found in other texture testing, that there was a high level of variance
within cheese types. However, this data is in agreement with previous results
from the Texture Profile Analyzer and the stress sweep tests on the AR-G2 in
that the Provon High treatment appears to be the closest in improving texture of
low fat Cheddar cheese.
The increased firmness of cheeses with fat replacer in comparison to the
low fat control is also a similar trend between the stress sweep test and the
compression test. In both experiments, Provon Low, Perham High, and Perham
Low all seem to have increased firmness in comparison to the low fat control.
This may be a result of the activity of the filler gel. While it was determined in the
gel formation studies presented in Chapter 2 that a lack of increased G’ in
cheeses with fat replacers suggested an inactive filler, the results of the cheese
texture analysis suggest otherwise. An active filler which interacts with its
surroundings, as in possible whey protein-casein or carrageenan-casein
interactions, can impart strength (Yang et al., 2011). In addition, if the particles
are firmer than the fat that it has replaced, a firmer texture could be seen
(Chakrabarti, 2006; Yang et al., 2011).

111
Figure 44: Compression test of cheeses at 2.5 months of age. Full Fat control (FF), Low fat control (LF), Low fat with low Perham fat replacer (Per L), Low fat with high Perham fat replacer (Per H), Low fat with low Provon fat replacer (Pro L), Low fat with high fat replacer (Pro H).
Figure 45: Young’s Modulus of cheeses as determined by a compression test at 2.5 months of age. Full Fat control (FF), Low fat control (LF), Low fat with low Perham fat replacer (Pe L), Low fat with high Perham fat replacer (Pe H), Low fat with low Provon fat replacer (Pr L), Low fat with high fat replacer (Pr H).
0
5
10
15
20
25
30
35
40
45
50
0 0.05 0.1 0.15 0.2 0.25 0.3 0.35 0.4
Stre
ss (
kPa)
Strain
FF
LF
Per L
Per H
Pro L
Pro H
You
ng’
s M
od
ulu
s (k
Pa)

112
Figure 46: Cheese samples, tested at 2.5 months of age, before and after compression on the AR-G2 rheometer showing no evidence of fracture. A) Low Fat Control, B) Perham Low. All other cheese treatments appeared the same
Table 12: Young’s modulus from compression testing of cheeses at 2.5 months of age. Full Fat control (FF), Low fat control (LF), Low fat with low Perham fat replacer (Per L), Low fat with high Perham fat replacer (Per H), Low fat with low Provon fat replacer (Pro L), Low fat with high fat replacer (Pro H).
Treatments
FF LF Per L Per H Pro L Pro H
Young’s Modulus (kPa)
B A
113
4.3.4. Microscopy
Microscopy images of cheeses at 2.5 months of age are shown in
Figure 47. Each cheese treatment was tested in triplicate, and each sample was
tested in duplicate. A representative of this testing is shown. Each cheese was
stained with Fast Green and Nile Red, allowing lipids to appear red and protein to
appear green. As can be seen in Figure 47, the full fat sample consists of many
large fat globules. The fat globules appear to range in size from 10-30µm.
Typically, fat is between 2-10µm (Laneuville et al., 2000). This increase in fat
globule size may in part be due to the slight melting effect that occurred as the
cheese images were being taken. The low fat control cheese shows a primarily
protein-dominated structure. Very small fat globules are seen but are not very
abundant. Similar results are observed for Perham Low and Perham High.
Results for Provon Low and Provon High, however, show a slightly different
structure. While the matrix still seems to be dominated by protein, larger and
more abundant fat globules are seen in comparison to the low fat control. As
discussed previously, the difference in particle size between Provon and Perham
fat replacers may have attributed to differences seen. A study of fat replacers in
low fat cheese found that Simplesse, a microparticulated whey protein fat
replacer, produced many small discontinuities compared to the fat replacer with a
larger particle size (Aryana & Haque, 2001). One explanation for the increased
size and abundance of fat globules in cheese with a Provon fat replacer could be
a depletion mechanism in which fat is drawn away from the protein matrix and
coalesces. These results are in agreement with a study on low fat Manchego
cheese (Lobato-Calleros et al., 2001). This study found that the addition of fat
replacers produced more irregularly shaped fat globules when compared to a full
fat and low fat control cheese (Lobato-Calleros et al., 2001). Another study of
mozzarella cheese found the particle size of the fat replacer to be an important
factor in how it interacted within the cheese matrix (McMahon et al., 1996). They
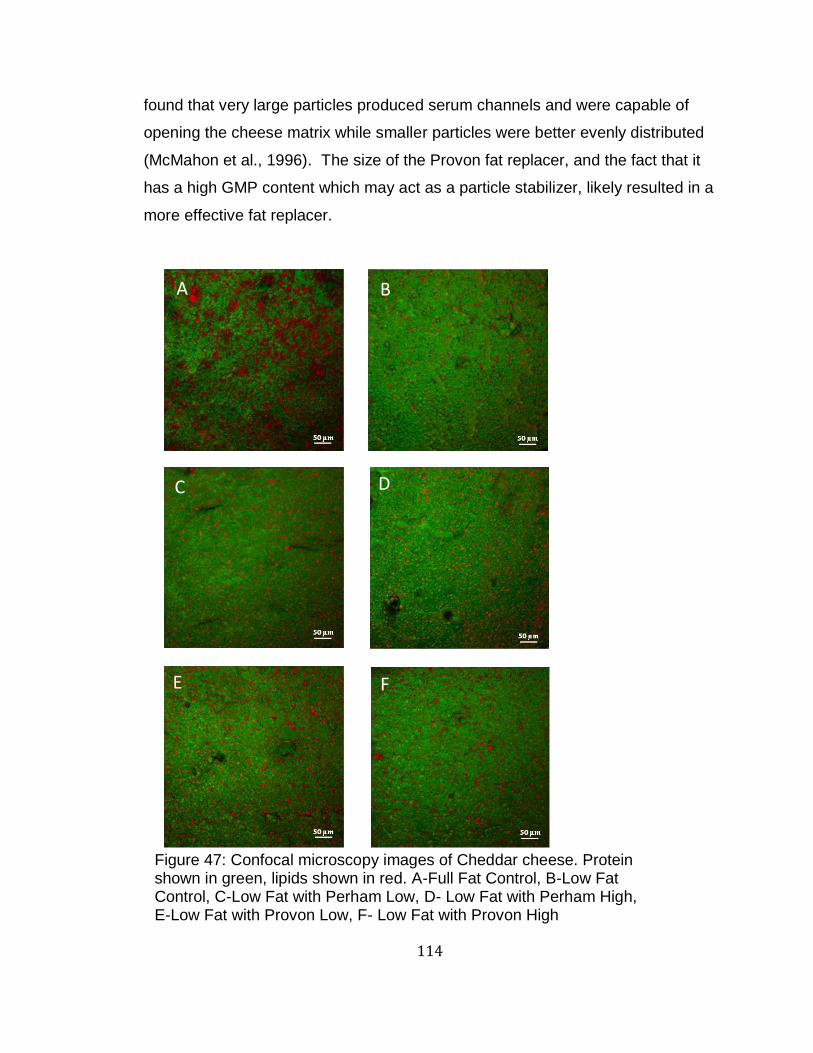
114
found that very large particles produced serum channels and were capable of
opening the cheese matrix while smaller particles were better evenly distributed
(McMahon et al., 1996). The size of the Provon fat replacer, and the fact that it
has a high GMP content which may act as a particle stabilizer, likely resulted in a
more effective fat replacer.
A
F E
D C
B
Figure 47: Confocal microscopy images of Cheddar cheese. Protein shown in green, lipids shown in red. A-Full Fat Control, B-Low Fat Control, C-Low Fat with Perham Low, D- Low Fat with Perham High, E-Low Fat with Provon Low, F- Low Fat with Provon High
115
4.4. Conclusion
Results of the TPA found the low fat Cheddar cheese with a high
level of Provon fat replacer to be more like full fat than any other treatment
cheese. This was particularly evident in measurements of hardness and
springiness. Rheological techniques also found Provon High to be closest to full
fat compared to other treatment cheeses in measurements of G’ and G’’ in the
stress sweep test and Young’s Modulus in the compression test. Rheological
techniques also saw an increase in firmness in other cheeses containing fat
replacers in comparison to the low fat control. In all texture and rheological
testing, a high variance was observed within cheese replicates. This is likely due
to the variability in producing bench-top cheeses. Microscopy images suggest a
difference between cheeses with the Provon fat replacers and the low fat control.
Cheeses that contained the Provon fat replacer, either low or high inclusion rate,
saw increased fat globule size, suggesting a better disruption of the protein
matrix.
5. Concluding Remarks
In this research, a microparticulated whey protein was produced through
the addition of a polysaccharide. This microparticulated whey protein was
designed to replace fat within a low fat Cheddar cheese by mimicking fat globule
size of 2-10μm. The microparticulated whey protein was produced through a
combination of whey protein isolates, Perham and Provon, each with λ-
carrageenan. SDS-PAGE results suggest the interaction occurring between the
protein and λ-carrageenan is not electrostatic or hydrophobic in nature. Rather,
the λ-carrageenan is likely preventing protein aggregation through increased
viscosity. Results of cheese coagulum testing via rheological techniques showed
a decreased gel strength with the addition of the microparticulated whey protein
fat mimetic.
This microparticulated whey protein fat mimetic produced varied results

116
once incorporated into low fat Cheddar cheese. Promising results are observed
in low fat Cheddar cheeses produced with high levels of Provon fat mimetic. This
cheese treatment was consistently more like the full fat cheese in TPA
measurements. In addition, a similar trend is seen for rheological texture
analysis. Stress sweep tests and compression testing showed Provon High to be
closest in texture to full fat in comparison to other treatment cheeses. Microscopy
images show a structural difference between the low fat control cheese and
cheeses produced with Provon Low and Provon High. While the low fat control
cheese is dominated by a protein matrix, the Provon Low and Provon High show
increased fat globule size. Within all texture tests, a high variability was observed
within cheese replicates. This is in part due to the variability of producing bench-
top cheeses. Overall, this research demonstrated potential use of a
microparticulated whey protein, produced from Provon 190 whey protein isolate
and λ-carrageenan, at a high inclusion rate in improving the texture of low fat
Cheddar cheese. Further testing should include a scale-up in cheese-makes to
reduce variability within cheese replicates.

117
6. References
Abd El-Salam, M. H., El-Shibiny, S., & Salem, A. (2009). Factors Affecting the Functional Properties of Whey Protein Products: A Review. Food Reviews International, 25(3), 251-270. Article database.
Akhtar, M., & Dickinson, E. (2003). Emulsifying properties of whey protein-dextran conjugates at low pH and different salt concentration. Colloids and Surfaces B: Biointerfaces, 31, 125-132.
Alexandra, L. Y., Laetitia, M. B., Winnie, Y., Andrew, M., & Peggy, M. T. (2011). Fractionation of Whey Protein Isolate with Supercritical Carbon Dioxide— Process Modeling and Cost Estimation. International Journal of Molecular Sciences, 13(1), 240.
Amelia, I., Drake, M., Nelson, B., & Barbano, D. M. (2013). A new method for the production of low-fat Cheddar cheese. Journal of Dairy Science, 96, 4870-4884.
Arango, O., Trujillo, A. J., & Castillo, M. (2013). Influence of fat replacement by inulin on rheological properties, kinetics of rennet milk coagulation, and syneresis of milk gels. Journal of Dairy Science, 96(4), 1984-1996. Retrieved Apr, from
Armstrong, D. J., & Rainey, N. H. (1995). Reduced-Fat Cheese: Regulations and Definitions. In E. L. Malin & M. H. Tunick (Eds.), Chemistry of Strucutre-Function Relationships in Cheese (Vol. 367, pp. 367-370). New York, NY: Plenum Press.
Aryana, K. J., & Haque, Z. U. (2001). Effect of commercial fat replacers on the microstructure of low-fat Cheddar cheese. International Journal of Food Science and Technology, 36(2), 169-177. Retrieved Feb, from
Auty, M. A., Twomey, M., Guinee, T. P., & Mulvihill, D. M. (2001). Development and application of confocal scanning laser microscopy methods for studying the distribution of fat and protein in selected dairy products. The Journal of dairy research, 68(3), 417.
Banks, J., & Weimer, B. (2007). Producing low fat cheese. Improving the Flavour of Cheese(142), 520-536.
Banks, J. M., Brechany, E., & Christie, W. W. (1989). The Production of Low Fat Cheddar Type Cheeses. Journal of the Society of Dairy Technology, 42, 6-9.
Bastian, E. D. (1996). Incorporating native and denatured whey proteins into cheese curd for manufacture of low-fat cheese.
Belfort, G., Davis, R. H., & Zydney, A. L. (1994). The behavior of suspensions and macromolecular solutions in crossflow microfiltration. Journal of Membrane Science, 96, 59.
BeMiller, J. N., & Whistler, R. L. (1996). Carbohydrates. In O. R. Fennema (Ed.), Food Chemistry (3 ed.). New York, NY: Marcel, Dekker, Inc.
118
Bhushan, S. Microformula: a novel approach to the microparticulation of whey protein. Dairy Ingredients Symposium.
Brown, J. A., Foegeding, E. A., Daubert, C. R., Drake, M. A., & Gumpertz, M. (2003). Relationships Among Rheological and Sensorial Properties of Young Cheeses. Journal of Dairy Science, 86, 14.
Brown, K. M., McManus, W. R., & McMahon, D. J. (2012). Starch addition in renneted milk gels: Partitioning between curd and whey and effect on curd syneresis and gel microstructure. Journal of Dairy Science, 95(12), 6871-6881. Retrieved Dec, from
Calvo, M. M., Leaver, J., & Banks, J. M. (1993). Influence of other whey proteins on the heat- induced aggregation of α-lactalbumin. International Dairy Journal, 3(8), 719-727.
Case, R. A., Bradley, R. L., & Williams, R. R. (1985). Chemical and Physical Methods. In G. H. Richardson (Ed.), Standard Methods for the Examination of Dairy Products (15 ed.). Washington, D.C.: American Public Health Association.
Chakrabarti, S. (2006). Probing Ingredient Functionalities in Food Systems Using Rheological Methods. In A. G. Gaonkar & A. McPherson (Eds.), Ingredient Interactions Effects on Food Quality (2 ed.). Boca Raton, FL: CRC Press Taylor and Francis Group.
Choi, J., Horne, D. S., & Lucey, J. A. (2007). Effect of Insoluble Calcium Concentration on Rennet Coagulation Properties of Milk. Journal of Dairy Science(90), 12.
Civille, G. V., & Szczesniak, A. S. (1973). GUIDELINES TO TRAINING A TEXTURE PROFILE PANEL. Journal of Texture Studies, 4(2), 204-223.
Corporation, S. (2014). Whey Microparticulation. http://www.spx.com/en/apv/pd-mp-microparticulation/. Retrieved November 28, 2014
Corredig, M., Sharafbafi, N., & Kristo, E. (2011). Polysaccharide-protein interactions in dairy matrices, control and design of structures. Food Hydrocolloids, 25(8), 1833-1841. Retrieved Dec, from
Croguennec, T., Leng, N., Hamon, P., Rousseau, F., Jeantet, R., & Bouhallab, S. (2014). Caseinomacropeptide modifies the heat- induced denaturation– aggregation process of β- lactoglobulin. International Dairy Journal, 36(1), 55-64.
de la Fuente, M. A., Hemar, Y., & Singh, H. (2003). Influence of k-carrageenan on the aggregation behaviour of protein in heated whey protein isolate solutions. Food Chemistry, 86, 9.
de la Fuente, M. A., Singh, H., & Hemar, Y. (2002). Recent advances in the characterisation of heat- induced aggregates and intermediates of whey proteins. Trends in Food Science & Technology, 13(8), 262-274.
Dietary Guidelines for Americans (2010). http://www.health.gov/dietaryguidelines/dga2010/DietaryGuidelines2010.pdf: U.S.

119
Department of Health and Human Services. Retrieved July 24, 2013
Drake, M. A., Boylston, T. D., & Swanson, B. G. (1996). Fat Mimetics in Low-Fat Cheddar Cheese. Journal of Food Science, 61(6), 1267-1271. Article database.
Drake, M. A., Gerard, P. D., Truong, V. D., & Daubert, C. R. (1999). Relationship Between Instrumental And Sensory Measurements of Cheese Texture. Journal of Texture Studies, 30, 26.
Drake, M. A., Herrett, W., Boylston, T. D., & Swanson, B. G. (1996). Lecithin improves texture of reduced fat cheeses. Journal of Food Science, 61(3), 639.
Etzel, M. R. (2004). Manufacture and use of dairy protein fractions. The Journal of Nutrition, 996-1002.
Everett, D. W., Ding, K., Olson, N. F., & Gunasekaran, S. (1995). Applications of Confocal Microscopy to Fat Globule Structure in Cheese. In E. L. Malin & M. H. Tunick (Eds.), Chemistry of Structure-Function Relationships in Cheese (Vol. 367, pp. 321-337). New York: Plenum Press.
Fiett, K. L., & Corredig, M. (2009). Whey protein aggregate formation during heating in the presence of kappa-carrageenan. Food Chemistry, 115(4), 1479-1485. Retrieved Aug, from
Foegeding, E. A., Davis, J. P., Doucet, D., & McGuffey, M. K. (2002). Advances in modifying and understanding whey protein functionality. Trends in Food Science & Technology, 13(5), 151-159. Retrieved May, from
Fox, P. F., Guinee, T. P., Cogan, T. M., & McSweeney, P. L. H. (2000). Fundamentals of Cheese Science. Gaithersberg, MD: Aspen Publishers.
Galani, D., & Apenten*, R. K. (1999). Heat‐ induced denaturation and aggregation of β‐ Lactoglobulin: kinetics of formation of hydrophobic and disulphide‐linked aggregates. International Journal of Food Science & Technology, 34(5‐6), 467-476.
Glanbia. (2014). Provon 190 Specification Sheet.
Goh, K. K. T., Sarkar, A., & Singh, H. (2009). Milk protein-polysaccharide interactions. Milk Proteins: from Expression to Food, 347-376.
Guinee, T. P., Auty, M. A. E., Mullins, C., Corcoran, M. O., & Mulholland, E. O. (2000). PRELIMINARY OBSERVATIONS ON EFFECTS OF FAT CONTENT AND DEGREE OF FAT EMULSIFICATION ON THE STRUCTURE‐FUNCTIONAL RELATIONSHIP OF CHEDDAR‐TYPE CHEESE. Journal of Texture Studies, 31(6), 645-663.
Guinee, T. P., Fenelon, M. A., Mulholland, E. O., O'Kennedy, B. T., & O'Briend, N., Reville, J. (1998). The influence of milk pasteurization temperature and pH at curd milling on the composition, texture, and maturation of reduced fat Cheddar cheese. International

120
Journal of Dairy Technology, 51(1), 1-10.
Gunasekaran, S., & Ak, M. M. (2003). Cheese Rheology and Texture. Boca Raton, FL: CRC Press LLC.
Haque, Z. U., Kucukoner, E., & Aryana, K. J. (2007). Influence of fat-replacing ingredients on process and age induced soluble nitrogen content and ultrastructure of lowfat Cheddar cheese. Food Science and Technology Research, 13(4), 338-344. Retrieved Nov, from
Havea, P., Singh, H., & Creamer, L. K. (2001). Characterization of heat-induced aggregates of B-lactoglobulin, a-lactalbumin, and bovine serum albumin in a whey protein concentrate environment. Journal of Dairy Research(15), 15.
Hill, A. R. (1995). Chemical species in cheese and their origin in milk components. In E. L. Malin & M. H. Tunick (Eds.), Chemistry of Structure-Function Relationships in Cheese (Vol. 367, pp. 43-58). New York: Plenum Press.
Hoffmann, M. A. M., & Mil, v. P. J. J. M. (1997). Heat induced aggregation of - lactoglobulin: role of the free thiol group and disulphide bonds. Journal of Agricultural and Food Chemistry, 0021.
Hooi, R., Barbano, D. M., Bradley, R. L., Budde, D., Bulthaus, M., Chettiar, M., et al. (2004). Chemical and Physical Methods. In H. M. Wehr & J. F. Frank (Eds.), Standard Methods for the Examination of Dairy Products (17 ed.). Washington, DC: American Public Health Association.
Iijima, H., & Takeo, K. (2000). Microcrystalline Cellulose. In G. O. Phillips & P. A. Williams (Eds.), Handbook of Hydrocolloids (pp. 331-346). Boca Raton, FL: Woodhead Publishing.
Imeson, A. P. (2000). Carrageenan. In G. O. Phillips & P. A. Williams (Eds.), Handbook of Hydrocolloids (pp. 87-102). Boca Raton, FL: Woodhead Publishing.
International, D. F. (2014). BiPRo: Functional Properties of BiPro. http://www.daviscofoods.com/specialty/function.html. Retrieved November 29, 2014
Jones, A. D., Tier, C. M., & Wilkins, J. P. G. (1998). Analysis of the Maillard reaction products of ß- lactoglobulin and lactose in skimmed milk powder by capillary electrophoresis and electrospray mass spectrometry. Journal of Chromatography A, 822(1), 147-154.
Kelco, C. (2014). CP Kelco Microparticulated Whey Protein Concentrate. http://cpkelco.com/products/microparticulated-whey-protein-concentrate/. Retrieved November 28, 2014
Kosikowski, F. V., & Mistry, V. V. (1997). Cheese and Fermented Milk Foods (3 ed. Vol. 1:Origins and Principles). Westport, Connecticut: F.V. Kosikowski, L.L.C.
Kovacova, R., Synytsya, A., & Stetina, J. (2009). Characterisation of Whey Proteins-Pectin Interaction in Relation to Emulsifying Properties of Whey Proteins. Czech Journal of Food
121
Sciences, 27, S4-S8.
Kuchroo, C., & Fox, P. (1982). Soluble Nitrogen in Cheddar Cheese - Comparison of Extraction Procedures. Milchwissenschaft, 37, 5.
Laloy, E., Vuillemard, J. C., ElSoda, M., & Simard, R. E. (1996). Influence of the fat content of Cheddar cheese on retention and localization of starters. International Dairy Journal, 6(7), 729-740. Retrieved Jul, from
Laneuville, S. I., Paquin, P., & Turgeon, S. L. (2000). Effect of preparation conditions on the characteristics of whey protein - xanthan gum complexes. Food Hydrocolloids, 14(4), 305-314. Retrieved Jul, from
Law, B. A., & Johnson, M. (1999). Technology of Cheesemaking. Boca Raton, FL: CRC Press, L.L.C.
Ledward, D. A. (1993). Creating textures from mixed biopolymer systems. Trends in Food Science and Technology, 4(December), 402-405.
Lieske, B., & Konrad, G. (1994). Microparticulation of whey protein: related factors affecting the solubility. Z Lebensm Unters Forsch, 199, 289-293.
Lobato-Calleros, C., Robles-Martinez, J. C., Caballero-Perez, J. F., Aguirre-Mandujano, E., & Vernon-Carter, E. J. (2001). Fat replacers in low-fat Mexican Manchego cheese. Journal of Texture Studies, 32(1), 1-14. Retrieved Apr, from Article database.
Lomholt, S. B., & Qvist, K. B. (1999). The formation of cheese curd. In B. A. Law (Ed.), Technology of Cheesemaking. Sheffield, England: Sheffield Academic Press Ltd.
Lopez, C., Camier, B., & Gassi, J.-Y. (2007). Development of the milk fat microstructure during the manufacture and ripening of Emmental cheese observed by confocal laser scanning microscopy. International Dairy Journal, 17(3), 235-247.
Lucey, J. A., Munro, P. A., & Singh, H. (1998). Rheological properties and microstructure of acid milk gels as affected by fat content and heat treatment. Journal of Food Science, 63(4), 0.
Lucey, J. A., Munro, P. A., & Singh, H. (1999). Effects of Heat Treatment and Whey Protein Addition on the Rheological Properties and Structure of Acid Skim Milk Gels. International Dairy Journal(9), 5.
Lucey, J. A., Tamehana, M., Singh, H., & Munro, P. A. (2000). Rheological properties of milk gels formed by a combination of rennet and glucono-delta-lactone. Journal of Dairy Research(67), 13.
Luyten, H., & van Vliet, T. (1990). The influence of a filler on the rheological and fracture properties of food materials. In R. E. Carter (Ed.), Rheology of Food, Pharmaceutical and Biological Materials with General Rheology (pp. 43-56). Essex, England: Elsevier Applied Science.

122
Ma, L., & Drake, M. A. (1997). Rheology of full-fat and low-fat cheddar cheeses as related to type of fat mimetic. Journal of Food Science, 62(4), 748. Article database.
Ma, L., Drake, M. A., Barbosa-Canovas, G. V., & Swanson, B. G. (1996). Viscoelastic Properties of Reduced-Fat and Full-Fat Cheddar Cheese. Journal of Food Science, 61(4), 3.
Mackey, K. L., & Desai, N. (1995). Rheology of Reduced-Fat Cheese Containing and Fat Substitute. In E. L. Malin & M. H. Tunick (Eds.), Chemistry of Structure-Function Relationships in Cheese (Vol. 367, pp. 21-26). New York, NY: Plenum Press.
McMahon, D. J., Alleyne, M. C., Fife, R. L., & Oberg, C. J. (1996). Use of fat replacers in low fat Mozzarella cheese. Journal of Dairy Science, 79(11), 1911-1921. Retrieved Nov, from
Metzger, L., & Rosenberg, L. (2002). Texture Profile Analysis (TPA). (Testing for Cheese Quality Workshop).
Metzger, L. E., & Mistry, V. V. (1995). A NEW APPROACH USING HOMOGENIZATION OF CREAM IN THE MANUFACTURE OF REDUCED FAT CHEDDAR CHEESE .2. MICROSTRUCTURE, FAT GLOBULE DISTRIBUTION, AND FREE OIL. Journal of Dairy Science, 78(9), 1883-1895. Retrieved Sep, from Article database.
Meullenet, J. F. C., Carpenter, J. A., Lyon, B. G., & Lyon, C. E. (1997). Bi-cyclical instrument for assessing texture profile parameters and its relationship to sensory evaluation of texture. J. Texture Stud., 28(1), 101-118.
Mishra, S., Mann, B., & Joshi, V. K. (2001). Functional improvement of whey protein concentrate on interaction with pectin. Food Hydrocolloids, 15(1), 9-15. Retrieved Jan, from
Mistry, V. V. (2001). Low fat cheese technology. International Dairy Journal, 11(4-7), 413-422.
Monahan, F. J., German, J. B., & Kinsella, J. E. (1995). Effect of pH and temperature on protein unfolding and thiol/ disulfide interchange reactions during heat- induced gelation of whey proteins. Journal of Agricultural and Food Chemistry, 43(1), 46-52.
Necas, J., & Bartosikova, L. (2013). Carrageenan: a review. Veterinarni Medicina, 4, 187-205.
Neelima, R., Sharma, Y., Rajput, B., & Mann, B. (2013). Chemical and functional properties of glycomacropeptide ( GMP) and its role in the detection of cheese whey adulteration in milk: a review. Official journal of the Institut National de la Recherche Agronomique (INRA), 93(1), 21-43.
Nurcan, K., & Metin, M. (2004). Textural, melting and sensory properties of low-fat fresh kashar cheeses produced by using fat replacers. International Dairy Journal, 14, 365-373.
Nutritionals, G. (2014). Products: Whey Proteins. Retrieved November 1, 2014, from www.glanbianutritionals.com/products/whey-proteins
O'Connor, T. P., & O'Brien, N. M. (2000). Nutritional Aspects of Cheese. In P. F. Fox, T. P. Guinee,
123
T. M. Cogan & P. L. H. McSweeney (Eds.), Fundamentals of Cheese Science (pp. 504-513). Gaithersburg, MD: Aspen Publishers.
Omayma, E. S., & Youssef, M. M. (2007). Fat Replacers and Their Applications in Food Products: A Review. Vol. 4, pp. 29-44)(Alexandria Journal of Food Science and Technology).
Onwulata, C. I., Konstance, R. P., & Tomasula, P. M. (2002). Viscous properties of microparticulated dairy proteins and sucrose. Journal of Dairy Science, 85(7), 1677-1683. Retrieved Jul, from
Overweight and Obesity (2012). http://www.cdc.gov/obesity/data/adult.html.: Centers for Disease Control and Prevention. Retrieved July 24, 2013
Photchanachai, S., & Kitabatake, N. (2001). Heating of beta- lactoglobulin A solution in a closed system at high temperatures. Journal of Food Science, 66(5), 647.
Punidadas, P., & Rizvi, S. S. H. (1998). Separation of milk proteins in to fractions rich in casein or whey proteins by cross flow filtration. Food Research International, 31(4), 8.
Regester, G. O. (1997). Protein Microfraction Analysis. In Chicago, IL. (International Whey Conference).
Regulations, C. o. F. (2013). Food Labeling. In F. a. D. Administration (Ed.). In 21.
Romeih, E. A., Michaelidou, A., Biliaderis, C. G., & Zerfiridis, G. K. (2002). Low-fat white-brined cheese made from bovine milk and two commercial fat mimetics: chemical, physical and sensory attributes. International Dairy Journal, 12(6), 525-540.
Roufik, S., Paquin, P., & Britten, M. (2005). Use of high- performance size exclusion chromatography to characterize protein aggregation in commercial whey protein concentrates. International Dairy Journal, 15(3), 231-241.
Rudan, M. A., Barbano, D. M., Guo, M. R., & Kindstedt, P. S. (1998). Effect of the Modification of Fat Particle Size by Homogenization on Composition, Proteolysis, Functionality, and Appearance of Reduced Fat Mozzarella Cheese. Journal of Dairy Science, 81, 2065-2076.
Schenkel, P., Samudrala, R., & Hinrichs, J. (2013). The effect of adding whey protein particles as inert filler on thermophysical properties of fat-reduced semihard cheese type Gouda. International Journal of Dairy Technology, 66(2), 220-230. Retrieved May, from
Schmidt, R. H., Packard, V. S., & Morris, H. A. (1984). Effect of processing on whey protein functionality. Journal of Dairy Science, 67, 2723-2733.
Schorsch, C., Wilkins, D. K., Jones, M. G., & Norton, I. T. (2001). Gelation of casein-whey mixtures: effects of heating whey proteins alone or in the presence of casein micelles. Journal of Dairy Research, 68, 11.
Schorsch, C., Wilkins, D. K., Jones, M. G., & Norton, I. T. (2001). Gelation of casein-whey

124
mixtures: effects of heating whey proteins alone or in the presence of casein micelles. Journal of Dairy Research, 68(3), 471-481. Retrieved Aug, from
Serrano, J., Velazquez, G., Lopetcharat, K., Ramirez, J. A., & Torres, J. A. (2005). Moderately high hydrostatic pressure processing to reduce production costs of shredded cheese: microstructure, texture, and sensory properties of shredded milled curd Cheddar. Journal of Food Science, 70, 286-293.
Shenana, M. E., El-Nagar, G. F., El-Shibiny, S., & Abdou, S. M. (2007). Preparation and use of whey protein/carrageenan particulate in making low-fat yoghurt. Egyption Journal of Dairy Science, 35(2), 185-193.
Smith, K. (2008). Dried Dairy Ingredients. (Wisconsin Center for Dairy Research).
Spagnuolo, P. A., Dalgleish, D. G., Goff, H. D., & Morris, E. R. (2005). Kappa- carrageenan interactions in systems containing casein micelles and polysaccharide stabilizers. Food Hydrocolloids, 19(3), 371-377.
Srinivasan, M., & Lucey, J. A. (2002). Effects of Added Plasmin on the Foundation and Rheological Properties of Rennet-Induced Skim Milk Gels. Journal of Dairy Science(85), 9.
Stone, A. K., & Nickerson, M. T. (2012). Formation and functionality of whey protein isolate–(kappa-, iota-, and lambda-type) carrageenan electrostatic complexes. Food Hydrocolloids, 27(2), 271-277. Article database.
Studio, R. (2012). RStudio: Integrated development environment for R Version 0.98.501. http://www.rstudio.org/. Retrieved January 1, 2014
Swaisgood, H. E. (1996). Characteristics of Milk. In O. R. Fennema (Ed.), Food Chemistry (3 ed., pp. 841-876). New York, NY: Marcel Dekker, Inc.
Tunick, M. H. (2000). Rheology of Dairy Foods that Gel, Stretch, and Fracture. Journal of Dairy Science(83), 7.
Uludogan, G. (1999). Evaluation of milk coagulation using ultrasonic and rheological methods, Ph.D. thesis. University of Wisconsin-Madison.
Ustunol, Z., Kawachi, K., & Steffe, J. (1995). Rheological Properties of Cheddar Cheese as Influenced by Fat Reduction and Ripening Time. Journal of Food Science, 60(6), 3.
Van Boekel, M. A. J. S. (1998). Effect of heating on Maillard reactions in milk. Food Chemistry, 62(4), 403-414.
van Vliet, T., Lakemond, C. M. M., & Wisschers, R. W. (2004). Rheology and structure of milk proteins gels. Current Opinion in Colloid and Interface Science, 9, 7.
Varnam, A. H., & Sutherland, J. P. (1994). Cheese. In Milk and Milk Products: Technology, Chemistry, and Microbiology (Vol. 1). London: Chapman & Hall.
125
Veith, P. D., & Reynolds, E. C. (2004). Production of a high gel strength whey protein concentrate from cheese whey. Journal of Dairy Science, 87(4), 831-840.
Venugopal, V., & Muthukumarappan, K. (2003). Rheological Properties of Cheddar Cheese During Heating and Cooling. International Journal of Food Properties, 6(1), 99-114.
Walstra, P. (1999). Dairy Technology -- Principles of Milk Properties and Processes. New York: Marcel Dekker, Inc.
Wehr, H. M., & Frank, J. F. (2004). Standard Methods for the Examination of Dairy Products. (17 ed. Washington, DC:(American Public Health Association).
Weinbreck, F., Nieuwenhuijse, H., Robijn, G. W., & de Kruif, C. G. (2004). Complexation of Whey Protein with Carrageenan. J. Agric. Food Chem., 52(11), 6.
Wilkinson, T., & Boutiette, B. (2013). Perham Whey Proteins: Instant Whey Protein Isolate. Perham, MN:(Bongards' Creameries).
Yang, X., Rogers, N. R., Berry, T. K., & Foegeding, E. A. (2011). MODELING THE RHEOLOGICAL PROPERTIES OF CHEDDAR CHEESE WITH DIFFERENT FAT CONTENTS AT VARIOUS TEMPERATURES. Journal of Texture Studies, 42(5), 331-348. Retrieved Oct, from
Zhang, G., & Foegeding, E. A. (2003). Heat induced phase behavior of B-lactoglobulin/polysaccharide mixtures. Food Hydrocolloids, 17, 785-792.
Zhang, G. Y., Foegeding, E. A., & Hardin, C. C. (2004). Effect of sulfated polysaccharides on heat-induced structural changes in beta-lactoglobulin. Journal of Agricultural and Food Chemistry, 52(12), 3975-3981. Retrieved Jun, from
Zhang, S., Zhang, Z., Lin, M., & Vardhanabhuti, B. (2012). Raman spectroscopic characterization of structural changes in heated whey protein isolate upon soluble complex formation with pectin at near neutral pH. Journal of agricultural and food chemistry, 60(48), 12029.
Zhu, D., Damadoran, S., & Lucey, J. A. (2008). Formation of Whey Protein Isolate (WPI) - Dextran Conjugates in Aqueous Solutions. J. Agric. Food Chem.(56), 5.

126
7. Appendix
7.1 Chapter 3 Extended Methods
7.1.1. Fat Replacer Preparation and Malvern Method
Objective: Prepare WPI-λ-Carrageenan sample preparation for use in particle
size analysis.
Materials and Equipment:
Whey protein isolate
Λ-Carrageenan
Deionized water
Weigh boats
Small glass vials
250mL beakers
Stir bars
Stir plate
1000mL beaker
Graduated cylinder
Spatula
Water bath
Plastic sample rack
IKA bench-top homogenizer
Balance
Thermometer
Malvern Mastersizer
Fresh, distilled water
3mL pipets
Draining bucket
IGEPAL Cleaning Solution
Procedure:
1. One day in advance, prepare the carrageenan. Weigh 1g carrageenan
onto a weigh boat. Measure 500mL of deionized water into a large,
1000mL beaker. Slowly pour the carrageenan into the water while the
water is mixed using the IKA bench-top homogenizer set at level 3. Store

127
in refrigerated conditions overnight to hydrate.
2. Remove carrageeenan from the refrigerator and allow it to reach room
temperature.
3. Weigh5g of the whey protein onto a weigh boat. Measure 100mL of
carrageenan into a small beaker and add a stir bar. Slowly mix in the whey
protein, avoiding foaming.
4. Using a graduated cylinder, transfer 25mL of mixed WPI-λ-Carrageenan
into a glass vial.
5. Set the water bath to 95ºC. Once at the proper temperature, set the glass
vials of sample into sample racks and add to the water bath. Time the
temperature exposure for five minutes.
6. Remove samples from the water bath and allow them to reach room
temperature before proceeding with further testing.
7. Turn on Malvern Mastersizer: Turn key forward and push ‘On’ button. Turn
on dispersion unit and set at 1,300.
8. Drain and add fresh, distilled water to the dispersion unit.
9. Allow instrument to warm up for approximately 30 minutes.
10. After 30 minutes, turn on the computer and enter the Malvern Mastersizer
program.
11. Set analysis to polydisperse.
12. While water is flowing through the dispersion unit, align the laser. Select
Measure and Align. Laser power should be 75% or higher. If too low, allow
to the instrument to warm longer. Select start and allow to align.
13. Correct for background. Select Measure and Background. Select start.
14. Begin samples. Adjust dispersion unit (containing fresh distilled water) to
1,300, which allows flow but is not fast enough to disturb the particle size.
Select Measure and Start Sequence. Enter sample ID name or number.
Click next twice until obscuration is shown.
15. Obscuration should be less than 1% to start. Add well mixed sample into
the dispersion unit with a pipet until an obscuration of approximately 25%

128
is achieved. Click next and then start.
16. Report can be printed as Derived Diameters or a Histogram Report.
17. To clear dispersion unit for next sample, flush with fresh water at least five
times, allowing water to circulate through the instrument and then drain.
18. When completely finished, add 1-2 drops of IGEPAL cleaning soap with a
pipet into the dispersion unit and allow to flow for five minutes. Flush with
distilled water 10 times or until soap is gone.
19. Leave fresh, distilled water in the dispersion unit. Turn off dispersion unit,
instrument, and computer.
7.1.2. Gel Electrophoresis
Objective: The objective is to determine the types of bonds present in WPI-λ-
Carrageenan samples using gel electrophoresis.
Materials and Equipment:
Lamdba carrageenan
Whey Protein
Weigh boats
1L Beaker
Stirring rod
IKA T18 homogenizer
Balance
Plastic wrap
Water bath
Thermometer
4-100mL beakers
Graduated cylinder
4 magnetic stir bars
Glass tubes with caps
Tube rack Pipet (1000ul, 5000ul, 20ul, 200ul)
Pipet transfer tips
1% SDS mixture
Laemmli buffer
Running buffer
Eppendorf tubes
Centrifuge
B-Mercaptoethanol
129
Gels- BioRad 26 well 4-20%
BioRad PowerPac/plastic base/green lid
G-250 BioSafe Coomassie Stain
BioRad pre-stained molecular weight marker
Protein Standards
BioRad Gel Doc Station
Procedure
Sample Preparation
1. Prepare WPI-λ-Carrageenan as per Method 7.1.1. The protein
concentration of the samples is 45mg/1mL.
2. Dilute samples to 0.0225/10ul. To do this, first scrape the sides of the
sample vials to ensure all protein is dispersed. Vortex the sample.
Remove 1mL of sample and transfer to another vial. Dilute by adding 9mL
of deionized water. The protein concentration is now 4.5mg/1mL.
3. Label a small eppendorf tube. Vortex and transfer 1mL of diluted sample
to the tube. The sample will be further diluted later upon addition of
Laemmli buffer.
4. Once 1mL of all diluted samples has been transferred to their
corresponding eppendorf tubes, vortex and remove 10ul from each to a
corresponding and labeled eppendorf tube #1.
5. Centrifuge the original tubes for 10 minutes at 10,000rpm. Remove 10ul of
supernatant, without disturbing the pellet, and place in eppendorf tube #2.
Remove and discard remaining supernatant layer.
6. Add 990ul of 1% SDS to the pellet. Resolubilize by vortexing. Remove
10ul of each sample and place in a labeled eppendorf tube #3.
7. Centrifuge samples for 10 minutes at 10,000rpm. Remove 10ul of the
supernatant and place in a labeled eppendorf tube #4. Remove and
discard supernatant layer.
8. Add 930ul of 1% SDS and 50ul of B-Mercaptoethanol to remaining pellet.
Vortex well to resolubilize the pellet. Remove 10ul of sample and place in

130
a labeled eppendorf tube #7.
9. Prepare standards and place 10ul of each in eppendorf tubes.
10. To each sample and standard tube, add 10ul of Laemmli buffer and
vortex. The protein concentration should now be 0.02mg/10ul per sample.
11. Heat the samples+Laemmli buffer in boiling water using an eppendorf tube
holder for 5 minutes.
Sample Loading
1. Remove the BioRad Prestained Molecular Weight Marker from the
freezer. Allow to warm at room temperature until liquid.
2. Set-up the plastic base. Remove the tab from the bottom of the gel and
snap the gel into place in the plastic base. Slowly add running buffer to the
base, filling both sides if two gels are being run. Fill up to the indicator line.
Remove gel comb and discard.
3. Using the gel loading tips, transfer 10ul of sample to each corresponding
well. Record placement of each sample.
4. Place the green lid over the plastic base, matching the red and black tips.
Plug the base into the BioRad PowerPac. Plug in the PowerPac and set to
200V. Select Run.
5. The run should last approximately 40 minutes or until bands reach the
base of the gel without running over.
6. When run is complete, unplug the power pac. Remove green lid. Remove
gels. Crack open the gels with the green lid and place the gel in deionized
water until submerged.
Staining
1. Submerge the gel in deionized water and place on a shaker at low speed
for five minutes. Repeat three times.
2. Drain the water and add 50mL of the BioSafe Coomassie G-250 Stain and
allow to shake for 1 hour.

131
3. Drain the stain into a waste container. Submerge the gel in deionized
water and allow the gel to shake for 30 minutes.
Viewing the Gel
1. Gel can be viewed on the BioRad Gel Doc. Turn on the gel doc and
connect to the computer.
2. Remove gel carefully from the water and place on the white tray inside the
gel doc. Remove excess water and bubbles.
3. Select Epi White on the instrument for the light source and close the
drawer.
4. On the computer, open the software program and the Gel Doc XR viewing
window. Adjust parameters such as focus and zoom until desired picture
is acquired.
7.1.3. Analysis of Gel Formation by Rheology
Objective: The purpose was to measure the gel strength and gel fracture time of
renneted milk containing various levels of the WPI-λ-C fat replacer mixture.
Results were used to determine inclusion rate of fat replacer in future cheese
makes.
Materials and Equipment:
AR-G2 Rheometer with Cup and Bob attachment
Water bath circulator
Deionized water
Skim milk
Heavy whipping cream
Rennet
Lactic Acid
pH meter with standard 4.0,7.0, and 10.0
50mL centrifuge tubes
15mL centrifuge tubes
Thermometer
Small milk vat
Large spoon
132
Small Balance
Large Balance
Pipette (5000ul, 1000ul, 20ul)
Pipette tips
2-500mL Beaker
Small plastic sample rack
Whey protein isolate
Λ-Carrageenan
Water bath
Weigh boat
Cooler and ice
Kim wipes
Stopwatch
Procedure: Day 1: Sample Preparation and Milk Preparation
1. Prepare whey protein and lambda carrageenan samples according to
sample prep procedure 7.1.1. Store samples in refrigerated conditions
until use.
2. Standardize milk to the desired fat content using a combination of skim
milk and heavy whipping cream. Method for Babcock test for determining
fat content can be found in method 7.2.2.
3. Reduce pH of standardized milk batch to pH 6.2 using lactic acid, diluted
1:10 in deionized water. Ensure milk is cold in this step.
4. Weigh 50g of milk into 50mL centrifuge tubes. Store in refrigerated
conditions until use.
Day 2: Rheometer Set-up
1. Transfer milk samples, whey protein+lambda carrageenan samples, and
rennet to a cooler with ice to transfer to the rheometer location.
2. Attach the cup to the rheometer base, ensuring both base and cup are
clean and free of particles. Connect the cup to the water circulator by
attaching the two clear tubes. Turn on the circulator. Connect the cup to
the rheometer with the electric plug.
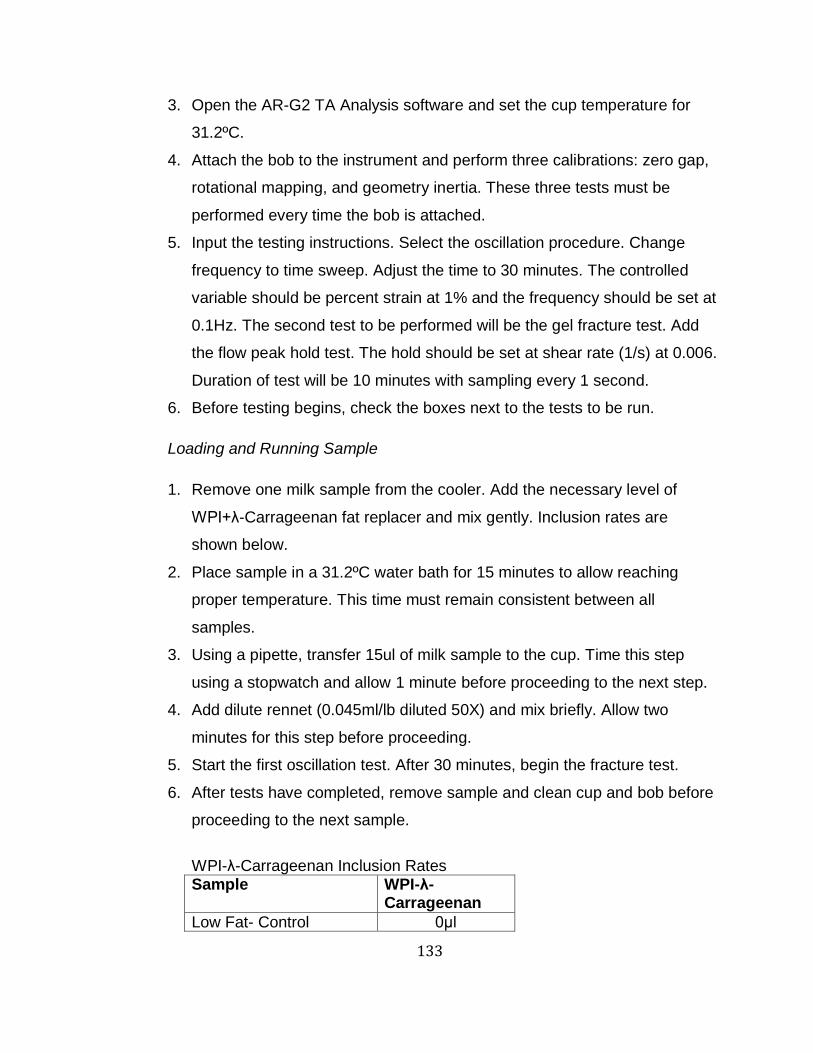
133
3. Open the AR-G2 TA Analysis software and set the cup temperature for
31.2ºC.
4. Attach the bob to the instrument and perform three calibrations: zero gap,
rotational mapping, and geometry inertia. These three tests must be
performed every time the bob is attached.
5. Input the testing instructions. Select the oscillation procedure. Change
frequency to time sweep. Adjust the time to 30 minutes. The controlled
variable should be percent strain at 1% and the frequency should be set at
0.1Hz. The second test to be performed will be the gel fracture test. Add
the flow peak hold test. The hold should be set at shear rate (1/s) at 0.006.
Duration of test will be 10 minutes with sampling every 1 second.
6. Before testing begins, check the boxes next to the tests to be run.
Loading and Running Sample
1. Remove one milk sample from the cooler. Add the necessary level of
WPI+λ-Carrageenan fat replacer and mix gently. Inclusion rates are
shown below.
2. Place sample in a 31.2ºC water bath for 15 minutes to allow reaching
proper temperature. This time must remain consistent between all
samples.
3. Using a pipette, transfer 15ul of milk sample to the cup. Time this step
using a stopwatch and allow 1 minute before proceeding to the next step.
4. Add dilute rennet (0.045ml/lb diluted 50X) and mix briefly. Allow two
minutes for this step before proceeding.
5. Start the first oscillation test. After 30 minutes, begin the fracture test.
6. After tests have completed, remove sample and clean cup and bob before
proceeding to the next sample.
WPI-λ-Carrageenan Inclusion Rates Sample WPI-λ-
Carrageenan
Low Fat- Control 0μl
134
Low Fat- Low Inclusion 785µl
Low Fat- Medium Inclusion
1,570µl
Low Fat- High Inclusion 2,355µl
7.2. Chapter 4 Extended Methods
7.2.1. Cheese Production
General Cheese Making Procedure
Objective: Produce full fat, low fat, or low fat with fat replacers bench top
cheeses for research purposes.
Materials
Homogenizer
500mL beaker
Λ-carrageenan
Deionized water
Protein (Provon and Perham)
Autumnwood Farms skim and unhomogenized whole milk
Large milk container
Sanitizer (EcoLab Trichloride 5600)
Weigh Boats
500-1000mL graduated cylinder
TA Test- Sodium Hydroxide
Phenolphthalein Solution
2 Plastic Cups
pH Meter with Standards
Tub for sanitized materials
Spoon
Knife for checking curd
Metal thermometer
Scale
Cheese cutters
Plastic pipets
Balance
10mL graduated cylinder
Beaker (plastic)

135
Plate
Container for collecting whey
4 Plastic containers for salt
Cheese mold materials
Cheese cloth
Cheese press
Procedure
1. Two days in advance to cheesemaking, begin preparation of the fat replacer.
Mix 1g of λ-carrageenan into 500mL of deionized water using a homogenizer.
Place the mixture, covered, in a refrigerator until use the next day.
2. One day in advance to cheesemaking, prepare fat replacers according to the
method found in Appendix 7.1.1. The same day, prepare the cheesemilk. Rinse
large milk containers and any other utensils with sanitizer (.13g/L water).
Combine skim and whole milk to achieve desired fat content. Confirm fat content
using the Babcock Method for milk found in Appendix 7.2.2. Store the
cheesemilk, covered, in a refrigerator.
3. One day in advance, prepare the culture. Place 500mL of skim milk in a 90ºC
water bath and allow to heat for one hour, stirring periodically. After one hour,
remove the milk and allow to cool. Once cool, add 1% culture (5mL culture in
500mL milk). Mix well and cover the container. Place in a 28ºC water bath for 12-
18 hours.
4. The next day, remove the cheesemilk and fat replacers from the cooler.
Check the pH of the culture and confirm that the pH is 4.4. Sanitize all materials
using the EcoLab Trichloride 5600 sanitizer. Pour the cheesemilk into vats and
place in a water bath. If low fat cheese is being made, use 10X diluted lactic acid
to reduce the pH to 6.2 while the milk is still cold. Then, bring the cheesemilk up
to 31.2ºC. While the cheesemilk is warming, add the fat replacer as needed.
5. Weigh out M30 culture and add once the cheesemilk has warmed. Stir to
evenly distribute. At this point, the cheesemake batch sheets should be followed

136
and can be found below. Time and temperature targets are listed as well as pH
and TA targets. No calcium chloride or color was added to research cheeses.
Exact quantities of fat replacer, culture, salt, and other ingredients are listed in a
table below.
6. After the batch sheets have been followed, assemble the cheese mold. Place
the drained curds in the cheese mold with the cheese cloth. Allow to press for
fifteen minutes. After fifteen removed, remove the cheese and flip it to ensure
even pressing. Redress the cheese and continue pressing overnight in a warm
environment.
7. Seal the cheeses and place in a refrigerator.
Full Fat Low Fat Low Fat with Low Fat Replacer
Low Fat with High Fat Replacer
Culture
Fat Replacer
Rennet
Salt
Low Fat Stirred Curd Cheddar Cheese Batch Sheet
Cheesemaker: ________ Batch No. Date: Vat No.:
Milk Source: ___________Heated at: Composition: Fat %:
Starter: Kind: M30 Amount: Initial pH /Acidity:
Coagulator: Amount: ml
Time Time
to next
step
Temp
˚F
Target
Temp
˚F
pH /
TA
Target
pH
/TA
Remarks
Starter added
5 88 6.2 /
0.20
Color added 10 20 ml/1000#
Rennet added 20-30 6.2
/0.21

137
Cut Coagulum 5 88 0.14-
0.16
Gel should cut
cleanly with a
knife 3/8 in knife.
Let curd
Start stirring
(steam on)
5 min
15
89
6.3 –
6.4 /
0.14-
0.16
Stir for 15 minutes
then increase
temperature slowly
to 96F over 30
minutes
10 min 5 91
15 min 10 92 6.15
25 min 10 94 6.10
30 min 96
Cooking / Stir out 20 96 6.05
/0.167
When temp
reached, stir up to
pH 5.9
20 min 20 96 5.97/
0.168
20 min 20 96 Keep stirring
gently
Start Draining 15 96 5.9 /
0.181
Keep stirring
gently
End Draining 10 94 5.85 /
0.19
Dry Stir 15 min
15 92 0.17 Keep stirring
gently
Salt 20 88 5.7 /
0.22-
0.25
Salt in 3 equal
applications. 0.2%
of starting milk
weight
Hoop 15 88
Press 12 5.63/
0.375
40 psi overnight
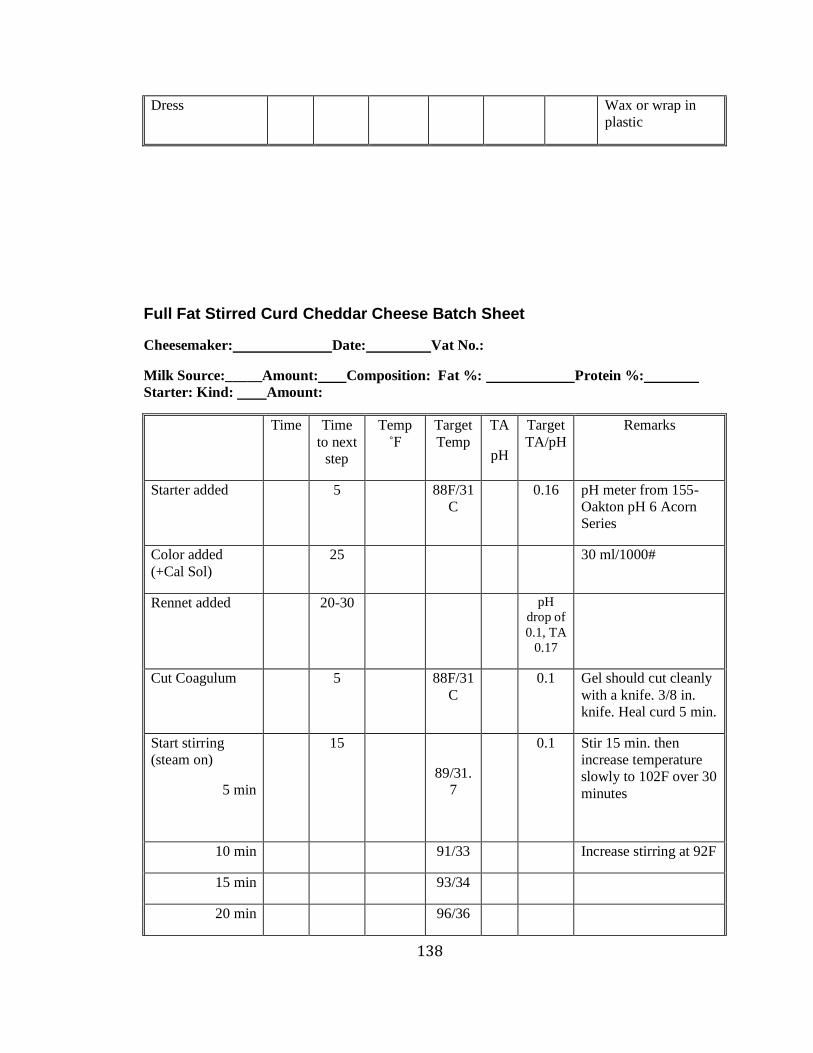
138
Dress Wax or wrap in
plastic
Full Fat Stirred Curd Cheddar Cheese Batch Sheet
Cheesemaker: Date: Vat No.:
Milk Source:_____Amount: Composition: Fat %: Protein %:
Starter: Kind: Amount:
Time Time
to next
step
Temp
˚F
Target
Temp
TA
pH
Target
TA/pH
Remarks
Starter added
5 88F/31
C
0.16 pH meter from 155-
Oakton pH 6 Acorn
Series
Color added
(+Cal Sol)
25 30 ml/1000#
Rennet added 20-30 pH
drop of
0.1, TA
0.17
Cut Coagulum 5 88F/31
C
0.1 Gel should cut cleanly
with a knife. 3/8 in.
knife. Heal curd 5 min.
Start stirring
(steam on)
5 min
15
89/31.
7
0.1 Stir 15 min. then
increase temperature
slowly to 102F over 30
minutes
10 min 91/33 Increase stirring at 92F
15 min 93/34
20 min 96/36
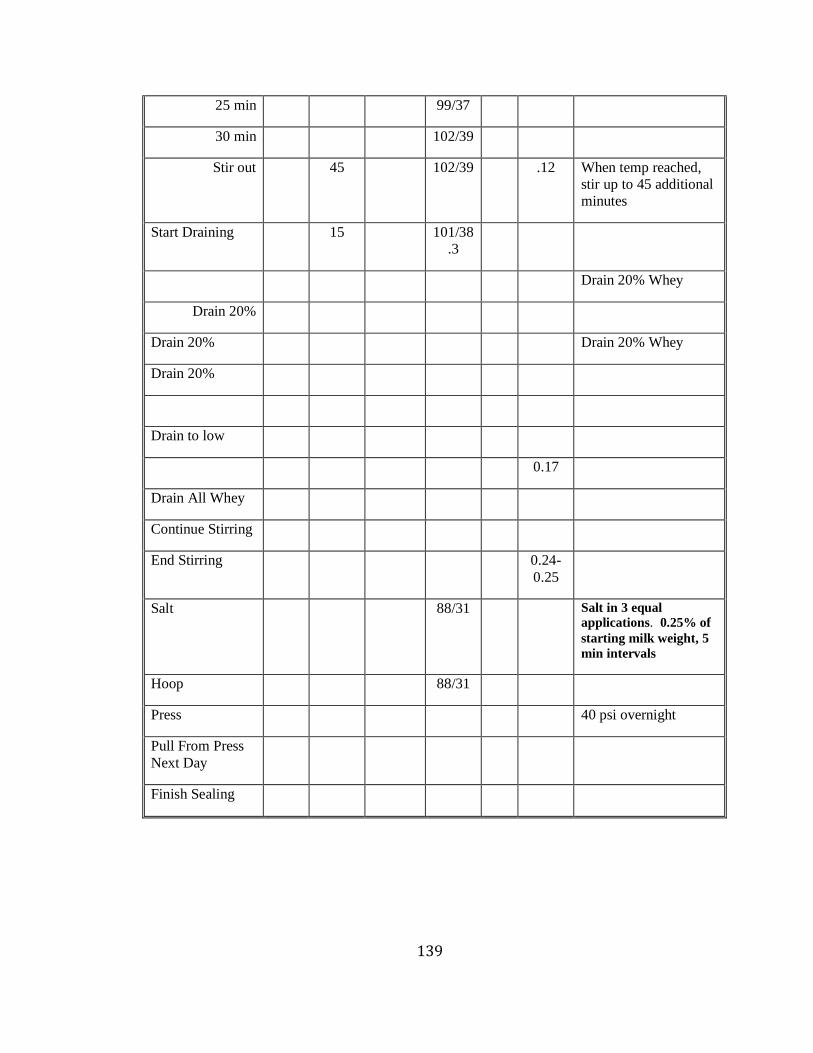
139
25 min 99/37
30 min 102/39
Stir out 45 102/39 .12 When temp reached,
stir up to 45 additional
minutes
Start Draining 15 101/38
.3
Drain 20% Whey
Drain 20%
Drain 20% Drain 20% Whey
Drain 20%
Drain to low
0.17
Drain All Whey
Continue Stirring
End Stirring 0.24-
0.25
Salt 88/31 Salt in 3 equal
applications. 0.25% of
starting milk weight, 5
min intervals
Hoop 88/31
Press 40 psi overnight
Pull From Press
Next Day
Finish Sealing
140
7.2.2. Babcock Method
Objective: The objective is to determine the fat content of milk and cream for
use in experiments and cheese making procedures. This method is also used in
determination of cheese fat content.
Materials and Equipment:
Babcock bottles
Sulfuric Acid
50mL beaker
Shaker
Centrifuge
Metal bottle holder
Duct tape
Pyrex pan
Balance
Plastic Pipet
Water bottle
Deionized water
Water bath
Sample rack
Milk or Cream
10mL graduated glass pipet
Pipet bulb
Safety equipment: lab coat, acid-resistant gloves, eyewear
Rubber stoppers
Caliper with light
Procedure:
1. Turn on the water bath to 55-60ºC. Place water bottle in water to warm.
2. Assemble shaker by placing metal bottle holder into a pyrex pan. Attach
the pyrex pan to the shaker with duct tape, ensuring it is secure.
3. Measure 9g of cream (or finely shredded cheese) into each Babcock
bottle. Add 9mL of deionized water using the graduated glass pipet.
Stopper the bottles and mix by swirling gently.
4. Dispense approximately 17mL of sulfuric acid into a small beaker. The
17mL does not need to be exact but enough acid needs to be present to
digest the sample. This step should take place over an acid spill container.

141
5. In three equal portions, transfer the 17 mL of sulfuric acid by pouring
quickly but carefully into the Babcock bottle. Hold the bottle by the neck as
the base will become hot.
6. Place the bottles on the shaker, making sure they are secure. Shake for 5
minutes at high speed.
7. Place the bottles, balanced, in the centrifuge. The centrifuge has one
speed. Turn it on, allow it to reach full speed, and let it run for five minutes.
Open the centrifuge door slowly, and add the warm deionized water to
each bottle until the liquid reaches the base of the bottle neck. Place the
samples back in the centrifuge and run for 2 minutes. Again, remove the
samples and add the warm water until the liquid reaches the readable
range of the neck. Place the bottle back in the centrifuge for 1 minute.
8. Place the samples in the water bath set at 55-60ºC. Make sure the fat
level in the neck of the bottle is completely immersed in the warm water.
Allow the samples to warm for a minimum of five minutes.
9. Read the fat level using the calipers and light. Set the lowest caliper and
the lower fat line and the highest caliper and the highest fat line. Move
both calipers together until the lowest caliper is aligned with 0 on the neck.
The highest caliper, then, is reading the percent fat in the sample.
7.2.3. TPA Method
Objective: The purpose was to measure texture using the texture analyzer. Results were reported has values of hardness, cohesion, and others.
Materials and Equipment:
TA XT Plus Texture Analyzer
Lower plate and upper geometry
Screwdriver and allen wrench (if changing equipment is needed)
Kim wipes
Di water
Double blade cheese slicer
Plastic bags
142
Light mineral oil
Plastic pipet
Procedure:
1. Prepare samples at least 5 hours in advance. Use a number 12 cork borer
to obtain three samples of each cheese. Place cheese samples in a
sealed plastic bag and allow the samples to equilibrate to the room
temperature that they will be tested in.
2. Turn on the TA XT Plus Texture Analyzer. Attach the lower plate and
upper geometry, a 25mm diameter and 35mm tall acrylic probe. Calibrate
the instrument.
3. Use the software to load the desired project and macro. The analysis run
is a two-bite compression test. Sample will be compressed by 48% of the
original sample height at a rate of 2mm per second. The compression is
removed and after a six second resting period, the sample is compressed
by 75% of the original sample height. Enter sample information.
4. Using the parallel-wire cheese slicer, cut a slice of one sample 25mm in
length. Be sure to avoid the edges of the cheese as they will affect results.
5. Using a plastic pipet, place a small drop of mineral oil on the lower plate of
the instrument. Place another small drop of mineral oil on the top of the
cheese sample and spread to the edges. Center the cheese sample on
the lower plate, beneath the upper geometry.
6. Allow the sample to run. When testing is completed, discard the cheese
sample. Clean the surfaces of the instrument with kim wipes before
proceeding to the next sample.
7.2.4. Moisture Analysis Method
Objective: The purpose of this test is to determine moisture content in cheese. It
has been adapted from Moisture Method 15.111 in the Standard Methods for the
Examination of Dairy Products by H. Wehr.
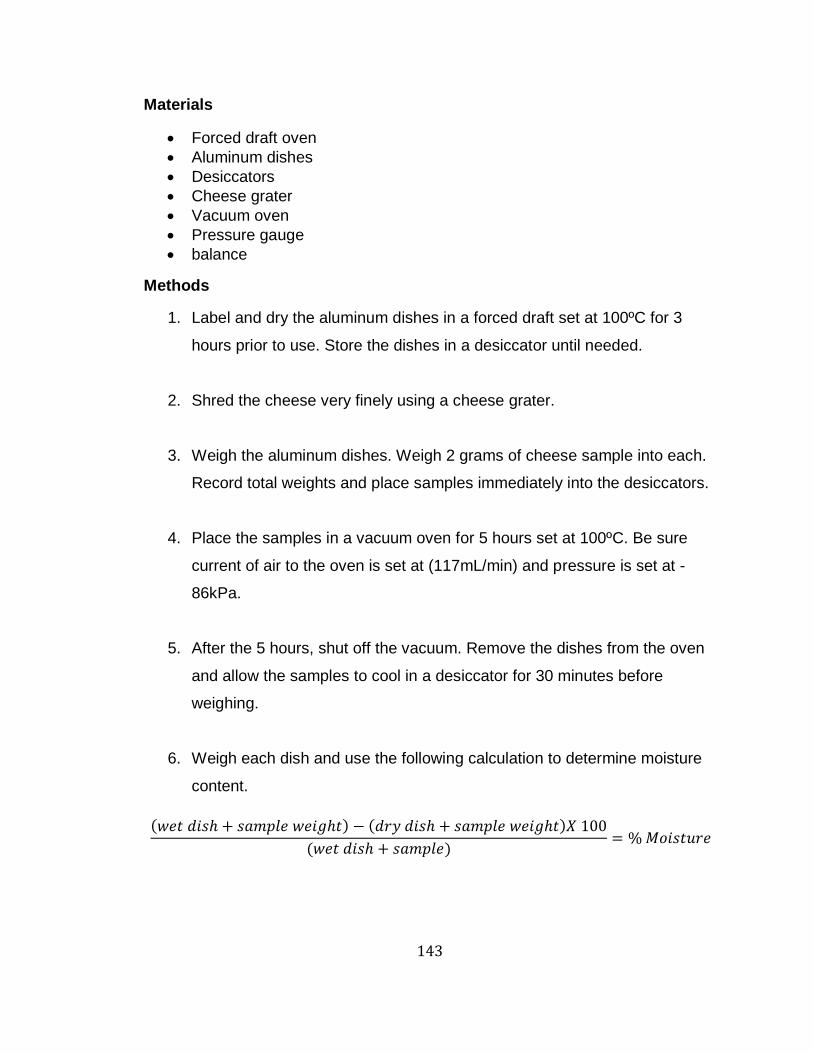
143
Materials
Forced draft oven
Aluminum dishes
Desiccators
Cheese grater
Vacuum oven
Pressure gauge
balance
Methods
1. Label and dry the aluminum dishes in a forced draft set at 100ºC for 3
hours prior to use. Store the dishes in a desiccator until needed.
2. Shred the cheese very finely using a cheese grater.
3. Weigh the aluminum dishes. Weigh 2 grams of cheese sample into each.
Record total weights and place samples immediately into the desiccators.
4. Place the samples in a vacuum oven for 5 hours set at 100ºC. Be sure
current of air to the oven is set at (117mL/min) and pressure is set at -
86kPa.
5. After the 5 hours, shut off the vacuum. Remove the dishes from the oven
and allow the samples to cool in a desiccator for 30 minutes before
weighing.
6. Weigh each dish and use the following calculation to determine moisture
content.

144
7.2.5. Proteolysis Method
Objective: Determine the level of proteolysis by examining the water-soluble
nitrogen of the sample.
Materials
Cheese grater
IKA Ultra Turrax Tube Drive
Ultra Turrax sample cups
Balance
Deionized water
50mL centrifuge tubes
Centrifuge
Whatman No. 1 Filter
Vacuum
Filter flasks
Procedure
1. Grate cheese.
2. Weight 15g of sample into a Ultra Turrax sample cup. Add 30g of deionized
water.
3. Cap the sample cup. Grind the sample for two minutes at a setting of 6.
4. Weigh 40g of the mixture into a labeled 50mL centrifuge tube.
5. Place samples in a 40ºC water bath for one hour.
6. Centrifuge the samples at 4,750rpm for 30 minutes.
7. Filter the supernatant through a no. 1 whatman filter. Determine the weight of
the extract and record.
8. Store extract in a -20ºC freezer until Dumas nitrogen analysis can be
performed. Samples should be performed in triplicate.
7.2.6. Protein Method
Objective: Determine protein content of the cheese using a Dumas combustion
method.
Materials

145
Buchi Dumaster D-480
Foil
Balance
Cheese grater
Tweezers
L-aspartic acid
Procedure
1. Grate cheese samples using the cheese grater.
2. Confirm the CO2 and O2 gas tanks are on. Wake up Buchi DuMaster. Perform
calibration by first running three blanks of foil using the Blank With O2 method.
Run three 200mg standards of L-aspartic acid using method 250mg Standard.
3. Weigh 250mg of sample into foil. Fold foil and make a capsule. Record and
label the sample in the software. Set the method to 500mg Fat/Cheese/Sausage.
4. For cheese, set the protein factor to 6.38. Perform samples in triplicate and
record results.
7.2.7. Ashing Method
Objective: Determine total ash of cheese samples.
Materials
Desiccator
Ashing crucibles
Muffle furnace
Tongs
Cheese grater
Bunsen burner
Crucible stand
Balance
Procedure
1. Before using the crucibles, clearly label the underside with a number or letter
using a heat resistant marker. Place the crucibles in a muffle furnace and heat to
500ºC overnight.
2. Once the oven and crucibles have cooled, place the crucibles in a desiccators
until ready for use.
146
3. Grate the cheese samples. Record the weight of the empty crucible and then
weigh 2-3 of grated cheese into each.
4. Set up the Bunsen burner in a hood. Place the burner underneath a crucible
stand or hold the crucible over the Bunsen burner with tongs. Burn the cheese
sample in the crucible until the sample is black.
5. Once all samples have been burned, place the samples in the muffle furnace
set at 500ºC overnight.
6. Turn off the muffle furnace and allow it to cool. Place samples in a desiccator
until sample has cooled enough to weigh. Record the weight of each sample and
determine the total ash.
7.2.8. Cheese pH Testing Method
Objective: The purpose was to measure pH of cheese samples.
Materials and Equipment:
Cheese grater
5mL plastic flask
Spatula
Plastic pipet
Di water
pH probe
Procedure:
7. Prepare cheese samples by grating into fine shreds with a cheese grater.
Fill the 5mL plastic flask with shredded cheese, packed tightly. Add
approximately 15 drops of di water using a plastic pipet. Use the spatula to
carefully mix the cheese until it is a paste.
8. Calibrate the pH probe (Fisher Scientific Accumet Basic AB15 pH meter).
Use the pH probe to test the pH of the cheese paste in the 5mL plastic
flask. Record results.
7.2.9. Cheese Rheology Method

147
Objective: The purpose of this test is to determine textural characteristics of
cheese using rheology. The AR-G2 was used as four tests performed: Stress
Sweep, Frequency Sweep, Creep, and Recovery.
Materials:
TA AR-G2 Rheometer
Plastic bags
Plastic pipet
Dimethylpolysiloxane (coating oil)
Calipers
Acetone
Textured tape
25 mm plate (plain)
25 mm plate (textured)
Brush
Super glue
Scissors
Kim wipes
Razor blades
Cooler and ice
Procedure:
1. Begin with sample preparation. Store cheeses in a cooler until use. One
hour prior to testing, cut a square of cheese to be tested. Using the razor
blade, cut the cheese to the shape of the 25 mm plates. Using the calipers
to measure 1mm, carefully cut a slice of the cheese. Store the 1mm
cheese slice in a labeled plastic bag for one hour to allow it to equilibrate
to room temperature.
2. Attach the upper and low geometries to the AR-G2. Screw the 25mm
plates into place, using the textured plate in the upper geometry. For the
lower geometry, prepare the 25mm plate prior to attachment. To do this,
spread a small amount of super glue on the surface of the plate using a
brush. Attach a small square of texture tape to the plate. Once dry, cut the
edges to fit the plate.
3. Load the TA Software. Under geometry, select the 25mm aluminum
148
plates. Under oscillation procedure, select two tests: Stress Sweep Test
and Frequency Sweep Test.
a. Parameters for the stress sweep test: This test is used to determine
the linear viscoelastic region. For low fat cheese, the range tested
was an oscillatory stress of 1.0 to 4,000 Pa at a room temperature.
The frequency was set to 0.5Hz. Full fat cheese could be tested at
such a high oscillatory stress because damage to the sample could
occur and have an effect on future testing. For full fat, the
oscillatory stress was tested between 1.0 and 300 Pa. Other
parameters remained the same.
b. Parameters for the frequency sweep test: The frequency sweep
test tested a frequency between 0.01 to 20 Hz at 10 points per
decade. The test was performed at room temperature. The
controlled variable of oscillatory stress was based on the linear
viscoelastic region determined in the stress sweep test. For low fat
cheese, this oscillatory stress was 100.0 Pa. For full fat cheese, this
oscillatory stress is 10.0.
4. Calibrate the instrument. Perform rotational mapping, zero gap, and
calibration of the geometry.
5. Place a cheese sample onto the lower plate, centering the sample.
Adjusting the instrument head height to 1000mm. Once the head has
finished moved, using a plastic pipet to place a small coating of the
Dimethylpolysiloxane oil around the exposed cheese slice to prevent
drying during testing. Zero the normal force and allow the normal force to
equilibrate before beginning the testing.
6. When these first two tests have been completed, remove the lower plate.
Clean the plate using acetone to remove any cheese and tape residue.
Use super glue to attach a new piece of textured tape. Recalibrate the
zero point. Place a new 1mm thick cheese sample onto the plates.
7. Set up the final test, a creep and recovery test. First, the instrument is

149
moved to the sample height of 1000 microns. This test begins with a
conditioning step in which the sample is held in this position for 5 minutes
before testing begins. The creep test is performed at room temperature
with a shear stress of 10.00 Pa. The test is allowed to run for 2 minutes. At
2 minutes, the recovery period begins. This step is also performed at room
temperature. The shear stress is removed (set at 0Pa) and the test is
allowed to run for 2 minutes.
8. When testing has finished, the sample is removed. The lower plate is
again cleaned with acetone and the instrument is calibrated before
duplicate samples are run. Samples should be performed in triplicate.
7.2.10. Microscopy Method
Objective: The purpose of this test is to use a confocal microscope to take images of cheese, identifying regions of protein and fat.
Materials:
Nikon AZ100 C1si Confocal Macroscope
Nile Red stain
Fast Green stain
Phosphate Buffer Saline (pH 7.2)
Di water
Methanol
Acetic Acid
Razor blade
Sample tray
Micropipette
Procedure: 1. Prepare stains. Nile Red is prepared by mixing 25mg Nile Red stain with
25mL methanol. Fast Green is prepared by 400mg Fast Green with 40mL di water.
2. Cheese samples should be kept cold until cut. Using the razor blade, slice a 1cm X 1cm X 1mm sample of cheese. Place the cheese samples each into a well of the sample tray.
3. To each sample, add a mixture of 10µl acetic acid, 10 µl prepared Fast Green stain, and 980 µl phosphate buffer saline (PBS). Gently rock samples for 15 minutes in refrigerated conditions.
4. Remove and discard stain. Wash each sample twice with 900 µl PBS. Remove PBS.

150
5. To each sample, add 100 µl prepared Nile Red stain and 900 µl PBS. Gently rock samples for 15 minutes in refrigerated conditions.
6. Wash each sample with 900 µl PBS twice. Remove and discard PBS. 7. Observe cheese samples on the Nikon AZ100 C1si confocal macroscope
at a 4X objective and 5X zoom. 8. The microscope should be in spectral mode with a BS 20/80 PMT filter.
Use samples of cheese that have been stained with Nile Red or Fast Green only to identify the stains and remove background. After this initial set-up, this does not need to be repeated. Nile Red is detected with a 561 nm excitation and Fast Green is detected at a 488 nm excitation.
9. Once a section is in focus, perform a z-series, identifying the top and bottom of a sample and allowing the microscope to take up to 15 images to create a complete image.
10. Use spectral unmixing to unmix the Nile Red and Fast Green signals. Combine signals to view fat (red) and protein (green).
11. Wrap samples in foil and refrigerate if future sampling is needed.
7.2.10. Statistics Code
The following code is used for R Studio in analyzing fat content of cheese within the same month. Underlined portions indicate areas that need to be adjusted depending on the data analyzed. Data needs to be set up in an excel document with four headings: Cheese, Cheese Rep, Fat Rep, and Fat. If another type of cheese composition is being tested, replace Fat Rep and Fat with the new composition name.
getwd()
setwd("C:/Users/Molly/Desktop")
library(lmerTest)
library(multcomp)
fattest<-read.csv("Fat Test.csv")
fattest$Cheese.Rep<-factor(fattest$Cheese.Rep)
fattest$Fat.Rep<-factor(fattest$Fat.Rep)
summary(fattest)
summary(cheesemodel<-lmer((Fat)~Cheese+(1|Cheese.Rep),data=fattest))
anova(cheesemodel)

151
qqnorm(resid(cheesemodel),main="Random Error Normality")
qqline(resid(cheesemodel),col=2)
qqnorm(ranef(cheesemodel)$Cheese.Rep$"(Intercept)",main="Random Intercept Normality")
qqline(ranef(cheesemodel)$Cheese.Rep$"(Intercept)",col=2)
summary(glht(cheesemodel,mcp(Cheese='Tukey')))
library(ggplot2)
ggplot(fattest,aes(Cheese, Fat.Rep))+geom_boxplot()+theme_bw()
The following is code used in analyzing Springiness in cheese and comparing data from month 1 and month 2. Underlined portions indicate areas that need to be adjusted depending on the data analyzed. Data needs to be set up in an excel document with five headings: Cheese, Cheese Rep, Springiness, Rep (of springiness testing), and Month. If another type of cheese composition is being tested, replace Springiness, and Rep.
getwd()
setwd("C:/Users/Molly/Desktop")
library(lmerTest)
library(multcomp)
fattest<-read.csv("TPA Springiness.csv")
fattest$Cheese.Rep<-factor(fattest$Cheese.Rep)
fattest$Month<-factor(fattest$Month)
fattest$Rep<-factor(fattest$Rep)
summary(fattest)
summary(springinessmodel<-lmer(log(Springiness)~Cheese*Month+(1|Cheese.Rep),data=fattest))
anova(springinessmodel)

152
qqnorm(resid(springinessmodel),main="Random Error Normality")
qqline(resid(springinessmodel),col=2)
qqnorm(ranef(springinessmodel)$Cheese.Rep$"(Intercept)",main="Random Intercept Normality")
qqline(ranef(springinessmodel)$Cheese.Rep$"(Intercept)",col=2)
summary(glht(springinessmodel, linfct=mcp(Cheese="Tukey",interaction_average=TRUE))) library(ggplot2)
ggplot(fattest,aes(Cheese, Springiness))+geom_boxplot()+theme_bw() ggplot(fattest,aes(Month, Springiness))+geom_boxplot()+theme_bw() ggplot(fattest,aes(Month:Cheese,Springiness))+geom_boxplot()+theme_bw()
Related Documents