doi:10.1152/japplphysiol.01439.2010 111:1597-1605, 2011. First published 25 August 2011; J Appl Physiol Paoli, S. Pogliaghi, G. Fanò, C. Reggiani and C. Capelli C. Doria, L. Toniolo, V. Verratti, P. Cancellara, T. Pietrangelo, V. Marconi, A. fiber type in high-altitude trekkers uptake kinetics and shift in muscle 2 Improved V?O You might find this additional info useful... 41 articles, 16 of which can be accessed free at: This article cites http://jap.physiology.org/content/111/6/1597.full.html#ref-list-1 including high resolution figures, can be found at: Updated information and services http://jap.physiology.org/content/111/6/1597.full.html can be found at: Journal of Applied Physiology about Additional material and information http://www.the-aps.org/publications/jappl This infomation is current as of January 9, 2012. ISSN: 0363-6143, ESSN: 1522-1563. Visit our website at http://www.the-aps.org/. Physiological Society, 9650 Rockville Pike, Bethesda MD 20814-3991. Copyright © 2011 by the American Physiological Society. those papers emphasizing adaptive and integrative mechanisms. It is published 12 times a year (monthly) by the American publishes original papers that deal with diverse areas of research in applied physiology, especially Journal of Applied Physiology on January 9, 2012 jap.physiology.org Downloaded from

Welcome message from author
This document is posted to help you gain knowledge. Please leave a comment to let me know what you think about it! Share it to your friends and learn new things together.
Transcript

doi:10.1152/japplphysiol.01439.2010 111:1597-1605, 2011. First published 25 August 2011;J Appl Physiol
Paoli, S. Pogliaghi, G. Fanò, C. Reggiani and C. CapelliC. Doria, L. Toniolo, V. Verratti, P. Cancellara, T. Pietrangelo, V. Marconi, A.fiber type in high-altitude trekkers
uptake kinetics and shift in muscle2Improved V?O
You might find this additional info useful...
41 articles, 16 of which can be accessed free at:This article cites http://jap.physiology.org/content/111/6/1597.full.html#ref-list-1
including high resolution figures, can be found at:Updated information and services http://jap.physiology.org/content/111/6/1597.full.html
can be found at:Journal of Applied Physiologyabout Additional material and information http://www.the-aps.org/publications/jappl
This infomation is current as of January 9, 2012.
ISSN: 0363-6143, ESSN: 1522-1563. Visit our website at http://www.the-aps.org/.Physiological Society, 9650 Rockville Pike, Bethesda MD 20814-3991. Copyright © 2011 by the American Physiological Society.those papers emphasizing adaptive and integrative mechanisms. It is published 12 times a year (monthly) by the American
publishes original papers that deal with diverse areas of research in applied physiology, especiallyJournal of Applied Physiology
on January 9, 2012jap.physiology.org
Dow
nloaded from

Improved VO2 uptake kinetics and shift in muscle fiber type in high-altitudetrekkers
C. Doria,3 L. Toniolo,1 V. Verratti,3 P. Cancellara,1 T. Pietrangelo,3 V. Marconi,2 A. Paoli,1 S. Pogliaghi,2
G. Fanò,3 C. Reggiani,1,4 and C. Capelli2,5
1Department of Anatomy and Physiology, University of Padova; 2School of Exercise and Sport Sciences, University ofVerona; 3Department of Neurosciences and Imaging, University of Chieti-Pescara, Chieti; 4CNR, Institute of Neuroscience,Padova; and 5CeRiSM, Rovereto, Trento, Italy
Submitted 13 December 2010; accepted in final form 23 August 2011
Doria C, Toniolo L, Verratti V, Cancellara P, Pietrangelo T,Marconi V, Paoli A, Pogliaghi S, Fanò G, Reggiani C, Capelli C.Improved VO2 uptake kinetics and shift in muscle fiber type inhigh-altitude trekkers. J Appl Physiol 111: 1597–1605, 2011. Firstpublished August 25, 2011; doi:10.1152/japplphysiol.01439.2010.—The study investigated the effect of prolonged hypoxia on central [i.e.,cardiovascular oxygen delivery (QaO2)] and peripheral (i.e., O2 utili-zation) determinants of oxidative metabolism response during exer-cise in humans. To this aim, seven male mountaineers were examinedbefore and immediately after the Himalayan Expedition Interamnia8000–Manaslu 2008, lasting 43 days, among which, 23 days wereabove 5,000 m. The subjects showed a decrease in body weight (P �0.05) and of power output during a Wingate Anaerobic test (P � 0.05)and an increase of thigh cross-sectional area (P � 0.05). Absolutemaximal O2 uptake (VO2max) did not change. The mean response timeof VO2 kinetics at the onset of step submaximal cycling exercise wasreduced significantly from 53.8 s � 10.9 to 39.8 s � 10.9 (P � 0.05),whereas that of QaO2 was not. Analysis of single fibers dissected fromvastus lateralis biopsies revealed that the expression of slow isoforms ofboth heavy and light myosin subunits increased, whereas that of fastisoforms decreased. Unloaded shortening velocity of fibers was de-creased significantly. In summary, independent findings converge inindicating that adaptation to chronic hypoxia brings about a fast-to-slowtransition of muscle fibers, resulting in a faster activation of the mito-chondrial oxidative metabolism. These results indicate that a prolongedand active sojourn in hypoxia may induce muscular ultrastructural andfunctional changes similar to those observed after aerobic training.
hypobaric hypoxia; oxygen consumption kinetics; single fiber me-chanics
ADAPTATION TO LONG-TERM HYPOXIA entails several modifications,occurring at each step of the aerobic pathway, which affectoxygen (O2) transport and utilization. For instance, at high alti-tude, the ability of the cardiovascular system to carry O2 from thelungs to the muscles is improved by the increase of red blood cellmass brought about by the activation of the hypoxia-induciblefactor–erythropoietin signaling pathways (12). It has been shown,however, that the positive effects of such improvement may becounteracted or blunted by the concomitant impairment in severalmuscular functions (11, 21).
Indeed, skeletal muscles change their structural and functionalproperties during exposure to hypobaric hypoxia, lasting �4–8wk. At moderate altitude [4,000–5,000 m above sea level (asl)],the peripheral adaptations occurring at muscular level seem to
mimic those observed after endurance training (44), and theaddition of physical exercise to the hypoxic environment can beexploited to further improve aerobic performance (43). At alti-tudes above 6,000 m, however, a decrease of the activity of theoxidative enzymes and an increase of the activity of those impliedin glycolysis have been described (22). In addition, muscle fiberatrophy occurs, mitochondrial mass is reduced (17, 28), and themuscles undergo biochemical and structural modifications remi-niscent of those observed in ageing (11). Such alterations can givea substantial contribution to the reduction of the aerobic perfor-mance that has been observed during and after a prolonged stay athigh altitude (10).
Muscular O2 utilization rate during moderate intensity ex-ercise (i.e., exercise performed below the intensity correspond-ing to the anaerobic threshold) is mainly controlled by periph-eral cellular mechanisms rather than by bulk O2 delivery to themuscles (7, 18). Therefore, the study of the dynamic responseof oxidative metabolism at the onset of exercise may provideinsightful information about the adaptation of the skeletalmuscles occurring during hypobaric hypoxia.
The effects of prolonged sojourn at high altitude on pulmo-nary O2 uptake (VO2) kinetics and O2 deficit (DefO2; i.e., thedifference between the volume of O2, which would have beenconsumed if a steady-state had been attained immediately atthe beginning of the exercise, minus the O2 volume taken upduring the exercise) have been investigated only once (6). Thequoted study documented a larger DefO2 and a slower VO2
kinetics after a 6-wk permanence at 5,200 m asl.In summary, hypoxia may produce positive and negative
effects on skeletal muscles and on O2 transport in blood—thetrade-off between these contrasting effects still being unclear.To clarify the issue, it is necessary to investigate simultane-ously the metabolic and respiratory responses to exercise andthe functional and structural muscular changes in subjectsexposed to a hypoxic environment for a long period.
On this ground, we sought to investigate the effect of aprolonged stay in high altitude on the dynamic response of theoxidative metabolism to the sudden imposition of exercise andto infer about the relative role of central (i.e., O2 delivery) orperipheral (i.e., O2 utilization) adaptations.
METHODS
Subjects
Seven sedentary, amateur male climbers (age 39.4 � 14.9; height1.72 m � 0.09) of the mountaineer club “Interamnia 8000” partici-pating in the expedition aimed to climb Mount Manaslu in theHimalaya range and volunteered to serve as subjects after beinginformed about the nature of the study. None of them suffered from
* C. Doria and L. Toniolo contributed equally to this work.Address for reprint requests and other correspondence: C. Capelli, School of
Exercise and Sport Sciences, Univ. of Verona, Via Felice Casorati, 43, 37131Verona, Italy (e-mail: [email protected]).
J Appl Physiol 111: 1597–1605, 2011.First published August 25, 2011; doi:10.1152/japplphysiol.01439.2010.
8750-7587/11 Copyright © 2011 the American Physiological Societyhttp://www.jap.org 1597
on January 9, 2012jap.physiology.org
Dow
nloaded from

cardiovascular or respiratory problems or metabolic or skeletal musclediseases.
Experimental Design
The study included functional assessments, blood sampling, andmuscular biopsies. All procedures were performed with the approvalof the Ethics Committee of the Universities of Chieti-Pescara (Chieti,Italy) and Verona (Italy) and of CeRiSM (Rovereto, Italy) and wereconducted in accordance with the 1964 Declaration of Helsinki. Allindividuals provided written, informed consent before participating inthe study.
All assessments included in the experimental protocol were carriedout before and after (2–5 days upon return to Kathmandu) theexpedition at the laboratory of CeRiSM (Rovereto, Italy; 204 m asl)and at the Exercise Physiology Laboratory, Department of Neurosci-ences and Imaging, University of Chieti-Pescara (110 m asl), instrictly controlled environmental conditions (22–25°C, 55–65% rela-tive humidity).
During the experimental sessions, anthropometric parameters,maximal voluntary contraction (MVC) of the leg extensors, maximalanaerobic power and plasma lactate concentration ([La]b) in a Win-gate Anaerobic test (WAnT) and VO2 during submaximal and max-imal ergometric tests were measured, and blood and muscle sampleswere collected.
Expedition Profile
The expedition lasted 43 days (from September 8th to October20th). After the flight from Rome to Kathmandu (1,300 m), the sevenmountaineers reached Manaslu base camp at 5,000 m after 13 days ofan acclimatization trek. All of the climbers spent 23 days at highaltitude, and during this period, they moved to camp 1 (5,900 m) andto camp 2 (6,400 m) without O2 supplementation. Due to adverseweather conditions, the summit was not reached. The climbers re-turned to Kathmandu with a trek of 7 days and flew back to Italy onOctober 20th. The total distance covered walking was �450 km.
During the expedition, efforts were made to provide enough food tocover both the energy and the nutritional requirements of participants;yet, subjects were not following a specific or individualized dietaryregimen.
Anthropometric Evaluation, Muscle Cross-Sectional Area, MusclePower, and Strength
Body mass index, body fat, and quadriceps area. Body mass andstature were measured on the first testing day of each testing sessionbefore the incremental test (analogical scale 761 and portable stadi-ometer 214, Seca, Hamburg, Germany). Concurrently, subcutaneousskinfold thickness was measured sequentially, using a pincer-typecaliber at six sites (biceps brachii, subscapular, iliac, thigh, and tricepssurae; skinfold caliber, Holtain, Crymych, UK) for percent body fatand lean body mass calculations (15). Thigh circumference wasmeasured by inextensible anthropometric tape at one-third of thetrocanter-patella distance above the patella. Based on the thigh cir-cumference and skinfold thickness, the muscle cross-sectional area(CSA) was calculated (1).
Isometric strength measurement. Bilateral isometric strength of theknee extensor muscles was measured during MVCs using a legextension machine [Panatta Sport, Apiro (MC), Italy] equipped with aload cell [Globus Italia, Codognè (TV), Italy], which was calibratedbefore each experiment. Subjects were seated with the trunk thighangle at 90° and the knee joint angle also at 90°. Subjects performedmaximal voluntary isometric contractions of the knee extensors threetimes. Isometric contractions lasted for 5 s and were separated by2-min rest intervals. The highest value of torque attained was taken asthe MVC strength.
WAnT. WAnT was used to assess the maximal power (MP) on amechanically braked cycle ergometer (Ergomedic 894E, Monark
Exercise AB, Varberg, Sweden). The mechanical resistance (in kg),set equal to 7.5% of body mass, was applied after an unloadedacceleration phase, which lasted �3 s and was preceded by a stan-dardized warm-up of 5 min. The subjects were instructed to pedal asfast as possible, and they were verbally encouraged to maintain thehighest possible pedaling rate throughout the test (30 s). After the test,subjects recovered sitting on the saddle of the cycle ergometer for 10min. During the test, the following parameters were evaluated: 1) MP,i.e., the highest mechanical power observed as a mean of 5-s epochs;2) average power (AP), corresponding to the mean power outputmaintained during the 30-s test (14). Before and every 2 min until the10th min of recovery, the blood [La]b (mM) was determined using aportable blood lactate analyzer (Lactate Pro LT-1710, Arkray, Kyoto,Japan). Peak [La]b was selected as the highest value of [La]b measuredin the recovery phase after the WAnT.
Maximal VO2 and Response to Submaximal Exercise
Maximal VO2 (VO2max), ventilatory threshold (VT), and the re-sponse to submaximal exercise were evaluated in 2 subsequent days,both before and after the expedition. On the 1st day, the subjectsperformed a maximal incremental ramp test consisting of 3 min at restand 5 min of priming exercise at 50 W, followed by a continuousincrease in the workload by 20 W/min until exhaustion. The acceptedcriteria for maximal effort were: respiratory exchange ratio � 1.1, andheart rate � 90% of the predicted maximum based on age. On the nextday, each subject performed two square-wave transitions. After 3 minat rest, the cardiac output (Q) was measured by means of an inert gasrebreathing procedure. Then, after 3 min of exercise at 30 W, theworkload was increased immediately to 100 W and for 7 min (i.e., a70-W step transition was applied). The procedure was repeated after10 min of recovery. [La]b was measured from capillary blood samplesat rest, at the end of the priming phase, at the 3rd min of exercise at100 W, and at the 1st, 3rd, and 5th min of recovery. Hemoglobinconcentration ([Hb]; g 100 ml�1) was assessed from arterializedcapillary blood samples taken from the ear lobe at rest and at the endof the exercise.
All tests were performed on an electromechanically braked cycleergometer (Excalibur Sport, Lode, The Netherlands), operated by apersonal computer, connected to a metabolic cart. The system allowedinstantaneous step changes to predefined workloads. Breath-by-breath(B-by-B) VO2 and carbon dioxide output (VCO2) were measuredcontinuously at the mouth (Quark b2, Cosmed, Rome, Italy). Analyz-ers and respiratory flow transducer were calibrated following themanufacturer’s instructions before each experimental run.
The left arm of the subjects was bent and suspended at the level ofthe xiphoid with a sling, while an arterial pressure profile wasrecorded continuously at a fingertip by using a noninvasive photople-thysmographic method (Portapres, Finapres Medical Systems, Amster-dam, The Netherlands). Pressure values were corrected for the heightdifference between the heart and the fingertip.
Q at rest was measured by means of an inert gas rebreathingmethod (41) (Innocor, Innovision, Odense, Denmark).
[La]b was assessed by means of an electroenzymatic method(Biosen C_line, EKF Diagnostic, Barleben, Germany) on 10 �l bloodsamples from an earlobe; [Hb] was measured by a photometrictechnique (HemoCue, Angelholm, Sweden) on 10 �l blood samplesobtained from an earlobe; and percent saturation of O2 in hemoglobin(SaO2) was measured by infrared oximetry (Siemens MICRO2, Dan-vers, MA).
To determine VT, the VO2 and VCO2 B-by-B values measuredduring the incremental test were smoothed preliminarily by applyinga three-sample moving average. The VT was then estimated individ-ually, according to Beaver et al. (2). VO2max was calculated as theaverage of the VO2 values measured in the last 30 s before the end ofthe exercise.
1598 MUSCULAR AEROBIC METABOLISM AND ADAPTATION TO HYPOXIA
J Appl Physiol • VOL 111 • DECEMBER 2011 • www.jap.org
on January 9, 2012jap.physiology.org
Dow
nloaded from

Stroke volume was determined on a beat-by-beat basis by means ofthe Modelflow method (38), applied offline to the pulse-pressureprofiles obtained from Portapres by using the BeatScope softwarepackage. As the aortic compliance used by Modelflow may substan-tially differ from that of a given individual, Modelflow data need to becorrected with an independent measure of Q. To this aim, an individ-ual correction factor was calculated as the ratio of inert gas rebreath-ing Q to the corresponding Modelflow data (38). Beat-by beat car-diovascular O2 delivery (QaO2) was finally calculated as
QaO2 � Q · SaO2 · [Hb] · � (1)
where constant � is the physiological O2 binding coefficient ofhemoglobin (1.34 ml g�1).
For the analysis of square-wave exercises, only the first 6 min ofeach repetition were considered. B-by-B VO2 values were interpo-lated to 1-s intervals (26), time aligned with the onset of exercisetransition, and treated by subtracting the VO2 steady-state (VO2ss)value at 30 W. Then, the data from the two repetitions were combinedin 5-s averages to obtain a single data file for each subject andcondition. DefO2 was calculated as the difference between the O2,which would have been consumed if VO2ss had been attained imme-diately at the beginning of the exercise and the O2 volume actuallytaken up during the exercise. The first quantity was calculated bymultiplying VO2ss in ml O2 s�1 by the duration of the exercise setequal to 360 s. The O2 volume consumed during exercise wascalculated by summing progressively the VO2 values expressed in mlO2 s�1 from the onset of exercise to 360 s. Mean response time(MRT) of VO2 kinetics was finally calculated from the ratio of DefO2
to the corresponding O2 uptake above that of the free wheeling (8).Also beat-by-beat QaO2 values of the two experimental series were
interpolated to 1-s intervals and aligned with the onset of exercise.They were then treated by subtracting from them the QaO2 steady-state value at 30 W. Finally, the two series of data were overlappedand averaged (5 s) to obtain a single data file for each subject andcondition. The kinetics of the net increment of QaO2(t) at the onset ofthe exercise was described by means of a biexponential model (25)
QaO2�t� � �A1�1 � e�t�TD1�⁄�1�� � �A2�1 � e�t�TD2�⁄�2�� (2)
where A1 and A2, �1 and �2, and TD1 and TD2 are the amplitudes, thetime constants, and the time delays of the first and second component,respectively.
The parameters of the model were estimated by means of aweighted nonlinear least-squares procedure (9), implemented in Lab-VIEW 7.0 (National Instruments, Austin, TX). Initial guesses of theparameters of the model were entered after visual inspection of thedata. Finally, the MRT of the QaO2 response to step exercise wascalculated as
MRT � �A1 ⁄ �A1 � A2���TD1 � �1�� �A2 ⁄ �A1 � A2���TD2 � �2�
(3)
Muscle Biopsies
Muscle biopsies were taken using a semiautomatic needle (Precisa13 gauge, Hospital Service, Rome, Italy) from the vastus lateralismuscle at one-third of the distance between the patella upper marginand the trochanter major after local anesthesia with Lidocaine (0.5%,w/v). In each subject, several samples were collected from the sameneedle insertion. Each sample (approximate weight 4 mg, correspond-ing to a cylinder of 0.7-mm diameter and 8-mm length) was immersedin skinning solution mixed with glycerol (50% v/v) and stored at�20° until used (30).
Single Muscle Fiber Mechanics
Muscle samples, collected during biopsy and stored at �20°C, asstated above, were transferred on the day of the experiment in a petri
dish filled with ice-cold skinning solution and separated in smallbundles. Single fiber segments were dissected manually from bundlesunder a stereomicroscope and then bathed for 1 h in skinning solutioncontaining 1% Triton X-100 (Sigma-Aldrich, St. Louis, MO) toensure complete membrane solubilization. Light aluminium clipswere applied at both ends of the segments.
Skinning, relaxing, preactivating, and activating solutions used formechanical experiments with single fibers, were prepared as describedpreviously (4), with the addition of protease inhibitors (E64 10 �Mand leupeptine 40 �M).
Fiber segments were mounted in the experimental setup in a dropof relaxing solution between the force transducer (AME 801, Sensor-One Technologies, Sausalito, CA) and the electromagnetic puller(Scientific Instruments, Heidelberg, Germany), equipped with a dis-placement transducer (40). The signals from the force and displace-ment transducers were fed into a personal computer and stored in thehard disk after analog-to-digital conversion (CED 1401 plus interface,Cambridge Electronic Design, Cambridge, UK). For data storage, therecall and analysis software Spike2 (Cambridge Electronic Design)was used. All details of the setup are reported elsewhere (40).
Fiber segments were mounted in relaxing solution and after mea-suring length, diameters, and sarcomere length, were stretched by�20%. They were then transferred into the preactivating solution forat least 2 min and finally, maximally activated by immersion in theactivating solution (pCa 4.6). During maximal activation, isometrictension (P0) was measured, and unloaded shortening velocity (V0) wasdetermined according to the slack test procedure (16). At the end ofthe experiment, the segment was removed from the setup and im-mersed in sample buffer for gel electrophoresis after removing thealuminium clips.
Gel Electrophoresis
At the end of the mechanical experiment, each fiber was classifiedon the basis of myosin heavy chain (MyHC) isoform separation withSDS-PAGE. To this aim, the composition in MyHC isoforms ofhomogenates of single muscle fibers was determined on 8% poly-acrylamide slab gels after denaturation in SDS (SDS-PAGE) (37).Slabs, 18-cm wide, 16-cm high, and 1-mm thick, were used. Electro-phoresis was run for 26 h at 70 V for 1.5 h and at 230 V for theremaining time. Gels were silver stained. Three bands were separatedin the region of 200 kD, corresponding (in order of migration from theslowest to the fastest) to MyHC-1, MyHC-2A, and MyHC-2X. Inaddition, myosin light chain (MyLC) isoforms were separated on 12%polyacrylamide slab gels. A sample containing �4 �g proteins wasloaded on the gel and the electrophoresis run at 32 mA until themigration front reached the end of separating gels, which were stainedwith Coomassie blue. Two MyLC bands were separated in the regionof 20 kD, corresponding to the fast (MyLC-2f) and slow (MyLC-2s)isoforms of regulatory MyLC. The bands were identified by Westernblot using antibody against MyLC-2 (FL-172, Santa Cruz Biotech-nology, Santa Cruz, CA). The relative proportions of MyHC andMyLC isoforms were determined by the measurement of the bright-ness area product (B.A.P.; i.e., the product of the area of the band bythe average brightness subtracted local background after black-whiteinversion) after scanning the gels with the accuracy of 600 dayspostinfection.
Finally, a confirmatory analysis was performed by applying thesame methods on residual muscle fiber bundles from the individualbioptic samples.
TOM20 is considered a well-established mitochondrial marker (13,33). To determine the mitochondrial protein, TOM20 proteins fromfour subjects were separated by SDS-PAGE with the same protocolused for MyLC (see above in Gel electrophoresis) and electrotrans-ferred onto nitrocellulose membranes. Antibodies against TOM20(FL-145, Santa Cruz Biotechnology) were used, and immunodetectionwas performed with the chemiluminescence kit (ECL kit, Amersham
1599MUSCULAR AEROBIC METABOLISM AND ADAPTATION TO HYPOXIA
J Appl Physiol • VOL 111 • DECEMBER 2011 • www.jap.org
on January 9, 2012jap.physiology.org
Dow
nloaded from

Biosciences, Uppsala, Sweden). Quantification was based on B.A.P.analysis, as stated above (see above in Gel electrophoresis) formyosin isoform densitometry. Care was taken that equal amounts ofhomogenate were loaded in all lanes, as checked by actin densitom-etry. Each determination of myosin isoforms or TOM20 was done intriplicate.
Statistical Analysis
Regarding functional and blood samples, data are shown as meanswith SDs, and pairwise comparisons were carried out by usingStudent’s t-test for paired observations. The level of significance wasset at P � 0.05.
Concerning the structural and functional parameters derived frommuscle biopsies, average values of fiber CSA and mechanical char-acteristics were calculated as weighted averages (i.e., individualaverage value of each class of fiber was weighted by the correspond-ing numerousness within the subject). Cohen’s d effect size was alsodetermined (39).
Based on variances in in vivo functional parameters (e.g., themeasure of DefO2 in our laboratory is characterized by within-subjectvariability of 10%), using a power of 0.8 and �-level of 0.05,sample-size analysis for paired t-test (SigmaPlot version 11.0, SystatSoftware, Chicago, IL) indicated that the minimum number of sub-jects required to detect a significant difference (i.e., a 20% variation)was four. When the mechanical characteristics of isolated fibers areconsidered (i.e., a within-subject variability of 30%), the requiredsample size to detect a significant change (i.e., a 50% variation), usinga power of 0.8 and �-level of 0.05, was five.
RESULTS
Variations of Anthropometric Parameters and MusclePerformance In Vivo
The anthropometric parameters of the climbers before andafter the stay at altitude are shown in Table 1. Body weight (P� 0.05; effect size 0.23) and percent body fat (P � 0.001;effect size 0.72) were decreased significantly, whereas totallean body mass was unchanged. On the contrary, the CSA ofthigh muscles was increased significantly (P � 0.001; effectsize 0.75) after altitude exposure.
As shown in Table 2, MP, AP, and [La]b were significantlylower after the stay at altitude (effect size was 0.55, 0.67, and1 for MP, AP, and [La]b, respectively).
MVC did not significantly change before and after expedi-tion. Actually, two subjects showed an increase (by �2.6% and�18.9%, respectively), whereas five subjects showed a de-crease (range: 2.6–21.4%).
VO2max, DefO2, and O2 Delivery Response
The absolute values of VO2max, determined before and afterexpedition, were not significantly different (pre: 3.04 l·min�1 �
0.56; post: 3.06 l·min�1 � 0.51). On the contrary, VO2max
normalized for body mass was significantly higher after theexpedition (P � 0.05; effect size 0.32; Table 2). VO2 at VTcorresponded to the 59% � 10 and to 58% � 8 of VO2max
before and after exposure to hypobaric hypoxia, and it did notchange significantly (pre: 22.4 ml·kg�1 ·min�1 � 5.9; post:23.6 ml·kg�1 ·min�1 � 5.00).
VO2ss at 100 W amounted to 1.78 l·min�1 � 0.21 and to1.70 � 0.14 in the control condition and upon the return fromaltitude, respectively, and corresponded to a net increment ofO2 uptake during the step transition from 30 to 100 W of 1.09l·min�1 � 0.10 and of 0.99 l·min�1 � 0.11 (NS).
In Fig. 1, the VO2 and QaO2 kinetics of a typical subject, asmeasured after the exposure to hypobaric hypoxia, are shown.Average DefO2 in the control condition amounted to 979.8ml � 221.8, and it was reduced significantly upon the return:666.8 ml � 205.2 (P � 0.05; effect size: 1.46). The two valuescorresponded to a MRT of 53.8 s � 10.9 and of 39.8 s � 8.8(P � 0.05; effect size: 1.41).
The peak increment of [La]b amounted, on average, to 1.5mM � 0.7 and to 1.2 mM � 0.6 before and after theexpedition, respectively (NS).
[Hb] was 14.0 g 100 ml�1 � 1.6 and 14.1 g 100 ml�1 � 1.4(NS) before and after exposure to hypoxia. SaO2 was notsignificantly different in the two occasions and amounted, onaverage, to 99%. Therefore, arterial concentration of O2 was19.8 ml 100 ml�1 � 1.2 and 19.2 ml 100 ml�1 � 2.0 (NS)before and after expedition, respectively.
During submaximal exercise, Q was equal to 12.9 l·min�1 �1.6 and to 12.7 l·min�1 � 2.3 (NS) before and after exposureto hypoxia (NS); these two values corresponded to a QaO2
during exercise at steady-state of 2.3 l·min�1 � 0.5 and of 2.2l·min�1 � 0.4 (NS). MRTs of the QaO2 kinetics turned out tobe almost identical before (25.4 s � 14.1) and after (26.4 s �7.1) expedition (NS).
Single Muscle Fibers, Myosin Isoforms, andMitochondrial Content
Bioptic samples from two subjects had to be discarded forpoor quality. Approximately 200 fibers from five subjectscould be dissected and mechanically characterized in both pre-and postconditions.
The percent distribution of fibers based on MyHC isoformseparation with SDS-PAGE is shown in Fig. 2A. Slow fibersincreased from 34.7% to 52.2% (P � 0.05; effect size 1.43)
Table 1. Average � SD values of body weight, percentageof body fat, and cross-sectional area of the thigh before andafter the expedition
Mean � SD
Subject pre post
BW (kg) 79.3 � 15.3 76.0* � 12.2BF (%) 26.3 � 4.5 23.2† � 4.1CSA (cm2) 158 � 20 172† � 17
BW, body weight; BF, body fat; CSA, cross-sectional area; pre, beforeexpedition; post, after expedition. *P � 0.05; †P � 0.01.
Table 2. Average � SD values of maximal oxygenconsumption and of maximal power output, average poweroutput, and peak blood lactate concentration measuredduring the Wingate Anaerobic test before andafter the expedition
Mean � SD
Subject pre post
VO2max (ml ·kg�1 ·min�1) 38.8 � 6.5 40.8* � 6.2MP (W·kg�1) 7.3 � 1.1 6.7* � 1.1AP (W·kg�1) 5.9 � 0.7 5.4* � 0.8[La]b (mM) 10.9 � 2.3 8.6* � 2.3
VO2max, maximal oxygen consumption; MP, maximal power output; AP,average power output; [La]b, blood lactate concentration. *P � 0.05.
1600 MUSCULAR AEROBIC METABOLISM AND ADAPTATION TO HYPOXIA
J Appl Physiol • VOL 111 • DECEMBER 2011 • www.jap.org
on January 9, 2012jap.physiology.org
Dow
nloaded from
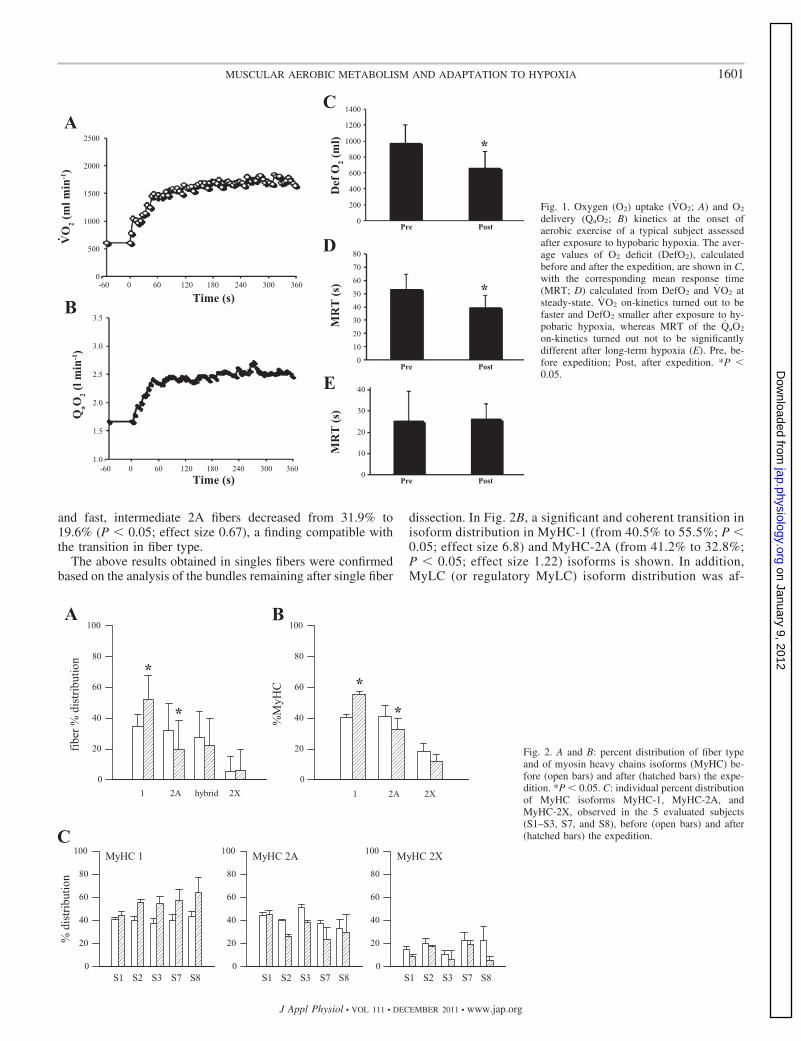
and fast, intermediate 2A fibers decreased from 31.9% to19.6% (P � 0.05; effect size 0.67), a finding compatible withthe transition in fiber type.
The above results obtained in singles fibers were confirmedbased on the analysis of the bundles remaining after single fiber
dissection. In Fig. 2B, a significant and coherent transition inisoform distribution in MyHC-1 (from 40.5% to 55.5%; P �0.05; effect size 6.8) and MyHC-2A (from 41.2% to 32.8%;P � 0.05; effect size 1.22) isoforms is shown. In addition,MyLC (or regulatory MyLC) isoform distribution was af-
Fig. 1. Oxygen (O2) uptake (VO2; A) and O2
delivery (QaO2; B) kinetics at the onset ofaerobic exercise of a typical subject assessedafter exposure to hypobaric hypoxia. The aver-age values of O2 deficit (DefO2), calculatedbefore and after the expedition, are shown in C,with the corresponding mean response time(MRT; D) calculated from DefO2 and VO2 atsteady-state. VO2 on-kinetics turned out to befaster and DefO2 smaller after exposure to hy-pobaric hypoxia, whereas MRT of the QaO2
on-kinetics turned out not to be significantlydifferent after long-term hypoxia (E). Pre, be-fore expedition; Post, after expedition. *P �0.05.
Fig. 2. A and B: percent distribution of fiber typeand of myosin heavy chains isoforms (MyHC) be-fore (open bars) and after (hatched bars) the expe-dition. *P � 0.05. C: individual percent distributionof MyHC isoforms MyHC-1, MyHC-2A, andMyHC-2X, observed in the 5 evaluated subjects(S1–S3, S7, and S8), before (open bars) and after(hatched bars) the expedition.
1601MUSCULAR AEROBIC METABOLISM AND ADAPTATION TO HYPOXIA
J Appl Physiol • VOL 111 • DECEMBER 2011 • www.jap.org
on January 9, 2012jap.physiology.org
Dow
nloaded from

fected, since a significant increase in slow isoforms (MyLC-2s; from 48.2% to 57.4%; P � 0.05; effect size 0.66) and asignificant decrease in the fast ones (MyLC-2f; from 51.8%to 42.7%; P � 0.05; effect size 0.60) occurred. Interest-ingly, when individual subjects were considered (Fig. 2C),the fast-to-slow transition is detectable in all subjects, al-though to a different extent.
In Fig. 3, the mean values of fiber CSA and of fibermechanical parameters are reported. Fiber CSA (Fig. 3B) wasgreater after the stay at altitude than before (plus 17% on theaverage), without reaching statistical significance. Accord-ingly, active force (F0), developed during maximal activationinduced by calcium (Fig. 3A), was greater after the stay ataltitude than before, but the difference did not attain the levelof significance (plus 17% on the average). Thus P0, i.e., F0
normalized to fiber CSA, remained virtually unchanged (Fig.3C). Surprisingly, unloaded V0 was decreased significantly(1.27 L/s�1 to 0.39 L/s�1; P � 0.01; effect size 3.5). Specif-ically, V0 was decreased significantly both in slow fibers,expressing MyHC-1 (0.52 L/s�1 to 0.19 L/s�1; P � 0.05;effect size 2.47), and in fast 2A fibers (1.38 L/s�1 to 0.78L/s�1; P � 0.1; effect size 1.15; Fig. 3D). The decrease in V0
also entailed a proportional drop (P � 0.01; �64%) of themechanical MP developed by the muscles, which was calcu-lated as 10% of the product of P0 V0.
Finally, the residual fragments of the biopsy samples weresufficient to analyze a mitochondrial marker protein (TOM20)before and after the expedition in four subjects. The densito-metric determination showed a trend to increase in the mito-chondrial protein abundance with greater values in three sub-jects and no change in one. Moreover, the decrease of DefO2
was highly correlated with the percent increase in mitochon-drial protein TOM20 [DefO2 (ml) 61 � 10 increase TOM20(%); r2 0.97; n 4].
DISCUSSION
The balance between detrimental and positive effects of highaltitude on the regulation and functions of aerobic metabolismin humans is still an open issue. Whereas there is wideagreement that moderate hypoxia (i.e., altitude below 4,000–5,000 m) can positively affect aerobic power and exerciseendurance [for a recent review, see (43)], on the contrary,exposure to severe hypoxia (i.e., above 6,000 m of altitude) hasdetrimental effects (22). The results obtained in the presentstudy showed that a prolonged sojourn (�3 wk) above 5,000 mwas not only well tolerated but also had, per se, a positiveimpact on the ability to use O2 for energy production. Impor-tantly, such conclusion comes from independent but fullyconsistent lines of evidence, namely, the analysis of VO2
kinetics and the study of structural and functional characteris-tics of the skeletal muscle.
In particular, the dynamic response of O2 uptake at themuscular level was faster after exposure to long-term hypo-baric hypoxia, despite the unchanged kinetics of bulk O2
transport. At the same time, a switch from fast to slow fibers inthe muscles of the lower limbs was shown, together with atrend to increased mitochondrial abundance. Therefore, a pro-longed stay in a hypoxic condition above 5,000 m does notnecessarily imply deterioration, but can even induce beneficialadaptations of muscle oxidative metabolism.
Some aspects of the correlation between the changes innoninvasive functional indexes and the molecular and func-tional adaptations of muscle fibers occurring at high altitudewill be discussed in the following paragraphs.
VO2 Kinetics and Muscular Adaptations
The functional adaptations undergone by the oxidative en-ergy pathway in exercising humans were quantified by calcu-lating DefO2 at the onset of a step exercise transition.
Fig. 3. Muscle fiber (weighted averages of �200fibers) characteristics before (open bars) and after(hatched bars) the expedition. A: force developed bysingle fibers during maximal calcium activation(F0); B: cross-sectional area (CSA) of single fibers;C: tension (P0), i.e., F0 normalized over CSA;D: maximal shortening velocity (V0) of type 1 andtype 2A muscle fibers. *P � 0.05; °P � 0.1.
1602 MUSCULAR AEROBIC METABOLISM AND ADAPTATION TO HYPOXIA
J Appl Physiol • VOL 111 • DECEMBER 2011 • www.jap.org
on January 9, 2012jap.physiology.org
Dow
nloaded from

MRT—or effective time constant �= (27)—was calculatedfrom the ratio of DefO2 to the corresponding net VO2ss. Thisapproach allows circumventing the problems originated fromfitting with a nonlinear exponential model B-by-B time seriescharacterized by an inherently low sampling frequency and alow signal-to-noise ratio (as is the case when a low number ofrepetitions of the same exercise are available). This approachprovides MRT values that are identical to those obtained byfitting the same response by a simple exponential functionwithout time delay (8, 45).
Pulmonary VO2 kinetics is considered to be a proxy of themuscular O2 dynamic response. Moreover, it is broadly ac-cepted that at least during moderate exercise, VO2 kinetics islimited by the intrinsic inertia of the muscular oxidative systemrather than by the local delivery of O2 to the muscles (18, 19).As such, the modification of the O2 dynamic response duringexercise is a valuable tool to understand the effects of exper-imental interventions and/or environmental adaptations on theregulation of the oxidative metabolism in vivo.
For instance, it is known that even short periods of aerobictraining are sufficient to induce a significant acceleration ofVO2 kinetics (29). This response seems to anticipate both theincrease of the maximal aerobic power induced by training andof mitochondrial protein content and mitochondrial enzymeactivities (29). A theoretical model has been proposed recently(24) to explain the biochemical regulation and the training-induced adaptation of the VO2 kinetics in skeletal muscles.According to this model, the increase in mitochondria contentis one of the factors inducing the acceleration of muscular VO2
kinetics and therefore, also of pulmonary VO2 response toexercise. The high correlation between the percent increase ofmitochondrial TOM20 and the decrease in DefO2 observed ina subgroup of subjects (four examined) is consistent with theabove hypothesis.
Whereas the dynamic response of O2 uptake at the muscularlevel improved after exposure to long-term hypobaric hypoxia,QaO2 kinetics did not change. These results seem to indicateand confirm that at least during moderate-intensity step tran-sitions, pulmonary VO2 and muscular O2 kinetics are notinfluenced directly by the dynamics of bulk O2 delivery, butthey are dictated by the intrinsic slowness of oxidative metab-olism (18, 31).
We know that high-altitude hypoxia induces an increase of[Hb] and therefore, of blood O2-carrying capacity secondary toenhanced emopoiesis. In the present study, however, nochanges were detected in blood O2-carrying capacity duringthe experiments performed after exposure to hypoxia. Thismay be due to a rapid return of [Hb] to sea level values afterthe end of the hypoxic stimulus, as it has been described inprevious works (34). This fast recovery is mainly due to thehigh rate of disappearance of young and middle-aged red bloodcells formed in response to the hypoxic stimulus (35).
Previous results showed that VO2 kinetics, upon the returnto sea level after 6 wk at 5,200 m asl, was significantly slowerthan before the stay at altitude, implying that a larger DefO2
was contracted at the onset of exercise (6). This finding wasattributed to a greater use of the inner O2 stores ascribed to theincrease in [Hb] found after exposure to hypobaric hypoxia. Inour subjects, however, [Hb] was unchanged compared with thevalue prevailing in the control condition. As a consequence, the
inner O2 stores of the body were unmodified, and they couldnot affect VO2 kinetics by any means.
The adaptation of hind-limb skeletal muscles was investi-gated on biopsy samples taken from vastus lateralis before andafter the expedition. At variance with previous studies (20) thatdetected no changes in fiber-type distribution after prolongedexposure to moderate chronic hypoxia, we documented anincreased proportion of slow fibers. Recent data (36) may helpus reconcile the apparent discrepancy of our results withprevious studies regarding fiber-type distribution changes (20).Namely, the coupling of physical exercise with hypoxia hasbeen demonstrated to cause a larger increase in subsarcolem-mal mitochondrial density of the trained muscles comparedwith training in a normoxic condition. The specific biochemi-cal and structural adaptations are elicited by differential regu-lation of gene transcription occurring with exercise in the twodifferent oxygenation conditions (36). Our subjects, during theapproach to (and the descent from) the base camp and duringtheir sojourn at high altitude, performed a higher amount ofphysical activity (i.e., an average of 30 km/day during the 14days of trekking and an average of 1 h/day of intense physicalactivity during the stay at the base camp) compared with thepre-expedition lifestyle. Therefore, it cannot be excluded thatphysical exercise is responsible for the muscular adaptationsobserved in this study.
Slow fibers are characterized by a high reliance on oxidativemetabolism and by a high capillary-to-fiber ratio (5). Anincrease in slow fiber proportion would imply an enhancedoxidative metabolism and an improved local microcirculation,which are in complete agreement with the acceleration of VO2
on-kinetics discussed above.
Anthropometrics and Muscle Performance
CSA of the lower limb significantly increased after theexpedition. This finding is consistent with the tendency of theincrease of fiber CSA. MVC was unchanged in full accordancewith the results obtained at the single fiber level.
Further confirmation of a shift toward the slow oxidativefiber type comes from the results of the WAnT. Upon return tosea level, we observed a decline in MP and AP (approximately�10%) and in peak [La]b (approximately �20%). The drop inmechanical power is consistent with the observed shift fromtype 2 to type 1 muscle fibers (characterized by an intrinsicallylower mechanical power) and reflects the decreased capacity ofleg muscles to perform extremely powerful movements thatrequire mainly anaerobic metabolic sources (3). It is worthobserving that single fiber experiments revealed not only anincreased abundance of slow fibers but also a decrease in theirmaximum V0. The above findings are intriguingly similar tochanges observed in slow fibers during aging (32), which areattributed to a post-translational modification caused by oxida-tive glycosylation of myosin (32). The contribution of the mostabundant fiber types to the decrease in muscle power (power isthe product of velocity by force) is fully understandable.
A reduced blood [La]b was observed at the end of theWAnT, upon return to sea level, compared with pre-expeditiontests. A number of physiological phenomena may concur tofully explain such decrease: 1) the above-mentioned reductionof power output; 2) an increased reliance on aerobic metabo-lism for the production of ATP during supramaximal exercise;
1603MUSCULAR AEROBIC METABOLISM AND ADAPTATION TO HYPOXIA
J Appl Physiol • VOL 111 • DECEMBER 2011 • www.jap.org
on January 9, 2012jap.physiology.org
Dow
nloaded from

3) the possible contribution of the still controversial phenom-enon called “lactate paradox” (23, 42). All of the explanationsare in full agreement with the independent results obtainedfrom the analysis of the structural–functional muscle adapta-tions and from the VO2 kinetics.
We can therefore conclude that a prolonged stay in ahypoxic condition above 5,000 m does not necessarily implydeterioration but can even induce an improvement of themuscle oxidative metabolism. This is the main message com-ing from the present results. From the comparison with previ-ous studies, it may be speculated, however, that there may bean altitude threshold, above which, the negative effects arepredominant, and no compensation is possible.
In addition, these results confirm that at least during mod-erate intensity exercise, pulmonary VO2 and muscular O2
kinetics are not influenced directly by the dynamics of bulk O2
delivery, but they are dictated by the intrinsic slowness of theoxidative metabolism to adapt to changes in energy demand.
ACKNOWLEDGMENTS
We heartily thank the mountaineers who volunteered to participate in theexperimental tests and Professor F. Schena (University of Verona) for valuableadvice and support in experiment design. The technical help of Dr. AlessandraAdami and Dr. Gabriela DeRoia is greatly acknowledged.
GRANTS
The study was partially supported by the Grant PRIN 2007, allocated to C.Capelli by the Italian Ministry for Research and University.
DISCLOSURES
No conflicts of interest, financial or otherwise, are declared by the author(s).
AUTHOR CONTRIBUTIONS
Author contributions: V. V., S. P., G. F., C. R., and C. C. conception anddesign of research; C. D., L. T., V. V., P. C., T. P., V. M., S. P., and C. C.performed experiments; C. D., L. T., P. C., T. P., V. M., A. P., S. P., and C. R.analyzed data; A. P., S. P., G. F., C. R., and C. C. interpreted results ofexperiments; L. T. and S. P. prepared figures; C. D., T. P., S. P., G. F., C. R.,and C. C. drafted manuscript; C. D., L. T., T. P., S. P., G. F., C. R., and C. C.edited and revised manuscript; C. C. approved final version of manuscript.
REFERENCES
1. Antonutto G, Capelli C, Girardis M, Zamparo P, di Prampero PE.Effects of microgravity on maximal power of the lower limbs during veryshort efforts in humans. J Appl Physiol 86: 85–92, 1999.
2. Beaver W, Wasserman K, Whipp BJ. A new method for detectinganaerobic threshold by gas exchange. J Appl Physiol 60: 2020–2027,1986.
3. Beneke R, Pollmann C, Bleif I, Leithäuser RM, Hütler M. Howanaerobic is the Wingate Anaerobic test for humans? Eur J Appl Physiol87: 388–392, 2002.
4. Bottinelli R, Canepari M, Pellegrino MA, Reggiani C. Force-velocityproperties of human skeletal muscle fibers: myosin heavy chain isoformand temperature dependence. J Physiol 495: 573–586, 1996.
5. Bottinelli R, Reggiani C. Human skeletal muscle fibres: molecular andfunctional diversity. Prog Biophys Mol Biol 73: 195–262, 2000.
6. Boutellier U, Giezendanner D, Cerretelli P, di Prampero PE. Aftereffects of chronic hypoxia on O2 kinetics and on O2 deficit and debt. EurJ Appl Physiol Occup Physiol 53: 87–91, 1984.
7. Burnley M. Found in translation: the dependence of oxygen uptakekinetics on O2 delivery and O2 utilization. J Appl Physiol 105: 1387–1388,2008.
8. Capelli C, Adami A, Antonutto G, Cautero M, Tam E. Oxygen deficitsand oxygen delivery kinetics during submaximal intensity exercise inhumans after 14 days of head-down tilt-bed rest. Eur J Appl Physiol 107:51–59, 2009.
9. Carson E, Cobelli C, Finkelstein L. The Mathematical Modelling ofMetabolic and Endocrine Systems. New York: Wiley-Interscience, 1983,p. 179–216.
10. Cerretelli P. Limiting factors to oxygen transport on Mount Everest. JAppl Physiol 40: 658–667, 1976.
11. Cerretelli P, Gelfi C. Energy metabolism in hypoxia: reinterpreting somefeatures of muscle physiology on molecular grounds. Eur J Appl Physiol111: 421–432, 2011.
12. Cerretelli P, Marzorati M, Marconi C. Muscle bioenergetics and met-abolic control at altitude. High Alt Med Biol 10: 165–174, 2009.
13. Corbi N, Batassa EM, Pisani C, Onori A, Di Certo MG, Strimpakos G,Fanciulli M, Mattei E, Passanananti C. The eEF1� subunit contactsRNA polymerase II and binds vimentin promoter region. PloS One 5:e14481, 2010.
14. Doria C, Veicsteinas A, Limonta E, Maggioni M, Aschieri P, Eusebi F,Fanò G, Pietrangelo T. Energetics of karate (kata and kumite techniques)in top-level athletes. Eur J Appl Physiol 107: 603–610, 2009.
15. Durnin JV, Womersley J. Body fat assessed from total body density andits estimation from skinfold thickness: measurements on 481 men andwomen aged from 16 to 72 years. Br J Nutr 32: 77–97, 1974.
16. Edman KA. The velocity of unloaded shortening and its relation tosarcomere length and isometric force in vertebrate muscle fibers. J Physiol291: 143–159, 1979.
17. Flueck M. Plasticity of the muscle proteome to exercise at altitude. HighAlt Med Biol 10: 183–193, 2009.
18. Grassi B. Skeletal muscle O2 on-kinetics: set by O2 delivery or by O2
utilization? New insight into an old issue. Med Sci Sports Exerc 32:108–116, 2000.
19. Grassi B, Poole DC, Richardson RS, Knight DR, Erickson B, WagnerPD. Muscle O2 uptake kinetics in humans: implications for metaboliccontrol. J Appl Physiol 80: 988–996, 1996.
20. Green HJ, Sutton JR, Wolfel EE, Reeves JT, Butterfield Brooks GA.Altitude acclimatization and energy metabolic adaptations in skeletalmuscle during exercise. J Appl Physiol 73: 2701–2708, 1992.
21. Howald H, Hoppeler H. Performing at extreme altitude: muscle cellularand subcellular adaptations. Eur J Appl Physiol 90: 360–364, 2003.
22. Howald H, Pette D, Simoneau J, Uber A, Hoppeler H, Cerretelli P.Effect of chronic hypoxia on muscle enzyme activities. Int J Sports Med11, Suppl 1: S10–S14, 1990.
23. Kayser B. Lactate during exercise at high altitude. Eur J Appl Physiol 74:195–205, 1996.
24. Korzeniewski B, Zoladz JA. A model of oxidative phosphorylation inmammalian skeletal muscle. Biophys Chem 92: 17–34, 2001.
25. Lador F, Azabji Kenfack M, Moia C, Cautero M, Morel D, Capelli C,Ferretti G. Simultaneous determination of the kinetics of cardiac output,systemic O2 delivery, and lung O2 uptake at exercise onset in men. Am JPhysiol Regul Integr Comp Physiol 290: R1071–R1079, 2006.
26. Lamarra N, Whipp B, Ward S, Wasserman K. Effect of interbreathfluctuations on characterising exercise gas exchange kinetics. J ApplPhysiol 62: 2003–2012, 1987.
27. Linnarsson D. Dynamics of pulmonary gas exchange and heart ratechanges at start and end of exercise. Acta Physiol Scand Suppl 415: 1–68, 1974.
28. Martinelli M, Winterhalder R, Cerretelli P, Howald H, Hoppeler H.Muscle lipofuscin content and satellite cell volume is increased after highaltitude exposure in humans. Experientia 46: 672–676, 1990.
29. Phillips SM, Green HJ, MacDonald MJ, Hughson R. Progressive effectof endurance training on VO2 kinetics at onset of submaximal exercise. JAppl Physiol 79: 1914–1920, 1995.
30. Pietrangleo T, D’Amelio L, Doria C, Mancinelli R, Fulle S, Fanò G.Tiny percutaneous needle biopsy: an efficient method for studying cellularand molecular aspects of skeletal muscle in humans. Int J Mol Med 27:361–367, 2011.
31. Poole DC, Barstow TJ, McDonough P, Jones AM. Control of oxygenuptake during exercise. Med Sci Sports Exerc 40: 462–474, 2008.
32. Ramamurthy B, Hook P, Larsson L. An overview of carbohydrate-protein interactions with specific reference to myosin and ageing. ActaPhysiol Scand 167: 327–329, 1999.
33. Rapaport D. How does the TOM complex mediate insertion of precursorproteins into mitochindrial outer membrane? J Cell Biol 171: 419–424, 2005.
34. Richalet JP, Robach P, Jarrot S, Schneider JC, Mason NP, Cauchy E,Herry JP, Bienvenu A, Gardette B, Gortan C. Operation Everest III(COMEX =97). Effects of prolonged and progressive hypoxia on humansduring a simulated ascent to 8,848 M in a hypobaric chamber. Adv ExpMed Biol 474: 297–317, 1999.
1604 MUSCULAR AEROBIC METABOLISM AND ADAPTATION TO HYPOXIA
J Appl Physiol • VOL 111 • DECEMBER 2011 • www.jap.org
on January 9, 2012jap.physiology.org
Dow
nloaded from
35. Risso A, Turello M, Biffoni F, Antonutto G. Red blood cell senescenceand neocytolisis in humans after high altitude acclimatization. Blood CellsMol Dis 38: 83–92, 2006.
36. Schmutz S, Däpp C, Wittwe M, Durieux AC, Mueller M, Weinstein F,Vogt M, Hoppler H, Flück M. A hypoxia complement differentiates themuscle response to endurance exercise. Exp Physiol 95: 723–735, 2010.
37. Talmadge RJ, Roy RR. Electrophoretic separation of rat skeletal musclemyosin heavy-chain isoforms. J Appl Physiol 75: 2337–2340, 1993.
38. Tam E, Azabji Kenfack M, Cautero M, Lador F, Antonutto G, diPrampero P, Ferretti G, Capelli C. Correction of cardiac output ob-tained by Modelflow from finger pulse pressure profiles with a respiratorymethod in humans. Clin Sci (Lond) 106: 371–376, 2004.
39. Thomas JR, Nelson JK, Silverman SJ. Research Methods in PhysicalActivity. Champaign, IL: Human Kinetics, 2005, p. 152–154.
40. Toniolo L, Patruno M, Maccatrozzo L, Pellegrino MA, Canepari M,Rossi R, DAntona G, Bottinelli R, Reggiani Mascarello FC. Fast fibers
in a large animal: fiber types, contractile properties and MHC expressionin pig skeletal muscles. J Exp Biol 207: 1875–1886, 2004.
41. Triebwasser JH, Johnosn RL Jr, Burpo RP, Campbell JC, ReardonWC, Blomqvist G. Noninvasive determination of cardiac outptut by amodified acetylene rebreathing procedure utlizing mass spectometer mea-surement. Aviat Space Environ Med 48: 203–207, 1977.
42. van Hall G, Lundby C, Araoz M, Calbet JA, Sander M, Saltin B. Thelactate paradox revisited in lowlanders during acclimatization to 4100 mand in high-latitude natives. J Physiol 587: 1117–1129, 2009.
43. Vogt M, Hoppeler H. Is hypoxia training good for muscles and exerciseperformance? Prog Cardiovasc Dis 52: 525–533, 2010.
44. West JB, Schoene RB, Milledge JS. Peripheral tissues. In: High AltitudeMedicine and Physiology. London: Hodder Arnold, 2007, p. 131–143.
45. Whipp BJ, Rossiter HB. The kinetics of oxygen uptake. In: OxygenUptake Kinetics in Sports, Exercise and Medicine, edited by Jones AMand Routledge PD. Oxon, UK: Bington, 2005, p. 62–94.
1605MUSCULAR AEROBIC METABOLISM AND ADAPTATION TO HYPOXIA
J Appl Physiol • VOL 111 • DECEMBER 2011 • www.jap.org
on January 9, 2012jap.physiology.org
Dow
nloaded from
Related Documents