Agricultural and Forest Meteorology, 52 (1990) 227-251 227 Elsevier Science Publishers B.V., Amsterdam -- Printed in The Netherlands Improved prospects for estimating insolation for calculating regional evapotranspiration from remotely sensed data R.T. Pinker and I. Laszlo Department of Meteorology, University of Maryland, College Park, MD 20742 (U.S.A.) (Received July 3, 1989; revision accepted December 12, 1989 ) ABSTRACT Pinker, R.T. and Laszlo, I., 1990. Improved prospects for estimating insolation for calculating re- gional evapotranspiration from remotely sensed data. Agric. For. Meteorol.. 52:227-251. Insolation is a key parameter in most formulations for estimating regional evapotranspiration and/ or primary productivity. Many attempts have been made to replace several parameters in these for- mulations with remotely sensed data. Insolation, however, has been obtained from conventional ob- servations. The objective of this paper is to demonstrate that satellite methods for deriving insolation can be improved on the regional scale beyond what is achievable on large scales. We have developed a realistic surface albedo model, which was used as an improved boundary condition in an insolation model, and also, to specify clear/cloudy thresholds. It was demonstrated that as a result, the mean bias error (MBE) was reduced by as much as 50%, to about 6 W m -2 for a monthly mean. Such improvements and accuracies have implications for local evapotranspiration estimation methods. INTRODUCTION To understand climate on various spatial and temporal scales, information on solar radiation reaching the ground is required (Suttles and Ohring, 1986 ). Ever since it was demonstrated that satellite observations in the visible part of the spectrum were useful for inferring surface insolation, prospects for ob- taining such information on a global scale have increased. Early attempts to derive insolation from satellites were made two decades ago (Hanson et al., 1967 ); however, it has only been in the last decade that systematic efforts to develop these techniques to predetermined accuracies have been initiated. A comprehensive review of the various methods can be found in Schmetz (1989). Of particular interest are the physical methods for deriving surface insola- tion because they are site independent and are amenable to improvements. However, they require information that at present is not available globally, 0168-1923/90/$03.50 © 1990 Elsevier Science Publishers B.V.

Welcome message from author
This document is posted to help you gain knowledge. Please leave a comment to let me know what you think about it! Share it to your friends and learn new things together.
Transcript
Agricultural and Forest Meteorology, 52 (1990) 227-251 227 Elsevier Science Publ ishers B.V., Ams te rdam - - Pr in ted in The Nether lands
Improved prospects for estimating insolation for calculating regional evapotranspiration from
remotely sensed data
R.T. Pinker and I. Laszlo Department of Meteorology, University of Maryland, College Park, MD 20742 (U.S.A.)
(Received July 3, 1989; revision accepted December 12, 1989 )
ABSTRACT
Pinker, R.T. and Laszlo, I., 1990. Improved prospects for estimating insolation for calculating re- gional evapotranspiration from remotely sensed data. Agric. For. Meteorol.. 52:227-251.
Insolation is a key parameter in most formulations for estimating regional evapotranspiration and/ or primary productivity. Many attempts have been made to replace several parameters in these for- mulations with remotely sensed data. Insolation, however, has been obtained from conventional ob- servations. The objective of this paper is to demonstrate that satellite methods for deriving insolation can be improved on the regional scale beyond what is achievable on large scales. We have developed a realistic surface albedo model, which was used as an improved boundary condition in an insolation model, and also, to specify clear/cloudy thresholds. It was demonstrated that as a result, the mean bias error (MBE) was reduced by as much as 50%, to about 6 W m -2 for a monthly mean. Such improvements and accuracies have implications for local evapotranspiration estimation methods.
I N T R O D U C T I O N
To understand climate on various spatial and temporal scales, information on solar radiation reaching the ground is required (Suttles and Ohring, 1986 ). Ever since it was demonstrated that satellite observations in the visible part of the spectrum were useful for inferring surface insolation, prospects for ob- taining such information on a global scale have increased. Early attempts to derive insolation from satellites were made two decades ago (Hanson et al., 1967 ); however, it has only been in the last decade that systematic efforts to develop these techniques to predetermined accuracies have been initiated. A comprehensive review of the various methods can be found in Schmetz (1989).
Of particular interest are the physical methods for deriving surface insola- tion because they are site independent and are amenable to improvements. However, they require information that at present is not available globally,
0 1 6 8 - 1 9 2 3 / 9 0 / $ 0 3 . 5 0 © 1990 Elsevier Science Publ ishers B.V.
2 2 8 R.T. PINKER AND 1. LASZLO
and at most, can be provided by climatology. The accuracy of the model pre- diction of surface insolation will depend on the quality of these inputs and on the degree to which these climatologies represent the actual ambient conditions.
Imbedded in the global needs for insolation are the regional needs. Infor- mation on insolation is required for hydrological and agricultural applica- tions, e.g. the need to estimate evapotranspiration (ET). Most of the formu- lations that utilize routine weather data for estimating ET, require information on net radiation (Rn). For instance, in the broadly accepted Penman ( 1948 ) approach, whereby the energy balance equation is combined with the aero- dynamic equation, Rn is required. It is also needed in the more recent Pen- man-Montei th approach, Monteith ( 1981 ); in the Priestly-Taylor ( 1972 ) simplified form of the Penman-Montei th approach for saturated surfaces; in the modified form of DeBruin and Holstag (1982) for non-saturated sur- faces; or in the Kanemasu et al. (1977) model for surfaces with partial vege- tation cover.
In most of the above formulations, Rn is obtained from measurement of the shortwave component, SWL There are two basic approaches to derive Rn from SW~. In the first, a regression formalism is developed between Rn and SWL and used to predict Rn from independent SW~ data. During the last 20 years, numerous such attempts have been made using empirical equations of the form:
Rn = a SW~ - b ( 1 )
o r
Rn = a ( 1 - a ) S W + + b (2)
where a is surface albedo and a, b are regression constants. Early examples of such attempts were presented by Monteith and Szeicz
( 1961 ), Fritschen (1967), and Federer (1968). A more complete summary, for a variety of surface types, can be found in Rosenberg et al. ( 1983 ). In the second approach, Rn is derived from SWL knowledge of surface albedo and parameterization of net longwave radiation (LW) (e.g. Jackson et al., 1987 ).
Many attempts have been made to replace some of the conventionally ob- served variables used for estimating ET by inputs from remotely sensed data. The most commonly used remotely sensed parameters are surface tempera- ture and surface albedo. The albedo is used to estimate the net SW, and sur- face temperature is used for estimating the net LW radiation. Jackson ( 1984 ) described how multispectral radiometer data could be used to estimate re- flected shortwave radiation. Jackson et al. ( 1985 ) and Reginato et al. ( 1985 ) demonstrated that the net radiation can be evaluated by combining multis- pectral estimates of reflected SW and emitted LW radiation with ground-based measurements of incoming SW and LW radiation. Such information when
PROSPECTS FOR ESTIMATING FROM REMOTELY SENSED DATA 229
combined with meteorological data on air temperature, wind speed, and va- por pressure, allows one to calculate Rn and sensible heat flux. Soil heat flux is generally estimated as a fraction of net radiation (Clothier et al., 1986 ). It was demonstrated by Jackson et al. (1987) that such an approach produced evaporation values which compared favorably with point estimates obtained from Bowen ratio/energy balance measurements. While in the above-refer- enced studies the remotely sensed data were obtained from hand-held radi- ometers or airborne sensors, Price (1982, 1983) and Carlson (1986) ex- plored the potential of satellite-derived thermal infrared data to relate surface temperature to ET. In view of the recent progress made to obtain surface in- solation from satellite observations, it is possible now to replace a key com- ponent in the ET formulations, namely, SW$, by remotely sensed informa- tion. In the context of calculating evapotranspiration, the accuracy requirements on insolation estimate techniques are more rigorous than in the case of climate studies, since the accuracies needed have to be achieved on shorter spatial and temporal scales. Therefore, it is important to improve the insolation prediction models on the smaller scales, by utilizing information that is available locally.
In the present study, such an attempt has been made. A location was se- lected where high quality ground truth on insolation was available and where research on evapotranspiration is continuing (Jackson et al., 1987 ). First, the solar model of Pinker and Laszlo (1989a) was implemented with informa- tion available on a global scale; tests were conducted with different sources of climatological information. Subsequently, local characteristics were incorpo- rated. It was demonstrated that by selecting the best regional climatology, the insolation prediction can be improved. Incorporating a new thresholding technique to discriminate between clear and cloudy conditions, based on lo- cal background brightness models, can result in further improvements. The background brightness models require observations from geostationary sat- ellites; if proven useful, they could be developed for each of the five geosta- tionary satellites which presently provide global coverage as part of the Inter- national Satellite Cloud Climatology Project (ISCCP) (Schiffer and Rossow, 1985 ). In the next Section, we will briefly review the solar model used. Then we will describe the procedures followed to obtain background brightness models, and discuss the experiments performed with the solar model.
THE PHYSICAL MODEL
A spectral model for computing solar irradiance at the surface was formu- lated for use with satellite observations. A detailed description of the model can be found in Pinker and Ewing (1985 ) and Pinker and Laszlo (1989a). Briefly, the solar spectrum from 0.2 to 0.7/~m is divided into four intervals; the region from 0.7 to 4 Ftm is divided into eight non-spectral intervals follow-
230 R.T. PINKER AND 1. LASZLO
ing Lacis and Hansen (1974). Use is made of the delta-Eddington approxi- mation to radiative transfer (Joseph et al., 1976). Parameterization is ap- plied to the optical properties of Rayleigh scattering, water vapor absorption, aerosol absorption and scattering and cloud absorption and scattering. Ozone absorption is also accounted for.
Estimation of solar irradiance at the surface (SW+) is obtained in two steps. First, pairs of planetary albedos and downwelling shortwave radiation (SW+) are calculated, using the delta-Eddington approximation of radiative transfer in the shortwave spectrum. Values of ozone amount, surface pressure, tem- perature, precipitable water and aerosol characteristics can be obtained from observations, or from climatology. The absorption by ozone, water vapor and the extinction of molecules, aerosols and clouds are parameterized. The cal- culations are performed for clear and cloudy skies separately with various values of aerosol and cloud optical depths. The calculations are repeated for several values of solar zenith angles and various surface models. In the second step, planetary albedos are derived from satellite counts, using current cali- bration of the sensor, clear/cloudy discrimination and narrow to broadband transformations. The satellite-derived planetary albedos are matched with those obtained in the first step and used to get an estimate of the surface in- solation. The model was implemented and tested at local and regional scales and shown to yield monthly mean daily averages within 8% of observed val- ues (Pinker and Laszlo, 1989a,b).
BACKGROUND BRIGHTNESS MODELS
Introduction
Physical models for deriving surface insolation differ in the way in which they treat the clear and cloudy cases. One group of such models treats the clear and cloudy cases separately and discriminates between the two condi- tions by applying thresholds at the top of the atmosphere (Diak and Gautier, 1983; Darnell et al., 1988; Pinker and Laszlo, 1989a). Others (e.g. Dedieu et al., 1987 ), deal with both situations simultaneously, and consider clouds as large aerosol loading. The fact that the same radiance observed by a satellite can be associated either with a clear atmosphere with a relatively large aerosol amount, or with a cloudy atmosphere with a relatively thin cloud, is a source of error in both types of models (Laszlo and Pinker, 1989). The need for improved specification of cloud thresholds has also been recognized by others (e.g. Raphael and Hay, 1984). Therefore, we opted to develop an objective method for specifying thresholds and to test their impact on the estimates of surface insolation.
PROSPECTS FOR ESTIMATING FROM REMOTELY SENSED DATA 231
Procedures
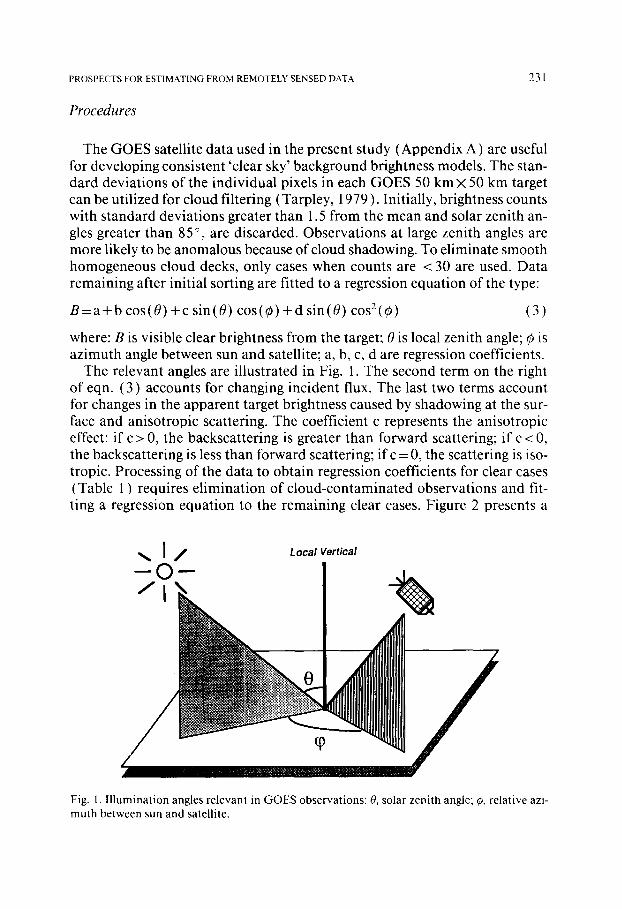
The GOES satellite data used in the present study (Appendix A) are useful for developing consistent 'clear sky' background brightness models. The stan- dard deviations of the individual pixels in each GOES 50 km X 50 km target can be utilized for cloud filtering (Tarpley, 1979 ). Initially, brightness counts with standard deviations greater than 1.5 from the mean and solar zenith an- gles greater than 85 ° , are discarded. Observations at large zenith angles are more likely to be anomalous because of cloud shadowing. To eliminate smooth homogeneous cloud decks, only cases when counts are < 30 are used. Data remaining after initial sorting are fitted to a regression equation of the type:
B = a + b cos(0) +c sin(0) cos(~) + d sin(0) COS2 ( ~ ) (3)
where: B is visible clear brightness from the target; 0 is local zenith angle; ~ is azimuth angle between sun and satellite; a, b, c, d are regression coefficients.
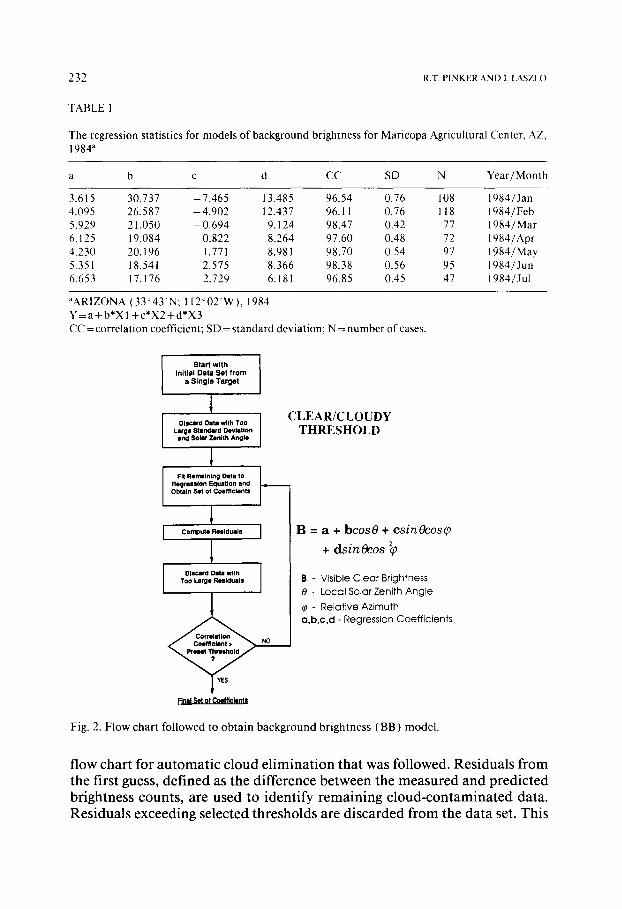
The relevant angles are illustrated in Fig. 1. The second term on the right of eqn. (3) accounts for changing incident flux. The last two terms account for changes in the apparent target brightness caused by shadowing at the sur- face and anisotropic scattering. The coefficient c represents the anisotropic effect: if c > 0, the backscattering is greater than forward scattering; if c < 0, the backscattering is less than forward scattering; if c = 0, the scattering is iso- tropic. Processing of the data to obtain regression coefficients for clear cases (Table 1 ) requires elimination of cloud-contaminated observations and fit- ting a regression equation to the remaining clear cases. Figure 2 presents a
. . I / I O - -
Local Vertical
/
Fig. 1. I l lumination angles relevant in GOES observations: 0, solar zenith angle; 0, relative azi- muth between sun and satellite.
232 R.T. PINKER AND 1. LASZLO
TABLE 1
The regression statistics for models of background brightness for Maricopa Agricultural Center, AZ, 1984 a
a b c d CC SD N Year/Month
3.615 30.737 - 7 . 4 6 5 13.485 96.54 0.76 108 1984/Jan 4.095 26.587 - 4 . 9 0 2 12.437 96.1 t 0.76 118 1984/Feb 5.929 21.050 - 0 . 6 9 4 9.124 98.47 0.42 77 1984/Mar 6.125 19.084 0.822 8.264 97.60 0.48 72 1984/Apt 4.230 20.196 1.771 8.981 98.70 0.54 97 1984/May 5.351 18.541 2.575 8.366 98.38 0.56 95 1984/Jun 6.653 17.176 2.729 6.181 96.85 0.45 47 1984/Jul
aARIZONA (33c43'N; 112°02'W), 1984 Y = a + b * X l + c ' X 2 + d ' X 3 CC = correlation coefficient; SD = standard deviation; N :- number of cases.
Start wi th Initial ga te Set from
a Single Target
DisCard Data with TOo Large Standard OevllUon
lind SOIM Zenhh Angle
Fit Remaining Data 1o RegreSSion Equlltlon lind Obtain Set of Coefficients
Compute St~ld~ls
1 DisCard Data With
Toe Large Ruldu$1$
Final Set of Coefflcilntll
CLEAR/CLOUDY THRESHOLD
B = a + b c o s O + c s i n O c o s ~
+ d s i n O c o s
B - Visible C lea r Brightness
0 - Loca l Solar Zeni th A n g l e
- Re la t ive Az imu th a ,b ,e ,d - Regression Coe f f i c ien ts
Fig. 2. Flow chart followed to obta in background brightness (BB) model.
flow chart for automatic cloud elimination that was followed. Residuals from the first guess, defined as the difference between the measured and predicted brightness counts, are used to identify remaining cloud-contaminated data. Residuals exceeding selected thresholds are discarded from the data set. This
P R O S P E C T S F O R E S T I M A T I N G F R O M R E M O T E L Y S E N S E D D A T A 233
procedure is applied about five times for each target, until the correlation coefficient between the observed and predicted clear brightness is greater than 0.96. The regression coefficients remained almost the same when the corre- lation coefficients exceeded 0.96.
Originally, satellite data for 1984 were used for model development. GOES- 5 (East) failed on 29 July 1984, and from then on, data were replaced by
ARIZONA JUNE 1984
<n 30 31.6 ¢t~ ¢/) ,~ ¢.n
,I- o ¢j -1-
ua 22 23.7 < z g.i
z
== 15 15.8 ~ --= (3 '-' (3 O O O
O
,,n 7 7 .9 "'
ARIZONA 1984 (WHOLE YEAR)
- ' ^ 23.7
17.8 l - Z UJ n., UJ
I 1 . 8 O.
5 .9
20 30 40 50 60 70 80 20 30 40 50 60 70 80
SOLAR ZENITH ANGLE SOLAR ZENITH ANGLE
Fig. 3. Frequency distribution of solar zenith angles for clear cases used for developing the back- ground brightness (BB) model of June 1984 and for all of 1984.
ARIZONA JUNE 1984
¢ncn 30 ]23 .7 u~ c~
o '~' 22 7.8 ]1 •
o
" ' .
° | ° ¢j
o 0 0
n- Ilc 7 s.9
:3 ~Z z i Z
ARIZONA 1984 (WHOLE YEAR)
19.0
14.2
I - Z uJ 0
9.5 m ¢
4. ' /
- 1 0 0 -60 -20 20 60 100 1 4 0
RELATIVE AZIMUTH ANGLE
Fig. 4. As in Fig. 3, for the relative azimuth angles.
- 1 0 0 - 6 0 - 2 0 20 60 1 0 0
RELATIVE AZIMUTH ANGLE
140
234 R.T. PINKER AND 1. LASZLO
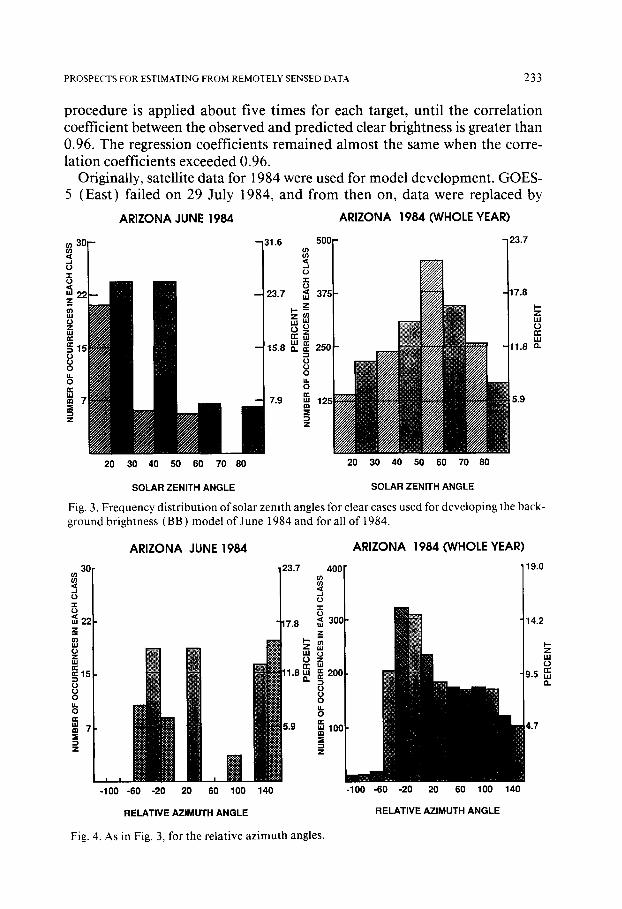
observations from GOES-6 (West). Therefore, only results from the first 7 months will be presented (Table 1 ). While in principle it is feasible to derive an independent regression model for each month, such a model will be based only on a limited sample of solar zenith (s.z.) and relative azimuth (r.a.) angles. In Fig. 3, the frequency distributions of s.z. angles, for June 1984, and for all of 1984 used in developing the regression models are presented. Simi- lar frequency distributions for r.a. angles are presented in Fig. 4. The relative
Janua.,-y(A). July(G) 35 ~A
Z
g 3o U
~ 2 5
15
I i I i I i i I0 I0 20 30 40 50 60 70 80
SOLAR ZENITH ANGLE
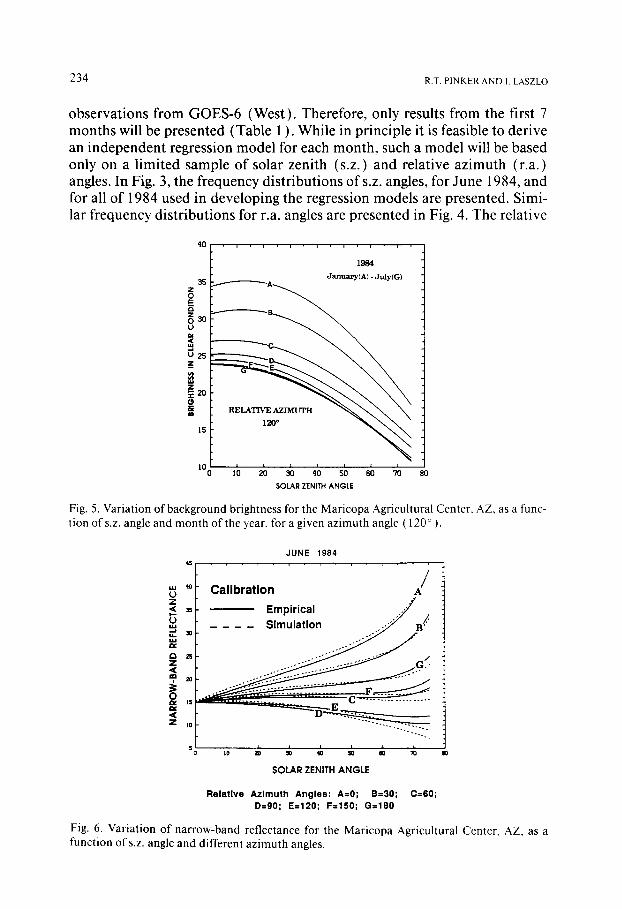
Fig. 5. Variation of background brightness for the Maricopa Agricultural Center, AZ, as a func- tion ofs.z, angle and month of the year, for a given azimuth angle ( 120 ° ).
15
LIJ
Z
a zs Z <
3 0 cI¢ < Z 1o
5
JUNE 1984
/ Calibration A
Empirical . / Simulation ~ B ./"
. . . . . . . ,22, i i i i i i i
10 20 SO 40 5a 80 70
SOLAR ZENITH ANGLE
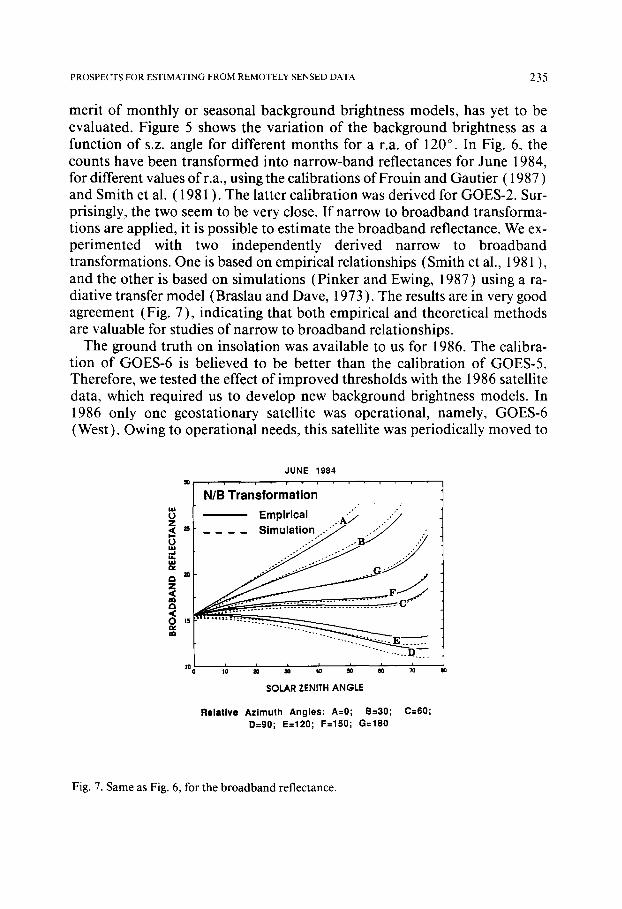
R e l a t i v e A z i m u t h A n g l e s : A=0; B=30; C=60; D=90; E=120; F=150; G=180
Fig. 6. Variation of narrow-band reflectance for the Maricopa Agricultural Center, AZ, as a function of s.z. angle and different azimuth angles.
PROSPECTS FOR ESTIMATING FROM REMOTELY SENSED DATA 235
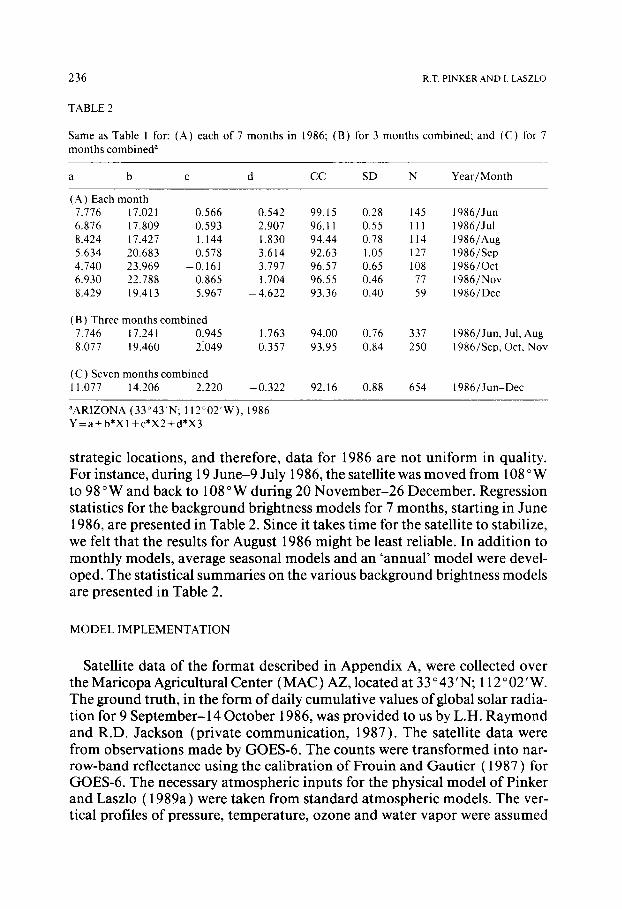
merit of monthly or seasonal background brightness models, has yet to be evaluated. Figure 5 shows the variation of the background brightness as a function of s.z. angle for different months for a r.a. of 120 °. In Fig. 6, the counts have been transformed into narrow-band reflectances for June 1984, for different values ofr.a., using the calibrations of Frouin and Gautier ( 1987 ) and Smith et al. ( 1981 ). The latter calibration was derived for GOES-2. Sur- prisingly, the two seem to be very close. If narrow to broadband transforma- tions are applied, it is possible to estimate the broadband reflectance. We ex- perimented with two independently derived narrow to broadband transformations. One is based on empirical relationships (Smith et al., 1981 ), and the other is based on simulations (Pinker and Ewing, 1987) using a ra- diative transfer model (Braslau and Dave, 1973 ). The results are in very good agreement (Fig. 7), indicating that both empirical and theoretical methods are valuable for studies of narrow to broadband relationships.
The ground truth on insolation was available to us for 1986. The calibra- tion of GOES-6 is believed to be better than the calibration of GOES-5. Therefore, we tested the effect of improved thresholds with the 1986 satellite data, which required us to develop new background brightness models. In 1986 only one geostationary satellite was operational, namely, GOES-6 (West). Owing to operational needs, this satellite was periodically moved to
JUNE 1984
= l N/B T;an'sf0rmafion . . . . . . . .
[ ~ Empirical /~-~ . . . .~ = . . . . Simulation . . ' ~ ..-~'/ ..
10 10 l0 40 ~i0 00 70
SOLAR ZENITH ANGLE
Relstlve Azlrnuth Angles: A=0; B=30; C=60; D=90; E=120; F=150; G=180
Fig. 7. Same as Fig. 6, for the broadband reflectance.
236 R.T. PINKER AND 1. LASZLO
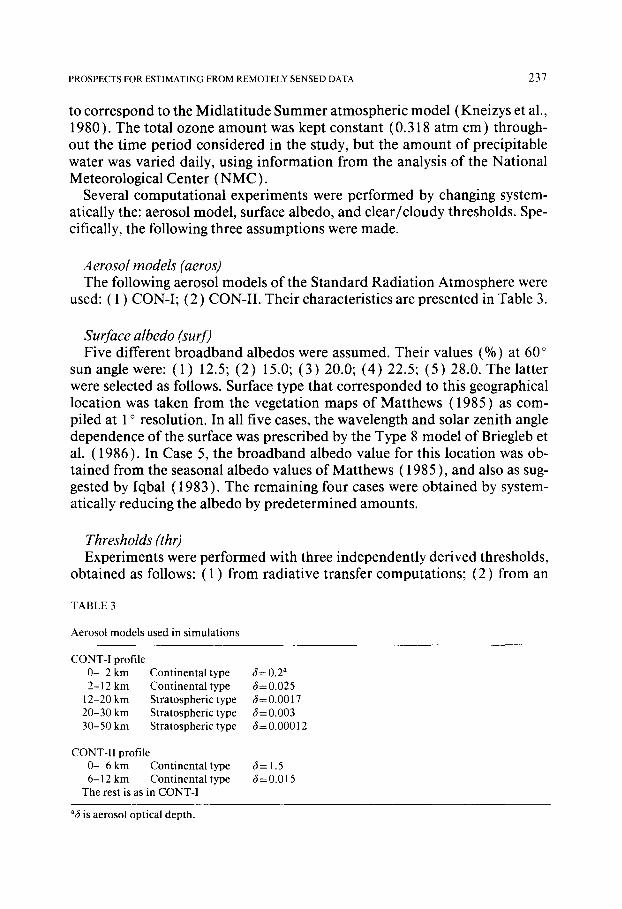
TABLE 2
Same as Table 1 for: (A) each of 7 months in 1986; (B) for 3 months combined; and (C) for 7 months combined a
a b c d CC SD N Year/Month
(A) Each month 7.776 17.021 0.566 0.542 99.15 0.28 145 1986/Jun 6.876 17.809 0.593 2.907 96.11 0.55 111 1986/Jul 8.424 17.427 1.144 1.830 94.44 0.78 114 1986/Aug 5.634 20.683 0.578 3.614 92.63 1.05 127 1986/Sep 4.740 23.969 -0 .161 3.797 96.57 0.65 108 1986/Oct 6.930 22.788 0.865 1.704 96.55 0.46 77 1986/Nov 8.429 19.413 5.967 - 4 . 6 2 2 93.36 0.40 59 1986/Dec
( B ) Three months combined 7.746 17.241 0.945 1.763 94.00 0.76 337 1986/Jun, Jul, Aug 8.077 19.460 21049 0.357 93.95 0.84 250 1986/Sep, Oct, Nov
(C) Seven months combined 11.077 14.206 2.220 - 0 . 3 2 2 92.16 0.88 654 1986/Jun-Dec
aARIZONA (33°43 'N; 112°02'W), 1986 Y = a + b * X 1 + c * X 2 + d * X 3
strategic locations, and therefore, data for 1986 are not uniform in quality. For instance, during 19 June-9 July 1986, the satellite was moved from 108 ° W to 98 °W and back to 108 °W during 20 November-26 December. Regression statistics for the background brightness models for 7 months, starting in June 1986, are presented in Table 2. Since it takes time for the satellite to stabilize, we felt that the results for August 1986 might be least reliable. In addition to monthly models, average seasonal models and an 'annual' model were devel- oped. The statistical summaries on the various background brightness models are presented in Table 2.
M O D E L I M P L E M E N T A T I O N
Satellite data of the format described in Appendix A, were collected over the Maricopa Agricultural Center (MAC) AZ, located at 33 ° 43'N; 112 ° 02'W. The ground truth, in the form of daily cumulative values of global solar radia- tion for 9 September- 14 October 1986, was provided to us by L.H. Raymond and R.D. Jackson (private communication, 1987). The satellite data were from observations made by GOES-6. The counts were transformed into nar- row-band reflectance using the calibration of Frouin and Gautier ( 1987 ) for GOES-6. The necessary atmospheric inputs for the physical model of Pinker and Laszlo (1989a) were taken from standard atmospheric models. The ver- tical profiles of pressure, temperature, ozone and water vapor were assumed
PROSPECTS FOR ESTIMATING FROM REMOTELY SENSED DATA 237
to correspond to the Midlatitude Summer atmospheric model (Kneizys et al., 1980). The total ozone amount was kept constant (0.318 atm cm) through- out the time period considered in the study, but the amount of precipitable water was varied daily, using information from the analysis of the National Meteorological Center (NMC).
Several computational experiments were performed by changing system- atically the: aerosol model, surface albedo, and clear/cloudy thresholds. Spe- cifically, the following three assumptions were made.
Aerosol models (aeros) The following aerosol models of the Standard Radiation Atmosphere were
used: ( 1 ) CON-I; (2) CON-II. Their characteristics are presented in Table 3.
Surface albedo (surf) Five different broadband albedos were assumed. Their values (%) at 60 °
sun angle were: (1) 12.5; (2) 15.0; (3)20.0; (4)22.5; (5)28.0. The latter were selected as follows. Surface type that corresponded to this geographical location was taken from the vegetation maps of Matthews (1985) as com- piled at 1 ° resolution. In all five cases, the wavelength and solar zenith angle dependence of the surface was prescribed by the Type 8 model of Briegleb et al. (1986). In Case 5, the broadband albedo value for this location was ob- tained from the seasonal albedo values of Matthews ( 1985 ), and also as sug- gested by Iqbal (1983). The remaining four cases were obtained by system- atically reducing the albedo by predetermined amounts.
Thresholds (thr) Experiments were performed with three independently derived thresholds,
obtained as follows: ( 1 ) from radiative transfer computations; (2) from an
TABLE3
Aerosol models used in simulations
CONT-I profile 0- 2 km Continental type 6= 0.2 a 2-12 km Continental type 6=0.025
12-20 km Stratospheric type 6 = 0.0017 20-30 km Stratospheric type 6= 0.003 30-50 km Stratospheric type 6= 0.00012
CONT-II profile 0- 6 km Continental type 6= 1.5 6-12 km Continental type 6=0.015
The rest is as in CONT-I
a6 is aerosol optical depth.
238 R.T. P I N K E R A N D 1. LASZLO
average background brightness equation (BBE); ( 3 ) from a BBE as obtained for each month independently. In Case 1, the thresholds were based on values of planetary broadband albedos as derived from the radiative transfer com- ponent of the Pinker and Laszlo (1989a) insolation model, using different assumptions about the atmospheric aerosols and surface albedos. In Cases 2 and 3, the thresholds for each s.z. angle and r.a. were determined from the planetary background brightness models, once, using an average BBE based on 7 months of data, and once, using a specific BBE derived for each month (see Table 2 ).
RESULTS
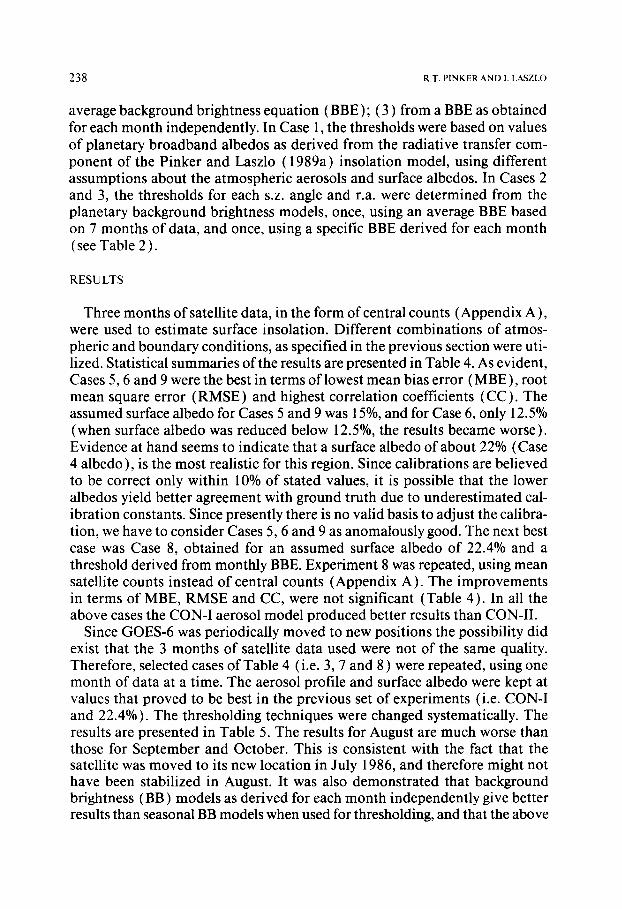
Three months of satellite data, in the form of central counts (Appendix A), were used to estimate surface insolation. Different combinations of atmos- pheric and boundary conditions, as specified in the previous section were uti- lized. Statistical summaries of the results are presented in Table 4. As evident, Cases 5, 6 and 9 were the best in terms of lowest mean bias error (MBE), root mean square error (RMSE) and highest correlation coefficients (CC). The assumed surface albedo for Cases 5 and 9 was 15%, and for Case 6, only 12.5% (when surface albedo was reduced below 12.5%, the results became worse). Evidence at hand seems to indicate that a surface albedo of about 22% (Case 4 albedo ), is the most realistic for this region. Since calibrations are believed to be correct only within 10% of stated values, it is possible that the lower albedos yield better agreement with ground truth due to underest imated cal- ibration constants. Since presently there is no valid basis to adjust the calibra- tion, we have to consider Cases 5, 6 and 9 as anomalously good. The next best case was Case 8, obtained for an assumed surface albedo of 22.4% and a threshold derived from monthly BBE. Experiment 8 was repeated, using mean satellite counts instead of central counts (Appendix A). The improvements in terms of MBE, RMSE and CC, were not significant (Table 4). In all the above cases the CON-I aerosol model produced better results than CON-II.
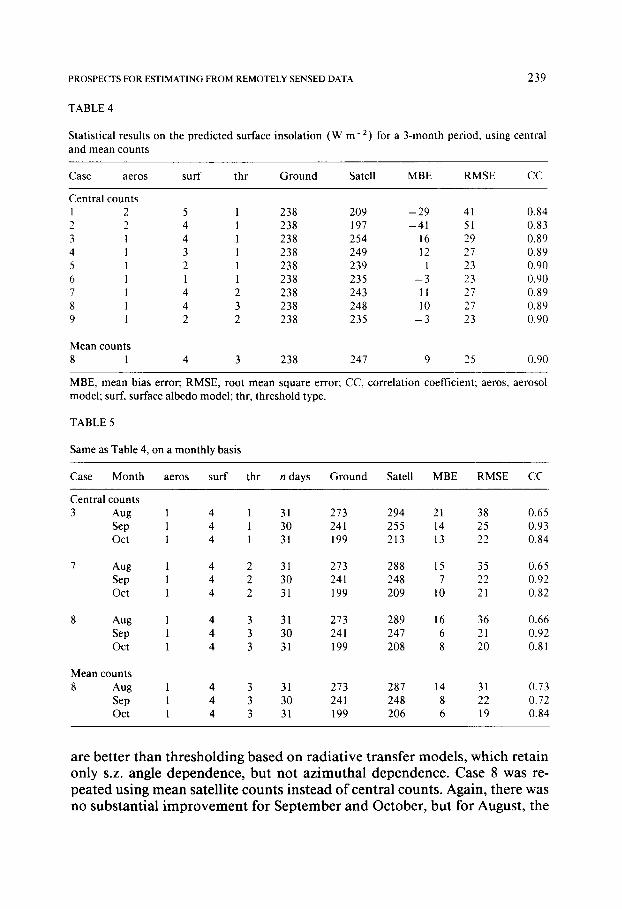
Since GOES-6 was periodically moved to new positions the possibility did exist that the 3 months of satellite data used were not of the same quality. Therefore, selected cases of Table 4 (i.e. 3, 7 and 8) were repeated, using one month of data at a time. The aerosol profile and surface albedo were kept at values that proved to be best in the previous set of experiments (i.e. CON-I and 22.4%). The thresholding techniques were changed systematically. The results are presented in Table 5. The results for August are much worse than those for September and October. This is consistent with the fact that the satellite was moved to its new location in July 1986, and therefore might not have been stabilized in August. It was also demonstrated that background brightness (BB) models as derived for each month independently give better results than seasonal BB models when used for thresholding, and that the above
PROSPECTS FOR ESTIMATING FROM REMOTELY SENSED DATA 239
TABLE 4
Statistical results on the predicted surface insolation ( W m -2) for a 3-month period, using central and mean counts
Case aeros surf thr Ground Satell MBE RMSE CC
Central counts 1 2 5 1 238 209 - 2 9 41 0.84 2 2 4 1 238 197 - 4 1 51 0.83 3 1 4 1 238 254 16 29 0.89 4 1 3 1 238 249 12 27 0.89 5 1 2 1 238 239 1 23 0.90 6 1 1 1 238 235 - 3 23 0.90 7 1 4 2 238 243 11 27 0.89 8 1 4 3 238 248 10 27 0.89 9 1 2 2 238 235 - 3 23 0.90
Mean counts 8 1 4 3 238 247 9 25 0.90
MBE, mean bias error; RMSE, root mean square error; CC, correlation coefficient; aeros, aerosol model; surf, surface albedo model; thr, threshold type.
TABLE 5
Same as Table 4, on a monthly basis
Case Month aeros surf thr n days Ground Satell MBE RMSE CC
Centralcounts 3 Aug 1 4 1 31 273 294 21 38 0.65
Sep 1 4 1 30 241 255 14 25 0.93 Oct 1 4 1 31 199 213 13 22 0.84
7 Aug 1 4 2 31 273 288 15 35 0.65 Sep 1 4 2 30 241 248 7 22 0.92 Oct 1 4 2 31 199 209 10 21 0.82
8 Aug 1 4 3 31 273 289 16 36 0.66 Sep 1 4 3 30 241 247 6 21 0.92 Oct 1 4 3 31 199 208 8 20 0.81
Mean counts 8 Aug 1 4 3 31 273 287 14 31 0.73
Sep 1 4 3 30 241 248 8 22 0.72 Oct 1 4 3 31 199 206 6 19 0.84
are better than thresholding based on radiative transfer models, which retain only s.z. angle dependence, but not azimuthal dependence. Case 8 was re- peated using mean satellite counts instead of central counts. Again, there was no substantial improvement for September and October, but for August, the
240
800
280
2S0 E
z 2 4 0 9.
~ 220
200
'~ 18o
~< 160
~ 140
R . T . P I N K E R A N D I. L A S Z L O
Maricopa Agr icu l tura l Center , P h o e n i x , A Z
120
100
, , , i I
Surface Albedo: 22,4% - Aerosol Model: CONT-I
M E A N RMSE CC - - SATELLITE - - 247 21 0.92
' ' I ~ I I I i I I i I i ' I i I I ' ' I i i
1
- SURFACE . . . . . 241 8 0 ] 1 ' I I I I I I I I I I l l I I I J l I I I I J I I
244 247 250 253 256 259 262 265 268 271 274
DAY OF YEAR (JULIAN)
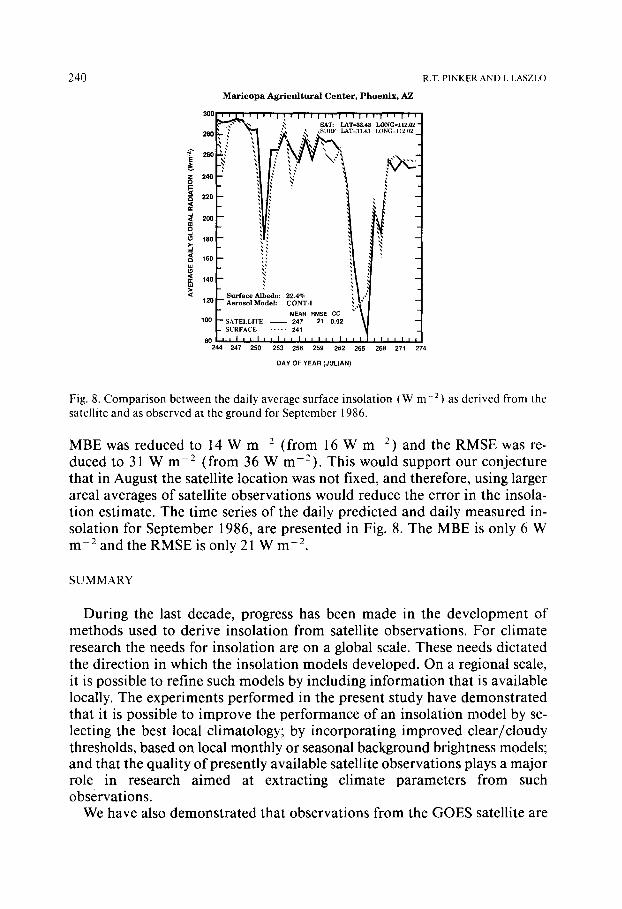
Fig. 8. Comparison between the daily average surface insolation (W m-2) as derived from the satellite and as observed at the ground for September 1986.
MBE was reduced to 14 W m - 2 (from 16 W m - 2 ) and the RMSE was re- duced to 31 W m -2 (from 36 W m-2) . This would support our conjecture that in August the satellite location was not fixed, and therefore, using larger areal averages of satellite observations would reduce the error in the insola- tion estimate. The time series of the daily predicted and daily measured in- solation for September 1986, are presented in Fig. 8. The MBE is only 6 W m -2 and the RMSE is only 21 W m -2.
SUMMARY
During the last decade, progress has been made in the development of methods used to derive insolation from satellite observations. For climate research the needs for insolation are on a global scale. These needs dictated the direction in which the insolation models developed. On a regional scale, it is possible to refine such models by including information that is available locally. The experiments performed in the present study have demonstrated that it is possible to improve the performance of an insolation model by se- lecting the best local climatology; by incorporating improved clear/cloudy thresholds, based on local monthly or seasonal background brightness models; and that the quality of presently available satellite observations plays a major role in research aimed at extracting climate parameters from such observations.
We have also demonstrated that observations from the GOES satellite are
PROSPECTS FOR ESTIMATING FROM REMOTELY SENSED DATA 241
useful for estimating regional surface albedos and that the availability of fre- quent observations covering a large range of solar s.z. angles and r.a. angles is very important for developing surface models which respond to seasonal changes. An attempt has also been made to 'couple' satellite observations of surface reflectivity with independent ground and aircraft observations and the results have shown a high degree of consistency. We would like to believe that additional attempts of this type would be useful for testing satellite-de- rived estimates of surface insolation.
It has been recognized that in order to estimate regional ET, remotely sensed data should be incorporated into the ET models. Until now, such experiments have utilized remotely estimated surface temperatures, surface albedos, soil moisture, or leaf area index. The key parameter, namely, surface insolation, was generally obtained from ground observations or simple parameterization based on cloud information. In the present study it was demonstrated that satellite methods can provide good estimates of surface insolation, and that it is possible to improve such methods on a regional scale. It seems timely to start developing strategies for incorporating satellite-based estimates of inso- lation into the schemes designed to evaluate regional ET.
ACKNOWLEDGEMENTS
This work was supported by Grant NAG-5-812 from the National Aero- nautics and Space Administration (NASA), Earth Science and Applications Division, Land Processes Branch, and by Grant NAG-5-914 from NASA, Earth Science and Applications Division, Climate Research Program, to the University of Maryland. The experimental satellite data were provided by NOAA/NESDIS under the Cooperative Institute for Climate Studies. Thanks are due to the granting agencies, to Drs. Lee H. Raymond and Ray D. Jack- son, for providing the ground insolation observations, to Dr. Ghassem Asrar for valuable comments, and to Minze V. Chien, for technical assistance.
APPENDIX A
Satellite data used
The satellite data set contains 8 km resolution Visible and Infrared Spin Scan Radiometer (VISSR) pixels from GOES-5 and 6. The VISSR makes measurements in two wavelength regions: an interval in the visible region (0.55-0.75 am) , and one in the thermal infrared window region ( 10.5-12.5 am ). Eleven visible observations and five infrared observations are collected each day for each site. The data are in the form of counts which are dimen- sionless quantities proportional to the square root of the intensity of the as- sociated spectral region. Both the mean count values of 5 × 5 arrays of pixels,
242 R.T. PINKER AND I. LASZLO
and the count values for the center pixel of the array are stored. Each array of pixels covers an area on the surface of about 50 km on a side and is centered at the latitude and longitude of the ground station. The standard deviation of the count of each individual pixel from the mean count of the array of pixels is stored for each observation.
A P P E N D I X B
Estimating surface albedo
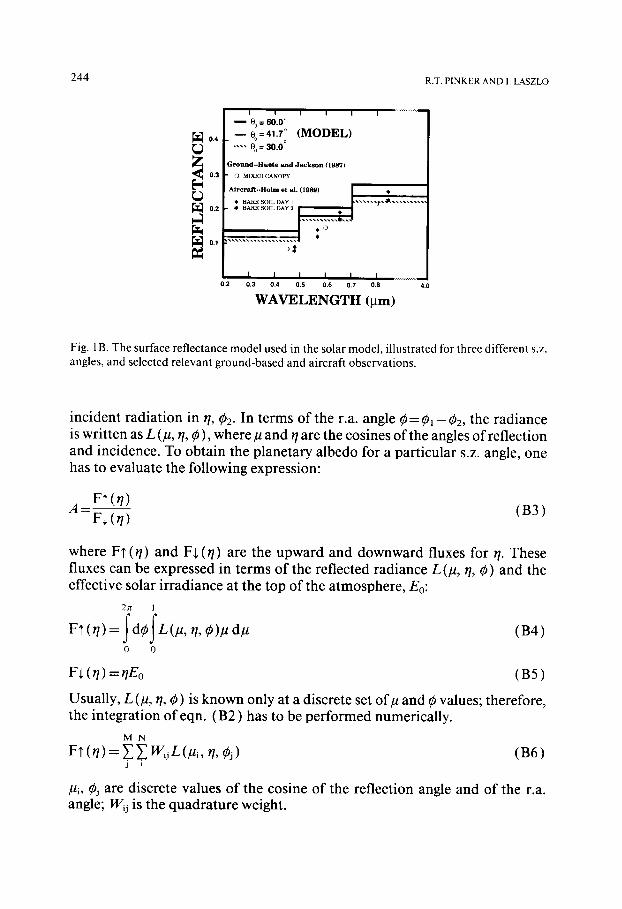
Measurements of surface reflectivity which could be of consequence for modeling on satellite scales, are not available. To synthesize site-specific ob- servations is very difficult because the reflectance varies as a function of wavelength and s.z. angle, differently for each surface type. For instance, Kimes et al. (1980) have found an increase in red and near infrared reflection with decreasing solar zenith angle for lodgepole pine and open meadow, but no definitive trend in grass canopies. Jackson et al. (1979) found that reflec- tance will change slowly with s.z. angle for bare soil and dense canopies, but for incomplete canopies with row structure, spectral reflectance will be strongly dependent on s.z. and azimuth angles. Yet, the step from detailed observa- tions to generalization must be taken, when modeling on regional scale. In what follows we will outline an approach to do so, and demonstrate that the value of surface albedo selected in the Results section as optimal (about 22% at s.z. angle of 60 ° ), is in good agreement with independent estimates.
The surface albedo model used The land-albedo models of Briegleb et al. ( 1986 ) were adopted to prescribe
the surface reflectance as a function of the s.z. angle and wavelength. In these models each surface is considered to consist of two types. The albedo of each component is given as a function of the s.z. angle (0); the reflectivity Ro for 0= 60 °; and an empirical parameter d (Dickinson, 1983 );
( l + d ) R (cos0) =Ro( 1 + 2dcos0) (B1)
The models specify Ro for four spectral intervals in the shortwave band with boundaries at 0.2, 0.5, 0.7, 0.85 and 4 #m, as well as the values o f d and the fractions for each component. The reflectance is expressed as:
R(l~o) =fR~ (/to) + ( 1 -jOR2 (/to) (B2)
where/to is the cosine of the s.z. angle, R~ and Re are reflectances of the two components of the surface type, f i s the fraction of the primary component. The above parameters and the surface reflectivities are specified for ten sur- face types. While on the basis of Matthews' ( 1985 ) land-use maps, Model 2B
PROSPECTS FOR ESTIMATING FROM REMOTELY SENSED DATA
TABLE 1B
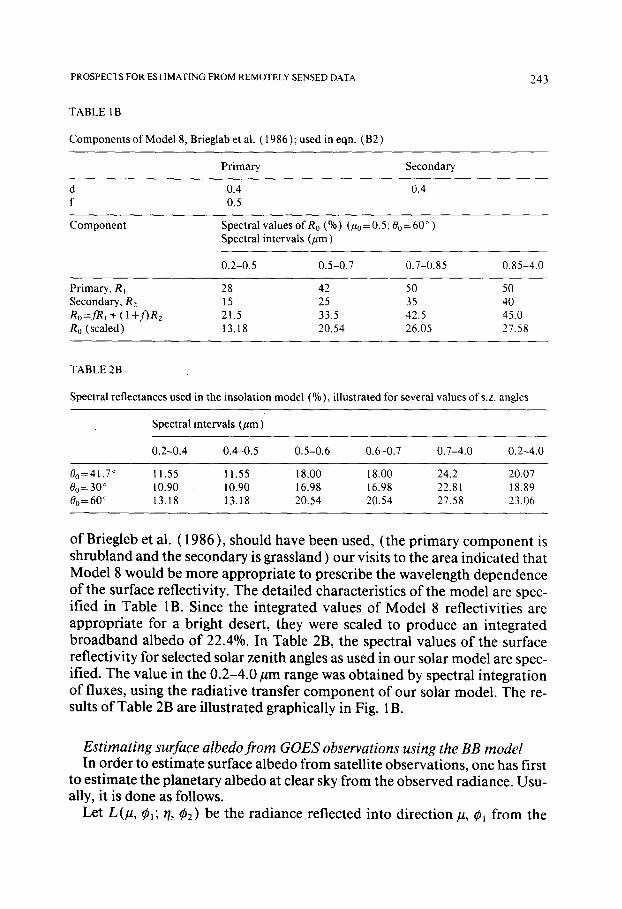
Components of Model 8, Brieglab et al, ( 1986 ); used in eqn. (B2)
243
Primary Secondary
d 0.4 0.4 f 0.5
Component Spectral values of Ro (%) ( ~ = 0 . 5 ; 00=60 ° ) Spectral intervals (#m)
0.2-0.5 0.5-0.7 0.7-0.85 0.85-4.0
Primary, R~ 28 42 50 50 Secondary, Rz 15 25 35 40 Ro =fRl + ( 1 +f)R2 21.5 33.5 42.5 45.0 R0 (scaled) 13.18 20.54 26.05 27.58
TABLE 2B
Spectral reflectances used in the insolation model (%), illustrated for several values of s.z. angles
Spectral intervals (#m)
0.2-0.4 0 . 4 - 0 . 5 0.5-0.6 0.6-0.7 0.7-4.0 0.2-4.0
0o=41.7 ° 11.55 11.55 18.00 18.00 24.2 20.07 0o= 30 ° 10.90 10.90 16.98 16.98 22.81 18.89 0o= 60 ° 13.18 13.18 20.54 20.54 27.58 23.06
of Briegleb et aL (1986), should have been used, (the primary component is shrubland and the secondary is grassland) our visits to the area indicated that Model 8 would be more appropriate to prescribe the wavelength dependence of the surface reflectivity. The detailed characteristics of the model are spec- ified in Table 1B. Since the integrated values of Model 8 reflectivities are appropriate for a bright desert, they were scaled to produce an integrated broadband albedo of 22.4%. In Table 2B, the spectral values of the surface reflectivity for selected solar zenith angles as used in our solar model are spec- ified. The value in the 0.2-4.0 #m range was obtained by spectral integration of fluxes, using the radiative transfer component of our solar model. The re- suits of Table 2B are illustrated graphically in Fig. 1B.
Estimating surface albedo from GOES observations using the BB model In order to estimate surface albedo from satellite observations, one has first
to estimate the planetary albedo at clear sky from the observed radiance. Usu- ally, it is done as follows.
Let L0t, ~ ; r/, q~z) be the radiance reflected into direction #, ~l from the
244 R.T. P I N K E R A N D 1. L A S Z L O
0.4
0.3
I I I I I I
0 ° = 6 0 . 0 °
0 o= 41.7~ (MOD]P]L) .... e. = 30.0
;round--Huete and J a c k s o n (1987)
,0 MIXED CANOPY
AArcraf t . .Holm et aLl. (1989) | •
0,2 • BARE SOIL DAY 2 | • | |
I I I I I [ ........... 0.2 0.3 0.4 0.5 0.6 0.7 0.8 4.0
WAVELENGTH (pm)
Fig. 1B. The surface reflectance model used in the solar model, illustrated for three different s.z. angles, and selected relevant ground-based and aircraft observations.
incident radiation in r/, 02. In terms of the r.a. angle 0= 0~- 0 2 , the radiance is written as L (lt, ~/, ¢), where/t and q are the cosines of the angles of reflection and incidence. To obtain the planetary albedo for a particular s.z. angle, one has to evaluate the following expression:
F? (t/) A = ~ ( r / ) (B3)
where F? (q) and F$ (~/) are the upward and downward fluxes for ~/. These fluxes can be expressed in terms of the reflected radiance L(/x, q, 0) and the effective solar irradiance at the top of the atmosphere, Eo:
2 n 1
V? ( , ) = j d 0 j L (/x, q, 0)P d/l (B4) t ~
0 0
F+0/) =qEo (B5)
Usually, L(/t, ~/, ¢) is known only at a discrete set of~ and ¢ values; therefore, the integration of eqn. (B2) has to be performed numerically.
M N
F? (r/) = 2 2 W~jL (U,, n, 0j) (B6) j 1
Pi, 0j are discrete values of the cosine of the reflection angle and of the r.a. angle; W~j is the quadrature weight.
PROSPECTS FOR ES TIMATING F R O M REMOTELY SENSED DATA 245
Geostationary satellites do not change their positions with respect to a given location on the globe, i.e. there is only one value of the reflection angle, (the satellite zenith angle) for which the radiance is known. Therefore, the inte- gration in eqn. (B4) cannot be carried out. To obtain radiances at other an- gles one can use the BBE and the reciprocity principle.
The BBE is given as:
B(#o, 0) = a+b/to + c ( 1 -/~o2) ~ u + d( 1 --po) -~ v 2 (B7)
where a, b, c and d are constants, #o = cos0 and v = cos0. Using the calibration equation for the satellite detector, one can obtain the radiance, L(#s, ~to, 0) from the count B(#o, 0):
L (/ts,/to, 0 ) = k , + k 2 B2 (flo, 0) (B8)
kt and k 2 are the offset and the gain, respectively. Equation (B8) gives the radiance reflected towards the satellite (at a constant angle of cos-t Ps) for different values of the angle of incidence and of the r.a.
Based on the reciprocity principle, the following relationship exists be- tween the reflected radiance:
L(#, q, ¢ )#=L(q , / t , ¢)r/ (B9)
Equation (B9) states that radiances L(p, q, 0) reflected into direction (/~, 0) from the direction of incident radiation (q, ¢), can be calculated, if L (r/, p, 0) is known.
Substituting eqn. (B9) into eqn. (B4), we have: 2n 1
F, = jaoJL( , , u. o),a (B10) 0 0
Thus, the planetary albedo for s.z. angle t/can be written as: 2n 1
A(t / )_ o o ( B l l ) Eo
L(~7, #, 0) can be obtained from the BBE as given in eqns. (B5) and (B6) for q= #~( =cosine of s.z. angle). Using L(q, #, 0) =L(fls,/~o, 0) in eqn. (B 1 ) the planetary albedo will be given as:
2n 1
A (t/= ¢ts) = _[ dg~_[ L (/t~,/Zo, ~)d#o/Eo (a12) 0 0
Since for geostationary satellites #~ is constant at a given location, only one value of the planetary albedo can be obtained from eqn. (B 12 ). The BBE eqn.
246 R.T. PINKER AND I. LASZLO
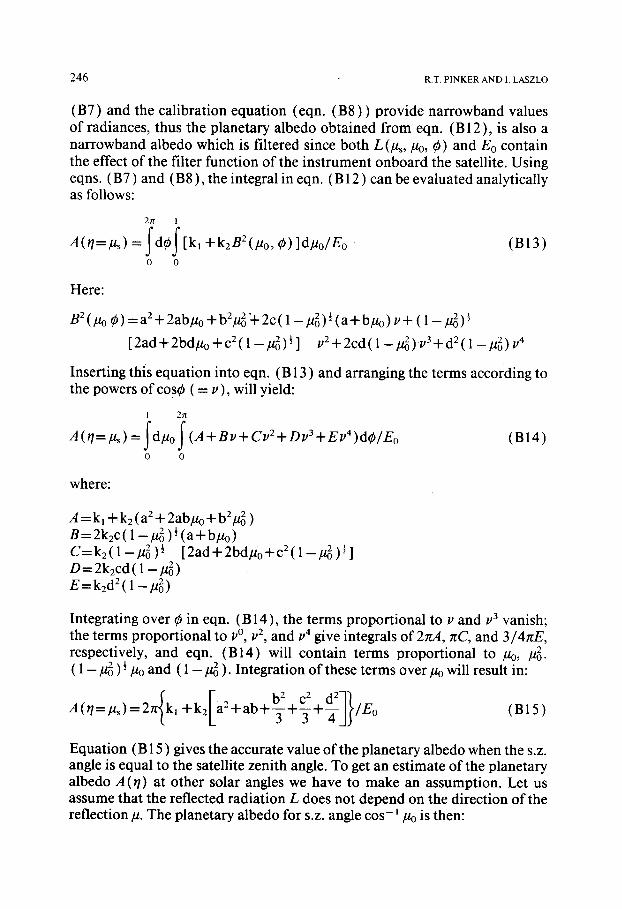
(B7) and the calibration equation (eqn. (B8)) provide narrowband values of radiances, thus the planetary albedo obtained from eqn. (B 12 ), is also a narrowband albedo which is filtered since both L(/~,/Zo, 0) and Eo contain the effect of the filter function of the instrument onboard the satellite. Using eqns. (B7) and (B8), the integral in eqn. (B 12 ) can be evaluated analytically as follows:
2n 1
A (r/=/~) = j'd0j" [k, +k2B2(,ao, 0)]dp, o/Eo • 0 0
(BI3)
Here:
B2 (/~o 0) = a2 + 2ab/to + b2/z~'+ 2c ( 1 --/z~) ½ (a + bp.o) . + ( l -/~)~ 2 i [ 2 a d + 2 b d # o -~- c2 ( 1 - / t6) 2 ] v2 + 2cd( 1 - - fl~)/.'3-1- d2 ( 1 _#2)//4
Inserting this equation into eqn. (B 13 ) and arranging the terms according to the powers of cos0 ( = u), will yield:
1 2n
A (r/=/ts) = jd/lo J (A+ Bu+Cu2+ Du 3 +Ev4)dO/Eo (B14) t Q
0 0
where:
A=kl + k2 (a2 + 2ab/to +b2/~ ) B= 2k2c( 1 - / t 2 )½ (a + b ~ ) C=k2(1-po2) ½ [2ad+2bd#o+C2(1-po2) ½] D = 2k2cd ( 1 - p~ ) E = k2 d2 ( 1 - / to 2)
Integrating over 0 in eqn. (B 14), the terms proportional to v and 113 vanish; the terms proportional to v °, v 2, and 1/4 give integrals of 2m4, nC, and 3~4hE, respectively, and eqn. (B14) will contain terms proportional to /to, /~. ( 1 - / ~ )½/~o and ( 1 - / ~ ). Integration of these terms over lto will result in:
A(q=/ls) =2n{kl F b 2 C 2 d2-]] +k2[a2 +ab+~-+~+~-J~/Eo (B15)
Equation (B 15 ) gives the accurate value of the planetary albedo when the s.z. angle is equal to the satellite zenith angle. To get an estimate of the planetary albedo A (r/) at other solar angles we have to make an assumption. Let us assume that the reflected radiation L does not depend on the direction of the reflection/z. The planetary albedo for s.z. angle cos- 1 lto is then:
PROSPECTS FOR ESTIMATING FROM REMOTELY SENSED DATA 247
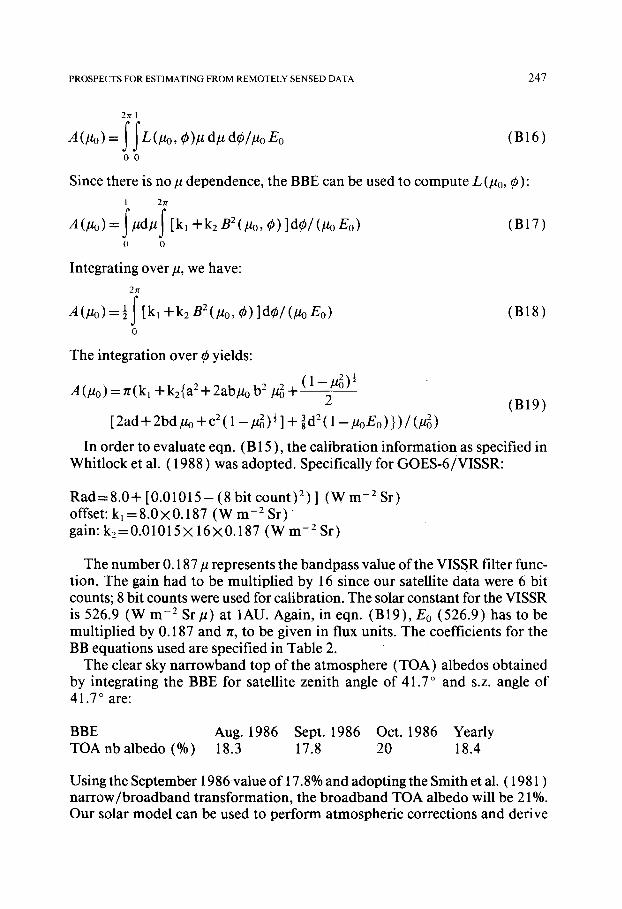
2 h i
A (/Zo) = f f L(p°' O)#d#dO/poEo (B16) O 0
Since there is no # dependence, the BBE can be used to compute L (/to, 0): 1 2r~
A (/~) = ~/td/t f [k~ +k2 B2 (,Uo, 0 ) ] d O / ( ~ E o ) (B17) 0 0
Integrating over p, we have: 2g
A ( ~ ) = ½ f [kl +k2 B2 (/to, 0) ] d O / ( ~ Eo) (B18 ) 0
The integration over 0 yields:
A(,uo)=/t(kt +k2{a2+2abpob 2/#)4 ( 1 - /~ )~ 2 (B19)
[2ad+ 2bd/to +c2(1 - / t2) ½ ] + ]d2(1 -,uoEo)}) / (/~)
In order to evaluate eqn. (B 15 ), the calibration information as specified in Whitlock et al. ( 1988 ) was adopted. Specifically for GOES-6/VISSR:
Rad= 8.0+ [0.01015- (8 bit count) 2) ] (W m -2 Sr) offset: kt =8.0×0.187 (W m -2 S r ) gain: k2=0.01015× 16×0.187 (W m -2 Sr)
The number 0.187 p represents the bandpass value of the VISSR filter func- tion. The gain had to be multiplied by 16 since our satellite data were 6 bit counts; 8 bit counts were used for calibration. The solar constant for the VISSR is 526.9 (W m -2 Sr#) at IAU. Again, in eqn. (B19), Eo (526.9) has to be multiplied by 0.187 and rt, to be given in flux units. The coefficients for the BB equations used are specified in Table 2.
The clear sky narrowband top of the atmosphere (TOA) albedos obtained by integrating the BBE for satellite zenith angle of 41.7 ° and s.z. angle of 41.7 ° are:
BBE Aug. 1986 Sept. 1986 Oct. 1986 Yearly TOA nb albedo (%) 18.3 17.8 20 18.4
Using the September 1986 value of 17.8% and adopting the Smith et al. ( 1981 ) narrow/broadband transformation, the broadband TOA albedo will be 21%. Our solar model can be used to perform atmospheric corrections and derive
248 R.T. P INKER A N D I. LASZLO
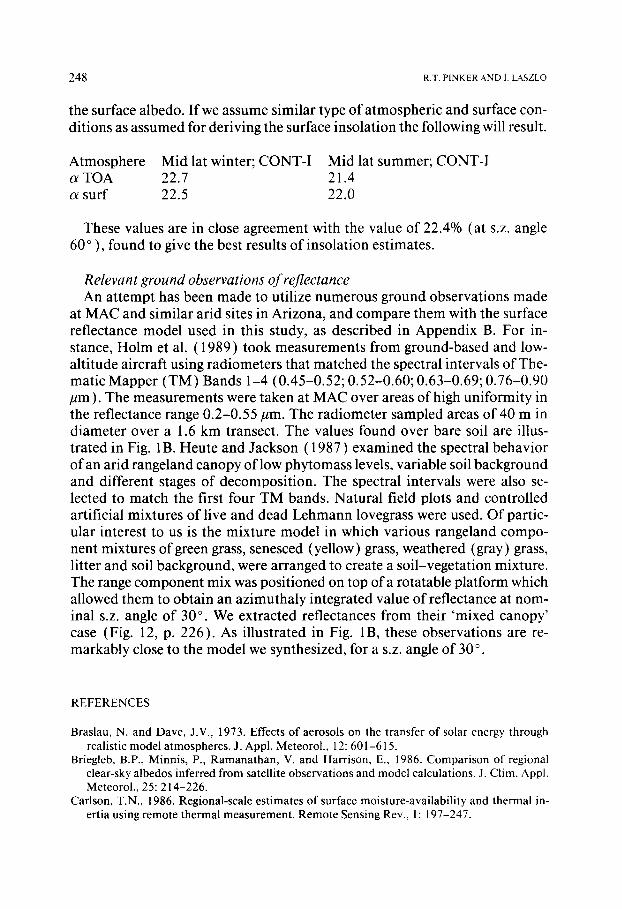
the surface albedo. If we assume similar type of atmospheric and surface con- ditions as assumed for deriving the surface insolation the following will result.
Atmosphere Mid la t winter; CONT-I Mid lat summer; CONT-I o~ TOA 22.7 21.4 ol surf 22.5 22.0
These values are in close agreement with the value of 22.4% (at s.z. angle 60 ° ), found to give the best results of insolation estimates.
Relevant ground observations of reflectance An attempt has been made to utilize numerous ground observations made
at MAC and similar arid sites in Arizona, and compare them with the surface reflectance model used in this study, as described in Appendix B. For in- stance, Holm et al. (1989) took measurements from ground-based and low- altitude aircraft using radiometers that matched the spectral intervals of The- matic Mapper (TM) Bands 1-4 (0.45-0.52; 0.52-0.60; 0.63-0.69; 0.76-0.90 /lm ). The measurements were taken at MAC over areas of high uniformity in the reflectance range 0.2-0.55/~m. The radiometer sampled areas of 40 m in diameter over a 1.6 km transect. The values found over bare soil are illus- trated in Fig. lB. Heute and Jackson (1987) examined the spectral behavior of an arid rangeland canopy of low phytomass levels, variable soil background and different stages of decomposition. The spectral intervals were also se- lected to match the first four TM bands. Natural field plots and controlled artificial mixtures of live and dead Lehmann lovegrass were used. Of partic- ular interest to us is the mixture model in which various rangeland compo- nent mixtures of green grass, senesced (yellow) grass, weathered (gray) grass, litter and soil background, were arranged to create a soil-vegetation mixture. The range component mix was positioned on top of a rotatable platform which allowed them to obtain an azimuthaly integrated value of reflectance at nom- inal s.z. angle of 30 °. We extracted reflectances from their 'mixed canopy' case (Fig. 12, p. 226). As illustrated in Fig. IB, these observations are re- markably close to the model we synthesized, for a s.z. angle of 30 °.
REFERENCES
Braslau, N. and Dave, J.V., 1973. Effects of aerosols on the transfer of solar energy through realistic model atmospheres. J. Appl. Meteorol., 12: 601-615.
Briegleb, B.P., Minnis, P., Ramanathan, V. and Harrison, E., 1986. Comparison of regional clear-sky albedos inferred from satellite observations and model calculations. J. Clim. Appl. Meteorol., 25:214-226.
Carlson, T.N., 1986. Regional-scale estimates of surface moisture-availability and thermal in- ertia using remote thermal measurement. Remote Sensing Rev., 1:197-247.
PROSPECTS FOR ESTIMATING FROM REMOTELY SENSED DATA 249
Clothier, B.E., Clawson, K.L., Pinter Jr., P.J., Moran, M.S., Reginato, R.J. and Jackson, R.D., 1986. Estimation of soil heat flux from net radiation during the growth of alfalfa. Agric. For. Meteorol., 37:319-329.
Darnell, W.L., Staylor, W., Gupta, S.K. and Denn, F.M., 1988. Estimation of surface insolation using sun-synchronous satellite data. J. Clim., 820-835.
DeBruin, H.A.R. and Holstag, A.A.M., 1982. A simple parameterization of the surface fluxes of sensible and latent heat during daytime compared with the Penman-Monteith Concept. J. Appl. Meteoroh, 21: 1610-1621.
Dedieu, G., Deschamps, P.Y. and Kerr, Y.H., 1987. Satellite estimation of solar irradiance at the surface of the earth and of surface albedo using a physical model applied to Meteosat data. J. Clim. Appl. Meteorol., 26: 79-87.
Diak, G.R. and Gautier, C., 1983. Improvements to a simple physical model for estimating insolation from GOES data. J. Clim. Appl. Meteorol., 22: 505-508.
Dickinson, R.E., 1983. Land surface processes and climate-surface albedo and energy balance. Adv. Geophys., 25: 305-365.
Federer, C.A., 1968. Spatial variation of net radiation, albedo and surface temperature of for- ests. J. Appl. Meteorol., 7: 789-795.
Fritschen, L.J., 1967. Net and solar-radiation relations over irrigated field crops. Agric. Mete- orol., 4: 55-62.
Frouin, R. and Gautier, G., 1987. Calibration of NOAA-7 AVHRR GOES-5 and GOES-6 VISSR/ VAS solar channels. Remote Sensing Environ., 22:73-101.
Hanson, K.J., Vonder Haar, T.H. and Suomi, V.E., 1967. Reflection of sunlight to space and absorption by the earth and atmosphere over the United States during spring 1962. Mon. Weather Rev., 104: 168-179.
Holm, R.G., Jackson, R.D., Benfah Yuan, Moran, M.S., Slater, P.N. and Biggar, S.F., 1989. Surface reflectance factor retrieval from Thematic Mapper Data. Remote Sensing Environ., 27: 47-57.
Huete, A.R. and Jackson, R.D., 1987. Suitability of spectral indices for evaluating vegetation characteristics on arid rangelands. Remote Sensing Environ., 23:213-232.
Iqbal, M., 1983. An Introduction to Solar Radiation. Academic Press, 390 pp. Jackson, R.D., 1984. Total reflected solar radiation calculated from multiband sensor data. Agric.
For. Meteorol., 33: 163-175. Jackson, R.D., Pinter Jr., P.J., Idso, S.B. and Reginato, R.J., 1979. Wheat spectral reflectance:
interactions between crop configuration, sun elevation, and azimuth angle. Appl. Optics., 18: 3730.
Jackson, R.D., Hatfield, J.L., Reginator, R.J., Idso, S.B. and Pinter Jr., P.J., 1983. Estimation of daily evapotranspiration from one time-of-day measurements. Agric. Water Manage., 5: 351-362.
Jackson, R.D., Pinter Jr., P.J. and Reginato, R.J., 1985. Net radiation calculated from remote multi-spectral and ground station meteorological data. Agric. For. Meteorol., 35:153-164.
Jackson, R.D., Moran, M.S., Gay, L.W. and Raymond, L.H., 1987. Evaluating evaporation from field crops using airborne radiometry and ground-based meteorological data. Irrig. Sci., 8: 81-90.
Joseph, J.H., Wiscombe, W.J. and Weinman, J.A., 1976. The delta-Eddington approximation for radiative transfer. J. Atmos. Sci., 33: 2452-2459.
Kanemasu, E.T., Heilman, J.L., Bagley, J.O. and Powers, W.L., 1977. Environmental Manage- ment. Springer-Verlag, New York, NY, Vol. 1, No. 6, pp. 515-520.
Kimes, D.S., Smith, J.A. and Ranson, K.J., 1980. Vegetation reflectance measurements as a function of solar zenith angle. Photogramm. Eng. Remote Sensing, 46:1563-1573.
Kneizys, F., Shette, E., Gallery, W., Chetwynd, J., Abreu, L., Selby, J., Fenn, R. and Mc-
250 R.T. PINKER AND I. LASZLO
Clatchey, R., 1980. Atmospheric transmittance/radiance: Computer code LOWTRAN5. Rep. AFGL-TR-80-67, Air Force Geophysics Laboratory, Hanscom AFB, MA, 127 pp.
Lacis, A.A. and Hansen, J.E., 1974. A parameterization for the absorption of solar radiation in the earth's atmosphere. J. Atmos. Sci., 31: 118-133.
Laszlo, I. and Pinker, R.T., 1989. On the optimal use of climatological information in physical models for surface solar radiation from satellites. In: J. Lenoble and J.R. Geleyn (Editors), IRS '88: Current Problems in Atmospheric Radiation. A. Deepak Publishing, 302-305.
Matthews, E., 1985. Atlas of archived vegetation and land use and seasonal albedo data sets. NASA Tech. Mem. G199, February 1985, 54 pp.
Monteith, J.L., 1981. Evaporation and surface temperature. Q. J. R. Meteorol. Soc., 107: 1-27. Monteith, J.L. and Szeicz, G., 1961. The radiation balance of bare soil and vegetation. Q. J. R.
Meteorol. Soc., 87:159-170. Penman, H.L., 1948. Natural evaporation from open water, bare soil and grass. Proc. R. Soc.
London Ser. A, 193: 120-145. Pinker, R.T. and Ewing, J.A., 1985. Modeling surface solar radiation: Model formulation and
validation. J. Climate Appl. Meteorol., 24:389-401. Pinker, R.T. and Ewing, J.A., 1987. Simulation of the GOES VISSR sensor to changing surface
conditions. J. Geophys. Res., 92, D4: 4001-4009. Pinker, R.T. and Laszlo, I., 1989a. A modified insolation model for satellite observations. J.
Appl. Meteorol., in press. Pinker, R.T. and Laszlo, I., 1989b. Derivation of surface solar radiation on a continental scale
with ISCCP B3 data. In: J. Lenoble and J.R. Geleyn (Editors), IRS '88: Current Problems in Atmospheric Radiation. A. Deepak Publishing, pp. 272-274.
Price, J.C., 1982. On the use of satellite data to infer surface fluxes at meteorological scales. J. Appl. Meteorol., 21:1111-1122.
Price, J.C., 1983. Estimating surface temperatures from satellite thermal infrared data - simple formulation for the atmospheric effect. Remote Sensing Environ., 13:353-361.
Priestly, C.H.B. and Taylor, R.J., 1972. On the assessment of surface heat flux and evaporation using large-scale parameters. Mon. Weather Rev., 106:81-92.
Raphael, C. and Hay, J.E., 1984. An assessment of models which use satellite data to estimate solar irradiance at the earth's surface. J. Clin. Appl. Meteorol., 23: 832-844.
Reginato, R.J., Jackson, R.D. and Pinter, Jr., P.J., 1985. Evapotranspiration calculated from remote multi-spectral and ground station meteorological data. Remote Sensing Environ., 18: 75-89.
Rosenberg, N.J., Blad, B.L. and Verma, S.B., 1983. Microclimate: The Biological Environment. Wiley-Interscience Publication, 495 pp.
Schiffer, R.A. and Rossow, W.B., 1985. ISCCP global radiance data set: A new resource for climate research. Bull. Am. Meteorol. Soc., 66:1498-1503.
Schmetz, J., 1989. Towards a surface radiation climatology: Retrieval of downward irradiances from satellites. In: J. Lenoble and J.G. Geleyn (Editors), IRS '88: Current Problems in At- mospheric Radiation. A. Deepak Publishing, pp. 265-268.
Smith, W.L., Herman, L.D., Schreiner, T., Howell, H.B. and Menzel, P., 1981. Radiation budget characteristics of the onset of the summer monsoon. International Conference Early Results of FGGE and Large-Scale Aspects of its Monsoon Experiments, IAMAP/WMO/AMS, Tal- lahasse, FL, session 6, 16-26.
Tarpley, J.D., 1979. Estimating incident solar radiation at the surface from geostationary sat- ellite data. J. Appl. Meteorol., 18:1172-1181.
Suttles, J.T. and Ohring, G., (Editors), 1986. Report of the Workshop on Surface Radiation Budget for Climate Applications. Columbia, MD, 18-21 June. WCP-115, (WMO/TD-No. 109), 144 pp.
Whitlock, C.H., Staylor, W.F., Smith, G., Levin, R., Frouin, R., Gautier, C., Teillet, P.M., Sla-

PROSPECTS FOR ESTIMATING FROM REMOTELY SENSED DATA 251
ter, P.N., Kaufman, Y.J., Holben, B.N., Rossow, W.B., Brest, C. and LeCroy, S.R., 1988. AVHRR and VISSR Satellite instrument calibration results for both cirrus and marine stra- tocumulus IFO periods. FIRE Science Team Meeting, Vail, Colorado, 1 l - 15 July 1988.
Related Documents