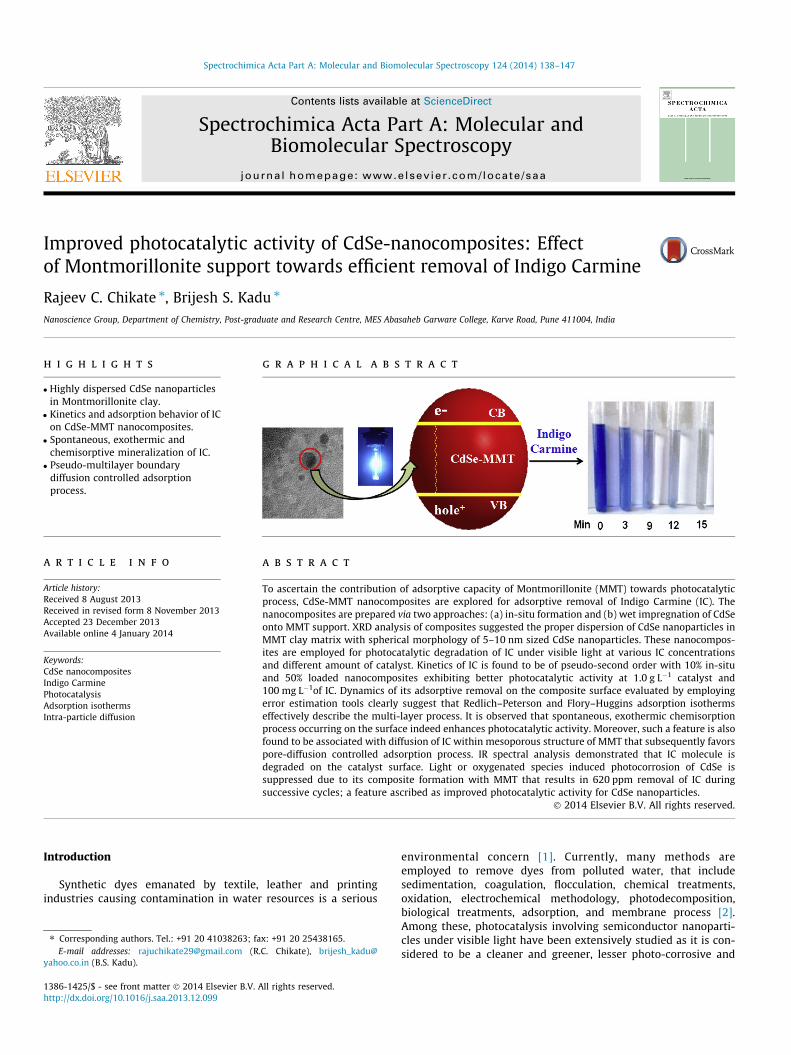
Improved photocatalytic activity of CdSe-nanocomposites: Effect of Montmorillonite support towards efficient removal of Indigo Carmine Rajeev C. Chikate ⇑ , Brijesh S. Kadu ⇑ Nanoscience Group, Department of Chemistry, Post-graduate and Research Centre, MES Abasaheb Garware College, Karve Road, Pune 411004, India highlights Highly dispersed CdSe nanoparticles in Montmorillonite clay. Kinetics and adsorption behavior of IC on CdSe-MMT nanocomposites. Spontaneous, exothermic and chemisorptive mineralization of IC. Pseudo-multilayer boundary diffusion controlled adsorption process. graphical abstract article info Article history: Received 8 August 2013 Received in revised form 8 November 2013 Accepted 23 December 2013 Available online 4 January 2014 Keywords: CdSe nanocomposites Indigo Carmine Photocatalysis Adsorption isotherms Intra-particle diffusion abstract To ascertain the contribution of adsorptive capacity of Montmorillonite (MMT) towards photocatalytic process, CdSe-MMT nanocomposites are explored for adsorptive removal of Indigo Carmine (IC). The nanocomposites are prepared via two approaches: (a) in-situ formation and (b) wet impregnation of CdSe onto MMT support. XRD analysis of composites suggested the proper dispersion of CdSe nanoparticles in MMT clay matrix with spherical morphology of 5–10 nm sized CdSe nanoparticles. These nanocompos- ites are employed for photocatalytic degradation of IC under visible light at various IC concentrations and different amount of catalyst. Kinetics of IC is found to be of pseudo-second order with 10% in-situ and 50% loaded nanocomposites exhibiting better photocatalytic activity at 1.0 g L 1 catalyst and 100 mg L 1 of IC. Dynamics of its adsorptive removal on the composite surface evaluated by employing error estimation tools clearly suggest that Redlich–Peterson and Flory–Huggins adsorption isotherms effectively describe the multi-layer process. It is observed that spontaneous, exothermic chemisorption process occurring on the surface indeed enhances photocatalytic activity. Moreover, such a feature is also found to be associated with diffusion of IC within mesoporous structure of MMT that subsequently favors pore-diffusion controlled adsorption process. IR spectral analysis demonstrated that IC molecule is degraded on the catalyst surface. Light or oxygenated species induced photocorrosion of CdSe is suppressed due to its composite formation with MMT that results in 620 ppm removal of IC during successive cycles; a feature ascribed as improved photocatalytic activity for CdSe nanoparticles. Ó 2014 Elsevier B.V. All rights reserved. Introduction Synthetic dyes emanated by textile, leather and printing industries causing contamination in water resources is a serious environmental concern [1]. Currently, many methods are employed to remove dyes from polluted water, that include sedimentation, coagulation, flocculation, chemical treatments, oxidation, electrochemical methodology, photodecomposition, biological treatments, adsorption, and membrane process [2]. Among these, photocatalysis involving semiconductor nanoparti- cles under visible light have been extensively studied as it is con- sidered to be a cleaner and greener, lesser photo-corrosive and 1386-1425/$ - see front matter Ó 2014 Elsevier B.V. All rights reserved. http://dx.doi.org/10.1016/j.saa.2013.12.099 ⇑ Corresponding authors. Tel.: +91 20 41038263; fax: +91 20 25438165. E-mail addresses: [email protected] (R.C. Chikate), brijesh_kadu@ yahoo.co.in (B.S. Kadu). Spectrochimica Acta Part A: Molecular and Biomolecular Spectroscopy 124 (2014) 138–147 Contents lists available at ScienceDirect Spectrochimica Acta Part A: Molecular and Biomolecular Spectroscopy journal homepage: www.elsevier.com/locate/saa

Welcome message from author
This document is posted to help you gain knowledge. Please leave a comment to let me know what you think about it! Share it to your friends and learn new things together.
Transcript
Spectrochimica Acta Part A: Molecular and Biomolecular Spectroscopy 124 (2014) 138–147
Contents lists available at ScienceDirect
Spectrochimica Acta Part A: Molecular andBiomolecular Spectroscopy
journal homepage: www.elsevier .com/locate /saa
Improved photocatalytic activity of CdSe-nanocomposites: Effectof Montmorillonite support towards efficient removal of Indigo Carmine
1386-1425/$ - see front matter � 2014 Elsevier B.V. All rights reserved.http://dx.doi.org/10.1016/j.saa.2013.12.099
⇑ Corresponding authors. Tel.: +91 20 41038263; fax: +91 20 25438165.E-mail addresses: [email protected] (R.C. Chikate), brijesh_kadu@
yahoo.co.in (B.S. Kadu).
Rajeev C. Chikate ⇑, Brijesh S. Kadu ⇑Nanoscience Group, Department of Chemistry, Post-graduate and Research Centre, MES Abasaheb Garware College, Karve Road, Pune 411004, India
h i g h l i g h t s
� Highly dispersed CdSe nanoparticlesin Montmorillonite clay.� Kinetics and adsorption behavior of IC
on CdSe-MMT nanocomposites.� Spontaneous, exothermic and
chemisorptive mineralization of IC.� Pseudo-multilayer boundary
diffusion controlled adsorptionprocess.
g r a p h i c a l a b s t r a c t
a r t i c l e i n f o
Article history:Received 8 August 2013Received in revised form 8 November 2013Accepted 23 December 2013Available online 4 January 2014
Keywords:CdSe nanocompositesIndigo CarminePhotocatalysisAdsorption isothermsIntra-particle diffusion
a b s t r a c t
To ascertain the contribution of adsorptive capacity of Montmorillonite (MMT) towards photocatalyticprocess, CdSe-MMT nanocomposites are explored for adsorptive removal of Indigo Carmine (IC). Thenanocomposites are prepared via two approaches: (a) in-situ formation and (b) wet impregnation of CdSeonto MMT support. XRD analysis of composites suggested the proper dispersion of CdSe nanoparticles inMMT clay matrix with spherical morphology of 5–10 nm sized CdSe nanoparticles. These nanocompos-ites are employed for photocatalytic degradation of IC under visible light at various IC concentrationsand different amount of catalyst. Kinetics of IC is found to be of pseudo-second order with 10% in-situand 50% loaded nanocomposites exhibiting better photocatalytic activity at 1.0 g L�1 catalyst and100 mg L�1of IC. Dynamics of its adsorptive removal on the composite surface evaluated by employingerror estimation tools clearly suggest that Redlich–Peterson and Flory–Huggins adsorption isothermseffectively describe the multi-layer process. It is observed that spontaneous, exothermic chemisorptionprocess occurring on the surface indeed enhances photocatalytic activity. Moreover, such a feature is alsofound to be associated with diffusion of IC within mesoporous structure of MMT that subsequently favorspore-diffusion controlled adsorption process. IR spectral analysis demonstrated that IC molecule isdegraded on the catalyst surface. Light or oxygenated species induced photocorrosion of CdSe issuppressed due to its composite formation with MMT that results in 620 ppm removal of IC duringsuccessive cycles; a feature ascribed as improved photocatalytic activity for CdSe nanoparticles.
� 2014 Elsevier B.V. All rights reserved.
Introduction
Synthetic dyes emanated by textile, leather and printingindustries causing contamination in water resources is a serious
environmental concern [1]. Currently, many methods areemployed to remove dyes from polluted water, that includesedimentation, coagulation, flocculation, chemical treatments,oxidation, electrochemical methodology, photodecomposition,biological treatments, adsorption, and membrane process [2].Among these, photocatalysis involving semiconductor nanoparti-cles under visible light have been extensively studied as it is con-sidered to be a cleaner and greener, lesser photo-corrosive and
R.C. Chikate, B.S. Kadu / Spectrochimica Acta Part A: Molecular and Biomolecular Spectroscopy 124 (2014) 138–147 139
therefore, is thought to be sustainable approach towards removalof variety of aquatic pollutants [3]. In recent past, differentstrategies are formulated towards enhancing their photocatalyticactivity that include the surface modifications, doping of transitionor non-transition metals ions and the immobilization of nanoparti-cles on to a solid support [4–6].
CdSe, an n-type semiconductor having band gap in the visiblelight (1.65–1.8 eV) [7–9], has received wide applications in labeling[10], sensors [11], optometric devices [12], solar cells [8,13] andphotocatalysis [7]. Although it has extensively been employed forbiological applications, its immobilization onto a solid supportfor photocatalytic applications is by and large has been less ex-plored. It is interesting to note that CdTe nanoparticles [14] andCd(OH)2 nanowires [15]; both supported on activated carbon hasrecently been employed as an adsorbent for removal of dyes fromaqueous medium. Clay minerals; a class of inorganic layeredcompounds is commonly available, robust and photochemically in-ert material that can be tailored into variety of functional solidadsorbents due to their flexibility in composition, structure andbeneficial adsorption capacities [16]. Clays and organically modi-fied clays are good adsorbents for removal of organic dyes fromwaste water [17,18]. Thus, it is imperative to develop a simpleand ingenious approach by combing its features with semiconduct-ing nanoparticles that may result in engineering the ‘‘designer pho-tocatalyst’’ towards green and sustainable technologies.
MMT has quite often been used as an adsorbent for dyes andpigments because of stronger cation exchange capacity and pres-ence of active surface sites [19]. Considering these facets, twosynthetic strategies are adopted for the synthesis of CdSe-nanocomposites: (a) in-situ formation of CdSe dispersed in theMMT structure and (b) wet impregnation of preformed CdSe onto the MMT surface. Such an approach has two advantages: (i)it will differentiate the effectiveness of CdSe and (ii) alterationin adsorption behavior may lead to changes in reaction rates ofphotochemical process. The major impetus for the present workis to establish the effective adsorption of IC through photochem-ical process occurring on the catalyst surface that possess reactivesites generated by adopting two synthetic approaches for CdSe-MMT nanocomposites. Since the physical and catalytic propertiesof these two types of photocatalysts are thought to be different,we envisage that their adsorption capacity shall be dissimilar asa consequence of alternations and modifications in the MMTmatrix. These concepts are systematically investigated withIndigo Carmine (IC) (Supplementary data; Fig. S1) by employingdifferent adsorption isotherms like Langmuir, Freundlich as wellas Redlich–Peterson, Dubinin–Radushkevich, Temkin and Flory–Huggins. Since adsorption phenomenon is manifested throughdiffusion controlled mechanisms, intra-particles diffusion modelslike Webber–Morris and Boyd plots are also evaluated to under-stand the diffusion process expected for nanocomposite-dyeinteractions.
In the present work, visible light induced adsorptive removalcapacity of CdSe-MMT nanocomposites is evaluated to understandthe role of MMT on photo-adsorption and the dynamics of removalprocess for IC molecule.
Experimental
Chemicals
The following compounds are used as received: IC (Hi-MediaChemicals, UK) Cadmium acetate (Cd(OAc)2�2H2O), Loba Chemie,UK), Selenium powder (Loba Chemie, UK), Ethylene glycol (LobaChemie, UK), Montmorillonite K-10 (Fluka) Sodium borohydride(NaBH4, Loba Chemie, UK), and Sodium chloride (NaCl, Loba
Chemie, UK). All the chemicals were of analytical grade and areused as received. Deionized water is used throughout theexperiments.
Preparation of modified Montmorillonite (MMT)
MMT treated with excess 1 M NaCl solution is stirred for 24 h,filtered and then dried at 50 �C. The powder obtained is dispersedin distilled water to prepare the colloidal suspension of clay parti-cles which is filtered, washed with Milli-Q water and acetone andfinally dried under vacuum.
Synthesis of Cadmium selenide (CdSe NP’s)
0.395 moles of NaBH4 is added to 0.495 moles of Se in 20 mLwater, so as to obtain wine red colored solution of sodium hydro-gen selenide (NaHSe). In other flask, aqueous solution of cadmiumacetate (0.488 moles) is mixed with 10 mL ethylene glycol. To this,solution of NaHSe is added drop wise under constant stirring at40 �C and the resulting mixture is kept under stirring for 1 h. Red-dish brown product is centrifuged at 3000 rpm, successivelywashed with methanol and then dried under vacuum.
Synthesis of CdSe-MMT nanocomposites
Two synthetic routes are adopted for the synthesis ofcomposites:
Synthesis of CdSe-MMT-insitu nanocompositeTo an aqueous suspension of 0.9 g of MMT in 10 mL water and
10 mL ethylene glycol, 0.13 g of Cd(OAc)2 is added and the mixtureis stirred for 1 h at 40 �C. In another flask, 0.03 g of NaBH4 is addedto 0.078 g of Se and mixture is stirred for 30 min. at 40 �C. Thissolution of NaHSe is added drop-wise to above Cd-solution withconstant stirring and the whole mixture is stirred for 1 h at40 �C. Brown precipitate obtained is centrifuged at 3000 rpm,washed with methanol and dried under vacuum. Such a prepara-tion results in the formation of CdSe-MMT-insitu-10% and similarprocedure is adopted for the synthesis of CdSe-MMT-insitu-25%and CdSe-MMT-insitu-50% nanocomposites with appropriatequantities of reactants.
Synthesis of CdSe-MMT loaded nanocompositesThese composites are prepared by mixing appropriate weight
proportions of MMT and preformed CdSe NP’s in water and thewhole mixture is stirred for 1 h at 40 �C. Brown precipitate ob-tained is centrifuged at 3000 rpm, washed with methanol anddried under vacuum. This procedure generated various nanocom-posites with different compositions such as CdSe-MMT-load-10%,CdSe-MMT-load-25% and CdSe-MMT-load-50%.
Characterization of nanocomposites
X-ray powder diffraction (XRD) patterns are obtained usingPhillips X’pert MPD X-ray diffractometer using Cu Ka radiation.Transmission electron microscope (TEM) images are obtainedusing a JEOL electron microscope (model 1200X) while FT-IR spec-tra are recorded on Perkin–Elmer BX2 model.
Batch adsorption experiments
Stock solution of IC (100 mg L�1) is prepared in Milli-Q waterand adsorption experiments are performed in an open batch sys-tem at room temperature. To a fixed volume of IC solution, appro-priate amount of photocatalyst is added and the entire mixture isexposed to visible light (500 W Xe lamp with a 420 nm cutoff
140 R.C. Chikate, B.S. Kadu / Spectrochimica Acta Part A: Molecular and Biomolecular Spectroscopy 124 (2014) 138–147
filter). Samples are withdrawn at fixed interval, centrifuged at3000 rpm and the absorbance of supernatant is measured in therange of 400–800 nm on UV–VIS spectrophotometer (Perkin Elmer,lambda 25).
Reusability studies
The recycling experiments with nanocomposites are carried outon [IC]ini = 100 mg L�1 with 1 g L�1 nanocomposite. After the com-pletion of 1st cycle, the residue is centrifuged at 3000 rpm, followedby successive washing with water and acetone, dried in vacuumand used for subsequent cycles.
Results and discussion
XRD and TEM analysis of nanocomposites
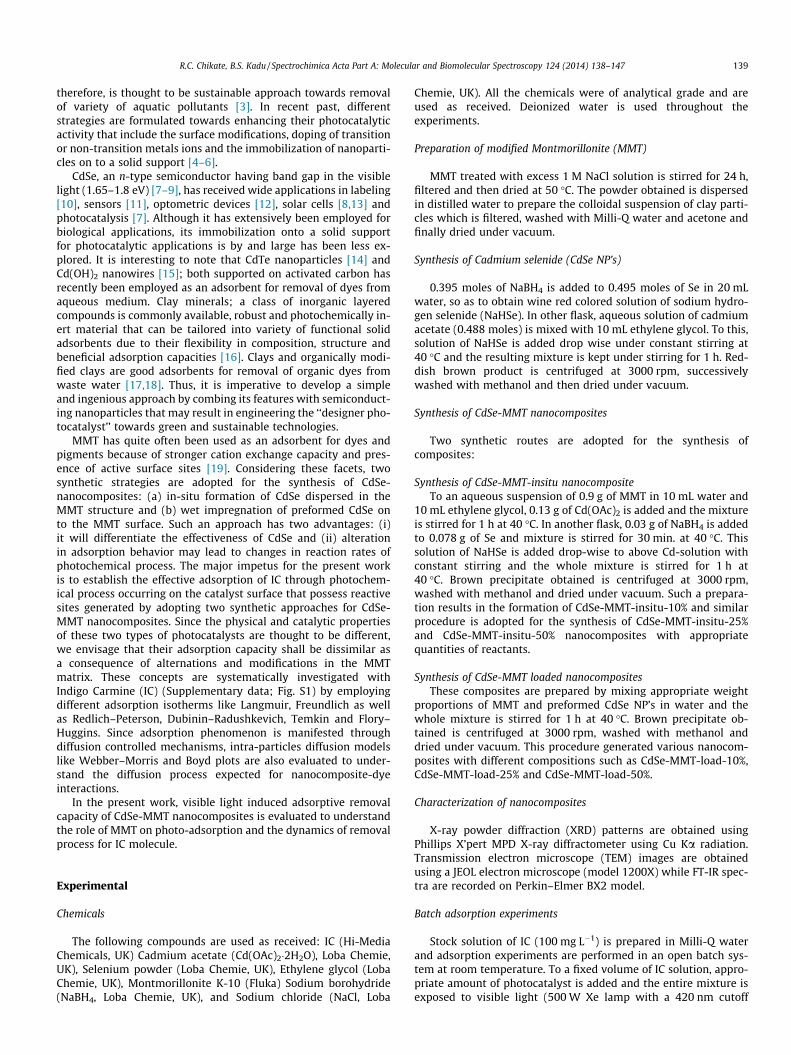
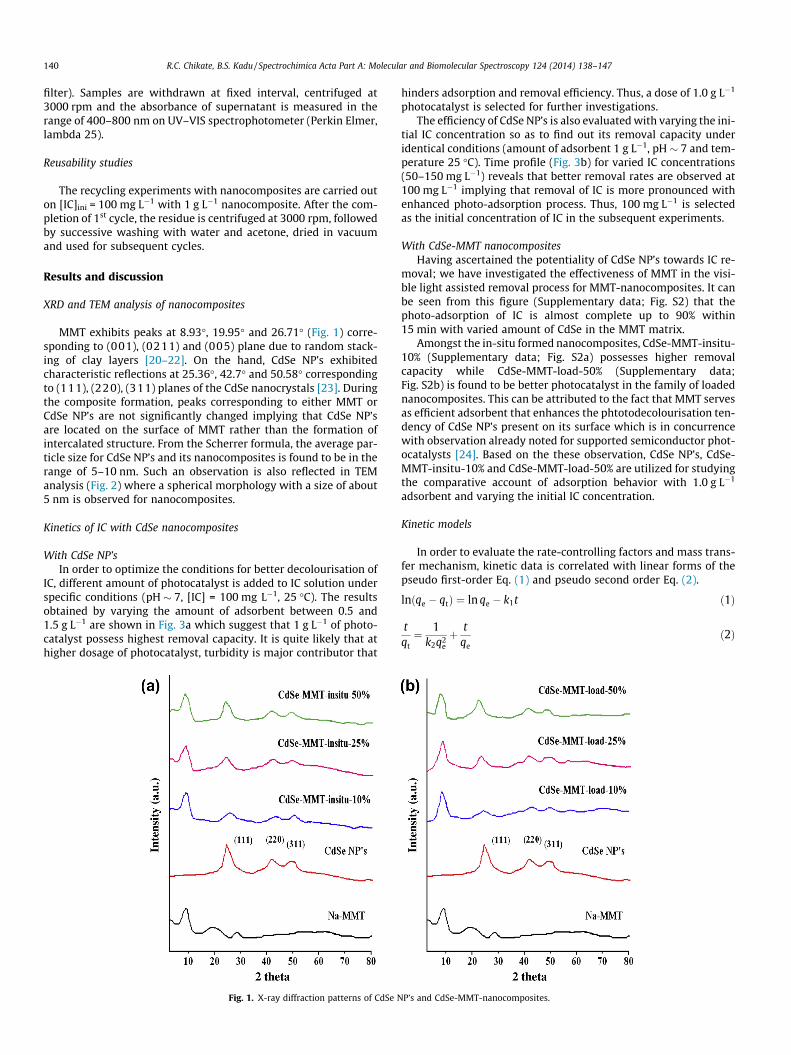
MMT exhibits peaks at 8.93�, 19.95� and 26.71� (Fig. 1) corre-sponding to (001), (0211) and (005) plane due to random stack-ing of clay layers [20–22]. On the hand, CdSe NP’s exhibitedcharacteristic reflections at 25.36�, 42.7� and 50.58� correspondingto (111), (220), (311) planes of the CdSe nanocrystals [23]. Duringthe composite formation, peaks corresponding to either MMT orCdSe NP’s are not significantly changed implying that CdSe NP’sare located on the surface of MMT rather than the formation ofintercalated structure. From the Scherrer formula, the average par-ticle size for CdSe NP’s and its nanocomposites is found to be in therange of 5–10 nm. Such an observation is also reflected in TEManalysis (Fig. 2) where a spherical morphology with a size of about5 nm is observed for nanocomposites.
Kinetics of IC with CdSe nanocomposites
With CdSe NP’sIn order to optimize the conditions for better decolourisation of
IC, different amount of photocatalyst is added to IC solution underspecific conditions (pH � 7, [IC] = 100 mg L�1, 25 �C). The resultsobtained by varying the amount of adsorbent between 0.5 and1.5 g L�1 are shown in Fig. 3a which suggest that 1 g L�1 of photo-catalyst possess highest removal capacity. It is quite likely that athigher dosage of photocatalyst, turbidity is major contributor that
Fig. 1. X-ray diffraction patterns of CdSe N
hinders adsorption and removal efficiency. Thus, a dose of 1.0 g L�1
photocatalyst is selected for further investigations.The efficiency of CdSe NP’s is also evaluated with varying the ini-
tial IC concentration so as to find out its removal capacity underidentical conditions (amount of adsorbent 1 g L�1, pH � 7 and tem-perature 25 �C). Time profile (Fig. 3b) for varied IC concentrations(50–150 mg L�1) reveals that better removal rates are observed at100 mg L�1 implying that removal of IC is more pronounced withenhanced photo-adsorption process. Thus, 100 mg L�1 is selectedas the initial concentration of IC in the subsequent experiments.
With CdSe-MMT nanocompositesHaving ascertained the potentiality of CdSe NP’s towards IC re-
moval; we have investigated the effectiveness of MMT in the visi-ble light assisted removal process for MMT-nanocomposites. It canbe seen from this figure (Supplementary data; Fig. S2) that thephoto-adsorption of IC is almost complete up to 90% within15 min with varied amount of CdSe in the MMT matrix.
Amongst the in-situ formed nanocomposites, CdSe-MMT-insitu-10% (Supplementary data; Fig. S2a) possesses higher removalcapacity while CdSe-MMT-load-50% (Supplementary data;Fig. S2b) is found to be better photocatalyst in the family of loadednanocomposites. This can be attributed to the fact that MMT servesas efficient adsorbent that enhances the phtotodecolourisation ten-dency of CdSe NP’s present on its surface which is in concurrencewith observation already noted for supported semiconductor phot-ocatalysts [24]. Based on the these observation, CdSe NP’s, CdSe-MMT-insitu-10% and CdSe-MMT-load-50% are utilized for studyingthe comparative account of adsorption behavior with 1.0 g L�1
adsorbent and varying the initial IC concentration.
Kinetic models
In order to evaluate the rate-controlling factors and mass trans-fer mechanism, kinetic data is correlated with linear forms of thepseudo first-order Eq. (1) and pseudo second order Eq. (2).
lnðqe � qtÞ ¼ ln qe � k1t ð1Þ
tqt¼ 1
k2q2eþ t
qeð2Þ
P’s and CdSe-MMT-nanocomposites.
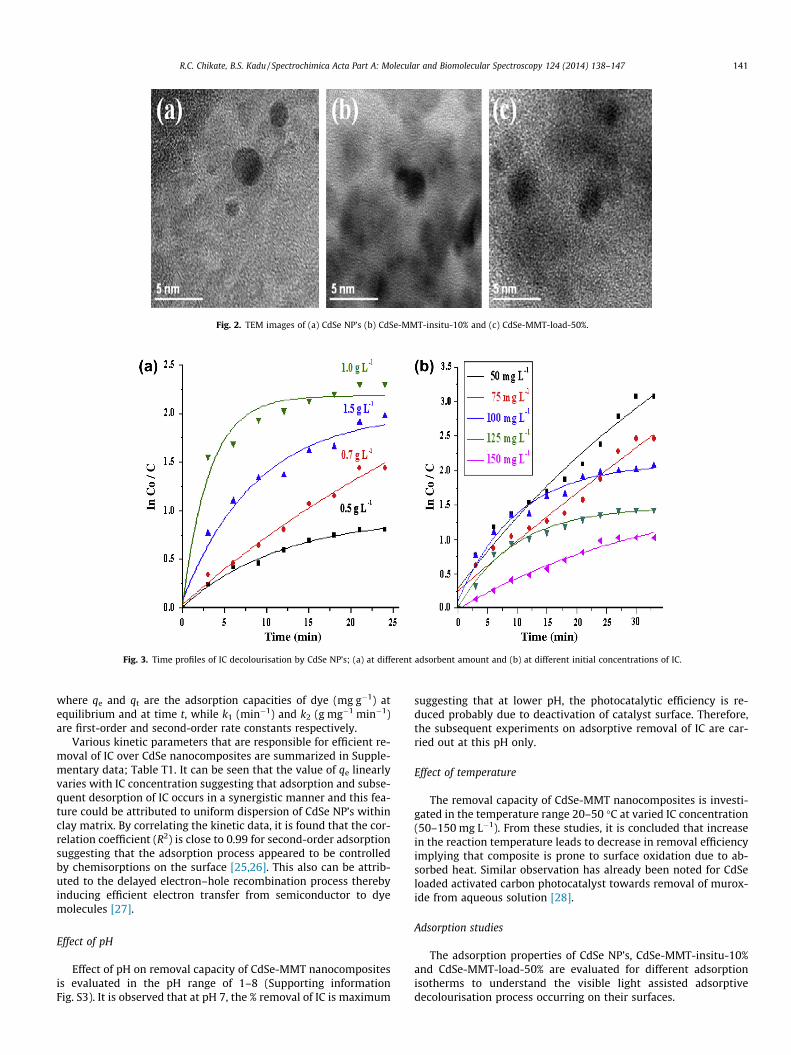
Fig. 2. TEM images of (a) CdSe NP’s (b) CdSe-MMT-insitu-10% and (c) CdSe-MMT-load-50%.
Fig. 3. Time profiles of IC decolourisation by CdSe NP’s; (a) at different adsorbent amount and (b) at different initial concentrations of IC.
R.C. Chikate, B.S. Kadu / Spectrochimica Acta Part A: Molecular and Biomolecular Spectroscopy 124 (2014) 138–147 141
where qe and qt are the adsorption capacities of dye (mg g�1) atequilibrium and at time t, while k1 (min�1) and k2 (g mg�1 min�1)are first-order and second-order rate constants respectively.
Various kinetic parameters that are responsible for efficient re-moval of IC over CdSe nanocomposites are summarized in Supple-mentary data; Table T1. It can be seen that the value of qe linearlyvaries with IC concentration suggesting that adsorption and subse-quent desorption of IC occurs in a synergistic manner and this fea-ture could be attributed to uniform dispersion of CdSe NP’s withinclay matrix. By correlating the kinetic data, it is found that the cor-relation coefficient (R2) is close to 0.99 for second-order adsorptionsuggesting that the adsorption process appeared to be controlledby chemisorptions on the surface [25,26]. This also can be attrib-uted to the delayed electron–hole recombination process therebyinducing efficient electron transfer from semiconductor to dyemolecules [27].
Effect of pH
Effect of pH on removal capacity of CdSe-MMT nanocompositesis evaluated in the pH range of 1–8 (Supporting informationFig. S3). It is observed that at pH 7, the % removal of IC is maximum
suggesting that at lower pH, the photocatalytic efficiency is re-duced probably due to deactivation of catalyst surface. Therefore,the subsequent experiments on adsorptive removal of IC are car-ried out at this pH only.
Effect of temperature
The removal capacity of CdSe-MMT nanocomposites is investi-gated in the temperature range 20–50 �C at varied IC concentration(50–150 mg L�1). From these studies, it is concluded that increasein the reaction temperature leads to decrease in removal efficiencyimplying that composite is prone to surface oxidation due to ab-sorbed heat. Similar observation has already been noted for CdSeloaded activated carbon photocatalyst towards removal of murox-ide from aqueous solution [28].
Adsorption studies
The adsorption properties of CdSe NP’s, CdSe-MMT-insitu-10%and CdSe-MMT-load-50% are evaluated for different adsorptionisotherms to understand the visible light assisted adsorptivedecolourisation process occurring on their surfaces.
142 R.C. Chikate, B.S. Kadu / Spectrochimica Acta Part A: Molecular and Biomolecular Spectroscopy 124 (2014) 138–147
Langmuir isothermThe Langmuir adsorption assumes that the adsorbed layer is
one molecule in thickness. The sorption data are analyzed accord-ing to linear form of Langmuir equation as:
Ce
qe¼ Ce
qmþ 1
qmKLð3Þ
A linear plot of Ce/qe vs. Ce (Supplementary data; Fig. S4a) sug-gests that the single layer adsorption takes place and the evaluatedparameters are presented in Table 1. It can be seen that amount ofIC adsorbed on photocatalytic surface is maximum for loaded com-posite as compared to other two catalysts probably due to in-creased reactive sites as well as favored adsorption tendency.Moreover, single layer surface adsorption possessing appreciableactivation energy is rate determining step having irreversiblecharacter.
Freundlich isothermThe linearized form of Freundlich can be described as;
ln qe ¼ bF ln Ce þ ln KF ð4Þ
Freundlich plot (Supplementary data; Fig. S5a) does not followlinear nature commonly observed for multilayer adsorption. Thisobservation can be attributed to non-linear distribution of adsorp-tion energy on the catalyst surface [29] owing to random distribu-tion of surface hydroxyl ions.
Redlich–Peterson (R–P) isothermRedlich–Peterson model described by Eq. (5) clearly differenti-
ates between Langmuir and Freundlich isotherms.
qe ¼KRCe
1þ aRCbe
ð5Þ
Table 1Isotherm parameters for CdSe NP’s, CdSe-MMT-insitu-10% and CdSe-MMT-load-50%.
Adsorbent CdSe NP’s CdSe-M
Linear Nonlinear Linear
Langmuirqm (mg g�1) 103.09 89.539 116.28KL (L mg�1) 0.3931 0.3882 0.3604R2 0.9901 0.9988 0.9854
FreundlichKF (mg g�1) 43.379 44.157 44.829bF 0.2280 0.1942 0.2624R2 0.8982 0.9754 0.8929
Redlich–Petersonb 0.7753 0.7702 0.7418KR (L g�1) 1361.27 1360.32 1347.8aR(L mg�1) 33.720 34.189 32.558R2 0.9999 0.9999 0.9999
Dubinin–RadushkevichqDR (mg g�1) 538.75 537.36 611.23K (J2 mol�2) 6.85 � 10�4 6.72 � 10�4 6.92 �E (kJ mol�1) �27.022 �27.271 �26.88R2 0.9709 0.9419 0.9785
TemkinbTe (kJ mol�1) 0.1507 0.1666 0.1239KT (L g�1) 10.644 10.602 7.1364DG� (kJ mol�1) �5.8550 �5.8421 �4.873R2 0.9308 0.9615 0.9701
Flory–Hugginsn 1.4035 1.3978 1.4328KFH (L g�1) 5.84 � 103 5.82 � 103 8.06 �DG� (kJ mol�1) �21.481 �21.473 �22.28R2 0.9955 0.9923 0.9893
where qe is the solid-phase sorbate concentration at equilibrium(mg g�1), Ce is the liquid-phase sorbate concentration at equilib-rium (mg L�1), KR (L g�1), aR (L/mg1�1/b) are Redlich-Peterson con-stants and b is the exponent, which lies between 1 and 0. Underthese conditions if b = 1, the adsorption favors Langmuir Eq. (6).
qe ¼KRCe
1þ aRCbe
ð6Þ
By rearranging Eq. (5), the Redlich–Peterson equation can beconverted to a linear form as:
ln KRCe
qe� 1
� �¼ ln aR þ b ln Ce ð7Þ
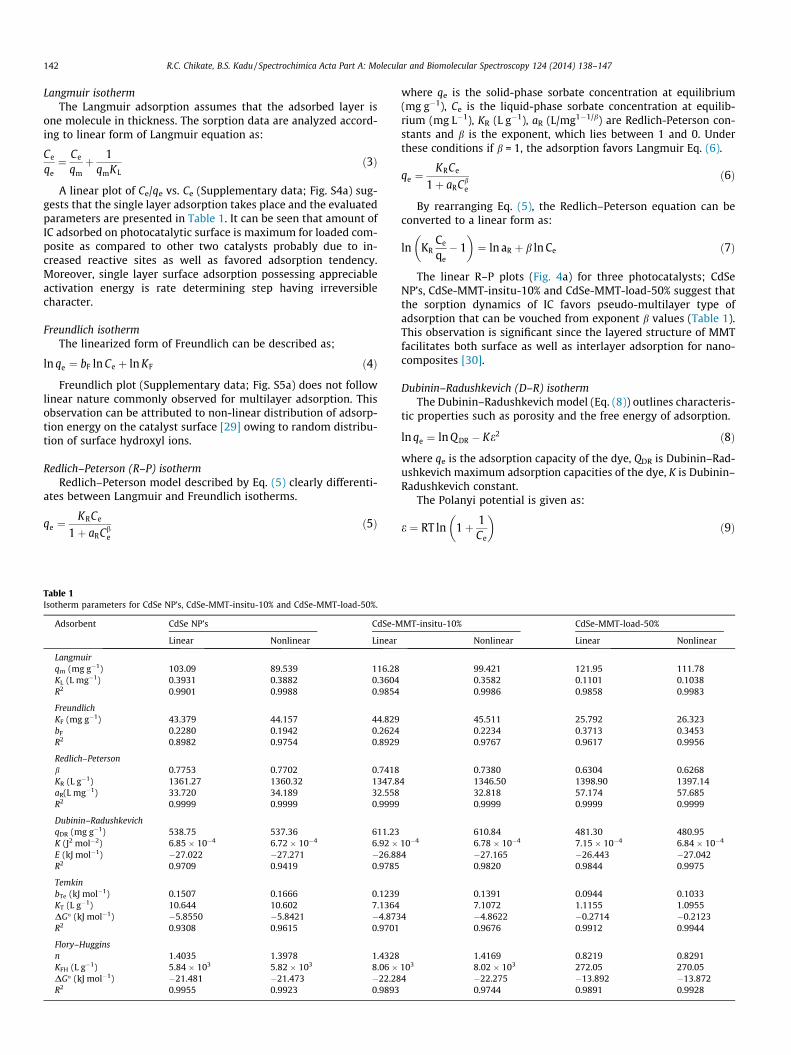
The linear R–P plots (Fig. 4a) for three photocatalysts; CdSeNP’s, CdSe-MMT-insitu-10% and CdSe-MMT-load-50% suggest thatthe sorption dynamics of IC favors pseudo-multilayer type ofadsorption that can be vouched from exponent b values (Table 1).This observation is significant since the layered structure of MMTfacilitates both surface as well as interlayer adsorption for nano-composites [30].
Dubinin–Radushkevich (D–R) isothermThe Dubinin–Radushkevich model (Eq. (8)) outlines characteris-
tic properties such as porosity and the free energy of adsorption.
ln qe ¼ ln Q DR � Ke2 ð8Þ
where qe is the adsorption capacity of the dye, QDR is Dubinin–Rad-ushkevich maximum adsorption capacities of the dye, K is Dubinin–Radushkevich constant.
The Polanyi potential is given as:
e ¼ RT ln 1þ 1Ce
� �ð9Þ
MT-insitu-10% CdSe-MMT-load-50%
Nonlinear Linear Nonlinear
99.421 121.95 111.780.3582 0.1101 0.10380.9986 0.9858 0.9983
45.511 25.792 26.3230.2234 0.3713 0.34530.9767 0.9617 0.9956
0.7380 0.6304 0.62684 1346.50 1398.90 1397.14
32.818 57.174 57.6850.9999 0.9999 0.9999
610.84 481.30 480.9510�4 6.78 � 10�4 7.15 � 10�4 6.84 � 10�4
4 �27.165 �26.443 �27.0420.9820 0.9844 0.9975
0.1391 0.0944 0.10337.1072 1.1155 1.0955
4 �4.8622 �0.2714 �0.21230.9676 0.9912 0.9944
1.4169 0.8219 0.8291103 8.02 � 103 272.05 270.054 �22.275 �13.892 �13.872
0.9744 0.9891 0.9928
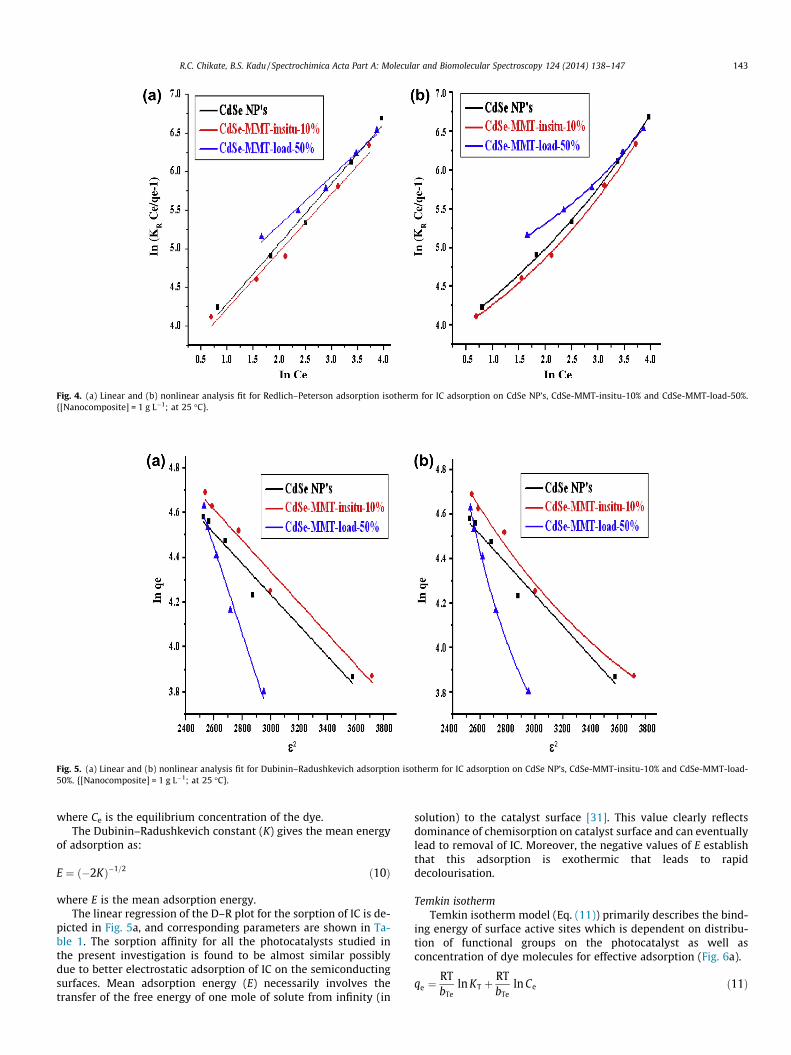
Fig. 4. (a) Linear and (b) nonlinear analysis fit for Redlich–Peterson adsorption isotherm for IC adsorption on CdSe NP’s, CdSe-MMT-insitu-10% and CdSe-MMT-load-50%.{[Nanocomposite] = 1 g L�1; at 25 �C}.
Fig. 5. (a) Linear and (b) nonlinear analysis fit for Dubinin–Radushkevich adsorption isotherm for IC adsorption on CdSe NP’s, CdSe-MMT-insitu-10% and CdSe-MMT-load-50%. {[Nanocomposite] = 1 g L�1; at 25 �C}.
R.C. Chikate, B.S. Kadu / Spectrochimica Acta Part A: Molecular and Biomolecular Spectroscopy 124 (2014) 138–147 143
where Ce is the equilibrium concentration of the dye.The Dubinin–Radushkevich constant (K) gives the mean energy
of adsorption as:
E ¼ ð�2KÞ�1=2 ð10Þ
where E is the mean adsorption energy.The linear regression of the D–R plot for the sorption of IC is de-
picted in Fig. 5a, and corresponding parameters are shown in Ta-ble 1. The sorption affinity for all the photocatalysts studied inthe present investigation is found to be almost similar possiblydue to better electrostatic adsorption of IC on the semiconductingsurfaces. Mean adsorption energy (E) necessarily involves thetransfer of the free energy of one mole of solute from infinity (in
solution) to the catalyst surface [31]. This value clearly reflectsdominance of chemisorption on catalyst surface and can eventuallylead to removal of IC. Moreover, the negative values of E establishthat this adsorption is exothermic that leads to rapiddecolourisation.
Temkin isothermTemkin isotherm model (Eq. (11)) primarily describes the bind-
ing energy of surface active sites which is dependent on distribu-tion of functional groups on the photocatalyst as well asconcentration of dye molecules for effective adsorption (Fig. 6a).
qe ¼RTbTe
ln KT þRTbTe
ln Ce ð11Þ
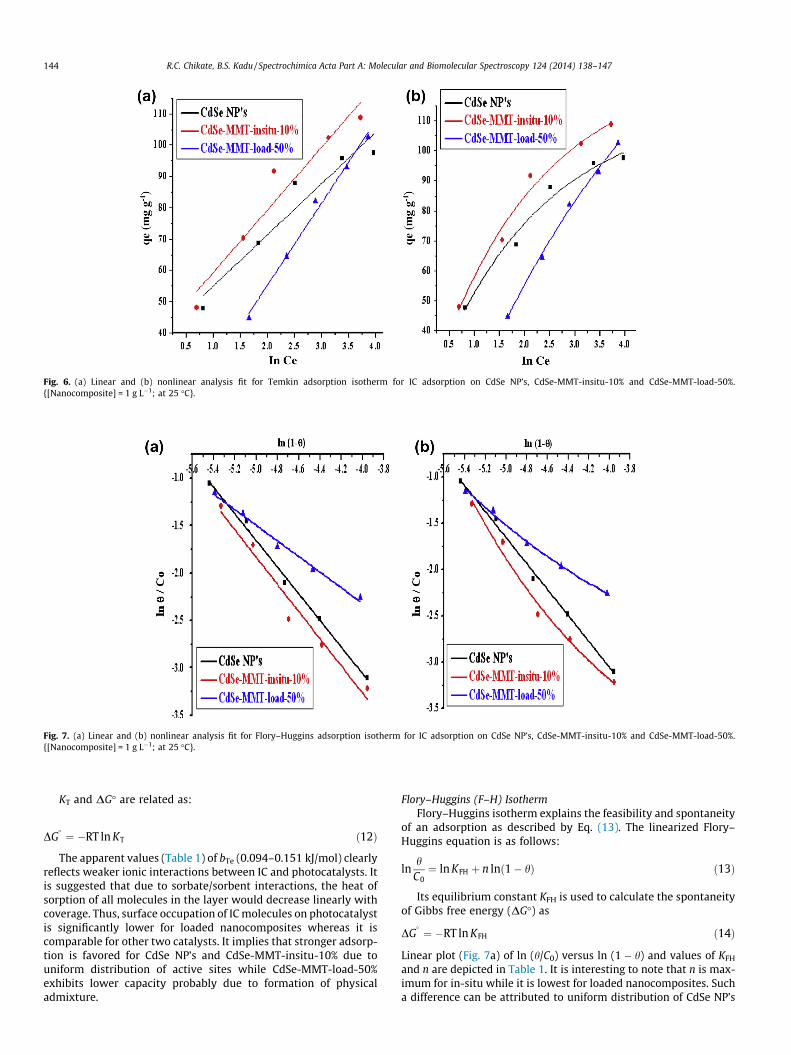
Fig. 6. (a) Linear and (b) nonlinear analysis fit for Temkin adsorption isotherm for IC adsorption on CdSe NP’s, CdSe-MMT-insitu-10% and CdSe-MMT-load-50%.{[Nanocomposite] = 1 g L�1; at 25 �C}.
Fig. 7. (a) Linear and (b) nonlinear analysis fit for Flory–Huggins adsorption isotherm for IC adsorption on CdSe NP’s, CdSe-MMT-insitu-10% and CdSe-MMT-load-50%.{[Nanocomposite] = 1 g L�1; at 25 �C}.
144 R.C. Chikate, B.S. Kadu / Spectrochimica Acta Part A: Molecular and Biomolecular Spectroscopy 124 (2014) 138–147
KT and DG� are related as:
DG�¼ �RT ln KT ð12Þ
The apparent values (Table 1) of bTe (0.094–0.151 kJ/mol) clearlyreflects weaker ionic interactions between IC and photocatalysts. Itis suggested that due to sorbate/sorbent interactions, the heat ofsorption of all molecules in the layer would decrease linearly withcoverage. Thus, surface occupation of IC molecules on photocatalystis significantly lower for loaded nanocomposites whereas it iscomparable for other two catalysts. It implies that stronger adsorp-tion is favored for CdSe NP’s and CdSe-MMT-insitu-10% due touniform distribution of active sites while CdSe-MMT-load-50%exhibits lower capacity probably due to formation of physicaladmixture.
Flory–Huggins (F–H) IsothermFlory–Huggins isotherm explains the feasibility and spontaneity
of an adsorption as described by Eq. (13). The linearized Flory–Huggins equation is as follows:
lnh
C0¼ ln KFH þ n lnð1� hÞ ð13Þ
Its equilibrium constant KFH is used to calculate the spontaneityof Gibbs free energy (DG�) as
DG�¼ �RT ln KFH ð14Þ
Linear plot (Fig. 7a) of ln (h/C0) versus ln (1 � h) and values of KFH
and n are depicted in Table 1. It is interesting to note that n is max-imum for in-situ while it is lowest for loaded nanocomposites. Sucha difference can be attributed to uniform distribution of CdSe NP’s
R.C. Chikate, B.S. Kadu / Spectrochimica Acta Part A: Molecular and Biomolecular Spectroscopy 124 (2014) 138–147 145
in clay matrix for in-situ nanocomposite; that are responsible forefficient adsorption followed by photochemical process. This obser-vation is further substantiated from KFH values that signify theamount of adsorbed IC molecule per g of adsorbent as well as thenegative values of DG� also confirm the thermodynamically favoredspontaneous adsorption of IC on photocatalyst surface [32].
Linear method
This method is quite often used where all the isotherms are lin-earized, and then, the method of least squares is employed to ob-tain the best-fit parameters for each isotherm. It is obvious thatdue to the transformations into different linear forms, the errorstructures are altered in different ways in all the forms and, there-fore, the results obtained would be different for all of them. In thiscontext, different error functions like R2, ARED, MPSED, HYBRIDand SSE as well as alternative statistical tools such as Pearson Cor-relation Coefficient, Determination Coefficient and v2 are evalu-ated and the respective data is presented in Supplementary data;Tables T2 and T3. Inspection of these tables suggest that Redlich–Peterson and Flory–Huggins models satisfactorily describe theeffective adsorption of IC on three photocatalysts as can bevouched from highest R2 value and the lowest SSE, HYBRID, MPSEDand ARED. Such a feature is also observed by employing alternativestatistical tools (Supplementary data; Table T3) as evident fromPearson Correlation Coefficient (r) that reflects the higher degreeof linearity for adsorption dynamics. This observation probablyindicates that rather than mono-layer, it is quite likely that sorp-tion process occurs through multi-layer adsorption.
Nonlinear method
The linear regression methods, in general, have problems asso-ciated with their error structure. Variation in error distribution hasbeen attributed to different axial settings which transform thedependent variables to different axial positions. Hence it is advis-able to employ nonlinear regression techniques which are freefrom such axial distribution errors. The non-linearized curve fit-tings for Langmuir, Freundlich (Supplementary data; Figs. S4band S5b), R–P (Fig. 4b), D–R (Fig. 5b), Temkin (Fig. 6b) and F–H(Fig. 7b) reveal that only R–P and F–H are best fitted isothermmodels (Supplementary data; Tables T4 and T5). It implies thatthese models effectively describe the adsorption of IC through mul-ti-layer process which may be ascribed to enhanced adsorptionbehavior due to MMT as well as CdSe nanoparticles in a synergicmanner.
Sorption dynamics
From the linear and non-linear regression analysis, it is ob-served that R–P and F–H are best-fit models for IC adsorption
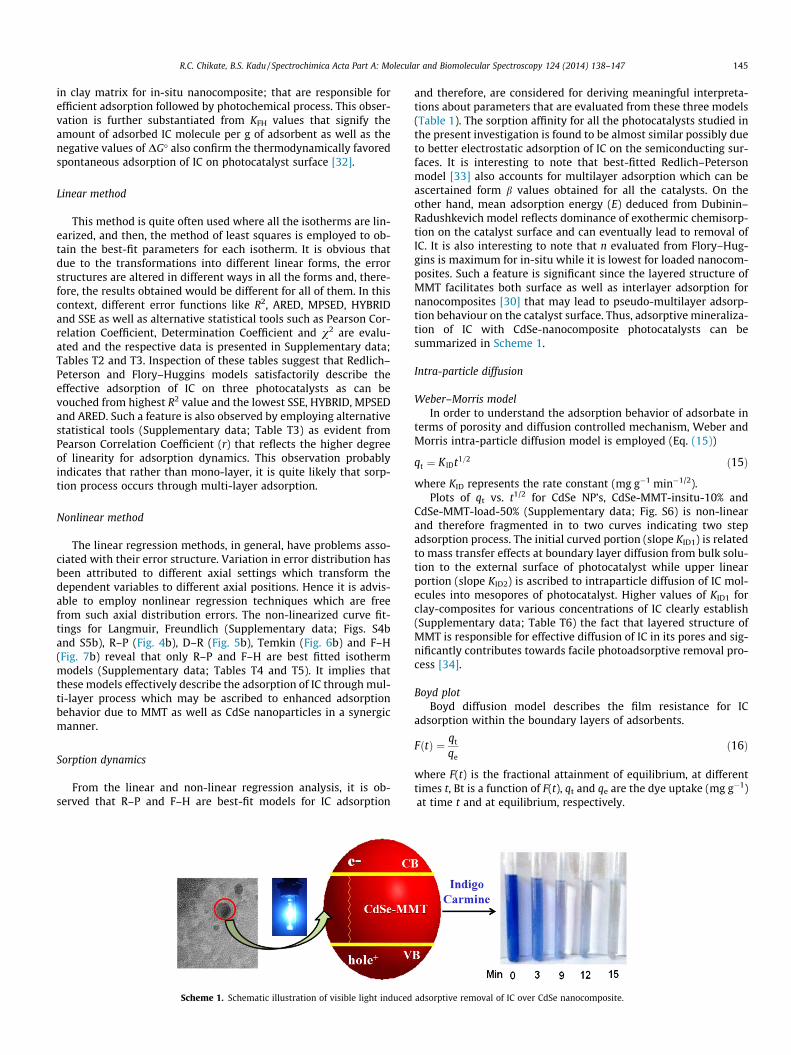
Scheme 1. Schematic illustration of visible light induced
and therefore, are considered for deriving meaningful interpreta-tions about parameters that are evaluated from these three models(Table 1). The sorption affinity for all the photocatalysts studied inthe present investigation is found to be almost similar possibly dueto better electrostatic adsorption of IC on the semiconducting sur-faces. It is interesting to note that best-fitted Redlich–Petersonmodel [33] also accounts for multilayer adsorption which can beascertained form b values obtained for all the catalysts. On theother hand, mean adsorption energy (E) deduced from Dubinin–Radushkevich model reflects dominance of exothermic chemisorp-tion on the catalyst surface and can eventually lead to removal ofIC. It is also interesting to note that n evaluated from Flory–Hug-gins is maximum for in-situ while it is lowest for loaded nanocom-posites. Such a feature is significant since the layered structure ofMMT facilitates both surface as well as interlayer adsorption fornanocomposites [30] that may lead to pseudo-multilayer adsorp-tion behaviour on the catalyst surface. Thus, adsorptive mineraliza-tion of IC with CdSe-nanocomposite photocatalysts can besummarized in Scheme 1.
Intra-particle diffusion
Weber–Morris modelIn order to understand the adsorption behavior of adsorbate in
terms of porosity and diffusion controlled mechanism, Weber andMorris intra-particle diffusion model is employed (Eq. (15))
qt ¼ K IDt1=2 ð15Þ
where KID represents the rate constant (mg g�1 min�1/2).Plots of qt vs. t1/2 for CdSe NP’s, CdSe-MMT-insitu-10% and
CdSe-MMT-load-50% (Supplementary data; Fig. S6) is non-linearand therefore fragmented in to two curves indicating two stepadsorption process. The initial curved portion (slope KID1) is relatedto mass transfer effects at boundary layer diffusion from bulk solu-tion to the external surface of photocatalyst while upper linearportion (slope KID2) is ascribed to intraparticle diffusion of IC mol-ecules into mesopores of photocatalyst. Higher values of KID1 forclay-composites for various concentrations of IC clearly establish(Supplementary data; Table T6) the fact that layered structure ofMMT is responsible for effective diffusion of IC in its pores and sig-nificantly contributes towards facile photoadsorptive removal pro-cess [34].
Boyd plotBoyd diffusion model describes the film resistance for IC
adsorption within the boundary layers of adsorbents.
FðtÞ ¼ qt
qeð16Þ
where F(t) is the fractional attainment of equilibrium, at differenttimes t, Bt is a function of F(t), qt and qe are the dye uptake (mg g�1)at time t and at equilibrium, respectively.
adsorptive removal of IC over CdSe nanocomposite.
146 R.C. Chikate, B.S. Kadu / Spectrochimica Acta Part A: Molecular and Biomolecular Spectroscopy 124 (2014) 138–147
Condition I: For F(t) > 0.85,
Bt ¼ 0:4977� lnð1� FðtÞÞ ð17Þ
Condition II: For F(t) < 0.85,
Bt ¼ffiffiffiffipp�
ffiffiffiffiffiffiffiffiffiffiffiffiffiffiffiffiffiffiffiffiffiffiffiffiffiffiffiffiffiffip� p2FðtÞ
3
� �s !2
ð18Þ
When external transport of the ingoing molecules is greaterthan internal transport, film diffusion is predominant, however,conversely, opposite mechanism is observed for particle diffusion.For all the photocatalysts, linear plots are obtained (Supplementarydata; Fig. S7) indicating that particle diffusion is the rate determin-ing step towards effective adsorption that eventually leads to fasterdecolourisation of IC solution [35]. This observation is found to beconsistent with the data obtained from kinetic data outlined ear-lier. Intercept of Bt vs. time plot accounts for values of Bt whichcan be ascribed for spontaneous boundary layer diffusion. It is ob-served that these values are higher for CdSe NP’s (Supplementarydata; Table T6) indicating that IC adsorption is electrostatic in nat-ure due to charged photocatalyst surface.
FT-IR spectra
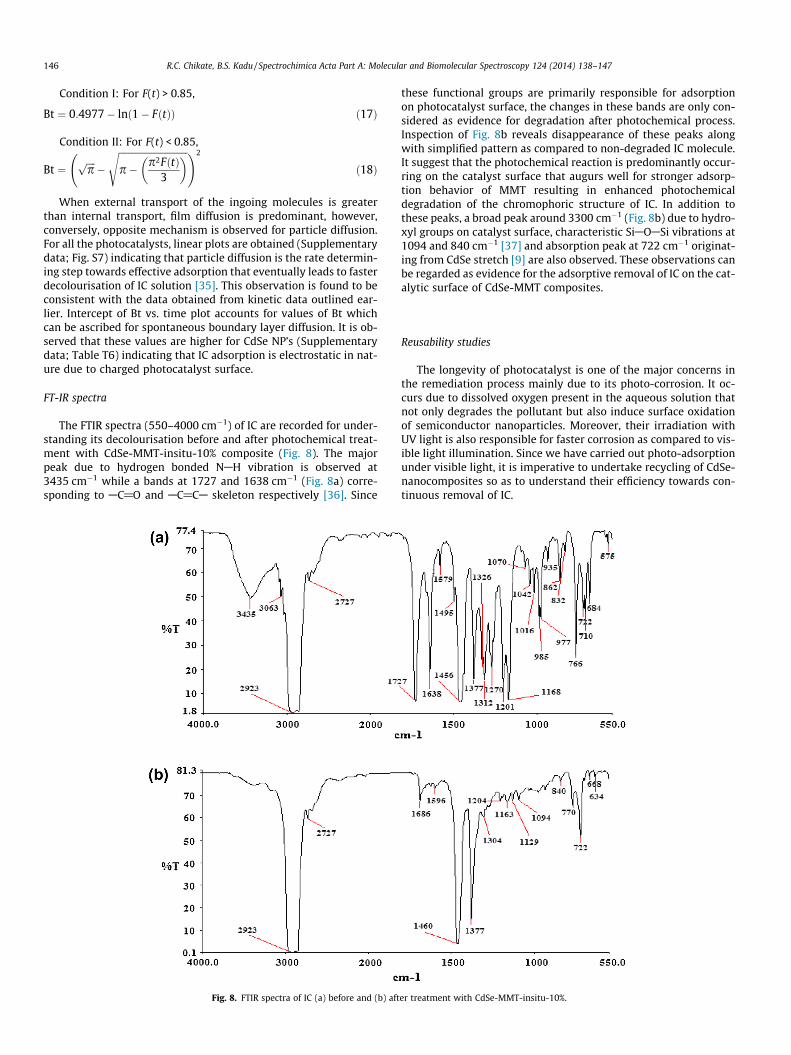
The FTIR spectra (550–4000 cm�1) of IC are recorded for under-standing its decolourisation before and after photochemical treat-ment with CdSe-MMT-insitu-10% composite (Fig. 8). The majorpeak due to hydrogen bonded NAH vibration is observed at3435 cm�1 while a bands at 1727 and 1638 cm�1 (Fig. 8a) corre-sponding to AC@O and AC@CA skeleton respectively [36]. Since
Fig. 8. FTIR spectra of IC (a) before and (b) aft
these functional groups are primarily responsible for adsorptionon photocatalyst surface, the changes in these bands are only con-sidered as evidence for degradation after photochemical process.Inspection of Fig. 8b reveals disappearance of these peaks alongwith simplified pattern as compared to non-degraded IC molecule.It suggest that the photochemical reaction is predominantly occur-ring on the catalyst surface that augurs well for stronger adsorp-tion behavior of MMT resulting in enhanced photochemicaldegradation of the chromophoric structure of IC. In addition tothese peaks, a broad peak around 3300 cm�1 (Fig. 8b) due to hydro-xyl groups on catalyst surface, characteristic SiAOASi vibrations at1094 and 840 cm�1 [37] and absorption peak at 722 cm�1 originat-ing from CdSe stretch [9] are also observed. These observations canbe regarded as evidence for the adsorptive removal of IC on the cat-alytic surface of CdSe-MMT composites.
Reusability studies
The longevity of photocatalyst is one of the major concerns inthe remediation process mainly due to its photo-corrosion. It oc-curs due to dissolved oxygen present in the aqueous solution thatnot only degrades the pollutant but also induce surface oxidationof semiconductor nanoparticles. Moreover, their irradiation withUV light is also responsible for faster corrosion as compared to vis-ible light illumination. Since we have carried out photo-adsorptionunder visible light, it is imperative to undertake recycling of CdSe-nanocomposites so as to understand their efficiency towards con-tinuous removal of IC.
er treatment with CdSe-MMT-insitu-10%.
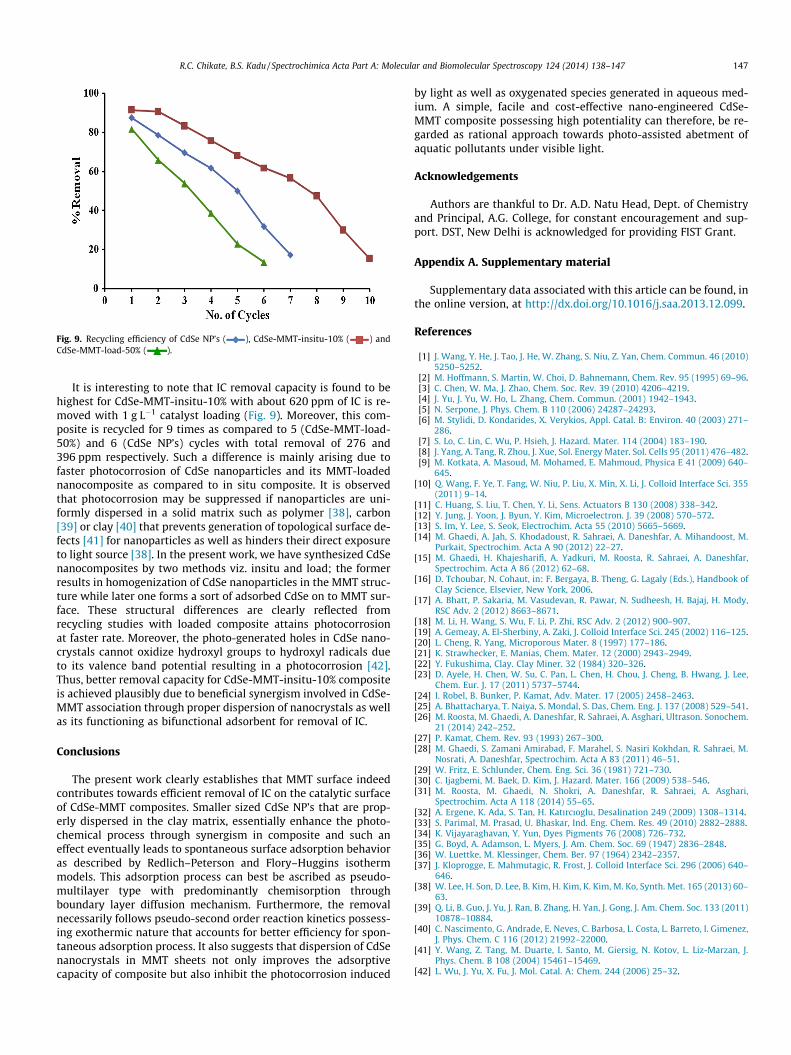
Fig. 9. Recycling efficiency of CdSe NP’s ( ), CdSe-MMT-insitu-10% ( ) andCdSe-MMT-load-50% ( ).
R.C. Chikate, B.S. Kadu / Spectrochimica Acta Part A: Molecular and Biomolecular Spectroscopy 124 (2014) 138–147 147
It is interesting to note that IC removal capacity is found to behighest for CdSe-MMT-insitu-10% with about 620 ppm of IC is re-moved with 1 g L�1 catalyst loading (Fig. 9). Moreover, this com-posite is recycled for 9 times as compared to 5 (CdSe-MMT-load-50%) and 6 (CdSe NP’s) cycles with total removal of 276 and396 ppm respectively. Such a difference is mainly arising due tofaster photocorrosion of CdSe nanoparticles and its MMT-loadednanocomposite as compared to in situ composite. It is observedthat photocorrosion may be suppressed if nanoparticles are uni-formly dispersed in a solid matrix such as polymer [38], carbon[39] or clay [40] that prevents generation of topological surface de-fects [41] for nanoparticles as well as hinders their direct exposureto light source [38]. In the present work, we have synthesized CdSenanocomposites by two methods viz. insitu and load; the formerresults in homogenization of CdSe nanoparticles in the MMT struc-ture while later one forms a sort of adsorbed CdSe on to MMT sur-face. These structural differences are clearly reflected fromrecycling studies with loaded composite attains photocorrosionat faster rate. Moreover, the photo-generated holes in CdSe nano-crystals cannot oxidize hydroxyl groups to hydroxyl radicals dueto its valence band potential resulting in a photocorrosion [42].Thus, better removal capacity for CdSe-MMT-insitu-10% compositeis achieved plausibly due to beneficial synergism involved in CdSe-MMT association through proper dispersion of nanocrystals as wellas its functioning as bifunctional adsorbent for removal of IC.
Conclusions
The present work clearly establishes that MMT surface indeedcontributes towards efficient removal of IC on the catalytic surfaceof CdSe-MMT composites. Smaller sized CdSe NP’s that are prop-erly dispersed in the clay matrix, essentially enhance the photo-chemical process through synergism in composite and such aneffect eventually leads to spontaneous surface adsorption behavioras described by Redlich–Peterson and Flory–Huggins isothermmodels. This adsorption process can best be ascribed as pseudo-multilayer type with predominantly chemisorption throughboundary layer diffusion mechanism. Furthermore, the removalnecessarily follows pseudo-second order reaction kinetics possess-ing exothermic nature that accounts for better efficiency for spon-taneous adsorption process. It also suggests that dispersion of CdSenanocrystals in MMT sheets not only improves the adsorptivecapacity of composite but also inhibit the photocorrosion induced
by light as well as oxygenated species generated in aqueous med-ium. A simple, facile and cost-effective nano-engineered CdSe-MMT composite possessing high potentiality can therefore, be re-garded as rational approach towards photo-assisted abetment ofaquatic pollutants under visible light.
Acknowledgements
Authors are thankful to Dr. A.D. Natu Head, Dept. of Chemistryand Principal, A.G. College, for constant encouragement and sup-port. DST, New Delhi is acknowledged for providing FIST Grant.
Appendix A. Supplementary material
Supplementary data associated with this article can be found, inthe online version, at http://dx.doi.org/10.1016/j.saa.2013.12.099.
References
[1] J. Wang, Y. He, J. Tao, J. He, W. Zhang, S. Niu, Z. Yan, Chem. Commun. 46 (2010)5250–5252.
[2] M. Hoffmann, S. Martin, W. Choi, D. Bahnemann, Chem. Rev. 95 (1995) 69–96.[3] C. Chen, W. Ma, J. Zhao, Chem. Soc. Rev. 39 (2010) 4206–4219.[4] J. Yu, J. Yu, W. Ho, L. Zhang, Chem. Commun. (2001) 1942–1943.[5] N. Serpone, J. Phys. Chem. B 110 (2006) 24287–24293.[6] M. Stylidi, D. Kondarides, X. Verykios, Appl. Catal. B: Environ. 40 (2003) 271–
286.[7] S. Lo, C. Lin, C. Wu, P. Hsieh, J. Hazard. Mater. 114 (2004) 183–190.[8] J. Yang, A. Tang, R. Zhou, J. Xue, Sol. Energy Mater. Sol. Cells 95 (2011) 476–482.[9] M. Kotkata, A. Masoud, M. Mohamed, E. Mahmoud, Physica E 41 (2009) 640–
645.[10] Q. Wang, F. Ye, T. Fang, W. Niu, P. Liu, X. Min, X. Li, J. Colloid Interface Sci. 355
(2011) 9–14.[11] C. Huang, S. Liu, T. Chen, Y. Li, Sens. Actuators B 130 (2008) 338–342.[12] Y. Jung, J. Yoon, J. Byun, Y. Kim, Microelectron. J. 39 (2008) 570–572.[13] S. Im, Y. Lee, S. Seok, Electrochim. Acta 55 (2010) 5665–5669.[14] M. Ghaedi, A. Jah, S. Khodadoust, R. Sahraei, A. Daneshfar, A. Mihandoost, M.
Purkait, Spectrochim. Acta A 90 (2012) 22–27.[15] M. Ghaedi, H. Khajesharifi, A. Yadkuri, M. Roosta, R. Sahraei, A. Daneshfar,
Spectrochim. Acta A 86 (2012) 62–68.[16] D. Tchoubar, N. Cohaut, in: F. Bergaya, B. Theng, G. Lagaly (Eds.), Handbook of
Clay Science, Elsevier, New York, 2006.[17] A. Bhatt, P. Sakaria, M. Vasudevan, R. Pawar, N. Sudheesh, H. Bajaj, H. Mody,
RSC Adv. 2 (2012) 8663–8671.[18] M. Li, H. Wang, S. Wu, F. Li, P. Zhi, RSC Adv. 2 (2012) 900–907.[19] A. Gemeay, A. El-Sherbiny, A. Zaki, J. Colloid Interface Sci. 245 (2002) 116–125.[20] L. Cheng, R. Yang, Microporous Mater. 8 (1997) 177–186.[21] K. Strawhecker, E. Manias, Chem. Mater. 12 (2000) 2943–2949.[22] Y. Fukushima, Clay. Clay Miner. 32 (1984) 320–326.[23] D. Ayele, H. Chen, W. Su, C. Pan, L. Chen, H. Chou, J. Cheng, B. Hwang, J. Lee,
Chem. Eur. J. 17 (2011) 5737–5744.[24] I. Robel, B. Bunker, P. Kamat, Adv. Mater. 17 (2005) 2458–2463.[25] A. Bhattacharya, T. Naiya, S. Mondal, S. Das, Chem. Eng. J. 137 (2008) 529–541.[26] M. Roosta, M. Ghaedi, A. Daneshfar, R. Sahraei, A. Asghari, Ultrason. Sonochem.
21 (2014) 242–252.[27] P. Kamat, Chem. Rev. 93 (1993) 267–300.[28] M. Ghaedi, S. Zamani Amirabad, F. Marahel, S. Nasiri Kokhdan, R. Sahraei, M.
Nosrati, A. Daneshfar, Spectrochim. Acta A 83 (2011) 46–51.[29] W. Fritz, E. Schlunder, Chem. Eng. Sci. 36 (1981) 721–730.[30] C. Ijagbemi, M. Baek, D. Kim, J. Hazard. Mater. 166 (2009) 538–546.[31] M. Roosta, M. Ghaedi, N. Shokri, A. Daneshfar, R. Sahraei, A. Asghari,
Spectrochim. Acta A 118 (2014) 55–65.[32] A. Ergene, K. Ada, S. Tan, H. Katırcıoglu, Desalination 249 (2009) 1308–1314.[33] S. Parimal, M. Prasad, U. Bhaskar, Ind. Eng. Chem. Res. 49 (2010) 2882–2888.[34] K. Vijayaraghavan, Y. Yun, Dyes Pigments 76 (2008) 726–732.[35] G. Boyd, A. Adamson, L. Myers, J. Am. Chem. Soc. 69 (1947) 2836–2848.[36] W. Luettke, M. Klessinger, Chem. Ber. 97 (1964) 2342–2357.[37] J. Kloprogge, E. Mahmutagic, R. Frost, J. Colloid Interface Sci. 296 (2006) 640–
646.[38] W. Lee, H. Son, D. Lee, B. Kim, H. Kim, K. Kim, M. Ko, Synth. Met. 165 (2013) 60–
63.[39] Q. Li, B. Guo, J. Yu, J. Ran, B. Zhang, H. Yan, J. Gong, J. Am. Chem. Soc. 133 (2011)
10878–10884.[40] C. Nascimento, G. Andrade, E. Neves, C. Barbosa, L. Costa, L. Barreto, I. Gimenez,
J. Phys. Chem. C 116 (2012) 21992–22000.[41] Y. Wang, Z. Tang, M. Duarte, I. Santo, M. Giersig, N. Kotov, L. Liz-Marzan, J.
Phys. Chem. B 108 (2004) 15461–15469.[42] L. Wu, J. Yu, X. Fu, J. Mol. Catal. A: Chem. 244 (2006) 25–32.
Related Documents