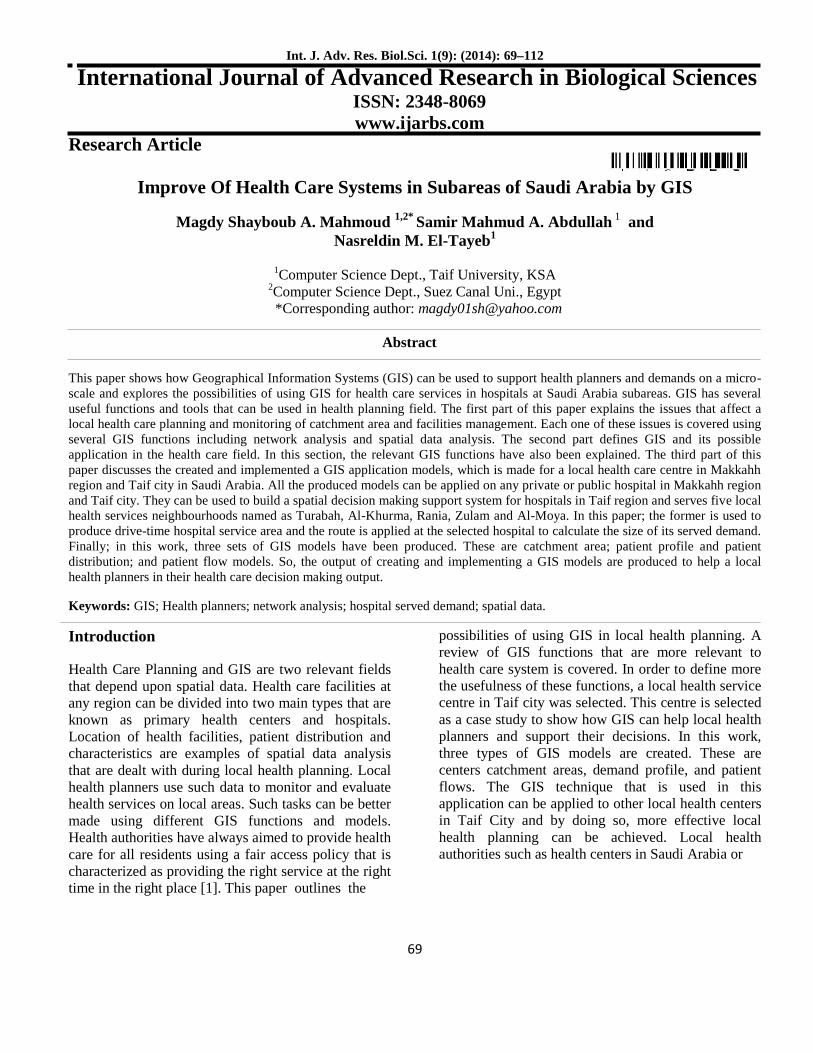
Int. J. Adv. Res. Biol.Sci. 1(9): (2014): 69–112 69 International Journal of Advanced Research in Biological Sciences ISSN: 2348-8069 www.ijarbs.com Research Article Improve Of Health Care Systems in Subareas of Saudi Arabia by GIS Magdy Shayboub A. Mahmoud 1,2* Samir Mahmud A. Abdullah 1 and Nasreldin M. El-Tayeb 1 1 Computer Science Dept., Taif University, KSA 2 Computer Science Dept., Suez Canal Uni., Egypt *Corresponding author: [email protected] Abstract This paper shows how Geographical Information Systems (GIS) can be used to support health planners and demands on a micro- scale and explores the possibilities of using GIS for health care services in hospitals at Saudi Arabia subareas. GIS has several useful functions and tools that can be used in health planning field. The first part of this paper explains the issues that affect a local health care planning and monitoring of catchment area and facilities management. Each one of these issues is covered using several GIS functions including network analysis and spatial data analysis. The second part defines GIS and its possible application in the health care field. In this section, the relevant GIS functions have also been explained. The third part of this paper discusses the created and implemented a GIS application models, which is made for a local health care centre in Makkahh region and Taif city in Saudi Arabia. All the produced models can be applied on any private or public hospital in Makkahh region and Taif city. They can be used to build a spatial decision making support system for hospitals in Taif region and serves five local health services neighbourhoods named as Turabah, Al-Khurma, Rania, Zulam and Al-Moya. In this paper; the former is used to produce drive-time hospital service area and the route is applied at the selected hospital to calculate the size of its served demand. Finally; in this work, three sets of GIS models have been produced. These are catchment area; patient profile and patient distribution; and patient flow models. So, the output of creating and implementing a GIS models are produced to help a local health planners in their health care decision making output. Keywords: GIS; Health planners; network analysis; hospital served demand; spatial data. Introduction Health Care Planning and GIS are two relevant fields that depend upon spatial data. Health care facilities at any region can be divided into two main types that are known as primary health centers and hospitals. Location of health facilities, patient distribution and characteristics are examples of spatial data analysis that are dealt with during local health planning. Local health planners use such data to monitor and evaluate health services on local areas. Such tasks can be better made using different GIS functions and models. Health authorities have always aimed to provide health care for all residents using a fair access policy that is characterized as providing the right service at the right time in the right place [1]. This paper outlines the possibilities of using GIS in local health planning. A review of GIS functions that are more relevant to health care system is covered. In order to define more the usefulness of these functions, a local health service centre in Taif city was selected. This centre is selected as a case study to show how GIS can help local health planners and support their decisions. In this work, three types of GIS models are created. These are centers catchment areas, demand profile, and patient flows. The GIS technique that is used in this application can be applied to other local health centers in Taif City and by doing so, more effective local health planning can be achieved. Local health authorities such as health centers in Saudi Arabia or

Welcome message from author
This document is posted to help you gain knowledge. Please leave a comment to let me know what you think about it! Share it to your friends and learn new things together.
Transcript
Int. J. Adv. Res. Biol.Sci. 1(9): (2014): 69–112
69
International Journal of Advanced Research in Biological SciencesISSN: 2348-8069www.ijarbs.com
Research Article
Improve Of Health Care Systems in Subareas of Saudi Arabia by GIS
Magdy Shayboub A. Mahmoud 1,2* Samir Mahmud A. Abdullah 1 andNasreldin M. El-Tayeb1
1Computer Science Dept., Taif University, KSA2Computer Science Dept., Suez Canal Uni., Egypt*Corresponding author: [email protected]
Abstract
This paper shows how Geographical Information Systems (GIS) can be used to support health planners and demands on a micro-scale and explores the possibilities of using GIS for health care services in hospitals at Saudi Arabia subareas. GIS has severaluseful functions and tools that can be used in health planning field. The first part of this paper explains the issues that affect alocal health care planning and monitoring of catchment area and facilities management. Each one of these issues is covered usingseveral GIS functions including network analysis and spatial data analysis. The second part defines GIS and its possibleapplication in the health care field. In this section, the relevant GIS functions have also been explained. The third part of thispaper discusses the created and implemented a GIS application models, which is made for a local health care centre in Makkahhregion and Taif city in Saudi Arabia. All the produced models can be applied on any private or public hospital in Makkahh regionand Taif city. They can be used to build a spatial decision making support system for hospitals in Taif region and serves five localhealth services neighbourhoods named as Turabah, Al-Khurma, Rania, Zulam and Al-Moya. In this paper; the former is used toproduce drive-time hospital service area and the route is applied at the selected hospital to calculate the size of its served demand.Finally; in this work, three sets of GIS models have been produced. These are catchment area; patient profile and patientdistribution; and patient flow models. So, the output of creating and implementing a GIS models are produced to help a localhealth planners in their health care decision making output.
Keywords: GIS; Health planners; network analysis; hospital served demand; spatial data.
Introduction
Health Care Planning and GIS are two relevant fieldsthat depend upon spatial data. Health care facilities atany region can be divided into two main types that areknown as primary health centers and hospitals.Location of health facilities, patient distribution andcharacteristics are examples of spatial data analysisthat are dealt with during local health planning. Localhealth planners use such data to monitor and evaluatehealth services on local areas. Such tasks can be bettermade using different GIS functions and models.Health authorities have always aimed to provide healthcare for all residents using a fair access policy that ischaracterized as providing the right service at the righttime in the right place [1]. This paper outlines the
possibilities of using GIS in local health planning. Areview of GIS functions that are more relevant tohealth care system is covered. In order to define morethe usefulness of these functions, a local health servicecentre in Taif city was selected. This centre is selectedas a case study to show how GIS can help local healthplanners and support their decisions. In this work,three types of GIS models are created. These arecenters catchment areas, demand profile, and patientflows. The GIS technique that is used in thisapplication can be applied to other local health centersin Taif City and by doing so, more effective localhealth planning can be achieved. Local healthauthorities such as health centers in Saudi Arabia or
Int. J. Adv. Res. Biol.Sci. 1(9): (2014): 69–112
70
GPs in the UK are the key players of healthplanning on a micro scale [2].
They carry out several functions together from thecore of local health planning. These functionsinclude monitoring of patient lists, monitoring ofcatchment areas, assessment of health needs andfacilities management. These functions can also beseen in the form of a checklist which include: (a)Where do their existing patients come from (byage, sex and specialty), (b) What is the Potentialfor increasing the workload by attracting patientscurrently referred elsewhere, (c) What are theimplications of proposed contracts on the futureviability of units and specialties within theorganization, and (d) Who are their maincompetitors [2, 8 and 20]. Ideally, every localhealth authority should always find answers tothese questions because by doing so, better healthplanning will surely be achieved. Spatialepidemiology is another important subject thatresearchers and local planners investigate on thescale of health centers. Defining the location ofhealth incidences, and studying the relationshipbetween such incidences and the surroundingenvironment are all important issues in anyepidemiology study. In order to perform the abovetasks, health centers usually collect and store largesets of data such as child immunization data,communicable diseases, centers performance,socio-economic data, physical environmental data
etc. All of these data have clear spatial references.This means that the use of GeographicalInformation Systems (GIS) is of great value tohealth planners. GIS is a very useful tool forhandling spatial data since it has several functionsfor capturing, editing, manipulating and modellingspatial data. The most important step before usingGIS is that such data must be geo-referenced, thatis, they must have a known grid reference for thelocation of the data. The following sections willdiscuss how health planners have applied GIS inhandling their relevant data [21-25].
HEALTH CARE PLANNING IN SAUDI ARABIA
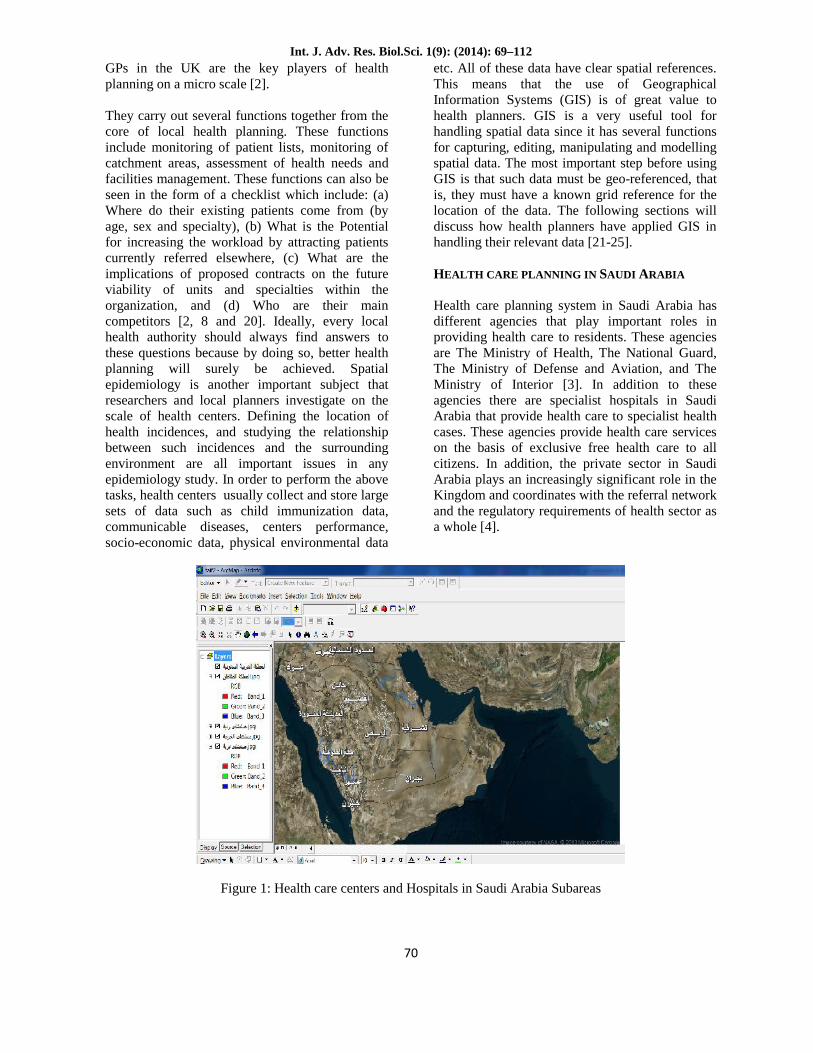
Health care planning system in Saudi Arabia hasdifferent agencies that play important roles inproviding health care to residents. These agenciesare The Ministry of Health, The National Guard,The Ministry of Defense and Aviation, and TheMinistry of Interior [3]. In addition to theseagencies there are specialist hospitals in SaudiArabia that provide health care to specialist healthcases. These agencies provide health care serviceson the basis of exclusive free health care to allcitizens. In addition, the private sector in SaudiArabia plays an increasingly significant role in theKingdom and coordinates with the referral networkand the regulatory requirements of health sector asa whole [4].
Figure 1: Health care centers and Hospitals in Saudi Arabia Subareas
Int. J. Adv. Res. Biol.Sci. 1(9): (2014): 69–112
71
The Ministry of health in Saudi Arabia has seenthat the primary objective of both the public andprivate health sector is to improve the healthconditions of all citizens through the provision ofcomprehensive preventive and curative healthservices throughout the Kingdom, with particularemphasis on equitable and efficient primary healthcare (ibid). In order to achieve this objective, TheMinistry of Health have identified long termobjectives to be accomplished in the futureincluding (a) the completion of all preventive andprimary health care facilities, and the fullimplementation of the referral system for theoptimal provision of preventive and curative healthservices, (b) the development of a healthinformation system necessary for efficient,effective health care delivery, and (c) furtherdevelopment of national health manpower throughprogrammers which raise productivity and improveperformance, and which provide the specializationneeded to maintain a high level of health services[5]. Saudi Arabia is divided into eleven healthregions each is headed by a regional healthdirectorate. Most of the planning and decision-making output has been centralized in Riyadh,which the capital of Saudi Arabia. However,regionalization has started with more authoritybeing delegated to the regional directors [6]. TheMinistry of Health provides almost 65% of healthservices, 28% of the services are provided by morethan ten government agencies, and 18% of theservices are provided by the private sector [5].Health facilities in Saudi Arabia are growing everyyear in terms of number of new health centers,additional health supply, and more new publichospitals. According to the Ministry of Healthannual report, health centers have increased from1707 centers in 1993 to 1737 centers in 1998 andthe number of hospitals also increased from 174 in1993 to 180 hospitals in 1998 [7]. There are sets ofstandards that are produced in Saudi Arabia toevaluate and plan the location of health facilities.These indicate that every hospital should provide2.5 beds for every 1000 persons with a catchmentarea of 4 – 8 km and, health centers, on the otherhand, should serve a catchment area of 2 – 4 km.These standards are going to be tested by this studyat the GIS application section [8, 20].
GIS and health care planning
The area of GIS and health care has risen toprominence in the past 5 – 10 years with therecognition that health surveillance practices andhealth service allocations need to become moresensitive to the needs of people in local geographicareas [8-9]. The collection, storage andmanipulation of geographic information haveundergone a revolution in recent years with thedevelopment and wide spread availability of GISsoftware's. Today, many health care planners andofficers can benefit from education and training inthe GIS field and this will give them the chance ofinfluencing the progress of health surveillance,environmental health assessment and thegeographic allocation of health resources [8].The rapid adoption of GIS in the field of healthcare planning is actually a result of the followingissues:
The increasing availability of geo-codedhealth data that lead to having health
information systems. The availability of digital geographic data
at micro and/or micro scale that hasseveral GIS coverage with enormousattribute data such as addresses land use,ownership, etc.
GIS software's such as ArcGIS producedby Environmental Systems ResearchInstitute (ESRI) become inexpensive andeasier to use and runs on a wider range ofplatforms e.g ,Unix, IBM, Windows.
The availability of spatial analysis tools, asseparate software modules or embedded isGIS.
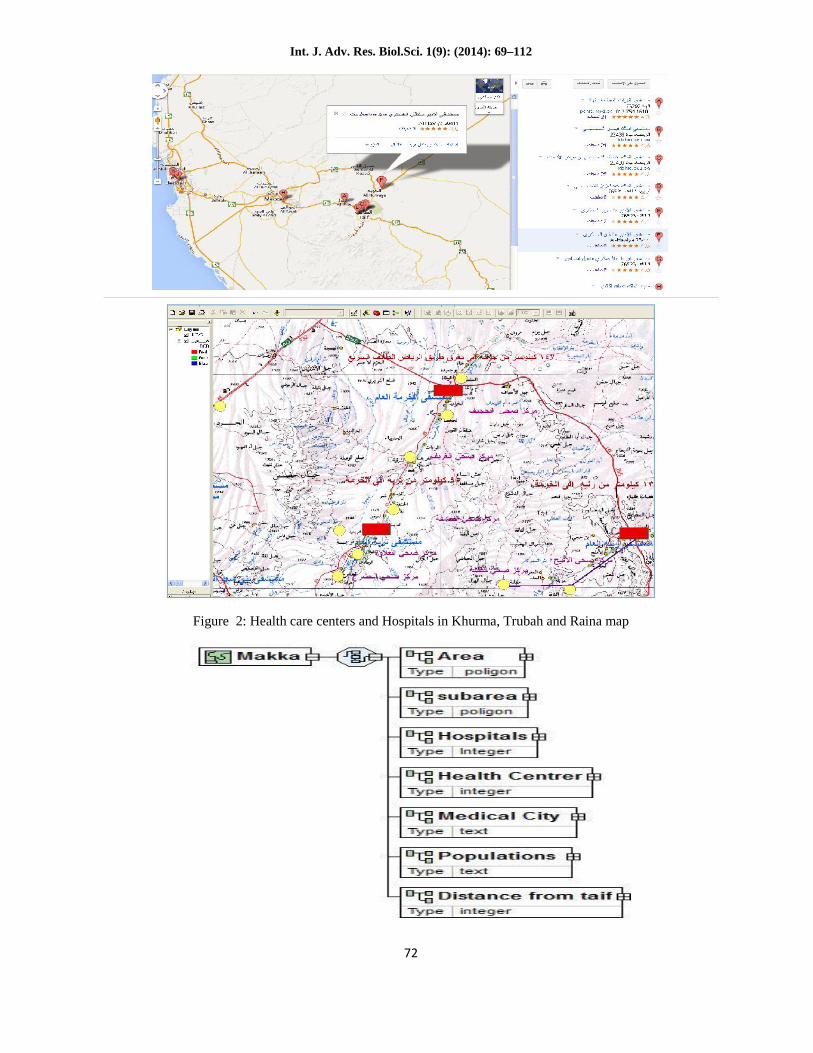
XML Schema in Health Care System in TaifCity
XML Instance Representation<...><Area> poligon </Area> [1]<subarea> poligon </subarea> [1]<Hospitals> Integer </Hospitals> [1]<Health Centrer> integer </Health Centrer> [1]<Medical City > text </Medical City > [1]<Populations > text </Populations > [1]<Distance from taif> integer </Distance from taif> [1]</...>
Int. J. Adv. Res. Biol.Sci. 1(9): (2014): 69–112
72
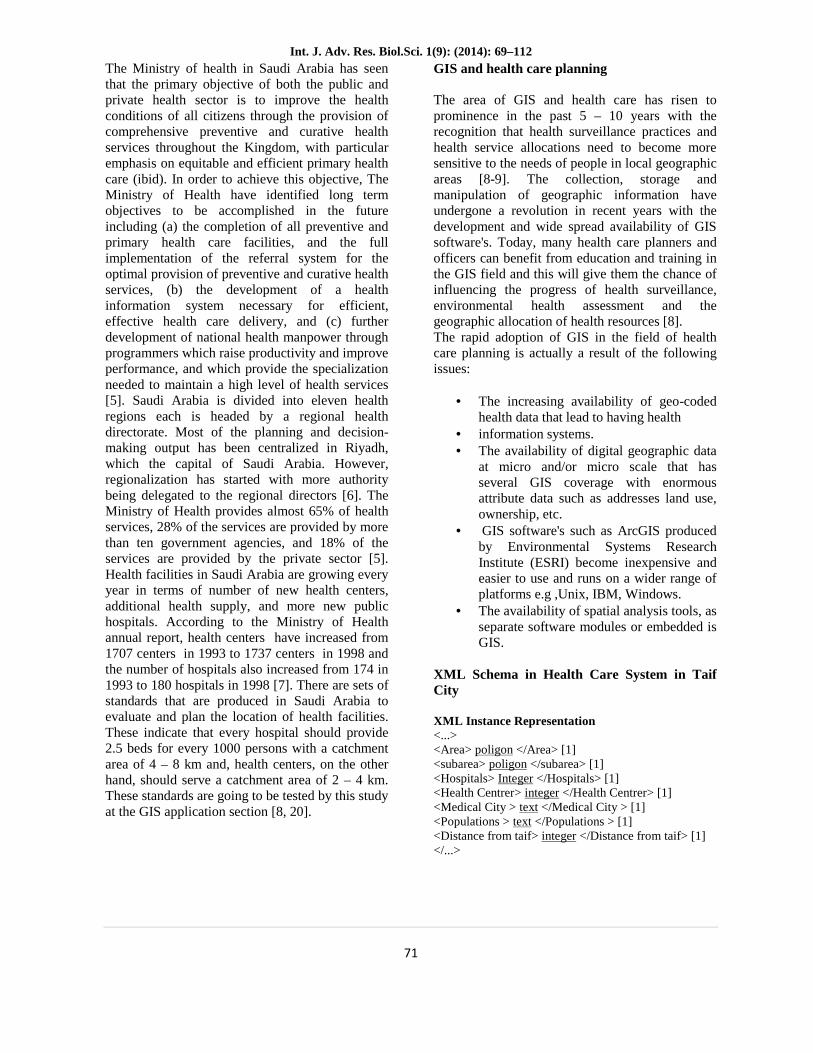
Figure 2: Health care centers and Hospitals in Khurma, Trubah and Raina map
Int. J. Adv. Res. Biol.Sci. 1(9): (2014): 69–112
73
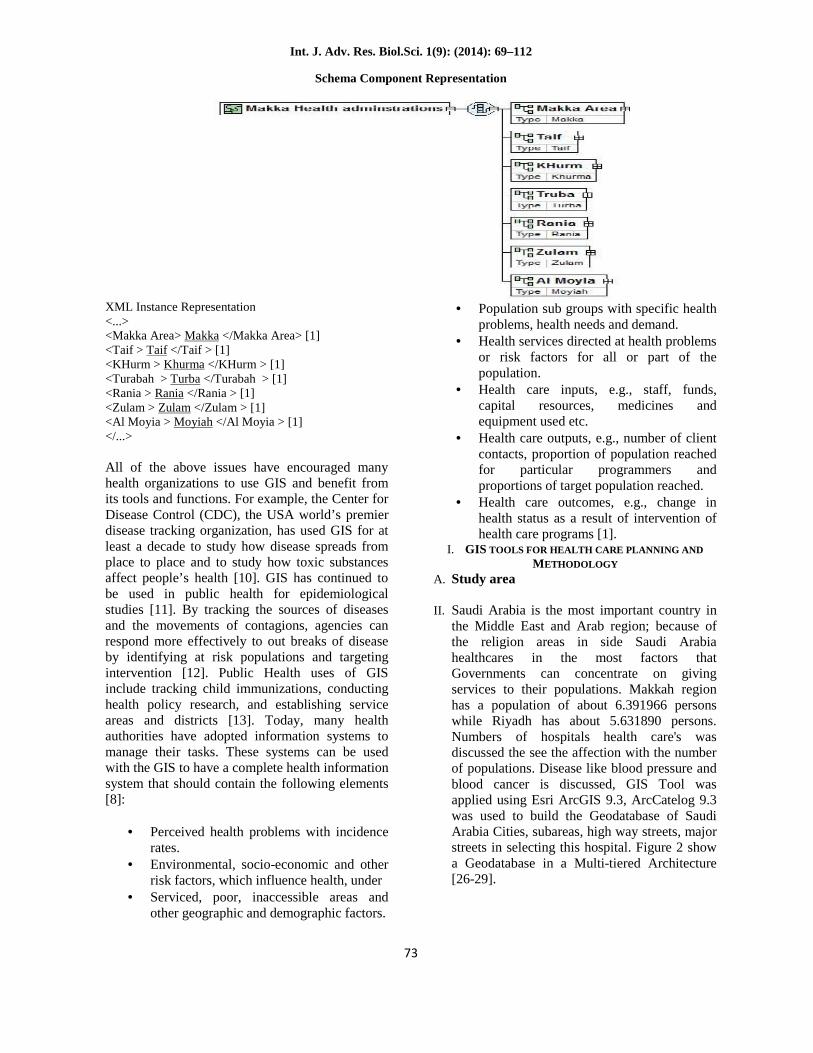
Schema Component Representation
XML Instance Representation<...><Makka Area> Makka </Makka Area> [1]<Taif > Taif </Taif > [1]<KHurm > Khurma </KHurm > [1]<Turabah > Turba </Turabah > [1]<Rania > Rania </Rania > [1]<Zulam > Zulam </Zulam > [1]<Al Moyia > Moyiah </Al Moyia > [1]</...>
All of the above issues have encouraged manyhealth organizations to use GIS and benefit fromits tools and functions. For example, the Center forDisease Control (CDC), the USA world’s premierdisease tracking organization, has used GIS for atleast a decade to study how disease spreads fromplace to place and to study how toxic substancesaffect people’s health [10]. GIS has continued tobe used in public health for epidemiologicalstudies [11]. By tracking the sources of diseasesand the movements of contagions, agencies canrespond more effectively to out breaks of diseaseby identifying at risk populations and targetingintervention [12]. Public Health uses of GISinclude tracking child immunizations, conductinghealth policy research, and establishing serviceareas and districts [13]. Today, many healthauthorities have adopted information systems tomanage their tasks. These systems can be usedwith the GIS to have a complete health informationsystem that should contain the following elements[8]:
Perceived health problems with incidencerates.
Environmental, socio-economic and otherrisk factors, which influence health, under
Serviced, poor, inaccessible areas andother geographic and demographic factors.
Population sub groups with specific healthproblems, health needs and demand.
Health services directed at health problemsor risk factors for all or part of thepopulation.
Health care inputs, e.g., staff, funds,capital resources, medicines andequipment used etc.
Health care outputs, e.g., number of clientcontacts, proportion of population reachedfor particular programmers andproportions of target population reached.
Health care outcomes, e.g., change inhealth status as a result of intervention ofhealth care programs [1].
I. GIS TOOLS FOR HEALTH CARE PLANNING ANDMETHODOLOGY
A. Study area
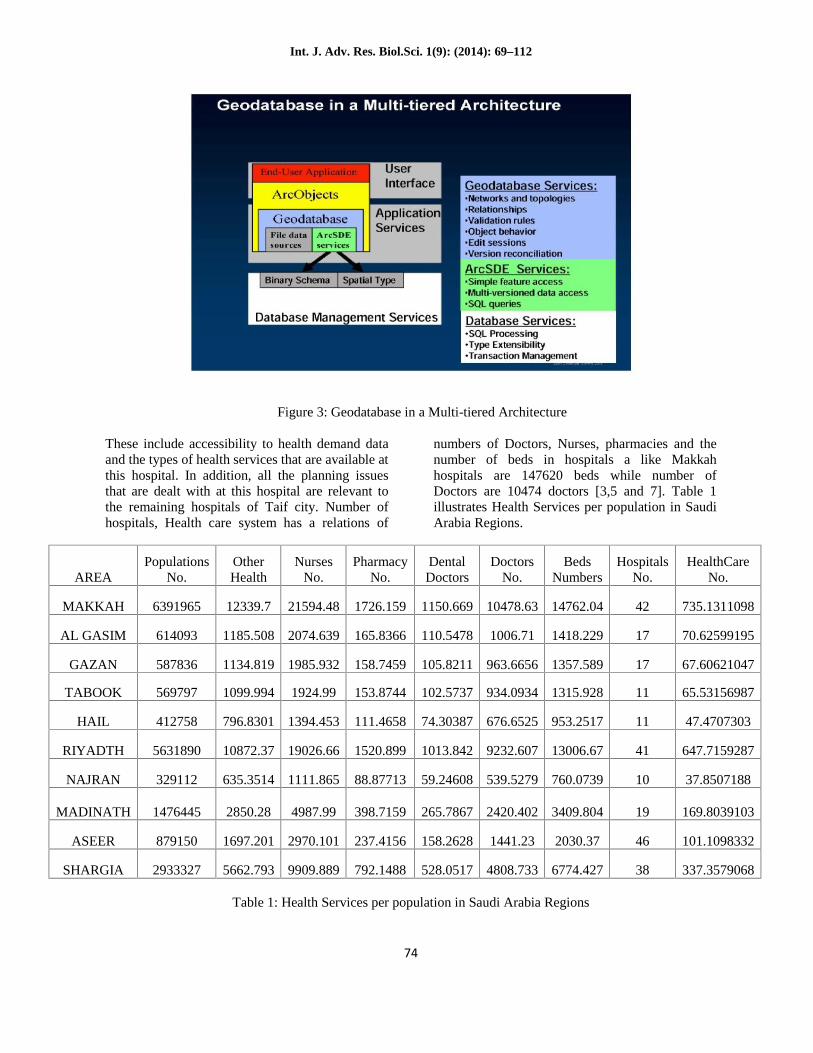
II. Saudi Arabia is the most important country inthe Middle East and Arab region; because ofthe religion areas in side Saudi Arabiahealthcares in the most factors thatGovernments can concentrate on givingservices to their populations. Makkah regionhas a population of about 6.391966 personswhile Riyadh has about 5.631890 persons.Numbers of hospitals health care's wasdiscussed the see the affection with the numberof populations. Disease like blood pressure andblood cancer is discussed, GIS Tool wasapplied using Esri ArcGIS 9.3, ArcCatelog 9.3was used to build the Geodatabase of SaudiArabia Cities, subareas, high way streets, majorstreets in selecting this hospital. Figure 2 showa Geodatabase in a Multi-tiered Architecture[26-29].
Int. J. Adv. Res. Biol.Sci. 1(9): (2014): 69–112
74
Figure 3: Geodatabase in a Multi-tiered Architecture
These include accessibility to health demand dataand the types of health services that are available atthis hospital. In addition, all the planning issuesthat are dealt with at this hospital are relevant tothe remaining hospitals of Taif city. Number ofhospitals, Health care system has a relations of
numbers of Doctors, Nurses, pharmacies and thenumber of beds in hospitals a like Makkahhospitals are 147620 beds while number ofDoctors are 10474 doctors [3,5 and 7]. Table 1illustrates Health Services per population in SaudiArabia Regions.
HealthCareNo.
HospitalsNo.
BedsNumbers
DoctorsNo.
DentalDoctors
PharmacyNo.
NursesNo.
OtherHealth
PopulationsNo.AREA
735.13110984214762.0410478.631150.6691726.15921594.4812339.76391965MAKKAH
70.62599195171418.2291006.71110.5478165.83662074.6391185.508614093AL GASIM
67.60621047171357.589963.6656105.8211158.74591985.9321134.819587836GAZAN
65.53156987111315.928934.0934102.5737153.87441924.991099.994569797TABOOK
47.470730311953.2517676.652574.30387111.46581394.453796.8301412758HAIL
647.71592874113006.679232.6071013.8421520.89919026.6610872.375631890RIYADTH
37.850718810760.0739539.527959.2460888.877131111.865635.3514329112NAJRAN
169.8039103193409.8042420.402265.7867398.71594987.992850.281476445MADINATH
101.1098332462030.371441.23158.2628237.41562970.1011697.201879150ASEER
337.3579068386774.4274808.733528.0517792.14889909.8895662.7932933327SHARGIA
Table 1: Health Services per population in Saudi Arabia Regions
Int. J. Adv. Res. Biol.Sci. 1(9): (2014): 69–112
75
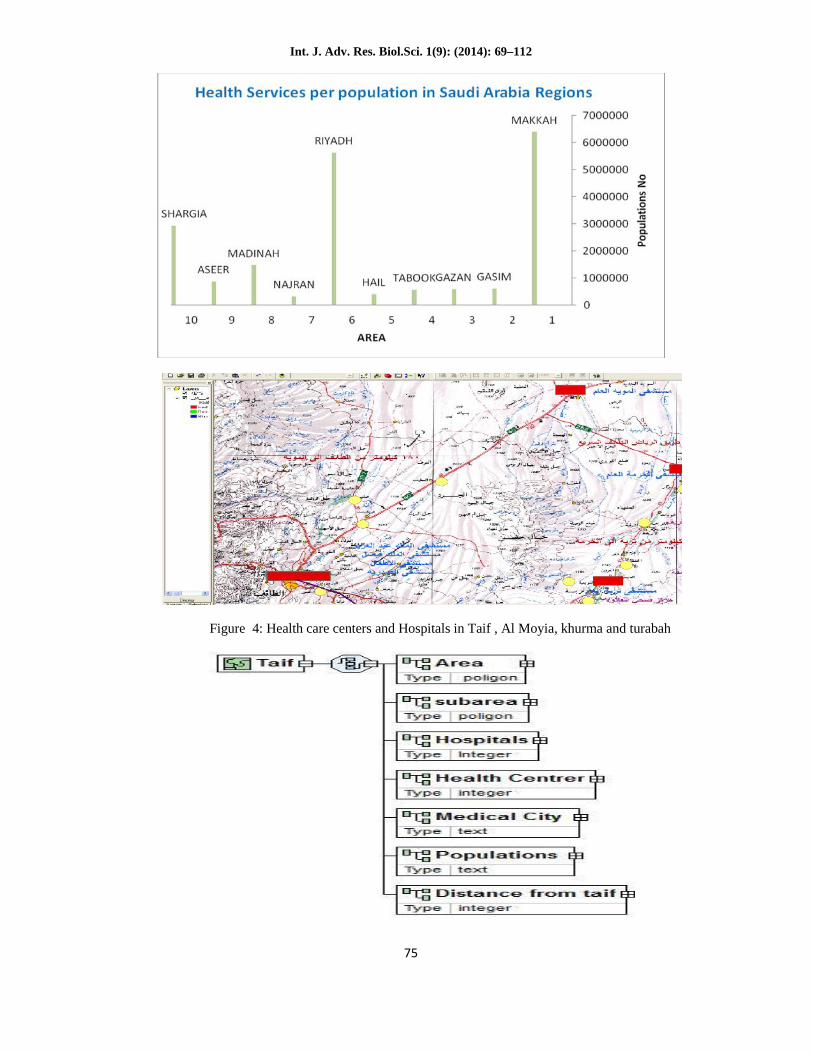
Figure 4: Health care centers and Hospitals in Taif , Al Moyia, khurma and turabah
Int. J. Adv. Res. Biol.Sci. 1(9): (2014): 69–112
76
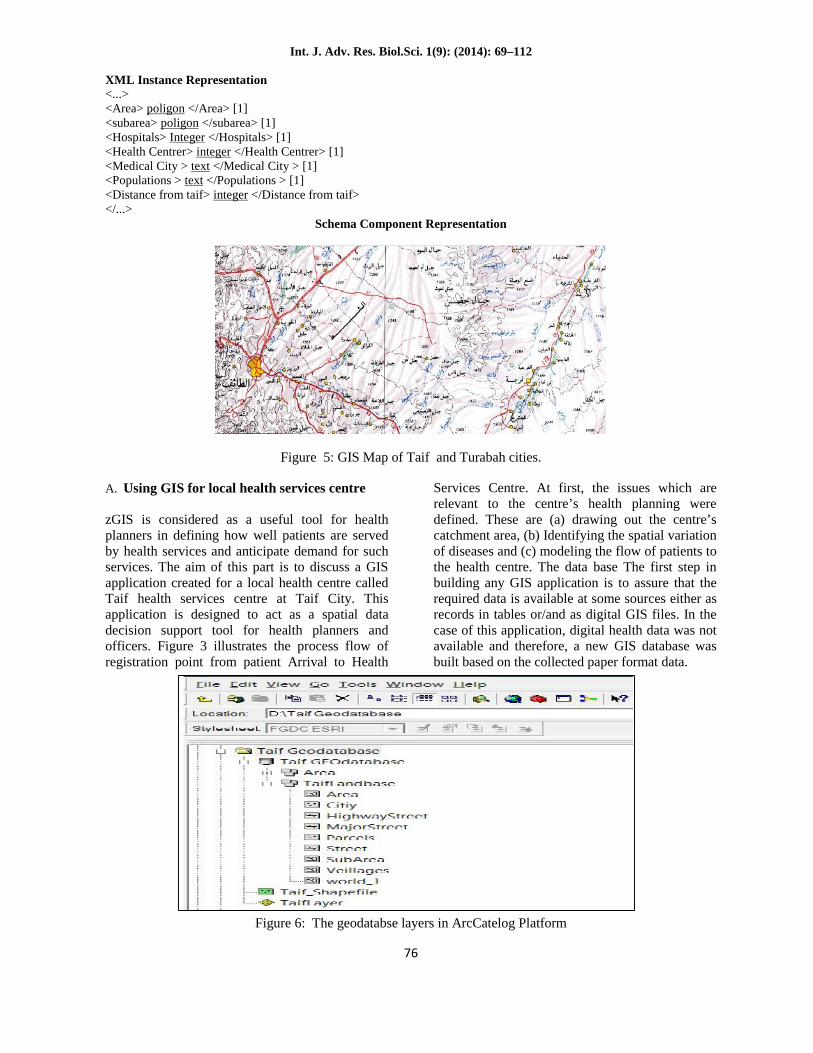
XML Instance Representation<...><Area> poligon </Area> [1]<subarea> poligon </subarea> [1]<Hospitals> Integer </Hospitals> [1]<Health Centrer> integer </Health Centrer> [1]<Medical City > text </Medical City > [1]<Populations > text </Populations > [1]<Distance from taif> integer </Distance from taif></...>
Schema Component Representation
Figure 5: GIS Map of Taif and Turabah cities.
A. Using GIS for local health services centre
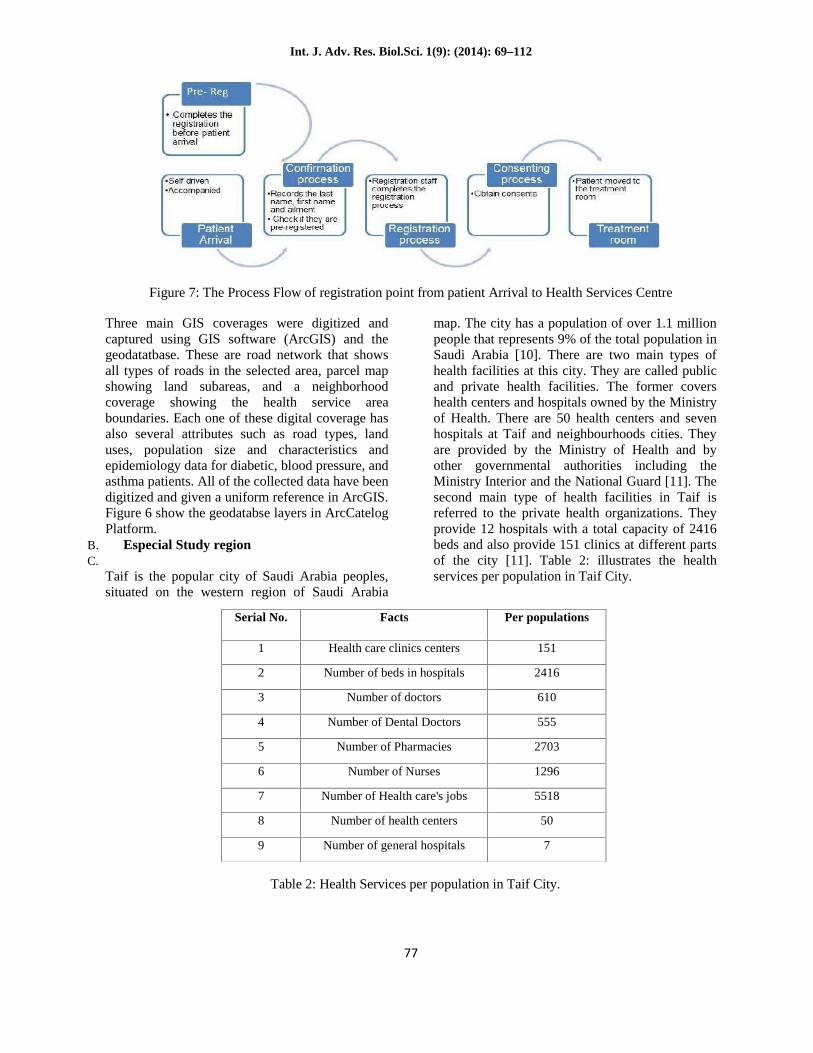
zGIS is considered as a useful tool for healthplanners in defining how well patients are servedby health services and anticipate demand for suchservices. The aim of this part is to discuss a GISapplication created for a local health centre calledTaif health services centre at Taif City. Thisapplication is designed to act as a spatial datadecision support tool for health planners andofficers. Figure 3 illustrates the process flow ofregistration point from patient Arrival to Health
Services Centre. At first, the issues which arerelevant to the centre’s health planning weredefined. These are (a) drawing out the centre’scatchment area, (b) Identifying the spatial variationof diseases and (c) modeling the flow of patients tothe health centre. The data base The first step inbuilding any GIS application is to assure that therequired data is available at some sources either asrecords in tables or/and as digital GIS files. In thecase of this application, digital health data was notavailable and therefore, a new GIS database wasbuilt based on the collected paper format data.
Figure 6: The geodatabse layers in ArcCatelog Platform
Int. J. Adv. Res. Biol.Sci. 1(9): (2014): 69–112
77
Figure 7: The Process Flow of registration point from patient Arrival to Health Services Centre
Three main GIS coverages were digitized andcaptured using GIS software (ArcGIS) and thegeodatatbase. These are road network that showsall types of roads in the selected area, parcel mapshowing land subareas, and a neighborhoodcoverage showing the health service areaboundaries. Each one of these digital coverage hasalso several attributes such as road types, landuses, population size and characteristics andepidemiology data for diabetic, blood pressure, andasthma patients. All of the collected data have beendigitized and given a uniform reference in ArcGIS.Figure 6 show the geodatabse layers in ArcCatelogPlatform.
B. Especial Study regionC.
Taif is the popular city of Saudi Arabia peoples,situated on the western region of Saudi Arabia
map. The city has a population of over 1.1 millionpeople that represents 9% of the total population inSaudi Arabia [10]. There are two main types ofhealth facilities at this city. They are called publicand private health facilities. The former covershealth centers and hospitals owned by the Ministryof Health. There are 50 health centers and sevenhospitals at Taif and neighbourhoods cities. Theyare provided by the Ministry of Health and byother governmental authorities including theMinistry Interior and the National Guard [11]. Thesecond main type of health facilities in Taif isreferred to the private health organizations. Theyprovide 12 hospitals with a total capacity of 2416beds and also provide 151 clinics at different partsof the city [11]. Table 2: illustrates the healthservices per population in Taif City.
Table 2: Health Services per population in Taif City.
Serial No. Facts Per populations
1 Health care clinics centers 151
2 Number of beds in hospitals 2416
3 Number of doctors 610
4 Number of Dental Doctors 555
5 Number of Pharmacies 2703
6 Number of Nurses 1296
7 Number of Health care's jobs 5518
8 Number of health centers 50
9 Number of general hospitals 7
Int. J. Adv. Res. Biol.Sci. 1(9): (2014): 69–112
78
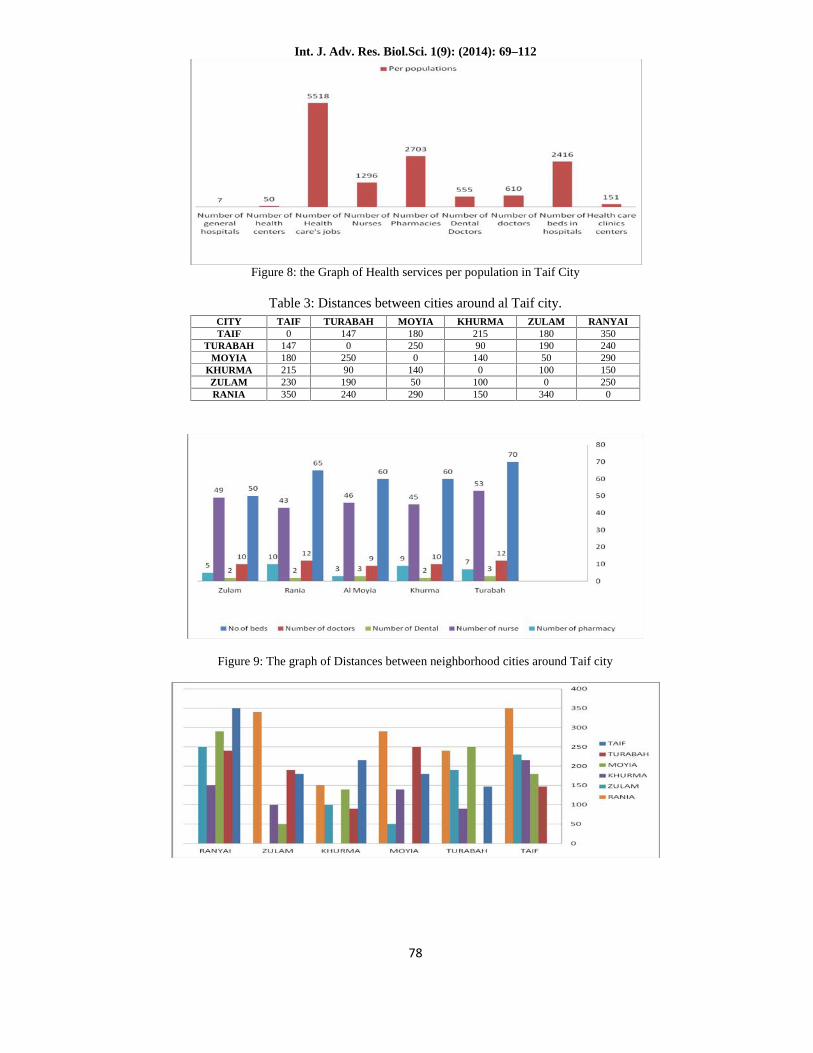
Figure 8: the Graph of Health services per population in Taif City
Table 3: Distances between cities around al Taif city.
Figure 9: The graph of Distances between neighborhood cities around Taif city
CITY TAIF TURABAH MOYIA KHURMA ZULAM RANYAITAIF 0 147 180 215 180 350
TURABAH 147 0 250 90 190 240MOYIA 180 250 0 140 50 290
KHURMA 215 90 140 0 100 150ZULAM 230 190 50 100 0 250RANIA 350 240 290 150 340 0
Int. J. Adv. Res. Biol.Sci. 1(9): (2014): 69–112
79
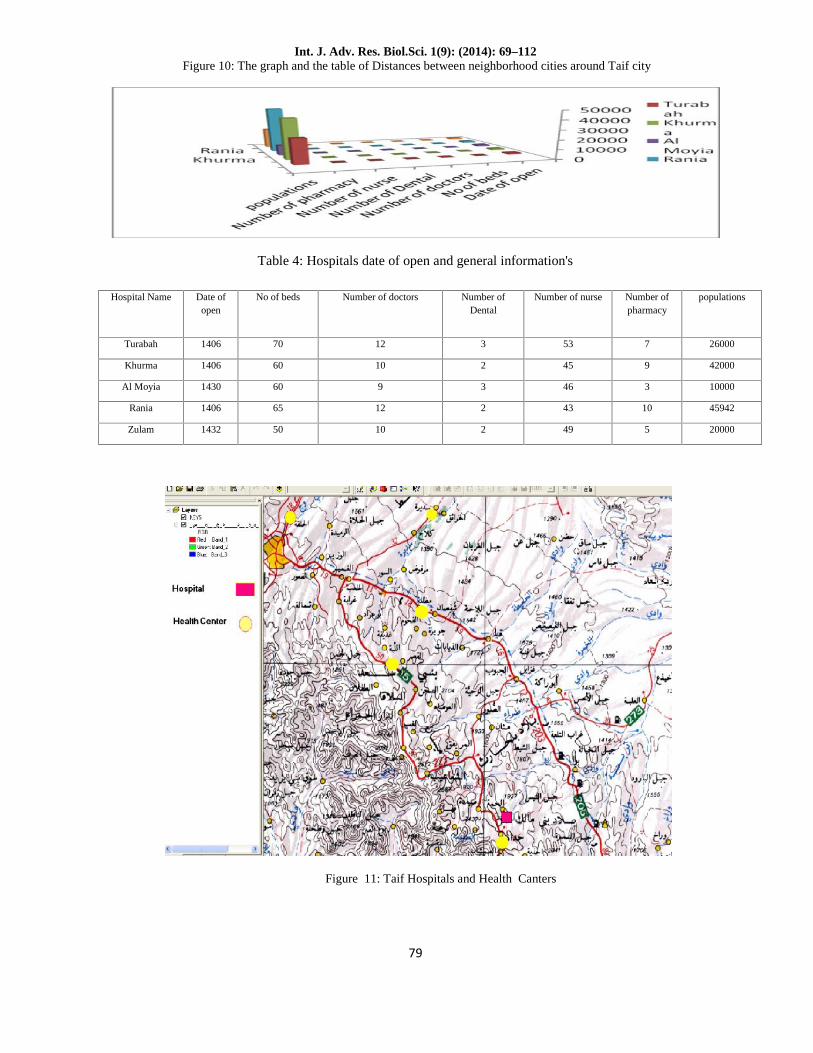
Figure 10: The graph and the table of Distances between neighborhood cities around Taif city
Table 4: Hospitals date of open and general information's
Figure 11: Taif Hospitals and Health Canters
Hospital Name Date ofopen
No of beds Number of doctors Number ofDental
Number of nurse Number ofpharmacy
populations
Turabah 1406 70 12 3 53 7 26000
Khurma 1406 60 10 2 45 9 42000
Al Moyia 1430 60 9 3 46 3 10000
Rania 1406 65 12 2 43 10 45942
Zulam 1432 50 10 2 49 5 20000
Int. J. Adv. Res. Biol.Sci. 1(9): (2014): 69–112
80
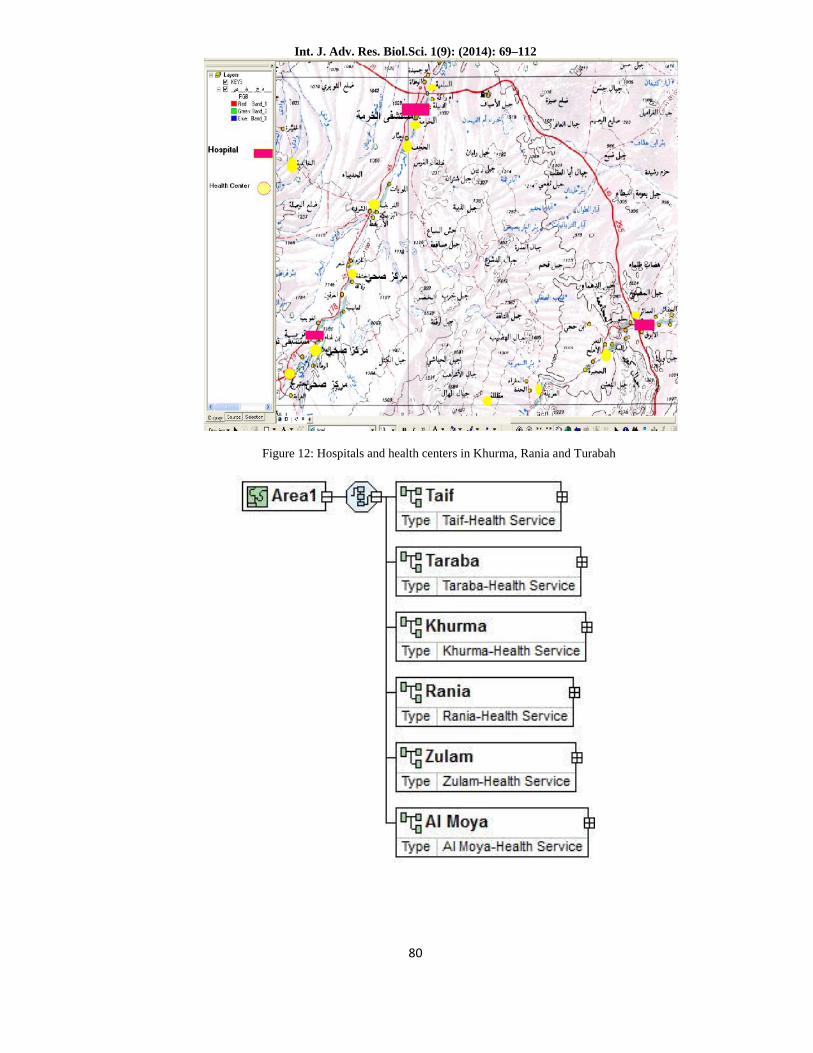
Figure 12: Hospitals and health centers in Khurma, Rania and Turabah
Int. J. Adv. Res. Biol.Sci. 1(9): (2014): 69–112
81
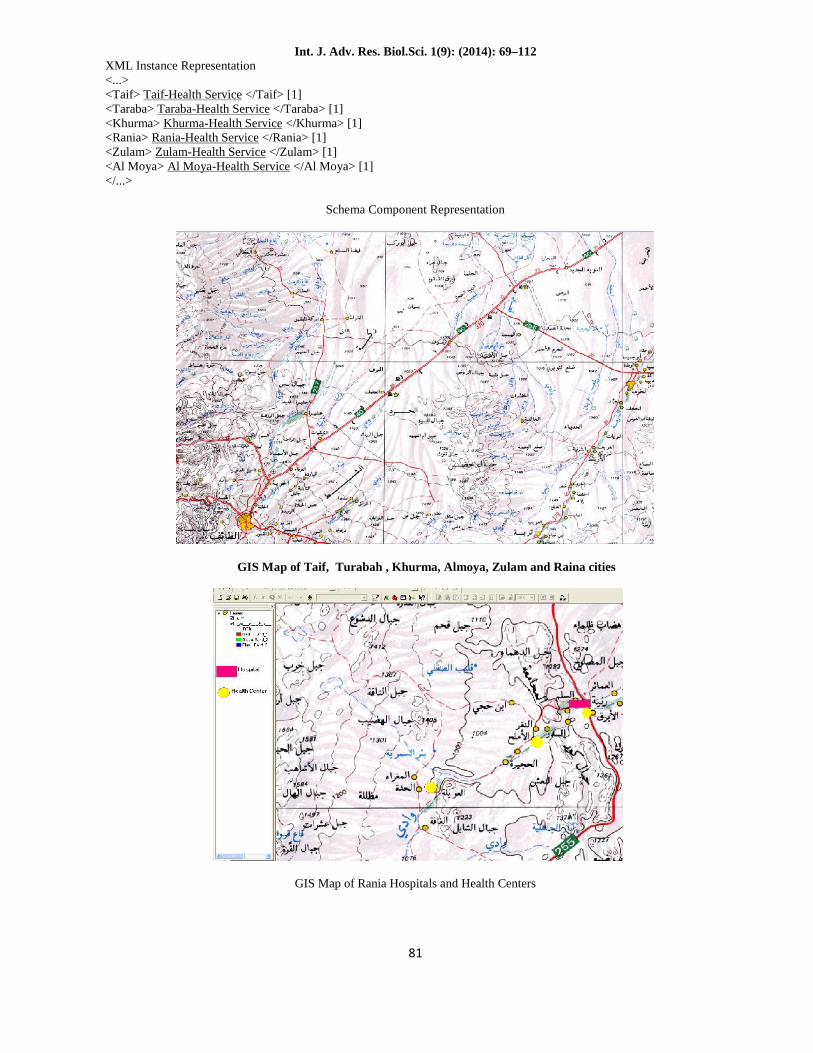
XML Instance Representation<...><Taif> Taif-Health Service </Taif> [1]<Taraba> Taraba-Health Service </Taraba> [1]<Khurma> Khurma-Health Service </Khurma> [1]<Rania> Rania-Health Service </Rania> [1]<Zulam> Zulam-Health Service </Zulam> [1]<Al Moya> Al Moya-Health Service </Al Moya> [1]</...>
Schema Component Representation
GIS Map of Taif, Turabah , Khurma, Almoya, Zulam and Raina cities
GIS Map of Rania Hospitals and Health Centers
Int. J. Adv. Res. Biol.Sci. 1(9): (2014): 69–112
82
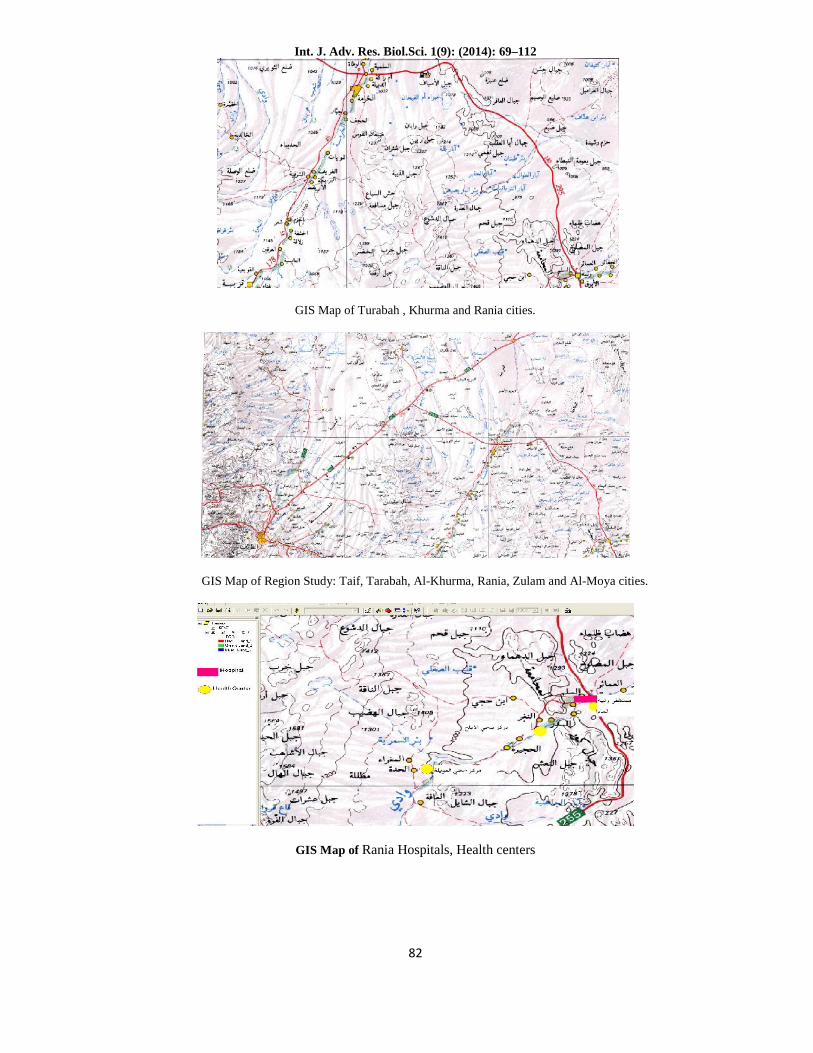
GIS Map of Turabah , Khurma and Rania cities.
GIS Map of Region Study: Taif, Tarabah, Al-Khurma, Rania, Zulam and Al-Moya cities.
GIS Map of Rania Hospitals, Health centers
Int. J. Adv. Res. Biol.Sci. 1(9): (2014): 69–112
83
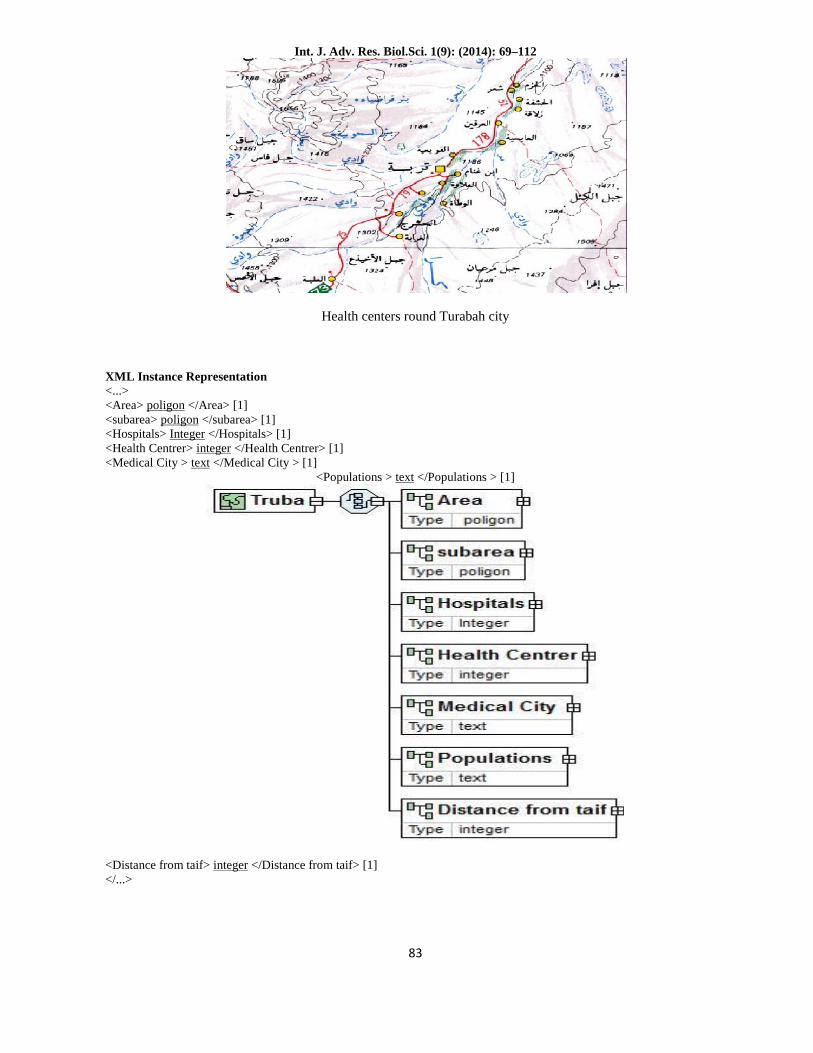
Health centers round Turabah city
XML Instance Representation<...><Area> poligon </Area> [1]<subarea> poligon </subarea> [1]<Hospitals> Integer </Hospitals> [1]<Health Centrer> integer </Health Centrer> [1]<Medical City > text </Medical City > [1]
<Populations > text </Populations > [1]
<Distance from taif> integer </Distance from taif> [1]</...>
Int. J. Adv. Res. Biol.Sci. 1(9): (2014): 69–112
84
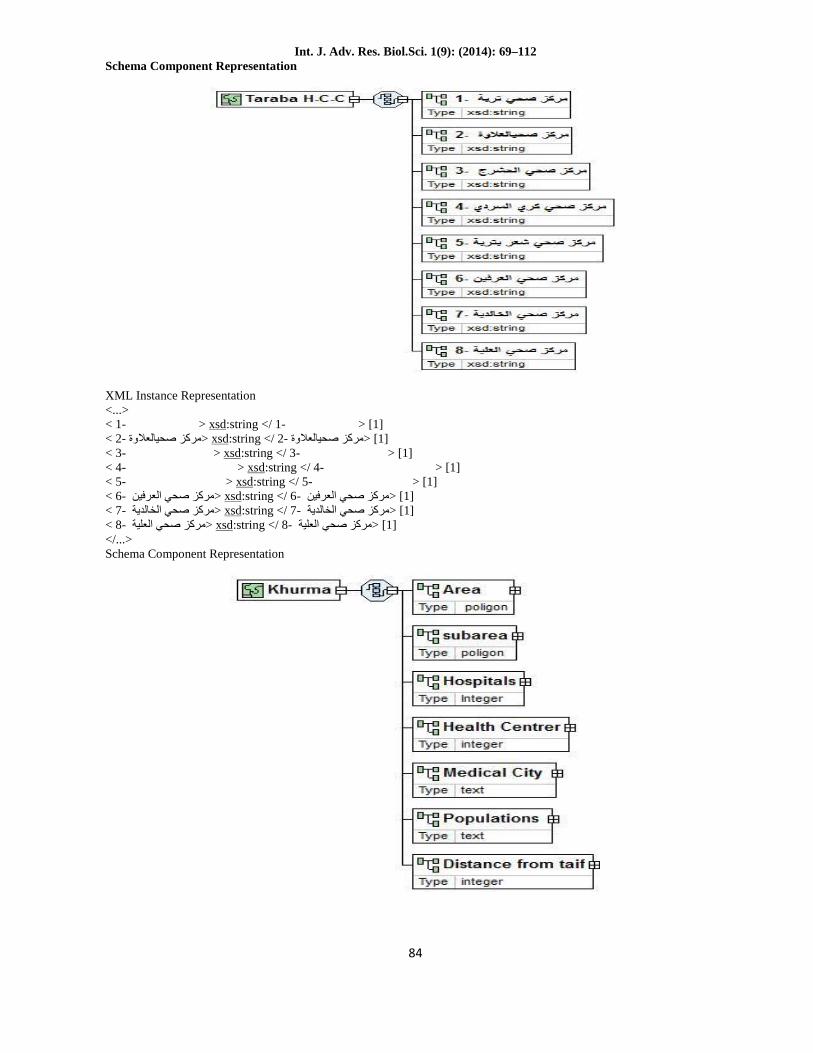
Schema Component Representation
XML Instance Representation<...>< 1- <مركز صحي تربة xsd:string </ 1- <مركز صحي تربة [1]< 2- <مركز صحیالعالوة xsd:string </ 2- <مركز صحیالعالوة [1]< 3- <مركز صحي الحشرج xsd:string </ 3- <مركز صحي الحشرج [1]< 4- <مركز صحي كري السردي xsd:string </ 4- <مركز صحي كري السردي [1]< 5- <مركز صحي شعر بتربة xsd:string </ 5- <مركز صحي شعر بتربة [1]< 6- <مركز صحي العرفین xsd:string </ 6- <مركز صحي العرفین [1]< 7- <مركز صحي الخالدیة xsd:string </ 7- <مركز صحي الخالدیة [1]< 8- <مركز صحي العلیة xsd:string </ 8- <مركز صحي العلیة [1]</...>Schema Component Representation
Int. J. Adv. Res. Biol.Sci. 1(9): (2014): 69–112
85
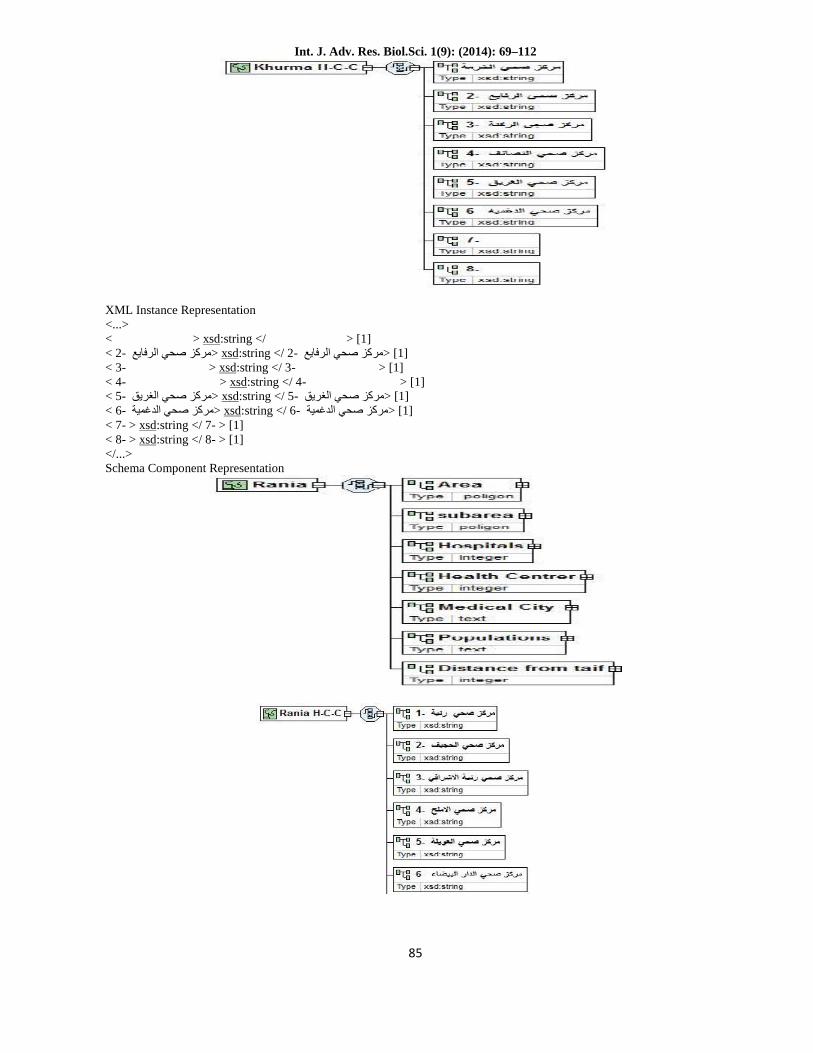
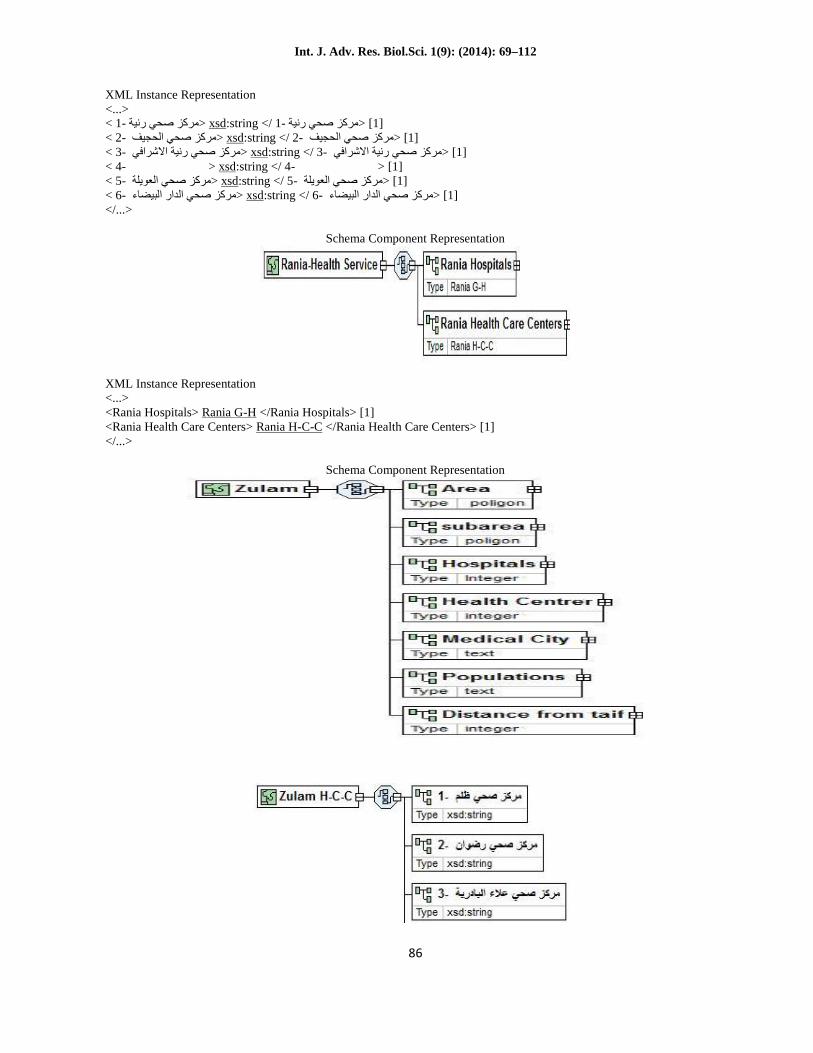
XML Instance Representation<...><مركز صحي الخرمة> xsd:string <مركز صحي الخرمة/> [1]< 2- <مركز صحي الرفایع xsd:string </ 2- <مركز صحي الرفایع [1]< 3- <مركز صجي الركنة xsd:string </ 3- <مركز صجي الركنة [1]< 4- <مركز صحي النصائف xsd:string </ 4- <مركز صحي النصائف [1]< 5- <مركز صحي الغریق xsd:string </ 5- <مركز صحي الغریق [1]< 6- <مركز صحي الدغمیة xsd:string </ 6- <مركز صحي الدغمیة [1]< 7- > xsd:string </ 7- > [1]< 8- > xsd:string </ 8- > [1]</...>Schema Component Representation
Int. J. Adv. Res. Biol.Sci. 1(9): (2014): 69–112
86
XML Instance Representation<...>< 1- <مركز صحي رنیة xsd:string </ 1- <مركز صحي رنیة [1]< 2- <مركز صحي الحجیف xsd:string </ 2- <مركز صحي الحجیف [1]< 3- <مركز صحي رنیة االشرافي xsd:string </ 3- <مركز صحي رنیة االشرافي [1]< 4- <مركز صحي االملح xsd:string </ 4- <مركز صحي االملح [1]< 5- <مركز صحي العویلة xsd:string </ 5- <مركز صحي العویلة [1]< 6- <مركز صحي الدار البیضاء xsd:string </ 6- <مركز صحي الدار البیضاء [1]</...>
Schema Component Representation
XML Instance Representation<...><Rania Hospitals> Rania G-H </Rania Hospitals> [1]<Rania Health Care Centers> Rania H-C-C </Rania Health Care Centers> [1]</...>
Schema Component Representation
Int. J. Adv. Res. Biol.Sci. 1(9): (2014): 69–112
87
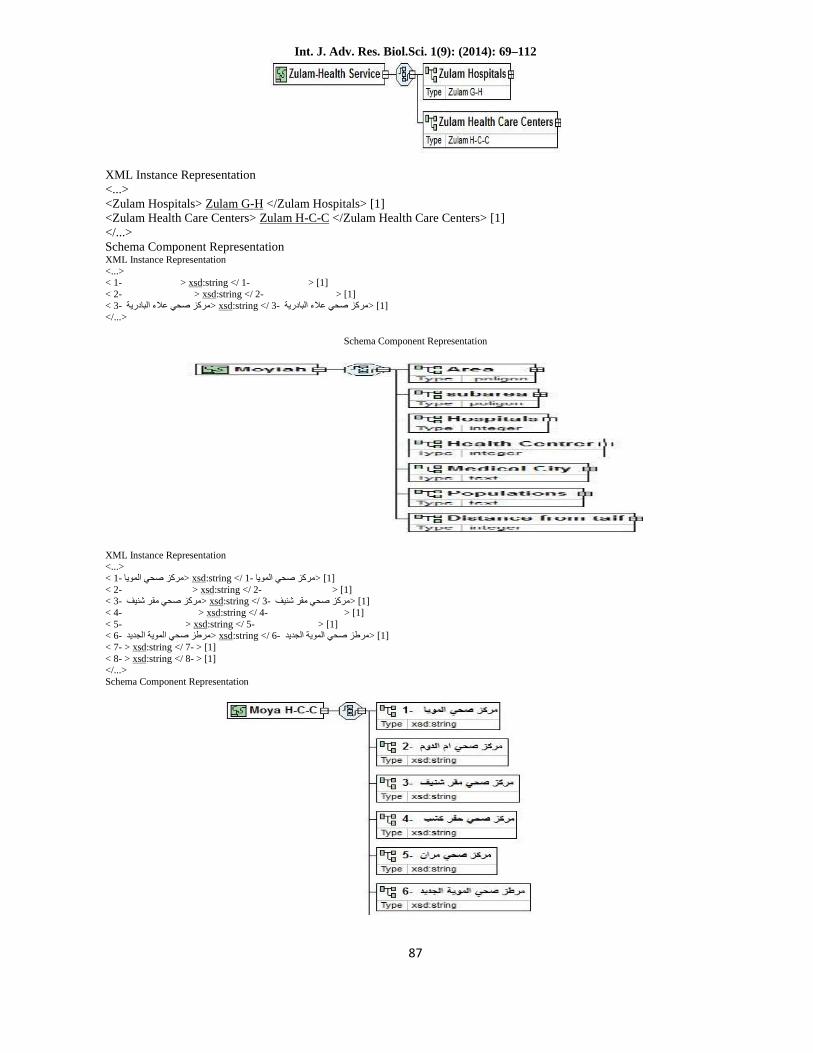
XML Instance Representation<...><Zulam Hospitals> Zulam G-H </Zulam Hospitals> [1]<Zulam Health Care Centers> Zulam H-C-C </Zulam Health Care Centers> [1]</...>Schema Component RepresentationXML Instance Representation<...>< 1- <مركز صحي ظلم xsd:string </ 1- [1] <مركز صحي ظلم < 2- <مركز صحي رضوان xsd:string </ 2- [1] <مركز صحي رضوان < 3- <مركز صحي عالء البادریة xsd:string </ 3- [1] <مركز صحي عالء البادریة </...>
Schema Component Representation
XML Instance Representation<...>< 1- <مركز صحي المویا xsd:string </ 1- [1] <مركز صحي المویا< 2- دوم مركز صحي ام ال > xsd:string </ 2- [1] <مركز صحي ام الدوم < 3- <مركز صحي مقر شنیف xsd:string </ 3- [1] <مركز صحي مقر شنیف < 4- <مركز صحي حفر كشب xsd:string </ 4- [1] <مركز صحي حفر كشب< 5- <مركز صحي مران xsd:string </ 5- [1] <مركز صحي مران < 6- <مرطز صحي المویة الجدید xsd:string </ 6- [1] <مرطز صحي المویة الجدید < 7- > xsd:string </ 7- > [1]< 8- > xsd:string </ 8- > [1]</...>Schema Component Representation
Int. J. Adv. Res. Biol.Sci. 1(9): (2014): 69–112
88
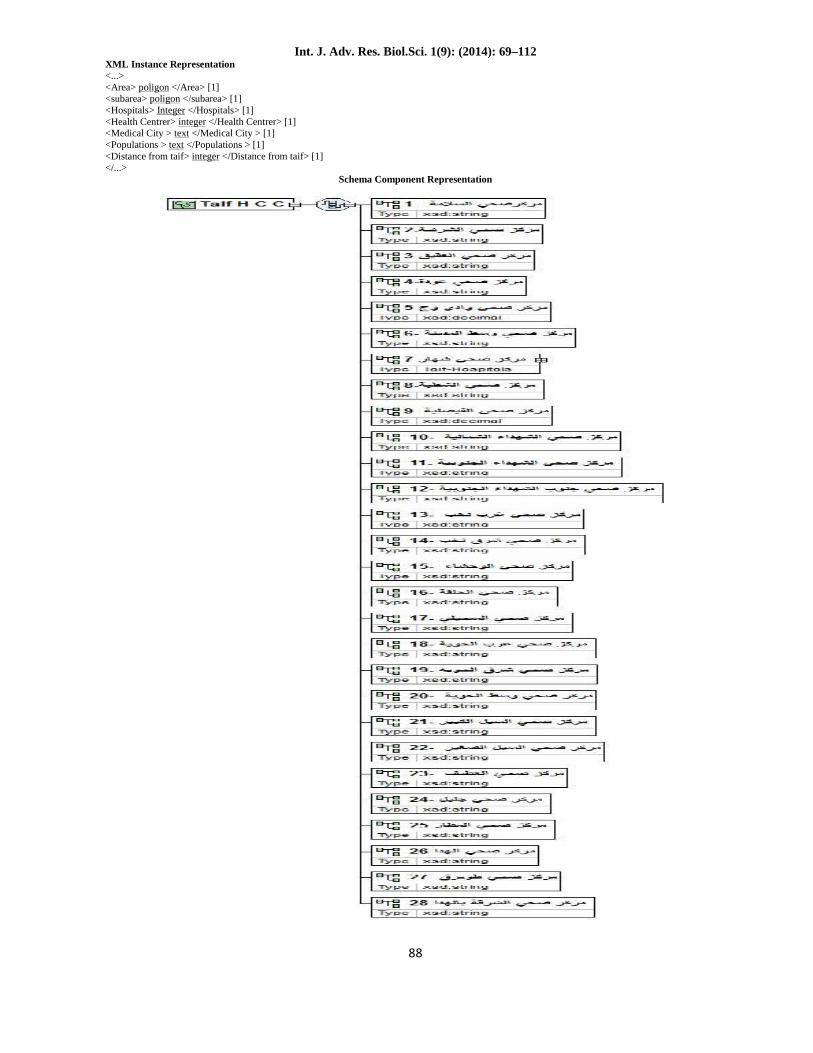
XML Instance Representation<...><Area> poligon </Area> [1]<subarea> poligon </subarea> [1]<Hospitals> Integer </Hospitals> [1]<Health Centrer> integer </Health Centrer> [1]<Medical City > text </Medical City > [1]<Populations > text </Populations > [1]<Distance from taif> integer </Distance from taif> [1]</...>
Schema Component Representation
Int. J. Adv. Res. Biol.Sci. 1(9): (2014): 69–112
89
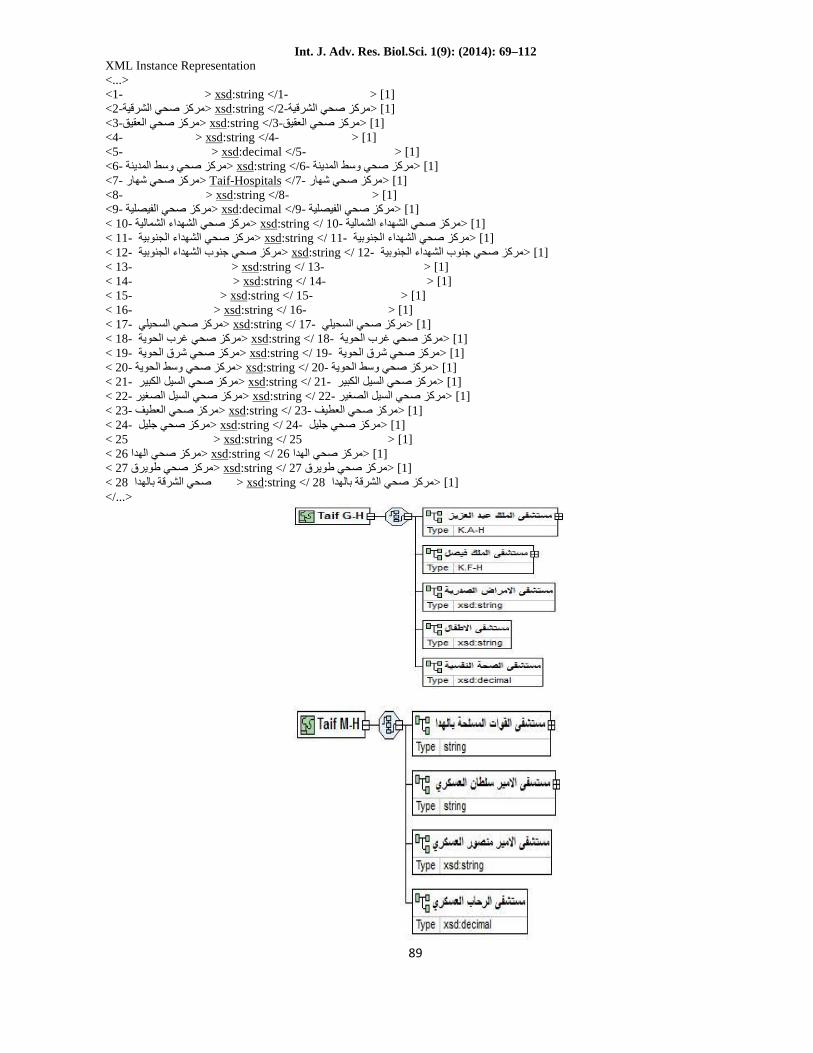
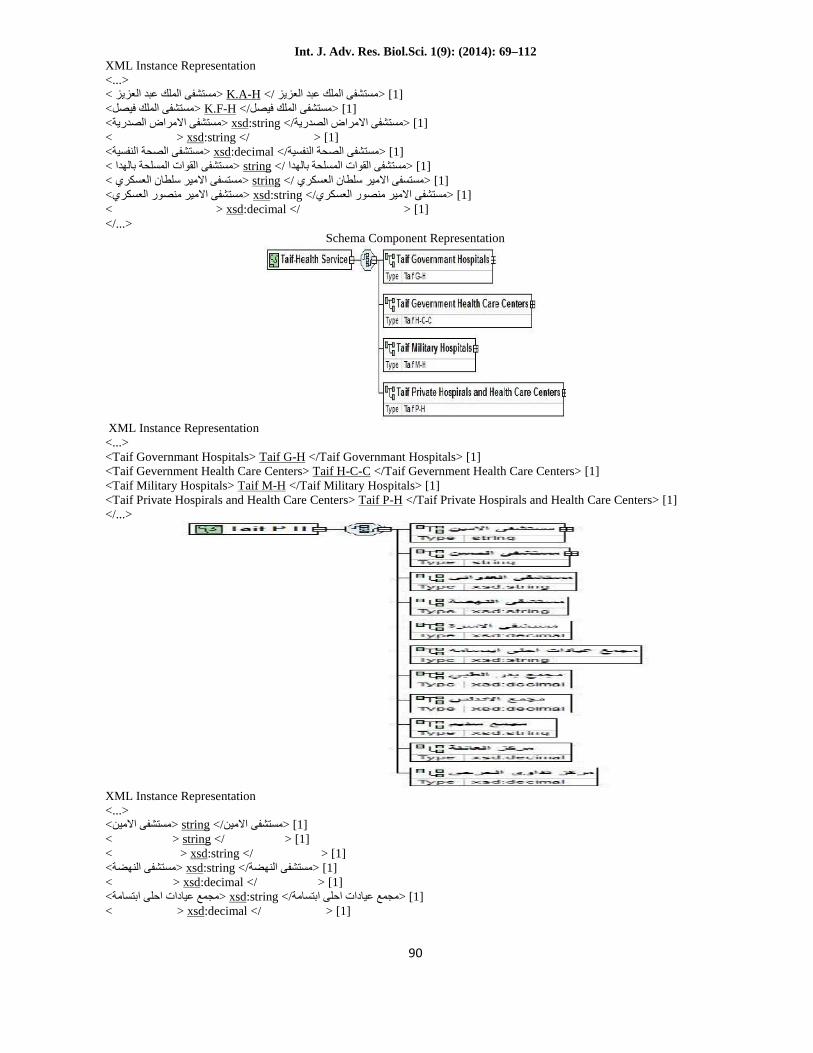
XML Instance Representation<...><1- <مركزصحي السالمة xsd:string </1- <مركزصحي السالمة [1]<مركز صحي الشرقیة-2> xsd:string <مركز صحي الشرقیة-2/> [1]<مركز صحي العقیق-3> xsd:string <مركز صحي العقیق-3/> [1]<مركز صحي عودة-4> xsd:string <مركز صحي عودة-4/> [1]<مركز صحي وادي وج-5> xsd:decimal <مركز صحي وادي وج-5/> [1]<6- <مركز صحي وسط المدینة xsd:string </6- <مركز صحي وسط المدینة [1]<مركز صحي شھار -7> Taif-Hospitals <مركز صحي شھار -7/> [1]<مركز صحي الشطبة -8> xsd:string <مركز صحي الشطبة -8/> [1]<9- <مركز صحي الفیصلیة xsd:decimal </9- <مركز صحي الفیصلیة [1]< 10- <مركز صحي الشھداء الشمالیة xsd:string </ 10- <مركز صحي الشھداء الشمالیة [1]< 11- <مركز صحي الشھداء الجنوبیة xsd:string </ 11- <مركز صحي الشھداء الجنوبیة [1]< 12- <مركز صحي جنوب الشھداء الجنوبیة xsd:string </ 12- <مركز صحي جنوب الشھداء الجنوبیة [1]< 13- <مركز صحي غرب نخب xsd:string </ 13- <مركز صحي غرب نخب [1]< 14- <مركز صحي شرق نخب xsd:string </ 14- <مركز صحي شرق نخب [1]< 15- <مركز صحي الوحشاء xsd:string </ 15- <مركز صحي الوحشاء [1]< 16- <مركز صحي الحلقة xsd:string </ 16- <مركز صحي الحلقة [1]< 17- <مركز صحي السحیلي xsd:string </ 17- <مركز صحي السحیلي [1]< 18- <مركز صحي غرب الحویة xsd:string </ 18- <مركز صحي غرب الحویة [1]< 19- <مركز صحي شرق الحویة xsd:string </ 19- <مركز صحي شرق الحویة [1]< 20- <مركز صحي وسط الحویة xsd:string </ 20- <مركز صحي وسط الحویة [1]< 21- <مركز صحي السیل الكبیر xsd:string </ 21- <مركز صحي السیل الكبیر [1]< 22- <مركز صحي السیل الصغیر xsd:string </ 22- <مركز صحي السیل الصغیر [1]< 23- <مركز صحي العطیف xsd:string </ 23- <مركز صحي العطیف [1]< 24- <مركز صحي جلیل xsd:string </ 24- <مركز صحي جلیل [1]< 25 <مركز صحي المطار xsd:string </ 25 <مركز صحي المطار [1]< 26 <مركز صحي الھدا xsd:string </ 26 <مركز صحي الھدا [1]< 27 <مركز صحي طویرق xsd:string </ 27 <مركز صحي طویرق [1]< 28 صحي الشرقة بالھدا مركز > xsd:string </ 28 <مركز صحي الشرقة بالھدا [1]</...>
Int. J. Adv. Res. Biol.Sci. 1(9): (2014): 69–112
90
XML Instance Representation<...>< <مستشفى الملك عبد العزیز K.A-H </ <مستشفى الملك عبد العزیز [1]<مستشفى الملك فیصل> K.F-H <مستشفى الملك فیصل/> [1]<مستشفى االمراض الصدریة> xsd:string <مستشفى االمراض الصدریة/> [1]<مستشفى االطفال> xsd:string <مستشفى االطفال/> [1]<مستشفى الصحة النفسیة> xsd:decimal <مستشفى الصحة النفسیة/> [1]< <مستشفى القوات المسلحة بالھدا string </ <مستشفى القوات المسلحة بالھدا [1]< <مستسفى االمیر سلطان العسكري string </ <مستسفى االمیر سلطان العسكري [1]<مستشفى االمیر منصور العسكري> xsd:string <مستشفى االمیر منصور العسكري/> [1]<مستشفى الرحاب العسكري> xsd:decimal <مستشفى الرحاب العسكري/> [1]</...>
Schema Component Representation
XML Instance Representation<...><Taif Governmant Hospitals> Taif G-H </Taif Governmant Hospitals> [1]<Taif Gevernment Health Care Centers> Taif H-C-C </Taif Gevernment Health Care Centers> [1]<Taif Military Hospitals> Taif M-H </Taif Military Hospitals> [1]<Taif Private Hospirals and Health Care Centers> Taif P-H </Taif Private Hospirals and Health Care Centers> [1]</...>
XML Instance Representation<...><مستشفى االمین> string <مستشفى االمین/> [1]<مستشفى الحسن> string <مستشفى الحسن/> [1]<مستشفى العدواني> xsd:string <مستشفى العدواني/> [1]<مستشفى النھضة> xsd:string <مستشفى النھضة/> [1]<مستشفى االسرة> xsd:decimal <مستشفى االسرة/> [1]<مجمع عیادات احلى ابتسامة> xsd:string <مجمع عیادات احلى ابتسامة/> [1]<مجمع بدر الطبي> xsd:decimal <مجمع بدر الطبي/> [1]
Int. J. Adv. Res. Biol.Sci. 1(9): (2014): 69–112
91
<مجمع االندلس> xsd:decimal <مجمع االندلس/> [1]<مجمع سدیم> xsd:string <مجمع سدیم/> [1]<مركز العائلة> xsd:decimal <مركز العائلة/> [1]<مركز تداوي الجرحي> xsd:decimal <مركز تداوي الجرحي/> [1]</...>Schema Component Representation
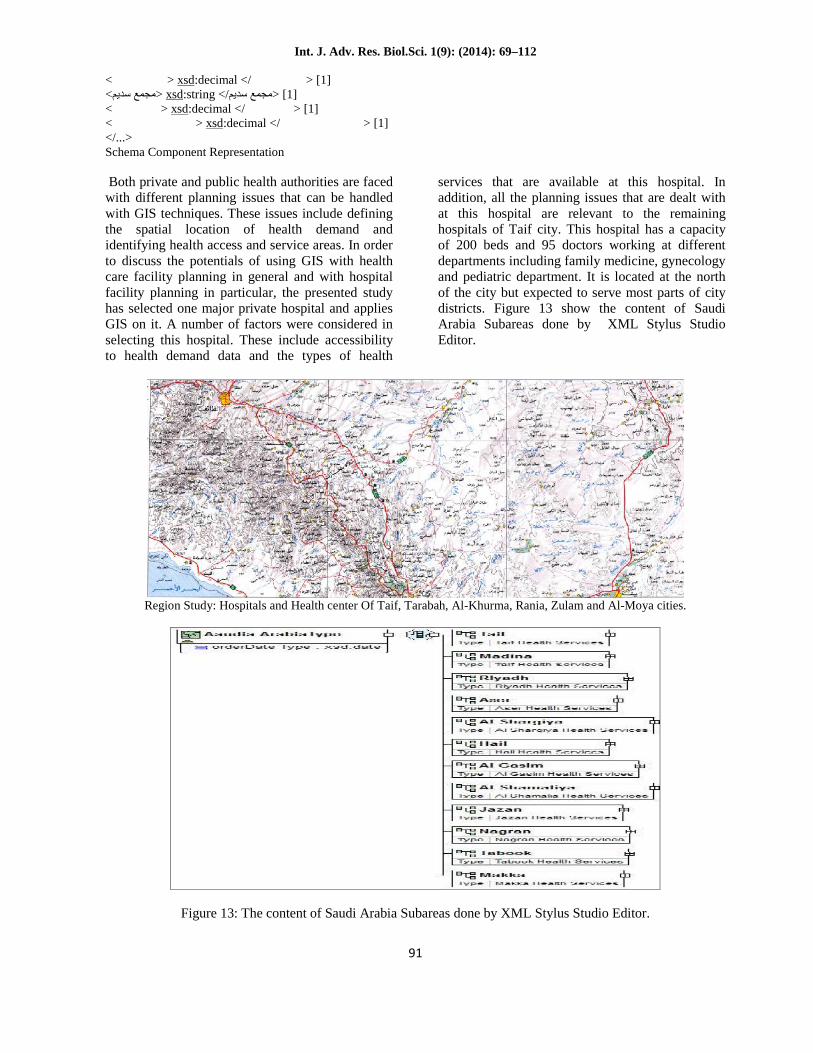
Both private and public health authorities are facedwith different planning issues that can be handledwith GIS techniques. These issues include definingthe spatial location of health demand andidentifying health access and service areas. In orderto discuss the potentials of using GIS with healthcare facility planning in general and with hospitalfacility planning in particular, the presented studyhas selected one major private hospital and appliesGIS on it. A number of factors were considered inselecting this hospital. These include accessibilityto health demand data and the types of health
services that are available at this hospital. Inaddition, all the planning issues that are dealt withat this hospital are relevant to the remaininghospitals of Taif city. This hospital has a capacityof 200 beds and 95 doctors working at differentdepartments including family medicine, gynecologyand pediatric department. It is located at the northof the city but expected to serve most parts of citydistricts. Figure 13 show the content of SaudiArabia Subareas done by XML Stylus StudioEditor.
Region Study: Hospitals and Health center Of Taif, Tarabah, Al-Khurma, Rania, Zulam and Al-Moya cities.
Figure 13: The content of Saudi Arabia Subareas done by XML Stylus Studio Editor.
Int. J. Adv. Res. Biol.Sci. 1(9): (2014): 69–112
92
III. RESEARCH ISSUES AND ANALYSIS TECHNIQUES
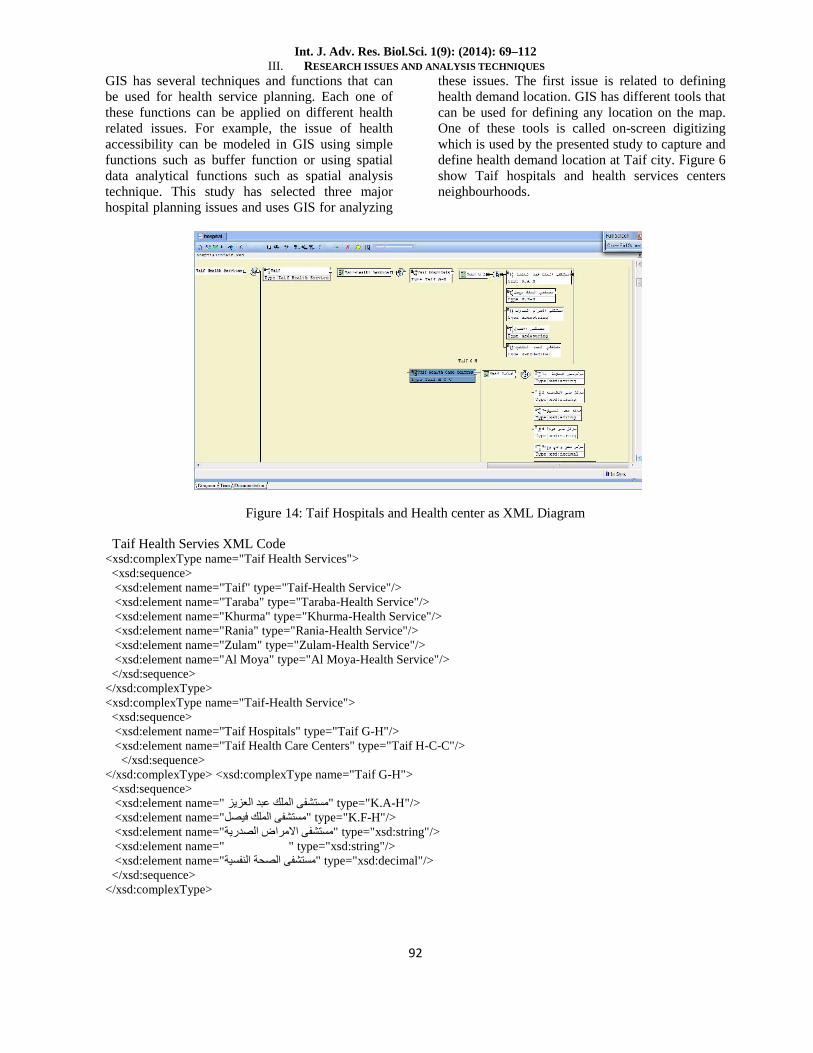
GIS has several techniques and functions that canbe used for health service planning. Each one ofthese functions can be applied on different healthrelated issues. For example, the issue of healthaccessibility can be modeled in GIS using simplefunctions such as buffer function or using spatialdata analytical functions such as spatial analysistechnique. This study has selected three majorhospital planning issues and uses GIS for analyzing
these issues. The first issue is related to defininghealth demand location. GIS has different tools thatcan be used for defining any location on the map.One of these tools is called on-screen digitizingwhich is used by the presented study to capture anddefine health demand location at Taif city. Figure 6show Taif hospitals and health services centersneighbourhoods.
Figure 14: Taif Hospitals and Health center as XML Diagram
Taif Health Servies XML Code<xsd:complexType name="Taif Health Services">
<xsd:sequence><xsd:element name="Taif" type="Taif-Health Service"/><xsd:element name="Taraba" type="Taraba-Health Service"/><xsd:element name="Khurma" type="Khurma-Health Service"/><xsd:element name="Rania" type="Rania-Health Service"/><xsd:element name="Zulam" type="Zulam-Health Service"/><xsd:element name="Al Moya" type="Al Moya-Health Service"/>
</xsd:sequence></xsd:complexType><xsd:complexType name="Taif-Health Service">
<xsd:sequence><xsd:element name="Taif Hospitals" type="Taif G-H"/><xsd:element name="Taif Health Care Centers" type="Taif H-C-C"/>
</xsd:sequence></xsd:complexType> <xsd:complexType name="Taif G-H">
<xsd:sequence><xsd:element name=" </"type="K.A-H "مستشفى الملك عبد العزیز<xsd:element name="مستشفى الملك فیصل" type="K.F-H"/><xsd:element name="مستشفى االمراض الصدریة" type="xsd:string"/><xsd:element name="مستشفى االطفال" type="xsd:string"/><xsd:element name="مستشفى الصحة النفسیة" type="xsd:decimal"/>
</xsd:sequence></xsd:complexType>
Int. J. Adv. Res. Biol.Sci. 1(9): (2014): 69–112
93
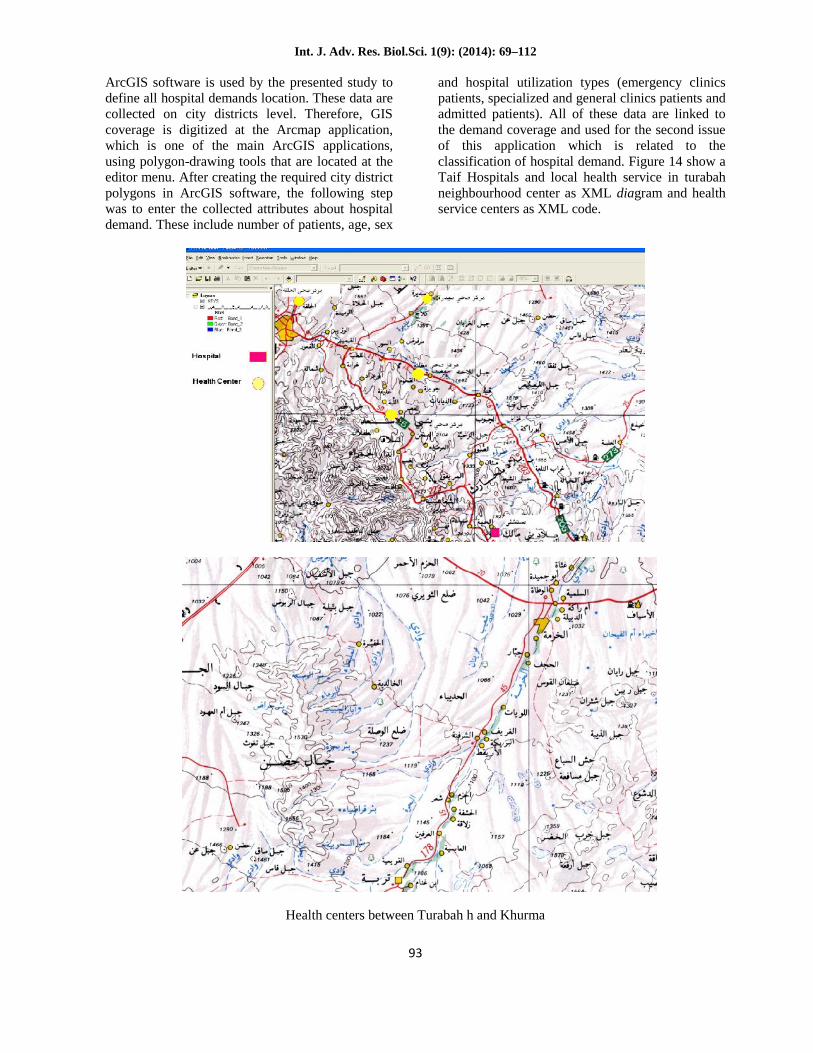
ArcGIS software is used by the presented study todefine all hospital demands location. These data arecollected on city districts level. Therefore, GIScoverage is digitized at the Arcmap application,which is one of the main ArcGIS applications,using polygon-drawing tools that are located at theeditor menu. After creating the required city districtpolygons in ArcGIS software, the following stepwas to enter the collected attributes about hospitaldemand. These include number of patients, age, sex
and hospital utilization types (emergency clinicspatients, specialized and general clinics patients andadmitted patients). All of these data are linked tothe demand coverage and used for the second issueof this application which is related to theclassification of hospital demand. Figure 14 show aTaif Hospitals and local health service in turabahneighbourhood center as XML diagram and healthservice centers as XML code.
Health centers between Turabah h and Khurma
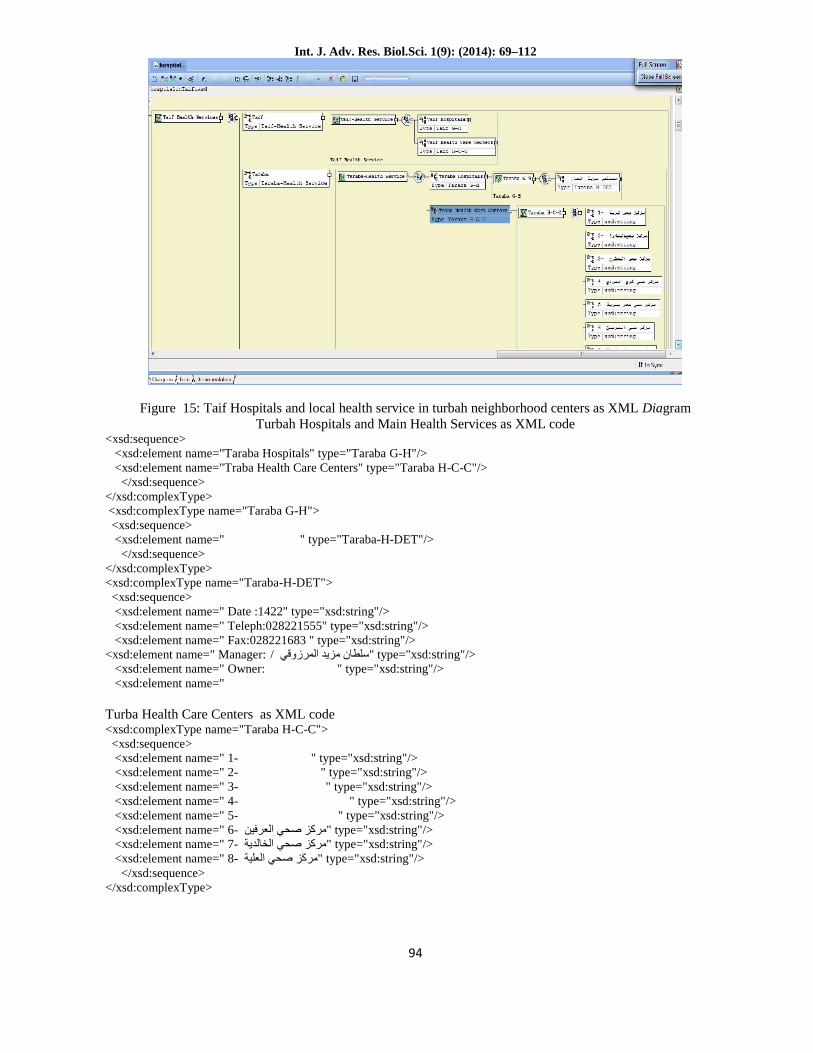
Int. J. Adv. Res. Biol.Sci. 1(9): (2014): 69–112
94
Figure 15: Taif Hospitals and local health service in turbah neighborhood centers as XML DiagramTurbah Hospitals and Main Health Services as XML code
<xsd:sequence><xsd:element name="Taraba Hospitals" type="Taraba G-H"/><xsd:element name="Traba Health Care Centers" type="Taraba H-C-C"/>
</xsd:sequence></xsd:complexType><xsd:complexType name="Taraba G-H"><xsd:sequence><xsd:element name=" </"type="Taraba-H-DET "مستشفى تربة العام
</xsd:sequence></xsd:complexType><xsd:complexType name="Taraba-H-DET">
<xsd:sequence><xsd:element name=" Date :1422" type="xsd:string"/><xsd:element name=" Teleph:028221555" type="xsd:string"/><xsd:element name=" Fax:028221683 " type="xsd:string"/>
<xsd:element name=" Manager:د/ </"type="xsd:string "سلطان مزید المرزوقي <xsd:element name=" Owner:ملك وزارة الصحة" type="xsd:string"/><xsd:element name="
Turba Health Care Centers as XML code<xsd:complexType name="Taraba H-C-C">
<xsd:sequence><xsd:element name=" 1- </"type="xsd:string "مركز صحي تربة<xsd:element name=" 2- </"type="xsd:string "مركز صحي العالوة<xsd:element name=" 3- </"type="xsd:string "مركز صحي الحشرج<xsd:element name=" 4- </"type="xsd:string "مركز صحي كري السردي <xsd:element name=" 5- </"type="xsd:string "مركز صحي شعر بتربة <xsd:element name=" 6- </"type="xsd:string "مركز صحي العرفین <xsd:element name=" 7- </"type="xsd:string "مركز صحي الخالدیة <xsd:element name=" 8- </"type="xsd:string "مركز صحي العلیة
</xsd:sequence></xsd:complexType>
Int. J. Adv. Res. Biol.Sci. 1(9): (2014): 69–112
95
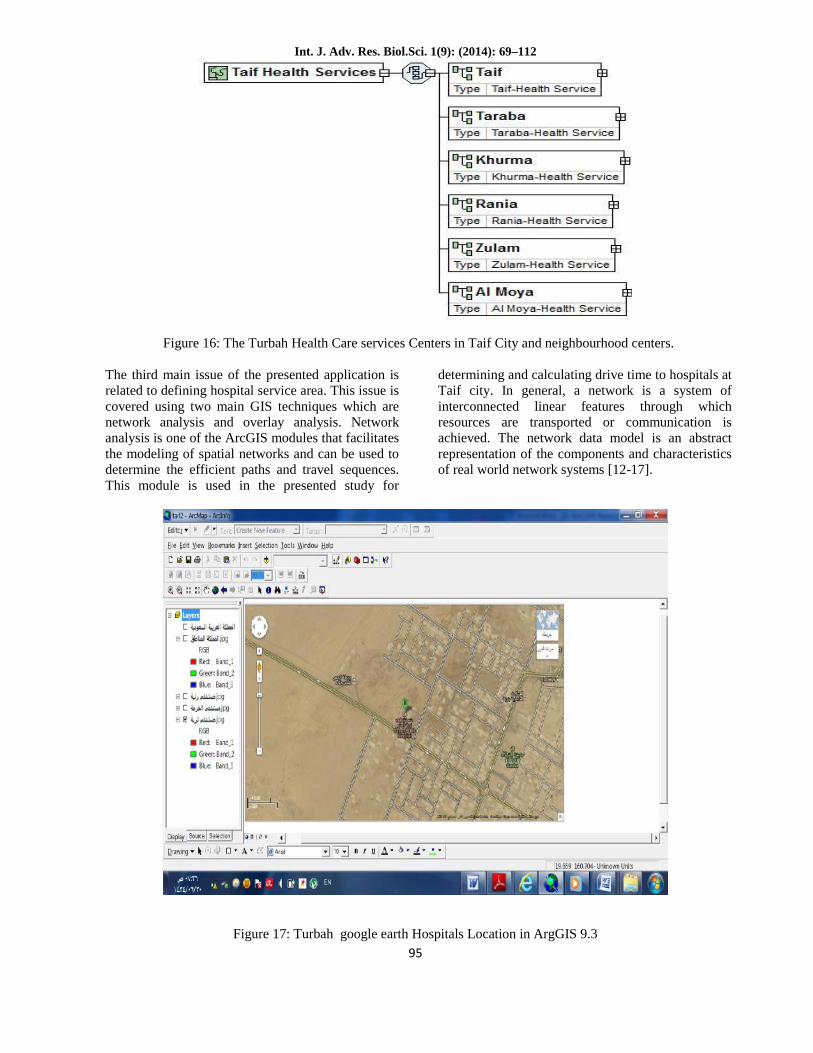
Figure 16: The Turbah Health Care services Centers in Taif City and neighbourhood centers.
The third main issue of the presented application isrelated to defining hospital service area. This issue iscovered using two main GIS techniques which arenetwork analysis and overlay analysis. Networkanalysis is one of the ArcGIS modules that facilitatesthe modeling of spatial networks and can be used todetermine the efficient paths and travel sequences.This module is used in the presented study for
determining and calculating drive time to hospitals atTaif city. In general, a network is a system ofinterconnected linear features through whichresources are transported or communication isachieved. The network data model is an abstractrepresentation of the components and characteristicsof real world network systems [12-17].
Figure 17: Turbah google earth Hospitals Location in ArgGIS 9.3
Int. J. Adv. Res. Biol.Sci. 1(9): (2014): 69–112
96
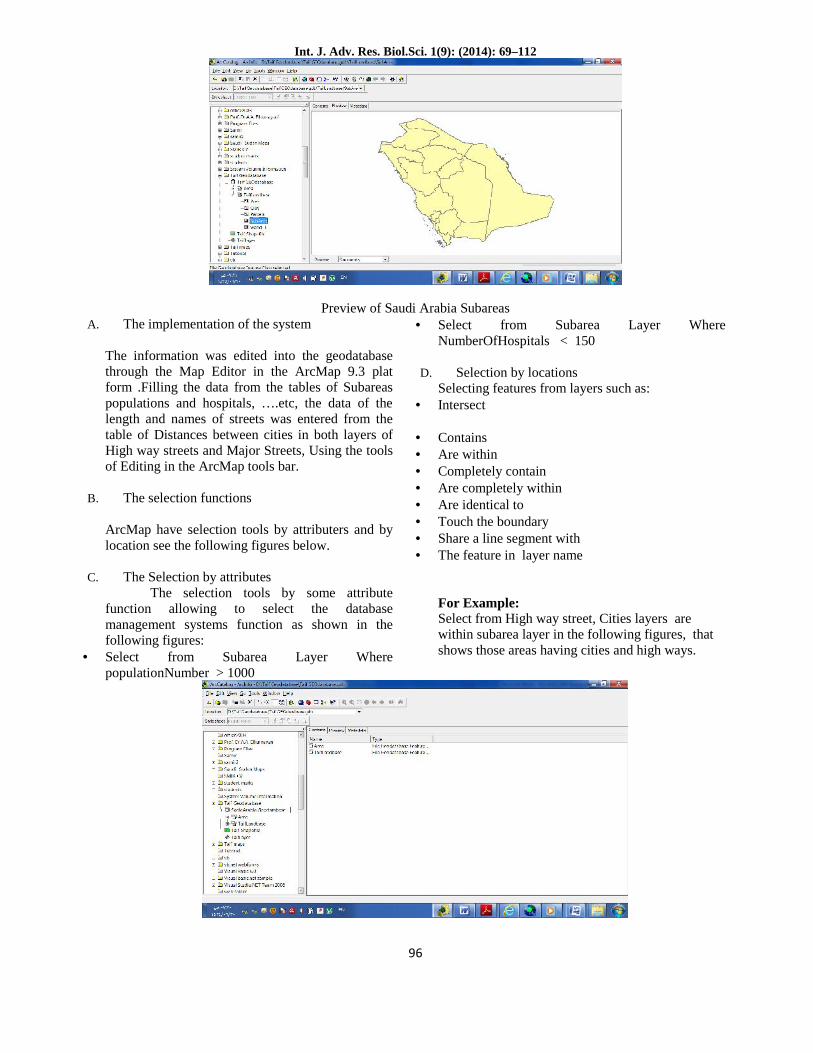
Preview of Saudi Arabia SubareasA. The implementation of the system
The information was edited into the geodatabasethrough the Map Editor in the ArcMap 9.3 platform .Filling the data from the tables of Subareaspopulations and hospitals, ….etc, the data of thelength and names of streets was entered from thetable of Distances between cities in both layers ofHigh way streets and Major Streets, Using the toolsof Editing in the ArcMap tools bar.
B. The selection functions
ArcMap have selection tools by attributers and bylocation see the following figures below.
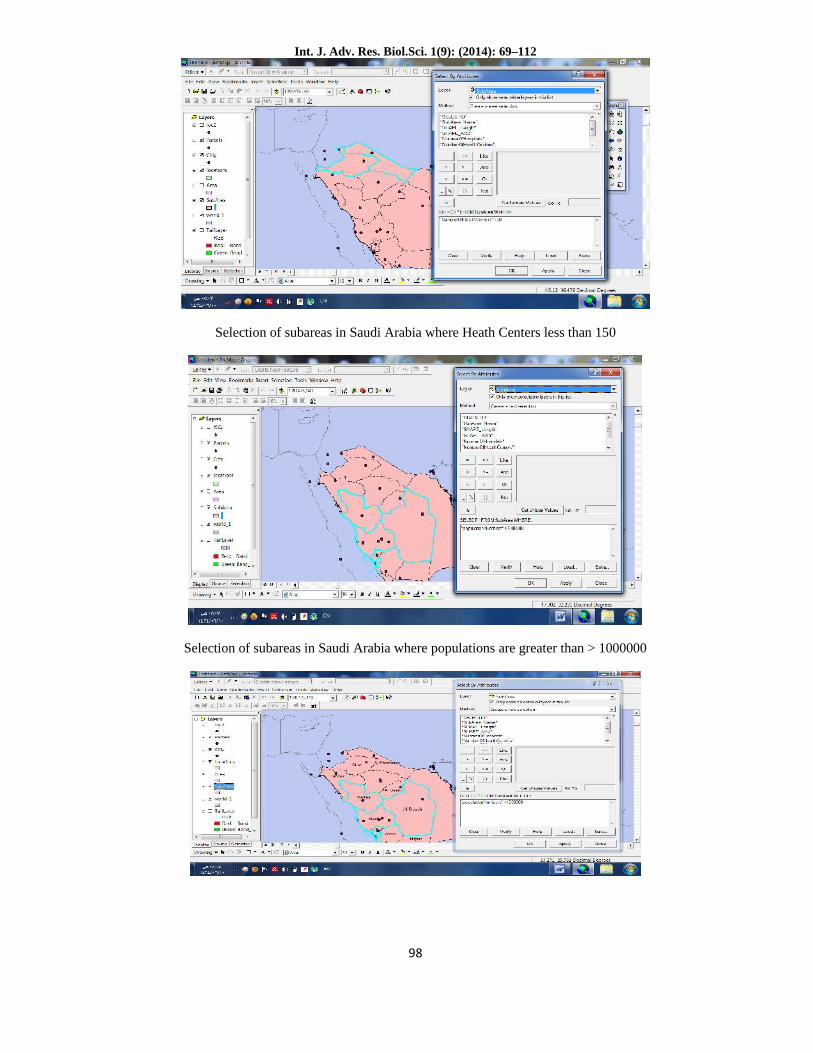
C. The Selection by attributesThe selection tools by some attribute
function allowing to select the databasemanagement systems function as shown in thefollowing figures:
Select from Subarea Layer WherepopulationNumber > 1000
Select from Subarea Layer WhereNumberOfHospitals < 150
D. Selection by locationsSelecting features from layers such as:
Intersect
Contains Are within Completely contain Are completely within Are identical to Touch the boundary Share a line segment with The feature in layer name
For Example:Select from High way street, Cities layers arewithin subarea layer in the following figures, thatshows those areas having cities and high ways.
Int. J. Adv. Res. Biol.Sci. 1(9): (2014): 69–112
97
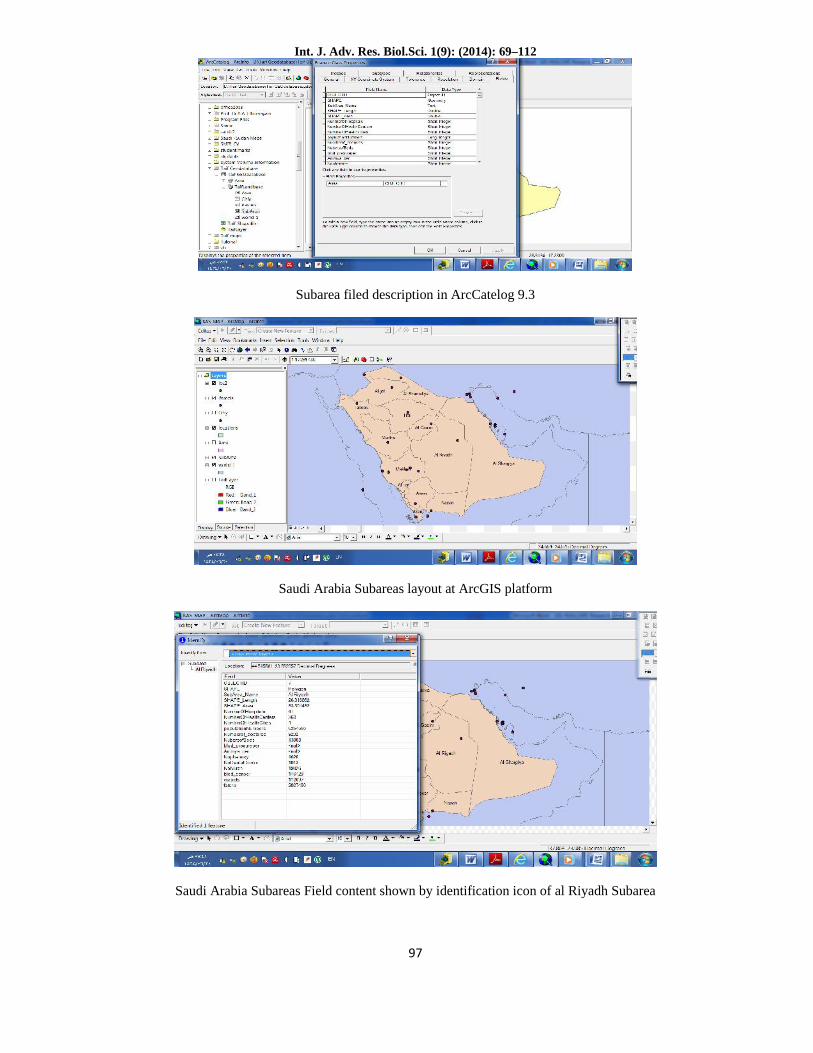
Subarea filed description in ArcCatelog 9.3
Saudi Arabia Subareas layout at ArcGIS platform
Saudi Arabia Subareas Field content shown by identification icon of al Riyadh Subarea
Int. J. Adv. Res. Biol.Sci. 1(9): (2014): 69–112
98
Selection of subareas in Saudi Arabia where Heath Centers less than 150
Selection of subareas in Saudi Arabia where populations are greater than > 1000000
Int. J. Adv. Res. Biol.Sci. 1(9): (2014): 69–112
99
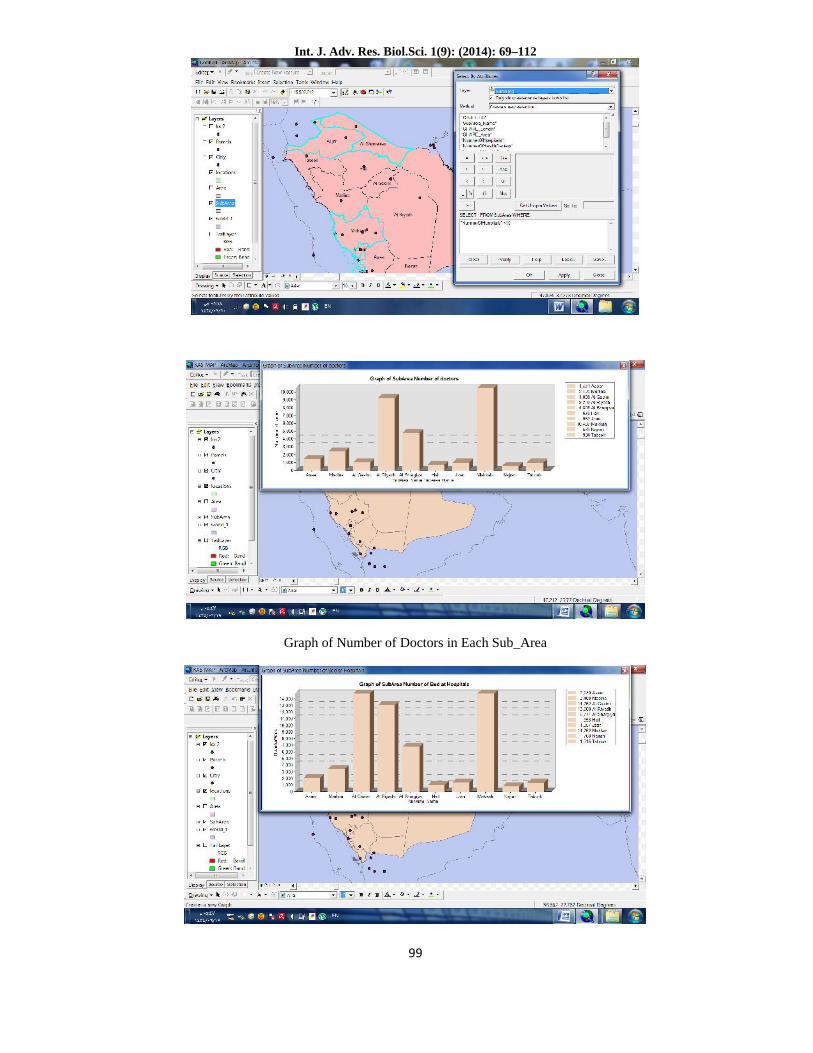
Graph of Number of Doctors in Each Sub_Area
Int. J. Adv. Res. Biol.Sci. 1(9): (2014): 69–112
100
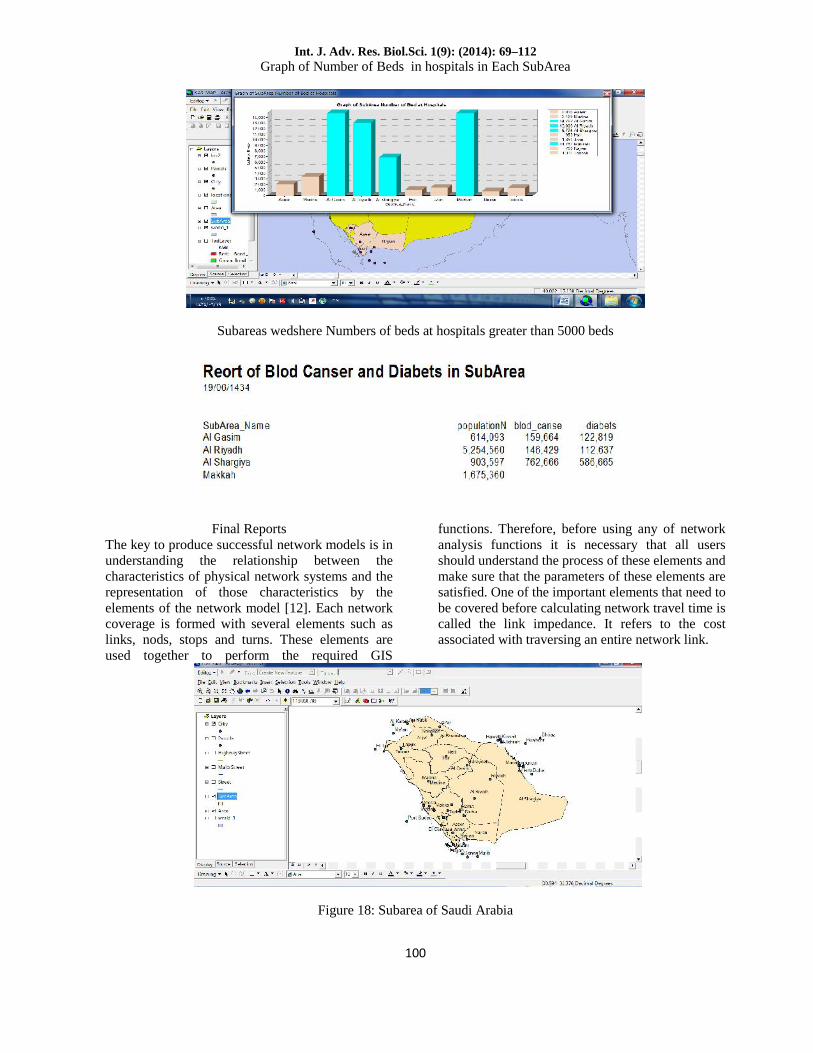
Graph of Number of Beds in hospitals in Each SubArea
Subareas wedshere Numbers of beds at hospitals greater than 5000 beds
Final ReportsThe key to produce successful network models is inunderstanding the relationship between thecharacteristics of physical network systems and therepresentation of those characteristics by theelements of the network model [12]. Each networkcoverage is formed with several elements such aslinks, nods, stops and turns. These elements areused together to perform the required GIS
functions. Therefore, before using any of networkanalysis functions it is necessary that all usersshould understand the process of these elements andmake sure that the parameters of these elements aresatisfied. One of the important elements that need tobe covered before calculating network travel time iscalled the link impedance. It refers to the costassociated with traversing an entire network link.
Figure 18: Subarea of Saudi Arabia
Int. J. Adv. Res. Biol.Sci. 1(9): (2014): 69–112
101
The presented study has calculated travel time foreach arc based on the average driving speed alongeach arc and based on the arc length. The resultedcost is saved as an arc attribute and used during theprocess of creating drive-time service area of theselected hospital. The second main GIS analyticaltechnique that is used within the hospital servicearea issue is called overlay analysis. This techniqueis used at different studies and for many purposes[13–15]. Overlay analysis manipulated spatial dataorganized in different layers to create combinedspatial features according to logical conditionspecified in Boolean Algebra [16]. The logicalconditions are specified with operands (dataelements) and operators (relationships among dataelements). The most well used overall functions arecalled union, intersect and identity. This study hasused the intersect function to analyse health demandwhich falls inside the created drive-time hospitalservice area. This overlay function creates a new
output coverage that has only city districts that fallsinside hospital service area.
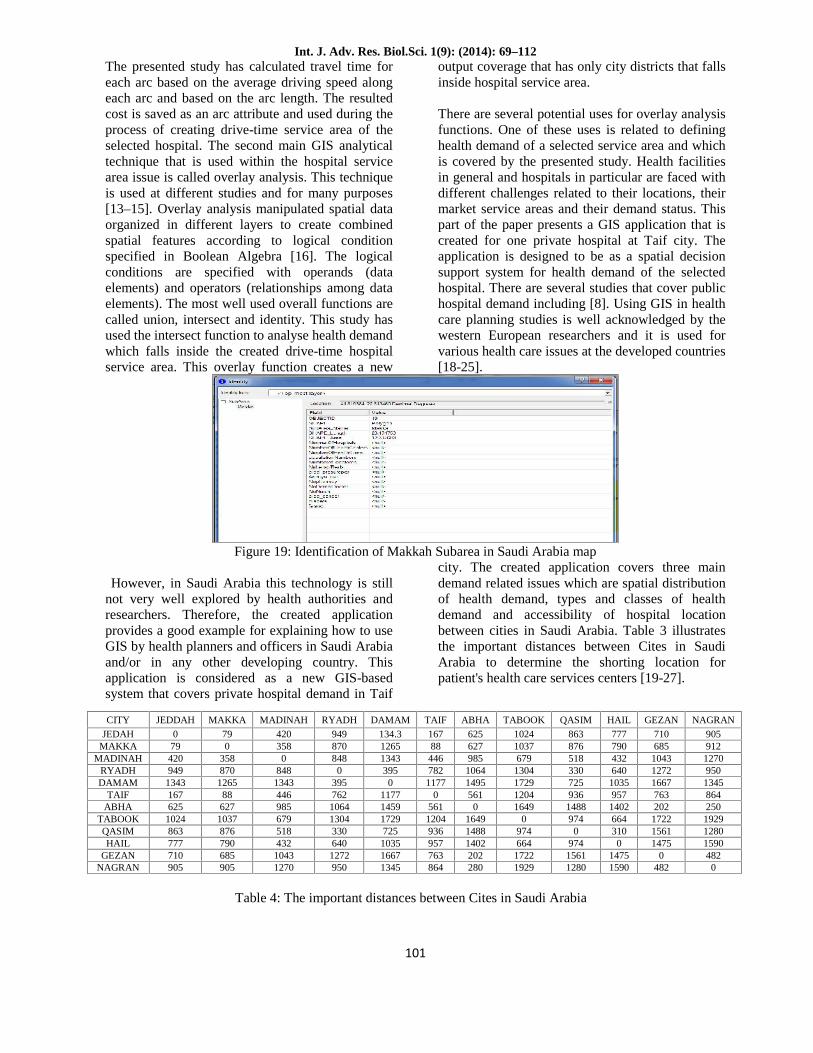
There are several potential uses for overlay analysisfunctions. One of these uses is related to defininghealth demand of a selected service area and whichis covered by the presented study. Health facilitiesin general and hospitals in particular are faced withdifferent challenges related to their locations, theirmarket service areas and their demand status. Thispart of the paper presents a GIS application that iscreated for one private hospital at Taif city. Theapplication is designed to be as a spatial decisionsupport system for health demand of the selectedhospital. There are several studies that cover publichospital demand including [8]. Using GIS in healthcare planning studies is well acknowledged by thewestern European researchers and it is used forvarious health care issues at the developed countries[18-25].
Figure 19: Identification of Makkah Subarea in Saudi Arabia map
However, in Saudi Arabia this technology is stillnot very well explored by health authorities andresearchers. Therefore, the created applicationprovides a good example for explaining how to useGIS by health planners and officers in Saudi Arabiaand/or in any other developing country. Thisapplication is considered as a new GIS-basedsystem that covers private hospital demand in Taif
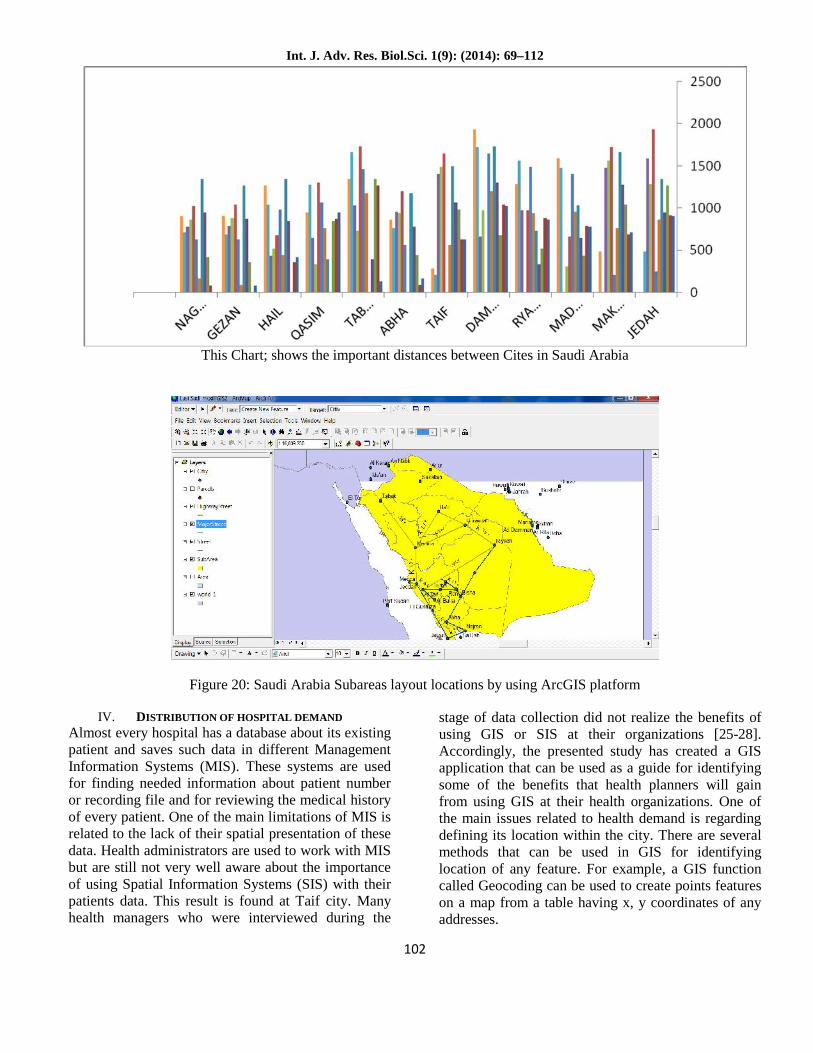
city. The created application covers three maindemand related issues which are spatial distributionof health demand, types and classes of healthdemand and accessibility of hospital locationbetween cities in Saudi Arabia. Table 3 illustratesthe important distances between Cites in SaudiArabia to determine the shorting location forpatient's health care services centers [19-27].
Table 4: The important distances between Cites in Saudi Arabia
NAGRANGEZANHAILQASIMTABOOKABHATAIFDAMAMRYADHMADINAHMAKKAJEDDAHCITY
9057107778631024625167134.3949420790JEDAH9126857908761037627881265870358079MAKKA1270104343251867998544613438480358420MADINAH9501272640330130410647823950848870949RYADH1345166710357251729149511770395134312651343DAMAM86476395793612045610117776244688167TAIF250202140214881649056114591064985627625ABHA192917226649740164912041729130467910371024TABOOK1280156131009741488936725330518876863QASIM15901475097466414029571035640432790777HAIL4820147515611722202763166712721043685710GEZAN
048215901280192928086413459501270905905NAGRAN
Int. J. Adv. Res. Biol.Sci. 1(9): (2014): 69–112
102
This Chart; shows the important distances between Cites in Saudi Arabia
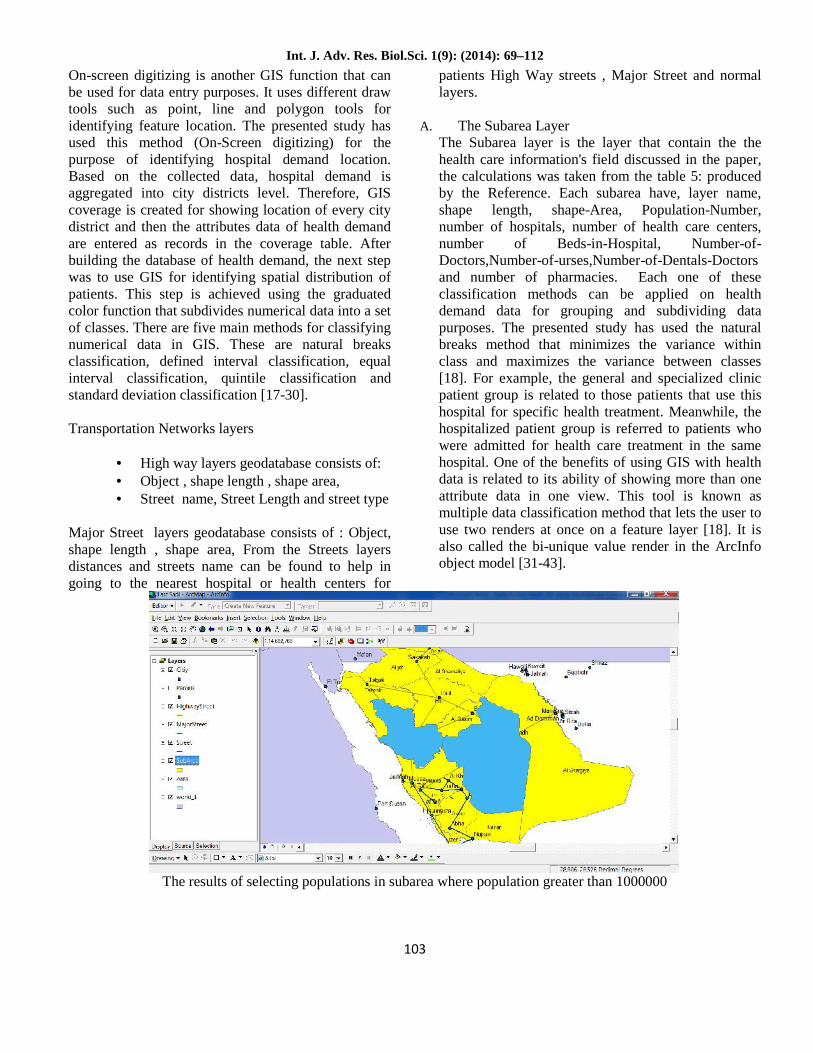
Figure 20: Saudi Arabia Subareas layout locations by using ArcGIS platform
IV. DISTRIBUTION OF HOSPITAL DEMAND
Almost every hospital has a database about its existingpatient and saves such data in different ManagementInformation Systems (MIS). These systems are usedfor finding needed information about patient numberor recording file and for reviewing the medical historyof every patient. One of the main limitations of MIS isrelated to the lack of their spatial presentation of thesedata. Health administrators are used to work with MISbut are still not very well aware about the importanceof using Spatial Information Systems (SIS) with theirpatients data. This result is found at Taif city. Manyhealth managers who were interviewed during the
stage of data collection did not realize the benefits ofusing GIS or SIS at their organizations [25-28].Accordingly, the presented study has created a GISapplication that can be used as a guide for identifyingsome of the benefits that health planners will gainfrom using GIS at their health organizations. One ofthe main issues related to health demand is regardingdefining its location within the city. There are severalmethods that can be used in GIS for identifyinglocation of any feature. For example, a GIS functioncalled Geocoding can be used to create points featureson a map from a table having x, y coordinates of anyaddresses.
Int. J. Adv. Res. Biol.Sci. 1(9): (2014): 69–112
103
On-screen digitizing is another GIS function that canbe used for data entry purposes. It uses different drawtools such as point, line and polygon tools foridentifying feature location. The presented study hasused this method (On-Screen digitizing) for thepurpose of identifying hospital demand location.Based on the collected data, hospital demand isaggregated into city districts level. Therefore, GIScoverage is created for showing location of every citydistrict and then the attributes data of health demandare entered as records in the coverage table. Afterbuilding the database of health demand, the next stepwas to use GIS for identifying spatial distribution ofpatients. This step is achieved using the graduatedcolor function that subdivides numerical data into a setof classes. There are five main methods for classifyingnumerical data in GIS. These are natural breaksclassification, defined interval classification, equalinterval classification, quintile classification andstandard deviation classification [17-30].
Transportation Networks layers
High way layers geodatabase consists of: Object , shape length , shape area, Street name, Street Length and street type
Major Street layers geodatabase consists of : Object,shape length , shape area, From the Streets layersdistances and streets name can be found to help ingoing to the nearest hospital or health centers for
patients High Way streets , Major Street and normallayers.
A. The Subarea LayerThe Subarea layer is the layer that contain the thehealth care information's field discussed in the paper,the calculations was taken from the table 5: producedby the Reference. Each subarea have, layer name,shape length, shape-Area, Population-Number,number of hospitals, number of health care centers,number of Beds-in-Hospital, Number-of-Doctors,Number-of-urses,Number-of-Dentals-Doctorsand number of pharmacies. Each one of theseclassification methods can be applied on healthdemand data for grouping and subdividing datapurposes. The presented study has used the naturalbreaks method that minimizes the variance withinclass and maximizes the variance between classes[18]. For example, the general and specialized clinicpatient group is related to those patients that use thishospital for specific health treatment. Meanwhile, thehospitalized patient group is referred to patients whowere admitted for health care treatment in the samehospital. One of the benefits of using GIS with healthdata is related to its ability of showing more than oneattribute data in one view. This tool is known asmultiple data classification method that lets the user touse two renders at once on a feature layer [18]. It isalso called the bi-unique value render in the ArcInfoobject model [31-43].
The results of selecting populations in subarea where population greater than 1000000
Int. J. Adv. Res. Biol.Sci. 1(9): (2014): 69–112
104
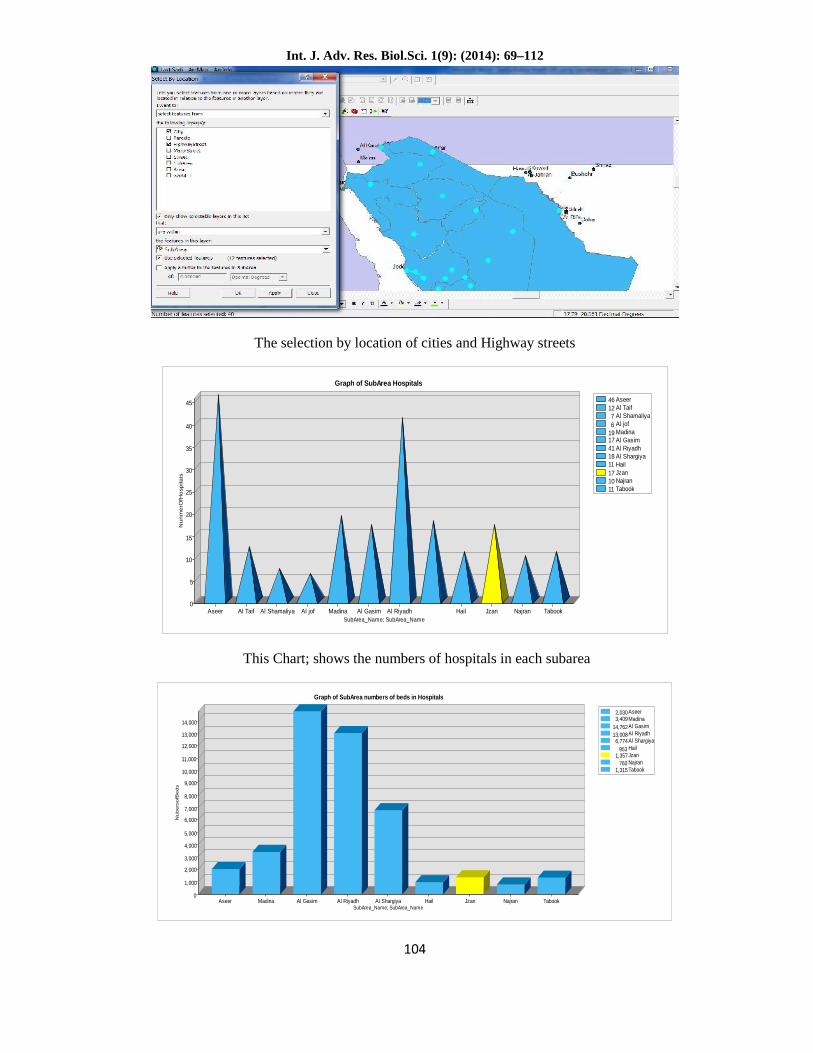
The selection by location of cities and Highway streets
46 Aseer12 Al Taif7 Al Shamaliya6 Al jof
19 Madina17 Al Gasim41 Al Riyadh18 Al Shargiya11 Hail17 Jzan10 Najran11 Tabook
Graph of SubArea Hospitals
SubArea_Name; SubArea_NameAseer Al Taif Al Shamaliya Al jof Madina Al Gasim Al Riyadh Hail Jzan Najran Tabook
Nun
mer
OfH
ospi
tals
45
40
35
30
25
20
15
10
5
0
This Chart; shows the numbers of hospitals in each subarea
2,030Aseer3,409Madina
14,762Al Gasim13,008Al Riyadh6,774Al Shargiya
953 Hail1,357Jzan
760 Najran1,315Tabook
Graph of SubArea numbers of beds in Hospitals
SubArea_Name; SubArea_NameAseer Madina Al Gasim Al Riyadh Al Shargiya Hail Jzan Najran Tabook
Nu
be
rso
fBe
ds
14,000
13,000
12,000
11,000
10,000
9,000
8,000
7,000
6,000
5,000
4,000
3,000
2,000
1,000
0
Int. J. Adv. Res. Biol.Sci. 1(9): (2014): 69–112
105
This Chart; shows the numbers of beds in hospitals ineach subarea
B. The compression between the healthcares centers
By using the statics tools in ArcMap compassionsbetween Number of hospitals, number of healthcarescenters and other health factors was done:
1- Building the graph of the number hospitals in thedifferent subarea was done shown in figure 20. From
this figure; the former founds that Al Riyadh andAsser cities are having the most number of hospitals inKingdom of Saudi Arabia. While Hial, Aljof andSharkia areas have the lowest number of hospital.
2- Another comparison graph was build betweennumbers of beds in hospital in the subareas as shownin figure
3- 21.
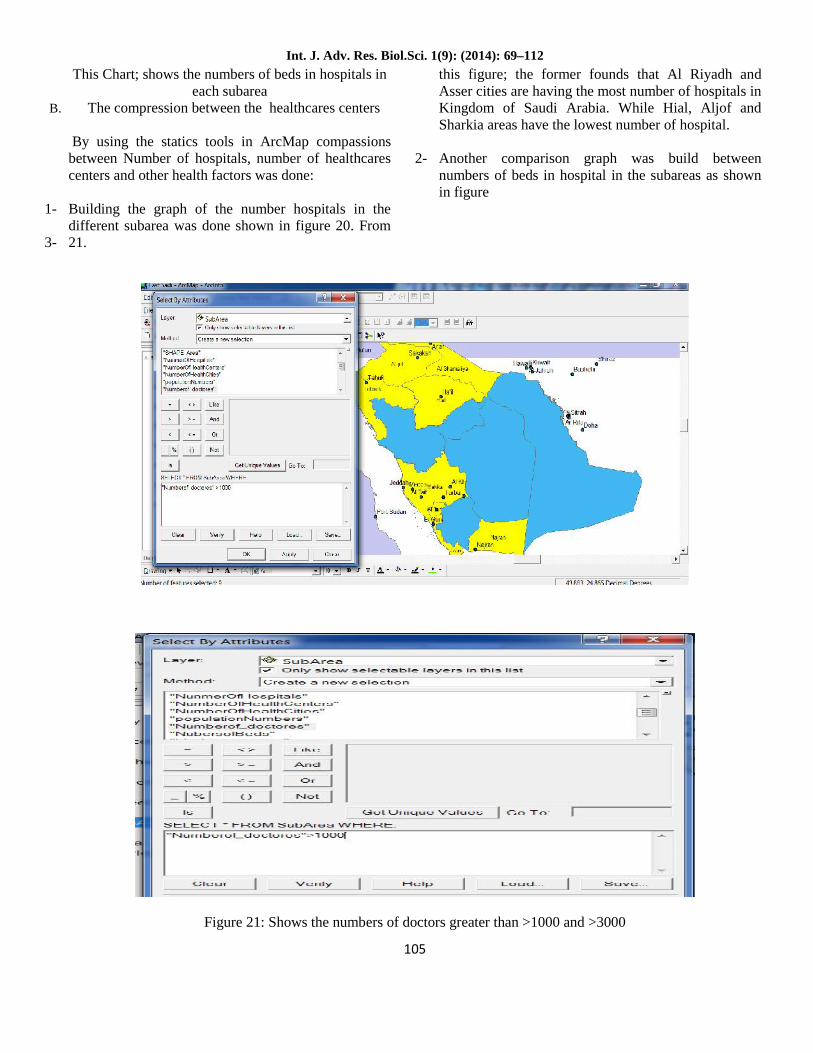
Figure 21: Shows the numbers of doctors greater than >1000 and >3000
Int. J. Adv. Res. Biol.Sci. 1(9): (2014): 69–112
106
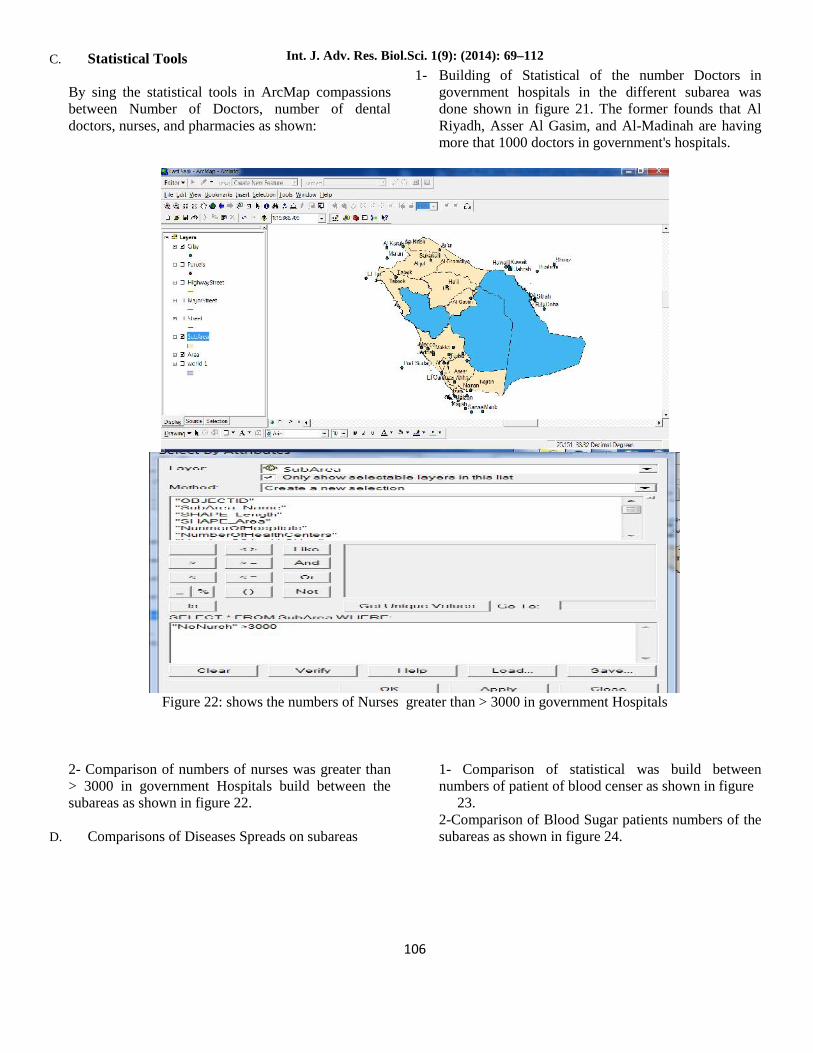
C. Statistical Tools
By sing the statistical tools in ArcMap compassionsbetween Number of Doctors, number of dentaldoctors, nurses, and pharmacies as shown:
1- Building of Statistical of the number Doctors ingovernment hospitals in the different subarea wasdone shown in figure 21. The former founds that AlRiyadh, Asser Al Gasim, and Al-Madinah are havingmore that 1000 doctors in government's hospitals.
Figure 22: shows the numbers of Nurses greater than > 3000 in government Hospitals
2- Comparison of numbers of nurses was greater than> 3000 in government Hospitals build between thesubareas as shown in figure 22.
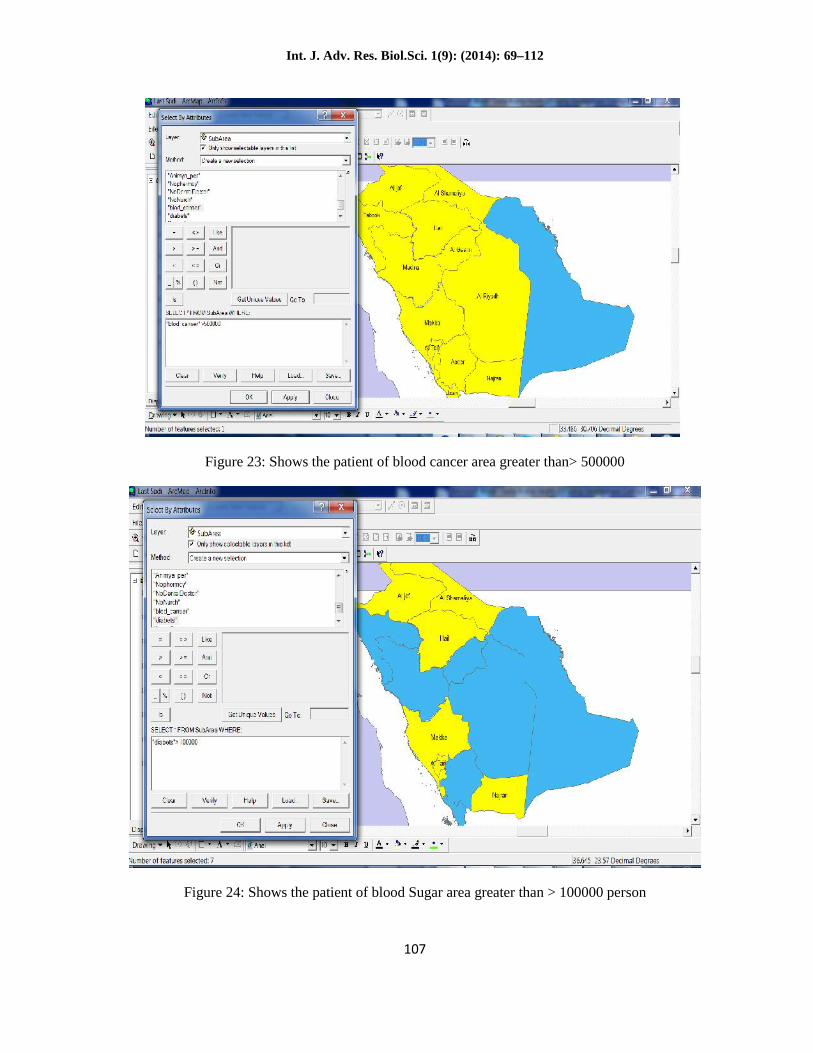
D. Comparisons of Diseases Spreads on subareas
1- Comparison of statistical was build betweennumbers of patient of blood censer as shown in figure
23.2-Comparison of Blood Sugar patients numbers of thesubareas as shown in figure 24.
Int. J. Adv. Res. Biol.Sci. 1(9): (2014): 69–112
107
Figure 23: Shows the patient of blood cancer area greater than> 500000
Figure 24: Shows the patient of blood Sugar area greater than > 100000 person
Int. J. Adv. Res. Biol.Sci. 1(9): (2014): 69–112
108
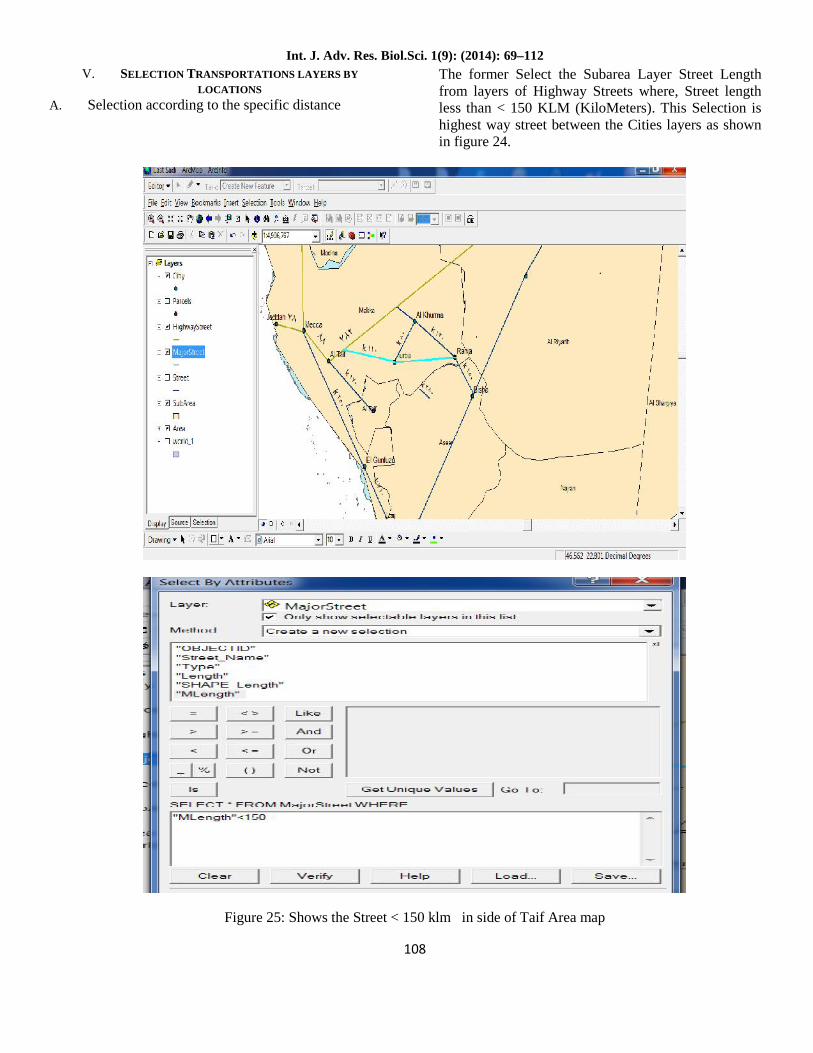
V. SELECTION TRANSPORTATIONS LAYERS BYLOCATIONS
A. Selection according to the specific distance
The former Select the Subarea Layer Street Lengthfrom layers of Highway Streets where, Street lengthless than < 150 KLM (KiloMeters). This Selection ishighest way street between the Cities layers as shownin figure 24.
Figure 25: Shows the Street < 150 klm in side of Taif Area map
Int. J. Adv. Res. Biol.Sci. 1(9): (2014): 69–112
109
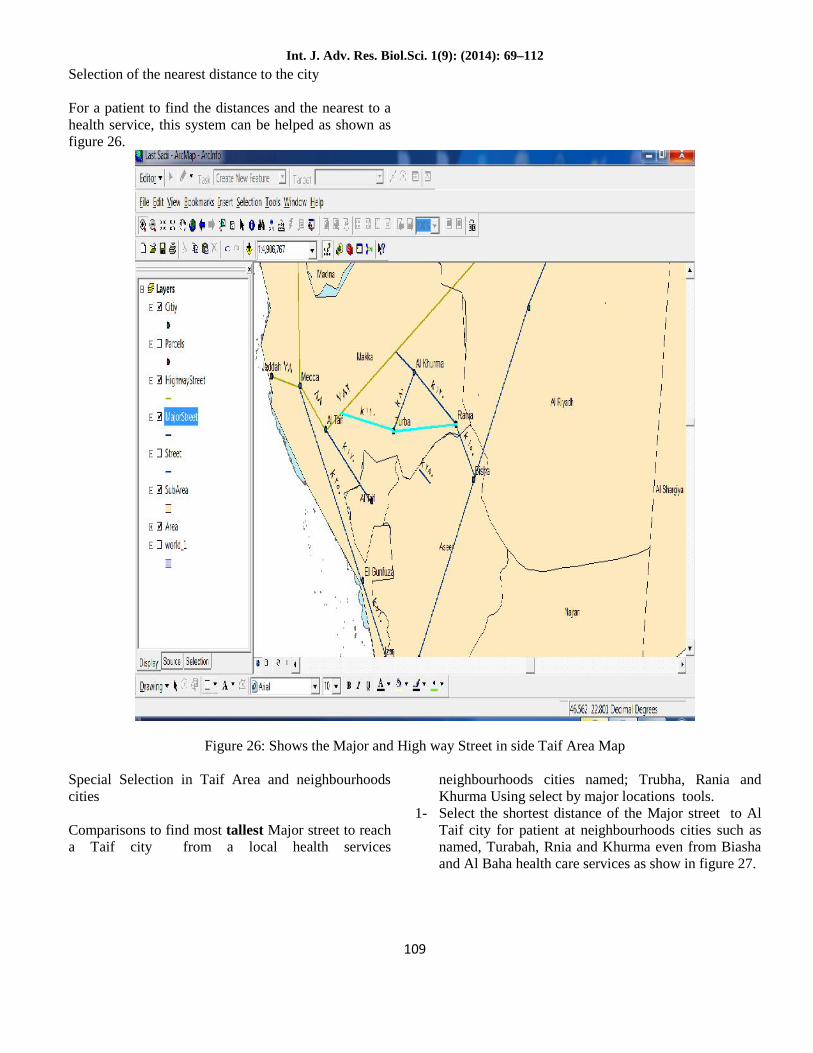
Selection of the nearest distance to the city
For a patient to find the distances and the nearest to ahealth service, this system can be helped as shown asfigure 26.
Figure 26: Shows the Major and High way Street in side Taif Area Map
Special Selection in Taif Area and neighbourhoodscities
Comparisons to find most tallest Major street to reacha Taif city from a local health services
neighbourhoods cities named; Trubha, Rania andKhurma Using select by major locations tools.
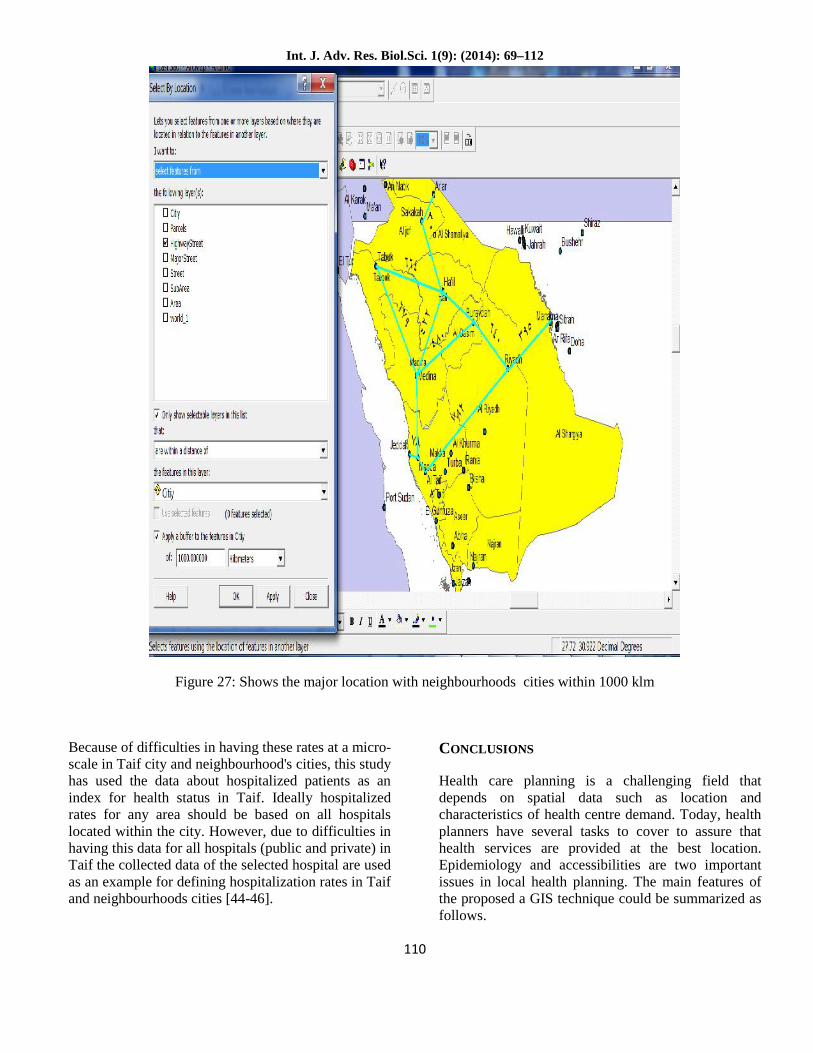
1- Select the shortest distance of the Major street to AlTaif city for patient at neighbourhoods cities such asnamed, Turabah, Rnia and Khurma even from Biashaand Al Baha health care services as show in figure 27.
Int. J. Adv. Res. Biol.Sci. 1(9): (2014): 69–112
110
Figure 27: Shows the major location with neighbourhoods cities within 1000 klm
Because of difficulties in having these rates at a micro-scale in Taif city and neighbourhood's cities, this studyhas used the data about hospitalized patients as anindex for health status in Taif. Ideally hospitalizedrates for any area should be based on all hospitalslocated within the city. However, due to difficulties inhaving this data for all hospitals (public and private) inTaif the collected data of the selected hospital are usedas an example for defining hospitalization rates in Taifand neighbourhoods cities [44-46].
CONCLUSIONS
Health care planning is a challenging field thatdepends on spatial data such as location andcharacteristics of health centre demand. Today, healthplanners have several tasks to cover to assure thathealth services are provided at the best location.Epidemiology and accessibilities are two importantissues in local health planning. The main features ofthe proposed a GIS technique could be summarized asfollows.
Int. J. Adv. Res. Biol.Sci. 1(9): (2014): 69–112
111
1. The GIS technique has been used effectivelywithin the hospital service area issue is calledoverlay analysis.
2. The results of the GIS technique were veryuseful for health planners and demands on amicro-scale and explore the possibilities ofusing GIS for health care services in hospitalsat Saudi Arabia subareas. Because theyevaluate the level of service provision at theselected area.
3. It is found that the existing health supply ofSaudi Arabia Subareas comparison was donefor health care activities and the relationbetween populations and geographical areas,transportation criteria was taken to helpreaching to neighbourhood health careservices.
4. The same technique can be applied at the otherhealth centers of other Saudi Arabia subareas,and by doing so health care planning anddemanding would be more effective in TaifCity and other neighbourhoods cities named;Turabah, Al Khurma, Zulam, Al-Moya andRania.
5. GIS has been used to analyses the centrecatchment as well as studying the spatial dataanalysis of some popular diseases such as ofblood cancer and blood sugar or fitnesspatients in Taif City and otherneighbourhoods cities.
For future work, we intended to test our GIS onmore cities in KSA. Also, we think that suchoutput of creating and implementing our GISmodels are very relevant to help a local healthplanner in their health care decision makingoutput.
REFERENCES
1.H. Jordan, P. Roderick, D. Martin, S. Barnett,Distance, rurality, and the need for care: access tohealth services in2. South West England, Int. J. Health Geograph. 3(21)2004, 1–9.
3.Birkin, M., Clarke, G., Clarke, M. and Wilson, A.Intelligent GIS: Location decisions and strategicplanning. Cambridge: Geo information. 1996.4.Mazrou, Y., Alshehri, S. and Rao, M. Principles &practices of primary health care. Riyadh: Dar alhilal.1990.5. Zainy, Z. Primary care health centers. PhD Thesis,Strathclyde University. 1993.
6.Ministry of Planning. The fifth fife yeardevelopment plan. Riyadh: MOP. Press.1990.7. Sebai, Z. Health in Saudi Arabia.Riyadh:Thama.1985.8.Ministry of Health . The annual report. Riyadh:Ministry of Health, 1998.9.Murad, A. Creating a GIS-based retail planningsystem for Jeddah City. GIS 2002 conference,Proceeding, pp. 67 – 81. Bahrain.10. Gatrell, A. and Loytonen, M. GIS and Health.London: Taylor and Francis.1998.11.ESRI . Getting to know Arc GIS desktop.Redlands: ESRI. 2001.12.Andes, N. and Davis, J. Linking public health datausing geographical information system techniques:Alaskan community characteristics and infantmortality. Stat. in Med. 42(6), 481 – 90. 1995.13.Collins, S., Small bone, K. and Briggs, D. A GISapproach to modeling small area variation ions in airPollution within a complex urban environment. InInnovations in GIS2 (P. Fisher, ed), pp. 125 – 39.London: Taylor and Francis.1995.14.Jones, A. and Bentham, G. Emergency medicalservice accessibility and outcome from roadtraffic accidents. Pub. Heal. 109, 169 – 77. 1995.15. L. Roovali, R. Kiivet, Geographical variations inhospital use in Estonia, Health & Place 12 (2) (2006)195–202.16.L. Bixby, Spatial access to health care in CostaRica and its equity: a GIS-based study, Soc.Sci. Med.58 (2004) 1271–1284.17.W. Luo, Using a GIS-based floating catchmentmethod to assess areas with shortage ofphysicians, Health & Place 10 (1) (2004) 1–11.18.F. Wang, W. Luo, Assessing spatial and no spatialfactors for healthcare access: towards an integratedapproach to defining health professional shortageareas, Health & Place 11 (2) (2004) 131–146.19.W. Gesler, T. Hayes, A. Skelly, S. Nash, A.Soward, Using mapping technology in healthintervention research, Nurs. Outlook 52 (2004) 142–146.
Int. J. Adv. Res. Biol.Sci. 1(9): (2014): 69–112
112
20.A. Murad, Creating a GIS application for localhealth care planning in Saudi Arabia, Int. J.Environ. Health Res. 14 (3) (2004) 185–199.21.A. Murad, Using GIS for planning public generalhospitals at Jeddah City, J. King AbdulazizUniv. Environ. Sci. 2006, in press.22.P. Wilkinson, C. Grundy, M. Landon, S.Stevenson, GIS in public health, in: A. Gatrell, M.Loytonen (Eds.), GIS and Health, Taylor & Francis,London, 1998.23.Jeddah municipality: www.Jeddah.gov.sa.24.Ministry of health http://www.moh.gov.sa25.ESRI, Network Analysis, ESRI, Redlands, 1992.26.M. Birkin, G. Clarke, M. Clarke, A. Wilson,Intelligent GIS: Location Decisions and StrategicPlanning, Geo Information, Cambridge, 1996.27.A. Gatrell, M. Senior, Health and health careapplications, in: P. Longley, M. Goodchild, D.Maguire, D.Rhind (Eds.), Geographical InformationSystems, Wiley, New York, 1999.28.Stylus studio, Open Geospatial Consortium, Inc,Whiteside. All Rights Reserved 2009.29.Aarcgis steam water on March 6, 2009 ,http:[email protected] , Building andMaintaining Water Utility Geodatabases ,30.Khatib and Alami"VBA Code for Searching , AConsolidated Engineering Company" , amember of ICON 2008.31.Kapil Chalil Madathil, Yuan-Han Huang, ReshmiKoikkara, and Anand Gramopadhye"Process Flow Development for a State-wide ResearchPermissions Management System".,Proceedings of the 2012 Industrial and SystemsEngineering Research Conference G. Lim andJ.W. Herrmann, eds.32.Uses and disclosures for treatment, payment, andhealthcare operations, 45 CFR 164.506. Retrievedfrom http://www.hhs.gov/ocr /privacy/hipaa/understanding /coveredentities/sharingfortpo.pdf.33.Definition for EHR, Health InformationManagement Systems Society’s webpage. RetrievedFromError! Hyperlink reference not valid..34.National institutes of health national centre forresearch resources, Electronic health recordsoverview. Retrieved from Error! Hyperlinkreference not valid. informatics/ehr.pdf.International Clinical Documentation Model, see Asp,Lone & Petersen, Jan, A Conceptual Modelfor Documentation of Clinical Information in theEHR, National Board of Health, Denmark, 2003.35.Akkad, Andrea, Clare Jackson, Sara Kenyon, MaryDixon-Woods, Nick Taub, and Marwan Habiba. 2006.
Patients' perceptions of written consent: Questionnairestudy. BMJ 333 (7567) (September 09): 528.36.Powell J. Buchan I. Electronic Health RecordsShould Support Clinical Research J MedInternet Res 2005:7(1):e4. Retrieved fromhttp://www.jmir.org/2005/1/e4/37.van der Linden, Helma, Dipak Kalra, Arie Hasman,and Jan Talmon. 2009. Inter- organizationalfuture proof EHR systems: A review of the securityand privacy related issues. International Journal ofMedical Informatics 78 (3) (3): 141-160.38.Willison, Donald J., Karim Keshavjee, KalpanaNair, Charlie Goldsmith, and Anne M.Holbrook. 2003. Patients' consent preferences forresearch uses of information in electronicmedical records: Interview and survey data. BMJ 326(7385) (February 15): 373-382.39.Win, Khin, and John Fulcher. 2007. Consentmechanisms for electronic health record systems:A simple yet unresolved issue. Journal of MedicalSystems 31 (2): 91-6.40. Hamilton, W. D., White, A. A., Ouellette, L., &Horacek, T. M. (2010). Use of geographicalinformation system to determine environment supportfor healthful living on a North Eastern Universitycampus. Journal of American Dietetic AssociationChicago, 110(9), 10_22.41.Maliene, V., Grigonis, V., Palevicius, V., &Griffiths, S. (2011). Geographic information system:Old principles with new capabilities, Urban DesignInternational, London, 16(1), 1- 6.42. Maikish, A. (2010). Universal primary educationand decentralization in Ghana. New YorkUniversity, AAT 3404544.43.APP. (2011). National Health Policy to meetMGDs: Gilani. Associated Press of Pakistan
(online). Available at http://www.app.com.pk.44. National Health Policy of Pakistan. (2010).National Health Policy. Islamabad: HealthDivision, Government of Pakistan.45.WHO (2011). Health for all by the Year 2020.WHO available at http://www.who.int.46 Goodman, S. E., & Wolcott, P. (2000). Internet inTurkey and Pakistan: A comparative analysis.Centre for International Security and Cooperation(CISAC) December 2000.
Related Documents