Impressions of Liusanjie: A Study of Motivation, Theatrical Performance Evaluation and Satisfaction This paper examines the relationships between motivation to visit, performance evaluation, satisfaction, and behavioral intentions for tourists experiencing “Impressions of Liusanjie”, an iconic, outdoor, theatrical performance in Guilin, China. The study finds that motivation does not affect satisfaction directly but that performance evaluation is an intervening variable between motivation and satisfaction. It also finds that experiential evaluation of the theatrical performance has more effect on satisfaction than evaluation of technical and functional attributes. Tourists were surveyed after the performance and the results analyzed using cluster, correlation analysis and structural equation modeling (SEM). The first two techniques were used to identify existing relationships amongst the study variables. SEM was applied to determine if a causal relationship existed and, if so, their strength. This research provides a contribution to the understanding of tourist motivation, theatrical performance evaluation, satisfaction, and behavioral intentions. Keywords: motivation, experience, satisfaction, behavioral intention, theatrical performance. 1

Welcome message from author
This document is posted to help you gain knowledge. Please leave a comment to let me know what you think about it! Share it to your friends and learn new things together.
Transcript
Impressions of Liusanjie: A Study of
Motivation, Theatrical Performance Evaluation
and Satisfaction
This paper examines the relationships between motivation to visit, performance evaluation, satisfaction, and behavioral intentions for tourists experiencing “Impressions of Liusanjie”, an iconic, outdoor, theatrical performance in Guilin, China. The study finds that motivation does not affect satisfaction directlybut that performance evaluation is an intervening variable between motivation and satisfaction. It also finds that experiential evaluation of the theatrical performance has more effect on satisfaction than evaluation of technical and functional attributes. Tourists were surveyed after the performance and the results analyzed using cluster, correlation analysis and structural equation modeling (SEM). The first two techniques were used to identify existing relationships amongst the study variables. SEM was applied to determine if a causal relationship existed and, if so, their strength. This research provides a contribution to the understanding of tourist motivation, theatrical performance evaluation, satisfaction, and behavioral intentions.Keywords: motivation, experience, satisfaction, behavioral intention, theatrical performance.
1

IntroductionTourists are increasing seeking novel and exciting
experiences and tourism managers are correspondingly developing unique and extravagant attractions, performances and product offerings to meet those requirements (Pearce & Caltabiano, 1983; Pine & Gilmore, 1998; Ritchie & Hudson, 2009; Yoon & Uysal, 2005). This has led to use of the term “experience economy” to discuss the need for products to be designed to be entertaining, educational, aesthetic, and/or an escape from everyday life. For such experiential products it is critical that managers understand tourists' satisfaction with such experiences (Gilmore & Pine, 2002; Pine & Gilmore, 1998). Attending theatrical performances plays asignificant role in the enjoyment of leisure time. Theatrical performances attract a wide range of domestic and international tourists, as well as repeat visitors from the local area. But what are the factors that affecta tourist’s perception of an experience and how do they evaluate experiences? In this paper we examine the effectof tourist motivation and its interplay with on-site evaluation, satisfaction and future behavioral intentions.
A review of the tourism literature reveals an abundance of studies on tourist motivation and satisfaction, with most focusing on visits to tourist destinations (Hsu, Cai, & Li, 2010; Pearce & Caltabiano, 1983; Poria, Reichel, & Biran, 2006; Ross & Iso-ahola, 1991). Destination choice is important in the decision-making process due to the preparation needed for long distance travel, the cost in money and time, and the variety of destinations available. Only a few studies however have examined motivation to visit medium and micro-scale tourism products (Connell, 2004; Swanson & Horridge, 2006), and these are primarily in the marketingand psychology literature (Brehm & Self, 1989; Pieters & Warlop, 1999; Schreier & Wood, 1948; Weiss, Anderson, & MacInnis, 1999). This study examines an experiential attraction in order to examine the effect of motivation to visit on satisfaction.
In the existing literature, the relation between motivation, tourism product evaluation, consequent
2

satisfaction and behavioral intention has not been extensively investigated (Yoon & Uysal, 2005). Previous tourism studies have examined the constructs of motivation and satisfaction independently, but not how motivation affects attitudes (Gnoth, 1997), or links to behavioral intention (Brewer & Hewstone, 2004; Lewin, 1951; Ross & Iso-ahola, 1991). The relationships between motivation for a visit, product evaluation, satisfaction,and behavioral intention have been discussed conceptually, but few studies have empirically examined the causal relationship (Hsu, et al., 2010; Yoon & Uysal,2005).
The objective of this research is to analyze the relationships between motivation, theatrical performance evaluation, satisfaction and behavioral intentions of tourists who attended a unique outdoor cultural performance. The study hypothesizes that individuals visiting a particular tourism product, irrespective of the motivation, will obtain a higher or lower satisfaction level depending on their evaluation of attributes of the tourism product more closely related totheir motivation for visiting. The results indicate that theatrical performance evaluation is an intervening variable between motivation and satisfaction, and that the experiential evaluation of the theatrical performancehas more effect than evaluation of technical and functional attributes on satisfaction. This study is the first to quantify the relation between these various concepts.Motivation, Experience and Satisfaction
Motivation is a central topic of research in psychology and marketing, and plays a fundamental role inthe stimulus-cognition-response model of human behavior. Motivation is the drive associated with achievement of a person's psychological/ biological needs and wants, and is an integral force that arouses, directs, and integrates a person’s behavior and activity (Dann, 1977; Gnoth, 1997; Pearce & Caltabiano, 1983; Ramkissoon & Uysal,2011). Thus motivation is an internal state, need, or condition that impels individuals toward action (Covington, 2000; Geen, 1991; Gnoth, 1997). This drive
3
causes behavior to occur which may lead to a feeling of satisfaction (Deci & Ryan, 1987).
Research on consumer motivation is divisible into twocategories (Campbell, Dunnette, Lawler, & Weick, 1970), based on use of either a process or content model of behavior. A process model seeks to predict which behaviors will be observed when a person is aroused, while content models include various conceptualizations of types of needs. A number of researchers have applied these concepts and models to study tourist motivation (Ballantyne, Packer, & Hughes, 2008; Crompton & McKay, 1997; Dann, 1977, 1981; Hsu, et al., 2010; Pearce & Caltabiano, 1983; Swanson & Horridge, 2006).
In tourism research, motivation has been discussed inwide range of studies. By analogy with its more general definition, tourism motivation refers to a set of needs that cause a person to participate in a tourist based activity (Park & Yoon, 2009; Pizam, Neumann, & Reichel, 1979; Ramkissoon & Uysal,2011; Swanson & Horridge, 2006).Research has examined the tourism motivation process (Gnoth, 1997; McCabe, 2000; Goossens, 2000; Maslow, 1943), motivation measurement (Crompton, 1979; Dann, 1981; Fodness, 1994), and has related motivation to different tourism activities, such as sightseeing (Ross &Iso-ahola, 1991), attending festivals (Crompton & McKay, 1997; Fodness, 1994), visiting gardens (Ballantyne, et al., 2008; Connell, 2004), adventure tourism (Radder, 2005), heritage and cultural tourism (Poria, et al., 2006), ecotourism (Beh & Bruyere, 2007; Luo & Deng, 2008), and rural tourism (Devesa, Laguna, & Palacios, 2010; Park & Yoon, 2009). Motivation has also been extensively used as a basis for segmentation.
Motivation is therefore a core concept in understanding tourist decision-making (Arnould, Price, & Zinkhan, 2002; Gnoth, 1997; Ross & Iso-ahola, 1991), and vital in understanding all forms of tourism (Kim, 1999; Radder, 2005). It is the starting point for decision processes (de Guzman, Leones, Tapia, Wong, & de Castro, 2006). Hence, analyses of motivation to visit and its relationship with perception, evaluation and attitude help managers to better understand tourists’ decision processes, identify opportunities with a view of
4

guaranteeing tourists’ satisfaction, and promote product development (Baker & Crompton, 2000; Crompton & McKay, 1997; Yoon & Uysal, 2005).
The theoretical model of tourist motivation used herebuilds upon the work of Gnoth (Gnoth,1997). Motivation associates with attitudes through its effect on a person’s willingness to process information (Eagly & Chaiken, 1993; Ng, 2010) and on the quality and quantity of information processed (Ng, 2010; Petty & Wegener, 1999).Prior research focuses on examining the qualitative relationship between motivation, attitude and behavior, and has examined the relationship between motivation, expectation and information processing using expectancy and achievement theories (Fluker & Turner, 2000; Gnoth, 1997; Poria, et al., 2006; Verinis, Brandsma, & Cofer, 1968). Motivation is an internal factor that can be likened to an awareness of potential satisfaction in a future situation and is a representation of future states. Such motivation causes autonomous initiation or self-determination of behavior, which is expected to leadto personally satisfying experiences (Brewer & Hewstone, 2004; Deci & Ryan, 1987; Lewin, 1951; Ross & Iso-ahola, 1991). Motivation relates positively to the concept of satisfaction, but motivation occurs before an experience and satisfaction after it (Iso-ahola, 1982). Some specific relationships among motivations, satisfaction, and tourism product loyalty, have been studied (Funk & Bruun, 2007; Hsu, et al., 2010; Swanson & Horridge, 2006;Yoon & Uysal, 2005), but the set of relationship between motivation, product evaluation, satisfaction and behavioral intention has not been identified.
Less research focuses on the quantitative relationship between motivation and perceptions of the on-site visit and its evaluation, although this is suggested as necessary and beneficial (Swanson & Horridge, 2006). Since motivation influences attitudes, such as product evaluations and perceived quality, which in turn have been found to be antecedents to satisfaction, the next section will discuss the evaluation of tourism products, focusing on evaluation ofthe quality of theatrical performances.
5

Attribute evaluation and experiential evaluation Experience has been discussed as an elusive area in
tourism research, and there is a lack of a common definition of it among researchers (Huang & Hsu, 2010; Oh, Fiore, & Jeoung, 2007). The attributes used to evaluate the quality of products, services or experiencesare debated. Researchers note that early philosophers used “quality” to refer to explicit features of an objectas perceived by a subject (Holbrook & Corfman, 1985) and this attribute approach has become the standard model. Grönroos (2000) has defined two dimensions of quality: technical and functional quality attributes. While researchers propose a difference between objective quality and perceived quality (Holbrook & Corfman, 1985; Parasuraman, Zeithaml, & Berry, 1985; Zeithaml, 1988), these models include quality as a series of attributes. Generally one or a few attributes from the total set of product attributes available appear to serve as reliable signals of product quality, but no standard has been found. Therefore there is a need to determine suitable quality-indicating attributes for different types of services and products.
The quality of services and products are usually evaluated on technical and functional attributes (Grönroos, 2000; Parasuraman, et al., 1985; Zeithaml, 1988). However, for experiential products such as a performance, technical attributes do not differentiate between the choices of consumers, and it is also difficult to determine which are technical and functionalattributes (Clarke, 2010; Morgan, Elbe, & Curiel, 2009; Oh, et al., 2007; Pine & Gilmore, 1998). For an experiential product such as a theatrical performance, the technical and functional attributes would include thequality of the music, actors, and setting, but for such products it is also necessary to determine experiential evaluation attributes such as entertainment, educational,aesthetic and escapist dimensions of the performance (Pine &Gilmore, 1998).
Research that has explored the elements of event and festival success from the visitor’s perspective offers insights into the relevant attributes of theatrical
6

performance. Saleh and Ryan (1993) assessed the success of two Canadian festivals in attracting tourists on the basis of access (ticketing, geographical accessibility and accommodation), quality of the program, social interaction and flexibility. Motivator attributes are thekey program attractors that persuade visitors to go to a festival and facilitate their satisfaction and include entertainment, activities, features and educational programs (Crompton, 2003). Event attributes that influence visitor satisfaction include transport, ceremonies and amenities throughout the event (Hall, Basarin, & Lockstone-Binney, 2010). Music festivals including live performances can are broadly popular (Bowen & Daniels, 2005). Less research has focused on theatrical performance quality evaluation alone and little has been done to determine how the experiences of the event or festival shape future behavior towards both the event itself and the relationship between tourist satisfaction and attitude and behavioral changes (Lehto, O'Leary, & Morrison, 2004).
Pine and Gilmore’s four realms of experience has beenintroduced recently to the tourism and hospitality literature (Oh, et al., 2007; Stamboulis & Skayannis, 2003) and provides a conceptual framework for understanding and measuring the nature of tourist experience in general. Researchers examining a product such as a hotel room or a restaurant meal usually consider consumers evaluations are based on technical attributes (e.g. size of room and bed, sanitary environment and tableware), or perhaps functional attributes (e.g. service quality for in room meals). However for theatrical performances such as the object ofthis study, “Impression of Liusanjie”, evaluations are based on experiential, technical and functional attributes (Bowen & Daniels, 2005; Brady & Cronin, 2001; Cooper, Fletcher, Fyall, Gilbert, & Wanhill, 2008; Parasuraman, et al., 1985). Such experiential evaluation plays an increasingly important role in research on the judgment of tourism product and services (Ritchie & Hudson, 2009; Stamboulis & Skayannis, 2003). In this study, we use the four realms of experience, namely entertainment, education, aestheticism and escapism to
7

identify the tourist's experiential evaluation of the show, and thus determine the relative effects of performance attributes on satisfaction and further behavioral outcomes.
Satisfaction and behavioral intentionThe topic of tourist satisfaction has been of great
interest to marketing and researchers for many years (Devesa, et al., 2010; Fornell, Johnson, Anderson, Cha, &Bryant, 1996; Oliver, 1980; Yoon & Uysal, 2005). Undoubtedly, satisfaction is important to successful tourism marketing because it influences the recommendations of products and services to others, and the decision to return (Yoon & Uysal, 2005). Satisfactionis a common way to evaluate the performance of tourism products and services. Satisfaction is considered to be (i) a cognitive state, (ii) influenced by previous cognition, and (iii) is the result of a comparison between a subjective experience and expectations.
Tourism researchers have used a number of different measures of service quality and satisfaction (Fornell, etal., 1996; Oliver, 1980; Ryan & Cessford, 2003; Yoon & Uysal, 2005). Studies conducted to evaluate consumer satisfaction have utilized models of expectation/disconfirmation (Bigne & Andreu, 2004; Menon & Dube, 2000; Oliver, 1999; Wirtz, Mattila, & Tan, 2000),equity (Oliver & Swan, 1989), norms (Cadotte, Woodruff, &Jenkins, 1987), and perceived overall service and performance (Tse & Wilton, 1988). Studies have also tested the relationship between disconfirmation and affective process (Bigne & Andreu, 2004; Menon & Dube, 2000; Oliver, 1999; Wirtz, et al., 2000). Repeat purchases or word-of-mouth recommendations to other people are most usually referred to as behavioral intention or consumer loyalty in the marketing literature(Fornell, et al., 1996; Yoon & Uysal, 2005), and are seenas unrelated to motivation. However some recent studies have suggested that a full understanding of loyalty needsto consider both motivation and satisfaction constructs simultaneously (Yoon & Uysal, 2005). This is the approachused in this paper.
8

HypothesesBased on the above, this paper considers that tourist
satisfaction with an experiential product is related to atourist's motivation and is evaluated on technical, functional and experiential dimensions. Motivation is an important factor in the visit evaluation criteria and, asa consequence, in the determination of the satisfaction with what has been experienced (Devesa, et al., 2010). Therefore, integration of previous studies indicates thatmotivation to experience different tourism products and the resultant on-site evaluation and perception are antecedents of satisfaction and behavioral intention. Hence, the following six hypotheses are proposed.
H1a: Motivation influences the experiential attributeevaluation of the show positively. H1b: Motivation influences the technical and functional attribute evaluation positively. H1c: Motivation influences satisfaction positively. H2: The experiential evaluationinfluences tourist satisfaction positively. H3: The technical and functional attribute evaluation influences tourist satisfaction positively. H4: The higher level oftourist satisfaction, the higher level of behavioral intention. All six hypotheses are shown in figure 1.
Please insert Figure 1 here.
Method and Data Analysis
This research was conducted with tourists attending the “Impression of Liusanjie” performance held in Guilin,a popular tourist destination located in one of the five minority autonomous regions in China. The play was first presented to audiences in March 2004, lasts for around 70minutes and takes place from seven in the evening. This show is famous throughout China and is a popular reason to visit Guilin, with around 800,000 tourists per year attending the performance.
“Impression of Liusanjie” was chosen as it provides an impressive experiential context in which to examine tourist motivation, on-site evaluation and perception, and their effects on satisfaction. The theatrical performance takes place over two kilometers of the Li
9

River, with mountains lit by colored spotlights providinga dramatic backdrop. There are four scenes to the show, each representing a season of the year. The outdoor theatrical performance combines ethnic culture and an open air setting to create an atmosphere of harmony between human beings and nature. The 600 performers are local villagers; most are fishermen from five local villages along the Li River. During the day, they work onthe river, and in the evening participate in the performance on bamboo rafts and on the river banks. They sing with untrained voices and dance in a natural and spontaneous style.
A survey questionnaire was developed to collect data relevant to the above hypotheses. The questionnaire was divided into two sections; the first providing demographic information, and the second consisting of items measuring motivations (13 items), experiential evaluation attributes (4 items), technical and functionalattribute evaluation (5 items), satisfaction (4 items), and intention to recommend to others (2 items). The tourist motivation scale used was based on previous motivation studies as well as the specific character of the performance (Connell, 2004; Hall ,et al.,2010; Pearce& Caltabiano, 1983; Ross & Iso-ahola, 1991; Swanson & Horridge, 2006). Items for evaluation of the experientialattributes were derived from the work of Pine and Gilmore(1998), while the evaluation of the technical attributes was based on the general characteristics of the show and measurement of service quality (Parasuraman, et al., 1985; Zeithaml, 1988). The satisfaction and intention scale items were those used in previous research (Fornell, 2001; Fornell, et al., 1996; Oliver, 1980). Allitems in the second section were formulated as statements, and respondents were required to indicate their level of agreement with each statement based on a six-point Likert scale ranging from very strongly disagree (one) to very strongly agree (six) in order to force a positive or negative response.
The questionnaire was prepared in bilingual language and pretested using face to face interviews to ensure theintended meaning of the questions were understood by respondents. Some 20 domestic and foreign tourists
10

attending the show were asked to complete the questionnaire and then interviewed to determine their understanding of the questions and whether any aspects were unclear. Information collected from the pretest was then used to review, modify, and finalize the questionnaire. The survey was conducted during April 2010, with respondents interviewed upon leaving the theatrical performance site. Approximately 250 tourists were approached and 229 valid answers were obtained corresponding to a response rate of 91.6%. The questionnaires were coded and analyzed by using SPSS (Version 11.5) and Lisrel (Version 8.7).
Please insert Table 1 here.
Demographic information on the final sample is shown in Table 1, and is generally similar to management statistics regarding tourists attending the theatrical performance. The survey data reliability coefficient (Cronbach’s alpha) was 0.919. In order to test for differences in the responses of foreign and domestic tourists, an independent samples test was performed on the 28 items, and only one item showed significant differences both in mean and variance; domestic tourists were more likely to agree that relaxation was a motivation to view the performance(mean =4.68) than foreign tourists (mean=3.60).
The items dealing with respondent motivation, evaluation and attitudes were subjected to a three-stage analysis. In the first stage, the reliability of the scales related to each variable was tested. Only the statements that had item-total correlations of 0.3 or above (Parasuraman, Zeithaml, & Berry, 1988), and had Cronbach's alpha coefficient higher than 0.60 (Nunnally &Bernstein, 1994) were kept for further analysis and discussion. All items except one met these criteria. Thismotivation item - “It was on the itinerary of a longer tour I am taking” (item-total correlation value of 0.281)was deleted and as a result Cronbach's alpha increased to0.921. The rest of the item-total correlation ranged from0.301 to 0.796 and the Cronbach's alpha coefficients ranged from 0.737 to 0.894.
11

In the second stage, a cluster analysis was used to identify differences in motivation for visiting, and was based on 12 motivation items. The use of factor scores ascluster variables is debated, as there is some evidence to suggest the items which truly discriminate among underlying groups are not well represented in many factorsolutions (Fredline & Faulkner, 2000), hence we used cluster analysis directly instead of conducting a factor analysis first. Solutions with between two and five clusters were examined (Davis, Allen, & Cosenza, 1988; Fredline& Faulkner, 2000), with the two cluster solution providing interpretable results. A correlation analysis was also conducted. The aim of these two analyses was to find empirical evidence that a relationship existed amongmotivation and attribute evaluation and between satisfaction and behavioral intention. This was achieved by first comparing the different means of each item in the cluster. Correlation analysis was used later based ontwo clusters in order to find if their motivation, evaluation, satisfaction and behavioral intention were correlated. The possible links between cluster solutions and demographic character was determined by using t-testsas shown in Table 1.
In the third stage, structure equation modeling (SEM)was used to test the six hypotheses. Firstly, the reliability of the scales was tested. Secondly, the loading of all items and internal consistency was examined. There were four motivation items that did not meet the recommended loading coefficient criteria (Nunnally & Bernstein, 1994). These were: for self-development, to be with friends and relatives/partner, being entertained and having fun, and for relaxation. Hence, there were 23 items suitable for use in the SEM analysis. Previous researchers recommend that the sample used in SEM should be 100 at a minimum and preferably over 200 (Anderson & Gerbing, 1988; Fornell & Larcker, 1981; Jöreskog & Sörbom, 1988; Pearl, 2000). This sample size also depends on the number of questions and variables. The ratio of items to sample should be more than 1:5. In this study these requirements were met.
Cluster and correlation analysis
12

A K-means cluster analysis was performed on the 12 motivation items. Cluster T1-1, was made up of 113 respondents or 49.3 % of the sample, and Cluster T1-2 was made up of 116 respondents or 51.7 % of the sample shown in Table 1. The t-test analysis of the two cluster solution showed that all 12 item means were significantlydifferent (F values were lower than the 0.01 significancecriterion), indicated differences among clusters as shownin Table 2.
Please insert Table 2 here.
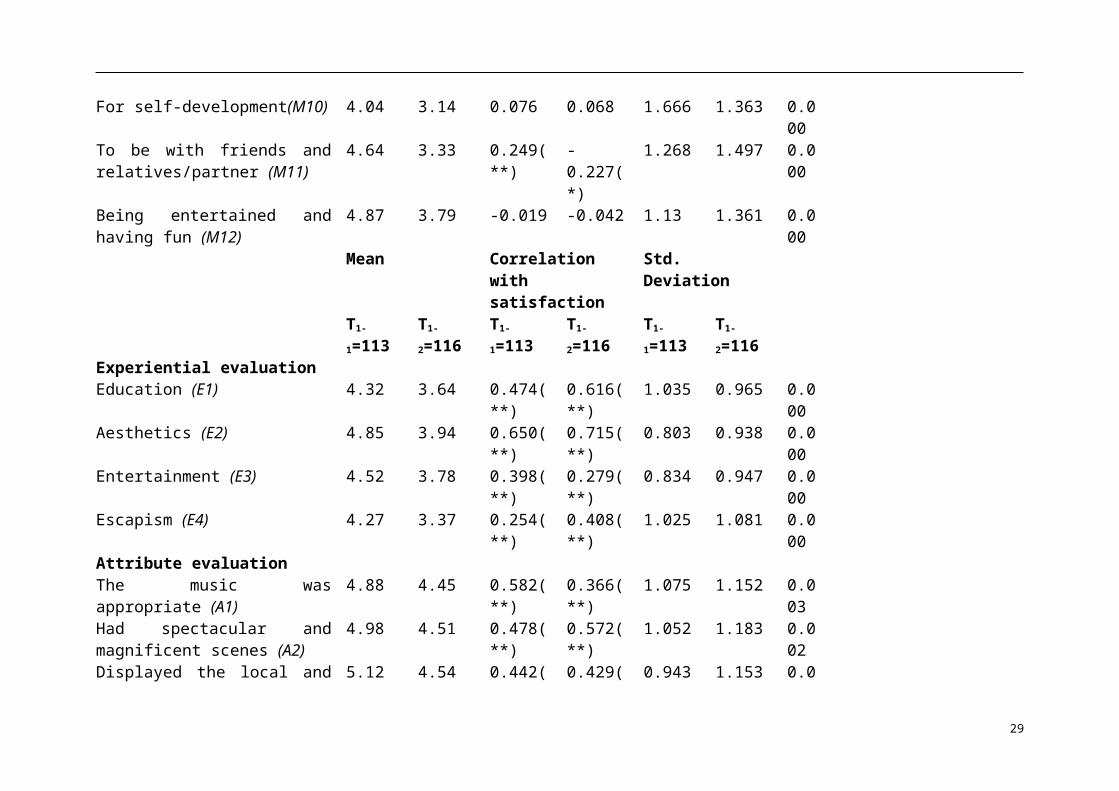
The clusters were tentatively labeled obvious and higher motivation (T1-1) because all of motivation items scored washigher than four; and ambiguous and lower motivation (T1-2) as all motivation items were lower than for cluster T1-1. Pearson correlation analysis showed those motivation items in cluster T1-1 more closely related with average satisfaction (average of four satisfaction item scores) than those of cluster T1-2. The motivation item, learns about the local culture had the largest Pearson correlation coefficient (0.475) in cluster T1-1, and was significant at the 0.01 level. This item had a mean above five which reflects interest in the theme of the performance. The corresponding experiential evaluations (four items), technical and functional attribute evaluations (five items), satisfaction (four items), and behavioral intention (two items), were all higher for T1-1 than for cluster T1-2. The perceptions of performance and satisfaction level were all lower than for T1-1 as shown in Table 2.
From the cluster analysis and correlation analysis,we can conclude that motivation is positively related tothe experiential evaluation and attribute evaluation ofthe show as the higher the mean of the motivation items,the higher the experiential evaluation and attributeevaluation items. Thus H1a, H1b, and H1c are supported.H2 and H3 were also supported because the higher theexperiential evaluation and attribute evaluation itemmeans, the higher tourist satisfaction item means.Similarly H4 was supported as the higher the touristsatisfaction item means, the higher behavioral intention
13

item means as can be seen in Table 2.
Structural equation model analysisSEM was used to test for causal relationship between
variables. Firstly the reliability of the scales was tested. The loadings of all items and the internal consistency were then examined. Four motivation items were lower than the recommended criteria of 0.40 and wereremoved.
Please insert Table 3 here.
Some 23 items were used in the SEM analysis (Table 3). Internal consistency was assessed by means of Cronbach's alpha coefficients which ranged from 0.737 to 0.894. The internal consistency of the measurement model,assessed using the composite reliability coefficients, ranged from 0.738 to 0.886, higher than the 0.6 recommended by Fornell and Larcher (1981). These measuresindicate a high internal reliability for the data. Four of the five constructs had an average extracted variance higher than the benchmark of 0.5 (Fornell & Larcker, 1981). The correlations between latent variables and their confidence intervals were calculated and are shown in Table 3. The variance extracted from each variable exceeds the value of its correlation with the other variables, indicating the discriminate validity of the scales (Anderson & Gerbing, 1988; Chin, Peterson & Brown,2008).
Please insert Figure 2 here.
The hypotheses were further evaluated by means of a path analysis. Each of the scales or items was reduced toonly one indicator or index. Using these values, and after calculating the error measurement of each indicatorbased on the path coefficient and t-test values, the proposed hypotheses was evaluated. The result of the evaluation was shown in Figure 1. The indicators of goodness of fit (χ2 (224) = 608.5, χ2/df=2.72; RMSEA = 0.087; NFI= 0.925; NNFI= 0.945; PNFI= 0.819; CFI= 0.952; GFI= 0.812; AGFI = 0.768; PGFI = 0.659) were all within
14

the recommended limits and are considered as proof of a good fit (Jöreskog & Sörbom, 1988). Figure 1 shows that all hypotheses are supported except H1c. In Figure 1 the significant relationships are presented as solid lines with their path coefficient and t values, and the non-significant relationship is presented as a broken line.
Results and Discussion
The relationships among motivation, experiential and attribute evaluation, tourist satisfaction and behavioralintention have been analyzed. Based on cluster and correlation analysis, relationships between motivation, perception and satisfaction were identified although it was not possible to show whether the relationship is direct or indirect. Using SEM five of the six hypotheses were supported and one was not supported. The results indicate that their motivation influenced strongly tourists’ experiential attribute evaluation and technicaland functional attribute evaluation (H1a, H1b), and theirexperiential attribute evaluation and technical and functional attribute evaluation influenced their satisfaction (H2, H3). Finally satisfaction affected behavioral intention (H4). The findings do not support H1c: motivation did not influence satisfaction positively. This study finds that motivational considerations directly influence tourist's evaluation ofa theatrical performance and these evaluations of the theatrical performance positively impact the degree of satisfaction. This conclusion is consistent with previousstudies, which found that motivation influences the quality and quantity of information processed, and perceptions of the tourism product (Ballantyne, et al., 2008; Connell, 2004; Petty & Wegener, 1999; Swanson & Horridge, 2006).
When motivation is high, people engage in more resource-demanding information processing. They process more information and scrutinize information more carefully (Ng, 2010; Petty & Wegener, 1999). This is shown in the current research, where the motivation item “learn about the local culture” (T1-1,M8 = 5.12), had a significant correlation with average (four items)
15

satisfaction, (0.475; p=0.01); indeed cluster T1-1 membersevaluated the attribute item “displayed the local and national character” highest (T1-1,A3 = 5.12) . The findings suggest that if theatrical performances are to introduce more educational or cultural information or activities, they will be more welcomed. Theatrical performance designers need to give careful consideration to the design and promotion of shows with cultural themes. Given the importance of restoration as a motivation to visit a theatrical performance, interpretive activities should be designed to be consistent with the need for a cultural, peaceful, and relaxing experience. All T1-1 satisfaction item means werehigher than for T1-2, and behavioral intention scores werealso higher. We conclude that satisfaction has a strong direct influence on behavioral intention.
The study finds that motivation only affect tourists’ satisfaction indirectly. Prior research indicates that the initiation of behavior (motivation) is largely a function of anticipation about the future consequences ofbehavior, which is expected to produce personal satisfaction. Motivation is an internal factor that represents “an awareness of potential satisfaction” in a future situation, meaning that motivation is representations of future states. Such motivation refers to autonomous initiation or self-determination of behavior (Deci & Ryan, 1987) and is expected to lead to personally satisfying experiences. In this study, motivation indeed influenced the quality and quantity of information processing such as tourists’ experiential, functional and technical attribute evaluation as previously shown (Petty & Wegener, 1999). However, satisfaction is based on on-site perceptions directly, instead of on motivation, which only has an indirect influence on attitude and behavioral outcomes. Although motivations are found to be linked to attitude and behavior in social psychological studies (Brewer & Hewstone, 2004; Lewin, 1951; Ross & Iso-ahola, 1991), this present study shows that motivation is linked to attitude indirectly. While previous authors such as Ross and Iso-ahola (1991) found that tours that met tourists motivations had high overall satisfaction with the tour
16

they did not test the nature of this link. Therefore, individuals visiting a particular tourism
product will obtain a higher or lower degree of satisfaction mainly depending on their evaluation of the product’s attributes, rather than their motivation for touring or viewing a theatrical performance. This is relevant both to the evaluation of performances and of other products such as visiting a historical garden. As the popularity of theatrical performances in China is rapidly increasing, the promotion of performances as partof local, regional and national tourism development strategies should be enhanced (Ballantyne, et al., 2008; Connell, 2004). Theatrical performances displaying the local and/or national character enhance the evaluation ofa tourism product and tourist satisfaction, and furthermore develop cultural understanding.
This study suggests that tourists are more concerned with the experiential aspects of a product in the emerging experience economy (Oh, et al., 2007). This is illustrated in Figure 2 which shows the path coefficient between experiential evaluation and satisfaction is more higher than that between functional and technical attribute evaluation and satisfaction. In the SEM model, the motivation item “to see a unique performance” has thehighest loading (λ=0.70) and a high evaluation score (mean=4.10), and the motivation item, “to learn about the local culture” received the highest evaluation score (mean=4.63). The tourists appear to have been attracted by the cultural performance and its uniqueness. In a destination offering a cultural tour, performance, exhibitions or event, the relationship between type of tourist and the attributes required to provide a positiveexperience is a promising area for future research.
This paper finds that motivation does not affect satisfaction directly but that performance evaluation is an intervening variable between motivation and satisfaction. It also finds that experiential evaluation of the theatrical performance has more effect on satisfaction than evaluation of technical and functional attributes.
17

Conclusions
This study contributes to theory of tourist's motivation and satisfaction, through testing the relationships between motivation to visit, performance evaluation, satisfaction, and behavioral intentions basedon “Impressions of Liusanjie”, an iconic cultural theatrical performance in Guilin, China. Theatrical performances attract a wide range of domestic and international tourists but little research has examined the factors that affect a tourist’s perception of an experience and how they evaluate experiences. This research provides a contribution of both theoretical and practical significance. Firstly this study adds to the body of knowledge supporting the motivation-product evaluation- satisfaction-behavioral intention process. Itprovides strong support for the influence of motivation on tourism product evaluation and confirms the relationship between satisfaction and behavioral intention. Most previous research focuses on tourist motivation to visit a destination with little discussion of other types of product. However, these results do not support a direct relationship between motivation and satisfaction. Instead the study finds that performance evaluation is an intervening variable between motivation and satisfaction. This research found that people with higher motivation to experience tourism products had higher evaluations of its attributes. It also finds that experiential evaluation of the theatrical performance hasmore effect on satisfaction than evaluation of technical and functional attributes. Since tourists are more concerned with the experiential aspects of a product in the emerging experience economy, tourism managers and theatrical performance designers should seek to develop unique attractions, performances and product offerings tomeet tourist requirements.
This research is not without limitations. It has examined a theatrical performance in one experiential context only where the motivation items loadings in the causal model are less than other factors. Thus different shows or contexts where the influence of motivational factors may be higher should be examined to test the
18

results obtained here. Self-report data may have sufferedfrom self-generated validity biases, and should be examined in future studies. The application of the study to other cultural product types such as theaters, museums, and concerts would also allow for wider generalizations to be made. Finally, comparing the motivation, experience evaluations and satisfaction amongdifferent types of tourists would be worthwhile.
Acknowledgements
The authors would like to thank the referees for their helpful comments. The study was supported by a grant fromthe National Science Foundation of China (No. 41101136), National Technology Support Project of China (No.2012BAC16B04) and National Social Science Foundation of China (No.10CMZ011).
ReferencesAnderson, J. C., & Gerbing, D. W. (1988). Structural
equation modeling in practice - a review and recommended 2-step approach. Psychological Bulletin, 103(3), 411-423.
Arnould, E. J., Price, L., & Zinkhan, G. M. (2002). Consumers. Boston: McGraw-Hill.
Baker, D. A., & Crompton, J. L. (2000). Quality, satisfaction and behavioral intentions. Annals of Tourism Research, 27(3), 785-804.
Ballantyne, R., Packer, J., & Hughes, K. (2008). Environmental awareness, interests and motives of botanic gardens visitors: Implications for interpretive practice. Tourism Management, 29(3), 439-444.
Beh, A., & Bruyere, B. L. (2007). Segmentation by visitormotivation in three Kenyan national reserves. TourismManagement, 28(6), 1464-1471.
Bigne, J. E., & Andreu, L. (2004). Emotions in segmentation - an empirical study. Annals of Tourism Research, 31(3), 682-696.
Bowen, H.E., & Daniels, M.J. (2005). Does the music matter? Motivations for attending a music festival.
19

Event Management, 9(3), 155-164.Brady, M. K., & Cronin, J. J. (2001). Some new thoughts
on conceptualizing perceived service quality: a hierarchical approach. Journal of Marketing, 65(3), 34-49.
Brehm, J. W., & Self, E. A. (1989). The intensity of motivation. Annual Review of Psychology, 40, 109-131.
Brewer, M. B., & Hewstone, M. (2004). Emotion and motivation. Malden, MA: Blackwell Pub.
Cadotte, E. R., Woodruff, R. B., & Jenkins, R. L. (1987).Expectations and norms in models of consumer satisfaction. Journal of Marketing Research, 24(3), 305-314.
Campbell, J., Dunnette, M., Lawler, E., & Weick, K. (1970). Managerial Behavior, Performance, and Effectiveness. New York: McGraw-Hill.
Chin, W. W., Peterson, R. A., & Brown, S. P. (2008). Structural equation modeling in marketing: Some practical reminders. Journal of Marketing Theory and Practice, 16(4), 287–298.
Clarke, A. (2010). Creating experiences in the experienceeconomy. Tourism Management, 31(3), 448.
Connell, J. (2004). The purest of human pleasures: The characteristics and motivations of garden visitors in Great Britain. Tourism Management, 25(2), 229-247.
Cooper, C., Fletcher, J., Fyall, A., Gilbert, D., & Wanhill, S. (2008). Tourism: Principles and practice.(4th ed.). Harlow: Financial Times Prentice Hall.
Covington, M. V. (2000). Goal theory, motivation, and school achievement: An integrative review. Annual Review of Psychology, 51, 171-200.
Crompton, J. L. (1979). Motivations for pleasure vacation. Annals of Tourism Research, 6(4), 408-424.
Crompton, J. L. (2003). Adapting Herzberg: A conceptualization of the effects of hygiene and motivator attributes on perceptions of event quality. Journal of Travel Research, 41(3), 305-310.
Crompton, J. L., & McKay, S. L. (1997). Motives of visitors attending festival events. Annals of Tourism Research, 24(2), 425-439.
Dann, G. M. S. (1977). Anomie, ego-enhancement and tourism. Annals of Tourism Research, 4(4), 184-194.
Dann, G. M. S. (1981). Tourist motivation an appraisal. Annals of Tourism Research, 8(2), 187-219.
20

Davis, D., Allen, J., & Cosenza, R. M. (1988). Segmentinglocal residents by their attitudes, interests, and opinions toward tourism. Journal of Travel Research, 27(2), 2-8.
de Guzman, A. B., Leones, J. D., Tapia, K. K. L., Wong, W. G., & de Castro, B. V. (2006). Segmenting motivation. Annals of Tourism Research, 33(3), 863-867.
Deci, E. L., & Ryan, R. M. (1987). The support of autonomy and the control of behavior. Journal of Personality and Social Psychology, 53(6), 1024-1037.
Devesa, M., Laguna, M., & Palacios, A. (2010). The role of motivation in visitor satisfaction: Empirical evidence in rural tourism. Tourism Management, 31(4), 547-552.
Eagly, A. H., & Chaiken, S. (1993). The psychology of attitudes. Fort Worth, TX: Harcourt Brace Jovanovich College Publishers.
Fluker, M., & Turner, L. (2000). Needs, motivations, and expectations of a commercial whitewater rafting experience. Journal of Travel Research, 38(4), 380–389.
Fodness, D. (1994). Measuring tourist motivation. Annals ofTourism Research, 21(3), 555-581.
Fornell, C. (2001). The science of satisfaction. Harvard Business Review, 79(3), 120-121.
Fornell, C., Johnson, M. D., Anderson, E. W., Cha, J. S.,& Bryant, B. E. (1996). The American customer satisfaction index: nature, purpose, and findings. Journal of Marketing, 60(4), 7-18.
Fornell, C., & Larcker, D. F. (1981). Evaluating structural equation models with unobservable variables and measurement error. Journal of Marketing Research, 18(1), 39-50.
Fredline, E., & Faulkner, B. (2000). Host community reactions: a cluster analysis. Annals of Tourism Research,27(3), 763-785.
Funk, D. C., & Bruun, T. J. (2007). The role of socio-psychological and culture-education motives in marketing international sport tourism: A cross-cultural perspective. Tourism Management, 28(3), 806-819.
Geen, R. G. (1991). Social motivation. Annual Review of Psychology, 42, 377-399.
21

Gilmore, J. H., & Pine II., Joseph. (2002). Differentiating hospitality operations via experiences. Cornell Hotel & Restaurant Administration Quarterly,43(3), 87-96.
Gnoth, J. (1997). Tourism motivation and expectation formation. Annals of Tourism Research, 24(2), 283.
Goossens, G. (2000). Tourism information and pleasure motivation. Annals of Tourism Research, 27(2), 301-321.
Grönroos, C. (2000). Service management and marketing : a customer relationship management approach (2nd ed.). Chichester, NY: Wiley.
Hall, J., Basarin, V. J., & Lockstone-Binney, L. (2010). An empirical analysis of attendance at a commemorative event: Anzac Day at Gallipoli. International Journal of Hospitality Management, 29(2), 245-253.
Holbrook, M. B., & Corfman, K. P. (1985). Quality and value in the consumption experience: Phaedrus Rides Again. In J. Jacoby & J. C. Olson (Eds.), Perceived quality : how consumers view stores and merchandise.(pp. 31-35).Lexington, MA: LexingtonBooks.
Hsu, C. H. C., Cai, L. A., & Li, M. (2010). Expectation, motivation, and attitude: A tourist behavioral model. Journal of Travel Research, 49(3), 282-296.
Huang, J., & Hsu, C. H. C. (2010). The Impact of Customer-to-Customer Interaction on Cruise Experience and Vacation Satisfaction. Journal of Travel Research, 49(1), 79-92.
Iso-ahola, S. E. (1982). Toward a Social psychological theory of tourism motivation - a rejoinder. Annals of Tourism Research, 9(2), 256-262.
Jöreskog, K. G., & Sörbom, D. (1988). LISREL 7: A guide to the program and applications. Chicago, IL: SPSS.
Kim, C. (1999). Cross-cultural perspectives on motivation. Annals of Tourism Research, 26(1), 201-204.
Lehto, X., O'Leary, J., & Morrison, A. (2004). The effect of prior experience on vacation behavior. Annals of Tourism Research, 31(4), 801-818.
Lewin, K. (1951). Intention, will, and need in organization and pathology of thought, InD. Rapaport(Ed.), Organization and Pathology of Thought, (pp. 95-153): New York, NY: Columbia University Press.
22

Luo, Y. J., & Deng, J. Y. (2008). The new environmental paradigm and nature-based tourism motivation. Journal of Travel Research, 46(4), 392-402.
Maslow, A. H. (1943). A theory of human motivation. Psychological Review, 50, 370-396.
McCabe, A. S. (2000). Tourism motivation process. Annals ofTourism Research, 27(4), 1049-1052.
Menon, K., & Dube, L. (2000). Ensuring greater satisfaction by engineering salesperson response to customer emotions. Journal of Retailing, 76(3), 285-307.
Morgan, M., Elbe, J., & Curiel, J. D. (2009). Has the experience economy arrived? The views of destinationmanagers in three visitor-dependent areas. International Journal of Tourism Research, 11(2), 201-216.
Ng, S. (2010). Cultural orientation and brand dilution: Impact of motivation level and extension typicality.Journal of Marketing Research, 47(1), 186-198.
Nunnally, J. C., & Bernstein, I. H. (1994). Psychometric theory. (3rd ed.), New York, NY: McGraw-Hill.
Oh, H., Fiore, A. M., & Jeoung, M. (2007). Measuring experience economy concepts: tourism applications. Journal of Travel Research, 46(2), 119-132.
Oliver, R. L. (1980). A cognitive model of the antecedents and consequences of satisfaction decisions. Journal of Marketing Research, 17(4), 460-469.
Oliver, R. L. (1999). Whence consumer loyalty? Journal of Marketing, 63, 33-44.
Oliver, R. L., & Swan, J. E. (1989). Equity and disconfirmation perceptions as influences on merchant and product satisfaction. Journal of Consumer Research, 16(3), 372-383.
Parasuraman, A., Zeithaml, V., & Berry, L. (1985). A conceptual-model of service quality and its implications for future-research. Journal of Marketing, 49(4), 41-50.
Parasuraman, A., Zeithaml, V., & Berry, L. (1988). SERVQUAL: a multiple-item scale for measuring consumer perceptions of services quality. Journal of Retailing, 64, 12-40.
Park, D. B., & Yoon, Y. S. (2009). Segmentation by motivation in rural tourism: A Korean case study. Tourism Management, 30(1), 99-108.
23

Pearce, P., & Caltabiano, M. (1983). Inferring travel motivation from travellers’ experience. Journal of TravelResearch, 22, 16-20.
Pearl, J. (2000). Causality : models, reasoning, and inference. Cambridge, U.K. ; New York: Cambridge University Press.
Petty, R. E., & Wegener, D. T. (1999). The elaboration likelihood model: Current status and controversies. In C. Shelly & T. Yaacov (Eds.), Dual Process Theories in Social Psychology (pp. 73–96): New York, NY: Guilford Press.
Pieters, R., & Warlop, L. (1999). Visual attention duringbrand choice: The impact of time pressure and task motivation. International Journal of Research in Marketing, 16(1), 1-16.
Pine, B. J., & Gilmore, J. H. (1998). Welcome to the experience economy. Harvard Business Review, 76(4), 97-105.
Pizam, A., Neumann, Y., & Reichel, A. (1979). Tourist satisfaction. Annals of Tourism Research, 6, 195–197.
Poria, Y., Reichel, A., & Biran, A. (2006). Heritage sitemanagement - Motivations and expectations. Annals of Tourism Research, 33(1), 162-178.
Radder, L. (2005). Motives of international trophy hunters. Annals of Tourism Research, 32(4), 1141-1144.
Ritchie, J. R. B., & Hudson, S. (2009). Understanding andmeeting the challenges of consumer/tourist experience research. International Journal of Tourism Research, 11(2), 111-126.
Ramkissoon, H., & Uysal, M. S. (2011). The effects of perceived authenticity, information search behaviour, motivation and destination imagery on cultural behavioural intentions of tourists. Current Issues in Tourism, 14(6), 537-562.
Ryan, C., & Cessford, G. (2003). Developing a Visitor Satisfaction Monitoring Methodology: Quality Gaps, Crowding and Some Results. Current Issues in Tourism, 6(6), 457-506.
Ross, E. L. D., & Iso-ahola, S. E. (1991). Sightseeing tourists motivation and satisfaction. Annals of Tourism Research, 18(2), 226-237.
Saleh, F., & Ryan, C. (1993). Jazz and knitwear: factors
24

that attract tourists to festivals. Tourism Management,14(4), 289–297.
Schreier, F. T., & Wood, A. J. (1948). Motivation analysis in market research. Journal of Marketing, 13(2), 172-182.
Stamboulis, Y., & Skayannis, P. (2003). Innovation strategies and technology for experience-based tourism. Tourism Management, 24(1), 35-43.
Swanson, K. K., & Horridge, P. E. (2006). Travel motivations as souvenir purchase indicators. Tourism Management, 27(4), 671-683.
Tse, D. K., & Wilton, P. C. (1988). Models of consumer satisfaction formation - an extension. Journal of Marketing Research, 25(2), 204-212.
Verinis, J. S., Brandsma, J. M., & Cofer, C. N. (1968). Discrepancy from expectation in relation to affect and motivation - tests of Mcclellands hypothesis. Journal of Personality and Social Psychology, 9(1), 47-58.
Weiss, A. M., Anderson, E., & MacInnis, D. J. (1999). Reputation management as a motivation for sales structure decisions. Journal of Marketing, 63(4), 74-89.
Wirtz, J., Mattila, A. S., & Tan, R. L. P. (2000). The moderating role of target-arousal on the impact of affect on satisfaction - an examination in the context of service experiences. Journal of Retailing, 76(3), 347-365.
Yoon, Y., & Uysal, M. (2005). An examination of the effects of motivation and satisfaction on destination loyalty: a structural model. Tourism Management, 26(1), 45-56.
Zeithaml, V. A. (1988). Consumer perceptions of price, quality, and value: a means-end model and synthesis of evidence. Journal of Marketing, 52(3), 2-22.
25

Table 1. Overall demographics and two cluster solution a
Overall Two type clusterT1-1 T1-2
n=229 % n=113 % n=116 %Gender Male 107 46.7
250 44.2 57 49.1
Female 122 53.28
63 55.8 59 50.9
Age 14-24 67 29.2
537 32.7 30 25.9
25-44 124 54.15
54 47.8 70 60.3
45-64 34 14.85
19 16.8 15 12.9
65 + 4 1.75 3 2.7 1 0.9Educationb Junior andlower
8 3.49 6 5.3 2 1.7
Senior 40 17.47
23 20.4 17 14.7
TechnicalSchool
50 21.83
27 23.9 23 19.8
Undergraduate 78 34.06
32 28.3 46 39.7
Postgraduateand above
53 23.14
25 22.1 28 24.1
Nationality Domestic 148 64.6
374 65.5 74 63.8
Inbound 81 35.37
39 34.5 42 36.2
a: T1-1 andT1-2 based on two cluster solution; T1-1: obvious and higher motivation; T1-2: ambiguous and lower motivation. The same labels apply in the following table. b: Junior equivalent to grades seven-nine in USA; Senior to grades 10-12 in the USA.
26

27

Table 2. Two cluster analysis of motivations
Items Mean Correlationwithsatisfaction c
Std. Deviation
t-test
T1-
1=113T1-
2=116T1-
1=113T1-
2=116T1-
1=113T1-
2=116Sig.
Pull MotivationIt is a classic that Ifelt I must see (M1)
4.50 3.41 0.355(**)
0.181 1.283 1.332 0.000
It was recommended (M2) 4.86 4.01 0.303(**)
0.330(**)
0.981 1.367 0.000
To see a uniqueperformance (M3)
4.86 3.35 0.352(**)
0.157 1.017 1.385 0.000
Something to do at nightfor entertainment (M4)
4.82 2.94 0.345(**)
0.105 0.938 1.26 0.000
It is affordable (M5) 4.41 2.87 0.158 -0.013 1.139 1.234 0.000
Push Motivation For the excitement (M6) 4.73 3.22 0.164 -0.065 0.938 1.214 0.0
00For the experience (M7) 4.81 3.74 0.275(
**)0.292(**)
1.031 1.266 0.000
Learn about the localculture (M8)
5.12 4.16 0.475(**)
0.121 0.998 1.381 0.000
For relaxation (M9) 4.91 3.71 0.258(**)
-0.098 0.996 1.538 0.000
28
For self-development(M10) 4.04 3.14 0.076 0.068 1.666 1.363 0.000
To be with friends andrelatives/partner (M11)
4.64 3.33 0.249(**)
-0.227(*)
1.268 1.497 0.000
Being entertained andhaving fun (M12)
4.87 3.79 -0.019 -0.042 1.13 1.361 0.000
Mean Correlationwithsatisfaction
Std.Deviation
T1-
1=113T1-
2=116T1-
1=113T1-
2=116T1-
1=113T1-
2=116Experiential evaluation Education (E1) 4.32 3.64 0.474(
**)0.616(**)
1.035 0.965 0.000
Aesthetics (E2) 4.85 3.94 0.650(**)
0.715(**)
0.803 0.938 0.000
Entertainment (E3) 4.52 3.78 0.398(**)
0.279(**)
0.834 0.947 0.000
Escapism (E4) 4.27 3.37 0.254(**)
0.408(**)
1.025 1.081 0.000
Attribute evaluationThe music wasappropriate (A1)
4.88 4.45 0.582(**)
0.366(**)
1.075 1.152 0.003
Had spectacular andmagnificent scenes (A2)
4.98 4.51 0.478(**)
0.572(**)
1.052 1.183 0.002
Displayed the local and 5.12 4.54 0.442( 0.429( 0.943 1.153 0.0
29

national character (A3) **) **) 00Had professionalperformers (A4)
4.65 4.09 0.364(**)
0.517(**)
1.043 1.176 0.000
Had a cultural theme (A5) 4.74 4.31 0.515(**)
0.590(**)
1.067 1.197 0.004
SatisfactionI think that I did theright thing when Ipurchased this (S1)
4.67 4.05 --- --- 1.153 1.193 0.000
I was delighted by thisshow (S2)
4.83 4.05 --- --- 1.06 1.178 0.000
It was better than Iexpected (S3)
4.42 3.69 --- --- 1.252 1.281 0.000
Overall I was satisfiedwith the performance?(S4)
4.65 3.95 --- --- 1.101 1.141 0.000
IntentionI will tell other peoplegood things about theshow (I1)
4.79 4.15 0.597(**)
0.657(**)
1.064 1.152 0.000
I would like to see thisshow again (I2)
4.53 3.53 0.473(**)
0.416(**)
1.389 1.295 0.000
c : Correlation with satisfaction, using average of satisfaction items; ** Correlation is significant at the 0.01 level (two-tailed), * Correlation is significant at the 0.05 level (two-tailed).
30

Table 3. Information regarding SEM Analysis d
Variable
Description
Mean ITC λ Var (E) α CR SMC AVE
Experiential
evaluation
0.7
90
0.79
4
0.52
6
E1 3.98 0.61
8
0.67 0.55 0.49
2
E2 4.39 0.80
3
0.91 0.17 0.74
0
E3 4.15 0.53
6
0.63 0.61 0.53
7
E4 3.81 0.51
4
0.57 0.67 0.44
8
Attribute
evaluation
0.8
42
0.84
2
0.52
5
A1 4.66 0.54
4
0.66 0.56 0.50
1
A2 4.74 0.57
2
0.72 0.48 0.52
7
A3 4.83 0.54
4
0.71 0.50 0.50
0
31

A4 4.36 0.53
7
0.72 0.48 0.53
2
A5 4.52 0.57
0
0.78 0.39 0.60
0
Satisfaction
S1 4.36 0.72
3
0.77 0.37 0.8
94
0.88
6
0.67
9
0.68
0
S2 4.44 0.73
4
0.84 0.24 0.71
5
S3 4.05 0.64
8
0.75 0.40 0.65
1
S4 4.29 0.71
0
0.81 0.28 0.69
5
Intention 0.7
37
0.73
8
0.57
5
I1 4.46 0.63
4
0.84 0.26 0.59
3
I2 4.03 0.52
0
0.66 0.54 0.49
1
Motivation 0.8
06
0.80
5
0.40
8
32

M1 3.94 0.47
0
0.56 0.68 0.38
6
M2 4.43 0.49
7
0.56 0.68 0.38
1
M3 4.10 0.54
6
0.70 0.51 0.48
4
M4 3.87 0.52
9
0.67 0.55 0.55
8
M5 3.63 0.39
4
0.48 0.77 0.49
0
M6 3.96 0.39
5
0.51 0.74 0.47
3
M7 4.27 0.50
6
0.62 0.62 0.46
6
M8 4.63 0.46
6
0.55 0.70 0.38
3
d :ITC : Item-Total Correlation; Var (E) =Error variances; SMC= Squared multiple correlation; CR=Composite reliability; AVE= Average variance extracted
33
Related Documents