IMPORTANT NOTICE THIS OFFERING IS AVAILABLE ONLY TO INVESTORS WHO EITHER (1) ARE QIBS UNDER RULE 144A OR (2) HAVE ADDRESSES OUTSIDE OF THE U.S. IMPORTANT: You must read the following before continuing. The following applies to the offering circular following this page, and you are therefore advised to read this carefully before reading, accessing or making any other use of the offering circular. In accessing the offering circular, you agree to be bound by the following terms and conditions, including any modifications to them any time you receive any information from us as a result of such access. NOTHING IN THIS ELECTRONIC TRANSMISSION CONSTITUTES AN OFFER OF SECURITIES FOR SALE OR SOLICITATION IN ANY JURISDICTION WHERE IT IS UNLAWFUL TO DO SO. THE SECURITIES HAVE NOT BEEN, AND WILL NOT BE, REGISTERED UNDER THE U.S. SECURITIES ACT OF 1933, AS AMENDED (THE “SECURITIES ACT”), OR THE SECURITIES LAWS OF ANY STATE OF THE U.S. OR OTHER JURISDICTION, AND THE SECURITIES MAY NOT BE OFFERED OR SOLD WITHIN THE U.S., EXCEPT PURSUANT TO AN EXEMPTION FROM, OR IN A TRANSACTION NOT SUBJECT TO, THE REGISTRATION REQUIREMENTS OF THE SECURITIES ACT AND APPLICABLE STATE OR LOCAL SECURITIES LAWS. THE FOLLOWING OFFERING CIRCULAR MAY NOT BE FORWARDED OR DISTRIBUTED TO ANY OTHER PERSON AND MAY NOT BE REPRODUCED IN ANY MANNER WHATSOEVER. ANY FORWARDING, DISTRIBUTION OR REPRODUCTION OF THIS DOCUMENT IN WHOLE OR IN PART IS UNAUTHORIZED. FAILURE TO COMPLY WITH THIS DIRECTIVE MAY RESULT IN A VIOLATION OF THE SECURITIES ACT OR THE APPLICABLE LAWS OF OTHER JURISDICTIONS. Confirmation of your Representation: In order to be eligible to view this offering circular or make an investment decision with respect to the securities, investors must either (1) be Qualified Institutional Buyers (“QIBs”) (within the meaning of Rule 144A under the Securities Act) or (2) have an address outside the U.S. This offering circular is being sent at your request and by accepting the e-mail and accessing this offering circular, you shall be deemed to have represented to us that (1) either (a) you and any customers you represent are QIBs or (b) the electronic mail address that you gave us and to which this e-mail has been delivered is not located in the U.S. and (2) you consent to delivery of such offering circular by electronic transmission. You are reminded that this offering circular has been delivered to you on the basis that you are a person into whose possession this offering circular may be lawfully delivered in accordance with the laws of the jurisdiction in which you are located. If this is not the case, you must return this offering circular to us immediately. You may not, nor are you authorized to, deliver or disclose the contents of this offering circular to any other person. The materials relating to the offering do not constitute, and may not be used in connection with, an offer or solicitation in any place where offers or solicitations are not permitted by law. If a jurisdiction requires that the offering be made by a licensed broker or dealer and the managers or any affiliate of the managers is a licensed broker or dealer in that jurisdiction, the offering shall be deemed to be made by the managers or such affiliate on behalf of the Government of the Democratic Socialist Republic of Sri Lanka in such jurisdiction. This offering circular has been sent to you in an electronic form. You are reminded that documents transmitted via this medium may be altered or changed during the process of electronic transmission and consequently none of the Government of the Democratic Socialist Republic of Sri Lanka, Citigroup Global Capital Markets Inc., CLSA Limited, Deutsche Bank AG, Singapore Branch, The Hongkong and Shanghai Banking Corporation Limited, ICBC International Securities Limited, J.P. Morgan (S.E.A.) Limited, Standard Chartered Bank, nor any person who controls any of them nor any director, officer, employee nor agent of any of them or affiliate of any such person accepts any liability or responsibility whatsoever in respect of any difference between this offering circular distributed to you in electronic format and the hard copy version available to you on request from Citigroup Global Capital Markets Inc., CLSA Limited, Deutsche Bank AG, Singapore Branch, The Hongkong and Shanghai Banking Corporation Limited, ICBC International Securities Limited, J.P. Morgan (S.E.A.) Limited or Standard Chartered Bank. You are responsible for protecting against viruses and other destructive items. Your use of this e-mail is at your own risk and it is your responsibility to take precautions to ensure that it is free from viruses and other items of a destructive nature. IF YOU HAVE GAINED ACCESS TO THIS TRANSMISSION CONTRARY TO ANY OF THE FOREGOING RESTRICTIONS, YOU ARE NOT AUTHORIZED AND WILL NOT BE ABLE TO PURCHASE ANY OF THE SECURITIES DESCRIBED THEREIN.

Welcome message from author
This document is posted to help you gain knowledge. Please leave a comment to let me know what you think about it! Share it to your friends and learn new things together.
Transcript
IMPORTANT NOTICE
THIS OFFERING IS AVAILABLE ONLY TO INVESTORS WHO EITHER(1) ARE QIBS UNDER RULE 144A OR (2) HAVE ADDRESSES OUTSIDE OF THE U.S.
IMPORTANT: You must read the following before continuing. The following applies to the offering circularfollowing this page, and you are therefore advised to read this carefully before reading, accessing or making anyother use of the offering circular. In accessing the offering circular, you agree to be bound by the following termsand conditions, including any modifications to them any time you receive any information from us as a result ofsuch access.
NOTHING IN THIS ELECTRONIC TRANSMISSION CONSTITUTES AN OFFER OF SECURITIES FOR SALEOR SOLICITATION IN ANY JURISDICTION WHERE IT IS UNLAWFUL TO DO SO. THE SECURITIES HAVENOT BEEN, AND WILL NOT BE, REGISTERED UNDER THE U.S. SECURITIES ACT OF 1933, ASAMENDED (THE “SECURITIES ACT”), OR THE SECURITIES LAWS OF ANY STATE OF THE U.S. OROTHER JURISDICTION, AND THE SECURITIES MAY NOT BE OFFERED OR SOLD WITHIN THE U.S.,EXCEPT PURSUANT TO AN EXEMPTION FROM, OR IN A TRANSACTION NOT SUBJECT TO, THEREGISTRATION REQUIREMENTS OF THE SECURITIES ACT AND APPLICABLE STATE OR LOCALSECURITIES LAWS.
THE FOLLOWING OFFERING CIRCULAR MAY NOT BE FORWARDED OR DISTRIBUTED TO ANY OTHERPERSON AND MAY NOT BE REPRODUCED IN ANY MANNER WHATSOEVER. ANY FORWARDING,DISTRIBUTION OR REPRODUCTION OF THIS DOCUMENT IN WHOLE OR IN PART IS UNAUTHORIZED.FAILURE TO COMPLY WITH THIS DIRECTIVE MAY RESULT IN A VIOLATION OF THE SECURITIES ACTOR THE APPLICABLE LAWS OF OTHER JURISDICTIONS.
Confirmation of your Representation: In order to be eligible to view this offering circular or make aninvestment decision with respect to the securities, investors must either (1) be Qualified Institutional Buyers(“QIBs”) (within the meaning of Rule 144A under the Securities Act) or (2) have an address outside the U.S. Thisoffering circular is being sent at your request and by accepting the e-mail and accessing this offering circular,you shall be deemed to have represented to us that (1) either (a) you and any customers you represent are QIBsor (b) the electronic mail address that you gave us and to which this e-mail has been delivered is not located inthe U.S. and (2) you consent to delivery of such offering circular by electronic transmission. You are remindedthat this offering circular has been delivered to you on the basis that you are a person into whose possession thisoffering circular may be lawfully delivered in accordance with the laws of the jurisdiction in which you arelocated. If this is not the case, you must return this offering circular to us immediately. You may not, nor are youauthorized to, deliver or disclose the contents of this offering circular to any other person.
The materials relating to the offering do not constitute, and may not be used in connection with, an offer orsolicitation in any place where offers or solicitations are not permitted by law. If a jurisdiction requires that theoffering be made by a licensed broker or dealer and the managers or any affiliate of the managers is a licensedbroker or dealer in that jurisdiction, the offering shall be deemed to be made by the managers or such affiliateon behalf of the Government of the Democratic Socialist Republic of Sri Lanka in such jurisdiction.
This offering circular has been sent to you in an electronic form. You are reminded that documents transmittedvia this medium may be altered or changed during the process of electronic transmission and consequently noneof the Government of the Democratic Socialist Republic of Sri Lanka, Citigroup Global Capital Markets Inc.,CLSA Limited, Deutsche Bank AG, Singapore Branch, The Hongkong and Shanghai Banking CorporationLimited, ICBC International Securities Limited, J.P. Morgan (S.E.A.) Limited, Standard Chartered Bank, nor anyperson who controls any of them nor any director, officer, employee nor agent of any of them or affiliate of anysuch person accepts any liability or responsibility whatsoever in respect of any difference between this offeringcircular distributed to you in electronic format and the hard copy version available to you on request fromCitigroup Global Capital Markets Inc., CLSA Limited, Deutsche Bank AG, Singapore Branch, The Hongkong andShanghai Banking Corporation Limited, ICBC International Securities Limited, J.P. Morgan (S.E.A.) Limited orStandard Chartered Bank.
You are responsible for protecting against viruses and other destructive items. Your use of this e-mail is at yourown risk and it is your responsibility to take precautions to ensure that it is free from viruses and other items ofa destructive nature.
IF YOU HAVE GAINED ACCESS TO THIS TRANSMISSION CONTRARY TO ANY OF THE FOREGOINGRESTRICTIONS, YOU ARE NOT AUTHORIZED AND WILL NOT BE ABLE TO PURCHASE ANY OF THESECURITIES DESCRIBED THEREIN.
OFFERING CIRCULAR CONFIDENTIAL
The Democratic Socialist Republic of Sri Lanka
US$1,500,000,000 6.20% Bonds due 2027
The US$1,500,000,000 6.20% Bonds due 2027 (the “Bonds”) of the Government of the Democratic Socialist Republicof Sri Lanka (the “Issuer”) will be issued in registered form in minimum denominations of US$200,000 and integralmultiples of US$ 1,000 in excess thereof. Interest on the Bonds will be payable semi-annually in arrears on May 11and November 11 of each year commencing on November 11, 2017. The Bonds are not redeemable prior to maturity.Except as described herein, payments on the Bonds will be made without deduction for or on account of withholdingtaxes imposed by Sri Lanka. The Bonds will mature at par on May 11, 2027.
The Bonds will constitute direct, unconditional, unsubordinated and unsecured general obligations of the Issuer. TheBonds will at all times rank pari passu among themselves in all respects, without any preference of one over the otherby reason of priority of date of issue or otherwise. The Bonds will at all times rank at least equally with all otherpresent and future unsecured and unsubordinated External Indebtedness (as defined herein) of the Issuer. The full faithand credit of the Democratic Socialist Republic of Sri Lanka will be pledged for the due and punctual payment of theprincipal of, and interest on, the Bonds.
The Bonds are expected to be rated “B+” by Standard & Poor’s Ratings Services, “B1” by Moody’s Investors Serviceand “B+” by Fitch Ratings. The ratings assigned by rating agencies are indicative and may go up and down from timeto time. A credit rating is not a recommendation to purchase, hold or sell securities and may be subject to suspension,change or withdrawal at any time by the assigning rating agency.
The Bonds are a new issue of securities with no established trading market. Approval in-principle has been receivedfrom the Singapore Exchange Securities Trading Limited (the “SGX-ST”) for the listing and quotation of the Bondson the SGX-ST. For so long as the Bonds are listed on the SGX-ST and the rules of the SGX-ST so require, the Bondswill be traded on the SGX-ST in a minimum board lot size of S$200,000 (or its equivalent in foreign currencies) TheSGX-ST assumes no responsibility for the correctness of any of the statements made, opinions expressed or reportscontained in this Offering Circular. Approval in-principle from, admission to the Official List of, and the listing andquotation of any Bonds on, the SGX-ST are not to be taken as an indication of the merits of the Issuer or the Bonds.
The Bonds have not been and will not be registered under the U.S. Securities Act of 1933, as amended (the “SecuritiesAct”), or with any securities regulatory authority of any state or other jurisdiction of the United States. The Bonds maynot be offered or sold within the United States except to qualified institutional buyers (“QIBs”) in reliance on theexemption from registration provided by Rule 144A under the Securities Act (“Rule 144A”) and outside the UnitedStates in offshore transactions in reliance on Regulation S under the Securities Act (“Regulation S”). Prospectiveinvestors are hereby notified that sellers of the Bonds may be relying on the exemption from the provisions of Section5 of the Securities Act provided by Rule 144A. For a description of certain restrictions on resale or transfer, see “Planof Distribution” and “Notice to Investors”.
Bond Price: 100.0%
Delivery of the Bonds is expected to be made on or about May 11, 2017 through the book-entry facilities of TheDepository Trust Company (“DTC”).
Joint Lead Managers and Bookrunners
Citigroup CITICCLSA
Securities
DeutscheBank
HSBC ICBCInternational
J.P. Morgan StandardChartered
Bank
The date of this Offering Circular is May 4, 2017.
Prospective investors should rely only on the information contained in this Offering Circular. Noperson has been authorized to give any information or to make any representation other thanthose contained in this Offering Circular in connection with the offering of the Bonds (the“Offering”) and, if given or made, such information or representations must not be relied uponas having been authorized by the Issuer or the initial purchasers named in “Plan of Distribution”(the “Initial Purchasers”). Neither the delivery of this Offering Circular nor any sale madehereunder shall, under any circumstances, constitute a representation or create any implicationthat there has been no change in the affairs of the Issuer since the date hereof. This OfferingCircular does not constitute an offer of, or an invitation by, or on behalf of, the Issuer or theInitial Purchasers to subscribe for, or purchase, any of the Bonds in any jurisdiction in whichsuch offer or invitation is not authorized or unlawful.
TABLE OF CONTENTS
CERTAIN DEFINED TERMS AND CONVENTIONS . . . . . . . . . . . . . . . . . . . . . . . . . . . . . iv
FORWARD LOOKING STATEMENTS . . . . . . . . . . . . . . . . . . . . . . . . . . . . . . . . . . . . . . . . . vi
ENFORCEABILITY OF FOREIGN JUDGMENTS . . . . . . . . . . . . . . . . . . . . . . . . . . . . . . . . vii
DATA DISSEMINATION . . . . . . . . . . . . . . . . . . . . . . . . . . . . . . . . . . . . . . . . . . . . . . . . . . . viii
EXCHANGE RATE INFORMATION . . . . . . . . . . . . . . . . . . . . . . . . . . . . . . . . . . . . . . . . . . viii
SUMMARY . . . . . . . . . . . . . . . . . . . . . . . . . . . . . . . . . . . . . . . . . . . . . . . . . . . . . . . . . . . . . 1
THE OFFERING . . . . . . . . . . . . . . . . . . . . . . . . . . . . . . . . . . . . . . . . . . . . . . . . . . . . . . . . . 22
USE OF PROCEEDS . . . . . . . . . . . . . . . . . . . . . . . . . . . . . . . . . . . . . . . . . . . . . . . . . . . . . . 25
THE DEMOCRATIC SOCIALIST REPUBLIC OF SRI LANKA . . . . . . . . . . . . . . . . . . . . . . 26History, Land and People . . . . . . . . . . . . . . . . . . . . . . . . . . . . . . . . . . . . . . . . . . . . . . . . . 26Government . . . . . . . . . . . . . . . . . . . . . . . . . . . . . . . . . . . . . . . . . . . . . . . . . . . . . . . . . . . 27Conclusion of Military Action against the LTTE and Resettlement, Development andReconciliation Activities . . . . . . . . . . . . . . . . . . . . . . . . . . . . . . . . . . . . . . . . . . . . . . . . . 36International Relations . . . . . . . . . . . . . . . . . . . . . . . . . . . . . . . . . . . . . . . . . . . . . . . . . . . 39Recent Economic Indicators . . . . . . . . . . . . . . . . . . . . . . . . . . . . . . . . . . . . . . . . . . . . . . . 42Overview of the Sri Lankan Economy . . . . . . . . . . . . . . . . . . . . . . . . . . . . . . . . . . . . . . . 42Sectors of the Economy . . . . . . . . . . . . . . . . . . . . . . . . . . . . . . . . . . . . . . . . . . . . . . . . . . 53Prices, Employment and Wages . . . . . . . . . . . . . . . . . . . . . . . . . . . . . . . . . . . . . . . . . . . . 59Labor Relations . . . . . . . . . . . . . . . . . . . . . . . . . . . . . . . . . . . . . . . . . . . . . . . . . . . . . . . . 65
Balance of Payments . . . . . . . . . . . . . . . . . . . . . . . . . . . . . . . . . . . . . . . . . . . . . . . . . . . . 68
Monetary System . . . . . . . . . . . . . . . . . . . . . . . . . . . . . . . . . . . . . . . . . . . . . . . . . . . . . . . 91
Sri Lankan Financial Institutions . . . . . . . . . . . . . . . . . . . . . . . . . . . . . . . . . . . . . . . . . . . 104
Sri Lankan Securities Markets . . . . . . . . . . . . . . . . . . . . . . . . . . . . . . . . . . . . . . . . . . . . . 110
Public Finance . . . . . . . . . . . . . . . . . . . . . . . . . . . . . . . . . . . . . . . . . . . . . . . . . . . . . . . . . 113
Government Budget . . . . . . . . . . . . . . . . . . . . . . . . . . . . . . . . . . . . . . . . . . . . . . . . . . . . . 118
Debt. . . . . . . . . . . . . . . . . . . . . . . . . . . . . . . . . . . . . . . . . . . . . . . . . . . . . . . . . . . . . . . . . 121
DESCRIPTION OF THE BONDS. . . . . . . . . . . . . . . . . . . . . . . . . . . . . . . . . . . . . . . . . . . . . 135
TAXATION . . . . . . . . . . . . . . . . . . . . . . . . . . . . . . . . . . . . . . . . . . . . . . . . . . . . . . . . . . . . . 155
PLAN OF DISTRIBUTION . . . . . . . . . . . . . . . . . . . . . . . . . . . . . . . . . . . . . . . . . . . . . . . . . 158
NOTICE TO INVESTORS . . . . . . . . . . . . . . . . . . . . . . . . . . . . . . . . . . . . . . . . . . . . . . . . . . 164
LEGAL MATTERS . . . . . . . . . . . . . . . . . . . . . . . . . . . . . . . . . . . . . . . . . . . . . . . . . . . . . . . 166
PUBLIC OFFICIAL STATEMENTS AND DOCUMENTS . . . . . . . . . . . . . . . . . . . . . . . . . . . 166
GENERAL INFORMATION . . . . . . . . . . . . . . . . . . . . . . . . . . . . . . . . . . . . . . . . . . . . . . . . . 167
INDEBTEDNESS OF THE DEMOCRATIC SOCIALIST REPUBLIC OF SRI LANKA . . . . . T-1
ii
This Offering Circular has been prepared by the Issuer solely for use in connection with the Offeringdescribed in this Offering Circular. This Offering Circular is personal to each offeree and does notconstitute an offer to any other person or to the public generally to subscribe for or otherwise acquiresecurities. Distribution of this Offering Circular to any other person other than the prospectiveinvestor and any person retained to advise such prospective investor with respect to its purchase isunauthorized, and any disclosure of any of its contents, without our prior written consent, isprohibited. Each prospective investor, by accepting delivery of this Offering Circular, agrees to theforegoing and to make no copies of this Offering Circular.
For a description of some restrictions on the offer and sale of the Bonds and the distribution ofthis Offering Circular, see “Plan of Distribution” and “Notice to Investors”.
The Initial Purchasers, the Trustee (as defined herein), the Paying Agent, the Transfer Agent and theRegistrar make no representation or warranty, express or implied, as to the accuracy or completenessof the information contained in this Offering Circular. Nothing contained in this Offering Circular is,or shall be relied upon as, a promise or representation by the Initial Purchasers as to the past or future.The Issuer has furnished the information contained in this Offering Circular. The Initial Purchasers,the Trustee, the Paying Agent, the Transfer Agent and the Registrar have not independently verifiedany of the information contained herein (financial, legal or otherwise) and assume no responsibilityfor the accuracy or completeness of any such information or of any other information provided by theIssuer in connection with the Bonds in their distribution.
The Issuer, having made all reasonable inquiries, confirms that this Offering Circular contains allinformation which is material in the context of the Offering, that the information contained in thisOffering Circular is true and accurate and is not misleading in all material respects, that the opinionsand intentions expressed in this Offering Circular are honestly held, and that there are no other factsthe omission of which would make this Offering Circular or any of such information or the expressionof any such opinions or intentions misleading in any material respect. The Issuer accepts responsibilityaccordingly.
This Offering Circular is not intended to provide the basis of any credit or other evaluation and shouldnot be considered as a recommendation by the Issuer, the Initial Purchasers, the Paying Agent, theTransfer Agent and the Registrar that any recipient of this Offering Circular should purchase any ofthe Bonds. Each prospective investor contemplating purchasing the Bonds should make its ownindependent investigation of the financial condition and affairs, and its own appraisal of thecreditworthiness, of the Issuer. Prospective investors should not construe anything in this OfferingCircular as legal, business or tax advice. Each prospective investor should consult its own advisors asneeded to make its investment decision and to determine whether it is legally permitted to purchasethe securities under applicable legal investment or similar laws or regulations.
IN CONNECTION WITH THIS OFFERING, THE HONGKONG AND SHANGHAI BANKINGCORPORATION LIMITED AS STABILIZING MANAGER (THE “STABILIZING MANAGER”)(OR PERSONS ACTING FOR IT ON BEHALF OF THE INITIAL PURCHASERS) MAYOVER-ALLOT THE BONDS OR EFFECT TRANSACTIONS WITH A VIEW TO SUPPORTINGTHE MARKET PRICE OF THE BONDS AT A LEVEL HIGHER THAN THAT WHICH MIGHTOTHERWISE PREVAIL. HOWEVER, THERE IS NO ASSURANCE THAT THE STABILIZINGMANAGER, OR ITS AGENT(S), WILL UNDERTAKE STABILIZATION ACTION. ANYSTABILIZING MAY BEGIN ON OR AFTER THE DATE ON WHICH ADEQUATE PUBLICDISCLOSURE OF THE TERMS OF THE OFFER OF THE BONDS IS MADE AND, IF BEGUN,MAY BE ENDED AT ANY TIME, BUT IT MUST END NO LATER THAN THE EARLIER OF 30DAYS AFTER THE ISSUE DATE OF THE BONDS AND 60 DAYS AFTER THE DATE OF THEALLOTMENT OF THE BONDS. ANY STABILIZATION ACTION OR OVER-ALLOTMENTMUST BE CONDUCTED BY THE STABILIZING MANAGER, OR ITS AGENT, INACCORDANCE WITH ALL APPLICABLE LAWS AND RULES. SEE “PLAN OFDISTRIBUTION”.
iiii
This Offering Circular is being submitted on a confidential basis in the United States to a limitednumber of QIBs for informational use solely in connection with their consideration of a purchase ofthe Bonds. It may not be copied or reproduced in whole or in part, nor may it be distributed or anyof its contents disclosed to anyone other than the prospective investors to whom it is originallysubmitted.
Each investor or holder of interests in the Bonds will be deemed, by its acceptance or purchase of suchBonds, to have made certain representations and agreements as set out in “Notice to Investors”.
Notwithstanding anything herein to the contrary, from the commencement of discussions with respectto the transaction contemplated by this Offering Circular, all persons may disclose to any and allpersons, without limitation of any kind, the tax treatment and tax structure of the transaction describedherein and all materials of any kind (including opinions and other tax analyses) that are provided tosuch persons relating to such tax treatment and tax structure, except to the extent that any suchdisclosure could reasonably be expected to cause this transaction not to be in compliance withsecurities laws. For purposes of this paragraph, the tax treatment of this transaction is the purportedor claimed U.S. federal income tax treatment of this transaction and the tax structure of thistransaction is any fact that may be relevant to understanding the purported or claimed U.S. federalincome tax treatment of this transaction.
Neither the U.S. Securities and Exchange Commission (the “SEC”), any state securities commissionnor any other regulatory authority has approved or disapproved the securities nor have any of theforegoing authorities passed upon or endorsed the merits of the Offering or the accuracy or adequacyof this Offering Circular. Any representation to the contrary is a criminal offense. As a prospectiveinvestor, you should be aware that you may be required to bear the financial risks of this investmentfor an indefinite period of time.
This Offering Circular contains summaries believed to be accurate with respect to certain documents,but reference is made to the actual documents for complete information. All such summaries arequalified in their entirety by such reference.
The SGX-ST assumes no responsibility for the correctness of any of the statements made, opinionsexpressed or reports contained herein. Approval in-principle from, admission to the Official List of,and the listing and quotation of any Bonds on, the SGX-ST are not to be taken as an indication of themerits of the Issuer or the Bonds.
iiiiii
CERTAIN DEFINED TERMS AND CONVENTIONS
Statistical and financial information included in this Offering Circular is the latest official datapublicly available at the date of this Offering Circular. Statistical and financial data provided in thisOffering Circular may be subsequently revised in accordance with the Issuer’s on-going maintenanceof its economic data. The Issuer is under no obligation to distribute such revised data to any holderof the Issuer’s securities. As used in this Offering Circular, the term “N/A” identifies statistical orfinancial data that is not available.
All references in this Offering Circular to (a) “the country” or “Sri Lanka” are to the DemocraticSocialist Republic of Sri Lanka, (b) the “Issuer” or the “Government” are to the Government of theDemocratic Socialist Republic of Sri Lanka and (c) the “Central Bank” are to the Central Bank of SriLanka.
Article 170 of the Constitution of Sri Lanka defines a public corporation as any corporation, board orany other body which was or is established by or under any written law other than the Companies ActNo. 7 of 2007 of Sri Lanka (the “Companies Act”), with capital wholly or partly provided by theGovernment by way of grant, loan or otherwise. The Foreign Loans Act No. 29 of 1957, as amended,defines a public enterprise as any company which is registered under the Companies Act and in whichthe Government of Sri Lanka holds not less than 50% of the paid-up capital.
The fiscal year of the Issuer commences on January 1 of each year and ends on December 31 of suchyear.
Unless otherwise indicated, all references in this Offering Circular to “Sri Lanka Rupee”, “rupee”,“rupees”, “Rupee”, “Rupees” or “Rs.” are to the lawful national currency of Sri Lanka, those to“Dollar”, “Dollars”, “dollars”, “US dollar”, “US dollars” or “US$” are to the lawful currency of theUnited States of America and those to “SDR” are to Special Drawing Rights of the InternationalMonetary Fund (the “IMF”).
Unless otherwise specified herein, all gross domestic product (“GDP”), gross national product(“GNP”), gross national income (“GNI”) and related data, including growth statistics and sub-sectordata are, or are derived from, real data using a base year of 2010.
Unless otherwise specified herein, all 2015 and 2016 full-year and interim statistical and financialdata included in this Offering Circular are provisional and subject to revision in accordance with theprocedures and practices of the Central Bank or other Government entity responsible for collating andpresenting such statistical data. Additional economic data for the first three months of 2017, whichmay vary from the data presented in this Offering Circular, are expected to be released by the thirdquarter of 2017.
Prior to 2007, both the Central Bank and the Department of Census and Statistics (the “DCS”), whichis the official agency responsible for the compilation and dissemination of national income accounts,compiled and published national income statistics of the country. The methodologies and assumptionsused by the Central Bank and the DCS in the compilation of such data were not identical and, as aresult, the information published by each of them was different. In 2007, in order to avoid anyconfusion among the public, the Central Bank decided to use and publish the national income statisticscompiled by the DCS going forward. In line with this policy, the Central Bank began using andpublishing GDP estimates compiled by the DCS commencing from 2007 in its various statutory reportswhich incorporated the DCS data series from 2003 onwards. As a result, some macroeconomicinformation, including per capita income, of the country disclosed herein varies from informationpublished by the Central Bank for the period from 2003 to 2007. Further, the DCS revised the baseyear relating to national accounts to 2010. As such, economic growth data from 2011 onwards foundin this Offering Circular are presented using a base year of 2010. On November 3, 2015, Sri Lankasubscribed to the IMF’s Special Data Dissemination Standard (“SDDS”).
iviv
Inflation in Sri Lanka is currently reported as the year-on-year percentage change in the ColomboConsumer Price Index (“CCPI”), the compilation of which is based on the Household Income andExpenditure Survey (“HIES”) conducted by the Department of Census and Statistics (DCS) in 2012and 2013. Expenditure information obtained from this survey is reflected in the CCPI (2013=100).DCS released the new series of CCPI in January 2017. Until December 2016, inflation was reportedas the year-on-year percentage change in the CCPI (2006/07=100) series. Information on inflation upto 2014 are based on CCPI (2006/07=100) and from 2015 onwards are based on CCPI (2013=100).
Unless otherwise indicated, all references to gross official reserves are to gross official reservesincluding Asian Clearing Union (“ACU”) receipts.
Any discrepancies in the tables included herein between the amounts listed and the totals thereof aredue to rounding.
vv
FORWARD LOOKING STATEMENTS
Some of the statements contained in this Offering Circular under “The Democratic Socialist Republicof Sri Lanka” are forward looking. They include statements concerning, among others:
• Sri Lanka’s economic, business and political conditions and prospects;
• Sri Lanka’s financial stability;
• the ability of the Government to implement economic, political and social reforms;
• governmental, statutory, regulatory or administrative initiatives;
• changes in economic conditions in Sri Lanka;
• official and unofficial expectations and targets for key economic data, including interest rates,domestic and external debt, exchange rates, the fiscal deficit, inflation, foreign reserves, thecurrent account balance, the trade balance and GDP growth;
• the depreciation or appreciation of the Rupee;
• investments;
• natural disasters; and
• the levels of foreign direct and portfolio investment.
Actual results may differ materially from those suggested by these forward looking statements due tovarious factors. These factors include, but are not limited to:
• Adverse external factors, such as volatile international interest rates, a global recession oreconomic crisis and recession or low growth in Sri Lanka’s trading partners; high internationalinterest rates could increase Sri Lanka’s current account deficit and budgetary expenditures.
• Adverse domestic factors, such as a decline in foreign direct and portfolio investment, increasesin domestic inflation, high domestic interest rates and exchange rate volatility, each of whichcould lead to lower growth or lower international reserves.
• Changes in the credit ratings of Sri Lanka, the international prices of key commodities and thepolicies of financial institutions and development partners regarding amounts and terms offinancial assistance to Sri Lanka may also adversely affect the economic prospects andinvestment climate in Sri Lanka.
• Other adverse factors, such as climatic or seismic events and political and civil uncertainty.
vivi
ENFORCEABILITY OF FOREIGN JUDGMENTS
The Issuer will irrevocably submit to the non-exclusive jurisdiction of any New York State or Federalcourt in the Borough of Manhattan, The City of New York and the courts of the Democratic SocialistRepublic of Sri Lanka in any action arising out of or based on the Bonds brought by any holder of aBond (other than any action arising out of or based on U.S. federal or state securities laws). Theagreements entered into with respect to the issue of the Bonds are governed by the laws of the Stateof New York. See “Description of the Bonds — Governing Law and Jurisdiction” and “Description ofthe Bonds — Waiver of Immunity”.
The Sri Lankan counsels to the Issuer and the Initial Purchasers have advised as follows:
The Democratic Socialist Republic of Sri Lanka is a foreign sovereign state. Consequently, it may bedifficult for investors to obtain and enforce judgments of courts in the United States or otherjurisdictions against Sri Lanka. The Government will irrevocably waive, to the fullest extent permittedby law, any immunity, including foreign sovereign immunity, from jurisdiction with respect to SriLanka and its property to which it may otherwise be entitled in any action arising out of or based onthe Bonds brought in any New York State or Federal court in the Borough of Manhattan, The City ofNew York or in any competent court in Sri Lanka; provided, however, that the Government will notwaive its immunity with respect to (1) actions brought against the Government arising out of or basedupon U.S. Federal or state securities laws; (2) present or future “premises of the mission” as definedin the Vienna Convention on Diplomatic Relations signed in 1961; (3) “consular premises” as definedin the Vienna Convention on Consular Relations signed in 1963; (4) military property or militaryassets or property or assets of Sri Lanka related thereto; or (5) properties and assets located in SriLanka and used solely or mainly for public or governmental purposes. Because the Government hasnot waived its sovereign immunity in connection with certain actions arising out of or based on U.S.Federal or state securities laws, it will not be possible to obtain a United States judgment against SriLanka based on such laws unless a court were to determine that the Government is not entitled underthe U.S. Foreign Sovereign Immunities Act of 1976 (the “Immunities Act”) to sovereign immunitywith respect to such an action. Furthermore, under the Immunities Act, execution upon the propertyof Sri Lanka in the United States to enforce a judgment is limited to an execution upon property usedfor the commercial activity on which the claim is based. The Government has been advised by its SriLankan counsel, the Attorney General of Sri Lanka, that there can be no enforcement of any judgmentsof the United States courts in Sri Lanka as a general matter, primarily because there is no treaty orother arrangement or basis for reciprocal enforcement of judgments between Sri Lanka and the UnitedStates. Thus, any claim arising out of or based on the Bonds, including judgments arising out of orbased on the civil liability provisions of U.S. Federal or state securities laws, may be brought as anoriginal action in Sri Lanka, with any judgment of the relevant United States court, if any, being usedas evidence in such action. The Government also has been advised by its Sri Lankan counsel that thereis doubt as to the enforceability of original actions brought in Sri Lanka courts of the civil liabilityprovisions of U.S. Federal or state securities laws. Moreover, if a judgment is obtained against theGovernment in the United States or in any other jurisdiction, including Sri Lanka, such judgment maynot be enforceable in Sri Lanka. While the Issuer is subject to legal proceedings and suit in the nameof the Attorney General in Sri Lanka, under Section 462 of the Civil Procedure Code (Cap 101) of SriLanka, no writ against person or property shall be issued against the Attorney General of Sri Lankain any action brought against the State. In addition, the courts of Sri Lanka have no power to grantenjoining orders or injunctions against, or order specific performance by, the Government.
viivii
DATA DISSEMINATION
The Issuer is a subscriber to the IMF’s General Data Dissemination Standard (“GDDS”), which isdesigned to improve the timeliness and quality of information of subscribing member countries. TheGDDS requires subscribing member countries to provide schedules indicating, in advance, the date onwhich data will be released. Summary methodologies of all metadata to enhance transparency ofstatistical compilation are also provided on the internet under the Dissemination Standards BulletinBoard. The internet website for Sri Lanka’s GDDS related information and metadata is located athttp://www.imf.org/external/country/LKA/index.htm. The information contained on the website doesnot constitute a part of this Offering Circular.
EXCHANGE RATE INFORMATION
This Offering Circular contains translations of Rupee amounts into US dollar amounts solely for yourconvenience. Unless otherwise indicated, the translations have been made at the exchange ratebetween the Rupee and the US dollar on a particular date or calculated at the average of the rates ofexchange for a particular period for which data is provided, i.e. the average of the rates of exchangefor a given year or a given six-month period. See “The Democratic Socialist Republic of Sri Lanka— Monetary System — Foreign Exchange System” for historical information regarding the exchangerate between the Rupee and the US dollar. You should not construe these translations asrepresentations that the Rupee amounts actually represent such US dollar amounts or could have beenor could be converted into US dollar at the indicated or at any other rates.
viiiviii
SUMMARY
The following summary is qualified in its entirety by, and should be read in conjunction with, the moredetailed information appearing elsewhere in this Offering Circular.
The Democratic Socialist Republic of Sri Lanka
General
The recorded history of Sri Lanka (formerly known as “Ceylon”) dates back to the sixth century B.C.,when an Indian prince named Vijaya together with his followers landed on the island. From thesixteenth century, Ceylon was colonized by the Portuguese, the Dutch and the British until sheregained independence on February 4, 1948. In 1972, Ceylon became a republic and changed her nameto Sri Lanka. In 1978, a new constitution was promulgated, providing that the country shall be knownas the “Democratic Socialist Republic of Sri Lanka.”
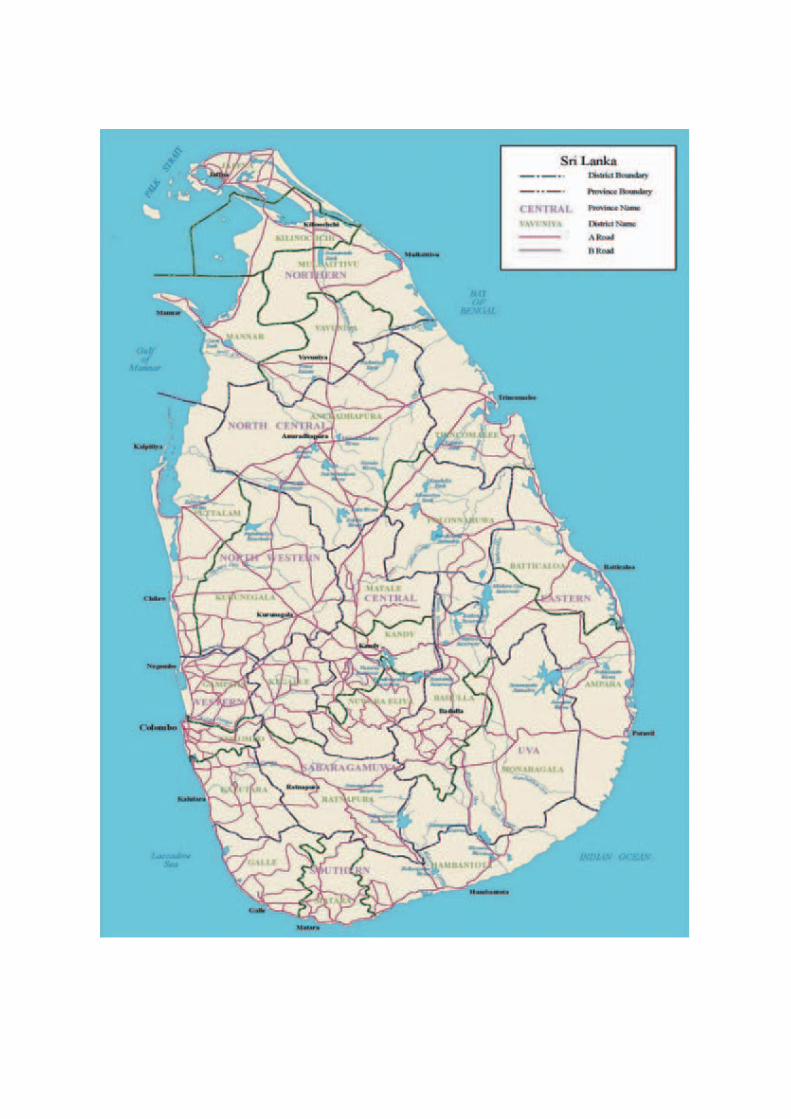
Sri Lanka is an island located 29 kilometers from the Southeastern tip of India and 645 kilometersnorth of the equator. It is located across several major maritime trading routes between Asia and theMiddle East, Europe, Africa and the Americas. Sri Lanka extends 438 kilometers from North to South,and 225 kilometers from East to West at its broadest points, occupying a territory of 65,610 squarekilometers. Sri Lanka has a marine resource base composed of 21,500 square kilometers of territorialsea and 517,400 square kilometers of Exclusive Economic Zone extending up to 200 nautical milesfrom the coastline. The geography and topography of Sri Lanka provide the basis for a richagricultural sector that was for centuries the source of a flourishing trade in coconut, coffee,cinnamon, cardamom, pepper, cloves, nutmeg and other spices, which were replaced by rubber and teain the mid-19th century. Sri Lanka’s climate is tropical, with high humidity and year-roundtemperatures averaging 27�C to 28�C.
The population of Sri Lanka was estimated to be 21.203 million in 2016. Colombo, located on SriLanka’s western coast, is the commercial capital and its largest city, with a population ofapproximately 2.395 million. Sri Lanka has a diverse ethnic composition: 74.9% of the people areSinhalese, 15.3% are Tamils, 9.3% are Sri Lankan Moors and the remaining 0.5% are of otherethnicities. In 2015, the literacy rate was 93.2%. Sinhalese and Tamil are the official languages of SriLanka and, along with English, are taught in all schools. 70.1% of the population is Buddhist, 12.6%is Hindu, 9.7% is Muslim and 7.6% is Christian (including Roman Catholic).
Government and Politics
Sri Lanka’s current constitution, which was adopted on September 7, 1978 (the “Constitution”),provides for an Executive President, a unicameral Parliament with legislative power, an independentjudiciary and fundamental rights of the people. Under the Constitution, the President of Sri Lanka isdirectly elected and acts as the Head of State, the Head of the Executive and of the Government andthe Commander-in-Chief of the armed forces. The President appoints the Prime Minister and theCabinet of Ministers, who are responsible to the Parliament.
The sixth presidential election was held on January 8, 2015. The main candidates were MahindaRajapaksa, the then-incumbent President contesting under the United People’s Freedom Alliance(“UPFA”), and Maithripala Sirisena, the former Minister of Health in Rajapaksa’s governmentcontesting as a common candidate under New Democratic Front. Sirisena was declared the winnerafter receiving 51.28% of all votes cast compared to Rajapaksa’s 47.58%, winning 12 of the 22electoral districts.
The Parliament is currently a unicameral 225-member legislature that was elected to a five-year termby universal suffrage on the basis of proportional representation. The President may from time to timesummon, suspend or end a legislative session of or dissolve the Parliament under the Constitution. TheParliament reserves the power to make all laws and to repeal or amend any provision of theConstitution. After the election of President Sirisena in January 2015, the Parliament was dissolvedon June 26, 2015. Parliamentary elections were held thereafter on August 17, 2015 (the “2015Parliamentary General Election”) and the new Parliament convened for the first time on September 1,2015.
1
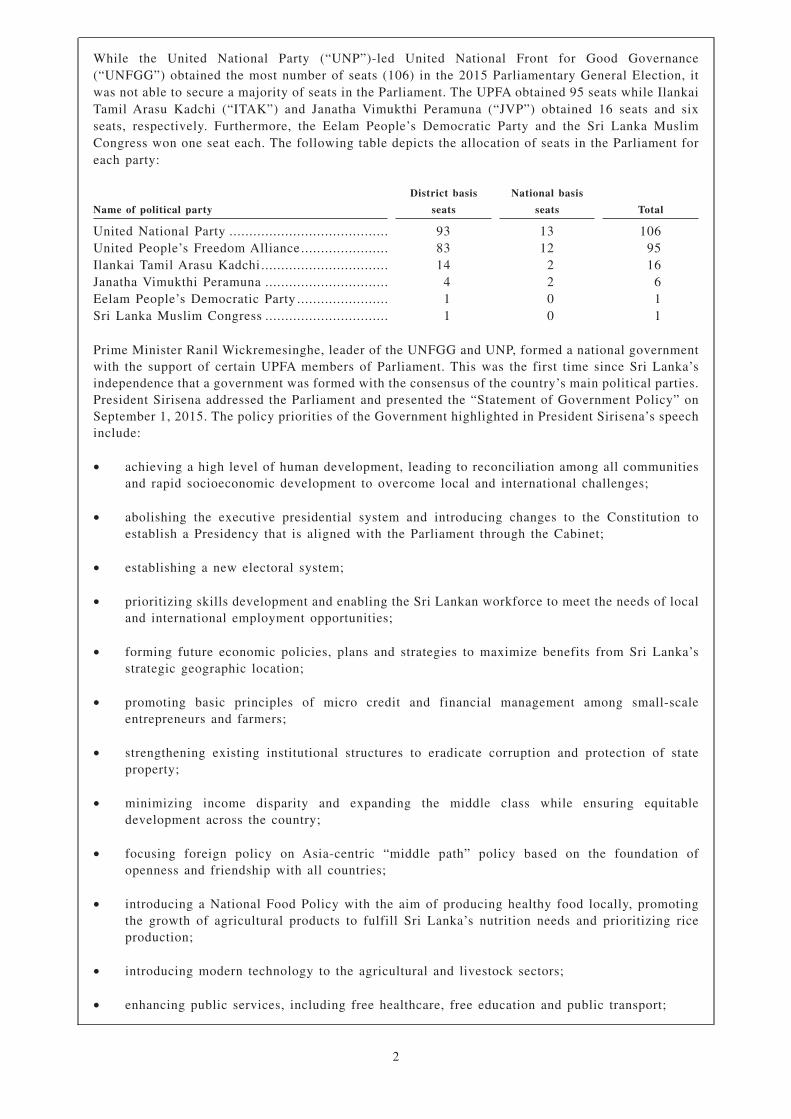
While the United National Party (“UNP”)-led United National Front for Good Governance(“UNFGG”) obtained the most number of seats (106) in the 2015 Parliamentary General Election, itwas not able to secure a majority of seats in the Parliament. The UPFA obtained 95 seats while IlankaiTamil Arasu Kadchi (“ITAK”) and Janatha Vimukthi Peramuna (“JVP”) obtained 16 seats and sixseats, respectively. Furthermore, the Eelam People’s Democratic Party and the Sri Lanka MuslimCongress won one seat each. The following table depicts the allocation of seats in the Parliament foreach party:
Name of political party
District basis
seats
National basis
seats Total
United National Party ........................................ 93 13 106United People’s Freedom Alliance...................... 83 12 95Ilankai Tamil Arasu Kadchi ................................ 14 2 16Janatha Vimukthi Peramuna ............................... 4 2 6Eelam People’s Democratic Party ....................... 1 0 1Sri Lanka Muslim Congress ............................... 1 0 1
Prime Minister Ranil Wickremesinghe, leader of the UNFGG and UNP, formed a national governmentwith the support of certain UPFA members of Parliament. This was the first time since Sri Lanka’sindependence that a government was formed with the consensus of the country’s main political parties.President Sirisena addressed the Parliament and presented the “Statement of Government Policy” onSeptember 1, 2015. The policy priorities of the Government highlighted in President Sirisena’s speechinclude:
• achieving a high level of human development, leading to reconciliation among all communitiesand rapid socioeconomic development to overcome local and international challenges;
• abolishing the executive presidential system and introducing changes to the Constitution toestablish a Presidency that is aligned with the Parliament through the Cabinet;
• establishing a new electoral system;
• prioritizing skills development and enabling the Sri Lankan workforce to meet the needs of localand international employment opportunities;
• forming future economic policies, plans and strategies to maximize benefits from Sri Lanka’sstrategic geographic location;
• promoting basic principles of micro credit and financial management among small-scaleentrepreneurs and farmers;
• strengthening existing institutional structures to eradicate corruption and protection of stateproperty;
• minimizing income disparity and expanding the middle class while ensuring equitabledevelopment across the country;
• focusing foreign policy on Asia-centric “middle path” policy based on the foundation ofopenness and friendship with all countries;
• introducing a National Food Policy with the aim of producing healthy food locally, promotingthe growth of agricultural products to fulfill Sri Lanka’s nutrition needs and prioritizing riceproduction;
• introducing modern technology to the agricultural and livestock sectors;
• enhancing public services, including free healthcare, free education and public transport;
2
• formulating a youth policy to address the current needs of Sri Lanka; and
• prioritizing the well-being of women in all development strategies and building a better futurefor and ensuring the security of children.
On May 15, 2015, the Nineteenth Amendment to the Constitution took effect and repealed theEighteenth Amendment to the Constitution with the aim of improving consultative and democraticprocesses in Sri Lanka. The Nineteenth Amendment also removed certain executive powers of thePresident, limited the Presidency to two terms in office and reduced the length of each term from sixyears to five years.
The Nineteenth Amendment also established a Constitutional Council and reintroduced manyprovisions of the Seventeenth Amendment to the Constitution, including allowing the ConstitutionalCouncil to set up independent commissions and various other measures to safeguard and promotedemocratic values in Sri Lanka. The Constitutional Council consists of ten members, including threeex-officio members — the Prime Minister, Opposition Leader and Speaker. The other members of theConstitutional Council consist of four members of the Parliament and three non-political personsrepresenting civil society. The first meeting of the Constitutional Council was held on September 10,2015.
The draft bill on the Twentieth Amendment to the Constitution is currently undergoing review by theCabinet of Ministers and Parliament. The Twentieth Amendment is expected to propose amendmentsto the existing preferential voting system for parliamentary elections and also increase the totalnumber of members of Parliament. Under the proposed amendment, members of Parliament will beelected through a first-past-the-post system, ensuring at least one member for each electorate, and adistrict-based proportional representation system, allowing continued parliamentary representation forminor political parties. In addition, some members of Parliament will be appointed from the NationalList that will be provided by Sri Lankan political parties. Notwithstanding the progress on theTwentieth Amendment, the current electoral system based on proportional representation forparliamentary elections is expected to remain in place for at least one calendar year due to technicallimitations.
Sri Lanka’s judiciary consists of a Supreme Court, a Court of Appeal and a number of subordinatecourts. The Supreme Court can determine whether a proposed bill is consistent with the Constitutionand whether a referendum must be held on a proposed bill. The Supreme Court is also the final courtof appeal for all criminal and civil cases.
Under the Thirteenth Amendment to the Constitution, significant authority was delegated to theProvincial Councils. Provincial Councils are directly elected for five-year terms and possess certainProvincial-level legislative and executive powers over education, health, rural development, tourism,social services, agriculture, public order and local taxation, subject to Government oversight. OnSeptember 8, 2012, Provincial Council elections were held for the Eastern, North Central andSabaragamuwa Provinces to elect 114 members of those three Provincial Councils. With 51% of thetotal votes and 63 seats, the UPFA won all three provinces. The UNP obtained 27.7% of the total votesand secured 29 seats. The Tamil National Alliance (the “TNA”) obtained 9.6% of the total votes andwon 11 seats while the Sri Lanka Muslim Congress won seven seats by obtaining 6.6% of the totalvotes.
On September 21, 2013, elections for 148 seats in the Northern, North Western and Central ProvincialCouncils were held. The UPFA won control over the North Western and Central Provincial Councilsby securing 34 and 36 seats, respectively, and the TNA won the Northern Provincial Council (the“NPC”) by securing 30 seats.
The establishment of the NPC in 2013 is a historical landmark in Sri Lankan political history.Approximately 20 political parties and independent groups ran for office at the Provincial Councilelections held on September 21, 2013. The elections were successfully administrated with 67% voterturnout. The success of the election, despite the Northern Province’s history as the center of SriLanka’s 26-year-long internal conflict, indicates the level of normalcy that has been restored to theregion and demonstrates the commitment of the Government to implement post-war reconciliation.
3
On March 29, 2014, elections were held for the Western and Southern Provincial Councils. The UPFAretained control over both the Western and the Southern Provincial Councils.
On September 20, 2014, elections were held in Uva Province for 34 seats in the Provincial Council.The UPFA retained control and secured 19 seats, followed by the UNP and the JVP, who secured 13seats and 2 seats, respectively.
There are also three categories of local governments: municipal, urban and rural (Pradeshiya Sabha)councils which have duties and responsibilities as conferred by law. The most recent local governmentelections were held from March to October 2011 for a total of 4,327 seats in 322 of the 335 localcouncils.
Economy
The adoption of market-oriented economic policies in 1977 and the subsequent reforms andliberalization measures undertaken by successive Governments in recent years have enhanced thelong-term growth prospects and resilience of the Sri Lankan economy. After four consecutive years of6.0% or higher growth, the growth of the Sri Lankan economy slowed in 2009 as a result of the globalfinancial and economic crisis. The economy recovered strongly in 2010, underpinned by favourabledevelopments in the domestic and external fronts. The economy grew by 9.1% in 2012, which was thecountry’s highest historically recorded growth. The economy continued to grow in 2013, 2014, 2015and 2016 at rates of 3.4%, 5.0%, 4.8% and 4.4%, respectively. Unfavourable weather conditions andsluggish global economic recovery caused the economy to grow at a slower rate in 2016 in real terms.However, the Sri Lankan economy is expected to grow at a moderate rate of around 5.0% amid theadverse impacts of unfavorable weather conditions, and is expected to improve gradually in themedium term.
Economic Growth. The principal economic activities of the Sri Lankan economy are services, industryand agriculture. In 2016, GDP grew by 4.4%, following growth of 4.8% in 2015, 5.0% in 2014 and3.4% in 2013. GNI grew by 4.1% in 2016 compared with a growth of 4.5% in 2015 and 5.1% in 2014.Per capita GDP declined slightly to US$3,835 in 2016, compared to US$3,843 in 2015, representinga marginal decrease of 0.2%, while per capita GDP in 2014 was US$3,821.
The 4.4% GDP growth rate in 2016 was supported by the services and industry activities whileagricultural activities dampened the GDP growth. Services-related activities grew by 4.2% primarilydue to significant expansion in financial services activities, supported by developments in thetransportation of goods and passengers including warehousing activities. Industry-related economicactivities grew by 6.7% primarily due to significant growth in construction and mining and quarryingactivities. Agriculture, forestry and fishing activities contracted by 4.2% mainly driven by contractionobserved in production of rice, tea, rubber and fruits as a result of adverse weather conditions thatprevailed throughout 2016.
Prices, Monetary Growth, Wages and Employment. In January 2017, inflation, as measured by theyear-on-year change in CCPI (2013=100), increased to 5.5% from 4.5% in December 2016 due toincrease in both food and non-food prices. Thereafter, inflation increased to 6.8% in February mainlydue to base effect, while the monthly increase in both food and non-food prices also contributedtowards this increase in year-on-year inflation. Inflation continued to increase in March 2017recording 7.3% amid a monthly decline. This increase in year-on-year inflation was mainly due to thelow base that prevailed in March 2016.
Nevertheless, year-on-year inflation remained in low-single digit levels in 2016. Both headline andcore inflation have remained at single-digit levels on a year-on-year basis since early 2009. Inflationdeclined to 4.5% in December 2016 from 4.6% in December 2015 on a year-on-year basis.
Average growth of broad money was 18.1% in 2016, compared to 15.2% in 2015, 13.3% in 2014,16.5% in 2013 and 20.2% in 2012. The increase from 2015 to 2016 was due to the substantialexpansion in credit to both the public and the private sectors.
4
The nominal wages of public sector employees increased by 1.7% in February 2017 on an annualaverage basis. Formal private sector wages and minimum nominal wages exhibited negligibleincreases in February 2017. Wages of informal private sector employees increased in nominal termsby 8.4% in February 2017. Real wages of informal private sector employees increased by 3.1% inFebruary 2017, while real wages of public and formal private sector employees recorded decreases of3.2% and 4.2%, respectively, in February 2017.
The nominal wages of public sector and informal private sector employees increased by 3.9% and7.9%, respectively, while average nominal wages of formal private sector employees exhibited anegligible increase in 2016. Meanwhile, real wages of informal private sector employees recordedincreases of 3.7%, while real wages in the public sector and formal private sector recorded decreasesof 0.1% and 3.6%, respectively, in 2016.
The unemployment rate was 4.4% in 2016, compared to 4.7% in 2015 and 4.3% in 2014. The decreasein the unemployment rate in 2016 was mainly due to the growth in labor force and the decline in theunemployed population, largely attributable to the increase in new employment opportunities in theeconomy. The labor force participation rate remained unchanged at 53.8% in 2016 and 2015, comparedto 53.2% in 2014.
Balance of Payments (“BOP”)
In 2014, the current account deficit narrowed, with higher inflows from trade in services, particularlyfrom tourism, and workers’ remittances offsetting the deficit in the trade account. Despite narrowingsubstantially during the first half of 2014 as a result of a growth in exports, the current account deficitwidened during the second half of 2014 as a result of increased imports. Inflows to the financialaccount, by way of foreign direct investment (“FDI”) and receipts to the Government, banking andprivate sectors, helped record a higher surplus in the BOP, resulting in an improvement in grossinternational reserves of the country.
Sri Lanka’s external sector showed a subdued performance in 2015, with lower than expected inflowsto the current and financial accounts of the BOP and higher foreign exchange outflows. Despite thelow level of net foreign inflows, the current account deficit in 2015 amounted to US$ 1.9 billion, anddeclined marginally to 2.3% of GDP. Although the merchandise trade deficit continued to widen in2015 due to the increase in non-oil imports and the slowdown in export earnings, a substantial increasewas largely avoided by lower expenditure on fuel imports due to the significant reduction ininternational oil prices and lower import volume due to less reliance on oil-based thermal power. Thedeficit in the primary income account also widened with increased interest payments during the year.However, the surpluses in the services and secondary income accounts enabled the current accountdeficit to remain almost unchanged from the previous year’s level. The financial account wasadversely affected by the decline in non-debt creating inflows, slowdown in inflows to theGovernment and gradual reversal of investments in Government securities, due to the expectation ofan, and the subsequent, increase in interest rates in the US.
In 2016, Sri Lanka’s external sector performance continued to be supressed due to factors from abroadand at home. In the global context, monetary policy normalization in the United States, subdued globaleconomic recovery, particularly in advanced economies, together with geopolitical uncertainties in theMiddle East all posed challenges for the Sri Lankan economy. Meanwhile, in the domestic front,continued demand on imports, together with subdued level of foreign investments and outflows fromthe government securities market, also adversely impacted the BOP position in 2016. As a combinedresult, the external current account deficit in 2016 increased marginally to 2.4% of GDP from 2.3%in 2015. The trade deficit expanded during the year with an increase in import expenditure,particularly with higher domestic demand for investment goods, while earnings from merchandiseexports contracted with the drop in both international commodity prices and export volumes. Thedeficit in the primary income account also widened during 2016 as a result of the decline in earningsfrom reserve assets and continued interest payments amid outflows on account of reinvested earningsand dividend payments. However, the adverse impact of the trade deficit and the primary incomeaccount deficit was mitigated to some extent by surpluses in the services account and the secondaryincome account. The surplus in the services account continued to increase, particularly with higherearnings from tourism, while the secondary income account benefitted from the moderate expansion
5
in workers’ remittances in 2016. Meanwhile, the financial account continued to experience higheroutflows while recording modest inflows by way of non-debt creating sources. In particular, lowerlevels of FDI and capital outflows arising from disinvestment of Government securities bynon-residents, together with continued debt service payments, adversely impacted the financialaccount in 2016. The lack of non-debt creating inflows to the financial account and the widening ofthe current account deficit prompted Sri Lank to seek financing from overseas, in particular throughthe issuance of an International Sovereign Bond (“ISB”) and syndicated loans. In addition, toovercome the economic challenges against the backdrop of an increasingly volatile global economicenvironment, Sri Lanka sought an Extended Fund Facility (“EFF”) from the IMF in 2016. The EFF,which is equivalent to 185.0% of the country’s current quota with the IMF, is aimed at supporting theBOP and the Government’s reform agenda.
Tourist arrivals grew by 14.0% during 2016, compared to a growth of 17.8% during 2015. As a resultof the increase in tourist arrivals, together with higher spending and increased duration of stay bytourists, earnings from tourism grew by 18.0% to US$ 3,518 million in 2016 in comparison to US$2,981 million in 2015. The top five sources of tourist arrivals were India, China, the UK, Germanyand France, which together accounted for around 51% of total tourist arrivals during 2016. Workers’remittances grew at a modest rate of 3.7% to US$ 7,242 million, as against the decline of 0.5%observed in 2015. Total FDI inflows, inclusive of foreign loans to Board of Investment (“BOI”)companies, amounted to US$ 1,079 million, while direct investments that exclude foreign borrowingsof BOI companies amounted to US$ 898 million in 2016. In comparison, total FDI inflows withforeign loans in 2015 amounted to US$ 1,160 million while the same excluding foreign loansamounted to US$ 680 million. Reflecting these developments, the overall balance recorded a deficitof US$ 500 million in 2016 in comparison to a deficit of US$ 1,489 million recorded in 2015.
On cumulative terms, tourist earnings are estimated to have increased by 3.4% to US$ 1,038 millionduring the first quarter of 2017, compared to US$ 1,003 million during the corresponding period in2016. For the first two months of 2017, workers’ remittances recorded a growth of 2.0%, with aninflow of US$ 1,140 million, compared to US$ 1,118 million during the corresponding period in 2016.
Foreign Trade. In 2016, Sri Lanka’s earnings from exports declined by 2.2% to US$ 10,310 million,while expenditure on imports increased by 2.5% to US$ 19,400 million, widening the trade deficit by8.4% to US$ 9,090 million as compared to US$8,388 million in 2015. Low commodity prices in theinternational market and modest recovery of Sri Lanka’s major export destinations mainly contributedto the decline in export earnings. Meanwhile, significant increase in expenditure on intermediate andinvestment goods imports led to the growth in imports.
In 2015, Sri Lanka’s earnings from exports declined by 5.2% year-on-year to US$ 10,546 millionwhile imports declined moderately by 2.5% to US$ 18,935 million. These results were mainly due toa slowdown in the growth of demand in Sri Lanka’s traditional export markets and lower internationalcommodity prices. In 2014, foreign trade recovered strongly, reversing the sharp contraction observedin imports in 2012 and 2013. Accordingly, earnings from exports increased by 7.1% to US$ 11,130million in 2014, compared to the 6.4% growth recorded in 2013. Meanwhile, expenditure on importsincreased by 7.9% to US$ 19,417 million in 2014, compared to the 6.2% decline recorded in 2013. Asexpenditure on imports exceeded earnings from exports, the trade deficit expanded by 8.9% toUS$8,287 million in 2014.
External Reserves. As at 2014 year-end, Sri Lanka’s gross official reserves were at US$ 8.2 billionand total foreign assets amounted to US$ 9.9 billion. In terms of months of imports, gross officialreserves were equivalent to 5.1 months of imports as at 2014 year-end, while total foreign assets wereequivalent to 6.1 months of imports. Compared to gross official reserves of US$ 7.5 billion as at 2013year-end, an improvement was achieved during 2014 despite outflows due to foreign currency debtservice payments totaling US$ 2.9 billion (including the SBA Facility repayments to the IMF totalingUS$ 719 million) and valuation changes stemming from a decline in the price of gold.
6
As at 2015 year-end, Sri Lanka’s gross official reserve asset position amounted to US$ 7.3 billion. Asat 2014 year-end, the level of gross official reserves stood at US$ 8.2 billion. During 2015, grossofficial reserves were drained, mainly due to the scheduled foreign currency debt service payments,the settlement of the matured ISBs, payments to the IMF on account of the Stand-By Arrangement(“SBA”) and supply of liquidity to the domestic foreign exchange market. In terms of adequacy ofgross official reserves, the level of gross official reserves as at 2015 year-end was equivalent to 4.6months of imports, which is above the internationally accepted benchmark of 3.0 months of imports.
Sri Lanka’s gross official reserve assets position declined as at 2016 year-end to US$ 6.0 billion fromUS$ 7.3 billion recorded at end of 2015. The gross official reserve assets as at 2016 year-end wasequivalent to 3.7 months of imports of goods and 3.1 months of imports of goods and services. Thedecline in gross official reserves was mainly due to the foreign currency debt service payments,settlement of a portion of the foreign currency swap arrangement, repayments of the IMF SBA and thesupply of liquidity to the domestic foreign exchange market through the Central Bank’s intervention.The total foreign assets, which comprise gross official reserves and foreign assets of deposit takingcorporations, declined to US$ 8.4 billion at end 2016, from US$ 9.3 billion as at 2015 year-end. Totalforeign assets were equivalent to 5.2 months of imports of goods and 4.3 months of imports of goodsand services. Gross official reserves as at March 31, 2017 are estimated to be approximately US$ 5.1billion.
Securities Market. There were two new listings (“IPOs”) on the Colombo Stock Exchange in 2015,through which Rs. 0.3 billion was raised, as well as 15 rights issues, through which Rs. 16.2 billionwas raised. During 2016, there were three new IPOs, through which Rs. 1.9 billion was raised and sixrights issues, through which Rs. 2.5 billion was raised. The number of companies listed on the CSEincreased by five in 2014 to 294 by the end of 2014 and remained unchanged during 2015 andincreased by one in 2016 to 295. Meanwhile, the cumulative net foreign inflow to the CSE throughthe secondary market amounted to US$ 80.4 million up to April 19, 2017 as compared to US$ 1.7million in 2016, the net outflow of US$ 32.3 million in 2015 and the net secondary inflow of US$169.0 million in 2014. The CSE currently has 12 members who are licensed to operate as stockbrokersand 8 debt trading members. As at April 19, 2017, the companies listed on the CSE represented 20business sectors and had a total market capitalization of Rs. 2,837.5 billion (US$ 18.7 billion),compared to Rs. 2,745.4 billion (US$ 18.3 billion) as at 2016 year-end.
During 2015, there were 25 corporate debentures issued by 23 corporations amounting to Rs. 83.4billion. During 2016, there were 17 corporate debenture listings by 14 corporations, amounting to Rs.78.0 billion. During the first three months of 2017, there was one debenture listing amounting to Rs.8.0 billion.
Foreign Exchange. The Government accepted Article VIII IMF status in 1994 and adopted anindependently floating exchange rate system in January 2001.
Sri Lanka’s exchange rate policy in 2014 focused on reducing short-term volatility to promote stabilityin the foreign exchange market. The rupee appreciated against the US dollar by 0.29% during the firstthree quarters of the year. However, as import demand increased and Government securities marketrecorded net outflows in the last quarter of 2014, the rupee depreciated by 0.47% against the USdollar, resulting in an overall depreciation of 0.23% in 2014.
The lower than expected foreign exchange inflows, coupled with high levels of outflows, exertedsignificant pressure on the exchange rate during 2015. This was mainly due to the reversal of foreigninvestments in the Government rupee securities market, in anticipation of a, and the subsequent, hikein interest rates in the US, and the high level of demand for foreign exchange, due to the increasedexpenditure in non-oil imports and foreign debt service payments. The resultant persistentdepreciation pressure on the rupee against the US dollar necessitated the continuous intervention ofthe Central Bank in the domestic foreign exchange market, in order to reduce volatility. Supported bythe supply of US$ 1.9 billion by the Central Bank, on a net basis, the rupee recorded a marginaldepreciation of 2.42% against the US dollar, during the first eight months of the year. However, onSeptember 3, 2015, the Central Bank decided to limit its intervention in the domestic foreign exchangemarket and allowed the exchange rate to be largely determined by the demand and supply conditions
7
of the market. This resulted in the rupee depreciating by 6.64% against the US dollar, during theperiod from September 4, 2015 to December 31, 2015. Overall, the rupee depreciated against the USdollar by 9.03% to Rs. 144.06 as at December 31, 2015. The annual average exchange rate of the rupeeagainst the US dollar also depreciated to Rs. 135.94 in 2015 from Rs. 130.56 in 2014.
In 2016, the rupee depreciated by 3.83% against the US dollar from Rs. 144.06 as at 2015 year-endto Rs. 149.8 as at 2016 year-end. The relatively low depreciation of the rupee in the first half of 2016was supported by supply of foreign exchange liquidity by the Central Bank amounting to US$ 1,093million on a net basis. Subsequently, the rupee depreciated at a higher rate with the curtailment inintervention by the Central Bank with a net absorption of US$ 325 million during the second half ofthe year. A substantial amount of the foreign exchange supplied during the second half was to partiallyease the pressure arising due to the disinvestment by non-resident investors in the Governmentsecurities market, particularly during the last quarter of 2016. This outflow from the Governmentsecurities market was driven by the expectation and the subsequent increase in interest rates by theUS Federal Reserve Bank.
In 2016, the rupee depreciated against all major currencies except the pound sterling, whichdepreciated substantially following the Brexit vote on June 23, 2016. Accordingly, reflecting themovements in the cross currency exchange rates against the US dollar in international markets, therupee depreciated against the euro by 0.32%, the Indian rupee by 1.72%, the Japanese yen by 7.05%,while appreciating against the pound sterling by 16.04%. Consequently, the rupee also depreciatedagainst the Special Drawing Rights (“SDR”) by 0.87% during 2016.
In its announcement of the “Road Map: Monetary and Financial Sector Policies for 2017 and Beyond”,the Central Bank announced its exchange rate policy to reflect market based movements by aligningthe exchange rate with the Real Effective Exchange Rate (“REER”) indices. Accordingly, theexchange rate policy would entail the REER to be maintained at around 100 index points to ensureexternal competitiveness of the country. Furthermore, Central Bank intervention in the form ofsupplying of liquidity to the domestic foreign exchange market would be curtailed only to addressundue volatilities in the exchange rate. Meanwhile the Central Bank has purchased over US$ 300million from the beginning of March up to mid-April 2017. By the end of March 2017, the rupeefurther depreciated by 1.3% against the US dollar from Rs. 149.8 as at 2016 year-end to Rs.151.7 asat March 31, 2017.
Interest Rates. Yields on Treasury bills in the primary market decreased during 2014, indicatingenhanced demand for Government securities and moderating inflation expectation in the country. In2014, the weighted average yield rates of 91-day, 182-day and 364-day Treasury bills decreased by180 basis points, 201 basis points and 228 basis points to 5.74%, 5.84% and 6.01%, respectively,compared to the yield rates at the end of 2013. Yield rates on Treasury bonds in the primary marketwere in the range of 8.65% on 5-year bonds to 11.75% on 30-year bonds. The declining primary marketyield rates was reflected across secondary market yield rates for Treasury bills and across the termstructure of interest rates, including that of medium to long term Treasury bonds. A substantial foreigndemand for Treasury bills and bonds also contributed to this development.
In line with the declining inflation, the Standing Lending Facility Rate (“SLFR” or “Reverse RepoRate”) was reduced in January 2014 by 50 basis points. Furthermore, improved foreign net inflows,as a result of higher remittances and positive developments in imports and exports, have left thedomestic banks with substantial foreign currency liquidity. All of these factors contributed to positiveliquidity conditions, resulting in the decline of both Treasury bills and bonds yields in 2014. Othermarket rates also declined significantly in 2014, particularly during the latter part of the year. Thisresult was supported by the Central Bank’s decision to limit access to the Standing Deposit Facility(“SDF”) by an Open Market Operation (“OMO”) participant, a decision intended to encourage banksto utilize excess liquidity to increase credit flows to the private sector.
8
Benefiting from relatively relaxed monetary conditions, market interest rates remained low during2015 although certain upward movements in interest rates were witnessed intermittently. With theremoval of restrictions placed on the access to SDF in March 2015, overnight interest rates, which hadremained below the standing deposit facility rate (the “SDFR” or “Repo Rate”), moved upwards andsettled within the policy rate corridor close to the lower bound. At the same time, a large increase incertain interest rates, particularly yields on Government securities, was observed in the aftermath ofthe removal of restrictions placed on the SDF. Accordingly, the yields of 91-day and 364-day Treasurybills peaked at 7.10% and 7.37%, respectively, reflecting an increase of 136 basis points and 137 basispoints, respectively, for each tenor during the year up to March 11, 2015, while the yield of 182-dayTreasury bills also increased by 147 basis points to 7.31%. In April 2015, to address concerns on themovement of market interest rates that was inconsistent with inflation, and to maintain greaterstability in interest rates while providing the necessary impetus to economic activity throughinvestments, the Central Bank reduced each of the SDFR and the SLFR by 50 basis points to 6.00%and 7.50%, respectively. The upward trend in interest rates was dampened by the reduction in policyrates of the Central Bank in April 2015. However, with the decline in market liquidity levels, a gradualupward adjustment in overnight interest rates was observed since August 2015. Meanwhile, retailinterest rates broadly remained low during 2015, although some increase was witnessed towards theend of the year. With the Central Bank’s decision to raise Statutory Reserve Ratio (“SRR”) with effectfrom January 2016 and the increase in policy interest rates in February 2016, market interest ratesincreased further in the first quarter of 2016.
Yield rates on Government securities in the primary market recorded an increase during 2015. Yieldrates pertaining to Treasury bills in the primary market, which had remained below the SDFR in thepreceding months, increased significantly by March 2015 with the removal of restrictions placed onthe SDF by the Central Bank. This increase also reflected the market anticipation of high domesticfunding requirement of the Government amid delays in foreign financial inflows as well as the CentralBank’s decision to issue Government securities only through public auctions. However, the yield ratesdeclined to a certain extent during the period between April 2015 to June 2015 in response to thereduction of policy rates of the Central Bank, but moved upwards thereafter. Accordingly, by the endof 2015, the 91-day, 182-day and 364-day Treasury bill yields increased by 71 basis points, 99 basispoints and 129 basis points to 6.45%, 6.83% and 7.30%, respectively, compared to the yields thatprevailed at the end of 2014. Treasury bonds with maturity periods of 30 years and 20 years wereissued in the primary market during February and March 2015 at yield rates of 11.73% and 11.20%,respectively, followed by issuances of Treasury bonds of various tenors throughout 2015. Overall, theyield rates on Treasury bonds in the primary market were in the range of 6.70% on 2-year Treasurybonds to 11.73% on 30-year Treasury bonds in 2015.
The upward pressure on the yield rates on Government securities continued in 2016 although somemoderation was observed in the second half of the year. Accordingly, by 2016 year-end, the 91-day,182-day and 364-day Treasury bill yields were at 8.72%, 9.63% and 10.17%, respectively, comparedto the yields that prevailed at 2015 year-end. Following the similar trend, yields on 5-year Treasurybonds increased to 11.76% by year-end 2016, compared to 9.79% at year-end 2015. During the sameperiod, yields on 10-year Treasury bonds increased to12.11% from 10.94%.
Public Finance. During the year 2016, the Government’s total revenue and grants amounted to Rs.1,693.6 billion (US$ 11.3 billion), while total expenditure and net lending amounted to Rs. 2,333.9billion (US$ 16.0 billion). The overall fiscal deficit which was Rs. 640.3 billion (US$ 4.3 billion),which registered to be 5.4% of GDP for the year 2016. Total net domestic financing was Rs. 248.4billion (US$ 1.7 billion), while net foreign financing was Rs. 391.9 billion (US$ 2.7 billion) in 2016.
The Government achieved its key fiscal targets for 2016 by reducing the budget deficit to 5.4% ofGDP as a result of enhanced revenue collection combined with reduction in total governmentexpenditure as a percentage of GDP. According to the Budget 2016, which was presented to Parliamentin November 2015, the overall budget deficit was expected to be reduced to 5.9% of GDP in 2016 from7.6% of GDP recorded in 2015. Considering subsequent developments, in March 2016 the Governmenthighlighted its commitment to further reduce the budget deficit to 5.4% of GDP in 2016. The revenueto GDP ratio increased for the second consecutive year in 2016, mainly due to the significantexpansion in non-tax revenue, driven by the profit and dividend transfers by the SOBEs, combined
9
with the increase in tax revenue, which benefited as a result of the measures taken on the taxation frontthat include: (a) broadening the tax base to ensure a tax revenue of around 15-16% of GDP in themedium term, (b) rationalizing the tax system while minimizing tax exemptions, tax holidays, andspecial tax rates that are detrimental to fair and effective tax administration, (c) augmenting capacityfor revenue administration and (d) strengthening public financial management, particularlycommitment control, and financial planning and discipline. These steps are expected to furtherimprove tax compliance and ultimately strengthen fiscal consolidation.
During 2016, a number of measures were implemented by the Government to rationalize expenditures.Accordingly, the Government established the Welfare Benefits Board to develop and implement acoherent system of welfare benefit scheme, as the rationalization of various social welfare programsis essential to achieve the envisaged fiscal targets. In addition, the fertilizer subsidy scheme was alsorevised with the provision of a cash grant in place of the provision of fertilizer. Further, a commitmentrecording system has been established at the Ministry of Finance (“MOF”), which helps to trackspending commitments for each line ministry on a monthly basis. In addition, in December 2016,Phase I of the Integrated Treasury Management Information System (“ITMIS”), the budget planningmodule, was rolled out to all ministries. Meanwhile, in March 2017, Statements of Corporate Intentswere signed for the five largest SOBEs to enhance oversight and financial discipline of SOBEs,thereby improving their performance.
In 2015, total revenue and grants was Rs. 1,460.9 billion (US$ 10.7 billion) and total expenditure andnet lending was Rs. 2,290.4 billion (US$ 16.8 billion). The overall fiscal deficit which was Rs. 829.5billion (US$ 6.1 billion) recorded 7.6% of GDP in 2015. Total net domestic financing was Rs.592.7billion (US$ 4.4 billion), while net foreign financing was Rs. 236.8 billion (US$ 1.7 billion) for theyear 2015.
In 2014, total revenue and grants was Rs. 1,204.6 billion (US$ 9.2 billion) and total expenditure andnet lending was Rs. 1,795.9 billion (US$ 13.8 billion). The overall fiscal deficit was 5.7% of GDP in2014. The budget deficit was Rs. 591.2 billion (US$ 4.5 billion). Total net domestic financing was Rs.378.7 billion (US$ 2.9 billion) while net foreign financing was Rs. 212.5 billion (US$ 1.6 billion).
External Indebtedness. The Government has a 60-year history of honoring its external debt serviceobligations. The outstanding position of foreign loans of the Government accounted for approximately58.4% of total external foreign loan liabilities of Sri Lanka as at 2016 year-end. The total external debtof the Government amounted to US$ 27.2 billion as at 2016 year-end, compared to US$ 24.7 billionas at 2015 year-end. This increase was primarily due to the issuance of international sovereign bondsof US$ 1.5 billion and the net inflow from project loans of US$ 1.1 billion during 2016. These loaninflows included US$ 700 million as foreign term financing facilities and US$ 185 million ofdevelopment policy loans.
Social Indicators. In terms of key social indicators such as adult literacy, life expectancy at birth andinfant mortality and maternal mortality, Sri Lanka ranks above many developing countries and is onpar with many developed countries, mainly due to the free health care and free education services andother welfare programs implemented by successive governments since Sri Lanka’s independence. In2015, the average adult literacy rate was 93.2%. According to United Nations Development Program’sHuman Development Report 2016, in 2015, the average life expectancy at birth was 75.0 years, andinfant mortality was 8.4 per 1,000 live births in Sri Lanka. Further, maternal mortality was 30 per100,000 live births, including maternal deaths due to indirect causes. Sri Lanka’s Human DevelopmentIndex of 0.766 ranked it at 73 among 188 countries.
Sovereign Rating. On February 27, 2009, Fitch Ratings (“Fitch”) revised its credit rating outlook forthe country’s long term foreign and local currency Issuer Default Ratings to “negative” from “stable,”citing the “heightened concern regarding the sovereign’s external financial position in light of themarked decline in official foreign exchange reserves.” Fitch revised Sri Lanka’s sovereign ratingoutlook to “stable” from “negative”, to reflect the country’s positive changes in sovereign creditfundamentals on October 9, 2009. The agency has affirmed the long-term foreign and local currencyIssuer Default Ratings and the Country Ceiling at “B+” and the short-term Issuer Default Rating at“B,” citing “the positive changes in sovereign credit fundamentals following the end of the 26-yearinternal conflict, the approval of the SBA Facility and the return of private capital inflows.” On
10
September 21, 2010, Fitch again revised the outlook to “positive” from “stable.” On July 18, 2011,Fitch upgraded Sri Lanka’s long-term foreign and local currency Issuer Default Rating to “BB-” from“B+”, with a stable outlook and affirmed Sri Lanka’s short-term Issuer Default Rating at “B.” Therating agency has also upgraded the Country Ceiling to “BB-.” In Fitch’s view, the outlook revisionreflects of Sri Lanka’s economic benefits from the end of the internal conflict and further benefitsfrom the disciplined policy framework put in place under the SBA Facility and from the improvedexternal liquidity position bolstered by the IMF program. On May 4, 2012, Fitch affirmed its existingrating. In April 2013, having observed the country’s growth performance, level of human developmentand payment record against weakness of fiscal and external balance sheet and moderate domesticsavings relative to investment needs, Fitch affirmed Sri Lanka at “BB-”, with a stable outlook. On May12, 2014, Fitch affirmed its existing rating of “BB-” and the stable outlook of the Sri Lankan economy.On April 22, 2015, Fitch reaffirmed its existing rating of “BB-” with a stable outlook, citing SriLanka’s smooth political transition following the presidential elections, reinforcing perceptions of afunctioning democracy with relatively strong institutions. On February 29, 2016, Fitch revised SriLanka’s existing rating of “BB-” to “B+”, and revised Sri Lanka’s sovereign rating outlook to“negative” from “stable”, citing “Sri Lanka’s heightened vulnerabilities, due to deterioration in theexternal position, continued fiscal slippages, and loss of policy coherence and credibility”. OnFebruary 9, 2017, Fitch confirmed Sri Lanka’s rating at “B+” and revised the outlook from “negative”to “stable” considering the continuous improvement in its fiscal performance, improved policycoherence and credibility with the on-going IMF-EFF programme and stable growth in the economy.
Standard & Poor’s Ratings Services (“S&P”), on August 25, 2009, revised its sovereign rating outlookback to “stable” due to Sri Lanka’s improved external liquidity position in light of the SBA Facility.On October 15, 2009, S&P further revised its sovereign rating outlook to “positive,” citing the“continued strengthening of Sri Lanka’s BOP position, and S&P’s expectation that the SBA Facilitywill be pursued to its conclusion, engendering modest improvement in public finances.” Accordingly,S&P affirmed its “B” long-term foreign currency credit rating and “B+” long-term local currencysovereign credit rating on Sri Lanka. They also affirmed the “B” short-term ratings on the sovereign.On September 15, 2010, S&P raised its long-term foreign currency sovereign credit rating on SriLanka to “B+” from “B,” and the long-term local currency rating to “BB-” from “B+” taking intoaccount the continued strengthening of Sri Lanka’s BOP position and the expected sustainable declinein fiscal deficits and public debt under the Government’s planned revenue reforms. On July 19, 2011,S&P raised its outlook on Sri Lanka’s long-term foreign currency sovereign credit rating to “positive”from “stable” based on improved external liquidity, progress in addressing structural fiscalweaknesses and the Government’s inflation management efforts. On February 29, 2012, S&P changedits outlook on Sri Lanka’s long-term foreign currency sovereign credit rating to “stable” from“positive” while affirming its “B+” rating and lowering its long-term local currency sovereign creditrating to “B+” from “BB-.” On August 1, 2013, S&P affirmed its “B+” long-term sovereign creditratings with a stable outlook. S&P expects that Sri Lanka’s gross international reserves will remainat a similar level to that in 2012, at three months’ coverage of current account receipts. The stableoutlook reflects S&P’s view that the country has strong prospects for per capita real GDP growth overthe next few years and the improvement of the Government’s fiscal profile. On July 8, 2014, S&Pagain affirmed its “B+” long-term and “B” short-term sovereign credit ratings. On August 6, 2015,S&P affirmed its “B+” long-term and “B” short-term sovereign credit ratings for Sri Lanka with astable outlook. S&P’s transfer and convertibility risk assessment remained unchanged at “B+”. S&Pcited Sri Lanka’s strong economic growth outlook, moderate external imbalances and adequatemonetary flexibility dampened by weak fiscal indicators and institutional constraints. On March 26,2016, S&P affirmed its “B+” long-term and “B” short-term sovereign credit ratings, but changed itsoutlook on Sri Lanka’s long-term foreign currency sovereign credit rating to “negative” from “stable”.S&P attributed the latest move to rising pressures on Sri Lanka’s external liquidity position, stemmingfrom a weaker than expected trade balance and falling remittances. On March 7, 2017, S&P affirmedits current ratings and outlook.
11
In addition, Moody’s Investors Service (“Moody’s”) has assigned a “B1” foreign currency issuerrating to the Government of Sri Lanka. The outlook was revised from “stable” to “positive” on July18, 2011. The agency has considered the end of the internal conflict and the structural improvementin the country’s economic prospects and stability in making the rating decision. In July 2013, Moody’schanged its outlook on Sri Lanka’s “B1” foreign currency sovereign rating from positive to stable andaffirmed its “B1” foreign currency government bond rating citing the stabilization in the externalpayments position, the sizable loss of foreign reserves in 2011 and the pause in the decline in theGovernment’s high debt burden as large on-going deficits impede a positive credit reduction. On June20, 2016, Moody’s affirmed its “B1” foreign currency issuer and senior unsecured sovereign ratingsto the Government of Sri Lanka, while changing its outlook to “negative” from “stable”. Moody’slatest rating change was underpinned by the expectation of a further weakening in certain of SriLanka’s fiscal metrics in an environment of subdued GDP growth which could lead to renewed BOPpressure and the possibility that the effectiveness of the fiscal reforms as envisaged by theGovernment may be lower than currently expected, which could further weaken Sri Lanka’s fiscal andeconomic performance.
Recent Developments
Conclusion of Military Action against the LTTE and Resettlement, Development and ReconciliationActivities
For nearly three decades, the Liberation Tigers of Tamil Eelam (the “LTTE”) engaged in a violentstruggle against Government forces. In May 2009, after a series of successful operations, the militarydefeated LTTE forces. The defeat of the LTTE and conclusion of hostilities is one of the mostsignificant events in the country’s history. Since regaining control over the Eastern and NorthernProvinces, the Government has conducted activities to resettle civilians displaced by the conflict(“internally displaced people” or “IDPs”). The Government’s resettlement program successfullyconcluded in 2013, with the resettlement of approximately 300,000 IDPs from the Northern andEastern Provinces. The demining process targeted public places, farm lands, schools, and hospitals andwas accelerated with the help of development partners as well as domestic and internationalnon-governmental organizations. As at September 30, 2015, the demining process was 99% completewith only 64 square kilometers to be cleared, demonstrating a substantial improvement in comparisonto the approximately 6,215 square kilometers of land from the end of the war. As per the HononaryPrime Minister’s economic statement presented to the Parliament on October 27, 2016, theGovernment expects to give high priority for reconstruction of housing and civic infrastructure withinthe previously war-affected areas around Jaffna, Mullaitivu and Kilinochchi districts. Further, theGovernment has proposed new development corridors with two key economic zones (the SouthwestEconomic Zone and the Northeast Economic Zone), which are expected to support an economicresurgence and provide prosperity to across the population. The Southwest Economic zone will coverthe Western, Southern, Central, Sabaragamuwa and Wayamba provinces, while the NortheastEconomic zone will cover the Northern, North Central and Eastern provinces. The UpcountrySecondary Corridor is expected to serve Nuwara Eliya and Badulla Districts via the Kandy-ColomboExpressway and the Southern Expressway through Mattala, connecting the hill country regions as asecondary economic corridor.
The Government has accelerated development activities in the Eastern and Northern Provinces throughits Neganahira Navodaya (Eastern Resurgence) and Uthuru Wasanthaya (Northern Spring)development programs. These programs are aimed at restoring and developing these regions throughthe establishment of critical infrastructure for the provision of drinking water, electricity, educationand healthcare, as well as by developing the regional economies, especially in the agricultural andservices sectors. The Government’s investments in the Eastern Province have facilitated theresettlement of internally displaced people and contributed to increased economic activity.
With respect to the Northern Province, the Government has spent Rs. 167 billion (US$ 1.3 billion)towards rehabilitation and development activities from 2009 to 2012. Furthermore, the Governmentearmarked Rs.49.4 billion (US$ 383 million) in 2013 for reconstruction, rehabilitation and deminingactivities in the Northern Province, for continuing the development, construction and rehabilitation ofroads and other transportation infrastructure and for electricity, housing, water supply, agriculture,
12
irrigation, manufacturing and livelihood development. The rehabilitation and reconstruction processwas implemented concurrently with the de-mining and re-settlement activities that were being carriedout in the region and is expected to yield positive social and economic results in the coming years.
The Government expects the end of the 26-year long internal conflict to have a significant positiveeconomic impact not only on the Northern and Eastern Provinces but also on the entire country asthese two regions integrate with the national economy. The Northern and Eastern Provinces possesssubstantial natural resources such as long, scenic and clean beaches and ecological conservation areasthat can support a vibrant tourism industry. The modernization of existing croplands, livestock farmsand fisheries is also expected to help boost the regional economy. The contribution to Sri Lanka’s GDPby the Eastern Province increased to 6.0% in 2015 from 5.8% in 2009, while the Northern Province’scontribution increased to 3.5% in 2015 from 3.2% in 2009.
See “The Democratic Socialist Republic of Sri Lanka — Conclusion of Military Action against theLTTE and Resettlement, Development and Reconciliation Activities”.
On March 27, 2014, the UN Human Rights Council (“UNHRC”) passed a resolution calling for a probeinto the final stages of the LTTE conflict. Subsequently, after pledging to conduct a domestic inquiryinto allegations by the UNHRC of war crimes on both sides in the final stages of the conflict, the newGovernment under President Sirisena achieved a six-month deferral of the UNHRC report against SriLanka that had been due on March 25, 2015.
The Government is currently exploring steps to examine alleged incidents of serious violations ofhuman rights that warrant further investigations and criminal justice responses. The Government hasinitiated discussions regarding mechanisms to be introduced for this purpose. Currently, these arebeing discussed in Parliament.
Furthermore, based upon recommendations made in the interim report submitted to President Sirisenaby the Presidential Commission to Investigate into Complaints regarding Missing Persons(“PCICMP”), four teams will be appointed to investigate complaints recorded by the PCICMP. In themeantime, to expedite the reconciliation process, the Government is also reviewing the list ofindividuals and entities representing the Tamil diaspora that were banned by the previous government.The Government has also incorporated the right to information into the Constitution as part of theNineteenth Amendment to safeguard the basic rights of the Sri Lankan people and democracy in SriLanka. The Right to information Act No. 12 of 2016 has been passed by the Parliament and a copyof the said Act is publicly available. The said Act has been effective from February 3, 2017.
The Government’s Relationship with the IMF
To overcome the economic challenges against the backdrop of an increasingly volatile globaleconomic environment, Sri Lanka sought an EFF from the IMF in 2016. On June 3, 2016, theExecutive Board of the IMF approved a three-year EFF of SDR1.1 billion (approximately US$ 1.5billion) for Sri Lanka to support its BOP position and in support of the Government’s economic reformagenda. This amount is equivalent to 185% of Sri Lanka’s current quota with the IMF. The first trancheunder the EFF, amounting to SDR 119.894 million (approximately US$ 169 million), was madeavailable to Sri Lanka in June 2016 and a similar amount was made available as the second tranchein November 2016 upon the successful completion of IMF’s review of the first programme. After theIMF staff visit during February-March 2017 and a series of constructive discussions between theGovernment and the IMF, a staff level agreement was reached on May 3, 2017 for the completion ofthe second review. Although net international reserves fell short of the target and progress onimplementing structural benchmarks was rather uneven with some of the reforms lagging behindintended timelines, the review mission of the IMF commended the authorities for their strong effortsin implementing the IMF-supported economic reform program with all fiscal quantitative targetsthrough end-December having been met. The Net International Reserves (“NIR”) target was missedentirely due to the outflows from Government securities market with the improved investor climate
13
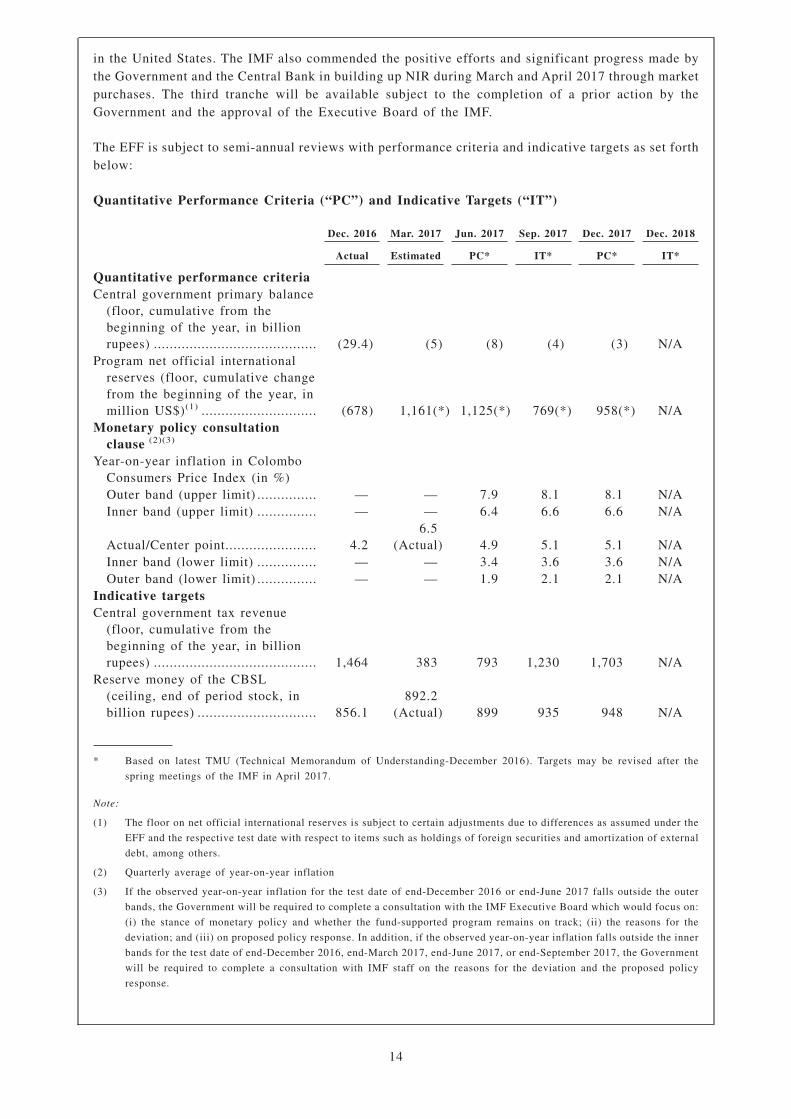
in the United States. The IMF also commended the positive efforts and significant progress made bythe Government and the Central Bank in building up NIR during March and April 2017 through marketpurchases. The third tranche will be available subject to the completion of a prior action by theGovernment and the approval of the Executive Board of the IMF.
The EFF is subject to semi-annual reviews with performance criteria and indicative targets as set forthbelow:
Quantitative Performance Criteria (“PC”) and Indicative Targets (“IT”)
Dec. 2016 Mar. 2017 Jun. 2017 Sep. 2017 Dec. 2017 Dec. 2018
Actual Estimated PC* IT* PC* IT*
Quantitative performance criteriaCentral government primary balance
(floor, cumulative from thebeginning of the year, in billionrupees) ......................................... (29.4) (5) (8) (4) (3) N/A
Program net official internationalreserves (floor, cumulative changefrom the beginning of the year, inmillion US$)(1) ............................. (678) 1,161(*) 1,125(*) 769(*) 958(*) N/A
Monetary policy consultationclause (2)(3)
Year-on-year inflation in ColomboConsumers Price Index (in %)Outer band (upper limit) ............... — — 7.9 8.1 8.1 N/AInner band (upper limit) ............... — — 6.4 6.6 6.6 N/A
Actual/Center point....................... 4.26.5
(Actual) 4.9 5.1 5.1 N/AInner band (lower limit) ............... — — 3.4 3.6 3.6 N/AOuter band (lower limit) ............... — — 1.9 2.1 2.1 N/A
Indicative targetsCentral government tax revenue
(floor, cumulative from thebeginning of the year, in billionrupees) ......................................... 1,464 383 793 1,230 1,703 N/A
Reserve money of the CBSL(ceiling, end of period stock, inbillion rupees) .............................. 856.1
892.2(Actual) 899 935 948 N/A
* Based on latest TMU (Technical Memorandum of Understanding-December 2016). Targets may be revised after the
spring meetings of the IMF in April 2017.
Note:
(1) The floor on net official international reserves is subject to certain adjustments due to differences as assumed under the
EFF and the respective test date with respect to items such as holdings of foreign securities and amortization of external
debt, among others.
(2) Quarterly average of year-on-year inflation
(3) If the observed year-on-year inflation for the test date of end-December 2016 or end-June 2017 falls outside the outer
bands, the Government will be required to complete a consultation with the IMF Executive Board which would focus on:
(i) the stance of monetary policy and whether the fund-supported program remains on track; (ii) the reasons for the
deviation; and (iii) on proposed policy response. In addition, if the observed year-on-year inflation falls outside the inner
bands for the test date of end-December 2016, end-March 2017, end-June 2017, or end-September 2017, the Government
will be required to complete a consultation with IMF staff on the reasons for the deviation and the proposed policy
response.
14
In addition, the following actions have already been taken with respect to certain benchmarks for theEFF:
• The Cabinet issued a Memorandum requiring the Ministry of Finance to complete by the end ofOctober 2016 a definitive strategy to address the issue of outstanding arrears of the centralgovernment and obligations of state enterprises. The Memorandum specified that the strategy isto include: (i) completion (by the end of 2016) of a comprehensive database of SOE’s financialobligations, including a breakdown of arrears and non-arrears to be certified by the AuditorGeneral, for use in creating a registry of such obligations; and (ii) clarification of thegovernment’s responsibility over existing obligations related to subsidies and othernon-commercial obligations of the SOEs. Meanwhile, in March 2017, Statements of CorporateIntent (“SCIs”) were signed for the five largest SOEs to enhance oversight and financialdiscipline of these enterprises with the view of improving their performance.
• The Ministry of Finance issued circulars to (i) formally implement tax policy and other revenuemeasures outlined in the Cabinet Memorandum of March 4, 2016; and (ii) detail revisedexpenditure ceilings for government ministries and agencies consistent with the overall budgetdeficit target for 2016.
• The Cabinet issued a resolution to adopt a framework note (which was agreed with IMF staff)for a new Inland Revenue Act, which embodies key tax policy drivers, overarching legal designframework, and the tax law reform roadmap as outlined in the March 2016 IMF LegalDepartment technical assistance mission Aide Memoire.
• Formally suspended, by Cabinet order the Board of Investment’s capacity to grant taxexemptions, tax holidays, and special tax rates until such time as the BOI Act can be formallyamended.
Sri Lanka’s previous IMF facility was obtained in 2009. In order to rebuild the country’s reserves tocomfortable levels and to increase investor confidence in the country, Sri Lanka made a request to, andwas approved by, the IMF for the SBA Facility of US$ 2.6 billion (SDR1.65 billion) in July 2009. TheSBA Facility successfully completed in July 2012. Sri Lanka achieved the key objectives of thisprogram by rebuilding international reserves to cover more than 3.5 months of imports, containing thebudget deficit, maintaining inflation at single-digit levels and ensuring the stability of the financialsystem. Accordingly, Sri Lanka received the entire amount of SDR1.65 billion (US$ 2.6 billion),which was approved under the SBA Facility. The completion of the SBA Facility marked the longestengagement that Sri Lanka has had with the IMF and the single largest facility that Sri Lanka has everobtained from a multilateral institution. Repayment of the SBA Facility commenced in October 2012and is expected to be completed by July 2017. Outstanding amount of the SBA Facility and EFFFacility as at March 31, 2017 amounted to SDR 103.35 million and SDR 239.79 million, respectively.
In addition to the SBA Facility, in August 2009, the IMF approved a general allocation of SDRs tocountries based on each country’s quota with the IMF to strengthen their international reserves in casethey may confront any liquidity constraints caused by the global economic crisis. Under the generalSDR allocation by the IMF, the current outstanding SDR liability position as of end-March 2017amount to SDR 395.46 million. The previous SDR allocation was received in August 2009 for anamount of SDR 325 million.
Recent Policy Measures
The Central Bank continued to tighten its monetary policy stance in 2016. Accordingly, the SRRapplicable on all rupee deposit liabilities of LCBs was raised by 1.50% to 7.50%, to be effective fromthe reserve period commencing on January 16, 2016. This measure permanently absorbed Rs. 52billion of excess liquidity from the domestic money market, while short term money market rates wereallowed to adjust upwards in response. The Central Bank also raised its policy interest rates, namely
15
the SDFR and the SLFR, by 50 basis points each, to 6.50% and 8.00%, respectively, effective fromthe close of business on February 19, 2016, with a view to curb growth of monetary and creditaggregates. Reflecting the pass-through effect of monetary policy measures, market interest ratesadjusted upwards, although credit flows to the private sector by commercial banks grew persistentlyat higher than projected levels due to increased ease of obtaining credit as well as increased demandfor long term credit from all major sectors of the economy, as reflected in the Quarterly Survey ofCommercial Banks’ Loans and Advances to the private sector. Considering these developments, theCentral Bank further tightened its monetary policy stance by raising the SDFR and the SLFR by 50basis points each to 7.00% and 8.50%, respectively, effective from the close of business on July 28,2016. With the view of limiting monetary expansion to desired levels while curtailing the build-up ofadverse inflation expectations, the Central Bank raised the policy interest rates again by 25 basispoints with effect from March 24, 2017.
In view of the low inflation environment as well as subdued inflation expectations, the Central Bankcontinued to pursue a relatively relaxed monetary policy stance during 2015, but initiated a gradualtightening of monetary policy towards the end of 2015. With the revival of the growth in credit to theprivate sector during the latter part of 2014, the special interest rate of 5% was removed effectiveMarch 2, 2015, to stabilize overnight interest rates within the policy rate corridor. In April 2015,considering the interest rate movements that were inconsistent with the low inflation environment andinvestment needs of the economy, the Central Bank reduced each of the SDFR and the SLFR by 50basis points to 6.00% and 7.50%, respectively. These measures enabled a significant expansion indomestic credit, particularly credit to the private sector. Given the high exposure of banks andfinancial institutions to certain lending categories, including loans for motor vehicles, the CentralBank imposed a minimum cash margin requirement of 100% on Letters of Credit (“LCs”) opened withcommercial banks for the importation of motor vehicles with effect from October 30, 2015 for a periodof one month. Thereafter, with effect from December 1, 2015, a maximum loan-to-value ratio of 70%was imposed on loans and advances for the purpose of purchasing or utilizing motor vehicles grantedby banks and other financial institutions supervised by the Central Bank. The continued high level ofexcess liquidity that prevailed in the domestic money market, however, remained a concern given itspotential to fuel credit leading to eventual inflationary pressures. Therefore, the Central Bankincreased the SRR by 1.50 percentage points in December 2015, to be effective from January 16, 2016,signaling the change in the Central Bank’s policy stance towards a more restrictive approach.
The Central Bank maintained its eased monetary policy stance in 2014 and reduced a key policy rate,the SLFR, by 50 basis points on January 2, 2014, thus reducing the policy rate corridor to 150 basispoints from the previous 200 basis points. Accordingly, the SDFR and the SLFR were maintained at6.50% and 8.00%, respectively, throughout the year. The Central Bank also implemented measures torationalize access to the SDF in view of the continued excess in liquidity in the domestic moneymarket and to encourage commercial banks to increase their credit disbursements to the private sector.Accordingly, on September 23, 2014, the Central Bank placed a limit on the use of SDF by an OMOparticipant at the SDF rate of 6.50% to three times per calendar month. Further, any deposit by anOMO participant at the SDF window in excess of three times is to be accepted at a reduced interestrate of 5% per annum. The easing of monetary policy since December 2012 continued to affect themarket interest rates during 2014, thereby reducing interest rates to historically low levels. Inaddition, the Central Bank introduced a credit guarantee scheme for pawning advances in June 2014for licensed banks engaged in pawning businesses in order to mitigate the contraction of pawingadvances and its effect on the overall credit growth, which moderated as an indirect result of thedecline in international gold prices. Furthermore, considering the improvement in the external sector,on January 2, 2014, the Central Bank removed the minimum cash margin requirement of 100% againstLCs opened with commercial banks for the import of certain categories of motor vehicles, which wasimposed on August 30, 2013.
A new electricity tariff structure, effective April 20, 2013, was implemented on May 9, 2013 tomitigate the financial losses incurred by the Ceylon Electricity Board (“CEB”). Domestic retail pricesof petroleum products were also raised to curb losses incurred by the Ceylon Petroleum Corporation(“CPC”). Effective April 1, 2013, prices of fuel oil used for power generation were increased in acost-reflective manner to reduce the losses incurred from sale of fuel oil to CEB at below-cost prices.Electricity tariffs have been lowered twice during the last three months of 2014 due to a change in
16
domestic generation mix with the addition of 900 MW of electricity through the Norochcholai CoalPower Plant. Accordingly, effective September 16, 2014, the electricity tariff for the ‘Domestic’category was reduced by 25%. In November 2014, accounts in the ‘Industry’ and ‘General Purposes’categories consuming below 300 units per month were given a tariff reduction of 25% through theintroduction of a separate tariff band, while a 15% downward revision was made to the tariffapplicable on ‘Hotel’ and all other ‘Industry’ and ‘General Purposes’ categories.
Similarly, petrol, diesel and kerosene prices were lowered on six occasions from September 2014 toJanuary 2016 due to declining global oil prices. Accordingly, kerosene, petrol and diesel prices werereduced by Rs. 20, Rs. 5 and Rs. 3 per liter, respectively, on September 17, 2014 and, effective fromDecember 6, 2014, petrol and diesel prices were reduced again by Rs. 7 per liter and kerosene by Rs.5per liter. Furthermore, effective from January 22, 2015, kerosene, petrol and diesel prices werereduced significantly by Rs. 16, Rs. 33 and Rs. 16 per liter, respectively, and, effective from January30, 2015, kerosene price was further reduced by Rs. 6 per liter. In addition kerosene price was furtherreduced by Rs. 10 and Rs. 5 effective from November 21, 2015 and January 9, 2017, respectively. Thedomestic gas price was twice reduced by Rs. 250 per 12.5 kg cylinder, effective from October 10, 2014and effective from December 7, 2014, respectively, resulting in a cumulative reduction of Rs. 500 per12.5kg cylinder during 2014. The domestic gas price was again reduced by Rs. 300, Rs. 100 and Rs.150 per 12.5 kg cylinder, effective from January 30, 2015, July 15, 2015 and November 21, 2015,respectively, due to declining global gas prices. Further, as per the Government’s budget for 2017(“Budget 2017”), domestic gas price was reduced again by Rs. 25 since November 2016.
Diversification of Oil Imports
Since the imposition of sanctions against Iran, Sri Lanka has been proactive in its reduction of crudeoil imports from Iran. Since June 2012, Sri Lanka has not imported any crude oil from Iran. Instead,it has initially substituted its crude oil requirements with imports from Saudi Arabia, the U.A.E. andOman and, since 2013, from only the U.A.E. and Oman. In 2015, crude oil imports from the U.A.E.amounted to 89% of total crude imports. In 2016, crude oil imports were solely from U.A.E.Meanwhile, the end to economic sanctions on Iran by the United States is anticipated to create apositive impact on Sri Lankan oil imports.
Medium Term Macroeconomic Outlook
Sri Lanka’s economy expanded at a provisional rate of 4.4% in 2016, and is projected to expect at arate of 5.0% for 2017 and thereafter expected to strengthen over the medium term to achieve a highergrowth trajectory of approximately 6% to 7% per annum. The envisaged growth path is expected tobe attained with the improvement in investor sentiment. Further, the new policy initiatives of theGovernment to spur growth across all major sectors of the economy and increase private sectorparticipation through the creation of an investor-friendly environment are expected to contribute to thegrowth trajectory of the economy over the medium term. Policy measures to encourage small and largescale entrepreneurs to participate in the global economy and positioning of Sri Lanka in the regionaland global value chain are expected to support growth in the industry, agricultural and servicessectors.
The monetary policy stance of Sri Lanka is also expected to support growth through theimplementation of necessary policy measures to ensure price stability in the country and providingconducive conditions for investors. In the medium term, inflation is estimated to be at a low level ofapproximately 5.0%.
Positive developments in the domestic and global economies, coupled with recent policy initiatives,are expected to result in a favorable outlook for the external sector over the medium term. The currentaccount deficit, which remained below US$ 2.0 billion in 2016 and 2015 and which was equivalentto 2.4% and 2.3% of GDP, respectively, is expected to gradually improve as a percentage of GDPduring the medium term to a deficit of approximately 1.9% by 2018. The decline in the current accountdeficit is expected to be driven by the improvement in trade in merchandise goods and services.Improvement in foreign exchange earnings from services, particularly with higher inflows from thetourism sector with increase in both tourist arrivals and higher spending, are expected to contributefavorably towards the improvement of the current account. However, workers’ remittances are
17
expected to slow down due to the decline in migration for foreign employment as a result of economicand geopolitical uncertainties in traditional destinations, such as the Middle East and Europe, theincreased availability of domestic employment opportunities, and the implementation of policymeasures to discourage migration in semi-skilled and unskilled categories. The overall BOP positionis also expected to improve over the medium term, with the expected rise in inflows to the financialaccount.
Meanwhile, Sri Lanka’s external reserve position is expected to improve over the medium term,mainly due to the expected higher inflows from non-debt related sources such as export proceeds andforeign direct investments. Furthermore, projected other inflows to the financial account are expectedto comfortably finance the narrowing current account deficit. Overall, the external position isexpected to improve over the medium term, yielding a sizable surplus in the overall balance andimproving the country’s external reserves.
Over the medium term, the monetary policy of the Central Bank will increasingly be aligned towardsa flexible inflation targeting framework in place of the existing monetary targeting framework. In thisframework, broad money aggregates would continue to serve as key intermediate indicators to guideits monetary policy, while the average weighted call money rate (“AWCMR”) would serve as theoperating target. Accordingly, in the medium term, the Central Bank’s monetary policy will follow apath for monetary expansion consistent with its projections for economic growth and inflation.Although net foreign assets of the banking system contracted in 2016 reflecting the deficit in theoverall BOP position, going forward, net foreign assets of the banking sector are projected to increasedue to the expected increase in foreign inflows and the resultant BOP surpluses. In the meantime,credit flows to the Government from the banking sector are expected to gradually decline as a resultof the projected improvement in the fiscal position of the Government which would lead to a reductionin domestic financing requirements. Similarly, borrowings of public corporations are expected todecline significantly due to the expected improvement in their financial performance, increasedoperational efficiency and market-based pricing. Accordingly, due to the decreasing reliance of thepublic sector on funds from the banking sector, the banking sector is expected to provide sufficientcredit flows to the private sector which would lead to higher investment levels and improved economicactivity.
With the Government’s on-going fiscal consolidation efforts, the budget deficit is expected to bearound 3.5% of GDP by 2020, while the central Government’s debt, which was at 79.3% of GDP asat 2016 year-end, is expected to be reduced to approximately 65% of GDP in the medium term. Therevenue-based fiscal consolidation efforts are aimed at increasing Government revenue with a numberof policy initiatives, including the automation of revenue collecting agencies, risk-based audits,efficiency enhancing measures and simplification of tax legislation and broadening the tax base. Theserevenue policies are being complemented by further rationalization of recurrent expenditure to allowthe Government to maintain public investment at approximately 5% of GDP in the medium term.
Recognizing the critical role of infrastructure development in sustaining medium term growth, theGovernment has adopted programs which aim, inter alia, at facilitating growth through well-connectedroads and expressway networks, providing irrigation and expanding the water distribution network,building a strong telecommunication network and initiating urban and township developmentprograms that focus on enabling investment inflows, creating jobs and improving living standards ofresidents. The Government also expects Sri Lanka to continue to benefit from its key strategic locationin the Indian Ocean. The development of the Colombo port, including the addition of the new southand east container terminals, are expected to make full use of the country’s potential as a maritime hubin the South Asian region. Sri Lanka has also made progress on its two international airports in theWestern and Southern parts of the country through its emphasis on training of aviation personnel,development of research facilities, development of a national airline and airports, improvement offacilities to harbor international aviation activities and improvement of passenger services. Plans areunderway to construct the second terminal and a multi-level terminal building with two pier passengerterminals at the Bandaranaike International Airport (“BIA”). Upon completion of the construction ofthe second terminal at the BIA, the current capacity of passenger movements per annum would bedoubled. In addition, on-going construction work of the Southern Expressway Extension project isscheduled to be completed in 2019 while land acquisition work is in progress in respect of the 168.7
18
km long Central Expressway project. Further, the railway line connecting Colombo to Jaffna hasprovided an alternative route between the Western and Northern parts of Sri Lanka, which is expectedto spur economic growth and broader social integration Initiatives have been taken to conduct afeasibility study for the Colombo Suburban Railway Project which aims at improving railway servicesin the capital city of Colombo and its suburbs. As a result of these projects, Sri Lanka will bewell-positioned to participate in international trade and become a popular tourist destination.
The construction work of the Colombo Financial City, which was earlier named as Colombo Port CityProject (“CPCP”), recommenced in March 2016. The Ministry of Megapolis and Western Developmenthas allocated approximately Rs. 94 million in 2017 to develop the infrastructure facilities of theproposed port city development project. Further, construction work for the Uma Oya HydropowerProject (120MW) and Broadlands Hydropower Project (35MW) have been in progress throughout2016 and these power plants are expected to be connected to the national grid by mid-2018 andmid-2019, respectively.
The Prime Minister appointed a special committee to investigate a certain domestic bond issuance bythe Central Bank in early 2015. The special committee presented its finding to the Parliament on May19, 2015 and the information is currently available in the public domain. The Committee on PublicEnterprises (“COPE”) has also investigated this matter. The COPE report is publicly available. APresidential Commission of Inquiry has also been appointed to investigate and inquire into theissuance of Treasury bonds and such commission is presently conducting its hearings on this matter.Meanwhile, the Government will continue its funding plans via domestic public auctions within theapproved limits of the Appropriation Act.
Sri Lanka has recently completed multiple power generation projects that contribute a total ofapproximately 900MW of coal power, approximately 175MW of hydro power and approximately275MW of renewable energy including mini hydro. In addition, 120MW of hydro power and 210MWof renewable energy, including mini-hydro and solar power, are in the process of being added to theimproved transmission and distribution system. Meanwhile, in education, the Government hasintroduced initiatives such as the program to establish 1,000 secondary schools in the country. Further,the concept of ‘nearest school is the best school’ has been introduced to promote equal opportunitiesin education for all students, irrespective of the region or the school type. As a result, education hasimproved at all levels, creating a greater talent pool to support Sri Lanka’s economic growth.
In January 2017, the European Union (“EU”) has proposed to remove a significant part of theremaining import duties on Sri Lankan products and increase market access, appreciating the newGovernment’s policies on improving human rights and strengthening democratic institutions. TheGSP+ trade status, when regained, is expected to have a positive impact on Sri Lanka’s foreign trade,particularly exports, thereby resulting in a positive economic impact in the medium term. Under theGSP+ scheme, Sri Lanka had obtained duty-free access for exports of over 7,200 products to membercountries of the EU. The textiles and garments industry derived substantial benefits from this scheme,as close to half of Sri Lanka’s textiles and garments are exported to EU countries. In mid-January2015, the EU banned importing fish from Sri Lanka, as it suspected that Sri Lanka was not complyingwith international rules on illegal fishing and employing inadequate control systems in the Sri Lankanfisheries industry. Discussions were held to negotiate the ban while steps were taken to improve theSri Lankan fisheries industry’s compliance with international standards and requirements specified bythe EU. As a result, in April 2016, the EU recommended lifting the fish import ban of Sri Lanka andsuch removal of the ban was approved by the EU Parliament in June 2016, who cited the reason thatSri Lanka has successfully reformed its fisheries governance system. With the EU market being oneof the major seafood exporting destinations for Sri Lanka, this development contributed significantlytowards promoting Sri Lankan seafood exports. Since the removal of the ban, seafood exports to theEU grew by 110.0%, year-on-year, during the second half of 2016.
19
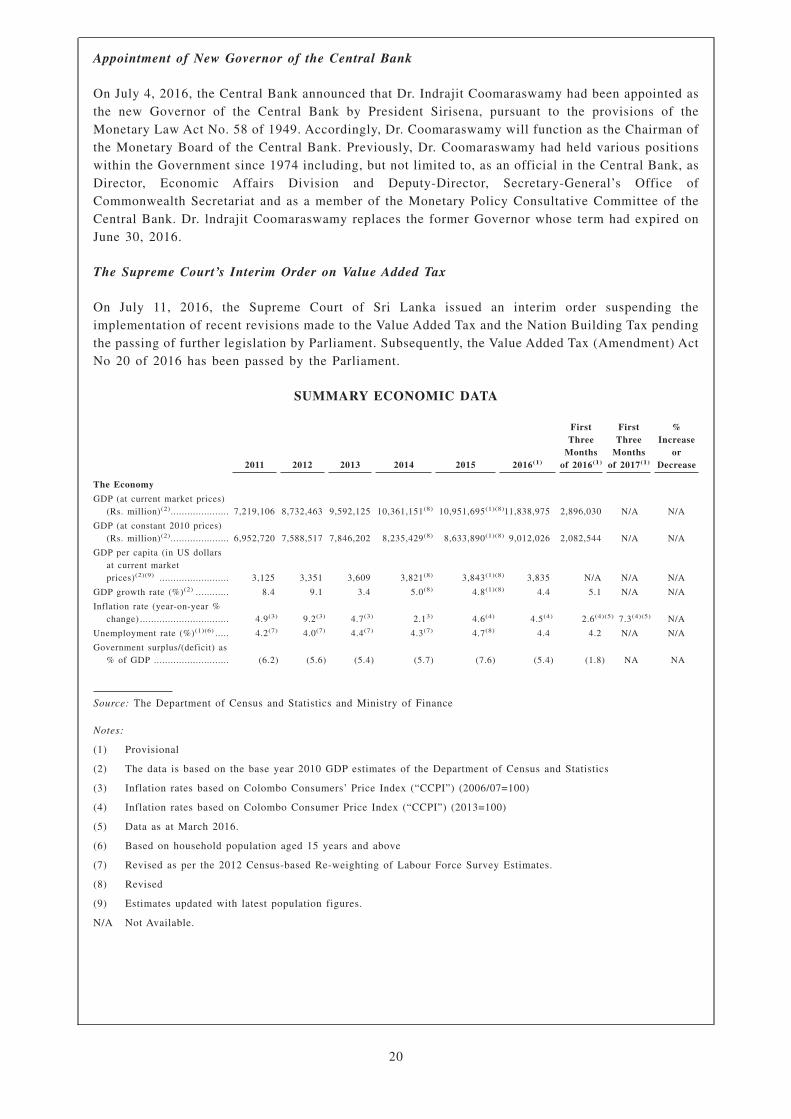
Appointment of New Governor of the Central Bank
On July 4, 2016, the Central Bank announced that Dr. Indrajit Coomaraswamy had been appointed asthe new Governor of the Central Bank by President Sirisena, pursuant to the provisions of theMonetary Law Act No. 58 of 1949. Accordingly, Dr. Coomaraswamy will function as the Chairman ofthe Monetary Board of the Central Bank. Previously, Dr. Coomaraswamy had held various positionswithin the Government since 1974 including, but not limited to, as an official in the Central Bank, asDirector, Economic Affairs Division and Deputy-Director, Secretary-General’s Office ofCommonwealth Secretariat and as a member of the Monetary Policy Consultative Committee of theCentral Bank. Dr. lndrajit Coomaraswamy replaces the former Governor whose term had expired onJune 30, 2016.
The Supreme Court’s Interim Order on Value Added Tax
On July 11, 2016, the Supreme Court of Sri Lanka issued an interim order suspending theimplementation of recent revisions made to the Value Added Tax and the Nation Building Tax pendingthe passing of further legislation by Parliament. Subsequently, the Value Added Tax (Amendment) ActNo 20 of 2016 has been passed by the Parliament.
SUMMARY ECONOMIC DATA
2011 2012 2013 2014 2015 2016(1)
FirstThree
Monthsof 2016(1)
FirstThree
Monthsof 2017(1)
%Increase
orDecrease
The Economy
GDP (at current market prices)(Rs. million)(2)..................... 7,219,106 8,732,463 9,592,125 10,361,151(8) 10,951,695(1)(8)11,838,975 2,896,030 N/A N/A
GDP (at constant 2010 prices)(Rs. million)(2)..................... 6,952,720 7,588,517 7,846,202 8,235,429(8) 8,633,890(1)(8) 9,012,026 2,082,544 N/A N/A
GDP per capita (in US dollarsat current marketprices)(2)(9) ......................... 3,125 3,351 3,609 3,821(8) 3,843(1)(8) 3,835 N/A N/A N/A
GDP growth rate (%)(2) ............ 8.4 9.1 3.4 5.0(8) 4.8(1)(8) 4.4 5.1 N/A N/A
Inflation rate (year-on-year %change) ................................ 4.9(3) 9.2(3) 4.7(3) 2.13) 4.6(4) 4.5(4) 2.6(4)(5) 7.3(4)(5) N/A
Unemployment rate (%)(1)(6) ..... 4.2(7) 4.0(7) 4.4(7) 4.3(7) 4.7(8) 4.4 4.2 N/A N/A
Government surplus/(deficit) as% of GDP ........................... (6.2) (5.6) (5.4) (5.7) (7.6) (5.4) (1.8) NA NA
Source: The Department of Census and Statistics and Ministry of Finance
Notes:
(1) Provisional
(2) The data is based on the base year 2010 GDP estimates of the Department of Census and Statistics
(3) Inflation rates based on Colombo Consumers’ Price Index (“CCPI”) (2006/07=100)
(4) Inflation rates based on Colombo Consumer Price Index (“CCPI”) (2013=100)
(5) Data as at March 2016.
(6) Based on household population aged 15 years and above
(7) Revised as per the 2012 Census-based Re-weighting of Labour Force Survey Estimates.
(8) Revised
(9) Estimates updated with latest population figures.
N/A Not Available.
20
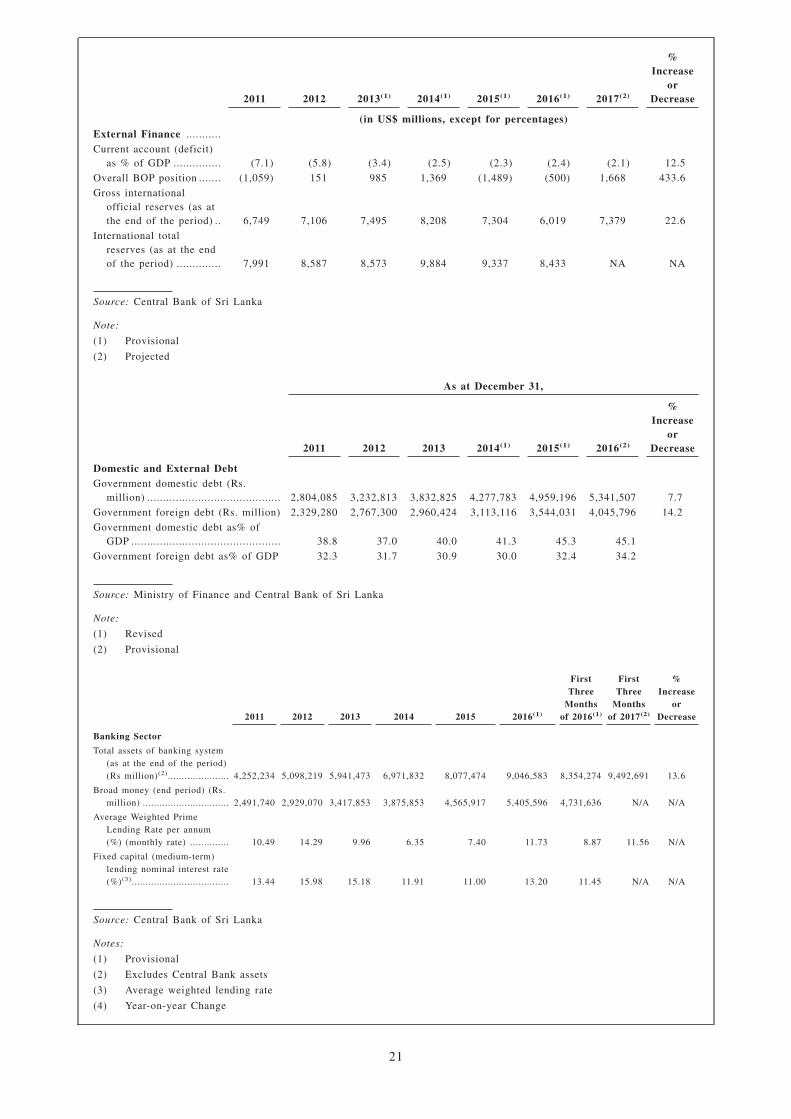
2011 2012 2013(1) 2014(1) 2015(1) 2016(1) 2017(2)
%Increase
orDecrease
(in US$ millions, except for percentages)External Finance ...........
Current account (deficit)as % of GDP ............... (7.1) (5.8) (3.4) (2.5) (2.3) (2.4) (2.1) 12.5
Overall BOP position ....... (1,059) 151 985 1,369 (1,489) (500) 1,668 433.6
Gross internationalofficial reserves (as atthe end of the period) .. 6,749 7,106 7,495 8,208 7,304 6,019 7,379 22.6
International totalreserves (as at the endof the period) .............. 7,991 8,587 8,573 9,884 9,337 8,433 NA NA
Source: Central Bank of Sri Lanka
Note:
(1) Provisional
(2) Projected
As at December 31,
2011 2012 2013 2014(1) 2015(1) 2016(2)
%Increase
orDecrease
Domestic and External DebtGovernment domestic debt (Rs.
million) .......................................... 2,804,085 3,232,813 3,832,825 4,277,783 4,959,196 5,341,507 7.7
Government foreign debt (Rs. million) 2,329,280 2,767,300 2,960,424 3,113,116 3,544,031 4,045,796 14.2
Government domestic debt as% ofGDP ............................................... 38.8 37.0 40.0 41.3 45.3 45.1
Government foreign debt as% of GDP 32.3 31.7 30.9 30.0 32.4 34.2
Source: Ministry of Finance and Central Bank of Sri Lanka
Note:
(1) Revised
(2) Provisional
2011 2012 2013 2014 2015 2016(1)
FirstThree
Monthsof 2016(1)
FirstThree
Monthsof 2017(2)
%Increase
orDecrease
Banking Sector
Total assets of banking system(as at the end of the period)(Rs million)(2)...................... 4,252,234 5,098,219 5,941,473 6,971,832 8,077,474 9,046,583 8,354,274 9,492,691 13.6
Broad money (end period) (Rs.million) ............................... 2,491,740 2,929,070 3,417,853 3,875,853 4,565,917 5,405,596 4,731,636 N/A N/A
Average Weighted PrimeLending Rate per annum(%) (monthly rate) .............. 10.49 14.29 9.96 6.35 7.40 11.73 8.87 11.56 N/A
Fixed capital (medium-term)lending nominal interest rate(%)(3)................................... 13.44 15.98 15.18 11.91 11.00 13.20 11.45 N/A N/A
Source: Central Bank of Sri Lanka
Notes:
(1) Provisional
(2) Excludes Central Bank assets
(3) Average weighted lending rate
(4) Year-on-year Change
21
THE OFFERING
The following is a brief summary of certain terms of the Offering. For a more complete descriptionof the terms of the Bonds, see “Description of the Bonds” and “Plan of Distribution.”
Issuer .......................................... The Government of the Democratic Socialist Republic of SriLanka.
Bonds .......................................... US$1,500,000,000 aggregate principal amount of 6.20%Bonds due 2027.
Interest Payment Dates .............. May 11 and November 11 of each year, commencing onNovember 11, 2017.
Maturity Date ............................. The Bonds will mature on May 11, 2027.
Redemption ................................. The Bonds will not be redeemable prior to maturity.
Status of Bonds .......................... The Bonds will constitute direct, unconditional,unsubordinated and unsecured general obligations of theIssuer. The Bonds will at all times rank pari passu amongthemselves in all respects without any preference of one overthe other by reason of priority of date of issue or otherwise.The Bonds will at all times rank at least equally with all otherpresent and future unsecured and unsubordinated ExternalIndebtedness (as defined herein) of the Issuer. The full faithand credit of the Democratic Socialist Republic of Sri Lankawill be pledged for the due and punctual payment of theprincipal of, and interest on, the Bonds.
Limitation on Liens .................... With certain exceptions, so long as any Bonds remainOutstanding (as defined herein), the Issuer shall not create,incur, assume or permit to subsist any Lien (as defined herein)upon the whole or any part of its present or future assets orrevenues to secure (1) any Public External Indebtedness (asdefined herein); (2) any Guarantees (as defined herein) inrespect of Public External Indebtedness; or (3) the PublicExternal Indebtedness of any other person; without at thesame time or prior thereto securing the Bonds equally andratably therewith or providing such other arrangement(whether or not comprising a Lien) as shall be approved bynot less than 66 2/3% of the aggregate principal amount ofOutstanding Bonds which are represented at a meeting ofHolders (as defined herein) duly convened in accordance withthe Indenture (as defined herein). See “Description of theBonds — Limitation on Liens.”
22
Taxation ...................................... The Issuer will make all payments on the Bonds withoutwithholding or deducting any present or future taxes imposedby Sri Lanka or any of its political subdivisions, unlessrequired by law. If Sri Lankan law requires the Issuer todeduct or withhold taxes, it will pay the holders, subject tocertain exceptions, such additional amounts as are necessaryto ensure that they receive the same amount as they wouldhave received without such withholding or deduction. TheIssuer will not, however, pay any such additional amounts ifthe holder or beneficial owner is liable for Sri Lankan taxunder certain circumstances. See “Description of the Bonds— Additional Amounts.” For a description of certain UnitedStates tax aspects of the Bonds, see “Taxation — UnitedStates Federal Income Taxation.”
Cross-Defaults ............................ Events of default with respect to the Bonds include (1) anyExternal Indebtedness shall become (or shall become capableof being declared) due and payable prior to its stated maturity(otherwise than at the option of the Issuer); (2) any defaultshall occur in the payment of principal of, or premium orprepayment charge (if any) or interest on, any ExternalIndebtedness when and as the same shall become due andpayable if such default shall continue for more than the periodof grace, if any, originally applicable thereto; or (3) anydefault shall occur in the payment when due and called upon(after the expiry of any originally applicable grace period) ofany Guarantee of the Issuer in respect of any ExternalIndebtedness of any other person, provided that the aggregateamount of the relevant External Indebtedness in respect ofwhich one or more of such events have occurred equals orexceeds US$25.0 million (or its equivalent in any othercurrency or currencies). See “Description of the Bonds —Events of Default.”
Collective Action Clause ............ The Bonds will contain provisions regarding default andacceleration and approval of amendments, modifications,changes and waivers with the consent of the Holders ofspecified percentages of the Outstanding Bonds, which arecommonly referred to as “collective action clauses.” See“Description of the Bonds — Modifications and Amendments;Meetings of Holders.”
Listing......................................... Approval in-principle has been received from the SGX-ST forthe listing and quotation of the Bonds on the SGX-ST. For solong as the Bonds are listed on the SGX-ST and the rules ofthe SGX-ST so require, the Bonds will be traded on theSGX-ST in a minimum board lot size of S$200,000 (or itsequivalent in foreign currencies).
Ratings of the Bonds .................. The Bonds are expected to be rated “B+” by S&P, “B1” byMoody’s and “B+” by Fitch. The ratings assigned by ratingagencies are indicative and may go up and down from time totime. A credit rating is not a recommendation to purchase,hold or sell securities and may be subject to suspension,change or withdrawal at any time by the assigning ratingagency.
23
Form, Denomination andRegistration ................................ The Issuer will issue the Bonds in fully registered form in
minimum denominations of US$200,000 and integralmultiples of US$1,000 in excess thereof. The Bonds will berepresented by one or more Global Bonds (as defined herein),registered in the name of Cede & Co., as nominee of DTC.Beneficial interests in the Global Bonds will be shown on, andthe transfer thereof will be effected only through, recordsmaintained by DTC and its direct and indirect participants(including Euroclear Bank SA/NV (“Euroclear”) andClearstream Banking S.A. (“Clearstream, Luxembourg”)).Settlement of all secondary market trading activity in theBonds will be made in immediately available funds.
Further Issues ............................ The Issuer may from time to time, without notice to or theconsent of the Holders, issue further bonds having terms andconditions the same as the Bonds or the same in all respectssave for the amount and date of the first payment of interestthereon and so that the same shall be consolidated and forma single series and class with the Bonds, provided that suchfurther bonds must be fungible with the Bonds for U.S.federal income tax purposes.
Use of Proceeds .......................... The net proceeds from the issuance of the Bonds will be usedto fund ongoing and/or new development projects of theGovernment. See “Use of Proceeds”.
Trustee; Paying Agent;Transfer Agent ............................ HSBC Bank USA, National Association.
Governing Law ........................... The Bonds and the Indenture will be governed by andconstrued in accordance with the laws of the State of NewYork.
24
USE OF PROCEEDS
The Government will use the net proceeds from the issue of the Bonds (estimated to beUS$1,497,442,559 after deduction of underwriting commission and fees as well as estimatedexpenses) to fund on-going and/or new development projects of the Government.
25
THE DEMOCRATIC SOCIALIST REPUBLIC OF SRI LANKA
History, Land and People
History
The recorded history of Sri Lanka (formerly known as “Ceylon”) dates back to the sixth century B.C.,when an Indian prince named Vijaya together with his followers landed on the island. In the thirdcentury B.C., the Buddhist faith was adopted by the majority of the people and the island became acenter of Buddhist scholarship and missionary work. From the sixteenth century, Ceylon wassuccessively colonized by the Portuguese, the Dutch and the British until she regained independenceon February 4, 1948. In 1972, Ceylon became a republic and changed its name to Sri Lanka. In 1978,the existing Constitution was promulgated, providing that the country shall be known as the“Democratic Socialist Republic of Sri Lanka.”
Geography and General Information
Sri Lanka is an island located 29 kilometers from the Southeastern tip of India and 645 kilometersnorth of the equator. It is located across several major maritime trading routes between Asia and theMiddle East, Europe, Africa and the Americas. Sri Lanka extends 438 kilometers from North to South,and 225 kilometers from East to West at its broadest point, occupying a territory of 65,610 squarekilometers. The terrain of Sri Lanka is largely flat, with a cluster of mountain peaks located in theSouth-central area of the island, the highest of which is the 2,524-meter-high PidurutalagalaMountain. Numerous rivers originate in the mountains and flow toward the sea, each of which supportsagricultural, industrial and transportation activities. Sri Lanka has a marine resource base comprising21,500 square kilometers of territorial sea and 517,400 square kilometers of Exclusive Economic Zone(“EEZ”) extending up to 200 nautical miles from the coastline.
Sri Lanka’s climate is tropical, with high humidity and year-round temperatures averaging 27�C to28�C. Two monsoon seasons occur each year, the Southwest monsoon from May to October and theNortheast monsoon from December to March. The North of the island receives an average ofapproximately 100 centimeters of rain annually, and the Southwest of the island receives an averageof approximately 500 centimeters of rain each year. A massive irrigation system comprising large,medium and small-scale tanks and a canal system has been built since ancient times to provide regularwater supply for cultivation of paddy and other field crops. Since independence, the Government hasimplemented extensive programs consisting of numerous irrigation projects, including the MahaweliScheme, with a goal to provide the population with electricity, regular water supply for agriculture andnew land for cultivation.
The population of Sri Lanka was estimated to be 21.203 million in 2016. Sri Lanka has a diverse ethniccomposition: based on data from the previous nation-wide census in 2012, 74.9% of the people isSinhalese, 15.3% is Tamils, 9.3% is Sri Lankan Moors and the remaining 0.5% is of other ethnicities.In 2015, the literacy rate was 93.2%. Sinhalese and Tamil are the official languages of Sri Lanka and,along with English, are taught in all schools. Based on the census in 2012, 70.1% of the populationare Buddhist, 12.6% are Hindu, 9.7% are Muslim and 7.6% are Christian (including Roman Catholic).
More than one fourth of the total population lives in the Western Province (28.4%), while the leastpopulated province is the Northern Province (5.2%). As at 2016 year end, the population in both theColombo district and the Gampaha district exceeded two million in each district. The five districts ofKurunegala, Kandy, Kalutara, Ratnapura and Galle recorded population of more than one millionwhile the Mullaitivu district recorded the lowest population. An administrative capital, SriJayawardenapura-Kotte, was designated in 1977 and serves as the site of the Parliament.
26
Government
Constitutions
The first constitution of independent Ceylon, promulgated at the time of independence on February 4,1948 and commonly referred to as the Soulbury Constitution, comprised several documents, includingThe Ceylon Independence Act of 1947 and The Orders in Council of 1946 and 1947. The firstrepublican constitution, which provides for a unicameral Parliament, was drafted by the Members ofParliament functioning as a Constituent Assembly and promulgated on May 22, 1972. On September7, 1978, the third and current constitution (the “Constitution”), was promulgated.
The Constitution provides for an independent judiciary and fundamental rights of the people,including the right of any aggrieved person to file a claim with the Supreme Court for redress of anyviolation of his or her fundamental rights. The Constitution also provides for a ParliamentaryCommissioner for Administration (Ombudsman) to investigate and report on public grievances againstGovernment Institutions and State officers and give redress. Furthermore, it provides for a referendumin respect of bills proposed for the amendment of certain Articles of the Constitution and certain otherselected bills referred to the people by the President.
Governmental Structure
President
The Nineteenth Amendment to the Constitution curtailed the executive powers of the Presidency. Itrepealed changes introduced by the Eighteenth Amendment in 2010, which further expanded theexecutive powers of the Presidency. Accordingly, the Nineteenth Amendment limited the Presidencyto two terms in office and reduced the length of each term from six years to five years. The mostimportant change is the limitation on Presidential immunity. In addition, under the NineteenthAmendment, the exclusive power vested with the President to dissolve the Parliament at any time afterone year of its election has been curtailed — the President may not dissolve the Parliament until theexpiration of a period of not less than four years and six months from the date of the Parliament’s firstmeeting unless the President is required to do so through a resolution passed by at least two-thirds ofthe members of the Parliament.
Under the Nineteenth Amendment, the President’s duties include:
• ensuring that the Constitution is respected and upheld by all organs of the Government;
• promoting national reconciliation and integration;
• facilitating the proper functioning of the Constitutional Council and the institutions whosemembers are appointed through recommendation of the Constitutional Council; and
• ensuring the creation of proper conditions for the conduct of free and fair elections and referendaon the advice of the Election Commission.
The new constitutional changes also confer upon the President the power to exercise the followingrights, among others:
• to make the Statement of Government Policy in Parliament at the commencement of each sessionof Parliament;
• to preside at ceremonial sittings of Parliament;
• to summon, prorogue and dissolve Parliament;
• to receive and recognize, and to appoint and accredit, Ambassadors, High Commissioners,Plenipotentiaries and other diplomatic agents;
27
• to appoint as President’s Counsel, attorneys-at-law who have reached eminence in the professionand have maintained high standards of conduct and professional rectitude;
• to keep the Public Seal of the Republic, and to make and execute under the Public Seal, the actsof appointment of the Prime Minister and other Ministers of the Cabinet, the Chief Justice andother judges of the Supreme Court, the President of the Court of Appeal and other judges of theCourt of Appeal, and such grants and dispositions of lands and other immovable property vestedin the Republic as the President is by law required or empowered to do, and to use the PublicSeal for sealing all things whatsoever that shall pass that Seal;
• to declare war and peace; and
• to do all such acts and things, not inconsistent with the provisions of the Constitution or writtenlaw, as by international law, custom or usage the President is authorized or required to do.
The President shall be responsible and answerable to Parliament for the due exercise, performance anddischarge of his or her powers, duties and functions under the Constitution and any written law,including the law for the time being relating to public security. The President remains the Head ofState, the Head of the Executive and the Government and the Commander in Chief of the ArmedForces. The President also appoints Ministers to the Cabinet, for which consultation with the PrimeMinister for advice is available.
Prime Minister
The President appoints the Member of Parliament who in his opinion is most likely to command theconfidence of the Parliament as the Prime Minister. The Prime Minister continues to hold office unlesshe resigns from his office or ceases to be a Member of Parliament. The Members of Parliament of theruling party are headed by the Prime Minister during the parliamentary sessions. The President mayconsult the Prime Minister where he considers such consultation to be necessary when appointingCabinet Ministers. The President, on the advice of the Prime Minister, may appoint non-CabinetMinisters and Deputy Ministers and assign ministries, subjects and functions to them. The Presidentmay also appoint the Prime Minister to exercise, perform and discharge the powers, duties, andfunctions of the President during a period when the President is of the opinion that he will be unableto attend to his office due to absence from Sri Lanka or any other reason.
Parliament
The Parliament is currently a unicameral 225-member legislature that was elected by universalsuffrage on the basis of proportional representation to a five-year term. The President may from timeto time summon, suspend or end a legislative session and dissolve the Parliament under theConstitution. The Parliament reserves the power to make all laws and to repeal or amend any provisionof the Constitution. The Parliament is not permitted under the Constitution to abdicate or in anymanner alienate its legislative power. The Speaker, the Deputy Speaker and the Deputy Chairman ofCommittees are elected by the Parliament at its first meeting after a general election. The Speaker isto preside at sessions of the Parliament. In his absence, the Deputy Speaker, or in the absence of both,the Deputy Chairman of Committees shall preside. The privileges, immunities and powers of theParliament and its Members are determined by the Parliament and regulated by law. The most recentParliamentary election was held on August 17, 2015. The UNP became the largest group in theParliament after securing 45.66% of votes and 106 seats while the UPFA secured 42.38% of votes and95 seats. On August 20, 2015, the central committee of the SLFP, the main party of the UPFA, agreedto form a national government with the UNP for two years. Ranil Wickremesinghe was sworn in asthe Prime Minister on August 21, 2015 and R. Sampanthan of ITAK was appointed as the Leader ofthe Opposition.
28
The proposed Twentieth Amendment to the Constitution will replace the existing proportionalrepresentation system of parliamentary elections with a hybrid proportional representation andfirst-past-the-post system. Although details remain yet to be confirmed, a draft of the proposedamendment expands the total number of members of Parliament from the present 225 to 255, with eachpolling division having at least one representative in Parliament. Of those 255 members of Parliament,196 members are expected to be elected on a first-past-the-post system and a district-basedproportional representation system. The remaining 59 members are expected to be from the NationalList. Meanwhile, a Delimitation Commission will decide on the number of electorates withmulti-member electorates, which has been proposed for a number of Districts.
Judiciary
Sri Lanka’s judiciary consists of a Supreme Court, a Court of Appeal, and a number of subordinatecourts. The Supreme Court consists of a Chief Justice and between six and ten Supreme Court Justicesappointed by the President. The Court of Appeal consists of a President of the Court of Appeal andbetween six and eleven judges appointed by the President. The Supreme Court can determine whethera proposed bill is consistent with the Constitution and whether a referendum must be held on aproposed bill. It also has sole and exclusive jurisdiction to hear and determine any cases relating tothe infringement by the executive or administrative action of any fundamental right or language rightrecognized by the Constitution. The Supreme Court is also the final court of appeal for all criminaland civil cases.
Provincial Councils
Under the Thirteenth Amendment to the Constitution, significant legislative authority was delegatedto the Provincial Councils. These Provincial Councils are directly elected for five-year terms. ThePresident appoints the Governor of a province, who then appoints the Board of Ministers, consistingof the Chief Minister and four other Ministers from among the elected members. The ProvincialCouncils possess certain provincial-level legislative and executive powers over education, health,rural development, tourism, social services, agriculture and local taxation, subject to Governmentoversight. There are also municipal, urban, and rural councils with limited powers.
Principal Government Officials
Name Principal Position Age
Maithripala Sirisena ............................................. President 65Ranil Wickremesinghe ........................................ Prime Minister 68Ravi Karunanayake ............................................. Minister of Finance 54Lakshman Kiriella ................................................ Leader of the House 69Gayantha Karunathilaka ....................................... Chief Government Whip 54Mangala Samaraweera .......................................... Minister of Foreign Affairs 60
National Elections and Recent Political Developments
Sri Lanka has a multi-party democracy. Two major parties, the Sri Lanka Freedom Party (the “SLFP”)and the UNP, have generally alternated rule since 1956.
In early 2004, the SLFP, the JVP, the Lanka Sama Samaja Party, the Sri Lanka Communist Party, theNational Unity Alliance and the National Muslim Congress formed the UPFA. On February 7, 2004,former President Chandrika Kumaratunga dissolved the Parliament and the parliamentary election washeld on April 4, 2004. The election resulted in the UPFA, together with several other parties andMembers of Parliament who had agreed to directly support the President, forming a majority in theParliament. When the Parliament convened on April 23, 2004, Mahinda Rajapaksa was elected as thePrime Minister and the UNP became the main opposition party.
29
The governing coalition led by the UPFA was supported by 24 Members of the UNP. Further, theCeylon Workers Congress, which contested the UNP at the general election in 2004, and the JathikaHela Urumaya supported the Government. Members of the Jathika Nidahas Peramuna who separatedfrom the JVP also supported the Government.
Resolving a protracted debate on the date of expiration of President Kumaratunga’s term of office, inAugust 2005 the Supreme Court ruled that a presidential election must be held in November 2005.Mahinda Rajapaksa was the UPFA candidate and Prime Minister Ranil Wickremesinghe was the UNPcandidate in the presidential election. The fifth presidential election was held on November 17, 2005.Mahinda Rajapaksa was elected the fifth Executive President of Sri Lanka in this election and he tookthe oath as the President on November 19, 2005. President Rajapaksa thereafter appointed RatnasiriWickremanayake as the Prime Minister.
Prior to the expiration of his first term, President Mahinda Rajapaksa called for a presidential electionone year earlier than what was constitutionally required. Mahinda Rajapaksa was the UPFA candidatewhile former army commander Sarath Fonseka was the common opposition candidate. The presidentialelection was held on January 26, 2010 and resulted in the incumbent, Mahinda Rajapaksa, becomingthe president-elect. Mahinda Rajapaksa took the oath as President for the second term of office onNovember 17, 2010 and began a new six-year term as the executive president of Sri Lanka.
President Mahinda Rajapaksa dissolved the 13th Parliament on February 9, 2010 and called for ageneral election. SLFP, Jathika Hela Urumaya, Jathika Nidahas Peramuna, Lanka Sama Samaja Party,the Sri Lanka Communist Party, the National Unity Alliance and the National Muslim Congress againcontested as the UPFA.
The general election was held on April 8, 2010. It was the first general election held in Sri Lankafollowing the end of the 26-year civil war. The election resulted in the UPFA winning 144 out of 225seats, securing close to a two-thirds majority in the Parliament. When the Parliament convened onApril 22, 2010, D.M. Jayarathne was appointed Prime Minister, and the UNP functioned and continuesto function as the main opposition party to this date.
The sixth presidential election was held on January 8, 2015. The incumbent President MahindaRajapaksa, seeking a third term in office, was the UPFA’s candidate. The UNP-led opposition coalitionfielded Maithripala Sirisena, the former Minister of Health in Rajapaksa’s government and GeneralSecretary of the SLFP, as its common candidate. Sirisena was declared the winner after receiving51.28% of total votes cast compared to Rajapaksa’s 47.58%, winning 12 of the 22 electoral districts.After a smooth transition of power, Sirisena was sworn in as the sixth executive President of Sri Lankaon January 9, 2015. Immediately after, Ranil Wickremesinghe was sworn in as the new prime ministerbefore President Sirisena.
30
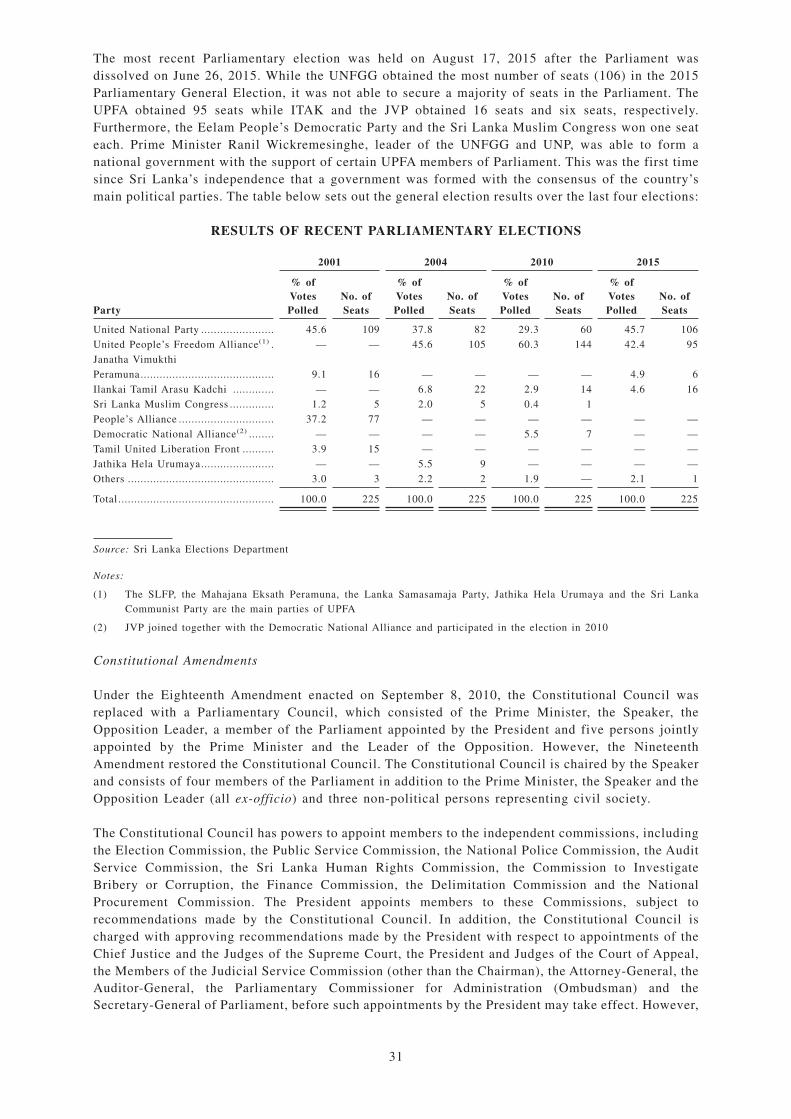
The most recent Parliamentary election was held on August 17, 2015 after the Parliament wasdissolved on June 26, 2015. While the UNFGG obtained the most number of seats (106) in the 2015Parliamentary General Election, it was not able to secure a majority of seats in the Parliament. TheUPFA obtained 95 seats while ITAK and the JVP obtained 16 seats and six seats, respectively.Furthermore, the Eelam People’s Democratic Party and the Sri Lanka Muslim Congress won one seateach. Prime Minister Ranil Wickremesinghe, leader of the UNFGG and UNP, was able to form anational government with the support of certain UPFA members of Parliament. This was the first timesince Sri Lanka’s independence that a government was formed with the consensus of the country’smain political parties. The table below sets out the general election results over the last four elections:
RESULTS OF RECENT PARLIAMENTARY ELECTIONS
Party
2001 2004 2010 2015
% ofVotesPolled
No. ofSeats
% ofVotesPolled
No. ofSeats
% ofVotesPolled
No. ofSeats
% ofVotesPolled
No. ofSeats
United National Party ....................... 45.6 109 37.8 82 29.3 60 45.7 106
United People’s Freedom Alliance(1) . — — 45.6 105 60.3 144 42.4 95
Janatha Vimukthi
Peramuna.......................................... 9.1 16 — — — — 4.9 6
Ilankai Tamil Arasu Kadchi ............. — — 6.8 22 2.9 14 4.6 16
Sri Lanka Muslim Congress .............. 1.2 5 2.0 5 0.4 1
People’s Alliance .............................. 37.2 77 — — — — — —
Democratic National Alliance(2) ........ — — — — 5.5 7 — —
Tamil United Liberation Front .......... 3.9 15 — — — — — —
Jathika Hela Urumaya....................... — — 5.5 9 — — — —
Others .............................................. 3.0 3 2.2 2 1.9 — 2.1 1
Total ................................................. 100.0 225 100.0 225 100.0 225 100.0 225
Source: Sri Lanka Elections Department
Notes:
(1) The SLFP, the Mahajana Eksath Peramuna, the Lanka Samasamaja Party, Jathika Hela Urumaya and the Sri LankaCommunist Party are the main parties of UPFA
(2) JVP joined together with the Democratic National Alliance and participated in the election in 2010
Constitutional Amendments
Under the Eighteenth Amendment enacted on September 8, 2010, the Constitutional Council wasreplaced with a Parliamentary Council, which consisted of the Prime Minister, the Speaker, theOpposition Leader, a member of the Parliament appointed by the President and five persons jointlyappointed by the Prime Minister and the Leader of the Opposition. However, the NineteenthAmendment restored the Constitutional Council. The Constitutional Council is chaired by the Speakerand consists of four members of the Parliament in addition to the Prime Minister, the Speaker and theOpposition Leader (all ex-officio) and three non-political persons representing civil society.
The Constitutional Council has powers to appoint members to the independent commissions, includingthe Election Commission, the Public Service Commission, the National Police Commission, the AuditService Commission, the Sri Lanka Human Rights Commission, the Commission to InvestigateBribery or Corruption, the Finance Commission, the Delimitation Commission and the NationalProcurement Commission. The President appoints members to these Commissions, subject torecommendations made by the Constitutional Council. In addition, the Constitutional Council ischarged with approving recommendations made by the President with respect to appointments of theChief Justice and the Judges of the Supreme Court, the President and Judges of the Court of Appeal,the Members of the Judicial Service Commission (other than the Chairman), the Attorney-General, theAuditor-General, the Parliamentary Commissioner for Administration (Ombudsman) and theSecretary-General of Parliament, before such appointments by the President may take effect. However,
31
in the discharge of its function relating to the appointment of Judges of the Supreme Court and thePresident and Judges of the Court of Appeal, the Constitutional Council is also required to obtain theviews of the Chief Justice. All of the independent commissions, except for the Election Commission,are responsible and answerable to the Parliament.
The Nineteenth Amendment provides that the total number of Ministers of the Cabinet shall not exceedthirty, while the total number of Ministers who are not members of the Cabinet shall not, in theaggregate, exceed forty. The Nineteenth Amendment further provides that if a political party, whichobtains the highest number of seats in Parliament, forms a national government together with the otherpolitical parties, the number of Ministers of the Cabinet, State Ministers and Deputy Ministers shallbe determined by Parliament.
Administrative Structure
Sri Lanka has nine provinces, 25 administrative districts and 335 local authorities. Each province isgoverned by a directly elected Provincial Council, while each administrative district is administeredby a District Secretariat.
The Government is composed of various ministries and ministry-equivalent agencies of the executivebranch, which implement the various programs and projects of the Government. Set out below is a listof all ministries:
LIST OF MINISTRIES
Sector Ministries
Economic services ................. National Policies & Economic Affairs; Mahaweli Development &Environment; City Planning & Water Supply; Plantation Industries,Power & Renewable Energy; Agriculture; Lands; Ports andShipping; Industry and Commerce; Transport & Civil Aviation;Fisheries & Aquatic Resources Development; Irrigation & WaterResources Management; Rural Economic Affairs; Public EnterprisesDevelopment; Petroleum Resources Development; PrimaryIndustries; Development, Strategies & International Trade;Megapolis & Western Development; Law & Order and SouthernDevelopment, Regional Development
Social services ....................... National Integration & Reconciliation; Tourism Development &Christian Religious Affairs; Sustainable Development & Wildlife;Social Empowerment & Welfare; Higher Education & Highways;Science, Technology & Research; Health Nutrition & IndigenousMedicine; Housing & Construction; Sports; Rehabilitation,Resettlement & Hindu Religious Affairs; Education; ForeignEmployment; Women & Child Affairs; Post, Postal Services &Muslim Religious Affairs; Disaster Management; SkillsDevelopment & Vocational Training; Hill Country New Villages,Infrastructure & Community Development; National Co-Existence,Dialogue and Official Languages
General public services .......... Finance; Defense; Buddha Sasana; Home Affairs; Foreign Affairs;Public Administration & Management; Provincial Councils & LocalGovernment; Labor & Trade Union Relations; Law & Order andPrison Reforms; Rehabilitation, Resettlement & Hindu ReligiousAffairs; Internal Affairs, Wayamba Development & CulturalAffairs; Justice; Telecommunication & Digital Infrastructure;National Dialogue; Special Assignment
Constitutional offices ............. Parliamentary Reforms and Mass Media
32
Public Corporations
The Ministry of Public Enterprises Development was established in September 2015 for theformulation of policies, programs and projects, and the monitoring and evaluation of public enterprisedevelopment. Enterprises within the purview of the Ministry are: Bogala Graphite Lanka Ltd., CeylonCeramics Corporation (Brick and Tiles) Division, Kahagolle Engineering Services Company Ltd.(“KESCO”), BCC Company Limited, Public Resources Management Corporation, Hotel Developers(Lanka) PLC, SriLankan Airlines Ltd., Mihin Lanka (Pvt.) Ltd., Insurance Corporation of Sri Lankaand its subsidiaries and associated companies, all state banks and their subsidiaries and associatedcompanies, Lakdiva Engineering Ltd, Werahara Engineering Services Ltd. (WESCO), Janatha EstateDevelopment Board, Sri Lanka State Plantation Corporation, Elkaduwa Plantation Company Ltd,Kurunegala Plantation Company Ltd, Chilaw Plantation Company Ltd and Galoya Plantation (PVT)Ltd.
Policy Priorities of President Sirisena’s Government
The policy priorities of President Sirisena’s Government include:
• achieving a high level of human development, leading to reconciliation among all communitiesand rapid socioeconomic development to overcome local and international challenges;
• abolishing the executive presidential system and introducing changes to the Constitution toestablish a Presidency that is aligned with the Parliament through the Cabinet;
• establishing a new electoral system;
• prioritizing skills development and enabling the Sri Lankan workforce to meet the needs of localand international employment opportunities;
• forming future economic policies, plans and strategies to maximize benefits from Sri Lanka’sstrategic geographic location;
• promoting basic principles of micro credit and financial management among small-scaleentrepreneurs and farmers;
• strengthening existing institutional structures to eradicate corruption and protection of stateproperty;
• minimizing income disparity and expanding the middle class while ensuring equitabledevelopment across the country;
• focusing foreign policy on Asia-centric “middle path” policy based on the foundation ofopenness and friendship with all countries;
• introducing a National Food Policy with the aim of producing healthy food locally, promotingthe growth of agricultural products to fulfill Sri Lanka’s nutrition needs and prioritizing riceproduction;
• introducing modern technology to the agricultural and livestock sectors;
• enhancing public services, including free healthcare, free education and public transport;
• formulating a youth policy to address the current needs of Sri Lanka; and
• prioritizing the well-being of women in all development strategies and building a better futurefor and ensuring the security of children.
33
The Committee Against Corruption and the Urgent Response Committee
The Government has established a special Committee Against Corruption. The Committee AgainstCorruption is headed by the Prime Minister and includes representatives from the Cabinet, oppositionparliamentarians/politicians and legal experts. Cabinet approval has also been granted to establish anUrgent Response Committee, with a member of Parliament as the Coordinator and comprising publicofficials, police officers, lawyers, financial specialists and officials of the Criminal InvestigationDepartment, to act on the recommendations of the Committee Against Corruption.
The Committee Against Corruption has already taken action on certain matters of public interest.Further, the Committee Against Corruption mainly focuses on the following:
• combating fraudulent financial dealings outside of Sri Lanka;
• introducing an Anti-Bribery or Anti-Corruption Commission with greater powers;
• establishing a National Procurement Commission;
• introducing the National Audit Act; and
• implementing the United Nations Anti-Corruption Covenant, to which Sri Lanka is a signatory.
Furthermore, in February 2015, the Fraud and Corruption Investigation Division, which is alsoreferred to as the Financial Crimes Investigation Division (“FCID”), was established as a functionaldivision of the Police Department. The establishment of FCID was in accordance with Section 55 ofthe Police Ordinance and was approved by the Cabinet. The FCID operates under the exclusivesupervision and direction of the Inspector General of Police.
Right to Information Bill
As part of the Nineteenth Amendment, the Government has incorporated the right to information intothe Constitution through the insertion of provisions which ensure the freedom of speech, assembly andmovement as a fundamental right. Accordingly, every citizen has the right of access to informationrequired for the exercise or protection of the citizen’s rights where such information is held by theState, a Ministry, a Government Department or any statutory body created under the centralGovernment or provincial councils, any local authority or any other person as provided for by law. Thepurpose of the Right to Information Act is to provide the public with the right to access officialinformation for purposes of good governance, accountability and anti-corruption. Right to informationAct No. 12 of 2016 has been passed by the Parliament and a copy of the said Act is publicly available.The said Act has been effective from February 3, 2017.
Fiscal Management (Responsibility) Act
The Government introduced the Fiscal Management (Responsibility) Act, No.3 of 2003 (the “FMRA”)with a view to improving the management, transparency and accountability of fiscal operations. Inorder to fulfill the objective of transparency and accountability, the FMRA has specified severalreports to be presented to the Parliament and to the general public within a given time frame. Sincethe enactment of the FMRA, the Government has published these reports, which has improvedavailability and transparency of information regarding its budgetary operations.
Under the FMRA, the budget deficit was to be reduced to 5.0% of GDP by 2006 and maintained atthat level thereafter. The outstanding Government debt, as a percentage of GDP, was also to be reducedto 85.0% by 2006 and to 60.0% by the end of 2013. The targets were not met due to a number ofsignificant unforeseen and adverse events, such as the 2004 tsunami disaster, the escalation ofinternational commodity prices in 2007 and 2008 and the global economic crisis and intensifiedcounter terrorism activities in 2009. In addition to the negative impact that these events had on GDP,the Government had to respond to these events by implementing appropriate measures which had afurther negative impact on the performance of its budgetary operations. For example, in 2004, the
34
country was struck by a tsunami, which in total left more than 35,000 people dead and another 550,000people internally displaced. The tsunami devastated certain economic sectors in the country and lefta significant amount of infrastructure damaged or destroyed in its wake. As a result, the Governmentspent significant amounts of money rebuilding homes and infrastructure and reviving the localeconomies of the affected areas. The Government also funded demining resettlement, development andreconciliation activities relating to the country’s recently resolved internal conflict. In 2009, theGovernment also prioritized the provision of basic needs for internally displaced people, resettlementof such people and reconstruction and rehabilitation of conflict-affected infrastructure. Although thetargets set out in the FMRA relating to budget deficits were not achieved, the outstanding debt to GDPratio declined from 102.3% in 2003 to 70.8% by the end of 2013. In 2013, the FMRA was amendedand the target outstanding debt to GDP ratios was set at 80% for 2013 and 60% for 2020. Theoutstanding debt to GDP ratio declined to 71.3% in 2014 and increased to 77.6% in 2015, while thebudget deficit increased to 5.7% and 7.6% of GDP in 2014 and 2015, respectively. The outstandingdebt to GDP ratio remained at 79.3% in 2016, while the budget deficit declined to 5.4% of GDP in2016. According to the estimates for 2017, the budget deficit is expected to decline to 4.6% of GDPin 2017. Debt to GDP ratio is also expected to decline to 77.5% in 2017.
Other Reforms
Reforms on taxation and public service have also commenced, resulting in the significant increase oftax revenues as a percentage of the GDP. Investment incentives and related measures such as theremoval of administrative bottlenecks and streamlining of investment approval processes are beingimplemented and are expected to attract further foreign investments into the country in the future.
Reforms towards better Governance Structures:
• The Procurement Commission was appointed in 2015 and is now engaged in formulating newprocurement guidelines encompassing modern concepts such as e-procurements.
• The Right to Information Bill was passed by Parliament on June 24, 2016, and certified by theSpeaker on August 4, 2017. A copy of the Act is publicly available.
• The Government is in the process of introducing new legislation in the form of a National AuditAct which is expected to be implemented starting in early 2017.
Reforms towards Macroeconomic Stability:
• A modern Inland Revenue Act has been drafted under the advice of the IMF.
• Modernizing revenue administration and public financial management (includingimplementation of key IT systems such as the Revenue Administration Management InformationSystem (“RAMIS”), the Integrated Treasury Management Information System (“ITMIS”), andthe Automated System for Customs Data (“ASYCUDA ++”).
• The Ministry of Public Enterprises Development was established in 2015 which is entrusted withthe monitoring and supervision of the performance of public enterprises.
• The Finance Act No. 38 of 1971 is being reviewed in order to ascertain the legal reformsnecessary in the context of the new reform package, which includes the establishment of aholding company similar to “Temasek Holdings” of Singapore. The operation of this holdingcompany would be based on sound financial principles and market economics. The shares of thestate-owned business enterprises (“SOBEs”) will thereafter be transferred to a Public WealthTrust (“PWT”), where the Secretary to the Treasury, Ministry of Finance and the Governor of theCentral Bank will be the custodians. The PWT will be managed by a Board comprising ofmembers from civil societies, trade chambers and trade unions, each of whom will be nominatedby the Constitutional Council. The PWT will be answerable to Parliament. A new PublicEnterprise Act will be enacted to provide the necessary legal framework to this effect.
35
Reforms in the Business Environment:
• The National Medicines Regulatory Authority Act was passed in the Parliament in March 2015.
• The Ease of Doing Business Unit was established in the MOF in May 2015.
• Introduction of Information and Communication Technology (“ICT”) systems and ITMIS isexpected to be completed in 2017 while RAMIS commenced its operations in 2016.
• A new Securities and Exchange Commission Act is being drafted.
• Amendments to the Land (Restriction on Alienation) Act No. 38 of 2014 have been drafted andwill be submitted to Parliament.
• The establishment of an Agency for Development has been initiated.
• The establishment of an Agency for Foreign Trade has been initiated.
• The Micro Finance Act was ratified in early 2016 to provide the legislative network for ruralmicro-finance activities.
Key Legal Reforms identified in the Budget for 2016:
• Payment Guarantee Security Act.
• PWT.
• Colombo International Financial Center.
• Public Private Partnership Act.
• Inclusion of the National Water Supply and Drainage Board and CPC within the regulatoryframework of the Public Utilities Commission of Sri Lanka.
• Expanding the scope of the National Transport Commission Act to include regulations of threewheelers, taxis, school vans and cargo transportation vehicles.
Conclusion of Military Action against the LTTE and Resettlement, Development andReconciliation Activities
History
From 1983 to 2009, there were intermittent armed clashes between the Government and the LTTE.During this period, the LTTE assassinated Sri Lankan President R. Premadasa, former Prime Minsterof India Rajiv Gandhi and many other high ranking Sinhalese and Tamil politicians and leaders,including former Minister of Foreign Affairs, Lakshman Kadirgamar. The LTTE also seriously injuredPresident Kumaratunga in an unsuccessful assassination attempt just prior to the presidential electionin 1999. As a result, the LTTE has been classified as a terrorist organization by more than 32 nations,including the United States, the United Kingdom, Australia and India.
Resumption of Hostilities in 2006 and Defeat of the LTTE
A series of bombings and assassinations launched by the LTTE beginning in early 2006 resulted in theresumption of hostilities between the LTTE and the Government. The resumption of hostilities led toassassinations of Government officials as well as the deaths of hundreds of LTTE fighters and asignificant number of Government soldiers in a series of clashes.
36
During 2007, Government forces intensified their operations against the LTTE, resulting in theliberation and the restoration of peace in the Eastern Province. Military operations in the NorthernProvince began in March 2007. In May 2009, after a series of successful operations, the militarydefeated LTTE forces, thereby gaining full control of the Northern Province.
Resettlement, Development and Reconciliation Activities
From the time hostilities resumed in 2006 until the end of the conflict in May 2009, a large numberof people were displaced in the Eastern and Northern Provinces. Since defeating the LTTE andobtaining control over the Northern and Eastern Provinces, the Government has re-settled a largenumber of the internally displaced people as quickly as possible. The Government has completed theprocess of resettling IDPs and has almost completed de-mining activities. The rehabilitation of keyinfrastructure and encouragement of economic activity for the benefit of people in these two provincescontinues with substantial public investment, particularly in the Northern Province.
In the Eastern Province, the Government launched the Neganahira Navodaya (Eastern Resurgence)Program in 2007 in order to rehabilitate the Eastern Province and accelerate development. Thedamaged social and economic infrastructure of the Eastern Province was rehabilitated, in part throughthe removal of all land mines under the Negenahira Navodaya program. A number of large bridges inthe East including the Kinniya bridge, Sri Lanka’s longest bridge, linking Trincomalee with Kinniya,the Irakkandi bridge linking Trincomalee with Pulmodai and the Arugam Bay bridge connectingPottuvil, Arugam Bay and Panama were constructed at an aggregate cost of more than Rs. 7 billion.In addition, various road development projects, water supply schemes, electricity schemes andhousing schemes were implemented in the Eastern Province to facilitate reconstruction anddevelopment activities. The Government has resettled all internally displaced persons from the EasternProvince. Further, the bridges are also expected to connect the Eastern Province and the North CentralProvince to Jaffna linking the Trincomalee Port City to the Rajarata under the second North-Easterndevelopment corridor proposed by the Government.
Resettlement of the internally displaced persons from the Northern Province is one of theGovernment’s top priorities. There were 295,136 IDPs at the time the internal conflict ended in May2009. All of the IDPs have been resettled by the end of 2013, reflecting the strong effort taken by theGovernment to resettle IDPs, with the help of development partners and other stakeholders.
In May 2009, President Rajapaksa appointed the Presidential Task Force for Resettlement,Development and Security in the Northern Province. The Task Force was mandated to, among otherthings, prepare and oversee programs to resettle internally displaced persons and rehabilitate anddevelop the economic and social infrastructure of the Northern Province. The Presidential Directiveappointing the Task Force requires it to complete its mandate and report to the President within oneyear. The Task Force moved quickly to establish the Uthuru Wasanthaya (Northern Spring) programin mid-2009. The Uthuru Wasanthaya (Northern Spring) Program included a 180-day acceleratedtimetable to expedite the resettlement and rehabilitation process, and a parallel long term program forrehabilitation and development activities, including the development, construction and rehabilitationof roads, other transportation, electricity, housing, water supply, agriculture, and irrigation. Moneywas also expected to be allocated for poverty reduction and the reinforcement of the social safety net.The Government’s rehabilitation and reconstruction initiatives were implemented concurrently withextensive and ongoing de-mining activities in the Northern Province. From 2009 to 2014, theGovernment spent Rs. 325.0 billion (US$ 2.7 billion) towards rehabilitation and developmentactivities in the Northern Province.
The Government has encouraged the involvement of the private sector in the economic recovery of theEastern and Northern Provinces through an on-going development program. Major players in themanufacturing sectors have expanded their production capacities. Output from the agricultural sector,especially the fishing sub-sector, has increased as fishing restrictions imposed during the civil warwere removed. The expansion of the commercial banking network in the Northern and EasternProvinces has offered new opportunities to entrepreneurs.
37
The Central Bank opened its Northern Province regional office in Jaffna to encourage micro, small andmedium scale entrepreneurs to invest and expand by providing financial assistance. In addition, theCentral Bank commenced operations of its constructed regional office in Kilinochchi on May 6, 2015.The Central Bank also introduced a Credit Guarantee Scheme for the benefit of farmers in theKilinochchi, Mullaitivu and some parts of the Mannar district who have been facing difficulties inobtaining short-term cultivation loans due to their inability to provide title deeds to establish landrights/ownership through which the Central Bank will guarantee up to Rs.200,000 per farmer in caseof default arising due to a land ownership dispute. The scheme has encouraged banks to disburse morecultivation loans to farmers. The Central Bank has also arranged credit facilities for and providedentrepreneurship development services to resettled IDPs to restart their livelihood and conductedfinancial literacy programs to create awareness of the formal sector financial facilities and services.
In addition, a special low-interest loan scheme, named the “Awakening North Loan Scheme RevolvingFund”, was introduced in 2010 for residents of the Northern Province to develop income generatingactivities. Another loan scheme that provided financial assistance to repair damaged houses concludedin 2015 after the allocated funds were fully utilized. Similar activities have also been carried out bythe Central Bank’s eastern regional office at Trincomalee since 2010.
The Government has also encouraged the expansion of micro-finance activities, especially in theEastern and Northern Provinces, through the “Poverty Alleviation Microfinance Program”. Thisprogram is currently being implemented across Sri Lanka. In this regard, since May 2009, 356 bankingoutlets were established in the Northern Province and 411 banking outlets were established in theEastern Province. These banking outlets also include student savings units (“SSUs”). As at the end of2016, the Northern and Eastern Provinces had 981 banking outlets (including SSUs) and 447 ATMs.Furthermore, as at the end of 2016, there were 1,125 licensed finance companies (“LFCs”) and 88specialized leasing company (“SLC”) outlets.
The Government is committed to the restoration of democracy in the two provinces. Local governmentelections were held in the Batticaloa District in March 2008, and Provincial Council elections wereheld in the Eastern Province in May 2008. Provincial Council Ministers were appointed, and a formerTamil child combatant became the Chief Minister of the Eastern Province.
The elections for Jaffna Municipal Council and the Vavuniya Urban Council were held in August 2009.Local government elections for most of the remaining local authorities in the Northern and EasternProvinces were held in March 2011, with the balance held in July 2011. The second Eastern ProvincialCouncil election was held in 2012. In September 2013, the Provincial Council elections for theNorthern Province were held.
The Government expects the end of the 26-year long internal conflict to have a significant positiveeconomic impact, not just on the Northern and Eastern Provinces, but also on the entire country asthese two regions integrate with the national economy. The Northern and Eastern Provinces havesubstantial natural resources, including long, scenic and unpolluted beaches and ecologicalconservation areas that can support a vibrant tourism industry. The modernization of existingcroplands, livestock farms and fisheries should help boost the regional economies. The contributionto the country’s GDP by the Eastern Province increased to 6.0% in 2014 from 5.8% in 2009 while thatof the Northern Province increased to 3.6% in 2014 from 3.2% in 2009.
On March 27, 2014, the UN Human Rights Council (“UNHRC”) passed a resolution calling for a probeinto the final stages of the LTTE conflict. Subsequently, after pledging to conduct a domestic inquiryinto allegations by the UNHRC of war crimes on both sides in the final stages of the conflict, the newGovernment under President Sirisena achieved a six-month deferral of the UNHRC report against SriLanka that had been due on March 25, 2015.
The Government is currently exploring steps to examine alleged incidents of violations of humanrights that warrant further investigations and criminal justice responses. The Government has initiateddiscussions regarding mechanisms to be introduced for this purpose.
38
Furthermore, based upon recommendations made in the interim report submitted to President Sirisenaby the PCICMP, four teams will be appointed to investigate complaints recorded by the PCICMP. Inthe meantime, to expedite the reconciliation process, the Government is also reviewing the list ofindividuals and entities representing the Tamil diaspora that were banned by the previous government.The Government has also incorporated the right to information into the Constitution as part of theNineteenth Amendment to safeguard the basic rights of the Sri Lankan people and democracy in SriLanka.
International Relations
Sri Lanka has been following a non-aligned foreign policy even before its independence. It was alsoone of the founding members of the Non-Aligned Movement (“NAM”) which hosted theNAM-Colombo summit of 1976. Sri Lanka was a founding member of both the General Agreement onTariffs and Trade as well as the World Trade Organization (the “WTO”). The trade policy objectivesof Sri Lanka are aimed at developing an outward-oriented trade regime following the principles of theWTO, with the goal of increasing overseas market access for Sri Lanka’s products through greaterintegration into the world economy. These policies have helped the country to benefit from everincreasing global demand and new technological developments. Sri Lanka continues to encourage FDIinto the country to expand output and employment and encourage the transfer of skills and knowledge.Sri Lanka is actively engaged in negotiations at the multilateral, regional and bilateral levels toaccomplish its policy objectives.
The new administration is determined to continue Sri Lanka’s non-aligned foreign policy and tostrengthen its cooperation with all countries and international organizations that extend support to SriLanka’s communities. The Government believes that Sri Lanka’s non-aligned foreign policy ispragmatic and results in the most improvement to the livelihoods of the Sri Lankan people. Withrespect to regional and bilateral relationships, Sri Lanka has made considerable progress in furtheringits liberalization arrangements in recent years.
Under the new administration, Sri Lanka has entered into bilateral agreements and has had seniorofficial visits with India, the United Kingdom, China, Pakistan and the United States. Sri Lanka hasentered into several bilateral agreements with India, including the agreement between the RBI and theCentral Bank to establish a currency swap worth US$ 1.5 billion to stabilize the Sri Lankan Rupee,a US$ 318 million credit line to assist development of Sri Lanka Railways and an agreement onnuclear energy. To discuss trade related issues under the Indo-Sri Lanka Free Trade Agreement(“ISFTA”), the third Commerce Secretary Level meeting was held in March 2015. At the meeting, adecision was made to compile a list of non-tariff barriers faced by Sri Lanka in the Indian market tobe submitted to the Indian authorities and to review the negative lists under the ISLFTA toaccommodate various industry concerns. The ISFTA is expected to be reinforced through the inclusionof the services sector and by creating more investment opportunities through the proposed Economicand Technology Cooperation Agreement (“ETCA”). Negotiations on the ETCA are expected to deepenthe current ISFTA on goods, technology cooperation, economic cooperation, liberalising services andinvestments. The preliminary official level discussions started in August 2016, where the two partieshad only explored the broader scope of ETCA and the areas that would be considered within theframework. The negotiations continued in September 2016 and January 2017, after which theGovernment expects to finalize negotiations before the end of 2017. The Memorandum ofUnderstanding (“MOU”) on initiating the negotiations of the China-Sri Lanka Free Trade Agreement(“CSFTA”) was signed in September 2014. The CSFTA covers trade in goods and services, investment,and economic and technical cooperation. The first and the second round of negotiations were held inSeptember 2014 and in November 2014, respectively. The third and fourth rounds of negotiations wereheld in August 2016 and in November 2016, respectively. The fifth and sixth rounds were held inJanuary 2017 and in March 2017, respectively. Sri Lanka also signed several agreements with China,including agreements on cooperation for special aid in public health, development of water treatmentmethods and technologies in areas affected by kidney diseases and research and development relatedto the coconut industry. With Pakistan, Sri Lanka recently signed six agreements, which provide foradditional frameworks to cooperate in disaster management, sports, shipping, atomic energy,anti-narcotics and academia. During the US Secretary of State’s recent visit to Sri Lanka in May 2015,the Governments of Sri Lanka and the United States announced an annual partnership dialogue, which
39
is expected to deepen ties between the two countries. Further, Sri Lanka and Singapore announced inJune 2016 that both countries are keen to pursue a comprehensive Free Trade Agreement (“FTA”). ThisFTA expects to focus on export-led growth, employment generation, expanding market to attractinvestments with technical know-how and expertise, and the usage of supply chain linkages of bothcountries. A feasibility study carried out by both parties was followed by a scoping mission fromSingapore in July 2016, for initial discussions with relevant institutions on the scope and coverage ofthe proposed FTA. The first three rounds of negotiations were held in 2016 and another two roundswere held in January and April 2017. FTAs with both China and Singapore are expected to be finalizedduring 2017. With respect to the EU, the Government is currently working towards regaining its GSP+trade status. The GSP+ trade status had been withdrawn in August 2010 due to allegations of theprevious government not complying with certain eligibility criteria such as implementation ofinternational human rights conventions. More recently, the EU has been evaluating the potential togrant Sri Lanka the GSP+ status under a special monitoring process. The application for regaining theEU-GSP+ facility was submitted to the European Commission (“EC”) in July 2016. After a thoroughreview process, in January 2017, the EC proposed to reinstate the EU-GSP+ in exchange of SriLanka’s commitment to ratify and effectively implement 27 international conventions related tohuman rights, labor rights, protection of the environment and good governance, while allowing the EUParliament to raise any potential objections within a period of four months. The Government expectsthe GSP+ status to be reinstated by the first half of 2017. The GSP offered by the United States, whichprovides duty free entry into the United States for nearly 5,000 products, from 122 beneficiarycountries, including Sri Lanka, was re-authorized in June 2015 and will remain valid until December31, 2017. Meanwhile, the 12th council meeting of the Trade and Investment Framework Agreement(“TIFA”) between the United States and Sri Lanka was held in April 2016 in Washington DC, UnitedStates. During the deliberation, the two governments adopted a US-Sri Lanka Joint Action Plan, whichfocused on reforming Sri Lanka’s trade and investment regime to match global standards, improvingthe competitiveness of Sri Lanka’s current exports and developing new markets to boost trade andinvestment between Sri Lanka and the United States over a period of five years. An inter-sessionalTIFA Council meeting was held in September 2016 in Colombo, with the agreement of a wide-rangingimplementation plan, mainly to support Sri Lanka’s goal to serve as a regional services hub. Sri Lankaalso benefits through GSP schemes granted by several other countries, including Japan and Norway.The tariff concessions offered under the above FTAs and the GSP Schemes implemented by the EU,the US and a number of other trading partners have increased trade with these countries.
The following table shows the Government’s capital participation in, and loans obtained from, majorinternational financial organizations.
MEMBERSHIP IN INTERNATIONAL FINANCIAL ORGANIZATIONS
Name of Organization
Date of
Admission Subscribed
Capital Paid
In
Loans
Outstanding
(at December
31, 2016)
Loans
Outstanding
(at March 31,
2017)
(in millions)
International Monetary Fund ........ 1950 SDR413.4 SDR47.9 SDR412 SDR343International Development
Agency ..................................... 1950 US$463.8 US$56.2 US$3,803 N/AAsian Development Bank(1) .......... 1966 US$317.6 US$84.1 US$2,788 N/A
Source: The IMF, the Asian Development Bank and the World Bank
40
Sri Lanka is now an active member of the Commonwealth, the SAARC, the WTO, the World Bank andthe IMF. Sri Lanka has also made commitments under the General Agreement of Trade in Services (the“GATS”) in relation to insurance, telecommunications, tourism and financial services. Sri Lankapromotes its economic interests through its membership in the following regional, bilateral tradeagreements and other international arrangements:
• Bay of Bengal Initiative for Multi-Sectoral, Technical and Economic Co-operation
• South Asian Preferential Trading Agreement
• South Asian Free Trade Agreement (“SAFTA”)
• Global System of Trade Preferences (“GSTP”)
• Generalized System of Preferences (“GSPs”) offered by the EU, the United States, Australia,Canada, Japan, New Zealand, Russia, Turkey, Norway and Switzerland
• India-Sri Lanka Free Trade Agreement
• Pakistan-Sri Lanka Free Trade Agreement
• Asia Pacific Trade Agreement (“APTA”)
• Trade and Investment Framework Agreement between the United States and Sri Lanka (“TIFA”)
• Joint Commission on Economic Cooperation with EU, Russia, Iran, Belarus, Turkey, Bangladesh,Egypt, Kuwait, Pakistan, Iraq, Kenya, Qatar, China and Vietnam
• World Trade Organization
• Asia Cooperation Dialogue
• Colombo Plan
• Indian Ocean Rim Association for Regional Co-operation
• United Nations Conference on Trade and Development
Sri Lanka was one of the first countries to speak out in global forums on the necessity for acoordinated global effort to combat terrorism. Sri Lanka has also introduced legislation to counter thefinancing of terrorism and combating money laundering by enacting the Convention on theSuppression of Terrorist Financing Act, No. 25 of 2005 and the Prevention of Money Laundering Act,No. 5 of 2006, respectively. This legislation was subsequently amended as the Prevention of MoneyLaundering (Amendment) Act No. 40 of 2011 and the Convention on Suppression of TerroristFinancing (Amendment) Act No. 41 of 2011, incorporating recommendations made by the FinancialAction Task Force (“FATF”) and the Asia Pacific Group on Money Laundering (“APG”) in theirMutual Evaluation conducted in 2006. The Financial Intelligence Unit was established in 2006 underthe Financial Transactions Reporting Act No 6 of 2006 with regulatory powers and a mandate toformulate policies and guidelines in line with international standards and recommendations.
41
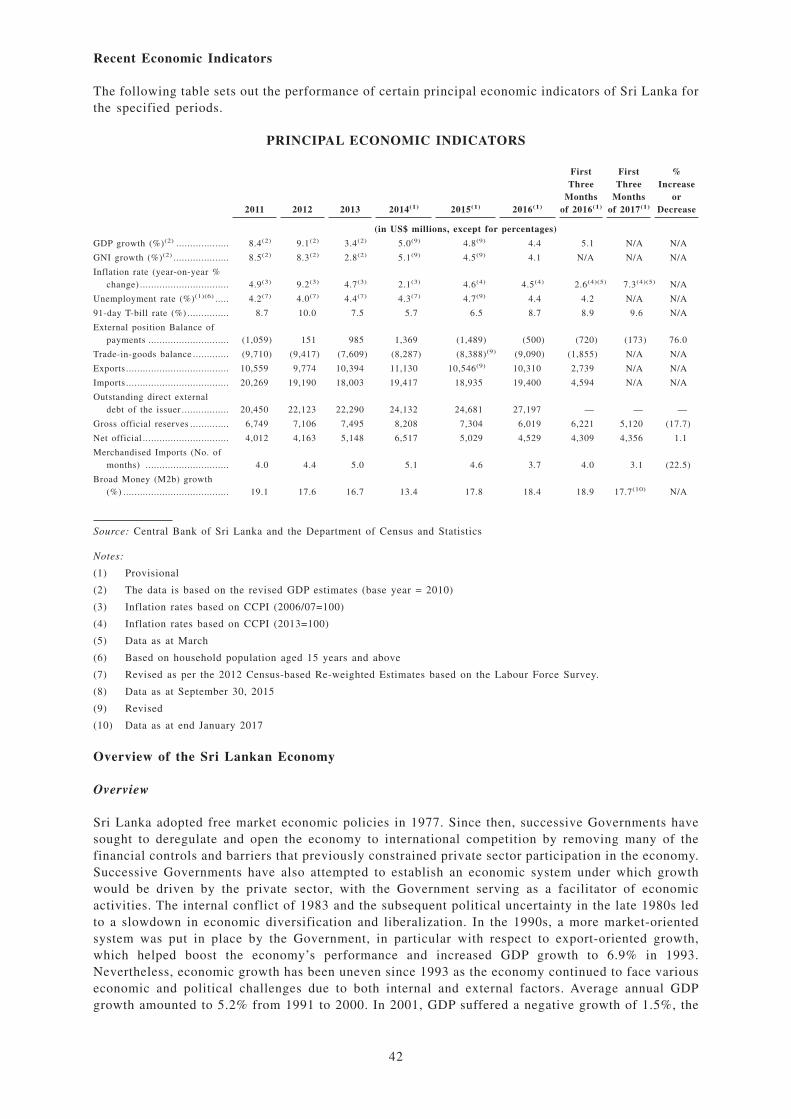
Recent Economic Indicators
The following table sets out the performance of certain principal economic indicators of Sri Lanka forthe specified periods.
PRINCIPAL ECONOMIC INDICATORS
2011 2012 2013 2014(1) 2015(1) 2016(1)
FirstThree
Monthsof 2016(1)
FirstThree
Monthsof 2017(1)
%Increase
orDecrease
(in US$ millions, except for percentages)
GDP growth (%)(2) ................... 8.4(2) 9.1(2) 3.4(2) 5.0(9) 4.8(9) 4.4 5.1 N/A N/A
GNI growth (%)(2) .................... 8.5(2) 8.3(2) 2.8(2) 5.1(9) 4.5(9) 4.1 N/A N/A N/A
Inflation rate (year-on-year %change) ................................ 4.9(3) 9.2(3) 4.7(3) 2.1(3) 4.6(4) 4.5(4) 2.6(4)(5) 7.3(4)(5) N/A
Unemployment rate (%)(1)(6) ..... 4.2(7) 4.0(7) 4.4(7) 4.3(7) 4.7(9) 4.4 4.2 N/A N/A
91-day T-bill rate (%) ............... 8.7 10.0 7.5 5.7 6.5 8.7 8.9 9.6 N/A
External position Balance ofpayments ............................. (1,059) 151 985 1,369 (1,489) (500) (720) (173) 76.0
Trade-in-goods balance ............. (9,710) (9,417) (7,609) (8,287) (8,388)(9) (9,090) (1,855) N/A N/A
Exports ..................................... 10,559 9,774 10,394 11,130 10,546(9) 10,310 2,739 N/A N/A
Imports ..................................... 20,269 19,190 18,003 19,417 18,935 19,400 4,594 N/A N/A
Outstanding direct externaldebt of the issuer ................. 20,450 22,123 22,290 24,132 24,681 27,197 — — —
Gross official reserves .............. 6,749 7,106 7,495 8,208 7,304 6,019 6,221 5,120 (17.7)
Net official ............................... 4,012 4,163 5,148 6,517 5,029 4,529 4,309 4,356 1.1
Merchandised Imports (No. ofmonths) .............................. 4.0 4.4 5.0 5.1 4.6 3.7 4.0 3.1 (22.5)
Broad Money (M2b) growth(%) ...................................... 19.1 17.6 16.7 13.4 17.8 18.4 18.9 17.7(10) N/A
Source: Central Bank of Sri Lanka and the Department of Census and Statistics
Notes:
(1) Provisional
(2) The data is based on the revised GDP estimates (base year = 2010)
(3) Inflation rates based on CCPI (2006/07=100)
(4) Inflation rates based on CCPI (2013=100)
(5) Data as at March
(6) Based on household population aged 15 years and above
(7) Revised as per the 2012 Census-based Re-weighted Estimates based on the Labour Force Survey.
(8) Data as at September 30, 2015
(9) Revised
(10) Data as at end January 2017
Overview of the Sri Lankan Economy
Overview
Sri Lanka adopted free market economic policies in 1977. Since then, successive Governments havesought to deregulate and open the economy to international competition by removing many of thefinancial controls and barriers that previously constrained private sector participation in the economy.Successive Governments have also attempted to establish an economic system under which growthwould be driven by the private sector, with the Government serving as a facilitator of economicactivities. The internal conflict of 1983 and the subsequent political uncertainty in the late 1980s ledto a slowdown in economic diversification and liberalization. In the 1990s, a more market-orientedsystem was put in place by the Government, in particular with respect to export-oriented growth,which helped boost the economy’s performance and increased GDP growth to 6.9% in 1993.Nevertheless, economic growth has been uneven since 1993 as the economy continued to face variouseconomic and political challenges due to both internal and external factors. Average annual GDPgrowth amounted to 5.2% from 1991 to 2000. In 2001, GDP suffered a negative growth of 1.5%, the
42
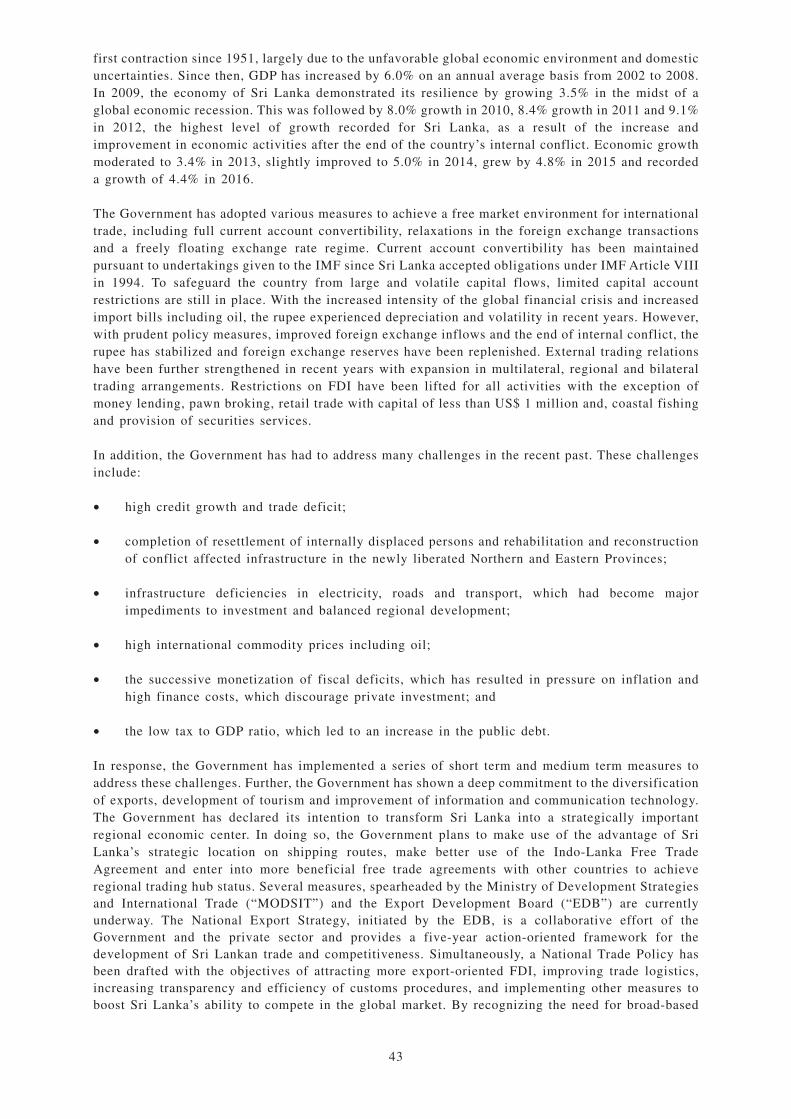
first contraction since 1951, largely due to the unfavorable global economic environment and domesticuncertainties. Since then, GDP has increased by 6.0% on an annual average basis from 2002 to 2008.In 2009, the economy of Sri Lanka demonstrated its resilience by growing 3.5% in the midst of aglobal economic recession. This was followed by 8.0% growth in 2010, 8.4% growth in 2011 and 9.1%in 2012, the highest level of growth recorded for Sri Lanka, as a result of the increase andimprovement in economic activities after the end of the country’s internal conflict. Economic growthmoderated to 3.4% in 2013, slightly improved to 5.0% in 2014, grew by 4.8% in 2015 and recordeda growth of 4.4% in 2016.
The Government has adopted various measures to achieve a free market environment for internationaltrade, including full current account convertibility, relaxations in the foreign exchange transactionsand a freely floating exchange rate regime. Current account convertibility has been maintainedpursuant to undertakings given to the IMF since Sri Lanka accepted obligations under IMF Article VIIIin 1994. To safeguard the country from large and volatile capital flows, limited capital accountrestrictions are still in place. With the increased intensity of the global financial crisis and increasedimport bills including oil, the rupee experienced depreciation and volatility in recent years. However,with prudent policy measures, improved foreign exchange inflows and the end of internal conflict, therupee has stabilized and foreign exchange reserves have been replenished. External trading relationshave been further strengthened in recent years with expansion in multilateral, regional and bilateraltrading arrangements. Restrictions on FDI have been lifted for all activities with the exception ofmoney lending, pawn broking, retail trade with capital of less than US$ 1 million and, coastal fishingand provision of securities services.
In addition, the Government has had to address many challenges in the recent past. These challengesinclude:
• high credit growth and trade deficit;
• completion of resettlement of internally displaced persons and rehabilitation and reconstructionof conflict affected infrastructure in the newly liberated Northern and Eastern Provinces;
• infrastructure deficiencies in electricity, roads and transport, which had become majorimpediments to investment and balanced regional development;
• high international commodity prices including oil;
• the successive monetization of fiscal deficits, which has resulted in pressure on inflation andhigh finance costs, which discourage private investment; and
• the low tax to GDP ratio, which led to an increase in the public debt.
In response, the Government has implemented a series of short term and medium term measures toaddress these challenges. Further, the Government has shown a deep commitment to the diversificationof exports, development of tourism and improvement of information and communication technology.The Government has declared its intention to transform Sri Lanka into a strategically importantregional economic center. In doing so, the Government plans to make use of the advantage of SriLanka’s strategic location on shipping routes, make better use of the Indo-Lanka Free TradeAgreement and enter into more beneficial free trade agreements with other countries to achieveregional trading hub status. Several measures, spearheaded by the Ministry of Development Strategiesand International Trade (“MODSIT”) and the Export Development Board (“EDB”) are currentlyunderway. The National Export Strategy, initiated by the EDB, is a collaborative effort of theGovernment and the private sector and provides a five-year action-oriented framework for thedevelopment of Sri Lankan trade and competitiveness. Simultaneously, a National Trade Policy hasbeen drafted with the objectives of attracting more export-oriented FDI, improving trade logistics,increasing transparency and efficiency of customs procedures, and implementing other measures toboost Sri Lanka’s ability to compete in the global market. By recognizing the need for broad-based
43
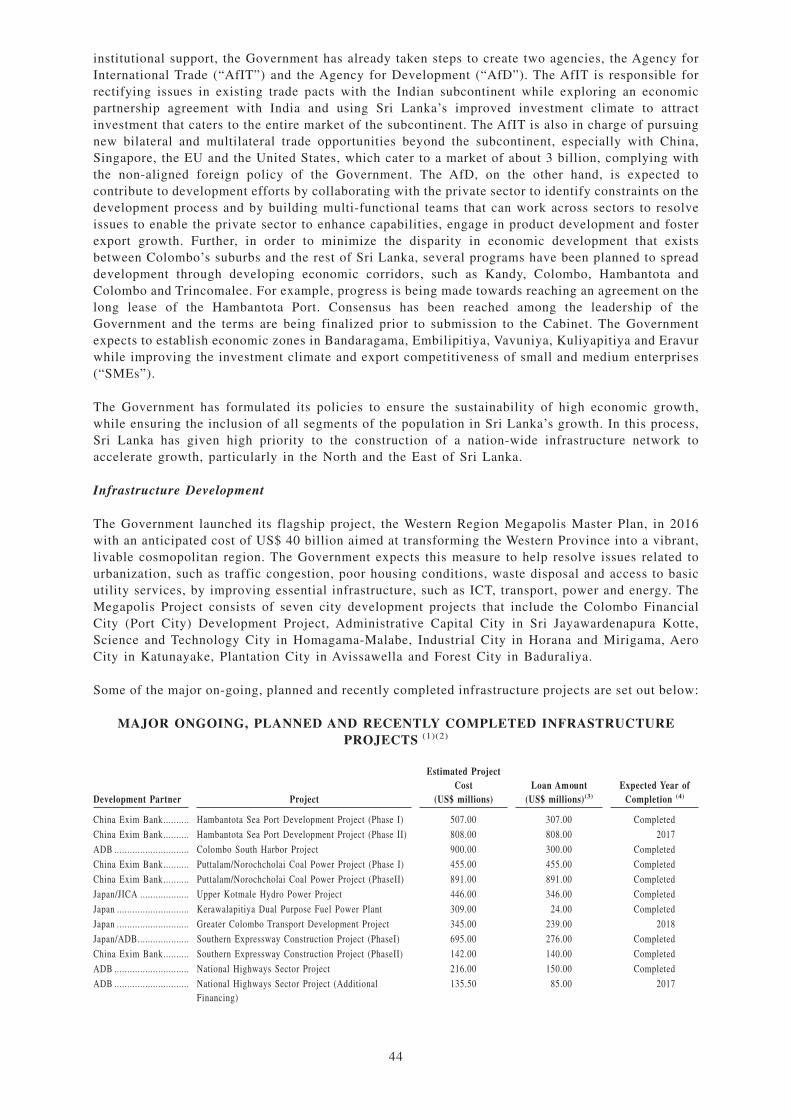
institutional support, the Government has already taken steps to create two agencies, the Agency forInternational Trade (“AfIT”) and the Agency for Development (“AfD”). The AfIT is responsible forrectifying issues in existing trade pacts with the Indian subcontinent while exploring an economicpartnership agreement with India and using Sri Lanka’s improved investment climate to attractinvestment that caters to the entire market of the subcontinent. The AfIT is also in charge of pursuingnew bilateral and multilateral trade opportunities beyond the subcontinent, especially with China,Singapore, the EU and the United States, which cater to a market of about 3 billion, complying withthe non-aligned foreign policy of the Government. The AfD, on the other hand, is expected tocontribute to development efforts by collaborating with the private sector to identify constraints on thedevelopment process and by building multi-functional teams that can work across sectors to resolveissues to enable the private sector to enhance capabilities, engage in product development and fosterexport growth. Further, in order to minimize the disparity in economic development that existsbetween Colombo’s suburbs and the rest of Sri Lanka, several programs have been planned to spreaddevelopment through developing economic corridors, such as Kandy, Colombo, Hambantota andColombo and Trincomalee. For example, progress is being made towards reaching an agreement on thelong lease of the Hambantota Port. Consensus has been reached among the leadership of theGovernment and the terms are being finalized prior to submission to the Cabinet. The Governmentexpects to establish economic zones in Bandaragama, Embilipitiya, Vavuniya, Kuliyapitiya and Eravurwhile improving the investment climate and export competitiveness of small and medium enterprises(“SMEs”).
The Government has formulated its policies to ensure the sustainability of high economic growth,while ensuring the inclusion of all segments of the population in Sri Lanka’s growth. In this process,Sri Lanka has given high priority to the construction of a nation-wide infrastructure network toaccelerate growth, particularly in the North and the East of Sri Lanka.
Infrastructure Development
The Government launched its flagship project, the Western Region Megapolis Master Plan, in 2016with an anticipated cost of US$ 40 billion aimed at transforming the Western Province into a vibrant,livable cosmopolitan region. The Government expects this measure to help resolve issues related tourbanization, such as traffic congestion, poor housing conditions, waste disposal and access to basicutility services, by improving essential infrastructure, such as ICT, transport, power and energy. TheMegapolis Project consists of seven city development projects that include the Colombo FinancialCity (Port City) Development Project, Administrative Capital City in Sri Jayawardenapura Kotte,Science and Technology City in Homagama-Malabe, Industrial City in Horana and Mirigama, AeroCity in Katunayake, Plantation City in Avissawella and Forest City in Baduraliya.
Some of the major on-going, planned and recently completed infrastructure projects are set out below:
MAJOR ONGOING, PLANNED AND RECENTLY COMPLETED INFRASTRUCTUREPROJECTS (1)(2)
Development Partner Project
Estimated ProjectCost
(US$ millions)Loan Amount
(US$ millions)(3)
Expected Year ofCompletion (4)
China Exim Bank.......... Hambantota Sea Port Development Project (Phase I) 507.00 307.00 Completed
China Exim Bank.......... Hambantota Sea Port Development Project (Phase II) 808.00 808.00 2017
ADB ............................. Colombo South Harbor Project 900.00 300.00 Completed
China Exim Bank.......... Puttalam/Norochcholai Coal Power Project (Phase I) 455.00 455.00 Completed
China Exim Bank.......... Puttalam/Norochcholai Coal Power Project (PhaseII) 891.00 891.00 Completed
Japan/JICA ................... Upper Kotmale Hydro Power Project 446.00 346.00 Completed
Japan ............................ Kerawalapitiya Dual Purpose Fuel Power Plant 309.00 24.00 Completed
Japan ............................ Greater Colombo Transport Development Project 345.00 239.00 2018
Japan/ADB.................... Southern Expressway Construction Project (PhaseI) 695.00 276.00 Completed
China Exim Bank.......... Southern Expressway Construction Project (PhaseII) 142.00 140.00 Completed
ADB ............................. National Highways Sector Project 216.00 150.00 Completed
ADB ............................. National Highways Sector Project (AdditionalFinancing)
135.50 85.00 2017
44
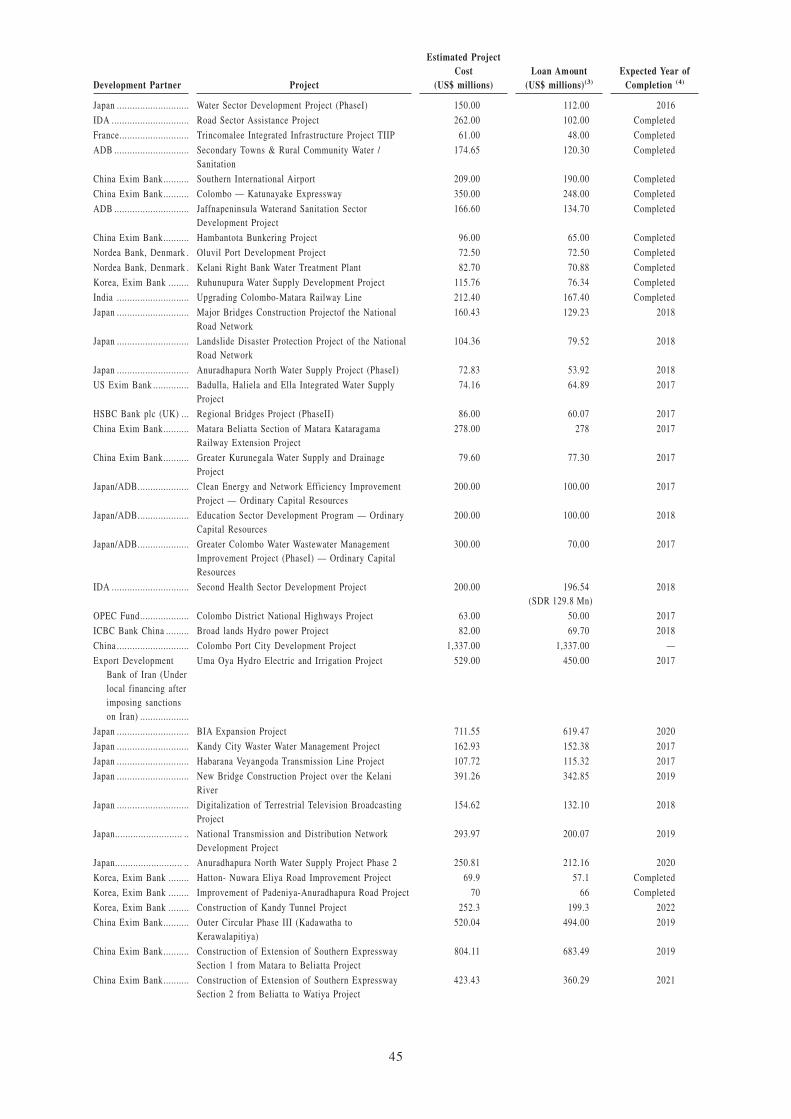
Development Partner Project
Estimated ProjectCost
(US$ millions)Loan Amount
(US$ millions)(3)
Expected Year ofCompletion (4)
Japan ............................ Water Sector Development Project (PhaseI) 150.00 112.00 2016
IDA .............................. Road Sector Assistance Project 262.00 102.00 Completed
France........................... Trincomalee Integrated Infrastructure Project TIIP 61.00 48.00 Completed
ADB ............................. Secondary Towns & Rural Community Water /Sanitation
174.65 120.30 Completed
China Exim Bank.......... Southern International Airport 209.00 190.00 Completed
China Exim Bank.......... Colombo — Katunayake Expressway 350.00 248.00 Completed
ADB ............................. Jaffnapeninsula Waterand Sanitation SectorDevelopment Project
166.60 134.70 Completed
China Exim Bank.......... Hambantota Bunkering Project 96.00 65.00 Completed
Nordea Bank, Denmark . Oluvil Port Development Project 72.50 72.50 Completed
Nordea Bank, Denmark . Kelani Right Bank Water Treatment Plant 82.70 70.88 Completed
Korea, Exim Bank ........ Ruhunupura Water Supply Development Project 115.76 76.34 Completed
India ............................ Upgrading Colombo-Matara Railway Line 212.40 167.40 Completed
Japan ............................ Major Bridges Construction Projectof the NationalRoad Network
160.43 129.23 2018
Japan ............................ Landslide Disaster Protection Project of the NationalRoad Network
104.36 79.52 2018
Japan ............................ Anuradhapura North Water Supply Project (PhaseI) 72.83 53.92 2018
US Exim Bank .............. Badulla, Haliela and Ella Integrated Water SupplyProject
74.16 64.89 2017
HSBC Bank plc (UK) ... Regional Bridges Project (PhaseII) 86.00 60.07 2017
China Exim Bank.......... Matara Beliatta Section of Matara KataragamaRailway Extension Project
278.00 278 2017
China Exim Bank.......... Greater Kurunegala Water Supply and DrainageProject
79.60 77.30 2017
Japan/ADB.................... Clean Energy and Network Efficiency ImprovementProject — Ordinary Capital Resources
200.00 100.00 2017
Japan/ADB.................... Education Sector Development Program — OrdinaryCapital Resources
200.00 100.00 2018
Japan/ADB.................... Greater Colombo Water Wastewater ManagementImprovement Project (PhaseI) — Ordinary CapitalResources
300.00 70.00 2017
IDA .............................. Second Health Sector Development Project 200.00 196.54(SDR 129.8 Mn)
2018
OPEC Fund................... Colombo District National Highways Project 63.00 50.00 2017
ICBC Bank China ......... Broad lands Hydro power Project 82.00 69.70 2018
China ............................ Colombo Port City Development Project 1,337.00 1,337.00 —
Export DevelopmentBank of Iran (Underlocal financing afterimposing sanctionson Iran) ...................
Uma Oya Hydro Electric and Irrigation Project 529.00 450.00 2017
Japan ............................ BIA Expansion Project 711.55 619.47 2020
Japan ............................ Kandy City Waster Water Management Project 162.93 152.38 2017
Japan ............................ Habarana Veyangoda Transmission Line Project 107.72 115.32 2017
Japan ............................ New Bridge Construction Project over the KelaniRiver
391.26 342.85 2019
Japan ............................ Digitalization of Terrestrial Television BroadcastingProject
154.62 132.10 2018
Japan.......................... .. National Transmission and Distribution NetworkDevelopment Project
293.97 200.07 2019
Japan.......................... .. Anuradhapura North Water Supply Project Phase 2 250.81 212.16 2020
Korea, Exim Bank ........ Hatton- Nuwara Eliya Road Improvement Project 69.9 57.1 Completed
Korea, Exim Bank ........ Improvement of Padeniya-Anuradhapura Road Project 70 66 Completed
Korea, Exim Bank ........ Construction of Kandy Tunnel Project 252.3 199.3 2022
China Exim Bank.......... Outer Circular Phase III (Kadawatha toKerawalapitiya)
520.04 494.00 2019
China Exim Bank.......... Construction of Extension of Southern ExpresswaySection 1 from Matara to Beliatta Project
804.11 683.49 2019
China Exim Bank.......... Construction of Extension of Southern ExpresswaySection 2 from Beliatta to Watiya Project
423.43 360.29 2021
45
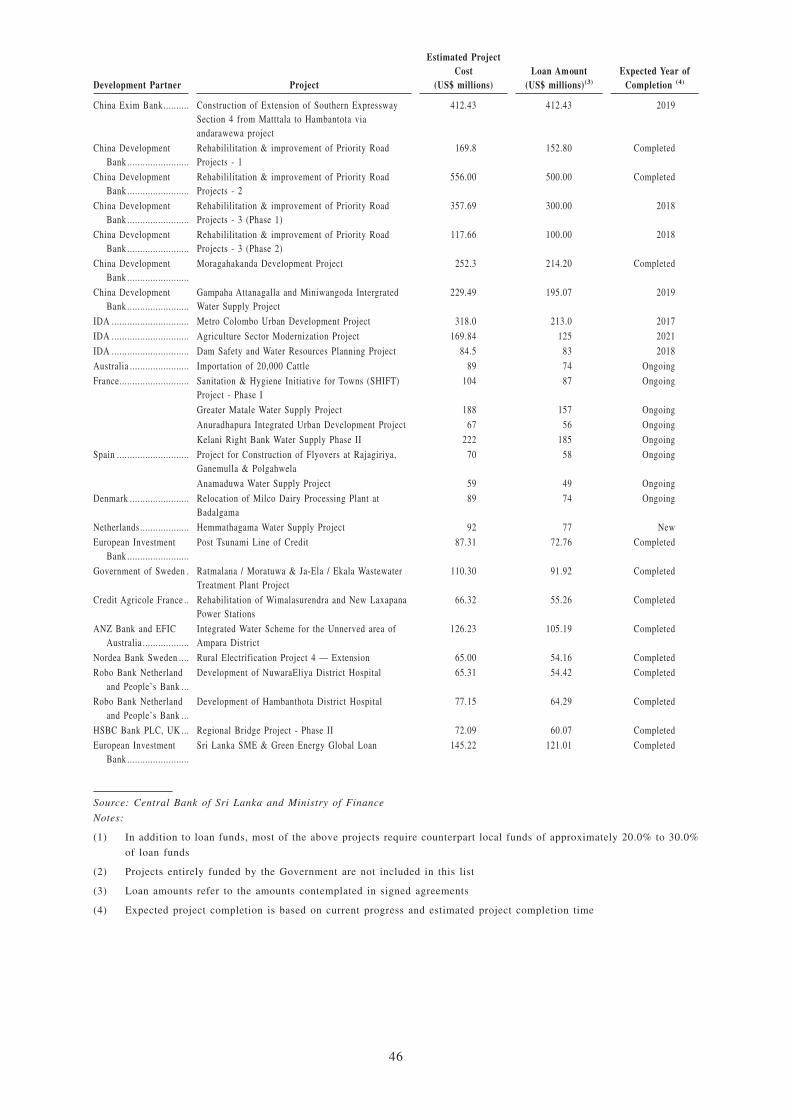
Development Partner Project
Estimated ProjectCost
(US$ millions)Loan Amount
(US$ millions)(3)
Expected Year ofCompletion (4)
China Exim Bank.......... Construction of Extension of Southern ExpresswaySection 4 from Matttala to Hambantota viaandarawewa project
412.43 412.43 2019
China DevelopmentBank ........................
Rehabililitation & improvement of Priority RoadProjects - 1
169.8 152.80 Completed
China DevelopmentBank ........................
Rehabililitation & improvement of Priority RoadProjects - 2
556.00 500.00 Completed
China DevelopmentBank ........................
Rehabililitation & improvement of Priority RoadProjects - 3 (Phase 1)
357.69 300.00 2018
China DevelopmentBank ........................
Rehabililitation & improvement of Priority RoadProjects - 3 (Phase 2)
117.66 100.00 2018
China DevelopmentBank ........................
Moragahakanda Development Project 252.3 214.20 Completed
China DevelopmentBank ........................
Gampaha Attanagalla and Miniwangoda IntergratedWater Supply Project
229.49 195.07 2019
IDA .............................. Metro Colombo Urban Development Project 318.0 213.0 2017
IDA .............................. Agriculture Sector Modernization Project 169.84 125 2021
IDA .............................. Dam Safety and Water Resources Planning Project 84.5 83 2018
Australia ....................... Importation of 20,000 Cattle 89 74 Ongoing
France........................... Sanitation & Hygiene Initiative for Towns (SHIFT)Project - Phase I
104 87 Ongoing
Greater Matale Water Supply Project 188 157 Ongoing
Anuradhapura Integrated Urban Development Project 67 56 Ongoing
Kelani Right Bank Water Supply Phase II 222 185 Ongoing
Spain ............................ Project for Construction of Flyovers at Rajagiriya,Ganemulla & Polgahwela
70 58 Ongoing
Anamaduwa Water Supply Project 59 49 Ongoing
Denmark ....................... Relocation of Milco Dairy Processing Plant atBadalgama
89 74 Ongoing
Netherlands................... Hemmathagama Water Supply Project 92 77 New
European InvestmentBank ........................
Post Tsunami Line of Credit 87.31 72.76 Completed
Government of Sweden . Ratmalana / Moratuwa & Ja-Ela / Ekala WastewaterTreatment Plant Project
110.30 91.92 Completed
Credit Agricole France .. Rehabilitation of Wimalasurendra and New LaxapanaPower Stations
66.32 55.26 Completed
ANZ Bank and EFICAustralia ..................
Integrated Water Scheme for the Unnerved area ofAmpara District
126.23 105.19 Completed
Nordea Bank Sweden .... Rural Electrification Project 4 — Extension 65.00 54.16 Completed
Robo Bank Netherlandand People’s Bank ...
Development of NuwaraEliya District Hospital 65.31 54.42 Completed
Robo Bank Netherlandand People’s Bank ...
Development of Hambanthota District Hospital 77.15 64.29 Completed
HSBC Bank PLC, UK ... Regional Bridge Project - Phase II 72.09 60.07 Completed
European InvestmentBank ........................
Sri Lanka SME & Green Energy Global Loan 145.22 121.01 Completed
Source: Central Bank of Sri Lanka and Ministry of Finance
Notes:
(1) In addition to loan funds, most of the above projects require counterpart local funds of approximately 20.0% to 30.0%
of loan funds
(2) Projects entirely funded by the Government are not included in this list
(3) Loan amounts refer to the amounts contemplated in signed agreements
(4) Expected project completion is based on current progress and estimated project completion time
46
The importance of improving economic and social infrastructure, which is essential to achievingsustained high economic growth and to raise living standards of its citizens, has been well recognizedby the Government and hence, it continues to remain an integral part of the overall development drive.Benefiting from continuous investments, a gradual improvement can be observed over the years in thecountry’s economic infrastructure, which includes, among others, power, transport, roads, highways,ports, water supply and telecommunications. However, the demand for these facilities continues toincrease, requiring further investments. Simultaneously, Sri Lanka has achieved significantimprovements in human development, due to the efforts made by successive Governments on theprovision of social infrastructure, particularly education and health.
The Government undertook several rehabilitation projects of Sri Lanka’s railway network, whichincludes extending the railway lines to Jaffna and Mannar while developing new port and airportfacilities as well as rehabilitating existing facilities. The Northern Road Connectivity Project,implemented by the Government to rehabilitate and improve link roads in the Northern region,rehabilitated 169.9 km of national highways consisting of 128.5 kilometers of Class A roads and 41.4kilometers of Class B roads in the Northern Province and North Central Province. In addition, thei-ROAD programme, which intends to rehabilitate selected rural and national roads in the Southern,Sabaragamuwa, Central, North Central, North Western and Western Provinces, and the Priority RoadsProject, which focuses on rehabilitating sections of the national highway network that are selected ona priority basis, were continued. In 2014, the Climate Resilience Improvement Project wascommenced in order to improve the climate resilience of road infrastructure, and a substantial amountof work under this project has been completed. Further, several projects on bridge construction andrehabilitation were implemented through bilateral funding arrangements. In addition, 13 new projectswere commenced in with financial facilities from both local and foreign funding sources, aimed atproviding safe drinking water to public. In the meantime, six new water supply projects are alsoplanned to initiate covering North-Central, Sabaragamuwa, Western, Uva and Southern Provinces.These initiatives are expected to open new opportunities for the country to become a key transport andtourist hub in the region
Restructuring Reform
The Ministry of State Resources and Enterprise Development was established in 2010 to give moreattention to under-performing state assets and to address loss-making SOBEs. SOBEs are beingre-engineered to generate surpluses by utilizing their resources to the optimum level, thus reducingdependence on the national budget. SOBEs are also being encouraged to explore public privatepartnerships, while small scale SOBEs that are not viable will be amalgamated to create commerciallyviable entities. SOBEs will continue to operate in areas of strategic importance and to engage inoperations which would not be undertaken by the private sector due to their scale, risk or technologicalcomplexity. New strategies were recently introduced for restructuring the non-performing debt ofSOBEs while prominent business persons in the private sector were appointed as chairpersons ofSOBEs. The Government also appointed professionals as Chief Executive Officers/General Managersof key SOBEs. Oversight Committees of the Parliament were very active and thereby created anenvironment for better governance.
The Ministry of Public Enterprises Development was established in September 2015 for theformulation of policies, programs and projects, and the monitoring and evaluation of public enterprisedevelopment. Enterprises within the purview of the Ministry are: Bogala Graphite Lanka Ltd., CeylonCeramics Corporation (Brick and Tiles) Division, KESCO, BCC Limited, Public ResourcesManagement Corporation, Hotel Developers (Lanka) PLC, SriLankan Air Lines Ltd., InsuranceCorporation of Sri Lanka and its subsidiaries and associated companies, all State banks and theirsubsidiaries and associated companies, Lakdiva Engineering Ltd, Werahara Engineering Services Ltd.(“WESCO”), Janatha Estate Development Board, Sri Lanka State Plantation Corporation, ElkaduwaPlantation Company Ltd and Kurunegala Plantation Company Ltd.
47
GDP and Major Financial Indicators
Gross Domestic Product
The domestic economy grew by 4.4% in 2016, compared to a growth of 4.8% in 2015 and 5.0% in2014. This growth was mainly attributable to the 4.2% growth in services-related activities, driven bysignificant expansion in financial services activities, together with developments in the transportationof goods and passengers including warehousing activities. Industry-related activities grew by 6.7%,driven by significant growth in construction and mining and quarrying activities. Meanwhile,agricultural activities contracted by 4.2%, mainly due to the contraction observed in production ofrice, tea, rubber and fruits as a result of adverse weather conditions that prevailed throughout 2016.
The domestic economy grew by 4.8% in 2015, compared to a growth of 5.0% in 2014. This growthwas mainly attributable to the 5.7% growth in services activities with major contribution from thegrowth in financial services activities. Industry-related activities grew at a slower pace of 2.1% drivenby the 4.9% growth in manufacturing activities, in the midst of the 2.7% contraction in constructionactivities. Meanwhile, agricultural activities grew by 4.8% mainly due to the 25.0% growth in ricecultivation.
The domestic economy grew by 5.0% in 2014, compared to a growth of 3.4% in 2013. This growthwas mainly attributable to the 4.8% growth in services activities as a result of the robust growth infinancial services and wholesale and retail trade activities. Industry-related activities grew by 4.7%which was driven by the growth in construction activities. Meanwhile, agricultural activities grew by4.6%, supported by growth in animal production and production of oleaginous fruits (coconut, kingcoconut, oil palm) amid adverse weather conditions that prevailed during 2014.
For 2016, the industry activities recorded a growth of 6.7%, compared to a 2.1% increase in 2015,mainly due to the rebound in construction activities, which increased by 14.9% in 2016 compared toa 2.7% contraction in 2015. Correspondingly, the share of industry activities in GDP was 26.8% during2016. Moreover, all sub-activities within the industry activities contributed positively towards thisgrowth.
The services activities, which accounted for 56.6% of GDP, grew by 5.7% in 2015. Financial servicesactivities grew by 17.2% while real estate activities (including ownership of dwellings) increased by10.2% in 2015. Wholesale and retail trade activities expanded by 5.1%, other personal servicesactivities grew by 3.6% and public administration-related services grew by 6.9%. Further,transportation and telecommunication-related activities grew by 5.0% and 10.1%, respectively.
The services activities, which accounted for 56.1% of GDP, grew by 4.8% in 2014. Financial servicesactivities grew by 8.9% while real estate activities (including ownership of dwellings) increased by6.5% in 2014. Further, wholesale and retail trade activities expanded by 2.8%, transportation activitiesgrew by 4.2%, other personal services activities grew by 4.5% and public administration-relatedservices grew by 5.2%.
For 2016, the agricultural activities contracted by 4.2%, compared to the growth of 4.8% in 2015. Thiscontraction in the agricultural sector was mainly driven by a 31.0% contraction in production of rice,11.2% contraction in production of tea and 10.7% contraction in production of rubber. On the otherhand, production of spices, aromatic, drug and pharmaceutical crops, animal production, forestry andlogging, and fishing, grew by 6.4%, 6.3%, 5.5%, and 1.6%, respectively, partially offsetting theoverall contraction in the agricultural activities to a certain extent.
The agricultural activities grew by 4.8% in 2015, compared to a 4.6% growth recorded in 2014, mainlydue to a 25.0% growth in production of rice. Meanwhile, the production of oleaginous fruits (coconut,king coconut, oil palm) recorded a growth rate of 5.2%, while animal produce and production ofspices, aromatic, drug and pharmaceutical crops grew by 8.1% and 6.9%, respectively in 2015.However, fishing, rubber and tea production contracted by 2.6%, 10.1% and 2.6%, respectively, in2015.
48
The agricultural activities grew by 4.6% in 2014, compared to a 3.2% growth recorded in 2013, mainlydue to the 31.0% growth in animal produce and the 20.1% growth in the production of oleaginousfruits (coconut, king coconut, oil palm). However, production of rice, rubber, tea and sugar cane,tobacco and other non-perennial crops contracted by 7.0%, 24.5%, 1.1% and 6.3%, respectively, in2014.
The industry activities grew by 6.7% and amounted to 26.8% of GDP in 2016. Manufacturing activitiesgrew by 1.7% while construction activities grew by 14.9% in 2016. Meanwhile, mining and quarryingactivities grew by 14.4% in 2016.
The industry activities recorded a growth of 2.1% and amounted to 26.2% of GDP in 2015.Manufacturing activities grew by 4.9% while construction activities contracted by 2.7% in 2015.Meanwhile, mining and quarrying activities recorded a decline of 5.2% in 2015.
The industry activities recorded a growth of 4.7% and amounted to 26.9% of GDP in 2014.Manufacturing activities grew by 2.5% while construction activities grew by 10.6% in 2014.Meanwhile, mining and quarrying activities recorded a slower growth of 1.6% in 2014.
Economic Effects of Oil Prices
In 2016, the fuel import bill declined marginally due to the reduction in international oil prices andthe increased import volume due to high reliance on oil-based thermal power while the persistentdecline in oil prices helped to maintain inflation at a subdued level. Fuel imports amounted to US$2,481 million in 2016, compared to US$ 2,700 million in 2015, US$ 4,597 million in 2014, US$ 4,308million in 2013, US$ 5,045 million in 2012 and US$ 4,795 million in 2011. The average crude oil price(Brent) decreased by 16.2% to US$ 45.03 per barrel in 2016, as compared to US$ 53.75 per barrel in2015 and US$ 99.68 per barrel in 2014. The CPC’s average import price decreased by 15.5% to US$46.30 per barrel in 2016, as compared to US$ 54.80 per barrel in 2015 and US$ 104.53 per barrel in2014. With the international oil price declines in the second half of 2014, which continued to January2015, the retail prices of kerosene, petrol and diesel in Sri Lanka were reduced on four occasionsduring the period from September 2014 to January 2015. Kerosene, petrol and diesel prices werereduced by Rs. 20, Rs. 5 and Rs. 3 per liter, respectively, on September 17, 2014. Effective fromDecember 6, 2014, petrol and diesel prices were both reduced again by Rs. 7 per liter and keroseneprice was reduced again by Rs. 5 per liter. Subsequently, effective from January 22, 2015, kerosene,petrol and diesel prices were further reduced by Rs. 16, Rs. 33 and Rs. 16 per liter, respectively, and,effective from January 30, 2015, kerosene price was again reduced by Rs. 6 per liter. In November2015, the price of kerosene was further reduced by Rs. 10 per liter. Effective from January 9, 2017,kerosene price was reduced again by Rs. 5 per litre. Notwithstanding the declining global oil pricesin the international market in 2013 to 2016, the Government continued short-term as well as mediumto long term measures to reduce any adverse effects of oil prices on the power generation sector, whichinclude the following:
• The Ministry of Power and Renewable Energy launched a new community-based powergeneration project called ‘Soorya Bala Sangramaya’ in collaboration with the Sri LankaSustainable Energy Authority (“SLSEA”), the CEB and the Lanka Electricity Company (Private)Limited (“LECO”) in 2016 to promote self-energy generation by households, religious places,commercial establishments and industries. This program is expected to add 200 MW of solarelectricity to the national grid by 2020 and 1,000 MW by 2025.
• The SLSEA implemented several energy conservation programs, focusing on regulatoryinterventions and strengthening energy efficiency in the services sector. In addition, two majorrenewable energy projects, namely the solar rooftop power generation project and the estatemicro hydro rehabilitation and repowering project, were initiated by the SLSEA with financialassistance from the Asian Development Bank and are currently in progress.
• As an alternative to imported fossil fuel, the Government has targeted to attain 20% of electricitygeneration of the national grid through new renewable energy sources by 2020. The Governmentalso targeted a reduction of approximately 10% of the total energy consumption by 2020 throughvarious energy conservation measures.
49
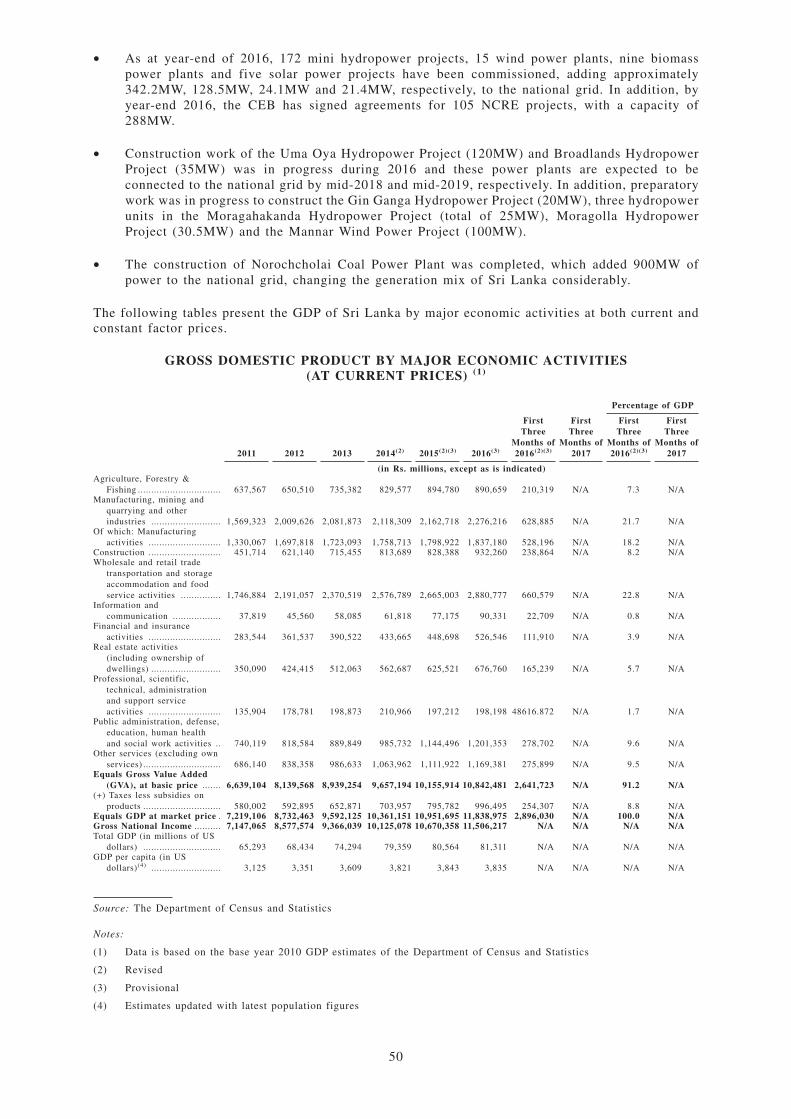
• As at year-end of 2016, 172 mini hydropower projects, 15 wind power plants, nine biomasspower plants and five solar power projects have been commissioned, adding approximately342.2MW, 128.5MW, 24.1MW and 21.4MW, respectively, to the national grid. In addition, byyear-end 2016, the CEB has signed agreements for 105 NCRE projects, with a capacity of288MW.
• Construction work of the Uma Oya Hydropower Project (120MW) and Broadlands HydropowerProject (35MW) was in progress during 2016 and these power plants are expected to beconnected to the national grid by mid-2018 and mid-2019, respectively. In addition, preparatorywork was in progress to construct the Gin Ganga Hydropower Project (20MW), three hydropowerunits in the Moragahakanda Hydropower Project (total of 25MW), Moragolla HydropowerProject (30.5MW) and the Mannar Wind Power Project (100MW).
• The construction of Norochcholai Coal Power Plant was completed, which added 900MW ofpower to the national grid, changing the generation mix of Sri Lanka considerably.
The following tables present the GDP of Sri Lanka by major economic activities at both current andconstant factor prices.
GROSS DOMESTIC PRODUCT BY MAJOR ECONOMIC ACTIVITIES(AT CURRENT PRICES) (1)
Percentage of GDP
2011 2012 2013 2014(2) 2015(2)(3) 2016(3)
FirstThree
Months of2016(2)(3)
FirstThree
Months of2017
FirstThree
Months of2016(2)(3)
FirstThree
Months of2017
(in Rs. millions, except as is indicated)Agriculture, Forestry &
Fishing ............................... 637,567 650,510 735,382 829,577 894,780 890,659 210,319 N/A 7.3 N/AManufacturing, mining and
quarrying and otherindustries .......................... 1,569,323 2,009,626 2,081,873 2,118,309 2,162,718 2,276,216 628,885 N/A 21.7 N/A
Of which: Manufacturingactivities ........................... 1,330,067 1,697,818 1,723,093 1,758,713 1,798,922 1,837,180 528,196 N/A 18.2 N/A
Construction ........................... 451,714 621,140 715,455 813,689 828,388 932,260 238,864 N/A 8.2 N/AWholesale and retail trade
transportation and storageaccommodation and foodservice activities ............... 1,746,884 2,191,057 2,370,519 2,576,789 2,665,003 2,880,777 660,579 N/A 22.8 N/A
Information andcommunication .................. 37,819 45,560 58,085 61,818 77,175 90,331 22,709 N/A 0.8 N/A
Financial and insuranceactivities ........................... 283,544 361,537 390,522 433,665 448,698 526,546 111,910 N/A 3.9 N/A
Real estate activities(including ownership ofdwellings) .......................... 350,090 424,415 512,063 562,687 625,521 676,760 165,239 N/A 5.7 N/A
Professional, scientific,technical, administrationand support serviceactivities ........................... 135,904 178,781 198,873 210,966 197,212 198,198 48616.872 N/A 1.7 N/A
Public administration, defense,education, human healthand social work activities .. 740,119 818,584 889,849 985,732 1,144,496 1,201,353 278,702 N/A 9.6 N/A
Other services (excluding ownservices) ............................. 686,140 838,358 986,633 1,063,962 1,111,922 1,169,381 275,899 N/A 9.5 N/A
Equals Gross Value Added(GVA), at basic price ....... 6,639,104 8,139,568 8,939,254 9,657,194 10,155,914 10,842,481 2,641,723 N/A 91.2 N/A
(+) Taxes less subsidies onproducts ............................. 580,002 592,895 652,871 703,957 795,782 996,495 254,307 N/A 8.8 N/A
Equals GDP at market price . 7,219,106 8,732,463 9,592,125 10,361,151 10,951,695 11,838,975 2,896,030 N/A 100.0 N/AGross National Income .......... 7,147,065 8,577,574 9,366,039 10,125,078 10,670,358 11,506,217 N/A N/A N/A N/ATotal GDP (in millions of US
dollars) ............................. 65,293 68,434 74,294 79,359 80,564 81,311 N/A N/A N/A N/AGDP per capita (in US
dollars)(4) .......................... 3,125 3,351 3,609 3,821 3,843 3,835 N/A N/A N/A N/A
Source: The Department of Census and Statistics
Notes:
(1) Data is based on the base year 2010 GDP estimates of the Department of Census and Statistics
(2) Revised
(3) Provisional
(4) Estimates updated with latest population figures
50
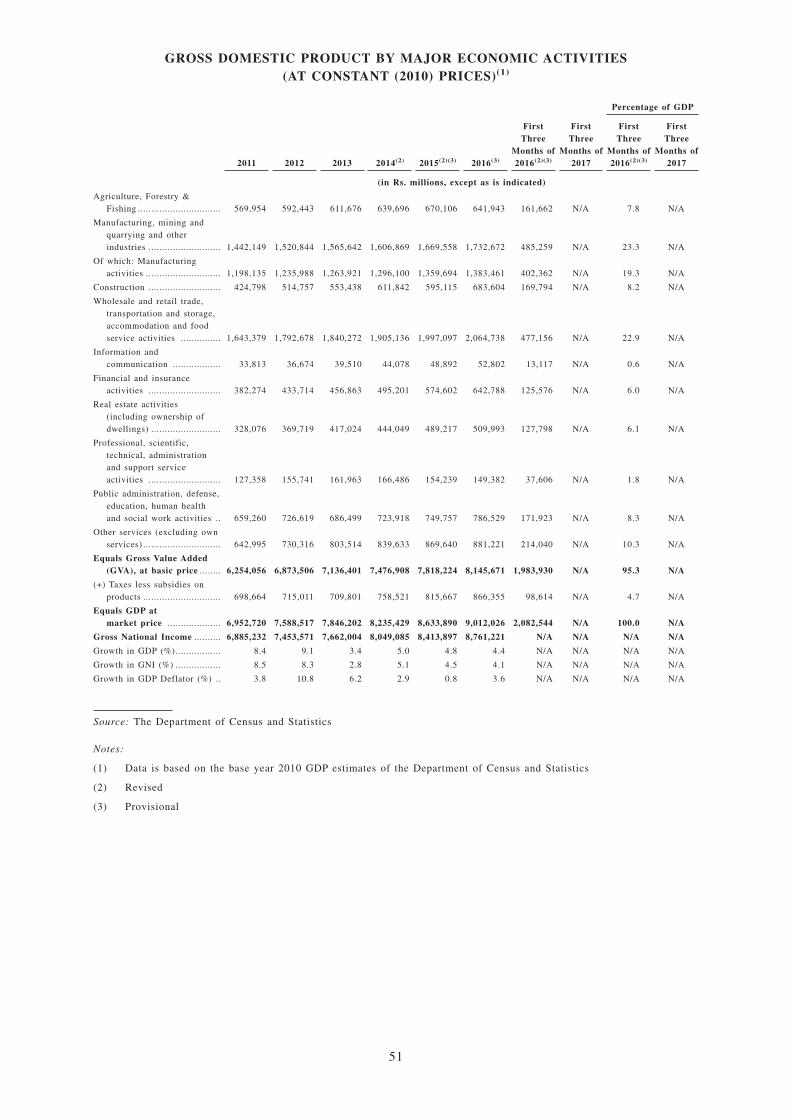
GROSS DOMESTIC PRODUCT BY MAJOR ECONOMIC ACTIVITIES(AT CONSTANT (2010) PRICES)(1)
Percentage of GDP
2011 2012 2013 2014(2) 2015(2)(3) 2016(3)
FirstThree
Months of2016(2)(3)
FirstThree
Months of2017
FirstThree
Months of2016(2)(3)
FirstThree
Months of2017
(in Rs. millions, except as is indicated)
Agriculture, Forestry &Fishing ............................... 569,954 592,443 611,676 639,696 670,106 641,943 161,662 N/A 7.8 N/A
Manufacturing, mining andquarrying and otherindustries ........................... 1,442,149 1,520,844 1,565,642 1,606,869 1,669,558 1,732,672 485,259 N/A 23.3 N/A
Of which: Manufacturingactivities ............................ 1,198,135 1,235,988 1,263,921 1,296,100 1,359,694 1,383,461 402,362 N/A 19.3 N/A
Construction ........................... 424,798 514,757 553,438 611,842 595,115 683,604 169,794 N/A 8.2 N/A
Wholesale and retail trade,transportation and storage,accommodation and foodservice activities ............... 1,643,379 1,792,678 1,840,272 1,905,136 1,997,097 2,064,738 477,156 N/A 22.9 N/A
Information andcommunication .................. 33,813 36,674 39,510 44,078 48,892 52,802 13,117 N/A 0.6 N/A
Financial and insuranceactivities ........................... 382,274 433,714 456,863 495,201 574,602 642,788 125,576 N/A 6.0 N/A
Real estate activities(including ownership ofdwellings) .......................... 328,076 369,719 417,024 444,049 489,217 509,993 127,798 N/A 6.1 N/A
Professional, scientific,technical, administrationand support serviceactivities ........................... 127,358 155,741 161,963 166,486 154,239 149,382 37,606 N/A 1.8 N/A
Public administration, defense,education, human healthand social work activities .. 659,260 726,619 686,499 723,918 749,757 786,529 171,923 N/A 8.3 N/A
Other services (excluding ownservices) ............................. 642,995 730,316 803,514 839,633 869,640 881,221 214,040 N/A 10.3 N/A
Equals Gross Value Added(GVA), at basic price ........ 6,254,056 6,873,506 7,136,401 7,476,908 7,818,224 8,145,671 1,983,930 N/A 95.3 N/A
(+) Taxes less subsidies onproducts ............................. 698,664 715,011 709,801 758,521 815,667 866,355 98,614 N/A 4.7 N/A
Equals GDP atmarket price .................... 6,952,720 7,588,517 7,846,202 8,235,429 8,633,890 9,012,026 2,082,544 N/A 100.0 N/A
Gross National Income .......... 6,885,232 7,453,571 7,662,004 8,049,085 8,413,897 8,761,221 N/A N/A N/A N/A
Growth in GDP (%)................. 8.4 9.1 3.4 5.0 4.8 4.4 N/A N/A N/A N/A
Growth in GNI (%) ................. 8.5 8.3 2.8 5.1 4.5 4.1 N/A N/A N/A N/A
Growth in GDP Deflator (%) .. 3.8 10.8 6.2 2.9 0.8 3.6 N/A N/A N/A N/A
Source: The Department of Census and Statistics
Notes:
(1) Data is based on the base year 2010 GDP estimates of the Department of Census and Statistics
(2) Revised
(3) Provisional
51
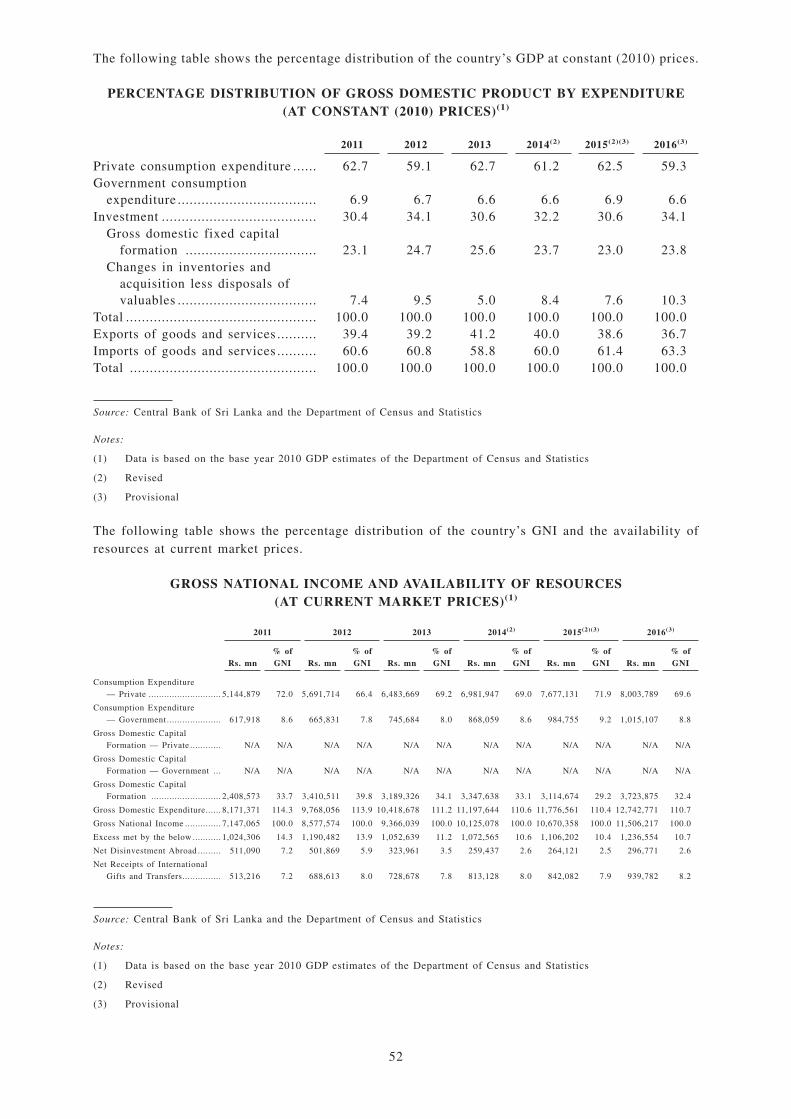
The following table shows the percentage distribution of the country’s GDP at constant (2010) prices.
PERCENTAGE DISTRIBUTION OF GROSS DOMESTIC PRODUCT BY EXPENDITURE(AT CONSTANT (2010) PRICES)(1)
2011 2012 2013 2014(2) 2015(2)(3) 2016(3)
Private consumption expenditure ...... 62.7 59.1 62.7 61.2 62.5 59.3Government consumption
expenditure ................................... 6.9 6.7 6.6 6.6 6.9 6.6Investment ....................................... 30.4 34.1 30.6 32.2 30.6 34.1
Gross domestic fixed capitalformation ................................. 23.1 24.7 25.6 23.7 23.0 23.8
Changes in inventories andacquisition less disposals ofvaluables ................................... 7.4 9.5 5.0 8.4 7.6 10.3
Total ................................................ 100.0 100.0 100.0 100.0 100.0 100.0Exports of goods and services .......... 39.4 39.2 41.2 40.0 38.6 36.7Imports of goods and services .......... 60.6 60.8 58.8 60.0 61.4 63.3Total ............................................... 100.0 100.0 100.0 100.0 100.0 100.0
Source: Central Bank of Sri Lanka and the Department of Census and Statistics
Notes:
(1) Data is based on the base year 2010 GDP estimates of the Department of Census and Statistics
(2) Revised
(3) Provisional
The following table shows the percentage distribution of the country’s GNI and the availability ofresources at current market prices.
GROSS NATIONAL INCOME AND AVAILABILITY OF RESOURCES(AT CURRENT MARKET PRICES)(1)
2011 2012 2013 2014(2) 2015(2)(3) 2016(3)
Rs. mn% ofGNI Rs. mn
% ofGNI Rs. mn
% ofGNI Rs. mn
% ofGNI Rs. mn
% ofGNI Rs. mn
% ofGNI
Consumption Expenditure— Private ............................ 5,144,879 72.0 5,691,714 66.4 6,483,669 69.2 6,981,947 69.0 7,677,131 71.9 8,003,789 69.6
Consumption Expenditure— Government ..................... 617,918 8.6 665,831 7.8 745,684 8.0 868,059 8.6 984,755 9.2 1,015,107 8.8
Gross Domestic CapitalFormation — Private ............ N/A N/A N/A N/A N/A N/A N/A N/A N/A N/A N/A N/A
Gross Domestic CapitalFormation — Government ... N/A N/A N/A N/A N/A N/A N/A N/A N/A N/A N/A N/A
Gross Domestic CapitalFormation ........................... 2,408,573 33.7 3,410,511 39.8 3,189,326 34.1 3,347,638 33.1 3,114,674 29.2 3,723,875 32.4
Gross Domestic Expenditure...... 8,171,371 114.3 9,768,056 113.9 10,418,678 111.2 11,197,644 110.6 11,776,561 110.4 12,742,771 110.7
Gross National Income .............. 7,147,065 100.0 8,577,574 100.0 9,366,039 100.0 10,125,078 100.0 10,670,358 100.0 11,506,217 100.0
Excess met by the below ........... 1,024,306 14.3 1,190,482 13.9 1,052,639 11.2 1,072,565 10.6 1,106,202 10.4 1,236,554 10.7
Net Disinvestment Abroad ......... 511,090 7.2 501,869 5.9 323,961 3.5 259,437 2.6 264,121 2.5 296,771 2.6
Net Receipts of InternationalGifts and Transfers............... 513,216 7.2 688,613 8.0 728,678 7.8 813,128 8.0 842,082 7.9 939,782 8.2
Source: Central Bank of Sri Lanka and the Department of Census and Statistics
Notes:
(1) Data is based on the base year 2010 GDP estimates of the Department of Census and Statistics
(2) Revised
(3) Provisional
52
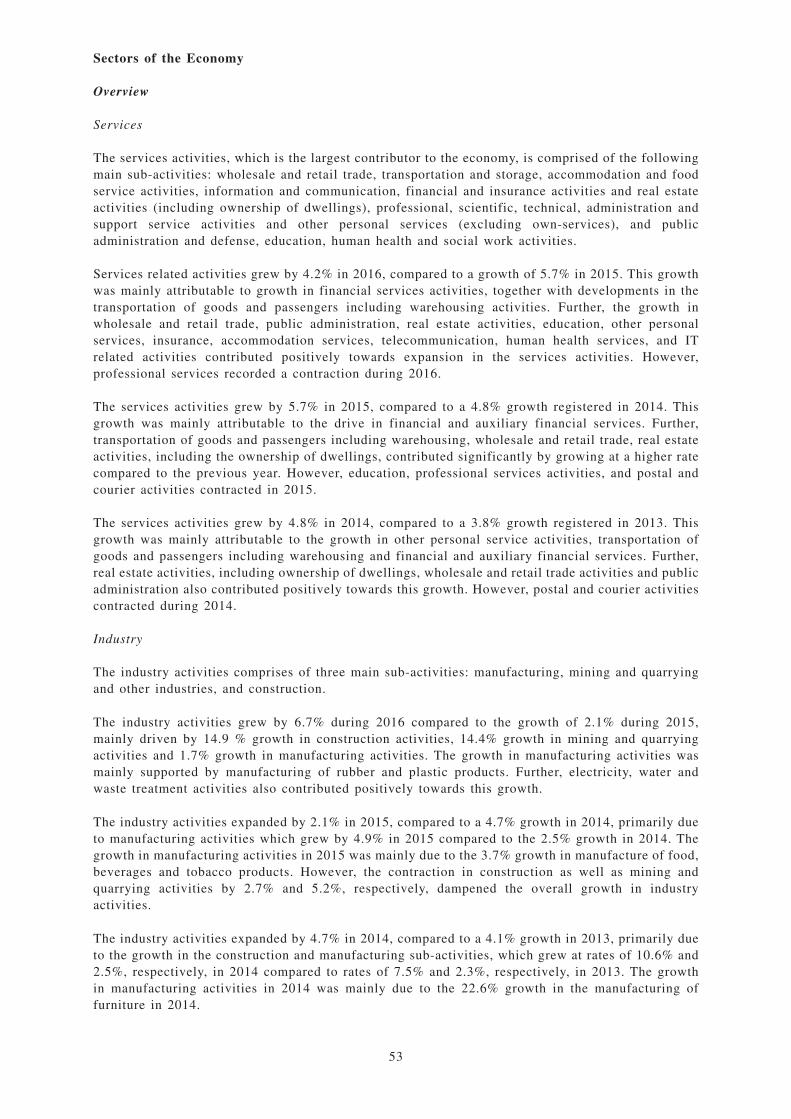
Sectors of the Economy
Overview
Services
The services activities, which is the largest contributor to the economy, is comprised of the followingmain sub-activities: wholesale and retail trade, transportation and storage, accommodation and foodservice activities, information and communication, financial and insurance activities and real estateactivities (including ownership of dwellings), professional, scientific, technical, administration andsupport service activities and other personal services (excluding own-services), and publicadministration and defense, education, human health and social work activities.
Services related activities grew by 4.2% in 2016, compared to a growth of 5.7% in 2015. This growthwas mainly attributable to growth in financial services activities, together with developments in thetransportation of goods and passengers including warehousing activities. Further, the growth inwholesale and retail trade, public administration, real estate activities, education, other personalservices, insurance, accommodation services, telecommunication, human health services, and ITrelated activities contributed positively towards expansion in the services activities. However,professional services recorded a contraction during 2016.
The services activities grew by 5.7% in 2015, compared to a 4.8% growth registered in 2014. Thisgrowth was mainly attributable to the drive in financial and auxiliary financial services. Further,transportation of goods and passengers including warehousing, wholesale and retail trade, real estateactivities, including the ownership of dwellings, contributed significantly by growing at a higher ratecompared to the previous year. However, education, professional services activities, and postal andcourier activities contracted in 2015.
The services activities grew by 4.8% in 2014, compared to a 3.8% growth registered in 2013. Thisgrowth was mainly attributable to the growth in other personal service activities, transportation ofgoods and passengers including warehousing and financial and auxiliary financial services. Further,real estate activities, including ownership of dwellings, wholesale and retail trade activities and publicadministration also contributed positively towards this growth. However, postal and courier activitiescontracted during 2014.
Industry
The industry activities comprises of three main sub-activities: manufacturing, mining and quarryingand other industries, and construction.
The industry activities grew by 6.7% during 2016 compared to the growth of 2.1% during 2015,mainly driven by 14.9 % growth in construction activities, 14.4% growth in mining and quarryingactivities and 1.7% growth in manufacturing activities. The growth in manufacturing activities wasmainly supported by manufacturing of rubber and plastic products. Further, electricity, water andwaste treatment activities also contributed positively towards this growth.
The industry activities expanded by 2.1% in 2015, compared to a 4.7% growth in 2014, primarily dueto manufacturing activities which grew by 4.9% in 2015 compared to the 2.5% growth in 2014. Thegrowth in manufacturing activities in 2015 was mainly due to the 3.7% growth in manufacture of food,beverages and tobacco products. However, the contraction in construction as well as mining andquarrying activities by 2.7% and 5.2%, respectively, dampened the overall growth in industryactivities.
The industry activities expanded by 4.7% in 2014, compared to a 4.1% growth in 2013, primarily dueto the growth in the construction and manufacturing sub-activities, which grew at rates of 10.6% and2.5%, respectively, in 2014 compared to rates of 7.5% and 2.3%, respectively, in 2013. The growthin manufacturing activities in 2014 was mainly due to the 22.6% growth in the manufacturing offurniture in 2014.
53
Agriculture, forestry and fishing
The agricultural activities comprises of three main sub-sectors: agriculture, forestry and fishing.Marine fishing and marine aquaculture, rice production, tea production, production of vegetables, andthe production of oleaginous fruits (coconut, king coconut, oil palm) generally represent the highestshare in the agriculture, forestry and fishing sector. Sri Lanka is the fourth largest tea producer in theworld. Sri Lanka’s fishing industry contributes to the country’s foreign exchange earnings as asubstantial portion of the seafood produced is exported.
The agricultural activities contacted by 4.2% in 2016, compared to an increase of 4.8% in 2015. Thiscontraction in the agricultural activities was mainly driven by a 31.0% contraction in production ofrice, 11.2% contraction in production of tea and 10.7% contraction in production of rubber. However,production of spices, aromatic, drug and pharmaceutical crops, animal produce, forestry and logging,and fishing, grew by 6.4%, 6.3%, 5.5%, and 1.6%, respectively, partially offsetting the overallcontraction in the agricultural activities.
In 2015, the agricultural activities grew by 4.8%, compared to a 4.6% growth observed in 2014, mainlydue to the recovery in the production of rice which grew by 25.0% in 2015 compared to the 7.0%contraction in 2014, and the 17.5% expansion in production of fruits compared to 9.4% growth in2014. Further, the production of spices, aromatic, drug and pharmaceutical products, oleaginous fruits(coconut, king coconut and oil palm), animal produce, vegetables and other perennial crops alsosignificantly contributed to this growth. However, the contraction in production of rubber, tea, sugarcane, tobacco and other non-perennial crops and other beverage crops (coffee and cocoa) and fishingdampened the growth in 2015.
In 2014, the agricultural activities grew by 4.6%, compared to a 3.2% growth observed in 2013, mainlydue to a 31.0% growth in animal produce compared to a 24.0% growth in 2013, and a 20.1% growthin the production of oleaginous fruits (coconut, king coconut and oil palm) recovering from a 14.1%contraction in 2014. However, the production of rice, rubber, tea, and sugar cane, tobacco, and othernon-perennial crops contracted during the year.
Services Activities
Wholesale and retail trade, transportation and storage, accommodation and food service activities
Wholesale and retail trade, transportation and storage, accommodation and food service activities, thelargest segment of the services sector, grew by 3.4% during 2016 compared to the 4.8% growthrecorded in 2015. In particular, wholesale and retail trade activities grew by 2.5% during 2016compared to a 5.1% growth in 2015. Meanwhile, transportation of goods and passengers includingwarehousing activities recorded a growth of 4.1% in 2016, compared to a 5.0% growth in 2015.Moreover, accommodation, food and beverage service activities also grew during 2016, recording a4.0% growth compared to a 1.9% growth posted in 2015. Further, postal and courier activities grewby 5.1% during 2016, compared to a contraction of 0.1% during 2015.
Wholesale and retail trade, transportation and storage, accommodation and food service activitiesgrew by 4.8% during 2015 compared to a 3.5% growth in 2014. In particular, wholesale and retailtrade activities grew by 5.1% during 2015 compared to a 2.8% growth in 2014. Meanwhile,transportation of goods and passengers including warehousing activities recorded a growth rate of5.0% in 2015, as compared to a 4.2% growth rate in 2014. Meantime, accommodation, food andbeverage service activities grew by 1.9% during 2015, compared to a 4.0% growth posted in 2014.However, postal and courier activities declined by 0.1% during 2015, compared to a decline of 7.1%during 2014.
Wholesale and retail trade, transportation and storage, accommodation and food service activitiesgrew by 3.5% during 2014 compared to a 2.7% growth in 2013. This growth was mainly driven by thewholesale and retail trade which grew by 2.8% in 2014 compared to a 1.3% growth recorded in 2013.Other activities also contributed to the overall growth, with transportation of goods and passengers
54
including warehousing activities recording a 4.2% growth in 2014 compared to a 5.5% growthrecorded in 2013 and accommodation, food and beverage service activities recording a 4.0% growthin 2014 compared to a decline of 5.8% in 2013. However, postal and courier activities continued tocontract, declining by 7.1% in 2014 compared to a decline of 1.7% in 2013.
Information and communication
Information and communication activities grew by 8.0% during 2016 compared to a 10.9% growthrecorded in 2015. This growth was mainly due to the 8.3% growth recorded in telecommunicationactivities during 2016. Further, IT programming consultancy and related activities grew by 7.1%during 2016, compared to a 14.8% growth recorded during the 2015. Moreover, programming andbroadcasting activities grew by 7.7% during 2016 compared to the 4.4% growth in 2015.
Information and communication activities grew by 10.9% during 2015 compared to a 11.6% growthrecorded in 2014. This growth was mainly due to the continuous expansion in telecommunicationactivities, which grew by 10.1% during the year, compared to a 13.1% growth in 2014. Further,programming and broadcasting activities and audio, video productions grew by 4.4% during 2015, ascompared to a 3.8% growth during 2014 while IT programming consultancy and related activities grewby 14.8% during 2015 compared to a 9.1% growth in 2014.
Information and communication activities grew by 11.6% in 2014 compared to a 7.7% growth in 2013.This growth was mainly attributable to a 13.1% growth in telecommunication activities, increasingfrom a 3.6% growth recorded in 2013. Programming and broadcasting activities and audio, videoproductions grew by 3.8%, and IT programming consultancy and related activities grew by 9.1% in2014, compared to growth rates of 7.6% and 21.6%, respectively, in 2013.
Financial, insurance and real estate activities (including ownership of dwellings)
Financial, insurance and real estate activities (including ownership of dwellings) grew by 8.4% during2016 compared to a 13.3% growth recorded in the corresponding period of 2015. This growth wasmainly due to a 12.4% growth recorded in the financial service activities and auxiliary financialservices activities during 2016 compared to a 17.2% growth recorded in 2015. Insurance, reinsuranceand pension funding activities also recorded a growth of 8.5% during 2016 compared to a 9.3% growthin 2015. Further, real estate activities, including ownership of dwellings, grew by 4.2% in 2016compared to a 10.2% growth recorded in 2015.
Financial, insurance and real estate activities (including ownership of dwellings) grew by 13.3%during 2015 compared to a 7.5% growth recorded in 2014. This growth was mainly due to the 17.2%growth in financial service activities and auxiliary financial service activities during 2015 comparedto a 8.9% growth recorded in 2014. Real estate activities (including ownership of dwellings) alsorecorded a higher growth rate of 10.2% during 2015 compared to a 6.5% growth in 2014. Further,activities of insurance, reinsurance and pension funding also posted a growth of 9.3% during 2015compared to a 5.8% growth in 2014.
Financial, insurance and real estate activities (including ownership of dwellings) grew by 7.5% in2014 compared to an 8.8% growth in 2013. This growth primarily attributable to financial serviceactivities and auxiliary financial services, which grew by 8.9% in 2014 compared to a 5.8% growthin 2013. Real estate activities (including ownership of dwellings) grew at a slower pace of 6.5% in2014, compared to a 12.8% growth recorded in 2013. Further, insurance, reinsurance and pensionfunding activities also grew by 5.8% in 2014 compared to a 2.6% growth recorded in 2013.
55
Professional, scientific, technical, administration and supporting service activities, and other services(excluding own-services)
Professional, scientific, technical, administration and supporting service activities and other servicesactivities (excluding own-services) grew marginally by 0.7% during 2016, compared to 1.8% growthin 2015. This growth was mainly due to expansion in other personal services activities, which grewby 1.3% in 2016 compared to a 3.6% growth in 2015. However, professional, scientific, technical,administration and contracted further in value added terms by 3.1% in 2016 compared to 7.4%contraction recorded in the previous year.
Professional, scientific, technical, administration and supporting service activities and other personalservices activities (excluding own-services) grew by 1.8% during 2015, compared to a 4.2% growthin 2014. This growth was mainly due to the growth in other personal service activities, which grewby 3.6% in 2015 compared to a 4.5% growth in 2014. However, professional, scientific, technical,administration and supporting services activities contracted by 7.4%, compared to the 2.8% growthrecorded in 2014.
Professional, scientific, technical, administration and supporting service activities and other servicesactivities (excluding own-services) grew by 4.2% during 2014, compared to a 9.0% growth recordedin 2013. The deceleration in the growth rate was mainly attributable to the slower 4.5% growth inother personal service activities in 2014, compared to a 10.0% growth recorded in 2013. Meanwhile,growth in professional, scientific, technical, administration and supporting services activities alsoslowed down to 2.8% in 2014, compared to a 4.0% growth in 2013.
Public administration, defense, education, human health, and social work activities
Public administration, defense, education, human health, and social work activities grew by 4.9%during 2016, compared to a growth of 3.6% recorded in 2015. The growth during 2016 was mainlyattributable to public administration, defence and compulsory social security activities, which grew by5.2% compared to a 6.9% growth recorded in 2015. Meanwhile, human health activities, residentialcare and social work activities grew by 1.5% during 2016, compared to a 8.1% growth posted in 2015.Meanwhile, education services rebounded in 2016 recording a 7.5% growth, compared to an 8.1%contraction posted during 2015.
Public administration, defense, education, human health, and social work activities grew at a slowerpace of 3.6% during 2015, compared to a 5.5% growth recorded in 2014. Growth during 2015 wasmainly attributable to the public administration and defense; compulsory social security activities,which grew by 6.9%, compared to a 5.2% growth recorded in 2014. Meanwhile, human healthactivities, residential care and social work activities grew by 8.1% during 2015, compared to a 1.0%growth posted in 2014. However, education services contracted by 8.1% in 2015, compared to a 10.3%growth posted during 2014, dampening the overall growth in the particular segment.
Public administration, defense, education, human health, and social work activities grew by 5.5% in2014, recovering from a 5.5% contraction in 2013. This recovery was mainly attributable to the publicadministration and defense; compulsory social security activities and the education activities, whichgrew by 5.2% and 10.3%, respectively, in 2014, compared to contractions of 0.8% and 5.8%,respectively, in 2013. Further, human health activities, residential care and social work activities grewmarginally by 1.0% in 2014, compared to a decline of 15.7% in 2013.
Industry Activities
Sri Lanka’s industry activities consist of manufacturing, mining and quarrying and other industries,and construction activities. In 2016, the industry sector grew by 6.7%, primarily due to a significantgrowth of 14.9% in construction activities, which recovered from the 2.7% contraction recorded in2015, together with the robust recovery in the mining and quarrying activities, which posted a 14.4%growth in 2016 compared to the 5.2% contraction in 2015.
56
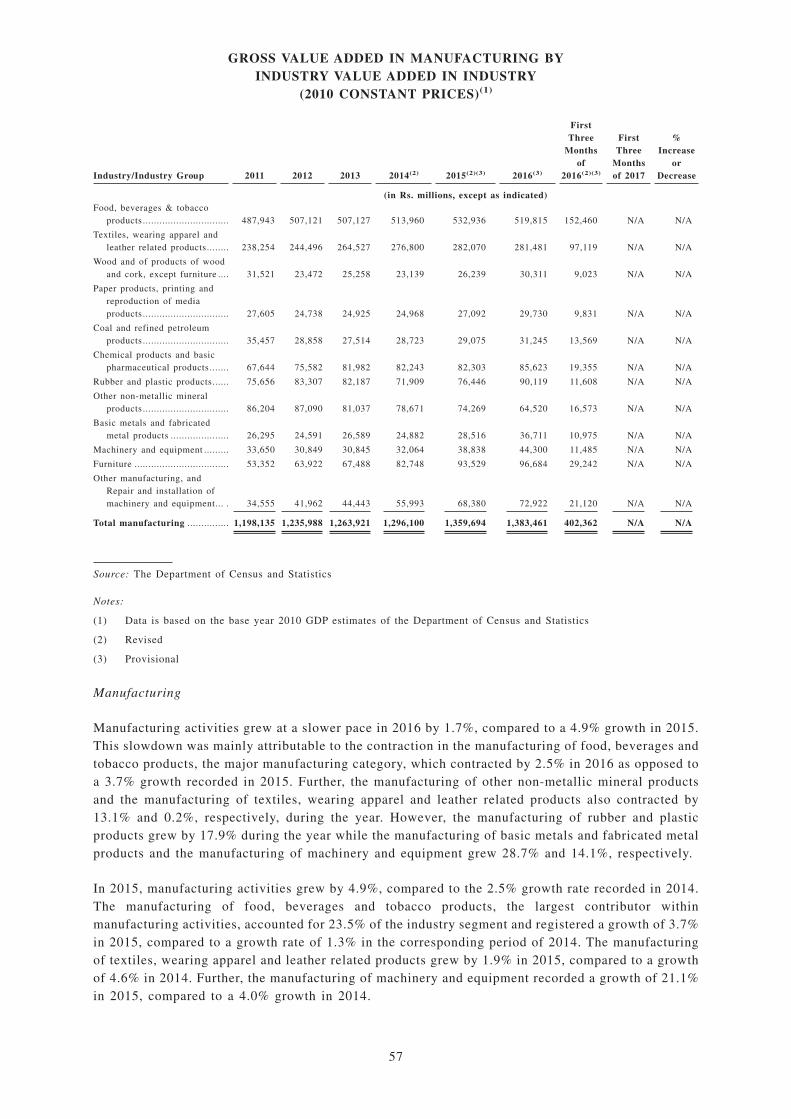
GROSS VALUE ADDED IN MANUFACTURING BYINDUSTRY VALUE ADDED IN INDUSTRY
(2010 CONSTANT PRICES)(1)
Industry/Industry Group 2011 2012 2013 2014(2) 2015(2)(3) 2016(3)
FirstThree
Monthsof
2016(2)(3)
FirstThree
Monthsof 2017
%Increase
orDecrease
(in Rs. millions, except as indicated)Food, beverages & tobacco
products ............................... 487,943 507,121 507,127 513,960 532,936 519,815 152,460 N/A N/A
Textiles, wearing apparel andleather related products ........ 238,254 244,496 264,527 276,800 282,070 281,481 97,119 N/A N/A
Wood and of products of woodand cork, except furniture .... 31,521 23,472 25,258 23,139 26,239 30,311 9,023 N/A N/A
Paper products, printing andreproduction of mediaproducts ............................... 27,605 24,738 24,925 24,968 27,092 29,730 9,831 N/A N/A
Coal and refined petroleumproducts ............................... 35,457 28,858 27,514 28,723 29,075 31,245 13,569 N/A N/A
Chemical products and basicpharmaceutical products ....... 67,644 75,582 81,982 82,243 82,303 85,623 19,355 N/A N/A
Rubber and plastic products...... 75,656 83,307 82,187 71,909 76,446 90,119 11,608 N/A N/A
Other non-metallic mineralproducts ............................... 86,204 87,090 81,037 78,671 74,269 64,520 16,573 N/A N/A
Basic metals and fabricatedmetal products ..................... 26,295 24,591 26,589 24,882 28,516 36,711 10,975 N/A N/A
Machinery and equipment ......... 33,650 30,849 30,845 32,064 38,838 44,300 11,485 N/A N/A
Furniture .................................. 53,352 63,922 67,488 82,748 93,529 96,684 29,242 N/A N/A
Other manufacturing, andRepair and installation ofmachinery and equipment... . 34,555 41,962 44,443 55,993 68,380 72,922 21,120 N/A N/A
Total manufacturing ............... 1,198,135 1,235,988 1,263,921 1,296,100 1,359,694 1,383,461 402,362 N/A N/A
Source: The Department of Census and Statistics
Notes:
(1) Data is based on the base year 2010 GDP estimates of the Department of Census and Statistics
(2) Revised
(3) Provisional
Manufacturing
Manufacturing activities grew at a slower pace in 2016 by 1.7%, compared to a 4.9% growth in 2015.This slowdown was mainly attributable to the contraction in the manufacturing of food, beverages andtobacco products, the major manufacturing category, which contracted by 2.5% in 2016 as opposed toa 3.7% growth recorded in 2015. Further, the manufacturing of other non-metallic mineral productsand the manufacturing of textiles, wearing apparel and leather related products also contracted by13.1% and 0.2%, respectively, during the year. However, the manufacturing of rubber and plasticproducts grew by 17.9% during the year while the manufacturing of basic metals and fabricated metalproducts and the manufacturing of machinery and equipment grew 28.7% and 14.1%, respectively.
In 2015, manufacturing activities grew by 4.9%, compared to the 2.5% growth rate recorded in 2014.The manufacturing of food, beverages and tobacco products, the largest contributor withinmanufacturing activities, accounted for 23.5% of the industry segment and registered a growth of 3.7%in 2015, compared to a growth rate of 1.3% in the corresponding period of 2014. The manufacturingof textiles, wearing apparel and leather related products grew by 1.9% in 2015, compared to a growthof 4.6% in 2014. Further, the manufacturing of machinery and equipment recorded a growth of 21.1%in 2015, compared to a 4.0% growth in 2014.
57
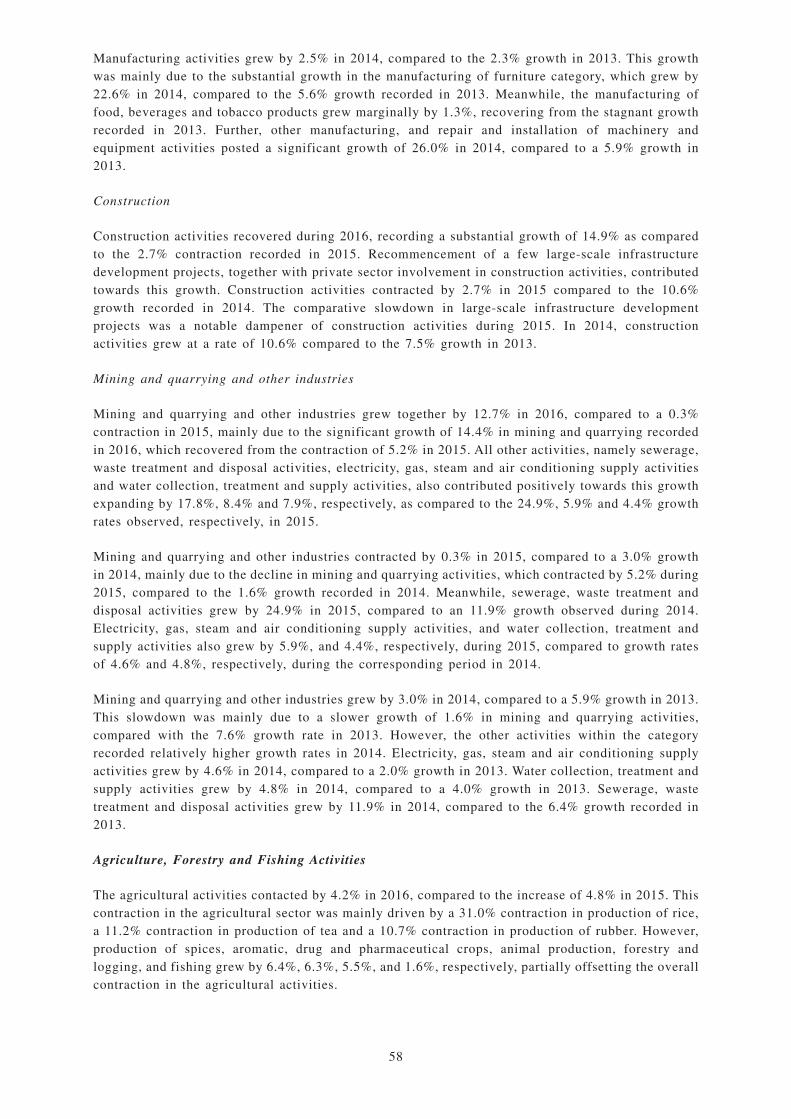
Manufacturing activities grew by 2.5% in 2014, compared to the 2.3% growth in 2013. This growthwas mainly due to the substantial growth in the manufacturing of furniture category, which grew by22.6% in 2014, compared to the 5.6% growth recorded in 2013. Meanwhile, the manufacturing offood, beverages and tobacco products grew marginally by 1.3%, recovering from the stagnant growthrecorded in 2013. Further, other manufacturing, and repair and installation of machinery andequipment activities posted a significant growth of 26.0% in 2014, compared to a 5.9% growth in2013.
Construction
Construction activities recovered during 2016, recording a substantial growth of 14.9% as comparedto the 2.7% contraction recorded in 2015. Recommencement of a few large-scale infrastructuredevelopment projects, together with private sector involvement in construction activities, contributedtowards this growth. Construction activities contracted by 2.7% in 2015 compared to the 10.6%growth recorded in 2014. The comparative slowdown in large-scale infrastructure developmentprojects was a notable dampener of construction activities during 2015. In 2014, constructionactivities grew at a rate of 10.6% compared to the 7.5% growth in 2013.
Mining and quarrying and other industries
Mining and quarrying and other industries grew together by 12.7% in 2016, compared to a 0.3%contraction in 2015, mainly due to the significant growth of 14.4% in mining and quarrying recordedin 2016, which recovered from the contraction of 5.2% in 2015. All other activities, namely sewerage,waste treatment and disposal activities, electricity, gas, steam and air conditioning supply activitiesand water collection, treatment and supply activities, also contributed positively towards this growthexpanding by 17.8%, 8.4% and 7.9%, respectively, as compared to the 24.9%, 5.9% and 4.4% growthrates observed, respectively, in 2015.
Mining and quarrying and other industries contracted by 0.3% in 2015, compared to a 3.0% growthin 2014, mainly due to the decline in mining and quarrying activities, which contracted by 5.2% during2015, compared to the 1.6% growth recorded in 2014. Meanwhile, sewerage, waste treatment anddisposal activities grew by 24.9% in 2015, compared to an 11.9% growth observed during 2014.Electricity, gas, steam and air conditioning supply activities, and water collection, treatment andsupply activities also grew by 5.9%, and 4.4%, respectively, during 2015, compared to growth ratesof 4.6% and 4.8%, respectively, during the corresponding period in 2014.
Mining and quarrying and other industries grew by 3.0% in 2014, compared to a 5.9% growth in 2013.This slowdown was mainly due to a slower growth of 1.6% in mining and quarrying activities,compared with the 7.6% growth rate in 2013. However, the other activities within the categoryrecorded relatively higher growth rates in 2014. Electricity, gas, steam and air conditioning supplyactivities grew by 4.6% in 2014, compared to a 2.0% growth in 2013. Water collection, treatment andsupply activities grew by 4.8% in 2014, compared to a 4.0% growth in 2013. Sewerage, wastetreatment and disposal activities grew by 11.9% in 2014, compared to the 6.4% growth recorded in2013.
Agriculture, Forestry and Fishing Activities
The agricultural activities contacted by 4.2% in 2016, compared to the increase of 4.8% in 2015. Thiscontraction in the agricultural sector was mainly driven by a 31.0% contraction in production of rice,a 11.2% contraction in production of tea and a 10.7% contraction in production of rubber. However,production of spices, aromatic, drug and pharmaceutical crops, animal production, forestry andlogging, and fishing grew by 6.4%, 6.3%, 5.5%, and 1.6%, respectively, partially offsetting the overallcontraction in the agricultural activities.
58
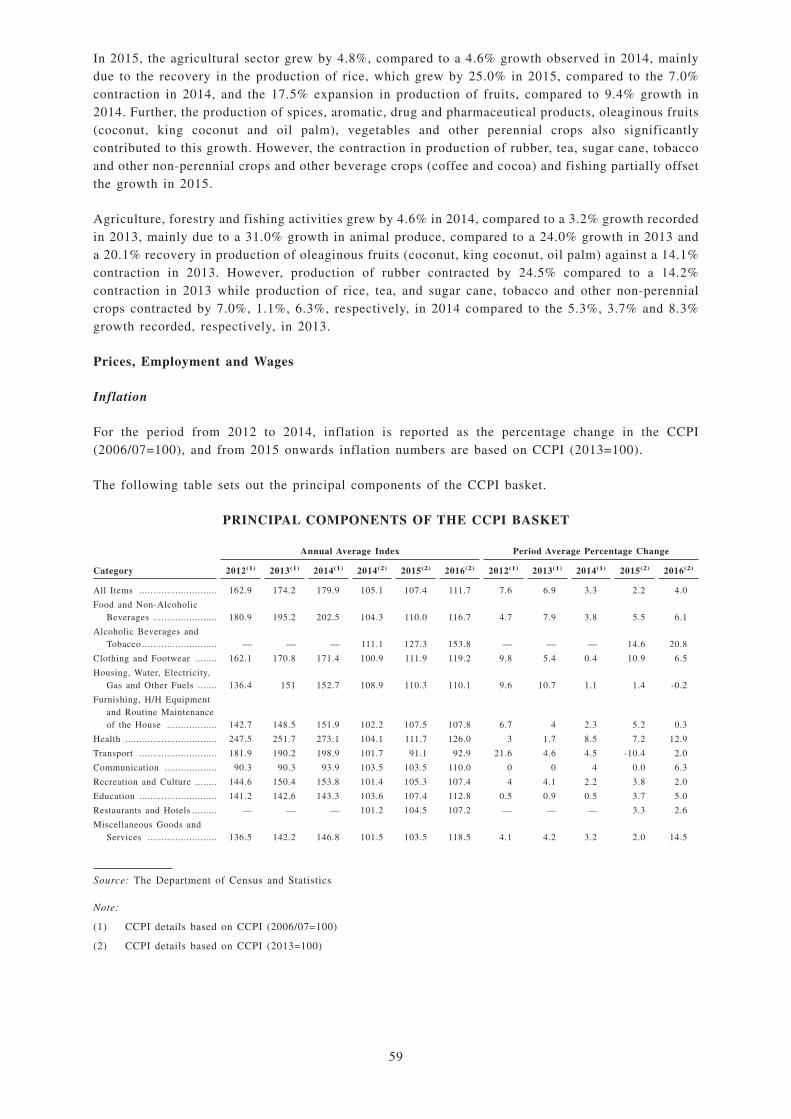
In 2015, the agricultural sector grew by 4.8%, compared to a 4.6% growth observed in 2014, mainlydue to the recovery in the production of rice, which grew by 25.0% in 2015, compared to the 7.0%contraction in 2014, and the 17.5% expansion in production of fruits, compared to 9.4% growth in2014. Further, the production of spices, aromatic, drug and pharmaceutical products, oleaginous fruits(coconut, king coconut and oil palm), vegetables and other perennial crops also significantlycontributed to this growth. However, the contraction in production of rubber, tea, sugar cane, tobaccoand other non-perennial crops and other beverage crops (coffee and cocoa) and fishing partially offsetthe growth in 2015.
Agriculture, forestry and fishing activities grew by 4.6% in 2014, compared to a 3.2% growth recordedin 2013, mainly due to a 31.0% growth in animal produce, compared to a 24.0% growth in 2013 anda 20.1% recovery in production of oleaginous fruits (coconut, king coconut, oil palm) against a 14.1%contraction in 2013. However, production of rubber contracted by 24.5% compared to a 14.2%contraction in 2013 while production of rice, tea, and sugar cane, tobacco and other non-perennialcrops contracted by 7.0%, 1.1%, 6.3%, respectively, in 2014 compared to the 5.3%, 3.7% and 8.3%growth recorded, respectively, in 2013.
Prices, Employment and Wages
Inflation
For the period from 2012 to 2014, inflation is reported as the percentage change in the CCPI(2006/07=100), and from 2015 onwards inflation numbers are based on CCPI (2013=100).
The following table sets out the principal components of the CCPI basket.
PRINCIPAL COMPONENTS OF THE CCPI BASKET
Annual Average Index Period Average Percentage Change
Category 2012(1) 2013(1) 2014(1) 2014(2) 2015(2) 2016(2) 2012(1) 2013(1) 2014(1) 2015(2) 2016(2)
All Items ............................ 162.9 174.2 179.9 105.1 107.4 111.7 7.6 6.9 3.3 2.2 4.0
Food and Non-AlcoholicBeverages ....................... 180.9 195.2 202.5 104.3 110.0 116.7 4.7 7.9 3.8 5.5 6.1
Alcoholic Beverages andTobacco ........................... — — — 111.1 127.3 153.8 — — — 14.6 20.8
Clothing and Footwear ........ 162.1 170.8 171.4 100.9 111.9 119.2 9.8 5.4 0.4 10.9 6.5
Housing, Water, Electricity,Gas and Other Fuels ....... 136.4 151 152.7 108.9 110.3 110.1 9.6 10.7 1.1 1.4 -0.2
Furnishing, H/H Equipmentand Routine Maintenanceof the House .................. 142.7 148.5 151.9 102.2 107.5 107.8 6.7 4 2.3 5.2 0.3
Health ................................. 247.5 251.7 273.1 104.1 111.7 126.0 3 1.7 8.5 7.2 12.9
Transport ............................ 181.9 190.2 198.9 101.7 91.1 92.9 21.6 4.6 4.5 -10.4 2.0
Communication ................... 90.3 90.3 93.9 103.5 103.5 110.0 0 0 4 0.0 6.3
Recreation and Culture ........ 144.6 150.4 153.8 101.4 105.3 107.4 4 4.1 2.2 3.8 2.0
Education ............................ 141.2 142.6 143.3 103.6 107.4 112.8 0.5 0.9 0.5 3.7 5.0
Restaurants and Hotels ......... — — — 101.2 104.5 107.2 — — — 3.3 2.6
Miscellaneous Goods andServices ......................... 136.5 142.2 146.8 101.5 103.5 118.5 4.1 4.2 3.2 2.0 14.5
Source: The Department of Census and Statistics
Note:
(1) CCPI details based on CCPI (2006/07=100)
(2) CCPI details based on CCPI (2013=100)
59
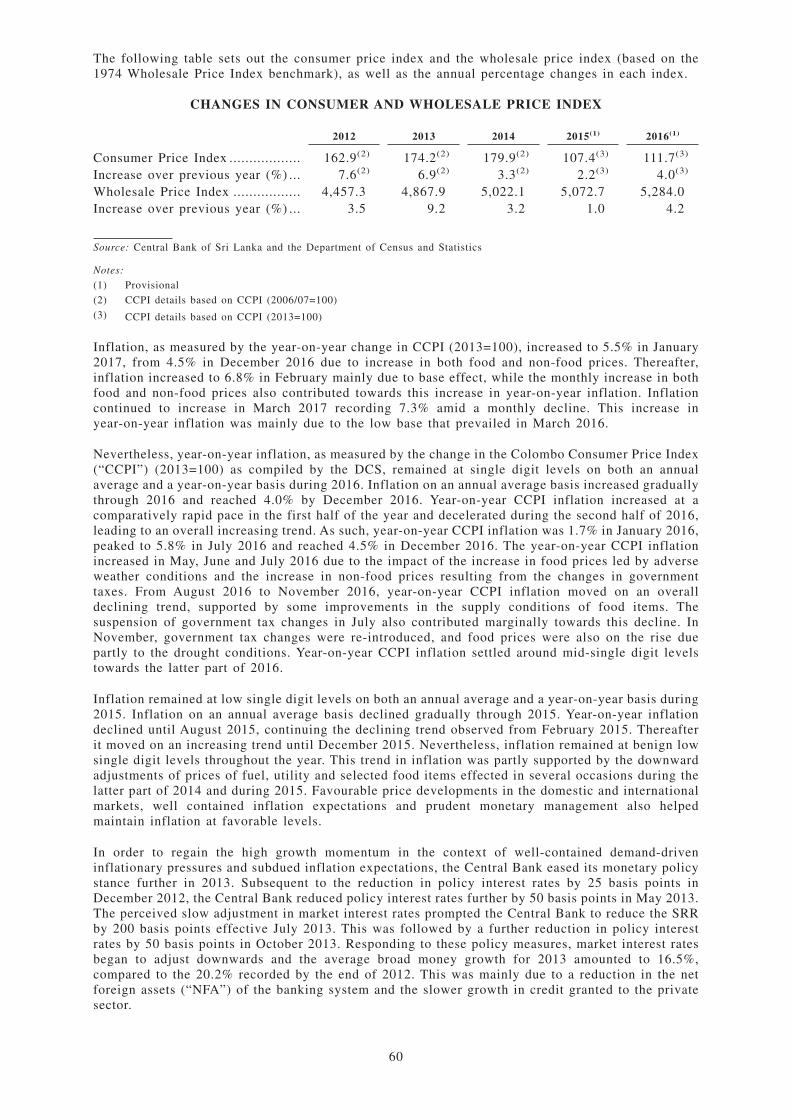
The following table sets out the consumer price index and the wholesale price index (based on the1974 Wholesale Price Index benchmark), as well as the annual percentage changes in each index.
CHANGES IN CONSUMER AND WHOLESALE PRICE INDEX
2012 2013 2014 2015(1) 2016(1)
Consumer Price Index .................. 162.9(2) 174.2(2) 179.9(2) 107.4(3) 111.7(3)
Increase over previous year (%) ... 7.6(2) 6.9(2) 3.3(2) 2.2(3) 4.0(3)
Wholesale Price Index ................. 4,457.3 4,867.9 5,022.1 5,072.7 5,284.0Increase over previous year (%) ... 3.5 9.2 3.2 1.0 4.2
Source: Central Bank of Sri Lanka and the Department of Census and Statistics
Notes:
(1) Provisional
(2) CCPI details based on CCPI (2006/07=100)
(3) CCPI details based on CCPI (2013=100)
Inflation, as measured by the year-on-year change in CCPI (2013=100), increased to 5.5% in January2017, from 4.5% in December 2016 due to increase in both food and non-food prices. Thereafter,inflation increased to 6.8% in February mainly due to base effect, while the monthly increase in bothfood and non-food prices also contributed towards this increase in year-on-year inflation. Inflationcontinued to increase in March 2017 recording 7.3% amid a monthly decline. This increase inyear-on-year inflation was mainly due to the low base that prevailed in March 2016.
Nevertheless, year-on-year inflation, as measured by the change in the Colombo Consumer Price Index(“CCPI”) (2013=100) as compiled by the DCS, remained at single digit levels on both an annualaverage and a year-on-year basis during 2016. Inflation on an annual average basis increased graduallythrough 2016 and reached 4.0% by December 2016. Year-on-year CCPI inflation increased at acomparatively rapid pace in the first half of the year and decelerated during the second half of 2016,leading to an overall increasing trend. As such, year-on-year CCPI inflation was 1.7% in January 2016,peaked to 5.8% in July 2016 and reached 4.5% in December 2016. The year-on-year CCPI inflationincreased in May, June and July 2016 due to the impact of the increase in food prices led by adverseweather conditions and the increase in non-food prices resulting from the changes in governmenttaxes. From August 2016 to November 2016, year-on-year CCPI inflation moved on an overalldeclining trend, supported by some improvements in the supply conditions of food items. Thesuspension of government tax changes in July also contributed marginally towards this decline. InNovember, government tax changes were re-introduced, and food prices were also on the rise duepartly to the drought conditions. Year-on-year CCPI inflation settled around mid-single digit levelstowards the latter part of 2016.
Inflation remained at low single digit levels on both an annual average and a year-on-year basis during2015. Inflation on an annual average basis declined gradually through 2015. Year-on-year inflationdeclined until August 2015, continuing the declining trend observed from February 2015. Thereafterit moved on an increasing trend until December 2015. Nevertheless, inflation remained at benign lowsingle digit levels throughout the year. This trend in inflation was partly supported by the downwardadjustments of prices of fuel, utility and selected food items effected in several occasions during thelatter part of 2014 and during 2015. Favourable price developments in the domestic and internationalmarkets, well contained inflation expectations and prudent monetary management also helpedmaintain inflation at favorable levels.
In order to regain the high growth momentum in the context of well-contained demand-driveninflationary pressures and subdued inflation expectations, the Central Bank eased its monetary policystance further in 2013. Subsequent to the reduction in policy interest rates by 25 basis points inDecember 2012, the Central Bank reduced policy interest rates further by 50 basis points in May 2013.The perceived slow adjustment in market interest rates prompted the Central Bank to reduce the SRRby 200 basis points effective July 2013. This was followed by a further reduction in policy interestrates by 50 basis points in October 2013. Responding to these policy measures, market interest ratesbegan to adjust downwards and the average broad money growth for 2013 amounted to 16.5%,compared to the 20.2% recorded by the end of 2012. This was mainly due to a reduction in the netforeign assets (“NFA”) of the banking system and the slower growth in credit granted to the privatesector.
60
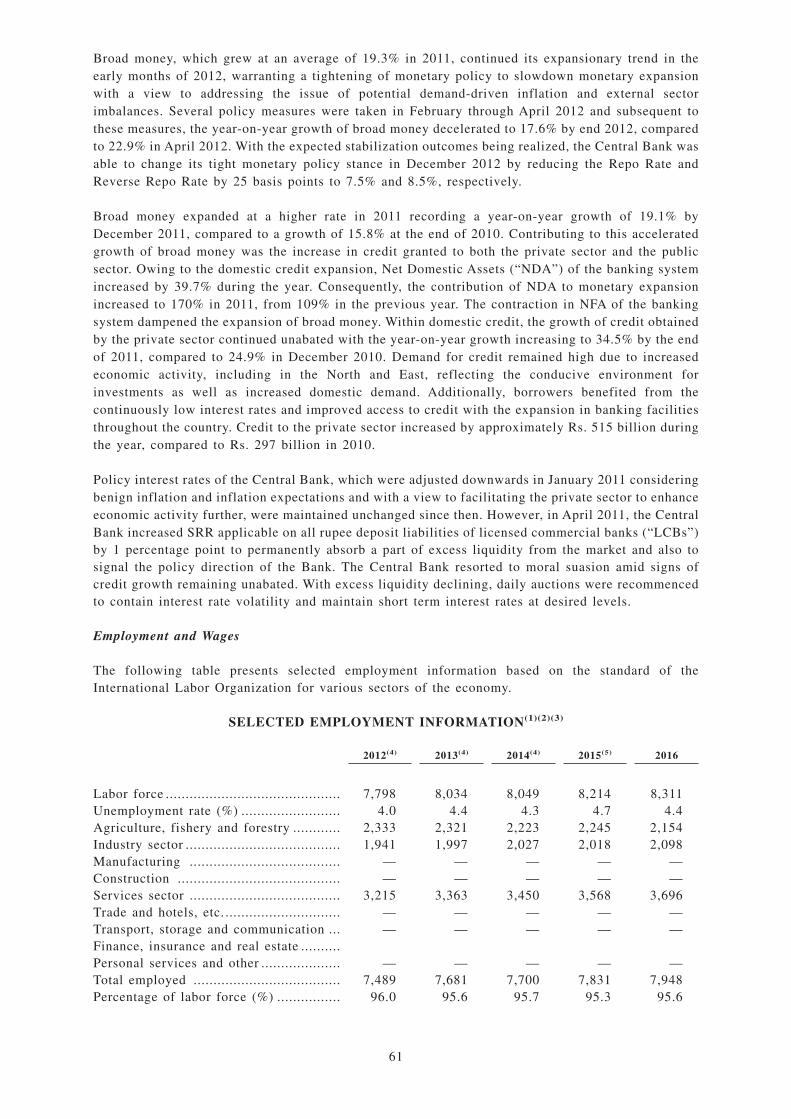
Broad money, which grew at an average of 19.3% in 2011, continued its expansionary trend in theearly months of 2012, warranting a tightening of monetary policy to slowdown monetary expansionwith a view to addressing the issue of potential demand-driven inflation and external sectorimbalances. Several policy measures were taken in February through April 2012 and subsequent tothese measures, the year-on-year growth of broad money decelerated to 17.6% by end 2012, comparedto 22.9% in April 2012. With the expected stabilization outcomes being realized, the Central Bank wasable to change its tight monetary policy stance in December 2012 by reducing the Repo Rate andReverse Repo Rate by 25 basis points to 7.5% and 8.5%, respectively.
Broad money expanded at a higher rate in 2011 recording a year-on-year growth of 19.1% byDecember 2011, compared to a growth of 15.8% at the end of 2010. Contributing to this acceleratedgrowth of broad money was the increase in credit granted to both the private sector and the publicsector. Owing to the domestic credit expansion, Net Domestic Assets (“NDA”) of the banking systemincreased by 39.7% during the year. Consequently, the contribution of NDA to monetary expansionincreased to 170% in 2011, from 109% in the previous year. The contraction in NFA of the bankingsystem dampened the expansion of broad money. Within domestic credit, the growth of credit obtainedby the private sector continued unabated with the year-on-year growth increasing to 34.5% by the endof 2011, compared to 24.9% in December 2010. Demand for credit remained high due to increasedeconomic activity, including in the North and East, reflecting the conducive environment forinvestments as well as increased domestic demand. Additionally, borrowers benefited from thecontinuously low interest rates and improved access to credit with the expansion in banking facilitiesthroughout the country. Credit to the private sector increased by approximately Rs. 515 billion duringthe year, compared to Rs. 297 billion in 2010.
Policy interest rates of the Central Bank, which were adjusted downwards in January 2011 consideringbenign inflation and inflation expectations and with a view to facilitating the private sector to enhanceeconomic activity further, were maintained unchanged since then. However, in April 2011, the CentralBank increased SRR applicable on all rupee deposit liabilities of licensed commercial banks (“LCBs”)by 1 percentage point to permanently absorb a part of excess liquidity from the market and also tosignal the policy direction of the Bank. The Central Bank resorted to moral suasion amid signs ofcredit growth remaining unabated. With excess liquidity declining, daily auctions were recommencedto contain interest rate volatility and maintain short term interest rates at desired levels.
Employment and Wages
The following table presents selected employment information based on the standard of theInternational Labor Organization for various sectors of the economy.
SELECTED EMPLOYMENT INFORMATION(1)(2)(3)
2012(4) 2013(4) 2014(4) 2015(5) 2016
Labor force ............................................ 7,798 8,034 8,049 8,214 8,311Unemployment rate (%) ......................... 4.0 4.4 4.3 4.7 4.4Agriculture, fishery and forestry ............ 2,333 2,321 2,223 2,245 2,154Industry sector ....................................... 1,941 1,997 2,027 2,018 2,098Manufacturing ...................................... — — — — —Construction ......................................... — — — — —Services sector ...................................... 3,215 3,363 3,450 3,568 3,696Trade and hotels, etc. ............................. — — — — —Transport, storage and communication ... — — — — —Finance, insurance and real estate ..........Personal services and other .................... — — — — —Total employed ..................................... 7,489 7,681 7,700 7,831 7,948Percentage of labor force (%) ................ 96.0 95.6 95.7 95.3 95.6
61
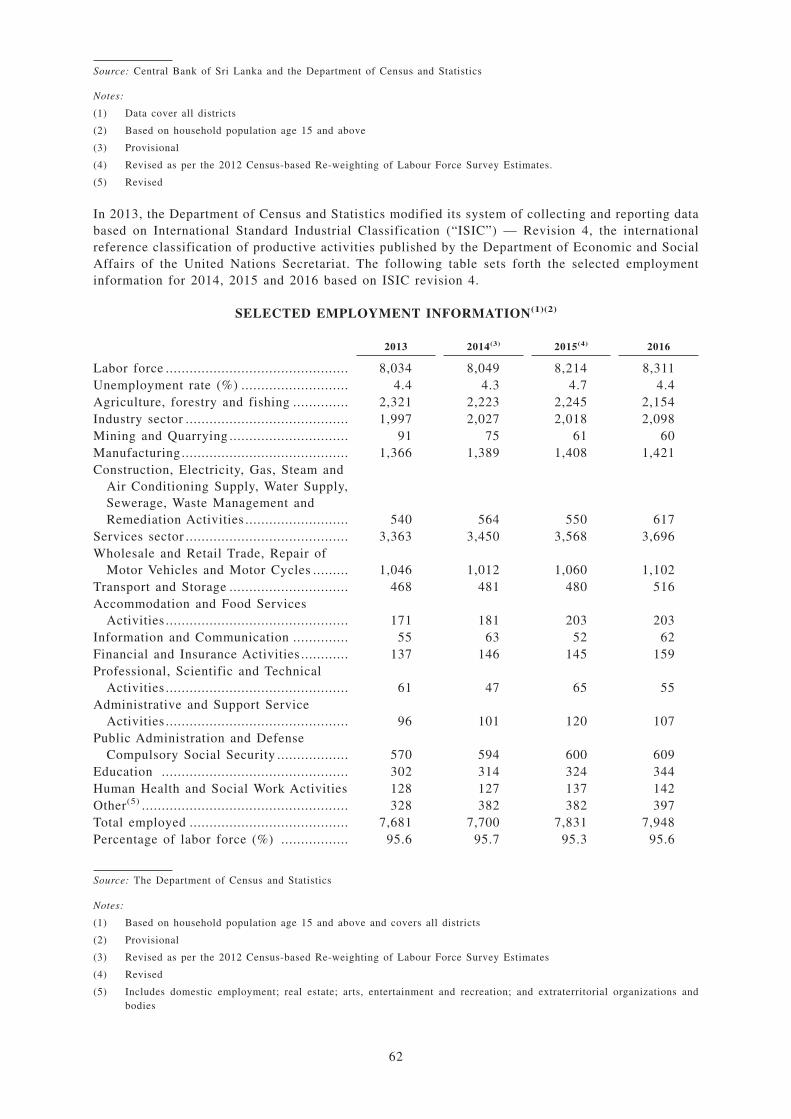
Source: Central Bank of Sri Lanka and the Department of Census and Statistics
Notes:
(1) Data cover all districts
(2) Based on household population age 15 and above
(3) Provisional
(4) Revised as per the 2012 Census-based Re-weighting of Labour Force Survey Estimates.
(5) Revised
In 2013, the Department of Census and Statistics modified its system of collecting and reporting databased on International Standard Industrial Classification (“ISIC”) — Revision 4, the internationalreference classification of productive activities published by the Department of Economic and SocialAffairs of the United Nations Secretariat. The following table sets forth the selected employmentinformation for 2014, 2015 and 2016 based on ISIC revision 4.
SELECTED EMPLOYMENT INFORMATION(1)(2)
2013 2014(3) 2015(4) 2016
Labor force .............................................. 8,034 8,049 8,214 8,311Unemployment rate (%) ........................... 4.4 4.3 4.7 4.4Agriculture, forestry and fishing .............. 2,321 2,223 2,245 2,154Industry sector ......................................... 1,997 2,027 2,018 2,098Mining and Quarrying .............................. 91 75 61 60Manufacturing .......................................... 1,366 1,389 1,408 1,421Construction, Electricity, Gas, Steam and
Air Conditioning Supply, Water Supply,Sewerage, Waste Management andRemediation Activities .......................... 540 564 550 617
Services sector ......................................... 3,363 3,450 3,568 3,696Wholesale and Retail Trade, Repair of
Motor Vehicles and Motor Cycles ......... 1,046 1,012 1,060 1,102Transport and Storage .............................. 468 481 480 516Accommodation and Food Services
Activities .............................................. 171 181 203 203Information and Communication .............. 55 63 52 62Financial and Insurance Activities ............ 137 146 145 159Professional, Scientific and Technical
Activities .............................................. 61 47 65 55Administrative and Support Service
Activities .............................................. 96 101 120 107Public Administration and Defense
Compulsory Social Security .................. 570 594 600 609Education ............................................... 302 314 324 344Human Health and Social Work Activities 128 127 137 142Other(5) .................................................... 328 382 382 397Total employed ........................................ 7,681 7,700 7,831 7,948Percentage of labor force (%) ................. 95.6 95.7 95.3 95.6
Source: The Department of Census and Statistics
Notes:
(1) Based on household population age 15 and above and covers all districts
(2) Provisional
(3) Revised as per the 2012 Census-based Re-weighting of Labour Force Survey Estimates
(4) Revised
(5) Includes domestic employment; real estate; arts, entertainment and recreation; and extraterritorial organizations andbodies
62
The unemployment rate decreased to 4.4% in 2016, compared to an unemployment rate of 4.7% in2015. The total number of unemployed persons in 2016 was estimated at 0.363 million, compared to0.383 million recorded in 2015. The female unemployment rate decreased to 7.0% in 2016 from 7.6%in 2015, while the male unemployment rate also decreased to 2.9% in 2016 from 3.0% in 2015. Thenumber of employed persons increased by 1.5% to 7.948 million in 2016, compared to 7.831 millionin 2015. The number of persons employed in the industry and services sectors increased by 3.9% and3.6%, respectively, in 2016. The number of persons employed in the agriculture sector decreased by4.0% in 2016. The labor force increased by 1.2% to 8.31 million persons in 2016 from 8.21 millionin 2015. While the labor force participation rate (“LFPR”) remained unchanged at 53.8% in 2016,female LFPR remained at 35.9% in both 2015 and 2016 while male LFPR increased marginally to75.1% in 2016 from 74.7% in 2015.
The unemployment rate increased to 4.7% in 2015, compared to an unemployment rate of 4.3% in2014. The total number of unemployed persons in 2015 was estimated at 0.383 million, compared to0.348 million recorded in 2014. The female unemployment rate increased to 7.6% in 2015 from 6.5%in 2014, while the male unemployment rate declined to 3.0% in 2015 from 3.1% in 2014. The numberof employed persons increased by 1.5% to 7.831 million in 2015, compared to 7.700 million in 2014.The increase in the number of employed persons was mainly due to the 3.4% increase in number ofpersons employed in the services sector. Meanwhile, the number of persons employed in theagricultural sector increased by 1.0% while those employed in the industry sector declined by 0.5%in 2015. The labor force increased by 2.1% to 8.214 million persons in 2015 from 8.049 million in2014, mainly due to the entry of women in to the labor force. The labor force participation rate(“LFPR”) increased to 53.8% in 2015, compared to 53.2% in 2014, primarily due to the increase infemale LFPR from 34.6% in 2014 to 35.9% in 2015. Male LFPR improved marginally from 74.6% in2014 to 74.7% in 2015.
The unemployment rate decreased marginally to 4.3% in 2014 from 4.4% in 2013. This decrease inthe unemployment rate was due to a marginal increase in employment generation. The number ofemployed workers increased by 0.3% while the number of unemployed workers decreased by 1.2%during the period. The female unemployment rate decreased to 6.5% in 2014 from 6.6% in 2013, whilethe male unemployment rate decreased to 3.1% in 2014 from 3.2% in 2013. This marginal increase inemployment was primarily observed in increases in employment in the industry and services sectors.Meanwhile, the number of workers employed in the agricultural sector declined due to adverseweather conditions during most of the year. Accordingly, the share of the number of employed workersin the agricultural sector declined to 28.9% in 2014 from 30.2% in 2013. The share of the number ofemployed workers in the industry sector increased marginally to 26.3% in 2014 from 26.0% in 2013.The services sector continued to be the foremost sector in terms of employment generation,contributing to 44.8% of total employment in 2014, compared to 43.8% in 2013. The labor forceincreased marginally to 8.049 million in 2014 from 8.034 million in 2013. The labor forceparticipation rate declined marginally to 53.2% in 2014 from 53.7% in 2013 as the result of arelatively greater increase in the working age population than in the labor force.
Wages
The employed population comprises paid employees, employers, own account (self-employed)workers and unpaid family workers. Wages in Sri Lanka fall into two main categories of employment:the public sector and the private sector. The public sector comprises government and semi-governmentinstitutions and the private sector comprises formal and informal sectors. Wages in the public sectorare largely determined by the Government. For formal private sector employees, the wage-settingmechanism includes several forms: tripartite determination, collective bargaining, remunerativetribunals, unilateral employer decisions and adjustment by Government directives. In the informalprivate sector, wages are mostly determined based on demand and supply conditions in the market.Wage movements stated below are analyzed in terms of annual average changes.
63
Public Sector
The nominal wages of public sector employees increased by 3.9% during 2016 on an annual averagebasis as measured by the public sector wage rate index compiled by the Central Bank. This increasewas a result of the incremental increase in the interim allowance to Rs. 10,000, which came into effectduring 2015, and the inclusion of a portion of the interim allowance to the basic salary in 2016, whichyielded a higher average wage index in 2016 as compared to 2015. Within the public sector, employeesin all categories, namely the senior level, tertiary level, secondary level and primary level receiveda wage increase of 5.0%, 4.4%, 3.7% and 4.6%, respectively. Real wages of the senior level, tertiarylevel and primary level public sector employees increased by 1.0%, 0.4% and 0.6%, respectively,while real wages of the secondary level public sector employees decreased by 0.2% in 2016. As aresult, real wages of overall public sector decreased by 0.1% in 2016.
The nominal wages of public sector employees increased significantly by 31.7% during 2015 as aresult of an interim allowance of Rs.10,000 that was paid to all public sector employees. Out of thetotal allowance of Rs. 10,000, Rs. 3,000 was granted under the 2015 Budget, with effect fromNovember 2014, and balances of Rs. 5,000 and Rs. 2,000 were granted under the Interim Budget for2015, with effect from February 2015 and June 2015, respectively. This increase resulted in a gain inthe nominal wage rate indices of all categories of public sector employees, namely the senior level,tertiary level, secondary level and primary level, whose wages rose by 21.5%, 28.0%, 32.2% and36.6%, respectively. Real wages of the same categories of public sector employees increased by17.1%, 23.4%, 27.4% and 31.8%, respectively, while overall real wages in the public sector recordedan increase of 27.0% in 2015.
The nominal wages of public sector employees increased by 10.5% in 2014. This was primarily dueto the increase of the monthly cost of living allowance to Rs. 7,800 from Rs. 6,600 and the interimallowance of Rs. 3,000 paid to all public sector employees from the budget proposal for 2015 effectiveNovember 2014. In real terms, public sector employees experienced a 6.7% increase in wages.
Formal Private Sector
Nominal wages of employees in the formal private sector exhibited a negligible increase during 2016,as measured by the annual average change in the minimum wage rate indices of employees whosewages are governed by the Wages Boards Trades. Accordingly, the wage rate index of employees inthe agricultural sector exhibited a negligible increase while the indices in the industry and commerce;and services sectors remained unchanged. Real wages of employees in the formal private sectordecreased by 3.6% in 2016. Real wages of employees in the agricultural, industry and commerce, andservices sectors decreased by 3.5%, 3.6% and 3.6%, respectively, in 2016.
The National Minimum Wages of Workers Act and Budgetary Relief Allowance of Workers Act werepassed in the Parliament in March 2016. Accordingly, workers receiving a monthly wage less than Rs.40,000 will be paid the provisioned allowance of Rs. 1,500 with effect from May 1, 2015 to December31, 2015, and, an additional allowance of Rs. 1,000 with effect from January 1, 2016. According tothe National Minimum Wages of Workers Act, the minimum wage is now set at Rs. 10,000.
Nominal wages of employees in the formal private sector increased by 2.9% during 2015, as measuredby the minimum wage rate indices of employees whose wages are governed by the Wages BoardsTrades. Accordingly, the wage rate index of employees in the agricultural sector increased by 3.8%while the indices in the industry and commerce and services sectors remained unchanged. Real wagesof employees in the formal private sector increased by 1.9% during 2015. Employees in theagricultural sector enjoyed real wage increases of 2.9%, while real wages of employees in bothindustry and commerce and services sectors declined by 0.9%.
Nominal wages of the employees in the formal private sector recorded an increase of 3.7% in 2014.Accordingly, the wage rate indices of the agriculture, industry and commerce; and services sectorsincreased by 2.8%, 8.4% and 3.2%, respectively, in 2014. Employees in the industry and commercesector and services sector received modest increases in nominal wages, following significant increasesof 32.9% and 21.0%, respectively, in 2013. Real wages of employees in the formal private sector
64
showed a marginal increase of 0.4% in 2014. Employees in the industry and commerce sector enjoyeda real wage increase of 5.0%, while those in the agricultural sector experienced a real wage declineof 0.5% in 2014. Meanwhile, the real wage of the employees in the services sector remainedunchanged in 2014, compared to a 13.1% increase in 2013.
Informal Private Sector
The nominal wages of informal private sector employees, as measured by the annual average changein Informal Private Sector Wage Rate Index (2012=100), increased by 7.9% in 2016. Accordingly, thenominal wage rate indices of all three sectors, namely, agricultural, industry and services sectorsincreased by 6.7%, 9.1% and 7.2%, respectively, in 2016. Meanwhile, real wages of informal privatesector employees increased by 3.7% in 2016. Real wages of employees in all three sectors, namely,the agricultural, industry and services sectors increased by 2.6%, 4.9% and 3.1%, respectively, in2016.
Nominal wages of informal private sector employees increased by 7.3% during 2015. Accordingly, thenominal wage rate indices of all three sectors, namely, the agricultural, industry and services sectorsincreased by 8.5%, 8.4% and 5.9%, respectively, in 2015. Meanwhile, real wages of informal privatesector employees increased by 3.5% in 2015. Real wages of employees in all three sectors, namely,agriculture, industry and services increased by 4.6%, 4.5% and 2.0%, respectively, in 2015.
Nominal wages of informal private sector employees increased by 7.6% during 2014. Accordingly, thenominal wage rate indices of the agricultural, industry and services sectors increased by 6.3%, 8.2%and 7.5%, respectively, in 2014. Meanwhile, real wages of informal private sector employeesincreased by 3.8% in 2014. Real wages of employees in the agricultural, industry and services sectorsincreased by 2.7%, 4.4% and 3.8%, respectively, in 2014.
Labor Productivity
Labor productivity, as measured by value added (in 2010 prices) per hour worked, increased by 0.2%to reach Rs. 463.20 in the first nine months of 2016, compared to Rs. 462.09 in the correspondingperiod in 2015. The agricultural sector exhibited the most efficient use of labor resources, with a 6.3%growth in labor productivity amid decreases in the number of persons employed and the number ofhours worked. Although both the value added and the number of persons employed in the industry andservices sectors increased, both sectors registered labor productivity declines of 2.9% and 2.7%,respectively. Although the agricultural sector exhibited a robust growth in productivity, the level oflabor productivity in the agricultural sector continues to remain the lowest of all three sectors in theeconomy, with Rs. 173.70 per hour worked compared to Rs. 503.27 and Rs. 561.41 in the industry andservices sectors, respectively, for the first three quarters of 2016.
Labor productivity, as measured by value added (in 2010 prices) per hour worked, increased by 3.4%to reach Rs. 465.15 per hour in 2015, compared to Rs. 449.76 per hour in 2014. The agriculture sectorrecorded a 3.6% growth in labor productivity although the level of labor productivity in the sectorcontinues to remain the lowest of all three sectors. Despite the decrease in persons employed and thenumber of hours worked, the industry sector registered a labor productivity growth of 3.4%.Meanwhile, owing to the increases in the number of persons employed and the number of hoursworked in the services sector, labor productivity in the services sector increased by 3.3%.
Labor productivity increased by 3.3% to Rs. 449.76 per hour in 2014, compared to Rs. 435.32 per hourin 2013. Increases were achieved across all three sectors in the economy. The highest laborproductivity growth of 8.7% was observed in the agriculture sector. The industry sector recorded a1.9% growth, while the services sector recorded a productivity growth of 1.5% in 2014.
Labor Relations
The total number of strikes in the private sector decreased while the number of workers involved andthe total man-days lost increased during 2016. The number of strikes in the private sector declinedfrom 51 to 41 while the number of workers involved in strikes increased from 14,915 in 2015 to 20,652
65
in 2016. The decline in the number of strikes was observed in both plantation and other sectors.Nevertheless, on an overall basis, labor relations deteriorated in terms of the number of man-days lostdue to strikes, which increased by 26.8% from 82,294 in 2015 to 104,327 in 2016, primarily due tothe protracted strikes in the sectors other than plantation sector.
The total number of strikes and the number of workers involved in strikes in the private sectorincreased during 2015. The number of strikes in the private sector increased from 38 to 51 while thenumber of workers involved in strikes increased from 6,451 in 2014 to 14,915 in 2015. The increasesin workers involved in strikes and total man days lost were observed in both plantation and othersectors. Labor relations worsened in terms of the number of man-days lost due to strikes, whichincreased by 120.5% from 37,323 in 2014 to 82,294 in 2015, primarily due to the protracted strikesin the plantation sector.
The total number of strikes, the number of employees involved in strikes and the total man days lostin the private sector due to those strikes decreased considerably in 2014 compared to 2013. Althoughthe number of strikes in the plantation sector increased in 2014, the number of strikes recorded in theother sectors declined. As a result, the total number of strikes in the private sector decreased to 38 in2014 from 42 in 2013. Further, most of these strikes were token strikes, caused by short-termdisagreements of the striking workers with their respective managements, with minimal adverseimpact. Meanwhile, workers involved in the strikes in the private sector decreased significantly by42.0% in 2014. This led to a significant decrease in the number of man days lost in the private sectorby 53.6% in 2014. However, the man days lost in the plantation sector was higher in 2014 than thoseof the other sectors in the private sector.
Samurdhi Welfare Program
The “Samurdhi Welfare Program” is a program aimed at providing a safety net for the poor to raisetheir incomes above the poverty line. The percentage of the population living below the nationalpoverty threshold declined to 6.7% in 2012/13, compared to 8.9% based on the 2009/10 survey and15.2% based on the 2006/7 survey. The Government continued to channel resources to livelihooddevelopment initiatives through Samurdhi/Divineguma in 2016, with the objective of improvingsocioeconomic conditions of low income households in the country. The Department of DivinegumaDevelopment was established in early 2014 by consolidating the Samurdhi Authority of Sri Lanka, theSouthern Development Authority and the Udarata Development Authority. The establishment of thisdepartment is expected to improve institutional strength to carry out development activities targetedat poverty alleviation, food security and individual empowerment through providing micro-financefacilities, development of physical and social infrastructure and development of human capital toimprove the living standard of low income households. The Samurdhi relief was increased by 100%to Rs. 3,000 per month, from Rs. 1,500 per month, commencing from January 2015. This was furtherincreased to Rs. 3,500 per month with effect from April 2015. A total of 1,407,235 families benefitedfrom the Divineguma Subsidy Program in 2016 with the total value of grants reaching Rs.40,740million (US$ 279.8 million) compared to 1,453,078 families with the value of grants being Rs. 39,994million (US$ 294.2 million) in 2015.
Recognizing the importance of eradicating poverty for inclusive economic growth in Sri Lanka, theGovernment has declared 2017 as the “Year of Poverty Alleviation”. The Government has created aprogram to give due recognition and implement a comprehensive poverty alleviation program for SriLanka while giving priority to attain the Sustainable Development Goals (“SDGs”) by 2030 througha collaborative approach.
66
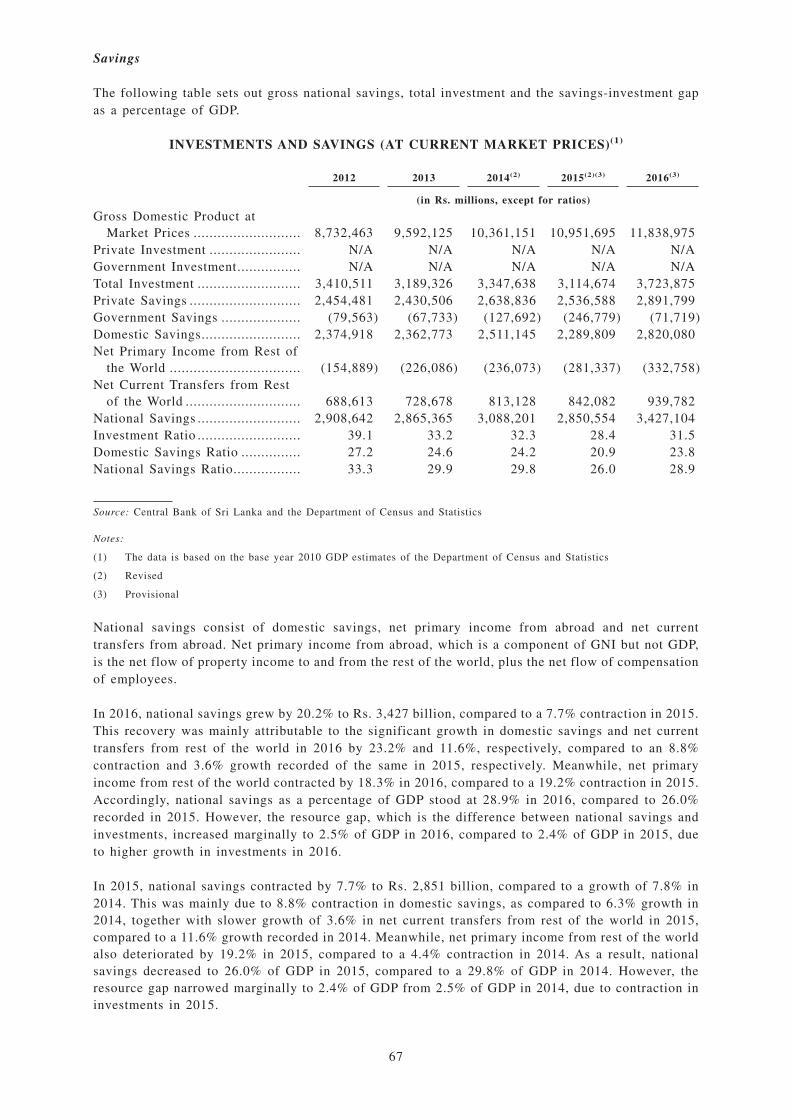
Savings
The following table sets out gross national savings, total investment and the savings-investment gapas a percentage of GDP.
INVESTMENTS AND SAVINGS (AT CURRENT MARKET PRICES)(1)
2012 2013 2014(2) 2015(2)(3) 2016(3)
(in Rs. millions, except for ratios)
Gross Domestic Product atMarket Prices ........................... 8,732,463 9,592,125 10,361,151 10,951,695 11,838,975
Private Investment ....................... N/A N/A N/A N/A N/AGovernment Investment................ N/A N/A N/A N/A N/ATotal Investment .......................... 3,410,511 3,189,326 3,347,638 3,114,674 3,723,875Private Savings ............................ 2,454,481 2,430,506 2,638,836 2,536,588 2,891,799Government Savings .................... (79,563) (67,733) (127,692) (246,779) (71,719)Domestic Savings......................... 2,374,918 2,362,773 2,511,145 2,289,809 2,820,080Net Primary Income from Rest of
the World ................................. (154,889) (226,086) (236,073) (281,337) (332,758)Net Current Transfers from Rest
of the World ............................. 688,613 728,678 813,128 842,082 939,782National Savings .......................... 2,908,642 2,865,365 3,088,201 2,850,554 3,427,104Investment Ratio .......................... 39.1 33.2 32.3 28.4 31.5Domestic Savings Ratio ............... 27.2 24.6 24.2 20.9 23.8National Savings Ratio................. 33.3 29.9 29.8 26.0 28.9
Source: Central Bank of Sri Lanka and the Department of Census and Statistics
Notes:
(1) The data is based on the base year 2010 GDP estimates of the Department of Census and Statistics
(2) Revised
(3) Provisional
National savings consist of domestic savings, net primary income from abroad and net currenttransfers from abroad. Net primary income from abroad, which is a component of GNI but not GDP,is the net flow of property income to and from the rest of the world, plus the net flow of compensationof employees.
In 2016, national savings grew by 20.2% to Rs. 3,427 billion, compared to a 7.7% contraction in 2015.This recovery was mainly attributable to the significant growth in domestic savings and net currenttransfers from rest of the world in 2016 by 23.2% and 11.6%, respectively, compared to an 8.8%contraction and 3.6% growth recorded of the same in 2015, respectively. Meanwhile, net primaryincome from rest of the world contracted by 18.3% in 2016, compared to a 19.2% contraction in 2015.Accordingly, national savings as a percentage of GDP stood at 28.9% in 2016, compared to 26.0%recorded in 2015. However, the resource gap, which is the difference between national savings andinvestments, increased marginally to 2.5% of GDP in 2016, compared to 2.4% of GDP in 2015, dueto higher growth in investments in 2016.
In 2015, national savings contracted by 7.7% to Rs. 2,851 billion, compared to a growth of 7.8% in2014. This was mainly due to 8.8% contraction in domestic savings, as compared to 6.3% growth in2014, together with slower growth of 3.6% in net current transfers from rest of the world in 2015,compared to a 11.6% growth recorded in 2014. Meanwhile, net primary income from rest of the worldalso deteriorated by 19.2% in 2015, compared to a 4.4% contraction in 2014. As a result, nationalsavings decreased to 26.0% of GDP in 2015, compared to a 29.8% of GDP in 2014. However, theresource gap narrowed marginally to 2.4% of GDP from 2.5% of GDP in 2014, due to contraction ininvestments in 2015.
67
In 2014, national savings grew by 7.8% to Rs. 3,088 billion, compared to a contraction of 1.5% in2013. Domestic savings rebounded with a growth of 6.3% compared to a 0.5% decline in 2014 whilenet current transfers from rest of the world increased to 11.6% compared to a 5.8% growth in 2013.Moreover, the net primary income from rest of the world contracted by 4.4% during the year comparedto a 46.0% contraction in 2013. However, the national savings slightly decreased to 29.8% of GDP in2014, compared to 29.9% of GDP in 2013, due to higher growth in nominal GDP. Meanwhile, theresource gap narrowed to 2.5% of GDP in 2014 from 3.4% of GDP in 2013.
In 2013, national savings contracted by 1.5% to Rs. 2,865 billion, compared to a growth of 53.3% in2012. This contraction was due to unfavorable developments in domestic savings as well as slowgrowth in net current transfers. National savings decreased to 29.9% of GDP, compared to 33.3% in2012. Net current transfers from rest of the world also grew at a slower rate in 2013. The growth innational savings was further dampened by the higher deterioration in net primary income from rest ofthe world. Meanwhile, the resource gap, which refers to the difference between national savings andinvestment as a ratio of GDP, narrowed to 3.4% of GDP in 2013 from 5.7% of GDP in 2012.
Balance of Payments
Overview
BOP figures measure the relative flow of goods, services and capital into and out of the country asrepresented in the current account and the capital and financial account. The current account tracksthe country’s trade in goods, services, income and current transfer transactions. The capital andfinancial account includes the capital account, which covers all transactions involving capital transfersand acquisition or disposition of non-produced, non-financial assets, and the financial account, whichcovers all transactions associated with changes of ownership in foreign financial assets and liabilitiesof an economy. A BOP surplus indicates a net inflow of foreign currencies, thereby increasing demandfor and strengthening the local currency. A BOP deficit indicates a net outflow of foreign currencies,thereby decreasing demand for and weakening the local currency. Prior to 2012, the presentation ofBOP was based on the fifth edition of the BOP and International Investment Position manual of theIMF. In 2013, the Central Bank modified its system of collecting and reporting data based on BOP andInternational Investment Position Compilation Guide (“BPM6”), a set of revised and updatedstandards for concepts, definitions and classifications for international accounts statistics publishedby the IMF. As such, from 2012 onwards, all external sector statistics, i.e., BOP, IIP (internationalinvestment position) and EDS (external debt statistics) are reported based on BPM6.
68
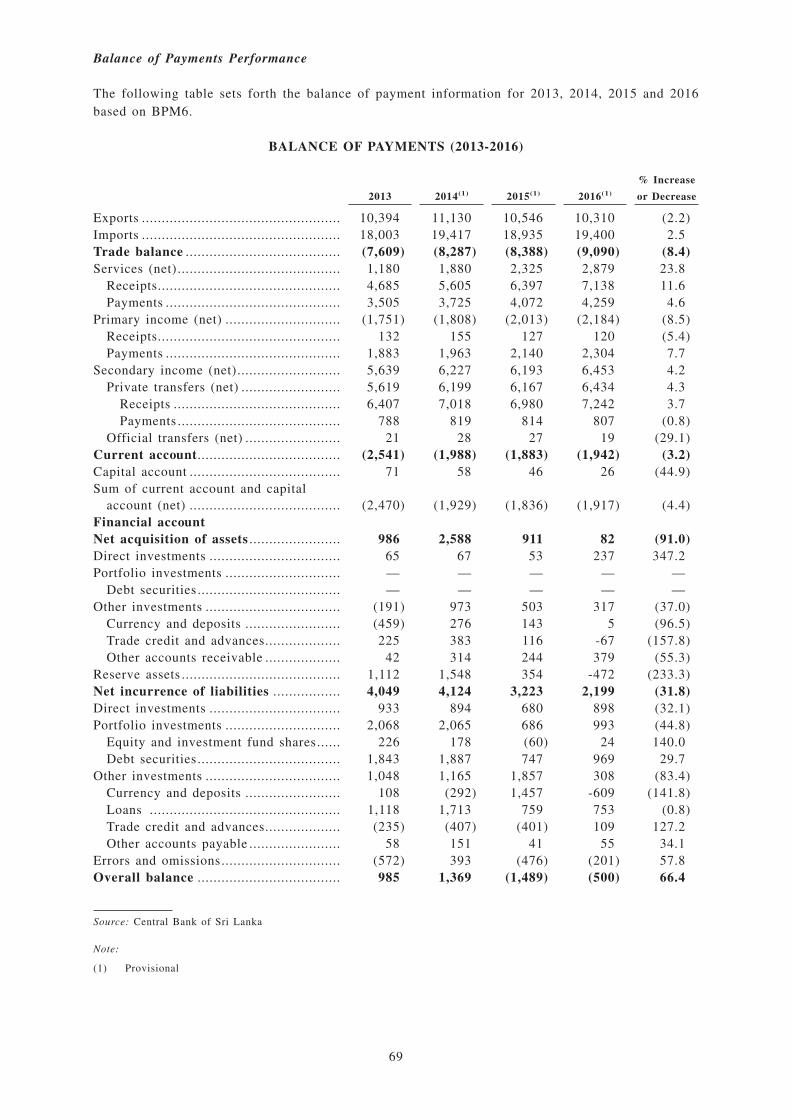
Balance of Payments Performance
The following table sets forth the balance of payment information for 2013, 2014, 2015 and 2016based on BPM6.
BALANCE OF PAYMENTS (2013-2016)
2013 2014(1) 2015(1) 2016(1)
% Increase
or Decrease
Exports .................................................. 10,394 11,130 10,546 10,310 (2.2)Imports .................................................. 18,003 19,417 18,935 19,400 2.5Trade balance ....................................... (7,609) (8,287) (8,388) (9,090) (8.4)Services (net) ......................................... 1,180 1,880 2,325 2,879 23.8
Receipts.............................................. 4,685 5,605 6,397 7,138 11.6Payments ............................................ 3,505 3,725 4,072 4,259 4.6
Primary income (net) ............................. (1,751) (1,808) (2,013) (2,184) (8.5)Receipts.............................................. 132 155 127 120 (5.4)Payments ............................................ 1,883 1,963 2,140 2,304 7.7
Secondary income (net).......................... 5,639 6,227 6,193 6,453 4.2Private transfers (net) ......................... 5,619 6,199 6,167 6,434 4.3
Receipts .......................................... 6,407 7,018 6,980 7,242 3.7Payments ......................................... 788 819 814 807 (0.8)
Official transfers (net) ........................ 21 28 27 19 (29.1)Current account.................................... (2,541) (1,988) (1,883) (1,942) (3.2)Capital account ...................................... 71 58 46 26 (44.9)Sum of current account and capital
account (net) ...................................... (2,470) (1,929) (1,836) (1,917) (4.4)Financial accountNet acquisition of assets ....................... 986 2,588 911 82 (91.0)Direct investments ................................. 65 67 53 237 347.2Portfolio investments ............................. — — — — —
Debt securities .................................... — — — — —Other investments .................................. (191) 973 503 317 (37.0)
Currency and deposits ........................ (459) 276 143 5 (96.5)Trade credit and advances................... 225 383 116 -67 (157.8)Other accounts receivable ................... 42 314 244 379 (55.3)
Reserve assets ........................................ 1,112 1,548 354 -472 (233.3)Net incurrence of liabilities ................. 4,049 4,124 3,223 2,199 (31.8)Direct investments ................................. 933 894 680 898 (32.1)Portfolio investments ............................. 2,068 2,065 686 993 (44.8)
Equity and investment fund shares...... 226 178 (60) 24 140.0Debt securities .................................... 1,843 1,887 747 969 29.7
Other investments .................................. 1,048 1,165 1,857 308 (83.4)Currency and deposits ........................ 108 (292) 1,457 -609 (141.8)Loans ................................................ 1,118 1,713 759 753 (0.8)Trade credit and advances................... (235) (407) (401) 109 127.2Other accounts payable ....................... 58 151 41 55 34.1
Errors and omissions.............................. (572) 393 (476) (201) 57.8Overall balance .................................... 985 1,369 (1,489) (500) 66.4
Source: Central Bank of Sri Lanka
Note:
(1) Provisional
69
The BOP in 2016 reflected the subdued performance of the external sector with a widening of thecurrent account deficit and a moderation in the financial account. The current account deficit in 2016increased marginally to 2.4% of GDP from 2.3% in 2015. The trade deficit expanded during the year,with an increase in import expenditure, particularly with higher domestic demand for investmentgoods, while earnings from merchandise exports contracted with the drop in both internationalcommodity prices and export volumes. The deficit in the primary income account also widened during2016 as a result of the decline in earnings from reserve assets and continued interest payments amidoutflows on account of reinvested earnings and dividend payments. However, the adverse impact ofthe trade deficit and the primary income account deficit was dampened to some extent by surplusesin the services account and the secondary income account. The surplus in the services accountcontinued to increase, particularly with higher earnings from tourism, while the secondary incomeaccount benefitted from the moderate expansion in workers’ remittances in 2016. Meanwhile, thefinancial account continued to experience higher outflows amid modest inflows by way of non-debtcreating sources. In particular, lower levels of FDI and capital outflows arising from disinvestment ofGovernment securities by non-residents, together with continued debt service payments, adverselyimpacted the financial account in 2016. The lack of non-debt creating inflows to the financial accountand the widening of the current account deficit necessitated financing from the rest of the world.Accordingly, the funding requirement of the BOP was met through the issuance of an ISB andsyndicated loans. In addition, to overcome the economic challenges against the backdrop of anincreasingly volatile global economic environment, Sri Lanka sought an EFF from the IMF in 2016.
On cumulative terms, tourist earnings are estimated to have increased by 3.4% to US$ 1,038 millionduring the first quarter of 2017, compared to US$ 1,003 million during the corresponding period in2016. For the first two months of 2017, workers’ remittances recorded a growth of 2.0%, with aninflow of US$ 1,140 million, compared to US$ 1,118 million during the corresponding period of 2016.
During 2016 Sri Lanka’s external sector experienced lower than expected inflows to the current andfinancial accounts and higher foreign exchange outflows in 2015. The current account deficit in 2015amounted to US$ 1.9 billion and declined to 2.3% of GDP. Although the merchandise trade deficitcontinued to widen in 2015 due to the increase in non-oil imports and the slowdown in exportearnings, a substantial increase was largely avoided by the low expenditure on the importation ofcrude oil. The primary income account also widened with increased interest payments during the year.However, the surpluses in the services and secondary income accounts enabled the current accountdeficit to remain almost unchanged from the previous year’s level. The financial account wasadversely affected by the decline in non-debt creating inflows, the slowdown in inflows to theGovernment and gradual reversal of investments in Government securities, due to the expectation ofan, and the subsequent, increase in interest rates in the US. This resulted in the BOP recording anoverall deficit of US$ 1,489 million in 2015. The lackluster performance in the BOP was reflected inthe decline in gross official reserves to US$ 7.3 billion as at the end of 2015, equivalent to 4.6 monthsof imports. Meanwhile, the rupee, which depreciated by 2.42% against the US dollar during the firsteight months, depreciated at a higher rate during the last four months of the year following the CentralBank’s decision to allow greater flexibility in the determination of the exchange rate from earlySeptember 2015. During the year, the Sri Lankan rupee depreciated by 9.03% against the US dollar.Greater flexibility in the exchange rate helped stabilize trade and current account deficits towards theend of 2015 although short term capital outflows continued into 2016 as well.
The external sector sustained its growth momentum in 2014, with relatively better performance in thefirst half of the year. Exports grew by 7.1%, with noticeable expansion in industrial exports, especiallygarment exports and agricultural exports. The expansion in exports was supported by increaseddemand from the United States and the EU and conducive macroeconomic conditions that prevailedin the domestic economy for the producers. Meanwhile, imports grew by 7.9%, largely due to theincreased fuel and motor vehicle imports during the second half of the year. Consequently, the tradedeficit widened by 8.9% to US$ 8.3 billion in 2014, resulting in a negative impact on the externalsector current account deficit. However, the receipts from trade in services increased as a result ofincreases in travel, transport and telecommunication, computer and information services sub-sectors.At the same time, earnings from tourism was supported by both an increase in tourist arrivals, which
70
surpassed 1.5 million by the end of 2014, and a higher average spending per guest per night. Theimprovement in the current account, together with inflows to the financial account, resulted in theoverall balance recording a surplus of US$ 1,369 million in 2014, compared to a surplus of US$ 985million in 2013.
Reserve assets held by the Central Bank and the Government, which comprise foreign currencyreserves, gold balances, reserve position in the IMF, SDR holdings and other reserve assets, amountedto US$ 8.2 billion in 2014. Proceeds from international sovereign bond issuances in January and April2014, disbursements under foreign funded projects and net absorption of excess liquidity in theforeign exchange market all helped to improve the reserve asset position, despite outflows on accountof foreign debt service payments and SBA Facility payments during 2014. Meanwhile, total foreignassets, which consist of reserve assets as well as foreign financial assets of deposit takingcorporations, increased to US$ 9.9 billion in 2014. The reserve assets position of the Central Bank andthe Government in 2014 was equivalent to 5.1 months of import of goods and 4.3 months of importof goods and services, compared to the internationally accepted norm of 3 months of imports. Totalforeign assets were equivalent to 6.1 months of imports of goods and 5.1 months of imports of goodsand services.
Gross official reserves of the country increased to US$ 7.5 billion in 2013, compared to US$ 7.1billion in 2012. Adequate levels of reserves were maintained throughout 2013 despite outflowsrelating to foreign debt service payments and SBA Facility payments, among others. The proceedsfrom the issuances of debt securities by NSB, DFCC and BOC (totaling US$ 1.35 billion) and otherreceipts contributed to the maintenance of gross official reserves at a stable level. In 2013, grossofficial reserves were equivalent to five months of imports, compared to the internationally acceptednorm of 3 months. Meanwhile, total foreign assets, which consist of reserve assets managed by theCentral Bank as well as foreign financial assets of deposit taking corporations, increased to US$ 8.6billion in 2013, equivalent to 5.7 months of imports.
In 2012, Sri Lanka’s external sector strengthened further, despite the challenging global economicenvironment, largely supported by the prudent policy package implemented by the Central Bank andthe Government in early 2012. The widening trade deficit, driven by a sharp growth in imports anda slowdown in exports due to weak global demand, was a key policy challenge faced at the beginningof 2012. With a view to ensuring macroeconomic stability, the Central Bank and the Governmentimplemented a strong policy package, which allowed greater flexibility in the exchange rate, increasedthe policy interest rates, imposed a ceiling on the growth of credit granted by licensed banks andraised customs duties on selected imports. As a result of these policy measures, expenditure on importsdeclined by 5.4% in 2012 with non-fuel imports decreasing at a higher rate of 8.6%. Although greaterflexibility in the exchange rate helped augment export competitiveness, the decline in internationalcommodity prices and subdued global demand, amid faltering economic activity in the US and Europe,resulted in exports declining by 7.4% in 2012. In absolute terms, however, the decline in importexpenditure was larger than the decline in earnings from exports, and, as a result, the trade deficitcontracted by 3.1% to US$ 9.4 billion. As a percentage of the GDP, the trade deficit declined from16.4% in 2011 to 15.8% in 2012.
Current Account
The current account deficit widened during 2016 amid the deterioration of the trade account and theprimary income account, despite the surpluses in the services and the secondary income accounts. Asignificant deterioration of the trade balance was witnessed, particularly during the fourth quarter of2016, as a result of increased import expenditure on intermediate and investment goods amid a declinein earnings from exports. However, increased inflows to the services account, which was primarilydriven by the substantial increase in earnings from tourism and the surplus in the secondary incomeaccount, consisting mainly of workers’ remittances, helped cushion the deficits in the trade and
71
primary income accounts of the current account to a certain extent. As a result, the current accountdeficit widened marginally to US$ 1,942 million in 2016, compared to US$ 1,883 million in 2015.Accordingly, the current account deficit as a percentage of GDP increased marginally to 2.4% of GDPin 2016 in comparison to 2.3% of GDP in 2015.
Despite the widening of the deficits in trade and income accounts, the deficit in the external currentaccount was limited to US$ 1.9 billion in 2015, mainly due to the surpluses in the services andsecondary income accounts. The merchandise trade deficit continued to widen in 2015 due to anincrease in the expenditure on the importation of consumer goods and the slowdown in exportearnings. However, a substantial increase in the trade deficit was largely abated by the lowexpenditure on the importation of crude oil, driven by the significant decline in oil, prices in theinternational markets, resulting in the merchandise trade deficit recording a marginal increase of 1.7%in 2015 over the previous year. However, the deficits in trade and income accounts were partiallyoffset by the surplus in the services account, which was mainly driven by a substantial increase inearnings from tourism and the surplus in the secondary income account, although the latterexperienced a notable setback during the year, due to a marginal decline in workers’ remittances.Consequently, the current account deficit amounted to US$ 1,883 million in 2015, compared to US$1,988 million a year earlier. However, the current account deficit as a percentage of GDP narrowedslightly to 2.3% of GDP in 2015, compared to 2.5% of GDP in 2014, as a result of the moderate growthin the nominal GDP.
In 2014, the current account recorded a lower deficit of US$ 2,018 million, compared to a currentaccount deficit of US$ 2,541 million in 2013. This improvement in the current account was supportedby the improvement in performance of trade in services and secondary income. The services accountrecorded higher inflows mainly from the transport, travel and the telecommunication, computer andinformation services sub-sectors, while workers’ remittances also contributed to the reduction of thecurrent account deficit during 2014.
In 2013, the current account recorded a deficit of US$ 2,541 million, compared to a deficit of US$3,982 million in 2012. The narrowing of the current account deficit was primarily due to the shrinkingof the deficit in the trade account as a result of a decline in imports and an increase in exports. Asignificant increase in inflows to the services account, by way of earnings from tourism,transportation, computer and information services and workers’ remittances, helped strengthen thecurrent account deficit during the year, with workers’ remittances alone helping to cushion more than84% of the trade deficit.
Goods Trade
Since liberalization of the economy in 1977, foreign trade policy and trade structure have undergoneconsiderable changes. The external sector was one of the prime drivers of the economy as internationaltrade and finance operated in a free and liberal economic environment. There is full current accountconvertibility, partial capital account convertibility and a freely floating exchange rate regime. Beinga small, open economy, the continuously improving economic environment and the greater freedom intrade, investment and payments have benefited Sri Lanka in maintaining its growth momentum and instrengthening its ability to face external shocks during the last three decades. Current accountconvertibility has been maintained as defined under the IMF Article VIII since 1994. To safeguard thecountry from large and volatile capital flows, limited capital account restrictions are still in place.However, the capital account was gradually relaxed in a staggered manner since 2006 by providingopportunities to foreign nationals to invest in rupee denominated Government Treasury bonds andTreasury bills. As announced in the 2011 Budget, the Central Bank has relaxed foreign exchangecontrols in order to facilitate the foreign exchange transactions in the emerging economicenvironment. Accordingly, the Central Bank has relaxed foreign exchange regulations relating toinvestment by Sri Lankans abroad, foreign borrowings by resident companies and investment bynon-residents in the domestic market. The continuation of a freely floating exchange rate regime since2001 has also served the economy well, particularly for the export sector to maintain its externalcompetitiveness, through autonomous adjustments in the exchange rate broadly in line with changesin economic fundamentals of the country.
72
Given the small size of the economy and limited domestic demand, Sri Lanka has adopted externaltrade relations and policies aimed at enhancing the integration of the domestic economy with globalmarkets. This helped the country benefit from increasing global demand, technological developmentsand the transfer of skills and knowledge. Sri Lanka remains firmly committed to the multilateraltrading system, being a founding member of the WTO, and it has made commitments to the WTO ontrade in goods and also made commitments under the GATS on insurance, telecommunications,tourism and financial services. As an active member of the WTO Ministerial Meeting, Sri Lankacontributed to the success of countries having similar interests, in designating a number of agriculturalproducts as special products which would be exempt from further tariff cuts to support local farmers.Sri Lanka also made progress in furthering its regional and bilateral trading arrangements in recentyears. Sri Lanka is a signatory of many trading arrangements, such as the Indo-Sri Lanka Free TradeAgreement, Pakistan-Sri Lanka Free Trade Agreement, Asia Pacific Trade Agreement and South AsiaFree Trade Arrangement. Furthermore, Sri Lanka continued its efforts to expand bilateral traderelations with China through the China Sri Lanka Free Trade Agreement (the “CSFTA”). TheMemorandum of Understanding (“MOU”) on initiating the negotiations of the CSFTA was signed inSeptember 2014. The CSFTA covers trade in goods and services, investment, and economic andtechnical cooperation. The first and the second round negotiations were held in September 2014 andin November 2014, respectively, where both nations negotiated the list of ‘highly sensitive products’,‘general sensitive products’, and ‘normal products’ to be incorporated into the agreement. Furthernegotiations focused on the rules of origin and product list to be incorporated under the proposedCSFTA. The third and fourth rounds of negotiations were held in August 2016 in Colombo and inNovember 2016 in Beijing, respectively. The fifth and sixth rounds were held in January 2017 andMarch 2017, respectively. Further, in June 2016, Sri Lanka and Singapore announced the intent topursue a comprehensive FTA. This FTA is expected to focus on export-led growth, employmentgeneration, expanding market to attract investments with technical know-how and expertise, and theusage of supply chain linkages of both countries. A feasibility study carried out by both parties wasfollowed by a scoping mission from Singapore in July 2016, for initial discussions with relevantinstitutions on the scope and coverage of the proposed FTA. The first three rounds of negotiationswere held in 2016 and another two rounds were held in January and April 2017. FTAs with both Chinaand Singapore are expected to be finalized during 2017. The FTA with India is expected to bereinforced through the inclusion of the services sector and by creating more investment opportunitiesthrough the proposed Economic and Technology Cooperation Agreement (“ETCA”). Negotiations onthe ETCA are expected to deepen the current ISFTA on goods, technology cooperation, economiccooperation, liberalising services and investments. The preliminary official level discussions startedin August 2016, where the two parties had only explored the broader scope of ETCA and the areas thatwould be considered within the framework. The negotiations continued in September 2016 andJanuary 2017, post which the Government expects to finalize negotiations before the end of 2017.
In order to simplify the tax structure, the five-band customs duty structure of 0.0%, 2.5%, 6.0%,15.0% and 28.0%, respectively, was changed to a four-band customs duty structure of 0.0%, 5.0%,15.0% and 30.0%, respectively, in 2010. Although, different duty rates were imposed on differentitems considering their impact to various stakeholder groups, recent policy direction is to furthersimplify the tariff bands in operation. Except for a few items, raw materials for local industries arekept at low duty rates, while rates for finished products are higher. Accordingly, more incentives havebeen granted to local manufacturers. In the 2014 Budget, the tariff structure was further consolidatedto 0.0%, 7.5%, 15.0% and 25.0%, in line with the Government’s policy direction towards furtherreducing tariff rates. Accordingly, 3,379 tariff lines out of 6,577 were placed at the zero duty band.In line with the policy to further simplify the tax structure and lower the tax rate, the 30% customsduty, which is applicable on end-user products, was reduced to 25%. This policy direction would besimplified further as in the Budget 2016, where a three band customs duty structure of exempt, 15%and 30% was implemented.
On August 15, 2010, the EU member states decided to withdraw preferential tariff benefits that SriLanka had received under the Special Incentive Arrangement for Sustainable Development and GoodGovernance as part of the GSP+ scheme. The GSP+ scheme, which exempted more than 7,200products from EU import duties, primarily benefited Sri Lanka’s apparel exporters. Following thiswithdrawal, Sri Lankan exports reverted to the standard EU-GSP, which still provides preferences forkey Sri Lankan products such as clothing. The decline in competitiveness that has resulted from the
73
GSP+ withdrawal appears to have been partially offset by Sri Lanka’s focus on long-term preparationsto adjust to conditions without the GSP+ benefits, the firm level actions taken towards differentiatingand diversifying products as well as markets, improvements in the quality and branding of products,negotiations with buyers, enhancements in productivity and reductions in finance and input cost,coupled with an improved macroeconomic environment. The resulting improvements incompetitiveness have helped Sri Lankan exports move forward amid challenges. The presentGovernment has recognised the importance of removing prevailing obstacles for external trade inorder to promote exports. In this regard, initiatives were taken to regain the EU-GSP+ and to adhereto the international rules on fisheries, for the lifting of the ban imposed by the European Commission(“EC”) on fish exports to the EU. The application for regaining the EU-GSP+ facility was submittedto the EC in July 2016. After a thorough review process, in January 2017, the EC proposed to reinstatethe EU-GSP+ in exchange for Sri Lanka’s commitment to ratify and effectively implement 27international conventions related to human rights, labor rights, protection of the environment and goodgovernance, while allowing the EU Parliament to raise any potential objections within a period of fourmonths. The government expects the GSP+ status to be reinstated by the first half of 2017. Inmid-January 2015, the EU banned importing fish from Sri Lanka, as it suspected that Sri Lanka wasnot complying with international rules on illegal fishing and employing inadequate control systems inthe Sri Lankan fisheries industry. Discussions were held to negotiate the ban on fish exports, whilesteps were taken to improve the Sri Lankan fisheries industry’s compliance with internationalstandards and requirements specified by the EU. As a result, in April 2016, the EU recommendedlifting the fish import ban of Sri Lanka and such removal of the ban was approved by the EUParliament in June 2016, who cited Sri Lanka’s successfully reformation of its fisheries governancesystem. With the EU market being one of the major seafood exporting destinations for Sri Lanka, thisdevelopment contributed significantly towards promoting Sri Lankan seafood exports. Since theremoval of the ban, seafood exports to the EU grew by 110.0%, year-on-year, during the second halfof 2016.
Considering the diverse regulatory issues faced by private actors when importing materials, equipmentand other goods, it was proposed in Budget 2016 to establish a “one-stop-shop” concept at the SriLanka Customs, which provides all the necessary permissions, clearances and approvals at a singlewindow platform. Accordingly, in January 2016, Sri Lanka Customs initiated operation of the SingleWindow System, with border regulatory agencies linked to the system to facilitate ease of obtainingapprovals. By recognizing the need for broad-based institutional support, the Government took stepsto create two agencies, the Agency for International Trade (“AfIT”) and the Agency for Development(“AfD”), as purposed by Budget 2016. The AfIT is responsible for rectifying issues in existing tradepacts with the Indian subcontinent while exploring an economic partnership agreement with India andusing Sri Lanka’s improved investment climate to attract investment that caters to the entire marketof the subcontinent. The AfIT is also in charge of pursuing new bilateral and multilateral tradeopportunities beyond the subcontinent, especially with China, Singapore, the EU and the UnitedStates, which cater to a market of about 3 billion, complying with the non-aligned foreign policy ofthe government. The AfD, on the other hand, is expected to contribute to development efforts bycollaborating with the private sector to identify constraints on the development process and bybuilding multi-functional teams that can work across sectors to resolve issues to enable the privatesector to enhance capabilities, engage in product development and foster export growth. Severalmeasures, spearheaded by the Ministry of Development Strategies and International Trade(“MODSIT”) and the Export Development Board (“EDB”), are currently underway. The NationalExport Strategy, initiated by the EDB, is a collaborative effort of the Government and the privatesector and provides a five-year action-oriented framework for the development of Sri Lankan trade andcompetitiveness. Simultaneously, a National Trade Policy has been drafted with the objective ofattracting more export-oriented FDI, improving trade logistics, increasing transparency and efficiencyof customs procedures, and implementing other measures to boost Sri Lanka’s ability to compete inthe global market. In addition, a One-Stop-Shop in collaboration with more than 15 stakeholderorganisations at the Board of Investment (“BOI”) was established, which are among the solutionsimplemented towards improving the investment climate of Sri Lanka.
74
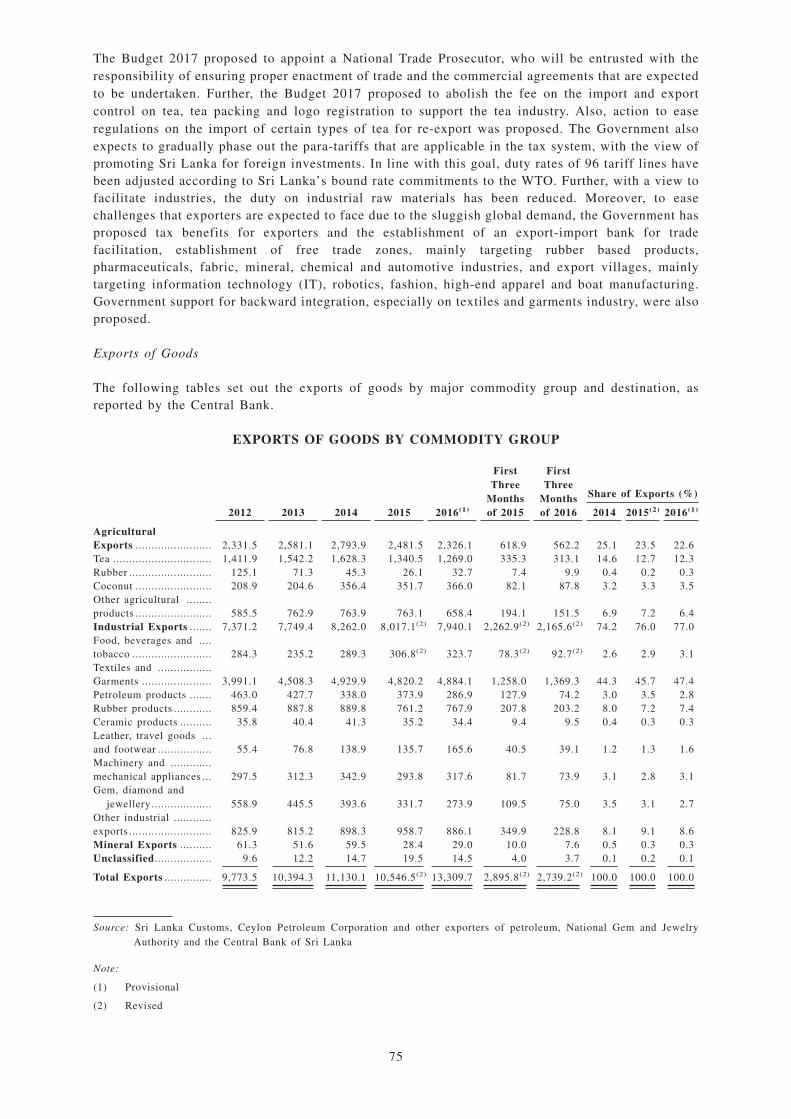
The Budget 2017 proposed to appoint a National Trade Prosecutor, who will be entrusted with theresponsibility of ensuring proper enactment of trade and the commercial agreements that are expectedto be undertaken. Further, the Budget 2017 proposed to abolish the fee on the import and exportcontrol on tea, tea packing and logo registration to support the tea industry. Also, action to easeregulations on the import of certain types of tea for re-export was proposed. The Government alsoexpects to gradually phase out the para-tariffs that are applicable in the tax system, with the view ofpromoting Sri Lanka for foreign investments. In line with this goal, duty rates of 96 tariff lines havebeen adjusted according to Sri Lanka’s bound rate commitments to the WTO. Further, with a view tofacilitate industries, the duty on industrial raw materials has been reduced. Moreover, to easechallenges that exporters are expected to face due to the sluggish global demand, the Government hasproposed tax benefits for exporters and the establishment of an export-import bank for tradefacilitation, establishment of free trade zones, mainly targeting rubber based products,pharmaceuticals, fabric, mineral, chemical and automotive industries, and export villages, mainlytargeting information technology (IT), robotics, fashion, high-end apparel and boat manufacturing.Government support for backward integration, especially on textiles and garments industry, were alsoproposed.
Exports of Goods
The following tables set out the exports of goods by major commodity group and destination, asreported by the Central Bank.
EXPORTS OF GOODS BY COMMODITY GROUP
2012 2013 2014 2015 2016(1)
FirstThree
Monthsof 2015
FirstThree
Monthsof 2016
Share of Exports (%)
2014 2015(2) 2016(1)
AgriculturalExports ........................ 2,331.5 2,581.1 2,793.9 2,481.5 2,326.1 618.9 562.2 25.1 23.5 22.6Tea ............................... 1,411.9 1,542.2 1,628.3 1,340.5 1,269.0 335.3 313.1 14.6 12.7 12.3Rubber .......................... 125.1 71.3 45.3 26.1 32.7 7.4 9.9 0.4 0.2 0.3Coconut ........................ 208.9 204.6 356.4 351.7 366.0 82.1 87.8 3.2 3.3 3.5Other agricultural ........products ........................ 585.5 762.9 763.9 763.1 658.4 194.1 151.5 6.9 7.2 6.4Industrial Exports ....... 7,371.2 7,749.4 8,262.0 8,017.1(2) 7,940.1 2,262.9(2) 2,165.6(2) 74.2 76.0 77.0Food, beverages and ....tobacco ......................... 284.3 235.2 289.3 306.8(2) 323.7 78.3(2) 92.7(2) 2.6 2.9 3.1Textiles and .................Garments ...................... 3,991.1 4,508.3 4,929.9 4,820.2 4,884.1 1,258.0 1,369.3 44.3 45.7 47.4Petroleum products ....... 463.0 427.7 338.0 373.9 286.9 127.9 74.2 3.0 3.5 2.8Rubber products ............ 859.4 887.8 889.8 761.2 767.9 207.8 203.2 8.0 7.2 7.4Ceramic products .......... 35.8 40.4 41.3 35.2 34.4 9.4 9.5 0.4 0.3 0.3Leather, travel goods ...and footwear ................. 55.4 76.8 138.9 135.7 165.6 40.5 39.1 1.2 1.3 1.6Machinery and .............mechanical appliances ... 297.5 312.3 342.9 293.8 317.6 81.7 73.9 3.1 2.8 3.1Gem, diamond and
jewellery ................... 558.9 445.5 393.6 331.7 273.9 109.5 75.0 3.5 3.1 2.7Other industrial ............exports .......................... 825.9 815.2 898.3 958.7 886.1 349.9 228.8 8.1 9.1 8.6Mineral Exports .......... 61.3 51.6 59.5 28.4 29.0 10.0 7.6 0.5 0.3 0.3Unclassified.................. 9.6 12.2 14.7 19.5 14.5 4.0 3.7 0.1 0.2 0.1
Total Exports ............... 9,773.5 10,394.3 11,130.1 10,546.5(2) 13,309.7 2,895.8(2) 2,739.2(2) 100.0 100.0 100.0
Source: Sri Lanka Customs, Ceylon Petroleum Corporation and other exporters of petroleum, National Gem and JewelryAuthority and the Central Bank of Sri Lanka
Note:
(1) Provisional
(2) Revised
75
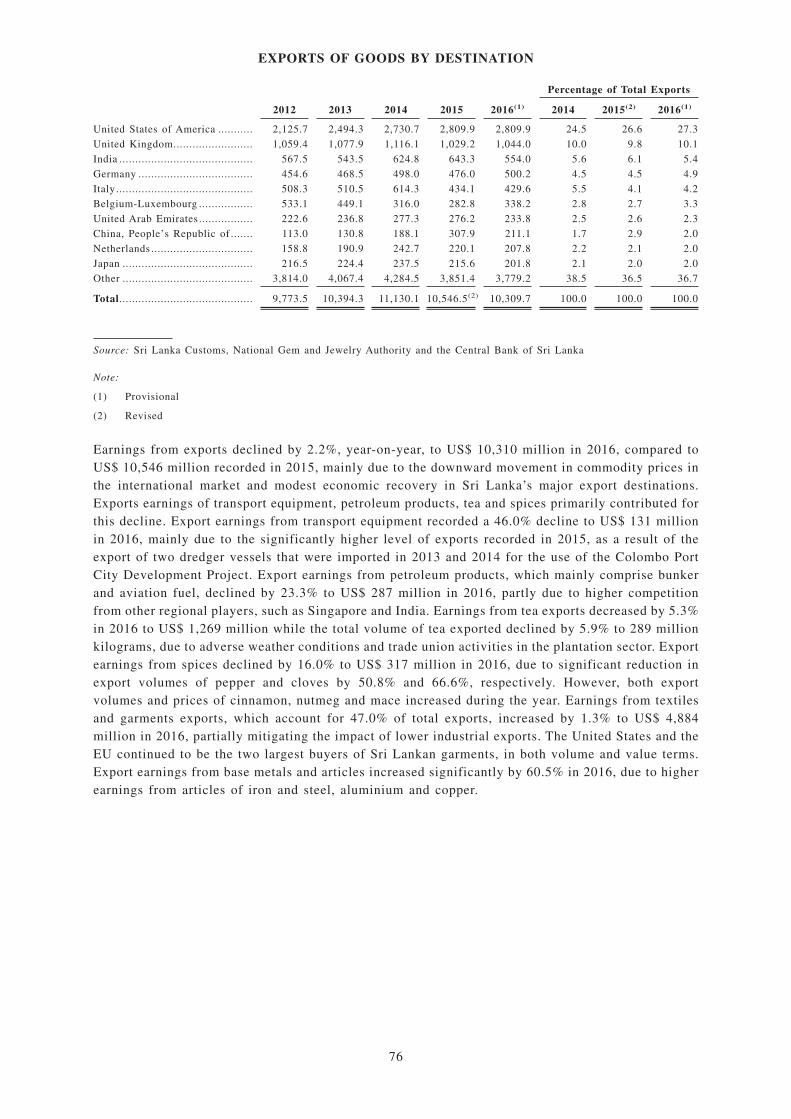
EXPORTS OF GOODS BY DESTINATION
Percentage of Total Exports
2012 2013 2014 2015 2016(1) 2014 2015(2) 2016(1)
United States of America ........... 2,125.7 2,494.3 2,730.7 2,809.9 2,809.9 24.5 26.6 27.3
United Kingdom......................... 1,059.4 1,077.9 1,116.1 1,029.2 1,044.0 10.0 9.8 10.1
India .......................................... 567.5 543.5 624.8 643.3 554.0 5.6 6.1 5.4
Germany .................................... 454.6 468.5 498.0 476.0 500.2 4.5 4.5 4.9
Italy ........................................... 508.3 510.5 614.3 434.1 429.6 5.5 4.1 4.2
Belgium-Luxembourg ................. 533.1 449.1 316.0 282.8 338.2 2.8 2.7 3.3
United Arab Emirates ................. 222.6 236.8 277.3 276.2 233.8 2.5 2.6 2.3
China, People’s Republic of ....... 113.0 130.8 188.1 307.9 211.1 1.7 2.9 2.0
Netherlands ................................ 158.8 190.9 242.7 220.1 207.8 2.2 2.1 2.0
Japan ......................................... 216.5 224.4 237.5 215.6 201.8 2.1 2.0 2.0
Other ......................................... 3,814.0 4,067.4 4,284.5 3,851.4 3,779.2 38.5 36.5 36.7
Total.......................................... 9,773.5 10,394.3 11,130.1 10,546.5(2) 10,309.7 100.0 100.0 100.0
Source: Sri Lanka Customs, National Gem and Jewelry Authority and the Central Bank of Sri Lanka
Note:
(1) Provisional
(2) Revised
Earnings from exports declined by 2.2%, year-on-year, to US$ 10,310 million in 2016, compared toUS$ 10,546 million recorded in 2015, mainly due to the downward movement in commodity prices inthe international market and modest economic recovery in Sri Lanka’s major export destinations.Exports earnings of transport equipment, petroleum products, tea and spices primarily contributed forthis decline. Export earnings from transport equipment recorded a 46.0% decline to US$ 131 millionin 2016, mainly due to the significantly higher level of exports recorded in 2015, as a result of theexport of two dredger vessels that were imported in 2013 and 2014 for the use of the Colombo PortCity Development Project. Export earnings from petroleum products, which mainly comprise bunkerand aviation fuel, declined by 23.3% to US$ 287 million in 2016, partly due to higher competitionfrom other regional players, such as Singapore and India. Earnings from tea exports decreased by 5.3%in 2016 to US$ 1,269 million while the total volume of tea exported declined by 5.9% to 289 millionkilograms, due to adverse weather conditions and trade union activities in the plantation sector. Exportearnings from spices declined by 16.0% to US$ 317 million in 2016, due to significant reduction inexport volumes of pepper and cloves by 50.8% and 66.6%, respectively. However, both exportvolumes and prices of cinnamon, nutmeg and mace increased during the year. Earnings from textilesand garments exports, which account for 47.0% of total exports, increased by 1.3% to US$ 4,884million in 2016, partially mitigating the impact of lower industrial exports. The United States and theEU continued to be the two largest buyers of Sri Lankan garments, in both volume and value terms.Export earnings from base metals and articles increased significantly by 60.5% in 2016, due to higherearnings from articles of iron and steel, aluminium and copper.
76
In 2015, earnings from exports declined, largely reflecting the downward movement of internationalcommodity prices and the slower growth in large economies and Sri Lanka’s major exportdestinations. Earnings from exports, which grew at 7.1% in 2014, declined by 5.2%, year-on-year, in2015, to US$ 10,546 million, led by the drop in both agricultural as well as industrial exports.Earnings from agricultural exports, declined significantly by 11.2% to US$ 2,481 million in 2015, ledby lower earnings from tea and seafood exports. Export earnings from tea declined significantly by17.7% to US$ 1,340 million. Geopolitical developments, currency depreciations in importer countriesand the substantial decline in revenue from oil resulted in a significant decline in demand for Ceylontea from major buyers such as Russia and some countries in the Middle East. Accordingly, the averageexport price of tea declined significantly by 12.2%, to US$ 4.37 per kilogram in 2015, from US$ 4.97per kilogram recorded in 2014, while the export volume also declined by 6.2% to 307 millionkilograms. Meanwhile, earnings from seafood exports declined by 35.5%, year-on-year, in 2015,mainly due to the significant decline recorded in seafood exports by 75.0% to the EU market, with therestrictions on market access, with effect from mid-January 2015. Rubber, non-kernel coconutproducts, vegetables and unmanufactured tobacco also contributed considerably to the decline inearnings from agricultural exports during the year. However, earnings from coconut kernel productsincreased by 3.5% due to more than a 100% growth recorded in coconut oil exports. As a result of abumper harvest in main export crops such as pepper and cloves, earnings from exports of spicesincreased significantly by 42.7%, to US$ 377 million in 2015. In line with the decline in commodityprices in the international market and lower global demand, earnings from industrial exportscontracted by 3.0% to US$ 8,017 million in 2015. The lower performance recorded in textiles andgarments, rubber products, gems, diamonds and jewellery, and machinery and mechanical appliances,mainly contributed to this decline. Export earnings from textiles and garments, which account forapproximately 46% of the total export earnings, declined by 2.2%, mainly due to the 2.7% declinerecorded in garment exports, despite the 4.5% and 13.4% growth, respectively, recorded in textiles andother made-up textile articles. Export earnings from garments to the EU market declined significantlyby 12.5% in 2015, largely contributing to the decline in earnings from garment exports, despite the6.0% and 4.6% growth recorded in the earnings from garment exports to the US and othernon-traditional markets, respectively. In line with the noticeable drop recorded in international rubberprices, earnings from rubber products exports declined by 14.5%, to US$ 761 million in 2015,reflecting declines in almost every sub-category in rubber products, such as rubber tires and surgicaland other gloves. However, export earnings from transport equipment, petroleum products and animalfodder, under industrial exports, increased during the year.
Earnings from exports increased by 7.1% to US$ 11,130 million in 2014, supported by increases inall major export categories. The largest contribution came from industrial exports, supplemented bya substantial increase in textile and garments exports. Specifically, earnings from textiles andgarments exports, which accounted for 44% of total exports, recorded a significant increase of 9.4%in 2014, evidenced by growth in garment exports to both traditional and non-traditional markets. Thegarment exports to the EU and the United States increased by 10.6% and 8.8%, respectively, whileexports to non-traditional markets increased by 10.5%, compared to the 14.0% recorded in 2013.Among industrial exports, export earnings from leather, travel goods and footwear, food, beveragesand tobacco, and machinery and mechanical appliances also increased substantially in 2014. However,export earnings from petroleum products, which primarily comprised bunker and aviation fuel,declined by 21% to US$ 338 million, and exports of gem, diamond and jewellery declined by 11.7%.Meanwhile, earnings from agricultural exports recorded an increase of 8.2% due to increased exportsof coconut products, tea and certain minor agricultural products. Specifically, export of coconutproducts and tea increased by 74.2% and 5.6%, respectively, primarily due to higher export volumes.However, the export earnings from spices, which experienced a remarkable increase of 38.8% during2013, declined by 25.6% due to a drop in amount harvested in 2014.
77
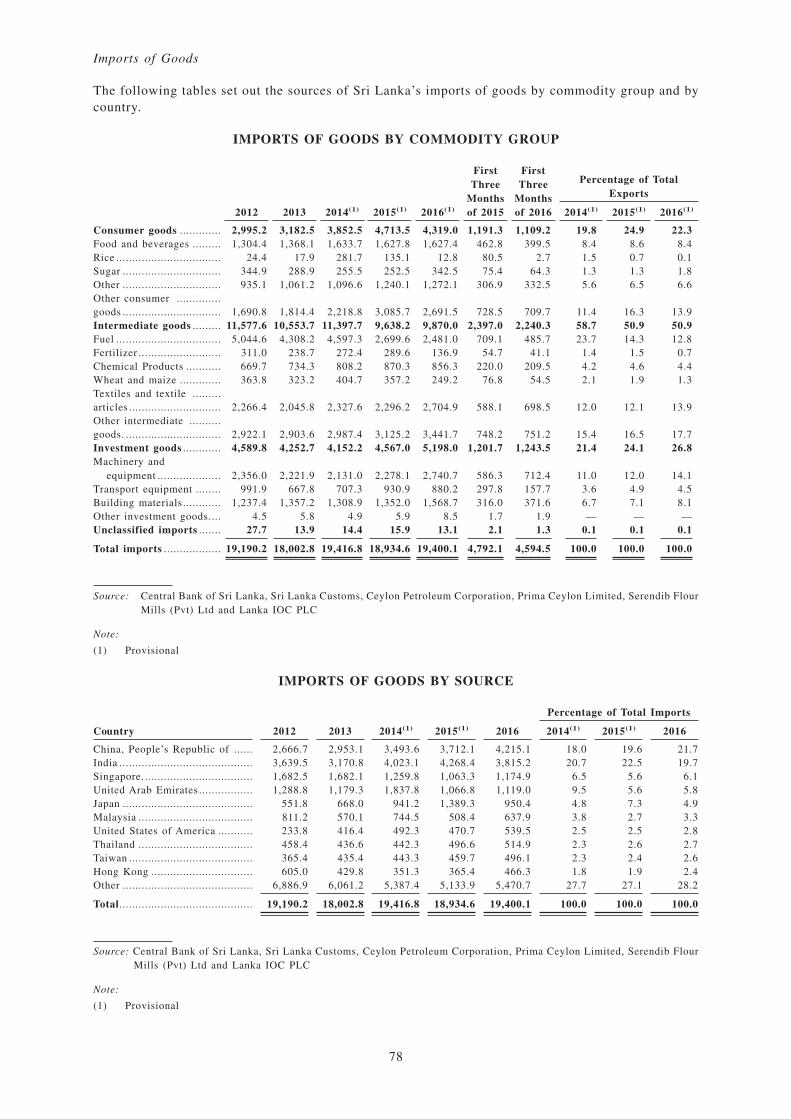
Imports of Goods
The following tables set out the sources of Sri Lanka’s imports of goods by commodity group and bycountry.
IMPORTS OF GOODS BY COMMODITY GROUP
2012 2013 2014(1) 2015(1) 2016(1)
FirstThree
Monthsof 2015
FirstThree
Monthsof 2016
Percentage of TotalExports
2014(1) 2015(1) 2016(1)
Consumer goods ............. 2,995.2 3,182.5 3,852.5 4,713.5 4,319.0 1,191.3 1,109.2 19.8 24.9 22.3Food and beverages ......... 1,304.4 1,368.1 1,633.7 1,627.8 1,627.4 462.8 399.5 8.4 8.6 8.4Rice ................................. 24.4 17.9 281.7 135.1 12.8 80.5 2.7 1.5 0.7 0.1Sugar ............................... 344.9 288.9 255.5 252.5 342.5 75.4 64.3 1.3 1.3 1.8Other ............................... 935.1 1,061.2 1,096.6 1,240.1 1,272.1 306.9 332.5 5.6 6.5 6.6Other consumer ..............goods ............................... 1,690.8 1,814.4 2,218.8 3,085.7 2,691.5 728.5 709.7 11.4 16.3 13.9Intermediate goods ......... 11,577.6 10,553.7 11,397.7 9,638.2 9,870.0 2,397.0 2,240.3 58.7 50.9 50.9Fuel ................................. 5,044.6 4,308.2 4,597.3 2,699.6 2,481.0 709.1 485.7 23.7 14.3 12.8Fertilizer .......................... 311.0 238.7 272.4 289.6 136.9 54.7 41.1 1.4 1.5 0.7Chemical Products ........... 669.7 734.3 808.2 870.3 856.3 220.0 209.5 4.2 4.6 4.4Wheat and maize ............. 363.8 323.2 404.7 357.2 249.2 76.8 54.5 2.1 1.9 1.3Textiles and textile .........articles ............................. 2,266.4 2,045.8 2,327.6 2,296.2 2,704.9 588.1 698.5 12.0 12.1 13.9Other intermediate ..........goods. .............................. 2,922.1 2,903.6 2,987.4 3,125.2 3,441.7 748.2 751.2 15.4 16.5 17.7Investment goods ............ 4,589.8 4,252.7 4,152.2 4,567.0 5,198.0 1,201.7 1,243.5 21.4 24.1 26.8Machinery and
equipment .................... 2,356.0 2,221.9 2,131.0 2,278.1 2,740.7 586.3 712.4 11.0 12.0 14.1Transport equipment ........ 991.9 667.8 707.3 930.9 880.2 297.8 157.7 3.6 4.9 4.5Building materials ............ 1,237.4 1,357.2 1,308.9 1,352.0 1,568.7 316.0 371.6 6.7 7.1 8.1Other investment goods.... 4.5 5.8 4.9 5.9 8.5 1.7 1.9 — — —Unclassified imports ....... 27.7 13.9 14.4 15.9 13.1 2.1 1.3 0.1 0.1 0.1
Total imports .................. 19,190.2 18,002.8 19,416.8 18,934.6 19,400.1 4,792.1 4,594.5 100.0 100.0 100.0
Source: Central Bank of Sri Lanka, Sri Lanka Customs, Ceylon Petroleum Corporation, Prima Ceylon Limited, Serendib FlourMills (Pvt) Ltd and Lanka IOC PLC
Note:
(1) Provisional
IMPORTS OF GOODS BY SOURCE
Percentage of Total Imports
Country 2012 2013 2014(1) 2015(1) 2016 2014(1) 2015(1) 2016
China, People’s Republic of ...... 2,666.7 2,953.1 3,493.6 3,712.1 4,215.1 18.0 19.6 21.7India .......................................... 3,639.5 3,170.8 4,023.1 4,268.4 3,815.2 20.7 22.5 19.7Singapore. .................................. 1,682.5 1,682.1 1,259.8 1,063.3 1,174.9 6.5 5.6 6.1United Arab Emirates ................. 1,288.8 1,179.3 1,837.8 1,066.8 1,119.0 9.5 5.6 5.8Japan ......................................... 551.8 668.0 941.2 1,389.3 950.4 4.8 7.3 4.9Malaysia .................................... 811.2 570.1 744.5 508.4 637.9 3.8 2.7 3.3United States of America ........... 233.8 416.4 492.3 470.7 539.5 2.5 2.5 2.8Thailand .................................... 458.4 436.6 442.3 496.6 514.9 2.3 2.6 2.7Taiwan ....................................... 365.4 435.4 443.3 459.7 496.1 2.3 2.4 2.6Hong Kong ................................ 605.0 429.8 351.3 365.4 466.3 1.8 1.9 2.4Other ......................................... 6,886.9 6,061.2 5,387.4 5,133.9 5,470.7 27.7 27.1 28.2
Total.......................................... 19,190.2 18,002.8 19,416.8 18,934.6 19,400.1 100.0 100.0 100.0
Source: Central Bank of Sri Lanka, Sri Lanka Customs, Ceylon Petroleum Corporation, Prima Ceylon Limited, Serendib FlourMills (Pvt) Ltd and Lanka IOC PLC
Note:
(1) Provisional
78
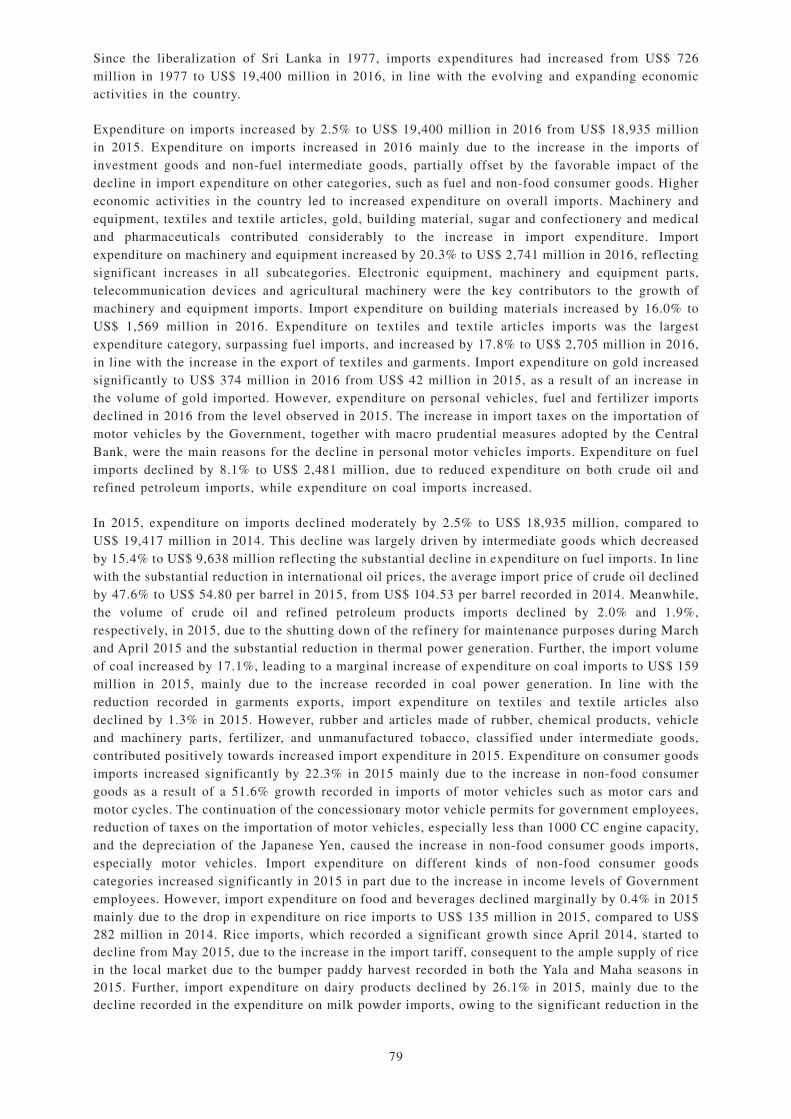
Since the liberalization of Sri Lanka in 1977, imports expenditures had increased from US$ 726million in 1977 to US$ 19,400 million in 2016, in line with the evolving and expanding economicactivities in the country.
Expenditure on imports increased by 2.5% to US$ 19,400 million in 2016 from US$ 18,935 millionin 2015. Expenditure on imports increased in 2016 mainly due to the increase in the imports ofinvestment goods and non-fuel intermediate goods, partially offset by the favorable impact of thedecline in import expenditure on other categories, such as fuel and non-food consumer goods. Highereconomic activities in the country led to increased expenditure on overall imports. Machinery andequipment, textiles and textile articles, gold, building material, sugar and confectionery and medicaland pharmaceuticals contributed considerably to the increase in import expenditure. Importexpenditure on machinery and equipment increased by 20.3% to US$ 2,741 million in 2016, reflectingsignificant increases in all subcategories. Electronic equipment, machinery and equipment parts,telecommunication devices and agricultural machinery were the key contributors to the growth ofmachinery and equipment imports. Import expenditure on building materials increased by 16.0% toUS$ 1,569 million in 2016. Expenditure on textiles and textile articles imports was the largestexpenditure category, surpassing fuel imports, and increased by 17.8% to US$ 2,705 million in 2016,in line with the increase in the export of textiles and garments. Import expenditure on gold increasedsignificantly to US$ 374 million in 2016 from US$ 42 million in 2015, as a result of an increase inthe volume of gold imported. However, expenditure on personal vehicles, fuel and fertilizer importsdeclined in 2016 from the level observed in 2015. The increase in import taxes on the importation ofmotor vehicles by the Government, together with macro prudential measures adopted by the CentralBank, were the main reasons for the decline in personal motor vehicles imports. Expenditure on fuelimports declined by 8.1% to US$ 2,481 million, due to reduced expenditure on both crude oil andrefined petroleum imports, while expenditure on coal imports increased.
In 2015, expenditure on imports declined moderately by 2.5% to US$ 18,935 million, compared toUS$ 19,417 million in 2014. This decline was largely driven by intermediate goods which decreasedby 15.4% to US$ 9,638 million reflecting the substantial decline in expenditure on fuel imports. In linewith the substantial reduction in international oil prices, the average import price of crude oil declinedby 47.6% to US$ 54.80 per barrel in 2015, from US$ 104.53 per barrel recorded in 2014. Meanwhile,the volume of crude oil and refined petroleum products imports declined by 2.0% and 1.9%,respectively, in 2015, due to the shutting down of the refinery for maintenance purposes during Marchand April 2015 and the substantial reduction in thermal power generation. Further, the import volumeof coal increased by 17.1%, leading to a marginal increase of expenditure on coal imports to US$ 159million in 2015, mainly due to the increase recorded in coal power generation. In line with thereduction recorded in garments exports, import expenditure on textiles and textile articles alsodeclined by 1.3% in 2015. However, rubber and articles made of rubber, chemical products, vehicleand machinery parts, fertilizer, and unmanufactured tobacco, classified under intermediate goods,contributed positively towards increased import expenditure in 2015. Expenditure on consumer goodsimports increased significantly by 22.3% in 2015 mainly due to the increase in non-food consumergoods as a result of a 51.6% growth recorded in imports of motor vehicles such as motor cars andmotor cycles. The continuation of the concessionary motor vehicle permits for government employees,reduction of taxes on the importation of motor vehicles, especially less than 1000 CC engine capacity,and the depreciation of the Japanese Yen, caused the increase in non-food consumer goods imports,especially motor vehicles. Import expenditure on different kinds of non-food consumer goodscategories increased significantly in 2015 in part due to the increase in income levels of Governmentemployees. However, import expenditure on food and beverages declined marginally by 0.4% in 2015mainly due to the drop in expenditure on rice imports to US$ 135 million in 2015, compared to US$282 million in 2014. Rice imports, which recorded a significant growth since April 2014, started todecline from May 2015, due to the increase in the import tariff, consequent to the ample supply of ricein the local market due to the bumper paddy harvest recorded in both the Yala and Maha seasons in2015. Further, import expenditure on dairy products declined by 26.1% in 2015, mainly due to thedecline recorded in the expenditure on milk powder imports, owing to the significant reduction in the
79
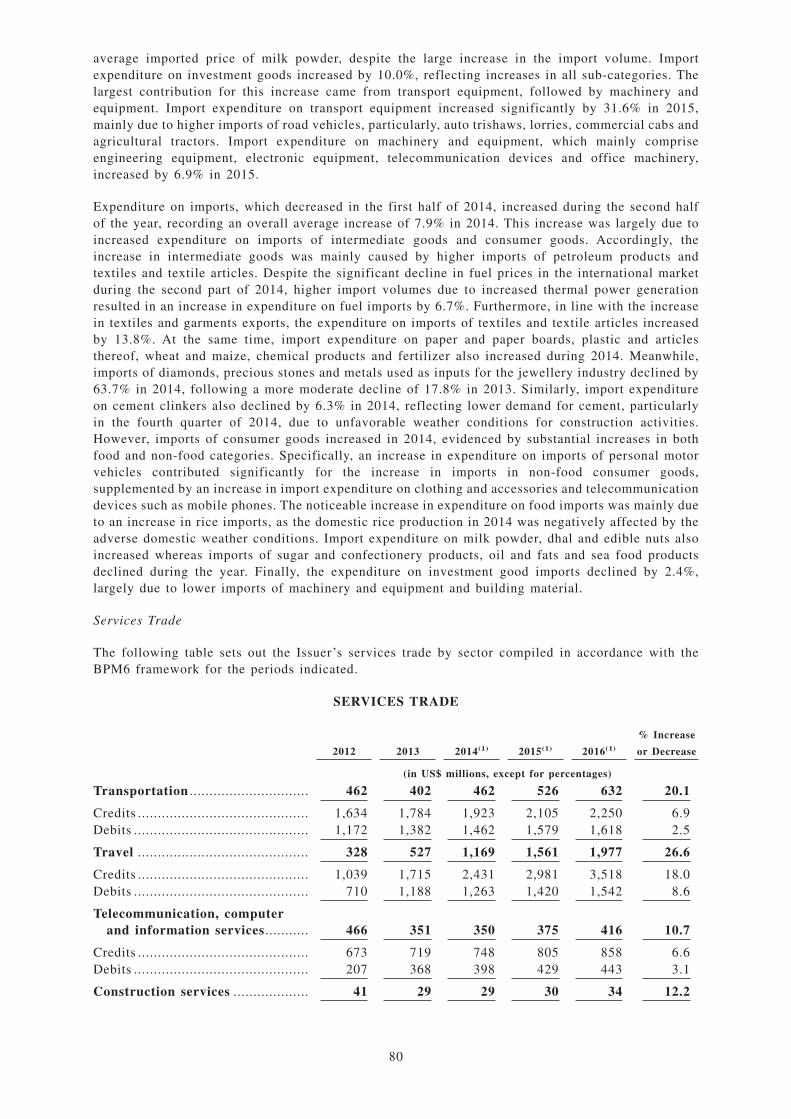
average imported price of milk powder, despite the large increase in the import volume. Importexpenditure on investment goods increased by 10.0%, reflecting increases in all sub-categories. Thelargest contribution for this increase came from transport equipment, followed by machinery andequipment. Import expenditure on transport equipment increased significantly by 31.6% in 2015,mainly due to higher imports of road vehicles, particularly, auto trishaws, lorries, commercial cabs andagricultural tractors. Import expenditure on machinery and equipment, which mainly compriseengineering equipment, electronic equipment, telecommunication devices and office machinery,increased by 6.9% in 2015.
Expenditure on imports, which decreased in the first half of 2014, increased during the second halfof the year, recording an overall average increase of 7.9% in 2014. This increase was largely due toincreased expenditure on imports of intermediate goods and consumer goods. Accordingly, theincrease in intermediate goods was mainly caused by higher imports of petroleum products andtextiles and textile articles. Despite the significant decline in fuel prices in the international marketduring the second part of 2014, higher import volumes due to increased thermal power generationresulted in an increase in expenditure on fuel imports by 6.7%. Furthermore, in line with the increasein textiles and garments exports, the expenditure on imports of textiles and textile articles increasedby 13.8%. At the same time, import expenditure on paper and paper boards, plastic and articlesthereof, wheat and maize, chemical products and fertilizer also increased during 2014. Meanwhile,imports of diamonds, precious stones and metals used as inputs for the jewellery industry declined by63.7% in 2014, following a more moderate decline of 17.8% in 2013. Similarly, import expenditureon cement clinkers also declined by 6.3% in 2014, reflecting lower demand for cement, particularlyin the fourth quarter of 2014, due to unfavorable weather conditions for construction activities.However, imports of consumer goods increased in 2014, evidenced by substantial increases in bothfood and non-food categories. Specifically, an increase in expenditure on imports of personal motorvehicles contributed significantly for the increase in imports in non-food consumer goods,supplemented by an increase in import expenditure on clothing and accessories and telecommunicationdevices such as mobile phones. The noticeable increase in expenditure on food imports was mainly dueto an increase in rice imports, as the domestic rice production in 2014 was negatively affected by theadverse domestic weather conditions. Import expenditure on milk powder, dhal and edible nuts alsoincreased whereas imports of sugar and confectionery products, oil and fats and sea food productsdeclined during the year. Finally, the expenditure on investment good imports declined by 2.4%,largely due to lower imports of machinery and equipment and building material.
Services Trade
The following table sets out the Issuer’s services trade by sector compiled in accordance with theBPM6 framework for the periods indicated.
SERVICES TRADE
2012 2013 2014(1) 2015(1) 2016(1)
% Increase
or Decrease
(in US$ millions, except for percentages)
Transportation .............................. 462 402 462 526 632 20.1
Credits ........................................... 1,634 1,784 1,923 2,105 2,250 6.9Debits ............................................ 1,172 1,382 1,462 1,579 1,618 2.5
Travel ........................................... 328 527 1,169 1,561 1,977 26.6
Credits ........................................... 1,039 1,715 2,431 2,981 3,518 18.0Debits ............................................ 710 1,188 1,263 1,420 1,542 8.6
Telecommunication, computerand information services ........... 466 351 350 375 416 10.7
Credits ........................................... 673 719 748 805 858 6.6Debits ............................................ 207 368 398 429 443 3.1
Construction services ................... 41 29 29 30 34 12.2
80
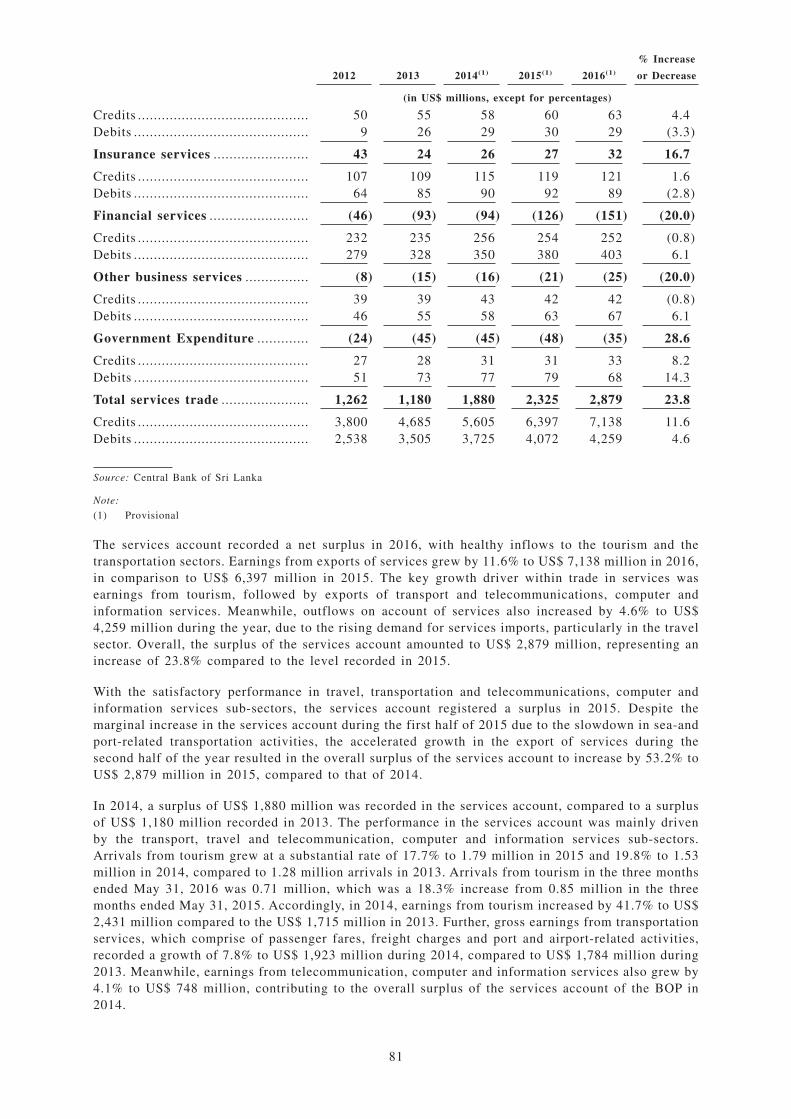
2012 2013 2014(1) 2015(1) 2016(1)
% Increase
or Decrease
(in US$ millions, except for percentages)
Credits ........................................... 50 55 58 60 63 4.4Debits ............................................ 9 26 29 30 29 (3.3)
Insurance services ........................ 43 24 26 27 32 16.7
Credits ........................................... 107 109 115 119 121 1.6Debits ............................................ 64 85 90 92 89 (2.8)
Financial services ......................... (46) (93) (94) (126) (151) (20.0)
Credits ........................................... 232 235 256 254 252 (0.8)Debits ............................................ 279 328 350 380 403 6.1
Other business services ................ (8) (15) (16) (21) (25) (20.0)
Credits ........................................... 39 39 43 42 42 (0.8)Debits ............................................ 46 55 58 63 67 6.1
Government Expenditure ............. (24) (45) (45) (48) (35) 28.6
Credits ........................................... 27 28 31 31 33 8.2Debits ............................................ 51 73 77 79 68 14.3
Total services trade ...................... 1,262 1,180 1,880 2,325 2,879 23.8
Credits ........................................... 3,800 4,685 5,605 6,397 7,138 11.6Debits ............................................ 2,538 3,505 3,725 4,072 4,259 4.6
Source: Central Bank of Sri Lanka
Note:
(1) Provisional
The services account recorded a net surplus in 2016, with healthy inflows to the tourism and thetransportation sectors. Earnings from exports of services grew by 11.6% to US$ 7,138 million in 2016,in comparison to US$ 6,397 million in 2015. The key growth driver within trade in services wasearnings from tourism, followed by exports of transport and telecommunications, computer andinformation services. Meanwhile, outflows on account of services also increased by 4.6% to US$4,259 million during the year, due to the rising demand for services imports, particularly in the travelsector. Overall, the surplus of the services account amounted to US$ 2,879 million, representing anincrease of 23.8% compared to the level recorded in 2015.
With the satisfactory performance in travel, transportation and telecommunications, computer andinformation services sub-sectors, the services account registered a surplus in 2015. Despite themarginal increase in the services account during the first half of 2015 due to the slowdown in sea-andport-related transportation activities, the accelerated growth in the export of services during thesecond half of the year resulted in the overall surplus of the services account to increase by 53.2% toUS$ 2,879 million in 2015, compared to that of 2014.
In 2014, a surplus of US$ 1,880 million was recorded in the services account, compared to a surplusof US$ 1,180 million recorded in 2013. The performance in the services account was mainly drivenby the transport, travel and telecommunication, computer and information services sub-sectors.Arrivals from tourism grew at a substantial rate of 17.7% to 1.79 million in 2015 and 19.8% to 1.53million in 2014, compared to 1.28 million arrivals in 2013. Arrivals from tourism in the three monthsended May 31, 2016 was 0.71 million, which was a 18.3% increase from 0.85 million in the threemonths ended May 31, 2015. Accordingly, in 2014, earnings from tourism increased by 41.7% to US$2,431 million compared to the US$ 1,715 million in 2013. Further, gross earnings from transportationservices, which comprise of passenger fares, freight charges and port and airport-related activities,recorded a growth of 7.8% to US$ 1,923 million during 2014, compared to US$ 1,784 million during2013. Meanwhile, earnings from telecommunication, computer and information services also grew by4.1% to US$ 748 million, contributing to the overall surplus of the services account of the BOP in2014.
81
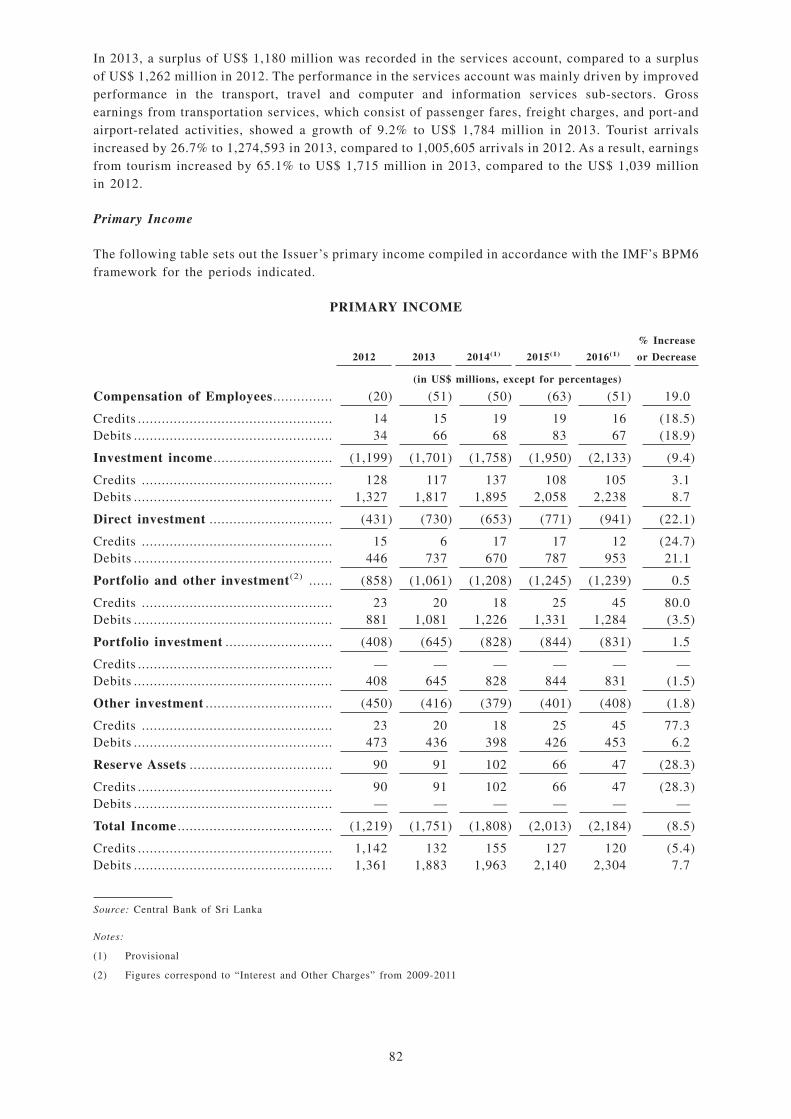
In 2013, a surplus of US$ 1,180 million was recorded in the services account, compared to a surplusof US$ 1,262 million in 2012. The performance in the services account was mainly driven by improvedperformance in the transport, travel and computer and information services sub-sectors. Grossearnings from transportation services, which consist of passenger fares, freight charges, and port-andairport-related activities, showed a growth of 9.2% to US$ 1,784 million in 2013. Tourist arrivalsincreased by 26.7% to 1,274,593 in 2013, compared to 1,005,605 arrivals in 2012. As a result, earningsfrom tourism increased by 65.1% to US$ 1,715 million in 2013, compared to the US$ 1,039 millionin 2012.
Primary Income
The following table sets out the Issuer’s primary income compiled in accordance with the IMF’s BPM6framework for the periods indicated.
PRIMARY INCOME
2012 2013 2014(1) 2015(1) 2016(1)
% Increase
or Decrease
(in US$ millions, except for percentages)
Compensation of Employees ............... (20) (51) (50) (63) (51) 19.0
Credits ................................................. 14 15 19 19 16 (18.5)Debits .................................................. 34 66 68 83 67 (18.9)
Investment income .............................. (1,199) (1,701) (1,758) (1,950) (2,133) (9.4)
Credits ................................................ 128 117 137 108 105 3.1Debits .................................................. 1,327 1,817 1,895 2,058 2,238 8.7
Direct investment ............................... (431) (730) (653) (771) (941) (22.1)
Credits ................................................ 15 6 17 17 12 (24.7)Debits .................................................. 446 737 670 787 953 21.1
Portfolio and other investment(2) ...... (858) (1,061) (1,208) (1,245) (1,239) 0.5
Credits ................................................ 23 20 18 25 45 80.0Debits .................................................. 881 1,081 1,226 1,331 1,284 (3.5)
Portfolio investment ........................... (408) (645) (828) (844) (831) 1.5
Credits ................................................. — — — — — —Debits .................................................. 408 645 828 844 831 (1.5)
Other investment ................................ (450) (416) (379) (401) (408) (1.8)
Credits ................................................ 23 20 18 25 45 77.3Debits .................................................. 473 436 398 426 453 6.2
Reserve Assets .................................... 90 91 102 66 47 (28.3)
Credits ................................................. 90 91 102 66 47 (28.3)Debits .................................................. — — — — — —
Total Income ....................................... (1,219) (1,751) (1,808) (2,013) (2,184) (8.5)
Credits ................................................. 1,142 132 155 127 120 (5.4)Debits .................................................. 1,361 1,883 1,963 2,140 2,304 7.7
Source: Central Bank of Sri Lanka
Notes:
(1) Provisional
(2) Figures correspond to “Interest and Other Charges” from 2009-2011
82
The deficit in the primary income account increased by 8.5% to US$ 2,184 million during 2016, incomparison to a deficit of US$ 2,013 million in 2015. Inflows to the primary income account, whichamounted to US$ 127 million in 2015, declined to US$ 120 million in 2016. The fall in inflows wasprimarily due to the reduction in earnings from reserve assets in line with the decline in gross officialreserves during the year. Meanwhile, the total outflow from the primary income account amounted toUS$ 2,304 million in 2016, in comparison to US$ 2,140 million in 2015. Dividend payments andreinvestment of earnings by direct investment enterprises, which stood at US$ 787 million in 2015,increased to US$ 953 million in 2016. Meanwhile, interest payments on portfolio investments declinedduring 2016 due to the reduction in the outstanding stock of Treasury bonds held by non-residents.This resulted in a modest decline of interest payments related to portfolio investments from US$ 764million in 2015 to US$ 756 million in 2016. However, interest payments on ISBs continued to rise asa result of new issuances by the Government. Further, primary income outflows in the form of otherinvestments, which consist of interest payments on foreign loans, increased moderately during 2016.
Outflows on account of dividend and reinvested earnings of direct investment enterprises increased toUS$ 787 million in 2015, compared to US$ 670 million recorded a year earlier. This comprised US$435 million of dividend payments and US$ 352 million of reinvested earnings, which are regarded asoutflows from the primary income account and inflows to the financial account in the form of directinvestments. The dividend payments on inward direct investments were much higher, compared to theprevious year, whereas reinvested earnings were lower than a year earlier, indicating the intention ofdirect investors to repatriate profits back instead of reinvesting. Meanwhile, of the total interestpayments on portfolio investments of US$ 844 million in 2015, US$ 80 million were dividendpayments on equity investments, while US$ 764 million were coupon and interest payments on debtsecurities. Further, primary income outflows in the form of other investment, which consist of interestpayments on foreign loans, amounted to US$ 426 million in 2015, compared to US$ 398 million in2014. Of the total interest payments on foreign loans in 2015, interest payments on foreign loansobtained by the Government, private sector and SOBEs, deposit taking corporations and the CentralBank, amounted to US$ 266 million, US$ 81 million, US$ 67 million and US$ 13 million,respectively. During recent years, a structural change in coupon and interest payments was observed,with the Government paying a higher amount as coupon payments on ISBs when compared to interestpayments on project loans, despite a relatively lower outstanding amount of ISBs.
The deficit in the primary income account in 2014 widened to US$ 1,839 million, compared to US$1,817 million in 2013. In 2014, inflows to the primary income account increased primarily due to theincrease in income earned on investment in reserve assets and dividends received on direct investmentwhile inflows from employee compensation increased only marginally. As a result, inflows to theprimary income account increased to US$ 153 million in 2014 from US$ 132 million in 2013. On theother hand, outflows of the primary income account also increased in 2014, primarily due to higherinterest payments on debt securities. Primary income account, which recorded an outflow of US$1,883 million in 2013, registered an outflow of US$ 1,992 million in 2014.
83
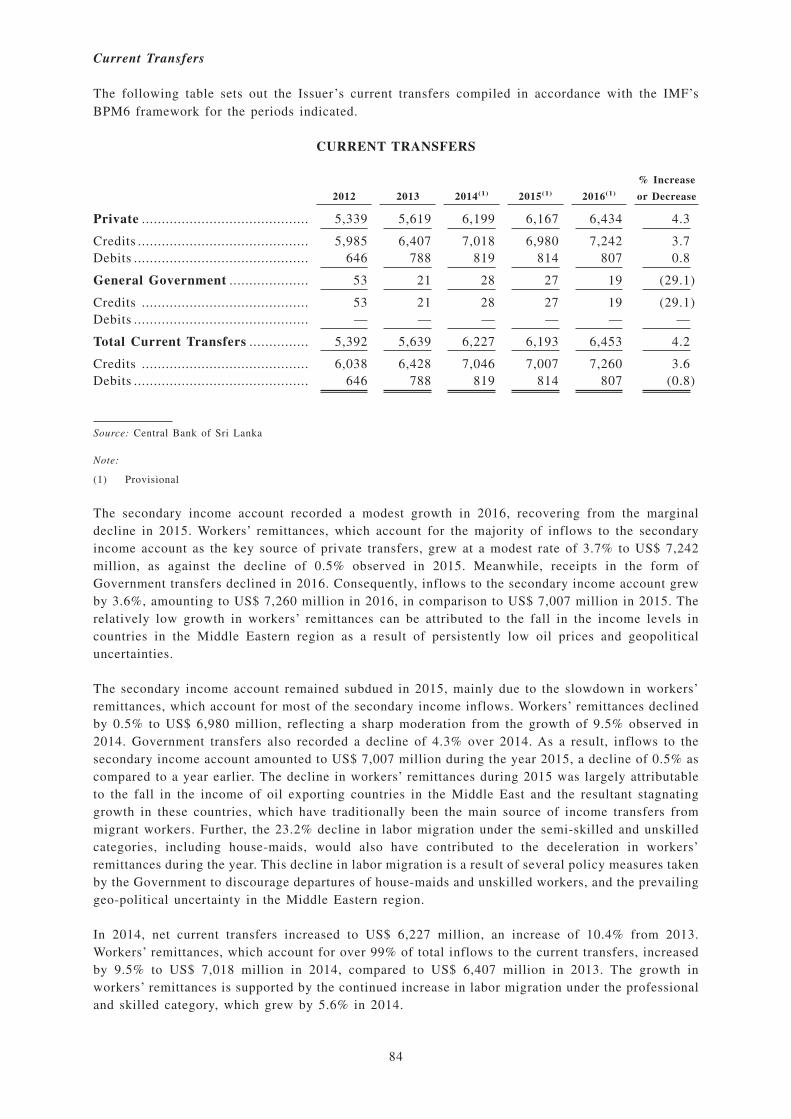
Current Transfers
The following table sets out the Issuer’s current transfers compiled in accordance with the IMF’sBPM6 framework for the periods indicated.
CURRENT TRANSFERS
2012 2013 2014(1) 2015(1) 2016(1)
% Increase
or Decrease
Private .......................................... 5,339 5,619 6,199 6,167 6,434 4.3
Credits ........................................... 5,985 6,407 7,018 6,980 7,242 3.7Debits ............................................ 646 788 819 814 807 0.8
General Government .................... 53 21 28 27 19 (29.1)
Credits .......................................... 53 21 28 27 19 (29.1)Debits ............................................ — — — — — —
Total Current Transfers ............... 5,392 5,639 6,227 6,193 6,453 4.2
Credits .......................................... 6,038 6,428 7,046 7,007 7,260 3.6Debits ............................................ 646 788 819 814 807 (0.8)
Source: Central Bank of Sri Lanka
Note:
(1) Provisional
The secondary income account recorded a modest growth in 2016, recovering from the marginaldecline in 2015. Workers’ remittances, which account for the majority of inflows to the secondaryincome account as the key source of private transfers, grew at a modest rate of 3.7% to US$ 7,242million, as against the decline of 0.5% observed in 2015. Meanwhile, receipts in the form ofGovernment transfers declined in 2016. Consequently, inflows to the secondary income account grewby 3.6%, amounting to US$ 7,260 million in 2016, in comparison to US$ 7,007 million in 2015. Therelatively low growth in workers’ remittances can be attributed to the fall in the income levels incountries in the Middle Eastern region as a result of persistently low oil prices and geopoliticaluncertainties.
The secondary income account remained subdued in 2015, mainly due to the slowdown in workers’remittances, which account for most of the secondary income inflows. Workers’ remittances declinedby 0.5% to US$ 6,980 million, reflecting a sharp moderation from the growth of 9.5% observed in2014. Government transfers also recorded a decline of 4.3% over 2014. As a result, inflows to thesecondary income account amounted to US$ 7,007 million during the year 2015, a decline of 0.5% ascompared to a year earlier. The decline in workers’ remittances during 2015 was largely attributableto the fall in the income of oil exporting countries in the Middle East and the resultant stagnatinggrowth in these countries, which have traditionally been the main source of income transfers frommigrant workers. Further, the 23.2% decline in labor migration under the semi-skilled and unskilledcategories, including house-maids, would also have contributed to the deceleration in workers’remittances during the year. This decline in labor migration is a result of several policy measures takenby the Government to discourage departures of house-maids and unskilled workers, and the prevailinggeo-political uncertainty in the Middle Eastern region.
In 2014, net current transfers increased to US$ 6,227 million, an increase of 10.4% from 2013.Workers’ remittances, which account for over 99% of total inflows to the current transfers, increasedby 9.5% to US$ 7,018 million in 2014, compared to US$ 6,407 million in 2013. The growth inworkers’ remittances is supported by the continued increase in labor migration under the professionaland skilled category, which grew by 5.6% in 2014.
84
In 2013, net current transfers increased to US$ 5,639 million, representing an increase of 4.6% over2012. Maintaining the positive growth momentum shown in 2012, workers’ remittances in 2013amounted to US$ 6,407 million, representing an increase of 7.1% over 2012. Increased labor migrationunder the professional and skilled category, additional remittance facilities to facilitate the process ofremittance through formal channels as well as the introduction of new internet based money transfersystems were the main factors that contributed to this increase in workers’ remittances.
Capital and Financial Account
The capital and financial account is divided into five categories: capital transfers account; directinvestment; portfolio investment; financial derivatives; and other investment.
Sri Lanka continues to maintain a liberal investment regime with a relatively open capital accountcompared with other countries in the region. In particular, restrictions on FDI over most areas havebeen lifted, and persons outside of Sri Lanka are allowed to invest in the following forms ofinvestments:
• Shares in companies incorporated in Sri Lanka (except for pawn brokering, retail trade withcapital of less than US$ 1 million and coastal fishing businesses as provided under Sri Lanka’sexchange control laws);
• Units in unit trusts;
• Treasury bills and Treasury bonds;
• Sri Lanka Development Bonds;
• Debentures;
• Special foreign investment deposit accounts;
• Incorporation of businesses in Sri Lanka;
• Immovable property (subject to the restrictions on transfer of land under the Land (Restrictionon Alienation) Act No. 38 of 2014 and the conditions and provisions of the StrategicDevelopment Project Act No. 14 of 2008, and the payment of land lease tax on rental paymentsof leased lands); and
• Lending under the External Commercial Borrowing Scheme or under special permission grantedby the Controller of Exchange.
Foreign investments in the areas listed below are limited to 40.0%. Foreign ownership in excess of40.0% must be approved on a case-by-case basis by the Board of Investment of Sri Lanka.
• Production of goods where Sri Lanka’s exports are subject to internationally determined quotarestrictions;
• Production and primary processing of tea, rubber, coconut, cocoa, rice, sugar and spices;
• Mining and primary processing of non-renewable national resources;
• Timber based industries using local timber;
• Deep sea fishing;
• Mass communications;
• Education;
• Freight forwarding;
85
• Travel agencies; and
• Shipping agencies.
Foreign investments in the areas listed below must be approved by the Government or the relevantlegal or administrative authorities:
• Air transportation;
• Coastal shipping;
• Industrial undertaking in the Second Schedule of the Industrial Promotion Act No. 46 of 1990,namely (i) any industry manufacturing arms, ammunitions, explosives, military vehicles andequipment aircraft and other military hardware; (ii) any industry manufacturing poisons,narcotics, alcohols, dangerous drugs and toxic, hazardous or carcinogenic materials; and (iii) anyindustry producing currency, coins or security documents;
• Large scale mechanized mining of gems; and
• Lotteries.
The capital account recorded a marginal surplus of US$ 26 million in 2016, in comparison to a surplusof US$ 46 million in 2015. This was the combined result of a decline in capital transfers received bythe Government and the decline in capital outflows from the private sector in 2016. Both netincurrence of liabilities and net acquisition of assets of the financial account of the BOP remainedsubdued in 2016. Accordingly, net incurrence of liabilities amounted to US$ 2,199 million in 2016,in comparison to US$ 3,223 million recorded in 2015. Meanwhile, net acquisition of assets amountedto US$ 82 million, in comparison to US$ 911 million in 2015. Lower level of inflows to the financialaccount reflected the continued moderation of capital inflows, particularly in the form of FDIs andforeign investments to the Colombo Stock Exchange. Furthermore, Sri Lanka experienced significantcapital outflows in 2016, especially from the rupee denominated Government securities market, in thebackdrop of increasing global interest rates and a stronger growth momentum in the United Stateseconomy. Continued capital outflows, high debt repayments and moderate inflows to the financialaccount during 2016 necessitated increased foreign borrowings in the year. Accordingly, the financialaccount was supported by the issuance of ISBs amounting to US$ 1.5 billion, a new internationalcurrency swap arrangement of US$ 400 million following the maturity of international currency swapsamounting to US$ 1.1 billion and foreign currency term financing facilities amounting to US$ 700million. Sri Lanka also entered in to an EFF with the IMF in order to support the BOP and to supportthe Government’s reform agenda.
Lower inflow of capital transfers in 2015 resulted in the capital account balance remaining subduedin 2015. Net inflows to the capital account dropped to US$ 46 million in 2015, from US$ 58 millionin 2014. This was mainly due to an increase in outflows of capital transfers from US$ 15 million in2014, to US$ 24 million in 2015. Meanwhile, capital transfers received by the Government and theprivate sector also declined marginally from US$ 73 million in 2014, to US$ 71 million in 2015. Boththe net incurrence of liabilities and the net acquisition of financial assets in the financial account ofthe BOP were considerably lower in 2015 than in 2014. Net incurrence of liabilities in 2015 recordedan increase of US$ 3,223 million, compared to an increase of US$ 4,124 million in 2014, while thenet acquisition of assets recorded only a moderate increase of US$ 911 million in 2015, compared toan increase of US$ 2,588 million in 2014. These relatively low levels of inflows were partly due tothe performance of the global economy in 2015, while subdued investor sentiment amid two majornational elections also contributed to the foreign direct investment inflows remaining belowexpectations during the year. The anticipation of an interest rate hike in the US during the first threequarters of the year and the subsequent increase in interest rates in the fourth quarter resulted inforeign investments in Government securities, namely Treasury bills and bonds, as well as foreigninvestment in the CSE recording a significant outflow. The major source of inflows to the financialaccount of the BOP during 2015 were the issuance of two ISBs totaling US$ 2,150 million followingthe repayment of the matured ISBs of US$ 500 million at the beginning of the year. The other majorinflow to the financial account was the proceeds of the international swap arrangement of US$ 1,500
86
million entered into with the RBI, of which US$ 400 million was repaid during 2015. During the year,the Government also renewed its focus in foreign financing through the issuance of SLDBs. Further,traditional sources of inflows to the financial account, such as foreign loans to the Government,SOBEs and the private sector, performed moderately during 2015.
Net inflows to the capital account decreased from US$ 71 million in 2013 to US$ 58 million in 2014,whereas capital grants received by the Government increased to US$ 52 million in 2014 from US$ 39million in 2013. Meanwhile, capital transfers to corporations and households decreased to US$ 21million in 2014 from US$ 51 million in 2013. The major inflow to the financial account was from theproceeds of the sixth and seventh ISB offerings, which amounted to US$ 1.0 billion and US$ 500million, respectively. In addition, the financial account recorded moderate inflows of foreign loans tothe Government and the banking sector, and inflows to the private sector were supported by theissuance of international bonds by SriLankan Airlines and NSB. Specifically, total net incurrence ofliabilities was recorded at US$ 4,239 million in 2014, compared to US$ 4,049 million in 2013. At thesame time, net acquisition of financial assets increased to US$ 2,303 million in 2014 from US$ 986million in 2013, primarily due to an increase in reserve asset transactions and a moderate increase inacquisition of financial assets by the banking sector. Total FDI amounted to US$ 1,685 million in2014, compared to US$ 1,437 million in 2013.
The capital account recorded a net inflow of US$ 71 million in 2013, compared to US$ 130 millionin 2012. The majority of inflows to the capital account were in the form of capital grants received bythe Government. Significant inflows to the financial account were observed during 2013. With theadoption of the BPM6 compilation methodology, the financial account also included reserve assettransactions in addition to direct investments, portfolio investments, financial derivatives and otherinvestments. Total direct investments amounted to US$ 916 million in 2013, compared to US$ 941million in 2012. Total direct investments comprised US$ 887 million received by BOI companies, US$22 million received by non-BOI companies and US$ 7 million received by CSE-listed companies notregistered with the BOI. In addition to direct investments, BOI companies also received foreign loansamounting to US$ 505 million, resulting in an increase of FDI received by BOI companies (includingloans) to US$ 1,391 million in 2013 from US$ 1,279 million in 2012. In 2013, one LCB and two LSBsissued international securities totalling US$ 1.35 billion, compared to issuances totalling US$ 500million in 2012, which strengthened the position of Sri Lanka’s banking sector in the internationalsecurities market. The issuances in 2013 comprised 5-year international bonds with amounts of US$750 million, US$ 500 million and US$ 100 million by NSB, BOC and DFCC, respectively. Totalforeign loan inflows to the Government, deposit-taking corporations and the private sector amountedto US$ 2,992 million in 2013, compared to US$ 4,234 million in 2012. Total loan inflows to theGovernment amounted to US$ 1,677 million in 2013, compared to US$ 1,854 million in 2012. Net loaninflows of deposit taking corporations, which consist of LCBs, LSBs and LFCs, were US$ 124 million,significantly less than the US$ 579 million recorded in 2012. Meanwhile, in 2013, net foreigninvestments in Treasury bills and Treasury bonds reached the full utilization of the investmentthreshold for foreign investments in Government securities, resulting in a net inflow of US$ 493million.
International Reserves
The following table sets out the gross international reserves of the Central Bank for the periodsindicated, compiled in a manner consistent with the revised BOP framework and the treatment of IMFaccounts in the monetary survey published in the IMF’s International Financial Statistics.
87
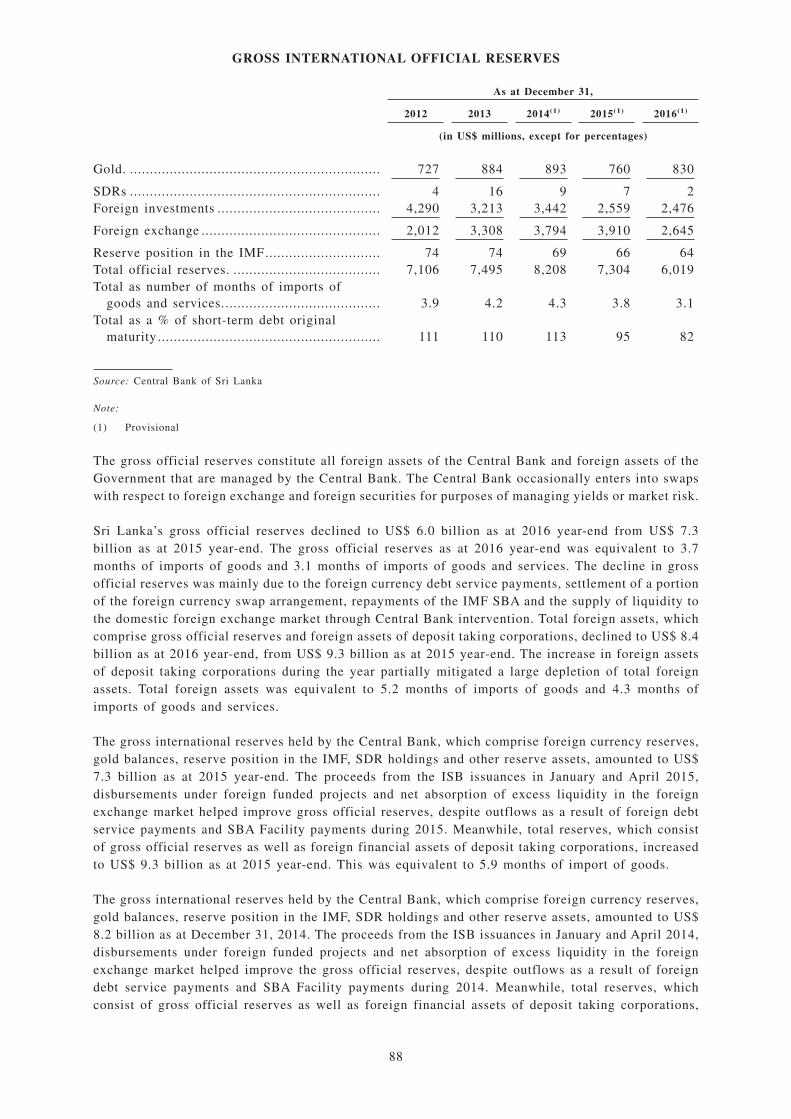
GROSS INTERNATIONAL OFFICIAL RESERVES
As at December 31,
2012 2013 2014(1) 2015(1) 2016(1)
(in US$ millions, except for percentages)
Gold. ............................................................... 727 884 893 760 830
SDRs ............................................................... 4 16 9 7 2Foreign investments ......................................... 4,290 3,213 3,442 2,559 2,476
Foreign exchange ............................................. 2,012 3,308 3,794 3,910 2,645
Reserve position in the IMF............................. 74 74 69 66 64Total official reserves. ..................................... 7,106 7,495 8,208 7,304 6,019Total as number of months of imports of
goods and services........................................ 3.9 4.2 4.3 3.8 3.1Total as a % of short-term debt original
maturity ........................................................ 111 110 113 95 82
Source: Central Bank of Sri Lanka
Note:
(1) Provisional
The gross official reserves constitute all foreign assets of the Central Bank and foreign assets of theGovernment that are managed by the Central Bank. The Central Bank occasionally enters into swapswith respect to foreign exchange and foreign securities for purposes of managing yields or market risk.
Sri Lanka’s gross official reserves declined to US$ 6.0 billion as at 2016 year-end from US$ 7.3billion as at 2015 year-end. The gross official reserves as at 2016 year-end was equivalent to 3.7months of imports of goods and 3.1 months of imports of goods and services. The decline in grossofficial reserves was mainly due to the foreign currency debt service payments, settlement of a portionof the foreign currency swap arrangement, repayments of the IMF SBA and the supply of liquidity tothe domestic foreign exchange market through Central Bank intervention. Total foreign assets, whichcomprise gross official reserves and foreign assets of deposit taking corporations, declined to US$ 8.4billion as at 2016 year-end, from US$ 9.3 billion as at 2015 year-end. The increase in foreign assetsof deposit taking corporations during the year partially mitigated a large depletion of total foreignassets. Total foreign assets was equivalent to 5.2 months of imports of goods and 4.3 months ofimports of goods and services.
The gross international reserves held by the Central Bank, which comprise foreign currency reserves,gold balances, reserve position in the IMF, SDR holdings and other reserve assets, amounted to US$7.3 billion as at 2015 year-end. The proceeds from the ISB issuances in January and April 2015,disbursements under foreign funded projects and net absorption of excess liquidity in the foreignexchange market helped improve gross official reserves, despite outflows as a result of foreign debtservice payments and SBA Facility payments during 2015. Meanwhile, total reserves, which consistof gross official reserves as well as foreign financial assets of deposit taking corporations, increasedto US$ 9.3 billion as at 2015 year-end. This was equivalent to 5.9 months of import of goods.
The gross international reserves held by the Central Bank, which comprise foreign currency reserves,gold balances, reserve position in the IMF, SDR holdings and other reserve assets, amounted to US$8.2 billion as at December 31, 2014. The proceeds from the ISB issuances in January and April 2014,disbursements under foreign funded projects and net absorption of excess liquidity in the foreignexchange market helped improve the gross official reserves, despite outflows as a result of foreigndebt service payments and SBA Facility payments during 2014. Meanwhile, total reserves, whichconsist of gross official reserves as well as foreign financial assets of deposit taking corporations,
88
increased to US$ 9.9 billion as at December 31, 2014. At the same time, the gross official position asat December 31, 2014 was equivalent to 5.1 months of import of goods, substantially higher than thegenerally accepted requirement of 3 months of imports. Additionally, the total reserves wereequivalent to 6.1 months of imports.
Investments
Foreign Investments to the Government
Net inflows to the Government amounted to US$ 1,287 million in 2016, compared to net inflows ofUS$ 470 million in 2015. This comprised total long-term loan inflows of US$ 2,163 million andrepayments amounting to US$ 876 million during the year. Of the total loan inflows, US$ 1,278million was in the form of project loans, US$ 700 million was from two foreign currency termfinancing facilities and US$ 185 million was in the form of program financing. Major project loaninflows to the Government in 2016 included the loans obtained for the construction of extension ofSouthern expressway section 1 and 2, integrated road investment program — tranche 2, Hambantotahub development project and metro Colombo urban development project. The two loans in the formof programme financing consisted of US$ 85 million from the Government of Japan as a developmentpolicy loan and US$ 100 million from the International Development Association of the World Bankas development policy financing on competitiveness, transparency and financial stability.
Loan inflows to the Government moderated during the year, whereas higher repayments by the privatesector, deposit taking corporations and the Central Bank resulted in the lower net loan inflow in 2015.Accordingly, net inflows from foreign loans amounted to US$ 759 million, compared to US$ 1,713million in 2014. Net foreign loan inflows to the Government were lower in 2015, compared to theprevious year. In the backdrop of two major national elections, the initiation of most Governmentprojects stalled during the first three quarters of 2015, resulting in a decrease in project loan inflows.Consequently, loan inflows in the form of Government project loans amounted to US$ 1,268 millionin 2015, compared to US$ 1,439 million in 2014. Further, repayments of Government loans increasedmarginally to US$ 798 million in 2015, compared to US$ 793 million in 2014. Major loan inflows toGovernment projects during 2015 included the improvement and rehabilitation of priority roads (PhaseI and II), Sri Lanka SME and green energy global loan, Matara Beliatta section of Matara Kataragamarailway extension project and Phase II of the Greater Colombo urban transport development project.
In 2014, long-term inflows to the Government, in the form of long-term loans and grants, amountedto US$ 1,491 million, compared to US$ 1,716 million in 2013. This includes long-term loan inflowsof US$ 1,439 million and grants of US$ 52 million. A major source of foreign loan inflow to theGovernment in 2014 was the US$ 292 million loan to fund the Priority Roads Project. In addition,foreign loan inflows were recorded to fund the reconstruction of the railway lines connectingOmanthai-Pallai and Madhu-Tallaimannar and Medawachchiya, the Matara-Beliatta section ofMatara-Kataragama Railway Extension Project, the Greater Colombo Urban Transport DevelopmentProject, the Russian Line of Credit, the Restoration of Northern Railway Services, the EducationSector Development Program and the Greater Kurunegala Water Supply and Sewerage Project.
Total loan inflows to the Government amounted to US$ 1,677 million in 2013, compared to US$ 1,854million in 2012. On a net basis, loan inflows to the Government decreased by 17.2%, recording a netinflow of US$ 821 million in 2013 compared to US$ 992 million in 2012. Of the total loan inflowsto the Government, US$ 1,451 million were obtained under concessional terms and conditions, whileUS$ 226 million were obtained as non-concessional loans, commercial loans and export credits.
Foreign Direct Investments
Total FDI inflows, inclusive of foreign loans to BOI companies, amounted to US$ 1,079 million in2016, while direct investments that exclude foreign borrowings of BOI companies amounted to US$898 million. In comparison, total FDI inflows with foreign loans amounted to US$ 1,160 million in2015 while the same excluding foreign loans amounted to US$ 680 million. While FDI inflows in theSri Lankan economy have generally been low, FDI inflows during 2016 were specifically affected bythe evolving global economic outlook in the backdrop of the interest rate hike by the US FederalReserve. In addition, the significant increase in wage rates and other costs of production compared to
89
peer countries in the region were expected to be disadvantageous in attracting foreign investments. Ofthe total FDI inflows in 2016, US$ 260 million was in the form of equity, US$ 450 million wasreinvested earnings, US$ 276 million was shareholder advances and intra company loans, whilerepayment of shareholder advances and intra company debt amounted to US$ 87 million in 2016.During the year, BOI companies received US$ 181 million of foreign loans from non-related lenders.
Total FDI, including foreign loans to BOI companies, recorded an inflow of US$ 1,685 million in2014, compared to US$ 1,437 million in 2013. Total inflows, excluding those to BOI companies,amounted to US$ 944 million, compared to US$ 933 million in 2013. Accordingly, BOI companiesreceived direct investment of US$ 782 million, whereas CSE-listed companies (not registered with theBOI) received US$ 62 million and non-BOI companies received US$ 100 million. FDI to BOIcompanies comprised equity and shareholder advances of US$ 218 million, intra-company borrowingsof US$ 224 million and reinvestment of retained earnings of US$ 346 million. A shift towards favoringlong-term foreign financing by domestic companies was observed in 2014, primarily due to therelative lower cost at which external borrowing was available to Sri Lankan companies. This shift wasevidenced by the direct investment enterprises obtaining an FDI of US$ 741 million during 2014. Theshare of FDI inflows to the infrastructure sector and the services sectors were 42.2% and 36.8%,respectively, while the manufacturing sector received 20.7% of the total FDI. A number of key projectscontinued to attract high foreign investment during 2014. These include SriLankan Airlines (foreignloan of US$ 150 million and proceeds of US$ 175 million from its international bond issuance), CHECPort City Colombo (Pvt) Ltd (US$ 200.4 million), Colombo International Container Terminals (US$113.0 million), Union Bank PLC (US$ 87.8 million), Waterfront Properties (US$ 75.0 million) andHambantota Port Project Phase II (US$ 64.5 million). Key FDI sources in 2014 were China, the UnitedKingdom, the United States, Singapore and the Netherlands.
Total direct investments in 2013 were US$ 916 million, compared to US$ 941 million in 2012. Totaldirect investments comprised of US$ 887 million received by BOI companies, US$ 24 million receivedby non-BOI companies and US$ 7 million received by CSE-listed companies not registered with theBOI. In addition to direct investments, BOI companies also received foreign loans amounting to US$505 million, which increased FDI received by BOI companies (including loans) to US$ 1,391 millionin 2013, compared to US$ 1,279 million in 2012. For investments in BOI companies by sector in 2013,the infrastructure, manufacturing, services and agricultural sectors received US$ 787 million, US$ 360million, US$ 236 million and US$ 8.5 million, respectively. Major sources of FDI inflows were fromChina (US$ 240 million), Malaysia (US$ 176 million), Hong Kong (US$ 139 million), the Netherlands(US$ 118 million) and Singapore (US$ 112 million).
FDI, including loans received by BOI-approved companies, recorded the highest annual inflow in2012, amounting to US$ 1,382 million, compared to US$ 1,066 million in 2011. The FDI inflowsconsisted of equity capital of US$ 111 million, loans and advances by shareholders of US$ 364million, intra-company borrowings of US$ 217 million, reinvestment of retained earnings of US$ 249million and foreign loans of US$ 441 million. Considering the sector-wise composition of FDI inflowsin 2012, the infrastructure sector received the highest share of FDI (44.6%) with major investmentsin ports and container terminals, telephone and telecommunication networks, power generation andhousing and property development, while the services sector attracted 31.9% of FDI in 2012 including8.8% from the tourism sector. Meanwhile, the manufacturing sector attracted 23% of FDI in 2012.
Portfolio Investments
Subdued investor sentiments on the capital markets of emerging economies continued to affect equityinvestments and resulted in a moderate net inflow of US$ 24 million in 2016. The net inflow of foreigninvestment to the CSE in 2016 consisted of a net inflow of US$ 10 million to the secondary marketand an inflow of US$ 14 million to the primary market. Further, Sri Lanka successfully issued a dualtranche ISB of US$ 1.5 billion, with US$ 1 billion maturing in 10 years and US$ 500 million maturingin five and a half years. Foreign investments in Treasury bonds and Sri Lanka Development Bonds(“SLDBs”) continued to record an outflow in 2016. Consequently, net outflows from Treasury bondsand SLDBs amounted to US$ 361 million and US$ 207 million, respectively, in 2016. Meanwhile,foreign investments in Treasury bills amounted to a moderate net inflow of US$ 36 million in 2016.Hence, on a cumulative basis, Government securities other than ISBs recorded a net outflow of US$531 million in 2016 in comparison to a net outflow of US$ 903 million in 2015.
90
The subdued global investor sentiment on emerging markets reflected on the passive foreigninvestment in equity under portfolio investments in 2015.Net incurrence of liabilities as equity underportfolio investments recorded an outflow of US$ 60 million in 2015, compared to a net inflow of US$178 million in 2014. Equity investments by non-residents in the CSE listed companies compriseforeign investments, other than direct investments in the CSE companies, which are typically morevolatile compared to direct investments, recorded a net outflow of US$ 96 million from the secondarymarket and a net inflow to the primary market amounting to US$ 36 million, resulting in an overallnet outflow of US$ 60 million as equity under portfolio investments. This was in sharp contrast to2014, where foreign inflows amounted to US$ 174 million in secondary market transactions and US$4 million in primary market transactions of the CSE, totalling an inflow of US$ 178 million in 2014.As at June 6, 2016, net foreign outflows from the CSE amounted to US$ 39 million.
Portfolio investments in the form of equity and investment fund in the CSE declined in 2014,reflecting the overall drop in investor enthusiasm in the emerging markets as the Federal ReserveSystem of the United States ended its quantitative easing stimulus program. Accordingly, net foreigninflows to the CSE were recorded at US$ 162.6 million in 2014, including US$ 180 million in thesecondary market transactions and US$ 4.4 million in the primary market transactions, compared toa net inflow of US$ 226 million in 2013. Foreign investments in the Government securities marketrecorded a net outflow in 2014 amounting to US$ 113.1 million with investments in Treasury bondsrecording a net inflow of US$ 59.6 million and investments in Treasury bills recording a net outflowof US$ 172.7 million.
In 2013, total foreign investment in the CSE amounted to US$ 270 million, comprising of US$ 263million equity and investment fund shares and US$ 7 million direct investments. Net inflows fromequity, as well as the six individual foreign investments (where were for less than 10% of voting sharesof Sri Lankan companies), were regarded as ‘equity and investment fund shares’ and were reportedunder the portfolio investments category. Investment fund shares to the CSE comprised secondarymarket transactions of US$ 172 million and inflows to the primary market of US$ 91 million. Inflowsto the primary market primarily consisted of inflows from rights issues of US$ 83 million.
Monetary System
Central Bank
The Central Bank of Sri Lanka (known as the Central Bank of Ceylon prior to 1985) was establishedby the Monetary Law Act No. 58 of 1949 (as amended) (the “MLA”) with capital appropriated fromthe Board of Commissioners of Currency and commenced operations on August 28, 1950. The CentralBank is responsible for safeguarding both the value of the Rupee and the country’s banking, financialand payments system.
With the amendments that were introduced to the MLA in December 2002, the Central Bank isresponsible for securing the objectives of (a) economic and price stability and (b) financial systemstability, with a view to encourage and promote the development of the productive resources of SriLanka.
Under the MLA, the Central Bank is governed by the Monetary Board. The Monetary Board isresponsible for making all policy decisions and for the management, operation and administration ofthe Central Bank. The Monetary Board consists of five members, including the Governor, theSecretary to the Ministry of Finance and three other members (the “Appointed Members”).
The Governor is the Chairman of the Monetary Board and also functions as the Chief ExecutiveOfficer of the Central Bank. The Governor and the Appointed Members are appointed by the Presidentfor a six-year term, on the recommendation of the Minister of Finance. The quorum for MonetaryBoard meetings is three members. The concurrence of three members is required for decisions of theMonetary Board to be valid. However, in cases where a unanimous decision is required, theconcurrence of all five members is necessary.
Beginning in 2015, the Central Bank functions under the Ministry of National Policies and EconomicAffairs.
91
Monetary Policy
The Central Bank conducts monetary policy to attain price stability in the domestic economy byinfluencing the cost and availability of money through the interest rate and credit channels as well asother channels of monetary policy transmission.
The Central Bank sets the policy interest rates for its own dealings with commercial banks to affectthe range of interest rates set by commercial banks and other financial institutions for borrowers andsavers, and in turn influences spending, investment and output decisions in the economy, andeventually the cost of production and the prices of goods and services.
The Central Bank’s monetary policy is primarily conducted through market based policy instrumentsand open market operations. Under the MLA, the following policy instruments are also available forthe Central Bank:
• foreign exchange operations;
• quantitative restrictions on credit;
• ceilings on interest rates; and
• refinance facilities.
The main monetary policy tools used by the Central Bank are the policy interest rates, i.e., theStanding Deposit Facility Rate (“SDFR”) and the Standing Lending Facility Rate (“SLFR”). TheCentral Bank sets these policy rates at a level to ensure that the aggregate demand is in line with theproductive capacity of the economy. A change in the Central Bank’s standing rates would have animmediate impact on interest rates in the inter-bank call money market (the money market amongcommercial banks). Within a very short period of time, changes in call rates may lead to changes inother flexible short-term rates, such as the yield on Treasury bills and the lending rates of commercialbanks to their prime customers. These changes affect the general lending rates of commercial banks,the yields on medium term Government securities, such as Treasury bonds, and deposit rates offeredby banks. The changes in the interest rates may lead to corresponding changes of the demand for creditfrom firms for investment and consumers for consumption expenditures, thereby affecting the pricesand the output of products in various industries.
When inflation is higher or lower than the projected level, the Central Bank may raise or lower itsSDFR and SLFR to facilitate and maintain a healthy rate of economic growth. Given that the effectsof monetary policies on the economy normally lag, the Central Bank is required to take appropriateadvance policy measures in order to effectively control inflation at the targeted level.
Other key monetary policy tools used by the Central Bank to control inflation are open marketoperations, which involve the sale or purchase of acceptable securities, namely, Government securitiesand Central Bank securities, either on a repurchase/reverse repurchase basis or outright basis; the SRRin accordance with which, commercial banks are required to maintain a stipulated percentage of theirrupee deposits with the Central Bank; and moral suasion. Considering the Central Bank’s zero creditrisk in rupee transactions, the SDF of the Central Bank was uncollateralized from February 2014,while other transactions under Open Market Operations (OMO) continued to remain collateral based.
Monetary Policy in 2011, 2012, 2013, 2014, 2015, and 2016
The gradual tightening of monetary policy initiated towards the end of 2015 continued into 2016 aswell. In spite of the policy measures taken by the Central Bank in December 2015 and some upwardadjustments observed in market interest rates, certain risks to macroeconomic stability persisted dueto excessive growth of broad money fuelled by domestic credit expansion amid the continued upwardtrend in underlying inflation. Accordingly, while continuing with precautionary measures such asapplication of Loan-to-Value (“LTV”) ratios as pre-emptive policy measures to contain furtherbuild-up of demand driven inflationary pressures in the economy, the Central Bank increased theSDFR and SLFR by 50 basis points each, to 6.50% and 8.00%, respectively, in February 2016.AWCMR and other short term interest rates responded to the increase in policy interest rates, while
92
excess liquidity in the domestic money market continued to decline further, requiring the Central Bankto actively engage in liquidity management measures. OMOs conducted by the Central Bank helpedmanage volatility in short term money market rates to a large extent. To preempt the escalation ofinflationary pressures and to support the BOP, the Central Bank further tightened the monetary policystance in July 2016, by increasing the SDFR and the SLFR by 50 basis points each to 7.00% and8.50%, respectively. Although the growth of credit disbursements to the private sector by commercialbanks decelerated to some extent, expansion in money and credit aggregates remained higher thanprojected while there was a continued supply- and tax-driven rise in inflation, particularly in early2017. These developments prompted the Central Bank to tighten monetary policy further in March2017 as a precautionary measure to contain the build-up of adverse inflation expectations and secondround effects within its increasingly forward looking approach to the conduct of monetary policy.
In view of the continued low inflation environment as well as subdued inflation expectations, theCentral Bank continued to pursue a relatively relaxed monetary policy stance during 2015, althoughit initiated a gradual tightening of monetary policy towards the end of 2015. Having observedconsistent growth in the credit extended to the private sector by commercial banks in the second halfof 2014, the special SDF rate of 5% was removed on March 2, 2015. Furthermore, effective April 15,2015, SDFR and SLFR were reduced by 50 basis points to 6.00% and 7.50%, respectively. With thedecline in market liquidity levels during 2015, there has been a gradual upward adjustment inovernight interest rates, and hence the Central Bank occasionally conducted reverse repurchaseauctions to maintain interest rate stability.
Given the rapid growth of exposure of banks and financial institutions to certain categories of lending,in particular lending in respect of motor vehicles, several policy measures were introduced towardsthe end of 2015 to contain credit flows to selected sectors. Accordingly, a minimum cash marginrequirement of 100% was imposed on LCs opened for the importation of motor vehicles, which wasreplaced later by a maximum Loan to Value (“LTV”) ratio of 70% on loans and advances granted forthe purpose of purchase or utilization of motor vehicles as a macro-prudential measure. Furthermore,although an immediate threat to price stability is not expected, the Central Bank commencedtightening its monetary policy stance gradually from the end of 2015 in order to forestall excessivedemand pressures on inflation arising from high credit and monetary expansion and the relatively highexcess rupee liquidity in the domestic money market. Accordingly, the Central Bank raised the SRRby 1.50% in December 2015, to be effective from January 16, 2016.
The Central Bank continued to maintain its eased monetary policy stance throughout 2014. At thebeginning of 2014, the Central Bank renamed its Repo Rate and Reverse Repo Rate as the SDFR andthe SLFR, respectively. Further, the SDF was uncollateralized starting from February 1, 2014. TheCentral Bank also lowered the SLFR by 50 basis points to 8% on January 2, 2014, intending to furtherreduce the volatility of short-term interest rates and facilitate a reduction in the spread between marketlending and deposit rates. Such an outcome would, in turn, enhance the efficiency of financialintermediation, thereby enabling the private sector to increase investment to support the expansion ineconomic activities. However, during the early part of 2014, the Central Bank observed that thegrowth of credit extended to the private sector by commercial banks remained modest in spite of thecontinued easing of monetary policy, resulting in the accumulation of a large amount of excessliquidity in the domestic monetary market. As a result, the Central Bank rationalized the access to itsSDF in September 2014, aiming to utilize the excess liquidity in the market more effectively tosupport productive economic activities.
The Central Bank eased its monetary policy stance in 2013 to regain high growth momentum in thecontext of well-contained demand-driven inflationary pressures and subdued inflation expectations.The Central Bank reduced its key policy interest rates by 50 basis points in May 2013. While marketinterest rates adjusted downward in line with such policy, deposit rates and general lending ratesremained downward rigid in the first few months of the year. To address this rigidity, the Central Banklowered the SRR by 200 basis points from 8% to 6%, effective July 2013. The Central Bank continuedits relaxed monetary policy by further reducing the main policy interest rates by another 50 basispoints in October 2013. As a result, the repurchase rate and the reverse repurchase rate were at 6.5%and 8.5%, respectively, at the end of 2013.
93
The Central Bank followed a tight monetary policy stance in 2012 with the aim of containing monetaryexpansion, thereby reducing demand driven inflationary pressures. As the high growth of money andcredit in 2011 continued unabated into 2012, the Central Bank raised its key policy interest rates by50 basis points in February 2012. Policy interest rates were increased further by 25 basis points inApril 2012. The Central Bank also issued a Direction under Section 101(1) of the MLA in March 2012,informing all banks to restrict their rupee lending portfolio to 18% or 23% with respect to banks thatfinance the difference through funds mobilized abroad. As a result of these policies, the growth ofbroad money and credit obtained by the private sector decelerated significantly towards the end of2012. This decrease, together with favorable inflation environment, enabled the Central Bank to relaxmonetary policy in December 2012 by reducing the main policy interest rates by 25 basis points. TheCentral Bank was also able to remove the ceiling on credit expansion in December 2012.
The accommodative policy stance pursued by the Central Bank during the early part of 2011 wasgradually reversed in the last six months of 2011. Continuing with the policy easing carried out in theprevious year, the Central Bank, enabled by the prevalent healthy outlook for future inflation, reducedits policy rates further in January 2011 with the intent of augmenting private sector investment in theeconomy. Accordingly, the repurchase rate was reduced by 25 basis points to 7.00% while the reverserepurchase rate was cut by 50 basis points to 8.50%. The continued high level of excess liquidity thatprevailed in the market, however, remained a concern given its potential to fuel credit at lower costsleading to eventual inflationary pressures. Therefore, the Central Bank in April 2011 increased theSRR by one percentage point signaling the change in the Bank’s policy stance towards a morerestrictive approach. The Central Bank also engaged in discussions with the commercial banks toimpress upon them the need to curb their lending portfolio to a more desirable size to minimize theexpansionary impact on the money supply as well as to mitigate any threats to financial systemstability arising from excessive credit growth.
Given the importance of maintaining transparency of the policy decisions taken by the Central Bankand with a view to enhancing its communication with the general public in order to manage inflationexpectations, the Central Bank has continued to communicate its policy decisions to markets,explaining the reasons for the policy decisions made. Accordingly, policies and decisions of theCentral Bank were communicated to market participants and the general public on a regular basis andin a timely manner through regular and occasional communiqués, press conferences, seminars andlectures as well as speeches by the Governor and the senior officials of the Central Bank. In addition,the Central Bank formally adopted the SDDS of the IMF for disseminating economic, monetary andfinancial data to the public, while continuing to publish useful economic information on a daily,weekly and monthly basis in the form of economic indicators, bulletins as well as a macroeconomicchart pack on the Central Bank website. The Central Bank is in the process of further improving thequality of data and information used for monetary policy analyses. Accordingly, with the assistanceof the IMF, the Central Bank commenced reporting monetary and financial data based on standardizedreport forms (“SRF”) of the IMF. From 2018, the Central Bank is expected to release an improved setof monetary statistics along with relevant explanatory notes and analyses. Further, in January 2017,the Central Bank recommenced the announcement of the Annual Road Map for Monetary and FinancialSector Policies to guide stakeholders of the economy with a medium term focus.
94
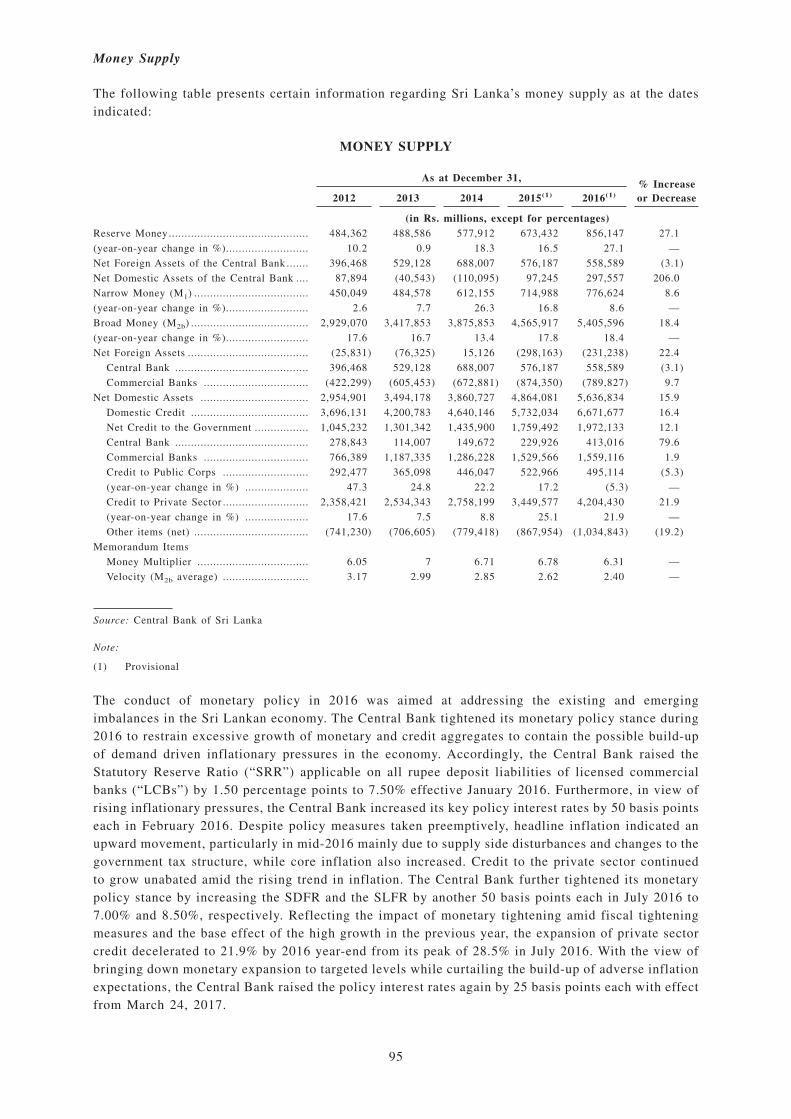
Money Supply
The following table presents certain information regarding Sri Lanka’s money supply as at the datesindicated:
MONEY SUPPLY
As at December 31,% Increaseor Decrease2012 2013 2014 2015(1) 2016(1)
(in Rs. millions, except for percentages)Reserve Money............................................ 484,362 488,586 577,912 673,432 856,147 27.1
(year-on-year change in %).......................... 10.2 0.9 18.3 16.5 27.1 —
Net Foreign Assets of the Central Bank ....... 396,468 529,128 688,007 576,187 558,589 (3.1)
Net Domestic Assets of the Central Bank .... 87,894 (40,543) (110,095) 97,245 297,557 206.0
Narrow Money (M1) .................................... 450,049 484,578 612,155 714,988 776,624 8.6
(year-on-year change in %).......................... 2.6 7.7 26.3 16.8 8.6 —
Broad Money (M2b) ..................................... 2,929,070 3,417,853 3,875,853 4,565,917 5,405,596 18.4
(year-on-year change in %).......................... 17.6 16.7 13.4 17.8 18.4 —
Net Foreign Assets ...................................... (25,831) (76,325) 15,126 (298,163) (231,238) 22.4
Central Bank .......................................... 396,468 529,128 688,007 576,187 558,589 (3.1)
Commercial Banks ................................. (422,299) (605,453) (672,881) (874,350) (789,827) 9.7
Net Domestic Assets .................................. 2,954,901 3,494,178 3,860,727 4,864,081 5,636,834 15.9
Domestic Credit ..................................... 3,696,131 4,200,783 4,640,146 5,732,034 6,671,677 16.4
Net Credit to the Government ................. 1,045,232 1,301,342 1,435,900 1,759,492 1,972,133 12.1
Central Bank .......................................... 278,843 114,007 149,672 229,926 413,016 79.6
Commercial Banks ................................. 766,389 1,187,335 1,286,228 1,529,566 1,559,116 1.9
Credit to Public Corps ........................... 292,477 365,098 446,047 522,966 495,114 (5.3)
(year-on-year change in %) .................... 47.3 24.8 22.2 17.2 (5.3) —
Credit to Private Sector ........................... 2,358,421 2,534,343 2,758,199 3,449,577 4,204,430 21.9
(year-on-year change in %) .................... 17.6 7.5 8.8 25.1 21.9 —
Other items (net) .................................... (741,230) (706,605) (779,418) (867,954) (1,034,843) (19.2)
Memorandum Items
Money Multiplier ................................... 6.05 7 6.71 6.78 6.31 —
Velocity (M2b average) ........................... 3.17 2.99 2.85 2.62 2.40 —
Source: Central Bank of Sri Lanka
Note:
(1) Provisional
The conduct of monetary policy in 2016 was aimed at addressing the existing and emergingimbalances in the Sri Lankan economy. The Central Bank tightened its monetary policy stance during2016 to restrain excessive growth of monetary and credit aggregates to contain the possible build-upof demand driven inflationary pressures in the economy. Accordingly, the Central Bank raised theStatutory Reserve Ratio (“SRR”) applicable on all rupee deposit liabilities of licensed commercialbanks (“LCBs”) by 1.50 percentage points to 7.50% effective January 2016. Furthermore, in view ofrising inflationary pressures, the Central Bank increased its key policy interest rates by 50 basis pointseach in February 2016. Despite policy measures taken preemptively, headline inflation indicated anupward movement, particularly in mid-2016 mainly due to supply side disturbances and changes to thegovernment tax structure, while core inflation also increased. Credit to the private sector continuedto grow unabated amid the rising trend in inflation. The Central Bank further tightened its monetarypolicy stance by increasing the SDFR and the SLFR by another 50 basis points each in July 2016 to7.00% and 8.50%, respectively. Reflecting the impact of monetary tightening amid fiscal tighteningmeasures and the base effect of the high growth in the previous year, the expansion of private sectorcredit decelerated to 21.9% by 2016 year-end from its peak of 28.5% in July 2016. With the view ofbringing down monetary expansion to targeted levels while curtailing the build-up of adverse inflationexpectations, the Central Bank raised the policy interest rates again by 25 basis points each with effectfrom March 24, 2017.
95
The monetary policy stance remained relatively accommodative throughout 2015 with a view tosupport economic activity in an environment of continued low inflation and favorable inflationexpectations, despite the gradual tightening measures in the latter part of the year. Considering thesustained increase in credit flows to the private sector that was encouraged by the low interest rateenvironment maintained during the past few years, with effect from March 2, 2015, the Central Bankremoved the temporary restrictions that were placed in September 2014 on the access to its SDF bymarket participants under the OMO. Following this move, the overnight interest rates in the moneymarket increased and displayed some volatility before settling closer to the lower bound of the policyrate corridor. Considering the space created by the sharp decline in inflation as well as the favorableoutlook for inflation, the Central Bank reduced its main policy interest rates, namely, the SDFR andthe SLFR, by 50 basis points to 6.00% and 7.50%, respectively, in April 2015. However, given thehigher than expected domestic credit growth, the Central Bank started to tight the monetary policy byincreasing the SRR applicable on all rupee deposit liabilities of licensed commercial banks by 1.50%in December 2015, to be effective from January 16, 2016. This measure was expected to permanentlyabsorb a part of excess liquidity from the market.
Monetary aggregates continued to grow at a high rate in 2016 mainly as a result of the expansion incredit to both the Government and the private sector. The year-on-year growth of broad money, whichpeaked at 19.8% in February 2016, decelerated to 18.4% by 2016 year-end, compared to 17.8% at 2015year-end. On average, broad money growth was 18.1% in 2016 in comparison to 15.2% in 2015. Theexpansion in broad money supply during 2016 was largely driven by the expansion in NDA of thebanking system, while NFA of the banking system also increased during the year. Driven by theexpansion in credit flows to domestic sectors, NDA of the banking system expanded further in 2016,albeit at a slower pace in comparison to 2015. In absolute terms, NDA recorded an increase of Rs.772.7 billion in 2016 but remained below the increase of Rs. 1,003.4 billion observed in 2015.Contributing to the increase in NDA, NCG from the banking system increased substantially in 2016.During 2016, NCG increased by Rs. 212.6 billion, compared to the increase of Rs. 323.6 billionrecorded in 2015. However, reflecting the improvements in a number of SOBEs, credit extended bythe banking system to public corporations declined by Rs. 27.9 billion during 2016, compared to theincrease of Rs. 76.9 billion during 2015.
In 2015, responding to relaxed monetary policy conditions in the economy, monetary aggregatesincreased at a high rate led by the significant expansion in domestic credit. Accordingly, broad moneyrecorded a year-on-year growth of 17.8% by the end of 2015, compared to a 13.4% growth recordedin 2014. The growth of domestic credit, which includes credit flows from the banking sector to theprivate sector, the Government and public corporations, contributed significantly to the monetaryexpansion during 2015. As a result, NDA of the banking system increased significantly by Rs.1,003.3billion while NFA of the banking system recorded a contraction of Rs.313.3 billion by the end of 2015.Within the NDA category credit to the private sector recorded a significant expansion, increasing by25.1%, year-on-year, by the end of 2015, compared to a 8.8% growth recorded in 2014.
The monetary policy stance has remained relatively eased in 2014, supported by stable inflation levelsas a result of well-contained demand pressures as well as improved supply conditions. Severaladjustments were introduced to streamline the policy interest rate corridor at the beginning of the year.Specifically, the Central Bank established a Standing Rate Corridor (“SRC”) in place of the policy ratecorridor while introducing the SDFR and the SLFR that replaced, respectively, the repurchase rate andthe reverse repurchase rate of the Central Bank. Further, in consideration of the Central Bank’s zerocredit risk in rupee transactions, the SDF became uncollateralized beginning in February 2014, whileall other OMO transactions continued to remain collateral-based. In line with the Central Bank’sstrategy to curtail the volatility of interest rates in the short-term money market, in January 2014, theSRC was reduced to 150 basis points from 200 basis points by reducing the SLFR by 50 basis points.
96
Since then, the SDFR and the SLFR have remained at 6.50% and 8.00%, respectively. In addition tothese measures, in light of the improvements in the external sector, commencing on January 2, 2014,the Central Bank decided to remove the minimum cash margin requirement of 100% against LCsopened with commercial banks for the import of certain categories of motor vehicles that was imposedon August 30, 2013. Additionally, to encourage banks to lend more actively to the private sector,access to the SDF was rationalized as a temporary measure, commencing on September 23, 2014. Asa result, OMO participants, including commercial banks, would earn a lower special SDF rate of 5%if they access the SDF of the Central Bank more than three times per calendar month. However, havingobserved consistent growth in the credit extended to the private sector by commercial banks in thesecond half of 2014, the special SDF rate of 5% was removed on March 2, 2015. Furthermore,effective April 15, 2015, SDFR and SLFR were reduced by 50 basis points to 6.00% and 7.50%,respectively.
Monetary expansion during 2014 was consistent with the continued growth momentum of the economyand the moderation of the inflation. The year-on-year growth of broad money decelerated to 13.4% inDecember 2014 while the average growth of broad money was 13.3% during 2014. The decelerationin the expansion of monetary aggregates was largely due to the contraction in NDA of the bankingsystem during the first eight months of 2014, led by the decline in credit extended to publiccorporations and credit to the private sector by commercial banks. However, the substantial increasein NFA of the banking system by Rs.226 billion during the first nine months of 2014 outpaced thedecline in NDA of the banking system. Nevertheless, NFA recorded a decline of Rs.134.4 billion inthe last quarter of 2014, primarily due to the Central Bank’s sale of foreign exchange to the domesticforeign exchange market. In absolute terms, NDA of the banking sector increased by Rs.366.5 billionin 2014, of which Rs.300.6 billion was recorded during the last quarter of 2014. The significant growthin NDA was observed along with increased credits to the private and public sectors.
Due to the lag effect of tight monetary policy measures during 2012, monetary expansion slowed in2013, with average growth of broad money decelerating to 16.5%, compared to an average annualgrowth of 20.2% in 2012. The reduction in the NFA of the banking sector, slower growth in privatesector credit and the relatively low levels of credit obtained by public corporations contributed to thedeceleration in the growth of broad money. However, a significant increase in net credit granted to theGovernment during this period contributed to the expansion of money supply.
Responding to the policy measures taken in early 2012, the year-on-year growth of broad moneydecelerated to 17.6% in by the end of 2012, compared to 22.9% in April 2012. Contributing to thisgrowth was the increase in credit to the private sector. However, the decline in NFA of the bankingsystem subdued the high monetary expansion. Credit to the private sector slowed towards the end ofthe year and recorded a year-on-year growth of 17.6% by the end of December 2012, compared to35.2% in March 2012 and 34.5% at the end of 2011. Monetary expansion and growth of credit to theprivate sector decelerated significantly towards end 2012 owing to the policy action taken earlier in2012.
Broad money expanded at a higher rate than targeted in 2011. High monetary expansion was largelydue to the increase in credit to the private and public sectors above the projected levels. The mainreasons for the high demand for credit by the private sector include increased economic activityreflecting the conducive environment for investments, increased domestic demand, higher demand forimports, continued low interest rates and improved access to credit. Meanwhile, public sectorborrowings from the banking system also increased, with the decline in non-banking sector fundingfor government deficit financing. The decline in NFA of the banking system partly mitigated theexpansionary impact of credit growth on money supply.
97
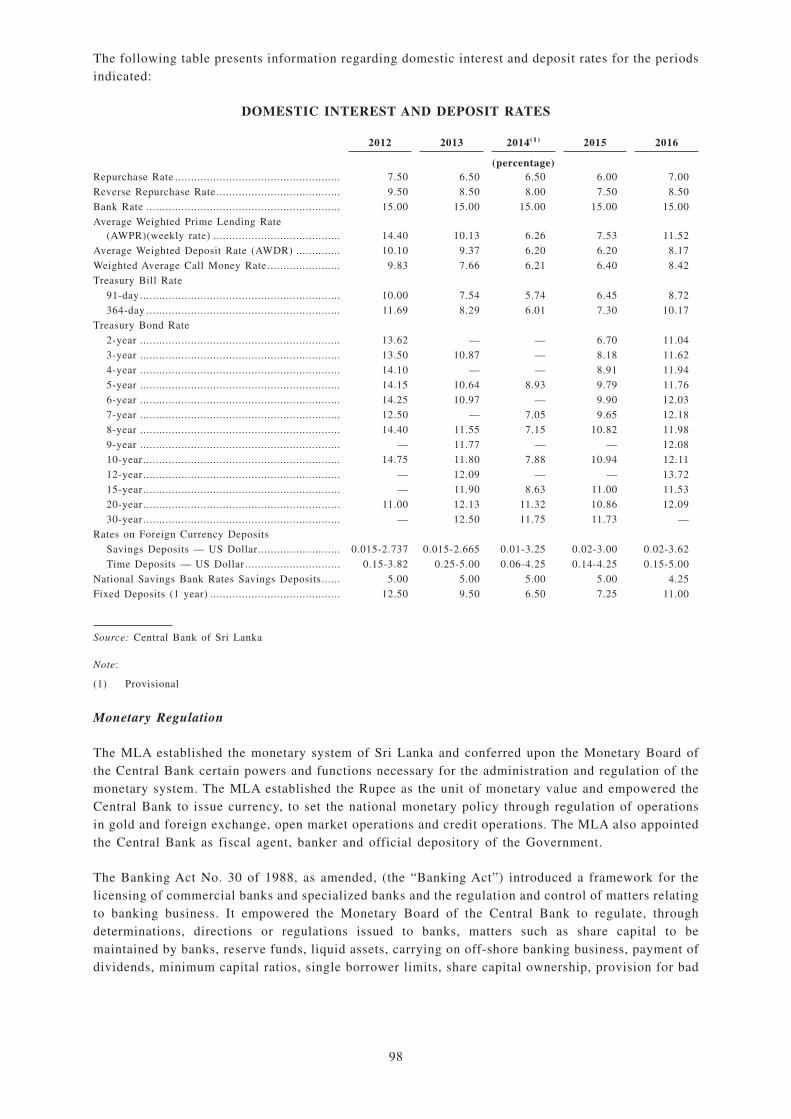
The following table presents information regarding domestic interest and deposit rates for the periodsindicated:
DOMESTIC INTEREST AND DEPOSIT RATES
2012 2013 2014(1) 2015 2016
(percentage)Repurchase Rate .................................................... 7.50 6.50 6.50 6.00 7.00
Reverse Repurchase Rate ....................................... 9.50 8.50 8.00 7.50 8.50
Bank Rate ............................................................. 15.00 15.00 15.00 15.00 15.00
Average Weighted Prime Lending Rate(AWPR)(weekly rate) ........................................ 14.40 10.13 6.26 7.53 11.52
Average Weighted Deposit Rate (AWDR) .............. 10.10 9.37 6.20 6.20 8.17
Weighted Average Call Money Rate ....................... 9.83 7.66 6.21 6.40 8.42
Treasury Bill Rate
91-day ............................................................... 10.00 7.54 5.74 6.45 8.72
364-day ............................................................. 11.69 8.29 6.01 7.30 10.17
Treasury Bond Rate
2-year ............................................................... 13.62 — — 6.70 11.04
3-year ............................................................... 13.50 10.87 — 8.18 11.62
4-year ............................................................... 14.10 — — 8.91 11.94
5-year ............................................................... 14.15 10.64 8.93 9.79 11.76
6-year ............................................................... 14.25 10.97 — 9.90 12.03
7-year ............................................................... 12.50 — 7.05 9.65 12.18
8-year ............................................................... 14.40 11.55 7.15 10.82 11.98
9-year ............................................................... — 11.77 — — 12.08
10-year.............................................................. 14.75 11.80 7.88 10.94 12.11
12-year.............................................................. — 12.09 — — 13.72
15-year.............................................................. — 11.90 8.63 11.00 11.53
20-year.............................................................. 11.00 12.13 11.32 10.86 12.09
30-year.............................................................. — 12.50 11.75 11.73 —
Rates on Foreign Currency Deposits
Savings Deposits — US Dollar.......................... 0.015-2.737 0.015-2.665 0.01-3.25 0.02-3.00 0.02-3.62
Time Deposits — US Dollar .............................. 0.15-3.82 0.25-5.00 0.06-4.25 0.14-4.25 0.15-5.00
National Savings Bank Rates Savings Deposits...... 5.00 5.00 5.00 5.00 4.25
Fixed Deposits (1 year) ......................................... 12.50 9.50 6.50 7.25 11.00
Source: Central Bank of Sri Lanka
Note:
(1) Provisional
Monetary Regulation
The MLA established the monetary system of Sri Lanka and conferred upon the Monetary Board ofthe Central Bank certain powers and functions necessary for the administration and regulation of themonetary system. The MLA established the Rupee as the unit of monetary value and empowered theCentral Bank to issue currency, to set the national monetary policy through regulation of operationsin gold and foreign exchange, open market operations and credit operations. The MLA also appointedthe Central Bank as fiscal agent, banker and official depository of the Government.
The Banking Act No. 30 of 1988, as amended, (the “Banking Act”) introduced a framework for thelicensing of commercial banks and specialized banks and the regulation and control of matters relatingto banking business. It empowered the Monetary Board of the Central Bank to regulate, throughdeterminations, directions or regulations issued to banks, matters such as share capital to bemaintained by banks, reserve funds, liquid assets, carrying on off-shore banking business, payment ofdividends, minimum capital ratios, single borrower limits, share capital ownership, provision for bad
98
and doubtful debts and the forms of various accounts and reports. It also conferred upon the MonetaryBoard and the Director of Bank Supervision their respective powers to call for information, to examinethe books and records of banks, to take control of the management of any bank in specifiedcircumstances and to liquidate any bank which is unable to meet the demands of its depositors or othercontracting parties or to carry on banking business in Sri Lanka pursuant to the Banking Act.
Following the liberalization policies introduced in 1977 and the subsequent reforms in the financialbusinesses, the Central Bank gradually moved away from direct controls to a more market- orientedmonetary policy. An independently floating exchange rate regime was implemented in January 2001.The Central Bank phased out the use of policy instruments such as quantitative ceilings and refinancefacilities while, beginning on March 3, 2003, it increased its reliance on open market operations. Tostrengthen the institutional arrangement for the determination of the monetary policy decision-makingprocess, the Central Bank established the Monetary Policy Committee in 2001. In order to engage incontinuous dialogue with various stakeholders in the economy with a view of strengthening its policydecisions and aligning market expectations with its policies, the Central Bank established theMonetary Policy Consultative Committee in the beginning of 2007, comprising stakeholders andeconomists representing the private sector, to assist in the monetary policy decision making process.Meanwhile, certain measures were taken to upgrade the monetary policy framework to become morein line with international best practice. Going forward, the monetary policy conduct of the CentralBank is expected to be increasingly aligned with a flexible inflation targeting framework focusing onboth inflation and growth outcomes while maintaining the flexibility in the exchange rate. To facilitatethis goal, the Central Bank expects to continues to strengthen its technical capabilities, particularlyin modelling and forecasting. The Central Bank has also taken steps to enhance the transparency,predictability and credibility of monetary policy. The Central Bank’s monetary policy framework, andmonetary projections, along with the explanatory notes are regularly posted on the Central Bank’swebsite (www.cbsl.gov.lk). Information available on the Central Bank’s website is not, directly orindirectly, included or incorporated by reference in this Offering Circular.
Foreign Exchange System
The Government adopted a floating exchange rate system in January 2001, a major step in theliberalization of foreign exchange transactions. The Central Bank intervention in the foreign exchangemarket is mainly to prevent excessive volatility in exchange rates and to maintain an appropriate levelof external reserves. The Central Bank’s buying and selling of foreign exchange is conducted at ornear market rates.
The Exchange Control Act, No. 24 of 1953, as amended, (the “Exchange Control Act”) provides forthe imposition of duties and restrictions in relation to gold, currency, payments, securities, debts,imports, exports and transfer and settlement of properties involving foreign exchange transactions.Foreign exchange transactions relating to goods and services in trade (current transactions) are freelypermitted without restrictions through authorized dealers in foreign exchange (i.e. commercial banks)subject to their exercising due diligence to identify transactions that are not bona-fide. Capitaltransactions (transactions relating to the acquisition of real or financial assets) are partiallyliberalized, especially in the area of non-resident investments in shares issued by Sri Lankancompanies, which are permitted subject to certain exclusions and limitations. Capital transactions thatare not liberalized require approval of the Central Bank unless they are permitted under a generalpermission.
During 2010, with the goal of improving investor confidence and stabilizing the foreign exchangemarket, the Central Bank decided to gradually relax certain restrictions on foreign exchangetransactions. Accordingly, the opening and maintaining of bank accounts abroad for certain specificreasons was allowed; provisions for entering into forward contracts in foreign currency to coverforeign exchange transactions were implemented; margin requirements against advance payments onselected imports were removed; suspension of prepayment of import bills was lifted and unificationof different investor accounts maintained by non-residents in commercial banks was allowed, effectivefrom March 11, 2010. Additionally, with effect from November 22, 2010, a range of further relaxationswere implemented, including permission for foreigners to invest in Rupee denominated debenturesissued by local companies, permission for foreign companies to open places of business in Sri Lankaand approval for companies to borrow from foreign sources. Further relaxations were implemented
99
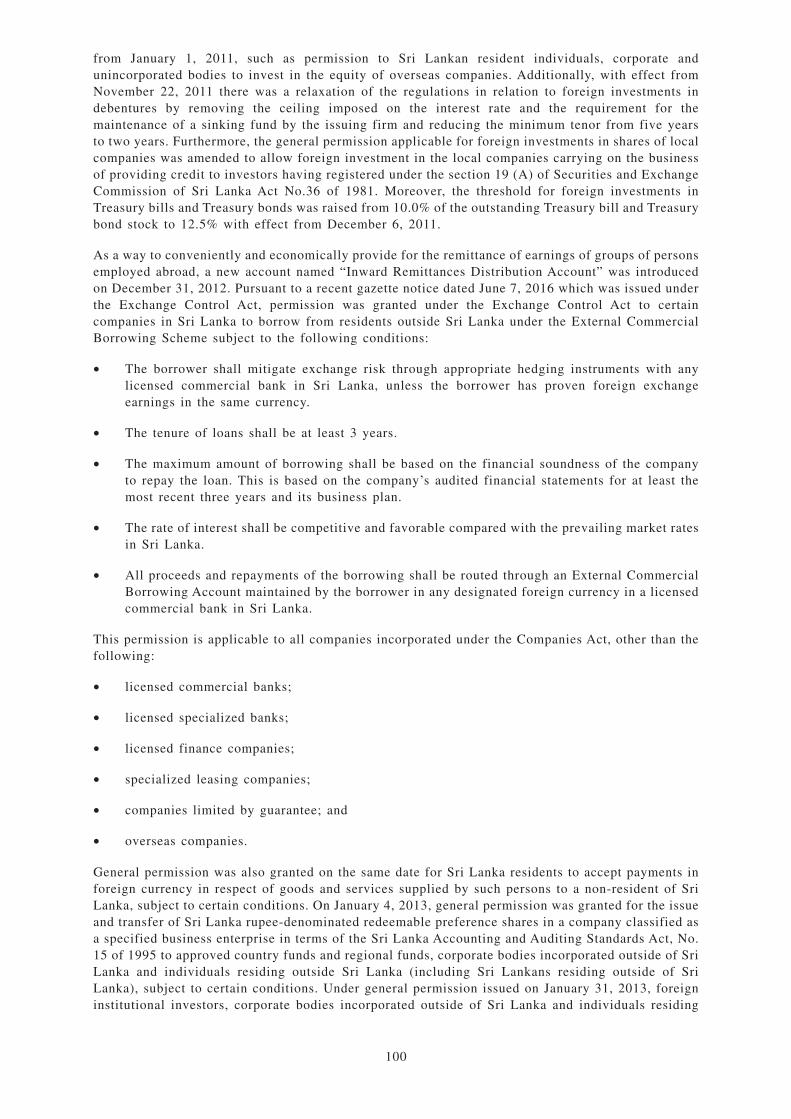
from January 1, 2011, such as permission to Sri Lankan resident individuals, corporate andunincorporated bodies to invest in the equity of overseas companies. Additionally, with effect fromNovember 22, 2011 there was a relaxation of the regulations in relation to foreign investments indebentures by removing the ceiling imposed on the interest rate and the requirement for themaintenance of a sinking fund by the issuing firm and reducing the minimum tenor from five yearsto two years. Furthermore, the general permission applicable for foreign investments in shares of localcompanies was amended to allow foreign investment in the local companies carrying on the businessof providing credit to investors having registered under the section 19 (A) of Securities and ExchangeCommission of Sri Lanka Act No.36 of 1981. Moreover, the threshold for foreign investments inTreasury bills and Treasury bonds was raised from 10.0% of the outstanding Treasury bill and Treasurybond stock to 12.5% with effect from December 6, 2011.
As a way to conveniently and economically provide for the remittance of earnings of groups of personsemployed abroad, a new account named “Inward Remittances Distribution Account” was introducedon December 31, 2012. Pursuant to a recent gazette notice dated June 7, 2016 which was issued underthe Exchange Control Act, permission was granted under the Exchange Control Act to certaincompanies in Sri Lanka to borrow from residents outside Sri Lanka under the External CommercialBorrowing Scheme subject to the following conditions:
• The borrower shall mitigate exchange risk through appropriate hedging instruments with anylicensed commercial bank in Sri Lanka, unless the borrower has proven foreign exchangeearnings in the same currency.
• The tenure of loans shall be at least 3 years.
• The maximum amount of borrowing shall be based on the financial soundness of the companyto repay the loan. This is based on the company’s audited financial statements for at least themost recent three years and its business plan.
• The rate of interest shall be competitive and favorable compared with the prevailing market ratesin Sri Lanka.
• All proceeds and repayments of the borrowing shall be routed through an External CommercialBorrowing Account maintained by the borrower in any designated foreign currency in a licensedcommercial bank in Sri Lanka.
This permission is applicable to all companies incorporated under the Companies Act, other than thefollowing:
• licensed commercial banks;
• licensed specialized banks;
• licensed finance companies;
• specialized leasing companies;
• companies limited by guarantee; and
• overseas companies.
General permission was also granted on the same date for Sri Lanka residents to accept payments inforeign currency in respect of goods and services supplied by such persons to a non-resident of SriLanka, subject to certain conditions. On January 4, 2013, general permission was granted for the issueand transfer of Sri Lanka rupee-denominated redeemable preference shares in a company classified asa specified business enterprise in terms of the Sri Lanka Accounting and Auditing Standards Act, No.15 of 1995 to approved country funds and regional funds, corporate bodies incorporated outside of SriLanka and individuals residing outside Sri Lanka (including Sri Lankans residing outside of SriLanka), subject to certain conditions. Under general permission issued on January 31, 2013, foreigninstitutional investors, corporate bodies incorporated outside of Sri Lanka and individuals residing
100
outside of Sri Lanka (including Sri Lankans residing outside of Sri Lanka) were allowed to invest inunit trusts, subject to certain, conditions. Effective June 12, 2013, general permission was granted tonon-residents to repatriate sale proceeds including capital gains, upon sale of immovable propertyowned and/or developed by the non-resident, provided the property had originally been acquiredand/or developed by such owner through funds remitted into Sri Lanka through international bankingchannels. Authorized dealers were permitted to extend accommodations in foreign currency from theDomestic Banking Unit to persons who maintain Foreign Exchange Earners’ Accounts.
The following table sets out exchange rate information between the Rupee and the US dollar.
EXCHANGE RATES OF RUPEE PER US DOLLAR
Period Period End Period Average
2010 ............................................................................................ 110.95 113.062011 ............................................................................................ 113.90 110.572012 ............................................................................................ 127.16 127.602013 ............................................................................................ 130.75 129.112014 ............................................................................................ 131.05 130.562015 ............................................................................................ 144.06 135.942016 ............................................................................................ 149.80 145.602017 (as at Mar 31, 2017) ........................................................... 151.74 150.78
Source: Central Bank of Sri Lanka
The Sri Lankan rupee, which depreciated by 0.82% in the first half of 2016, depreciated at a higherrate of 3.04% in the second half of the year. The relatively low depreciation of the rupee in the firsthalf of 2016 was supported by supply of foreign exchange liquidity by the Central Bank amountingto US$ 1,093 million, on a net basis. However, the rupee depreciated at a higher rate with thecurtailment in intervention by the Central Bank with a net supply of US$ 325 million during thesecond half of 2016. A substantial amount of the foreign exchange supplied during the second half of2016 was to partially ease the pressure arising due to the disinvestment by non-resident investors inthe Government securities market, which was triggered by the expectation and the subsequent increasein interest rates by the Federal Reserve Bank. With these developments throughout 2016, the rupeedepreciated by 3.83% against the U.S. dollar from Rs. 144.06 as at 2015 year-end to Rs. 149.80 as at2016 year-end. In addition, the annual average exchange rate depreciated by 6.64% to Rs. 145.60against the US dollar in 2016.
Between January 1, 2017 and March 31, 2017, the Sri Lankan rupee depreciated by 1.3% against theUS dollar. Based on cross-currency exchange rate movements, the Sri Lankan rupee depreciatedagainst the Australian dollar (6.5%), pound sterling (2.9%), Japanese yen (5.0%), and the euro (2.6%)by March 31, 2017.
The Sri Lankan rupee remained broadly stable during the first eight months of 2015, but depreciatedsubstantially thereafter, as a result of the Central Bank’s decision to allow greater flexibility in thedetermination of the exchange rate. The lower than expected foreign exchange inflows, coupled withhigh levels of outflows, exerted significant pressure on the exchange rate during the year. This wasmainly due to the reversal of foreign investments in the Government rupee securities market, inanticipation of, and the subsequent hike in interest rates in the US, and the high level of demand forforeign exchange, due to increased expenditure non-oil imports and foreign debt service payments.The resultant persistent depreciation pressure on the Sri Lankan rupee against the US dollarnecessitated the continuous intervention of the Central Bank in the domestic foreign exchange market,in order to reduce volatility. Supported by the supply of US$ 1.9 billion by the Central Bank, on a netbasis, the rupee recorded a marginal depreciation of 2.42% against the US dollar, during the first eightmonths of the year. However, on September 3, 2015, the Central Bank decided to limit its interventionin the domestic foreign exchange market and allowed the exchange rate to be largely determined bythe demand and supply conditions of the market. This resulted in the Sri Lankan rupee depreciatingby 6.64% against the US dollar, during the period from September 4, 2015 to December 31, 2015.Overall, the rupee depreciated against the US dollar by 9.03% to Rs.144.06 as at end 2015.
101
The Sri Lankan rupee appreciated against the US dollar during the first three quarters of 2014,warranting a certain level of intervention by the Central Bank’s in order to avoid undue appreciation.The appreciation pressure was mainly caused by an increase in foreign exchange inflows in the formof export earnings, workers’ remittances and other financial inflows such as the proceeds from the ISBofferings, Government securities, foreign loans to the Government and private sector as well asforeign investment in the CSE. Specifically, the rupee had appreciated by 0.29% against the US dollaras at September 30, 2014. However, as import demand increased and Government securities marketrecorded net outflows in the last quarter of 2014, the Sri Lankan rupee depreciated by 0.47% againstthe US dollar, resulting in an overall depreciation of 0.23% against the US dollar by the end of 2014.Accordingly, the year-end and annual average exchange rates were at Rs.131.05 and Rs.130.56 againstthe US dollar, respectively. The Sri Lankan rupee appreciated against the Japanese yen (13.48%), theeuro (13.19%), the pound sterling (5.65%) and the Indian rupee (2.13%) in 2014 as a result ofinternational cross-currency exchange rates movements. In addition, the rupee also appreciated againstthe SDR by 6.05% by the end of 2014.
In February 2012, the Central Bank decided to allow more flexibility in the exchange rate and limitits intervention in the foreign exchange market. Subsequently, the exchange rate policy in 2013 wasfocused on maintaining flexibility in the determination of the external value of the Sri Lanka rupee.Subsequent to initial fluctuation triggered by the policy change introduced in early 2012, the Sri Lankarupee gradually stabilized against the US dollar until early June 2013. Accordingly, the rupeeappreciated against the US dollar by 0.55% from January 2013 to the first week of June 2013.However, from the second week of June through the end of August, the rupee depreciated by 5.01%against the US dollar, primarily due to increased import demand in June and July and the expectationof unwinding by foreign investors from the Government securities market in anticipation of possibletapering of quantitative easing by the Federal Reserve Bank of the United States. Nonetheless, the SriLanka rupee fared better than many regional currencies such as the Japanese yen, the Indian rupee andthe Indonesian rupiah, which witnessed heavy depreciations following the announcement of possibletapering of quantitative easing. Since the beginning of September 2013 through the end of October2013, the Sri Lanka rupee gained value by 1.45% against the US dollar, mainly supported by increasedinflows to the banking sector including the NSB Bond issue in September 2013, which strengthenedmarket expectations. In 2013, the rupee appreciated against major international currencies such as theJapanese yen (18.78%), the Australian dollar (13.35%) and the Indian rupee (10.16%), whiledepreciating against the US dollar (2.75%), the Pound sterling (4.69%) and the Euro (6.83%).
The Central Bank compiles two effective exchange rate indices based on the 5-currency and24-currency baskets. Accordingly, the 5-currency Nominal Effective Exchange Rate (“NEER”) andReal Effective Exchange Rate (“REER”) indices capture the movement of the value of the rupeeagainst five major currencies; the US dollar, Euro, Pound sterling, Japanese yen and Indian rupee. Theweights derived from relative importance of trading currencies to Sri Lanka in terms of both exportsand imports have been normalized in computing 5-currency NEER and REER indices. Similarly, the24-currency NEER and REER indices are now being computed with some new trading partners,reflecting recent developments in the external sector. Accordingly, from the 2006 basket of countries,Denmark, the Philippines, South Africa and Sweden have been replaced by Australia, Pakistan, Russiaand Turkey in creating the 2010 basket of countries, based on the importance of trade with thosecountries.
102
The Real Effective Exchange Rate (“REER”) indices, which take the variation in nominal exchangerates in the baskets into account, as well as the inflation differentials among countries, wererecalculated from 2010 onwards using the newly rebased Colombo Consumer Price Index (2013=100).Accordingly, both 5-currency and 24-currency REER indices recorded an appreciation of 2.83% and2.70%, respectively, by the end of 2016. The relatively high level of domestic inflation in Sri Lanka,in comparison to the overall inflation level of its trading partners and competitors, has largelycontributed towards the appreciation of the REER indices in 2016. Meanwhile, the Nominal EffectiveExchange Rate (“NEER”) index for the 5-currency basket appreciated marginally by 0.23% while thesame for the 24-currecny basket recorded a marginal depreciation of 0.95% during 2016.
The 5-currency and the 24-currency effective exchange rate indices depreciated during 2015.Reflecting cross currency exchange rate movements and the nominal depreciation of the Sri Lankanrupee against most of the currencies in the currency basket, both the 5-currency and the 24-currencyNEER indices depreciated by 4.12% and 3.02%, respectively, during 2015. The REER, which takesinto account the inflation differentials amongst countries, in addition to the variation in nominalexchange rates, also depreciated during this period. Accordingly, both the 5-currency and the24-currency REER indices depreciated by 1.37% and 0.55%, respectively, during the year. Thisdepreciation of the REER indices attributed to the depreciation of the NEER indices and the relativelylow levels of domestic inflation, compared to most trading partners and competitors.
In 2014, the NEER and REER indices appreciated, extending the modest appreciation observed in2013. The NEER, based on the 5-currency and 24-currency baskets, appreciated equally by 6.02%,reflecting the nominal appreciation of the Sri Lankan rupee against the major currencies in bothcurrency baskets. The REER, which takes into account the changes in the inflation differentials,showed appreciation in the 5-currency and 24-currency baskets by 6.01% and 5.52%, respectively.This appreciation of the REER can be attributed to the appreciation of the NEER as well as a relativelyhigh level of domestic inflation compared to that of Sri Lanka’s trading partners and competitors.
Reflecting cross-currency movements, the rupee depreciated against all major currencies in 2012. Therupee depreciated against the US dollar (10.4%), the Pound sterling (14.6%), the Euro (12.3%) and theIndian rupee 7.5%. However, the rupee only depreciated moderately against the Japanese yen (0.9%)with the slowdown in activity in Japan. In 2012, both the NEER and the REER depreciatedsubstantially, compared to the appreciation observed in 2011. The nominal depreciation of the SriLanka rupee against all major currencies in the currency basket resulted in a depreciation of theNEER. The NEER based on the 5-currency basket, which includes the US dollar, the Pound sterling,the Euro, the Japanese yen and the Indian rupee, depreciated by 10.5% while the NEER based on thenominal exchange rates of 24 trading partners and competitors depreciated by 11.0%. Meanwhile, theinflation differential was higher due to relatively higher domestic inflation compared to that of tradingpartners and competitors. However, nominal depreciation of the rupee was larger than the inflationdifferential, resulting in a depreciation of the REER based on both 5-currency and 24-currency basketsby 4.9% and 5.5%, respectively, in 2012. In 2012, the total volume of spot transactions in the domesticforeign currency market decreased by 25.8% and total volume of forward transactions decreased by27.7% compared to 2011.
103
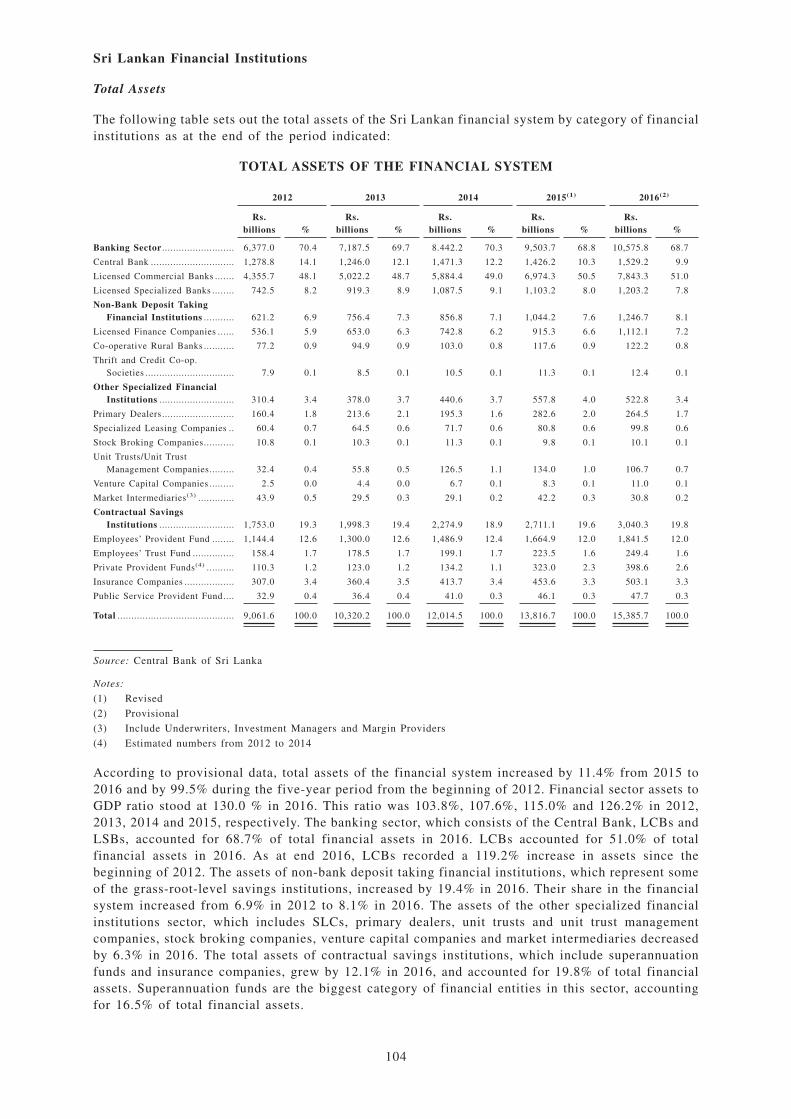
Sri Lankan Financial Institutions
Total Assets
The following table sets out the total assets of the Sri Lankan financial system by category of financialinstitutions as at the end of the period indicated:
TOTAL ASSETS OF THE FINANCIAL SYSTEM
2012 2013 2014 2015(1) 2016(2)
Rs.billions %
Rs.billions %
Rs.billions %
Rs.billions %
Rs.billions %
Banking Sector .......................... 6,377.0 70.4 7,187.5 69.7 8.442.2 70.3 9,503.7 68.8 10,575.8 68.7
Central Bank .............................. 1,278.8 14.1 1,246.0 12.1 1,471.3 12.2 1,426.2 10.3 1,529.2 9.9
Licensed Commercial Banks ....... 4,355.7 48.1 5,022.2 48.7 5,884.4 49.0 6,974.3 50.5 7,843.3 51.0
Licensed Specialized Banks ........ 742.5 8.2 919.3 8.9 1,087.5 9.1 1,103.2 8.0 1,203.2 7.8
Non-Bank Deposit TakingFinancial Institutions ........... 621.2 6.9 756.4 7.3 856.8 7.1 1,044.2 7.6 1,246.7 8.1
Licensed Finance Companies ...... 536.1 5.9 653.0 6.3 742.8 6.2 915.3 6.6 1,112.1 7.2
Co-operative Rural Banks ........... 77.2 0.9 94.9 0.9 103.0 0.8 117.6 0.9 122.2 0.8
Thrift and Credit Co-op.Societies ................................ 7.9 0.1 8.5 0.1 10.5 0.1 11.3 0.1 12.4 0.1
Other Specialized FinancialInstitutions ........................... 310.4 3.4 378.0 3.7 440.6 3.7 557.8 4.0 522.8 3.4
Primary Dealers.......................... 160.4 1.8 213.6 2.1 195.3 1.6 282.6 2.0 264.5 1.7
Specialized Leasing Companies .. 60.4 0.7 64.5 0.6 71.7 0.6 80.8 0.6 99.8 0.6
Stock Broking Companies........... 10.8 0.1 10.3 0.1 11.3 0.1 9.8 0.1 10.1 0.1
Unit Trusts/Unit TrustManagement Companies......... 32.4 0.4 55.8 0.5 126.5 1.1 134.0 1.0 106.7 0.7
Venture Capital Companies ......... 2.5 0.0 4.4 0.0 6.7 0.1 8.3 0.1 11.0 0.1
Market Intermediaries(3) ............. 43.9 0.5 29.5 0.3 29.1 0.2 42.2 0.3 30.8 0.2
Contractual SavingsInstitutions ........................... 1,753.0 19.3 1,998.3 19.4 2,274.9 18.9 2,711.1 19.6 3,040.3 19.8
Employees’ Provident Fund ........ 1,144.4 12.6 1,300.0 12.6 1,486.9 12.4 1,664.9 12.0 1,841.5 12.0
Employees’ Trust Fund ............... 158.4 1.7 178.5 1.7 199.1 1.7 223.5 1.6 249.4 1.6
Private Provident Funds(4) .......... 110.3 1.2 123.0 1.2 134.2 1.1 323.0 2.3 398.6 2.6
Insurance Companies .................. 307.0 3.4 360.4 3.5 413.7 3.4 453.6 3.3 503.1 3.3
Public Service Provident Fund.... 32.9 0.4 36.4 0.4 41.0 0.3 46.1 0.3 47.7 0.3
Total .......................................... 9,061.6 100.0 10,320.2 100.0 12,014.5 100.0 13,816.7 100.0 15,385.7 100.0
Source: Central Bank of Sri Lanka
Notes:
(1) Revised
(2) Provisional
(3) Include Underwriters, Investment Managers and Margin Providers
(4) Estimated numbers from 2012 to 2014
According to provisional data, total assets of the financial system increased by 11.4% from 2015 to2016 and by 99.5% during the five-year period from the beginning of 2012. Financial sector assets toGDP ratio stood at 130.0 % in 2016. This ratio was 103.8%, 107.6%, 115.0% and 126.2% in 2012,2013, 2014 and 2015, respectively. The banking sector, which consists of the Central Bank, LCBs andLSBs, accounted for 68.7% of total financial assets in 2016. LCBs accounted for 51.0% of totalfinancial assets in 2016. As at end 2016, LCBs recorded a 119.2% increase in assets since thebeginning of 2012. The assets of non-bank deposit taking financial institutions, which represent someof the grass-root-level savings institutions, increased by 19.4% in 2016. Their share in the financialsystem increased from 6.9% in 2012 to 8.1% in 2016. The assets of the other specialized financialinstitutions sector, which includes SLCs, primary dealers, unit trusts and unit trust managementcompanies, stock broking companies, venture capital companies and market intermediaries decreasedby 6.3% in 2016. The total assets of contractual savings institutions, which include superannuationfunds and insurance companies, grew by 12.1% in 2016, and accounted for 19.8% of total financialassets. Superannuation funds are the biggest category of financial entities in this sector, accountingfor 16.5% of total financial assets.
104
Regulation of Banks and Non-banking Financial Institutions
The Central Bank, in discharging its responsibility for financial stability, is the licensing authority andregulator of banking institutions, finance companies, leasing companies and primary dealers. It isresponsible for licensing of these financial institutions in Sri Lanka and has statutory responsibilityfor their safety and soundness to safeguard the interests of depositors and creditors. In ensuringfinancial system stability, it has established a strong prudential regulation and supervision frameworkwithin which all financial institutions licensed by it should operate.
Banks
The regulation and supervision of banks is primarily governed by the Banking Act, the MLA, and theExchange Control Act. The Central Bank issues banking licenses for two categories of banks, namely,LCBs and LSBs. The main distinction between commercial banks and specialized banks is that onlythe former are permitted to accept demand deposits (current accounts) from the public and engage ina full range of foreign exchange transactions.
As at March 31, 2017, the banking system consisted of 32 banks, of which 25 are LCBs and seven areLSBs. Another distinct market segment within the industry is 20 local banks and 12 branches offoreign banks.
The regulatory and supervisory framework currently applicable is based on international best practicesbased on the Basel Core Principles for effective banking-supervision set out by the Basel Committeefor Banking Supervision. In keeping with the global trends, the Central Bank has adopted a system ofrisk-based supervision of banks. This approach focuses on the identification of banking risks, themanagement of these risks and the assessment of the adequacy of resources to mitigate these risks. Asa part of its regulatory and supervisory functions, the Central Bank issues directives and prudentialrequirements on the licensing, operations and closure of banks, the resolution of weak banks and theenforcement of regulatory actions. The main techniques of supervision are continuous off-sitemonitoring and surveillance, periodic on-site examinations of banks, meetings with bank managementand co-operation with external auditors.
The Central Bank monitors the compliance of banks with a number of prudential requirements andinternational best practices, such as capital adequacy, liquidity, large exposures, asset quality,provisioning for non-performing loans, related party transactions, income recognition, ownership ofshares carrying voting rights in banks, investments, disclosures, audit of banks and standards ofcorporate governance and integrated risk management. In addition, the internal controls are alsoassessed.
Other Financial Institutions
As at December 31, 2016, there were 46 LFCs and seven SLCs under the purview of the Central Bank.All LFCs have also been registered as Finance Leasing Establishments. In addition, 17 banks were alsoregistered as Finance Leasing Establishments. As such, as at December 31, 2016, there were 70establishments involved in the finance leasing business.
The Central Bank regulates and supervises LFCs under the Finance Business Act, No. 42 of 2011 (the“FBA”). The regulatory and supervisory framework for finance companies is comparable to that ofbanks. The Central Bank also registers and monitors finance leasing companies under the FinanceLeasing Act, No. 56 of 2000, as amended. To increase public awareness, the Central Bank regularlypublishes press notices on “Financial Institutions Legally Permitted to Accept Deposits from thePublic” and periodically a “Guide to Interest Rates and Fees”.
The Central Bank also regulates and supervises primary dealers under the Local Treasury BillsOrdinance and the Registered Stocks and Securities Ordinance. As at March 31, 2017, Sri Lanka had15 primary dealers. These consisted of seven primary dealer units attached to LCBs, two primarydealer companies owned by licensed banks and six non-bank primary dealer companies.
105
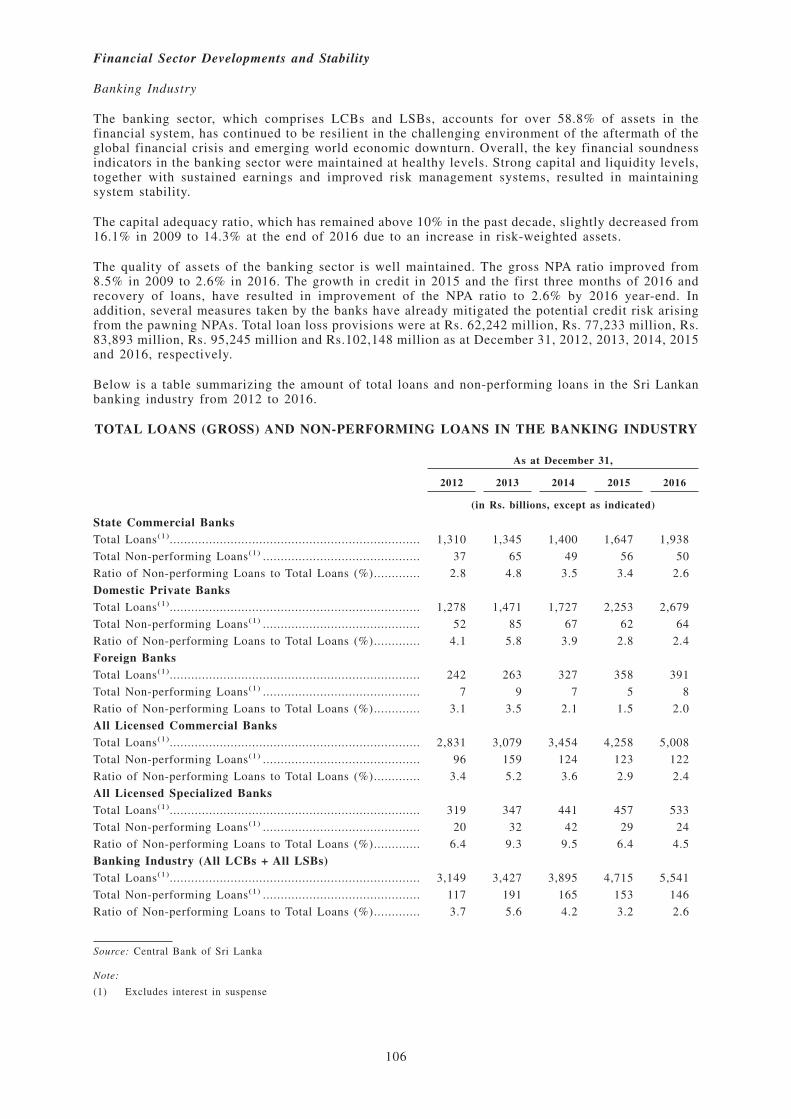
Financial Sector Developments and Stability
Banking Industry
The banking sector, which comprises LCBs and LSBs, accounts for over 58.8% of assets in thefinancial system, has continued to be resilient in the challenging environment of the aftermath of theglobal financial crisis and emerging world economic downturn. Overall, the key financial soundnessindicators in the banking sector were maintained at healthy levels. Strong capital and liquidity levels,together with sustained earnings and improved risk management systems, resulted in maintainingsystem stability.
The capital adequacy ratio, which has remained above 10% in the past decade, slightly decreased from16.1% in 2009 to 14.3% at the end of 2016 due to an increase in risk-weighted assets.
The quality of assets of the banking sector is well maintained. The gross NPA ratio improved from8.5% in 2009 to 2.6% in 2016. The growth in credit in 2015 and the first three months of 2016 andrecovery of loans, have resulted in improvement of the NPA ratio to 2.6% by 2016 year-end. Inaddition, several measures taken by the banks have already mitigated the potential credit risk arisingfrom the pawning NPAs. Total loan loss provisions were at Rs. 62,242 million, Rs. 77,233 million, Rs.83,893 million, Rs. 95,245 million and Rs.102,148 million as at December 31, 2012, 2013, 2014, 2015and 2016, respectively.
Below is a table summarizing the amount of total loans and non-performing loans in the Sri Lankanbanking industry from 2012 to 2016.
TOTAL LOANS (GROSS) AND NON-PERFORMING LOANS IN THE BANKING INDUSTRY
As at December 31,
2012 2013 2014 2015 2016
(in Rs. billions, except as indicated)
State Commercial BanksTotal Loans(1)...................................................................... 1,310 1,345 1,400 1,647 1,938
Total Non-performing Loans(1) ............................................ 37 65 49 56 50
Ratio of Non-performing Loans to Total Loans (%)............. 2.8 4.8 3.5 3.4 2.6
Domestic Private BanksTotal Loans(1)...................................................................... 1,278 1,471 1,727 2,253 2,679
Total Non-performing Loans(1) ............................................ 52 85 67 62 64
Ratio of Non-performing Loans to Total Loans (%)............. 4.1 5.8 3.9 2.8 2.4
Foreign BanksTotal Loans(1)...................................................................... 242 263 327 358 391
Total Non-performing Loans(1) ............................................ 7 9 7 5 8
Ratio of Non-performing Loans to Total Loans (%)............. 3.1 3.5 2.1 1.5 2.0
All Licensed Commercial BanksTotal Loans(1)...................................................................... 2,831 3,079 3,454 4,258 5,008
Total Non-performing Loans(1) ............................................ 96 159 124 123 122
Ratio of Non-performing Loans to Total Loans (%)............. 3.4 5.2 3.6 2.9 2.4
All Licensed Specialized BanksTotal Loans(1)...................................................................... 319 347 441 457 533
Total Non-performing Loans(1) ............................................ 20 32 42 29 24
Ratio of Non-performing Loans to Total Loans (%)............. 6.4 9.3 9.5 6.4 4.5
Banking Industry (All LCBs + All LSBs)Total Loans(1)...................................................................... 3,149 3,427 3,895 4,715 5,541
Total Non-performing Loans(1) ............................................ 117 191 165 153 146
Ratio of Non-performing Loans to Total Loans (%)............. 3.7 5.6 4.2 3.2 2.6
Source: Central Bank of Sri Lanka
Note:
(1) Excludes interest in suspense
106
Profitability, in terms of return on assets, before tax, deteriorated from 2.4% in 2012 to 1.9% in 2016,due to high interest expenses. Interest margin has also declined from 4.1% in 2012 to 3.6% in 2016.
The cost efficiency ratio (operating expenses to total income excluding interest expenses) marginallydeclined from 49.4% in 2012 to 49.3% in 2016 due to marginal increase in interest income.
Liquidity in the banking system measured in terms of Statutory Liquid Assets ratio continued toremain at a comfortable level of over 30% throughout the period, substantially above the minimumrequirement of 20%.
Financial Sector Reforms
The Central Bank has introduced a number of policy measures intended to improve risk management,corporate governance and the financial health of the banking and non-banking financial institutionssector, as follows:
• Implementation of the Direction on Corporate Governance: A Direction that comprehensivelycovers responsibilities of the board of directors of a bank, the board’s composition, criteria toassess the fitness and propriety of directors, management functions delegated by the board, therole and responsibilities of the chairman and the chief executive officer of a bank, duties andfunctions of the board appointed committees, related party transactions and disclosures, iscurrently in force. The Central Bank strictly monitors the adherence of banks with thesedirections in an effort to strengthen the corporate governance culture of banks. With a view tofurther strengthen good governance in the banking sector, the assessment criteria of fitness andsuitability of Board of Directors is currently under review.
Further, the Central Bank has introduced Corporate Governance Directions for LFCs and SLCsto make the board of directors more responsible and accountable for affairs of the respectiveLFCs and SLCs, with the goal of promoting a healthy and robust risk management framework inthese sectors in order to maintain overall soundness.
• Fitness and propriety of directors and senior management of bank and non-bank financialinstitution: The assessment of the fitness and propriety of the banks’ directors, CEO and otherofficers performing executive functions in banks and non-bank financial institutions are carriedout to ensure high standards of management.
• Strengthening risk management in banks and non-bank financial institutions: With a viewto further strengthening risk management in banks and non-bank financial institutions,Directions were issued on (i) classification of advances, provisioning and income recognition forimproved credit risk management, (ii) maximum amount of accommodation to improve creditconcentration risk management in banks and non-bank financial institutions and widen creditdelivery and (iii) risk management relating to foreign exchange business in LCBs and LFCs.
In addition, directions were also issued by banks on (i) abandoned property in order to safeguardunclaimed deposits of customers (ii) integrated risk management, (iii) outsourcing of businessoperations of banks, (iv) exposures to stock market, (v) improving customer confidence andbuilding up a better relationship between banks and customers, (vi) risk management relating toforeign exchange business and foreign exchange trading activities, (vii) the stress testingframework of the banking sector, (viii) the regulatory framework for valuation of immovableproperty of licensed banks, (ix) introduction of a loan-to-value ratio on loans and advancesgranted to purchase or utilize motor vehicles and (x) implementation of the Baseline SecurityStandard on information security management.
107
• Implementing a Mandatory Deposit Insurance Scheme: A Mandatory Deposit InsuranceScheme to protect small depositors and to strengthen the stability of the financial system wasintroduced in 2010. In addition, this Scheme will offer liquidity support for banks and LFCs inimminent liquidity distress. According to the decision announced in Budget 2015 to increasedeposit insurance cover by 50%, effective from January 1, 2015, the deposit insurance coverageratio per depositor per institution increased from Rs. 200,000 to Rs. 300,000.
• Enhancing the minimum capital requirement of banks and Licensed Finance Companies:Effective January 2015, new LCBs and LSBs have been required to have a minimum core capitalof Rs. 10 billion and Rs. 5 billion, respectively. Effective January 2016, existing banks are beingsubject to the same requirements. The direction for minimum core capital of LFCs was issued inFebruary 2017, which instructed LFCs to improve their core capital level from Rs. 400 millionto Rs. 2,500 million on staggered basis.
• Conduct statutory examinations of all banks annually: Beginning in 2014, all banks aresupervised on an annual basis.
• Enhancing Bank Examination Methodology: Measures have been taken to enhance the bankexamination methodology to focus on the efficiency, effectiveness and sustainability ofindividual banks and the banking sector. Further, Bank Sustainability Risk Index (“BSRI”) isbeing developed to strengthen this process.
• Implementation of Basel II: The implementation of the Basel II capital adequacy framework forlicensed banks commenced in January 2008. Under Pillar 1 of Basel II, banks are currentlyrequired to compute their capital adequacy ratio using a standardized approach for credit risk,standardized measurement method for market risk and operational risk. Starting from July 1,2014, banks were given the option to move to the Standardized Approach or the AlternativeStandardized Approach to compute the capital charge for operational risk. Directions on theimplementation of the supervisory review process for banks (Pillar 2 of Basel II) were issued inJuly 2013. The Internal Capital Adequacy Assessment Process established under these Directionsis expected to further strengthen capital planning of banks with the enhancement of their abilityto mitigate all inherent risks arising from the banking business. With the adoption of newaccounting standards in line with the generally accepted international accounting standards in2012, significant changes were made to conform to international disclosure requirements by thestandards.
• Minimum Capital Requirements under Basel III: Commencing on July 1, 2017, licensed bankswill be required to maintain a minimum capital ratio in respect of risk weighted assets, accordingto guidelines based on ‘Basel III: A Global Regulatory Framework For More Resilient Banks andBanking Systems’. The total minimum capital ratio for licensed banks with assets above Rs. 500billion will be 11.75%, which will be increased further to 14.00% by January 1, 2019.Meanwhile, the requirement for licensed banks with assets below Rs. 500 billion will be 11.25%,which will be increased further to 12.50% by January 1, 2019.
• Implementation of Basel III Leverage Ratio Framework for licensed banks: A ConsultationPaper on Implementation of Basel III Leverage Ratio was issued to banks and the final standardon the same will be issued in due course for implementation in line with the internationaltimeline. The Central Bank expects to commence monitoring of the leverage ratio during firsthalf of 2017. Amendments to the Banking Act: The Central Bank has initiated amendments to theBanking Act with a view to further strengthening the supervision and regulation of LCBsand LSBs. The proposed amendments will entail changes brought about by the Companies Act,and will, among others, facilitate consolidations of banks, strengthen recovery and resolutionmeasures of banks, facilitating consolidated supervision and introduce a deterrent penaltysystem.
108
• Enhancement of disclosure requirements: To facilitate banks and non-bank financialinstitutions to successfully adopt the new Sri Lanka Accounting Standards and the Sri LankaFinancial Reporting Standard, the Central Bank issued draft guidelines to banks and non-bankfinancial institutions on statutory reporting and adoption of these standards. For greatertransparency and comparability, forms have also been issued by the Central Bank to banks andnon-bank financial institutions for the preparation and publication of interim and annualfinancial statements. The new reporting forms will facilitate financial institutions to be on parwith other financial institutions adopting international accounting standards and to improvedisclosure. Uniform and adequate disclosure practices are important for improving marketefficiency and promoting healthy competition in the industry. To further enhance transparency ofbanking operations and market discipline, banks are also required to make annual, bi-annual andquarterly publications of financials on their respective websites.
• Establishment of stronger communications channels for home-host relationships and otherregulators: Considering the internationalization of the Sri Lankan banking sector and itscross-border presence, the Central Bank has initiated action to enter into memoranda ofunderstandings (“MOUs”) with other supervisory authorities in the Asian region to exchangeinformation and for supervisory cooperation. At present, the Central Bank has entered intoMOUs with the State Bank of Pakistan and the Reserve Bank of India on cross border supervisorycooperation and information sharing among regulators.
• Ceilings on interest rates and penal rates: To facilitate expansion of economic activities,prompt entrepreneurship and reduce undue burden on borrowers, ceilings have been imposed oninterest rates and penal rates on loans and advances.
• Implementation of Budget 2017 in respect of Banking Services: Licensed banks have beenrequested to take appropriate measures to increase distribution of credit to identified sectors (i.e.agriculture, small and medium enterprises (“SMEs”), exports, tourism, youth and women) and toenhance banking services in line with the national policy approved in the Budget 2017.
• Secondary Market Trading of Government Securities and Reporting: Licensed banks havebeen required to use the Bloomberg Trading Platform (FIQ), designed for Sri Lanka, to reportyield rates and volumes of all outright trades in excess of Rs. 50 million, with the aim ofpromoting the secondary market for Government securities.
• Electronic Transactions Act, No. 19 of 2006: Enacted to recognize and facilitate the formationof electronic contracts, the creation and exchange of data messages, communication in electronicform and to provide for the appointment of a certification authority and accreditation ofcertification for such service providers.
• Payment Devices Frauds Act, No. 30 of 2006: Enacted to prevent possession and use ofunauthorized or counterfeit payment devices and to provide for investigation, prosecution andpunishment of such offenses.
• Finance Business Act, No. 42 of 2011: The FBA was enacted on November 9, 2011 repealingand replacing the Finance Companies Act, No. 78 of 1988 (the “FCA”) for strengthenedregulation of LFCs and to curb unauthorized finance businesses. The FCA was enacted over morethan two decades ago, and over the years significant developments have taken place in thefinancial sector. The non-banking financial sector activities also increased tremendously duringthis period. Moreover, due to unlawful deposit taking activities, several finance companies facedliquidity problems during the last few years. Hence, there has been an immense need for a newlegislation to ensure safety and soundness of the financial system. The FBA has addressed thelacunas of the FCA which enabled entities carrying out finance business without authority tothrive as they did in the past few years. Further, the Central Bank has intervened to resolvedistressed LFCs, largely through mergers and recapitalization.
109
• Setting up of Separate Authority to Regulate Microfinance Sector: The Microfinance Act No.06 of 2016 has been enacted in Parliament to provide a legal basis for the licensing, regulationand supervision of companies carrying on microfinance business, the registration ofNon-Government Organizations (“NGOs”) accepting limited savings deposits as MicrofinanceNon-Government Organizations (“MFNGOs”) and the setting up of standards for the regulationand supervision of MFNGOs and micro credit NGOs. Currently, the Central Bank is preparinglicensing criteria, rules and directions for MFCs and standards, principles and guidelines for theRegistrar of National Secretariat for NGO. Regulatory process will be commenced before the endof year 2016.
• Payment Cards and Mobile Payment Systems Regulations No. 1 of 2013: Pursuant to thePayment and Settlement Systems Act No. 28 of 2005, the Service Providers of Payment CardsRegulation No. 1 of 2009 became effective from July 31, 2009. This was replaced by the PaymentCards and Mobile Payment Systems Regulations No. 1 of 2013, without prejudice to anythingdone under the 2009 regulations. The main objective of these regulations is to ensure that allservice providers involved in card-based payment instruments and mobile payment systemscomply with the best international standards and practices, thereby assuring that operations ofservice providers of payment cards and mobile payment systems do not threaten the stability ofthe financial system. The Central Bank, as the regulator of payment systems, is entrusted withthe authority to regulate and direct service providers engaged in the card-based payment industryand the mobile payment systems industry to accept best standards/practices, and to supervise andmonitor to ensure their compliance to the relevant acts, regulations, guidelines and circulars, etc.Under the authority given by the regulations, the Central Bank issued the Credit Card GuidelineNo. 01/2010 on March 1, an operational guideline to streamline the operations of credit cardissuers to ensure adherence to best international standards and practices in order to maintainfinancial system stability. Furthermore, under the authority given under the same regulations, theCentral Bank issued two mobile payment guidelines in March 2011 in order to regularize theemerging payment mechanism.
• Consolidation of Financial Institutions: The Central Bank expects to encourage market drivenfinancial sector consolidation with a view of building a stronger and dynamic financial sector.Through this policy, banks and non-bank financial institutions are expected to be in a positionto mobilize funds from the international market, leverage on the scale of operations and upgradetechnology to strengthen efficiency and thus reduce intermediation cost. The enhanced capitalrequirements are expected to encourage small and medium sized banks to merge in the mediumterm, whilst the small state owned banks are expected to merge with larger banks to enable themto contribute to the economy in a more meaningful manner. Concurrently, the regulatory andsupervisory framework is expected to be further strengthened.
Sri Lankan Securities Markets
Colombo Stock Exchange
In 1985, Colombo Securities Exchange Ltd. was established by consolidating the Colombo Brokers’Association and the Stock Brokers’ Association. Its name was changed to the Colombo StockExchange in 1990. Currently, there are 28 institutions licensed by the Securities and ExchangeCommission of Sri Lanka to operate as stockbrokers (as at April 19, 2017), but only 20 of suchinstitutions possess the CSE membership, out of which 12 members operate as stockbrokers and eightmembers operate as debt trading members. The CSE All-Share Price Index increased by 3.5% fromDecember 31, 2016 to April 19, 2017. As at April 19, 2017, there were 296 companies listed on theCSE, representing 20 business sectors, with a market capitalization of Rs. 2,837.5 billion (US$ 18.7billion).
110
During the first three months of 2017, there was one debenture listing amounting to Rs. 8.0 billion.
The policy making body of the CSE is its board of directors, consisting of nine directors. Fourdirectors are elected by the members and five directors are appointed by the Ministry of NationalPolicies and Economic Affairs. The Exchange Secretariat, headed by the Chief Executive Officer, isresponsible for the operations of the CSE and is accountable to the board of directors.
Government Securities Market
Sri Lanka has a large tradable Government securities market. The Government uses Treasury bonds,Treasury bills, Sri Lanka Development Bonds and rupee-denominated loans as the primary borrowinginstruments to finance its budgetary needs. Over the last ten years, reliance on marketable instrumentshas expanded rapidly. Since 2003, Treasury bonds with 5-year, 10-year, 15-year and 20-year maturitieshave been issued. With improvements in the Government securities market and to accommodateinvestors’ desire to invest in longer-term securities, the Government issued Treasury bonds with a30-year maturity in 2013 and continued such issuances thereafter.
Since November 1, 2006, the Government securities market was partially liberalized and foreignerswere allowed to purchase up to 5.0% of the outstanding rupee-denominated Treasury bonds. With theaim of further liberalizing capital account transactions and also to develop the capital market, bybroadening the investor base and increasing competition in the Government securities market, thislimit has gradually been increased to 12.5% of outstanding rupee- denominated Treasury bills andTreasury bonds. Subsequently, this limit has been brought down to 10% of outstanding Treasury billsand Treasury bonds.
Total outstanding Treasury bills amounted to Rs.792.39 billion (US$ 5.29 billion) and Treasury bondsamounted to Rs. 4,053.57 billion (US$ 27.06 billion) as at December 31, 2016. The total volume ofrupee-denominated Government securities transacted on outright basis in 2016 amounted to Rs.5,800.02 billion. Similarly, the total volume of Government securities transacted on repurchase andreverse repurchase bases in 2016 amounted to Rs. 50,970.25 billion.
As at March 31, 2017, total outstanding Treasury bills amounted to Rs.793.88 billion (US$ 5.23billion) and Treasury bonds amounted to Rs. 4,055.49 billion (US$ 26.73 billion). The total volumeof rupee-denominated Government securities transacted on outright basis for the first three months of2017 amounted to Rs. 1,211.60 billion, while the total volume of Government securities transacted onrepurchase and reverse repurchase bases during the first three months of 2017 amounted to Rs.12,330.15 billion.
Rupee Denominated Debt
The Government continues to raise funds through rupee-denominated debt instruments, primarilyTreasury bonds and Treasury bills to meet part of its budgetary requirements.
Treasury Bills. Issued with maturities of 91 days, 182 days or 364 days, Treasury bills are the primarydebt instruments for managing the short-term cash flow needs of the Government. Treasury bills areissued at market yield rates. Such market yield rates are derived through market-based primaryauctions conducted via an online secured electronic bidding system. In 2014, the stock of Treasurybills outstanding increased by Rs.11.83 billion (US$ 0.09 billion) in net terms in the primary market,in line with the Government’s strategy to reduce short-term Government securities. In 2015, the stockof Treasury bills outstanding decreased by Rs.73.66 billion (US$ 0.51 billion) in net terms in theprimary market. In 2016 and the first three months of 2017, the stock of Treasury bills outstandingincreased by Rs. 105.66 billion (US$ 0.71 billion) and Rs. 0.31 billion (US$ 0.002 billion) in net termsin the primary market, respectively.
Treasury Bonds. Treasury bonds are issued with maturities ranging from 2 years to 30 years in theprimary market to finance the long-term funding needs of the Government. Treasury bonds are usedas the primary domestic debt instrument to finance budgetary needs. In 2014, the Government issuedTreasury bonds amounting to Rs.452.86 billion (US$ 3.46 billion) in net terms in the primary market.
111
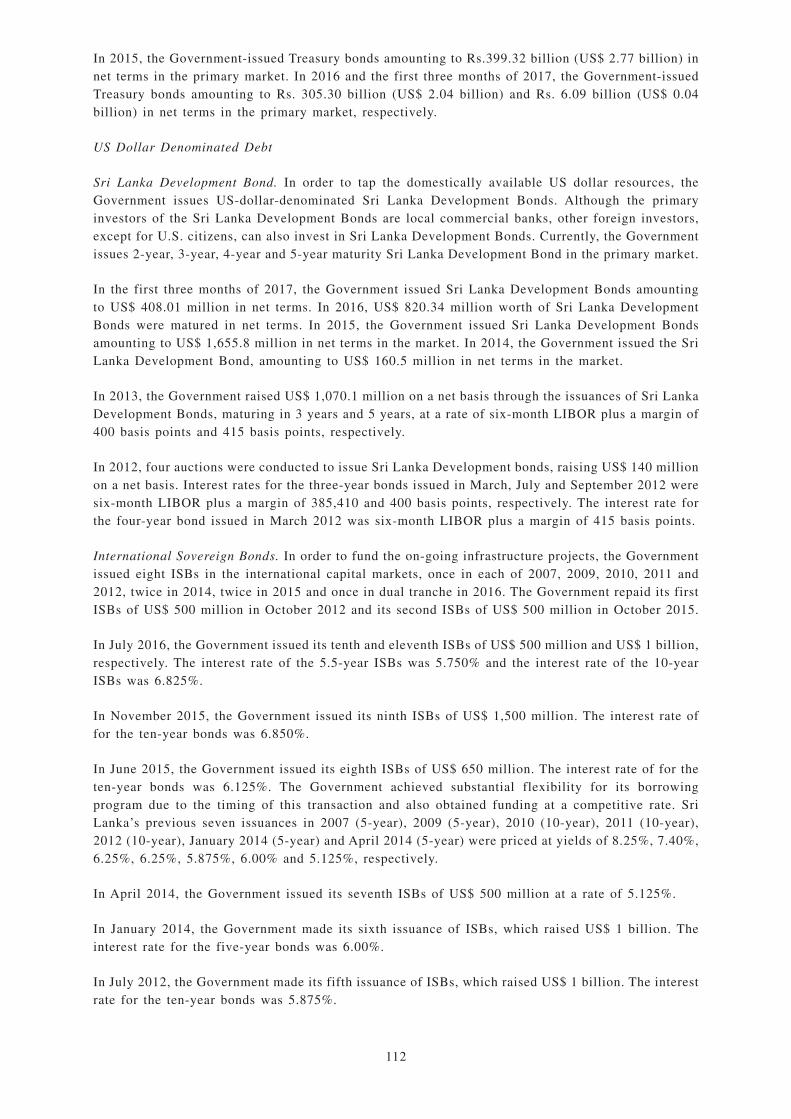
In 2015, the Government-issued Treasury bonds amounting to Rs.399.32 billion (US$ 2.77 billion) innet terms in the primary market. In 2016 and the first three months of 2017, the Government-issuedTreasury bonds amounting to Rs. 305.30 billion (US$ 2.04 billion) and Rs. 6.09 billion (US$ 0.04billion) in net terms in the primary market, respectively.
US Dollar Denominated Debt
Sri Lanka Development Bond. In order to tap the domestically available US dollar resources, theGovernment issues US-dollar-denominated Sri Lanka Development Bonds. Although the primaryinvestors of the Sri Lanka Development Bonds are local commercial banks, other foreign investors,except for U.S. citizens, can also invest in Sri Lanka Development Bonds. Currently, the Governmentissues 2-year, 3-year, 4-year and 5-year maturity Sri Lanka Development Bond in the primary market.
In the first three months of 2017, the Government issued Sri Lanka Development Bonds amountingto US$ 408.01 million in net terms. In 2016, US$ 820.34 million worth of Sri Lanka DevelopmentBonds were matured in net terms. In 2015, the Government issued Sri Lanka Development Bondsamounting to US$ 1,655.8 million in net terms in the market. In 2014, the Government issued the SriLanka Development Bond, amounting to US$ 160.5 million in net terms in the market.
In 2013, the Government raised US$ 1,070.1 million on a net basis through the issuances of Sri LankaDevelopment Bonds, maturing in 3 years and 5 years, at a rate of six-month LIBOR plus a margin of400 basis points and 415 basis points, respectively.
In 2012, four auctions were conducted to issue Sri Lanka Development bonds, raising US$ 140 millionon a net basis. Interest rates for the three-year bonds issued in March, July and September 2012 weresix-month LIBOR plus a margin of 385,410 and 400 basis points, respectively. The interest rate forthe four-year bond issued in March 2012 was six-month LIBOR plus a margin of 415 basis points.
International Sovereign Bonds. In order to fund the on-going infrastructure projects, the Governmentissued eight ISBs in the international capital markets, once in each of 2007, 2009, 2010, 2011 and2012, twice in 2014, twice in 2015 and once in dual tranche in 2016. The Government repaid its firstISBs of US$ 500 million in October 2012 and its second ISBs of US$ 500 million in October 2015.
In July 2016, the Government issued its tenth and eleventh ISBs of US$ 500 million and US$ 1 billion,respectively. The interest rate of the 5.5-year ISBs was 5.750% and the interest rate of the 10-yearISBs was 6.825%.
In November 2015, the Government issued its ninth ISBs of US$ 1,500 million. The interest rate offor the ten-year bonds was 6.850%.
In June 2015, the Government issued its eighth ISBs of US$ 650 million. The interest rate of for theten-year bonds was 6.125%. The Government achieved substantial flexibility for its borrowingprogram due to the timing of this transaction and also obtained funding at a competitive rate. SriLanka’s previous seven issuances in 2007 (5-year), 2009 (5-year), 2010 (10-year), 2011 (10-year),2012 (10-year), January 2014 (5-year) and April 2014 (5-year) were priced at yields of 8.25%, 7.40%,6.25%, 6.25%, 5.875%, 6.00% and 5.125%, respectively.
In April 2014, the Government issued its seventh ISBs of US$ 500 million at a rate of 5.125%.
In January 2014, the Government made its sixth issuance of ISBs, which raised US$ 1 billion. Theinterest rate for the five-year bonds was 6.00%.
In July 2012, the Government made its fifth issuance of ISBs, which raised US$ 1 billion. The interestrate for the ten-year bonds was 5.875%.
112
Primary Dealer System
Primary Dealers (“PD”) are specialized intermediaries in the Government securities market, appointedby the Central Bank under the Local Treasury Bills Ordinance No 8 of 1923 and the Registered Stockand Securities Ordinance No. 7 of 1937. The PD system is expected to strengthen the Governmentsecurities market by helping to build a stable and dependable source of demand for securities byeffectively participating in the primary auctions conducted by the Central Bank, providing liquidityin the secondary market, building distribution channels (to act as intermediaries) and providing marketinformation, including prices, volumes and spreads between bids and offers. As at March 31, 2017,there were 15 PDs consisting of seven PD units attached to LCBs, two PD companies owned bylicensed banks and six non-bank PD companies. PDs continued to be the key players in theGovernment securities market in 2016 and the first three months of 2017.
The Central Bank provides primary dealers with an intra-day liquidity facility and allows them toparticipate at the OMO of the Central Bank, which is in operation for implementing monetary policy.The Central Depository System and Scripless Securities Settlement System have been in operationsince February 2004 and have contributed to the improvement of the efficiency in the primaryissuances and trading in secondary market of Government securities. These systems are linked to theReal Time Gross Settlement System for Delivery vs. Payment mechanism where the transfer ofownership of securities and the underlying transfer of funds are realized simultaneously in real time.
Public Finance
Overview of Government Revenues and Expenditures
The following table sets out Government revenues and expenditures for the periods indicated.
GOVERNMENT REVENUES AND EXPENDITURES
Summary of Fiscal Operation
Actual2015-2016
Growth
Rate (%)2012 2013 2014 2015 2016(1)
Rs. million
Total revenues and grants .. 1,067,532 1,153,306 1,204,621 1,460,892 1,693,558 15.9Total revenues...................... 1,051,460 1,137,447 1,195,206 1,454,878 1,686,062 15.9
Tax Revenues ................... 908,913 1,005,895 1,050,362 1,355,779 1,463,689 8.0Non-tax Revenues ............. 142,547 131,552 144,844 99,099 222,374 124.4
Grants .................................. 16,071 15,859 9,415 6,014 7,496 24.6Total expenditure ............... 1,556,499 1,669,396 1,795,865 2,290,394 2,333,883 1.9Recurrent ............................. 1,131,023 1,205,180 1,322,898 1,701,658 1,757,782 3.3Capital and net lending. ....... 425,476 464,216 472,967 588,737 576,101 (2.1)Current account surplus/
(deficit) ............................ (79,563) (67,733) (127,692) (246,779) (71,719) (70.9)Primary account surplus/
(deficit) ............................ (80,469) (72,083) (154,849) (319,827) (29,430) (90.8)Overall surplus/(deficit). .... (488,967) (516,090) (591,244) (829,502) (640,325) (22.8)Total financing ................... 488,967 516,090 591,244 829,502 640,325 (22.8)
Foreign financing ............. 286,455 123,700 212,523 236,803 391,914 65.5Gross ................................ 463,448 327,693 395,632 521,096 561,020 7.7Repayment........................ (200,369) (203,993) (183,109) (284,293) (169,107) (40.5)Domestic financing ........... 202,511 392,390 378,721 592,699 248,411 (58.1)
113
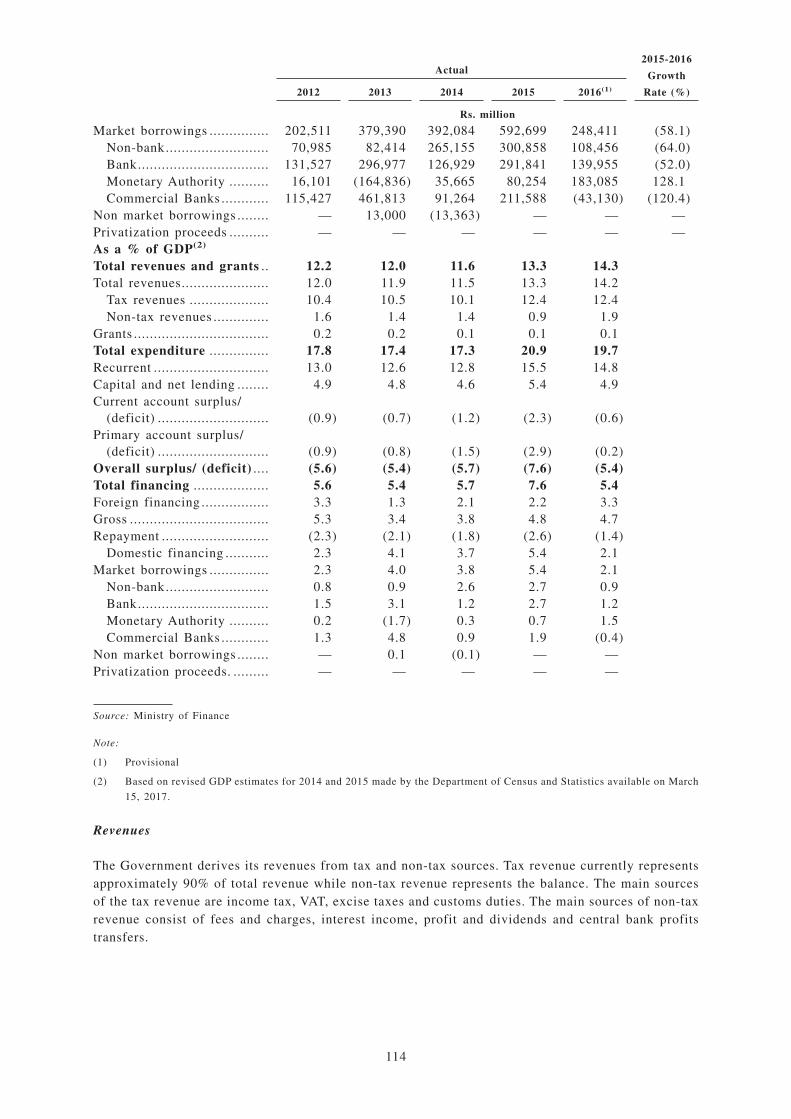
Actual2015-2016
Growth
Rate (%)2012 2013 2014 2015 2016(1)
Rs. million
Market borrowings ............... 202,511 379,390 392,084 592,699 248,411 (58.1)Non-bank.......................... 70,985 82,414 265,155 300,858 108,456 (64.0)Bank................................. 131,527 296,977 126,929 291,841 139,955 (52.0)Monetary Authority .......... 16,101 (164,836) 35,665 80,254 183,085 128.1Commercial Banks ............ 115,427 461,813 91,264 211,588 (43,130) (120.4)
Non market borrowings ........ — 13,000 (13,363) — — —Privatization proceeds .......... — — — — — —As a % of GDP(2)
Total revenues and grants .. 12.2 12.0 11.6 13.3 14.3Total revenues...................... 12.0 11.9 11.5 13.3 14.2
Tax revenues .................... 10.4 10.5 10.1 12.4 12.4Non-tax revenues .............. 1.6 1.4 1.4 0.9 1.9
Grants .................................. 0.2 0.2 0.1 0.1 0.1Total expenditure ............... 17.8 17.4 17.3 20.9 19.7Recurrent ............................. 13.0 12.6 12.8 15.5 14.8Capital and net lending ........ 4.9 4.8 4.6 5.4 4.9Current account surplus/
(deficit) ............................ (0.9) (0.7) (1.2) (2.3) (0.6)Primary account surplus/
(deficit) ............................ (0.9) (0.8) (1.5) (2.9) (0.2)Overall surplus/ (deficit) .... (5.6) (5.4) (5.7) (7.6) (5.4)Total financing ................... 5.6 5.4 5.7 7.6 5.4Foreign financing ................. 3.3 1.3 2.1 2.2 3.3Gross ................................... 5.3 3.4 3.8 4.8 4.7Repayment ........................... (2.3) (2.1) (1.8) (2.6) (1.4)
Domestic financing ........... 2.3 4.1 3.7 5.4 2.1Market borrowings ............... 2.3 4.0 3.8 5.4 2.1
Non-bank.......................... 0.8 0.9 2.6 2.7 0.9Bank................................. 1.5 3.1 1.2 2.7 1.2Monetary Authority .......... 0.2 (1.7) 0.3 0.7 1.5Commercial Banks ............ 1.3 4.8 0.9 1.9 (0.4)
Non market borrowings ........ — 0.1 (0.1) — —Privatization proceeds. ......... — — — — —
Source: Ministry of Finance
Note:
(1) Provisional
(2) Based on revised GDP estimates for 2014 and 2015 made by the Department of Census and Statistics available on March
15, 2017.
Revenues
The Government derives its revenues from tax and non-tax sources. Tax revenue currently representsapproximately 90% of total revenue while non-tax revenue represents the balance. The main sourcesof the tax revenue are income tax, VAT, excise taxes and customs duties. The main sources of non-taxrevenue consist of fees and charges, interest income, profit and dividends and central bank profitstransfers.
114
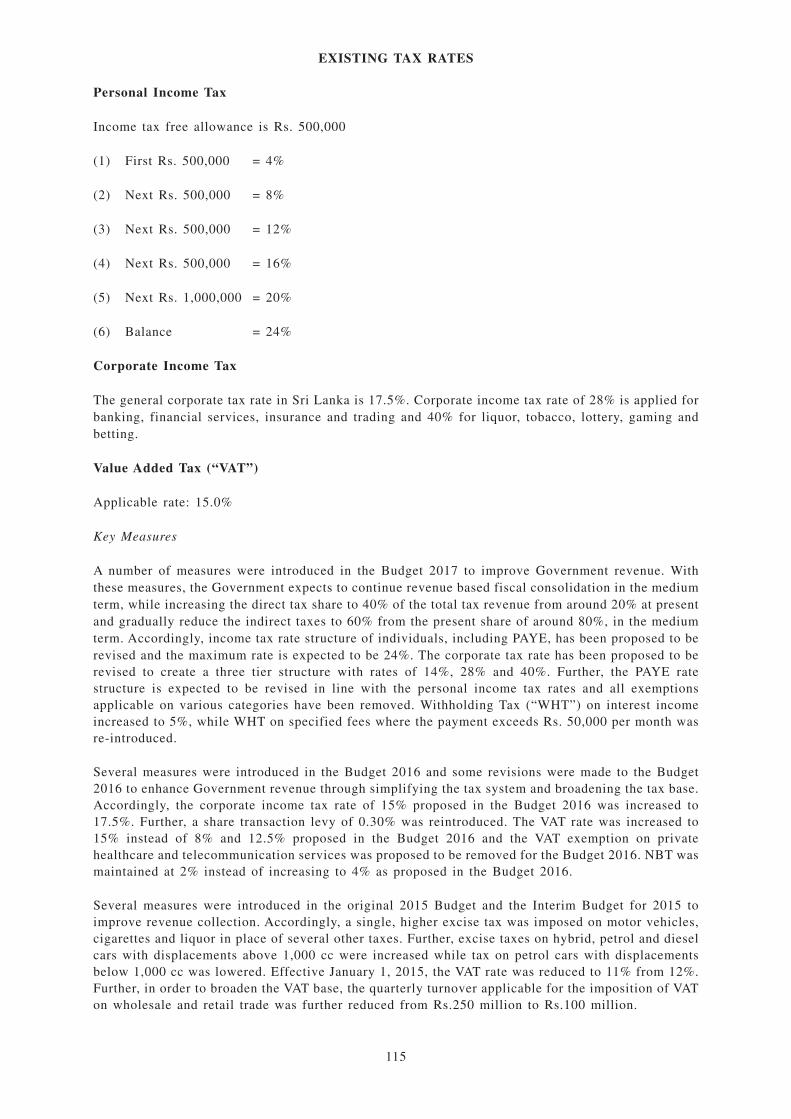
EXISTING TAX RATES
Personal Income Tax
Income tax free allowance is Rs. 500,000
(1) First Rs. 500,000 = 4%
(2) Next Rs. 500,000 = 8%
(3) Next Rs. 500,000 = 12%
(4) Next Rs. 500,000 = 16%
(5) Next Rs. 1,000,000 = 20%
(6) Balance = 24%
Corporate Income Tax
The general corporate tax rate in Sri Lanka is 17.5%. Corporate income tax rate of 28% is applied forbanking, financial services, insurance and trading and 40% for liquor, tobacco, lottery, gaming andbetting.
Value Added Tax (“VAT”)
Applicable rate: 15.0%
Key Measures
A number of measures were introduced in the Budget 2017 to improve Government revenue. Withthese measures, the Government expects to continue revenue based fiscal consolidation in the mediumterm, while increasing the direct tax share to 40% of the total tax revenue from around 20% at presentand gradually reduce the indirect taxes to 60% from the present share of around 80%, in the mediumterm. Accordingly, income tax rate structure of individuals, including PAYE, has been proposed to berevised and the maximum rate is expected to be 24%. The corporate tax rate has been proposed to berevised to create a three tier structure with rates of 14%, 28% and 40%. Further, the PAYE ratestructure is expected to be revised in line with the personal income tax rates and all exemptionsapplicable on various categories have been removed. Withholding Tax (“WHT”) on interest incomeincreased to 5%, while WHT on specified fees where the payment exceeds Rs. 50,000 per month wasre-introduced.
Several measures were introduced in the Budget 2016 and some revisions were made to the Budget2016 to enhance Government revenue through simplifying the tax system and broadening the tax base.Accordingly, the corporate income tax rate of 15% proposed in the Budget 2016 was increased to17.5%. Further, a share transaction levy of 0.30% was reintroduced. The VAT rate was increased to15% instead of 8% and 12.5% proposed in the Budget 2016 and the VAT exemption on privatehealthcare and telecommunication services was proposed to be removed for the Budget 2016. NBT wasmaintained at 2% instead of increasing to 4% as proposed in the Budget 2016.
Several measures were introduced in the original 2015 Budget and the Interim Budget for 2015 toimprove revenue collection. Accordingly, a single, higher excise tax was imposed on motor vehicles,cigarettes and liquor in place of several other taxes. Further, excise taxes on hybrid, petrol and dieselcars with displacements above 1,000 cc were increased while tax on petrol cars with displacementsbelow 1,000 cc was lowered. Effective January 1, 2015, the VAT rate was reduced to 11% from 12%.Further, in order to broaden the VAT base, the quarterly turnover applicable for the imposition of VATon wholesale and retail trade was further reduced from Rs.250 million to Rs.100 million.
115
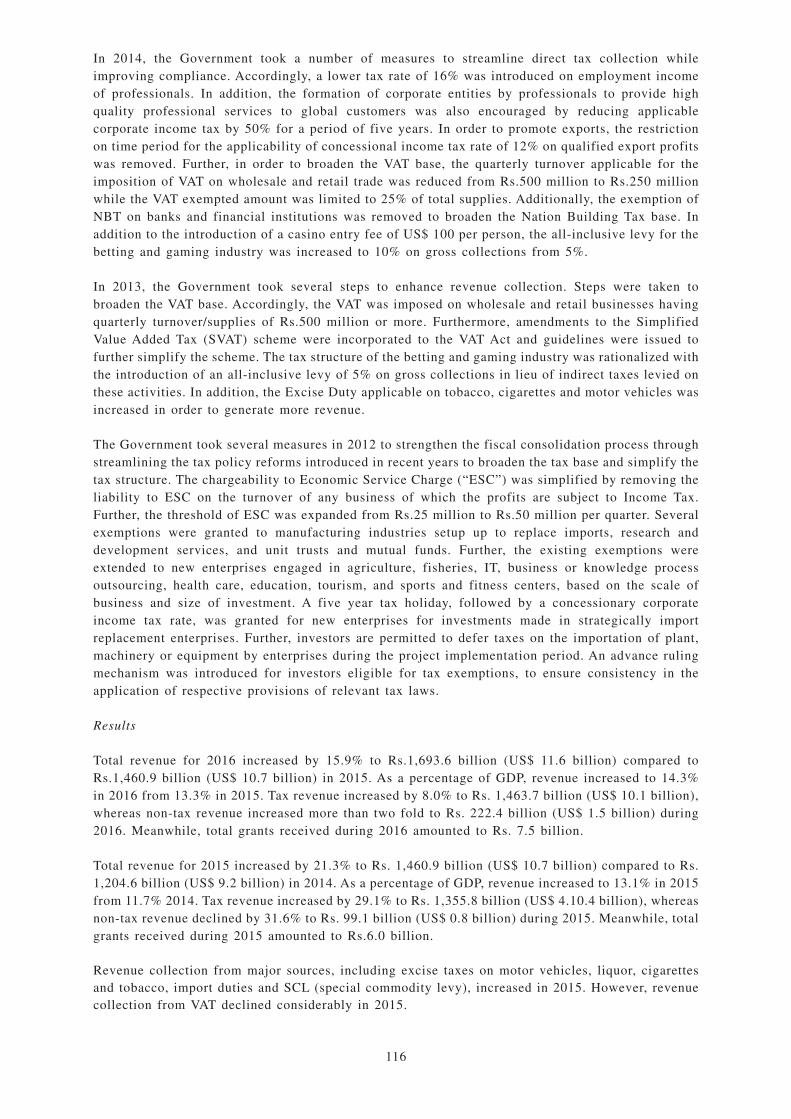
In 2014, the Government took a number of measures to streamline direct tax collection whileimproving compliance. Accordingly, a lower tax rate of 16% was introduced on employment incomeof professionals. In addition, the formation of corporate entities by professionals to provide highquality professional services to global customers was also encouraged by reducing applicablecorporate income tax by 50% for a period of five years. In order to promote exports, the restrictionon time period for the applicability of concessional income tax rate of 12% on qualified export profitswas removed. Further, in order to broaden the VAT base, the quarterly turnover applicable for theimposition of VAT on wholesale and retail trade was reduced from Rs.500 million to Rs.250 millionwhile the VAT exempted amount was limited to 25% of total supplies. Additionally, the exemption ofNBT on banks and financial institutions was removed to broaden the Nation Building Tax base. Inaddition to the introduction of a casino entry fee of US$ 100 per person, the all-inclusive levy for thebetting and gaming industry was increased to 10% on gross collections from 5%.
In 2013, the Government took several steps to enhance revenue collection. Steps were taken tobroaden the VAT base. Accordingly, the VAT was imposed on wholesale and retail businesses havingquarterly turnover/supplies of Rs.500 million or more. Furthermore, amendments to the SimplifiedValue Added Tax (SVAT) scheme were incorporated to the VAT Act and guidelines were issued tofurther simplify the scheme. The tax structure of the betting and gaming industry was rationalized withthe introduction of an all-inclusive levy of 5% on gross collections in lieu of indirect taxes levied onthese activities. In addition, the Excise Duty applicable on tobacco, cigarettes and motor vehicles wasincreased in order to generate more revenue.
The Government took several measures in 2012 to strengthen the fiscal consolidation process throughstreamlining the tax policy reforms introduced in recent years to broaden the tax base and simplify thetax structure. The chargeability to Economic Service Charge (“ESC”) was simplified by removing theliability to ESC on the turnover of any business of which the profits are subject to Income Tax.Further, the threshold of ESC was expanded from Rs.25 million to Rs.50 million per quarter. Severalexemptions were granted to manufacturing industries setup up to replace imports, research anddevelopment services, and unit trusts and mutual funds. Further, the existing exemptions wereextended to new enterprises engaged in agriculture, fisheries, IT, business or knowledge processoutsourcing, health care, education, tourism, and sports and fitness centers, based on the scale ofbusiness and size of investment. A five year tax holiday, followed by a concessionary corporateincome tax rate, was granted for new enterprises for investments made in strategically importreplacement enterprises. Further, investors are permitted to defer taxes on the importation of plant,machinery or equipment by enterprises during the project implementation period. An advance rulingmechanism was introduced for investors eligible for tax exemptions, to ensure consistency in theapplication of respective provisions of relevant tax laws.
Results
Total revenue for 2016 increased by 15.9% to Rs.1,693.6 billion (US$ 11.6 billion) compared toRs.1,460.9 billion (US$ 10.7 billion) in 2015. As a percentage of GDP, revenue increased to 14.3%in 2016 from 13.3% in 2015. Tax revenue increased by 8.0% to Rs. 1,463.7 billion (US$ 10.1 billion),whereas non-tax revenue increased more than two fold to Rs. 222.4 billion (US$ 1.5 billion) during2016. Meanwhile, total grants received during 2016 amounted to Rs. 7.5 billion.
Total revenue for 2015 increased by 21.3% to Rs. 1,460.9 billion (US$ 10.7 billion) compared to Rs.1,204.6 billion (US$ 9.2 billion) in 2014. As a percentage of GDP, revenue increased to 13.1% in 2015from 11.7% 2014. Tax revenue increased by 29.1% to Rs. 1,355.8 billion (US$ 4.10.4 billion), whereasnon-tax revenue declined by 31.6% to Rs. 99.1 billion (US$ 0.8 billion) during 2015. Meanwhile, totalgrants received during 2015 amounted to Rs.6.0 billion.
Revenue collection from major sources, including excise taxes on motor vehicles, liquor, cigarettesand tobacco, import duties and SCL (special commodity levy), increased in 2015. However, revenuecollection from VAT declined considerably in 2015.
116
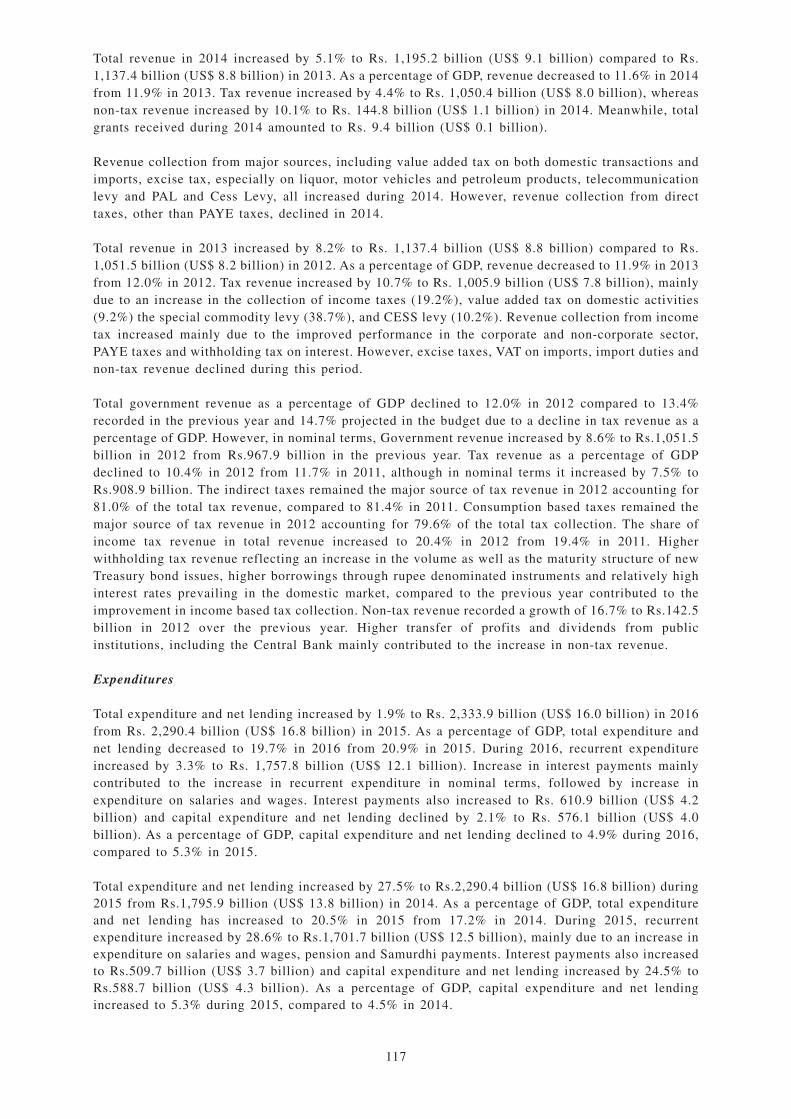
Total revenue in 2014 increased by 5.1% to Rs. 1,195.2 billion (US$ 9.1 billion) compared to Rs.1,137.4 billion (US$ 8.8 billion) in 2013. As a percentage of GDP, revenue decreased to 11.6% in 2014from 11.9% in 2013. Tax revenue increased by 4.4% to Rs. 1,050.4 billion (US$ 8.0 billion), whereasnon-tax revenue increased by 10.1% to Rs. 144.8 billion (US$ 1.1 billion) in 2014. Meanwhile, totalgrants received during 2014 amounted to Rs. 9.4 billion (US$ 0.1 billion).
Revenue collection from major sources, including value added tax on both domestic transactions andimports, excise tax, especially on liquor, motor vehicles and petroleum products, telecommunicationlevy and PAL and Cess Levy, all increased during 2014. However, revenue collection from directtaxes, other than PAYE taxes, declined in 2014.
Total revenue in 2013 increased by 8.2% to Rs. 1,137.4 billion (US$ 8.8 billion) compared to Rs.1,051.5 billion (US$ 8.2 billion) in 2012. As a percentage of GDP, revenue decreased to 11.9% in 2013from 12.0% in 2012. Tax revenue increased by 10.7% to Rs. 1,005.9 billion (US$ 7.8 billion), mainlydue to an increase in the collection of income taxes (19.2%), value added tax on domestic activities(9.2%) the special commodity levy (38.7%), and CESS levy (10.2%). Revenue collection from incometax increased mainly due to the improved performance in the corporate and non-corporate sector,PAYE taxes and withholding tax on interest. However, excise taxes, VAT on imports, import duties andnon-tax revenue declined during this period.
Total government revenue as a percentage of GDP declined to 12.0% in 2012 compared to 13.4%recorded in the previous year and 14.7% projected in the budget due to a decline in tax revenue as apercentage of GDP. However, in nominal terms, Government revenue increased by 8.6% to Rs.1,051.5billion in 2012 from Rs.967.9 billion in the previous year. Tax revenue as a percentage of GDPdeclined to 10.4% in 2012 from 11.7% in 2011, although in nominal terms it increased by 7.5% toRs.908.9 billion. The indirect taxes remained the major source of tax revenue in 2012 accounting for81.0% of the total tax revenue, compared to 81.4% in 2011. Consumption based taxes remained themajor source of tax revenue in 2012 accounting for 79.6% of the total tax collection. The share ofincome tax revenue in total revenue increased to 20.4% in 2012 from 19.4% in 2011. Higherwithholding tax revenue reflecting an increase in the volume as well as the maturity structure of newTreasury bond issues, higher borrowings through rupee denominated instruments and relatively highinterest rates prevailing in the domestic market, compared to the previous year contributed to theimprovement in income based tax collection. Non-tax revenue recorded a growth of 16.7% to Rs.142.5billion in 2012 over the previous year. Higher transfer of profits and dividends from publicinstitutions, including the Central Bank mainly contributed to the increase in non-tax revenue.
Expenditures
Total expenditure and net lending increased by 1.9% to Rs. 2,333.9 billion (US$ 16.0 billion) in 2016from Rs. 2,290.4 billion (US$ 16.8 billion) in 2015. As a percentage of GDP, total expenditure andnet lending decreased to 19.7% in 2016 from 20.9% in 2015. During 2016, recurrent expenditureincreased by 3.3% to Rs. 1,757.8 billion (US$ 12.1 billion). Increase in interest payments mainlycontributed to the increase in recurrent expenditure in nominal terms, followed by increase inexpenditure on salaries and wages. Interest payments also increased to Rs. 610.9 billion (US$ 4.2billion) and capital expenditure and net lending declined by 2.1% to Rs. 576.1 billion (US$ 4.0billion). As a percentage of GDP, capital expenditure and net lending declined to 4.9% during 2016,compared to 5.3% in 2015.
Total expenditure and net lending increased by 27.5% to Rs.2,290.4 billion (US$ 16.8 billion) during2015 from Rs.1,795.9 billion (US$ 13.8 billion) in 2014. As a percentage of GDP, total expenditureand net lending has increased to 20.5% in 2015 from 17.2% in 2014. During 2015, recurrentexpenditure increased by 28.6% to Rs.1,701.7 billion (US$ 12.5 billion), mainly due to an increase inexpenditure on salaries and wages, pension and Samurdhi payments. Interest payments also increasedto Rs.509.7 billion (US$ 3.7 billion) and capital expenditure and net lending increased by 24.5% toRs.588.7 billion (US$ 4.3 billion). As a percentage of GDP, capital expenditure and net lendingincreased to 5.3% during 2015, compared to 4.5% in 2014.
117
Total expenditure and net lending increased by 67.6% to Rs.1,795.9 billion (US$ 13.8 billion) in 2014from Rs.1,669.4 billion (US$ 12.9 billion) in 2013. In 2014, as a percentage of GDP, total expenditureand net lending remained unchanged at 17.4% from 2013. In 2014, recurrent expenditure increased by9.8% to Rs.1,322.9 billion (US$ 10.1 billion), mainly due to the increase in expenditure on salariesand wages, other goods and services and fertilizer subsidies. Interest payments declined marginally toRs.443.6 billion (US$ 3.3 billion) and capital expenditure and net lending increased by 1.9% toRs.473.0 billion (US$ 3.6 billion). As a percentage of GDP, capital expenditure and net lendingdeclined to 4.6% in 2014, compared to 4.8% in 2013.
Total expenditure and net lending is estimated to have increased by 7.3% to Rs.1,669.4 billion (US$12.9 billion) in 2013 from Rs.1,556.5 billion (US$ 12.2 billion) in 2012. As a percentage of GDP, totalexpenditure and net lending declined to 17.4% in 2013 from 17.8% in 2012. In 2013, recurrentexpenditure increased by 60.6% to Rs.1,205.2 billion (US$ 9.3 billion), mainly due to the increase inexpenditure on interest payments, salaries and wages, pensions and the Samurdhi payments. Interestpayments amounted to Rs.462.9 billion (US$ 3.4 billion), an 8.7% increase over 2012 which amountedto Rs.408.5 billion (US$ 3.0 billion). Capital expenditure and net lending is estimated to haveincreased by 9.1% to Rs.464.2 billion (US$ 3.6 billion). As a percentage of GDP, capital expendituredeclined to 4.8% in 2013, compared to 4.9% in 2012.
Government Budget
The Budget Process
Each year in May, the Ministry of Finance collects economic data and estimates from all the Ministriesand Revenue Departments in order to prepare the budget for the following year. The Minister ofFinance presents a budget speech to the Parliament in November every year which has to besubsequently approved by a majority in the Parliament to be passed as an Appropriation Act.
The broad strategies for budget making are to achieve macroeconomic stability and a regionally-balanced economic growth rate of 6.0% to 8.0% per annum over the medium term. The policyenvisages prominent roles for both the public and private sectors, and pro-poor, pro-growth strategies,while continuing market-based economic policies pursued by successive Governments over the past25 years.
As part of the Government’s budget process, Government obligations in debt service payments onoutstanding foreign debt are included in the expenses to be incurred out of the Consolidated Fund.Such an inclusion is based on the provisions of the Foreign Loans Act No. 29 of 1958 (as amended),which states that the cost of Government foreign debt service payments is to be charged to theConsolidated Fund.
2017 Budget
The Government’s budget for 2017 (the “Budget 2017”) was presented to the Parliament on November10, 2016 and approved on December 10, 2016. The broad theme of the Budget 2017 has been set outas “Accelerating Growth with Social Inclusion”. Accordingly, the main objective of the Budget 2017is eradication of poverty by promoting social inclusion. Furthermore, the Budget 2017 placed a greateremphasis on improving Sri Lanka’s production capacity, which includes expansion of employmentopportunities, recognizing the private sector as the engine of growth, encouraging entrepreneurshipdevelopment, improving productivity and introducing broad based reforms to achieve a sustainableeconomic growth while creating a conducive macroeconomic environment. Meanwhile, fiscaloperations are expected to improve further in 2017, with the expected overall fiscal deficit being 4.6%of GDP, a decrease from 5.4% of GDP recorded in 2016. According to budget estimates, total revenueand grants for 2017 is estimated to be Rs. 2,020.3 billion (US$ 13.4 billion), total expenditure and netlending is estimated to be Rs. 2,645.3 billion (US$ 17.5 billion) and the overall budget deficit isexpected to be Rs. 625.0 billion (US$ 4.1 billion). The budget deficit is expected to be financedthrough net domestic financing of Rs. 293.0 billion (US$ 1.9 billion) and net foreign financing of Rs.332.0 billion (US$ 2.2 billion).
118
2016 Budget
The Budget for 2016 was presented to the Parliament on November 20, 2015 and approved onDecember 19, 2015. The main objectives of the budget were to create an upper middle incomeeconomy guaranteeing economic resurgence, thus upgrading Sri Lanka to a higher plateau by furtherstrengthening the fiscal consolidation through rationalizing public expenditure and increasingGovernment revenue. Furthermore, the budget aims at setting a new dimension in the nationaleconomic policy within the framework of good governance and transparency. Fiscal operations wereexpected to improve further in 2016, with the overall fiscal deficit expected to decline to 5.9% of GDP.On March 8, 2016, the Government announced revisions to certain taxes in the backdrop of thechanging global economic climate while highlighting the commitment of the Government to reduce thebudget deficit further to 5.4% of GDP in 2016, instead of the originally targeted level of 5.9% of GDPenvisaged in the Budget 2016. According to revised estimates, total revenue and grants for 2016 isestimated to be Rs. 1,556.0 billion (US$ 10.8 billion), total expenditure and net lending is estimatedto be Rs. 2,215.0 billion (US$ 15.4 billion) and the overall budget deficit is expected to be Rs. 659billion (US$ 4.6 billion). The budget deficit is expected to be financed through net domestic financingof Rs. 259.0 billion (US$ 1.8 billion) and net foreign financing of Rs. 400.0 billion (US$ 2.8 billion).
2015 Interim Budget
The Interim Budget 2015 (Hundred Day Revolution) which was presented to the Parliament on January29, 2015 and approved on February 7, 2015, proposed changes to the original 2015 Budget that wasapproved on November 24, 2014. According to revised budget estimates in the 2015 Interim Budget,total revenue and grants for 2015 is estimated to be Rs. 1,535 billion (US$ 11.6 billion), totalexpenditure and net lending is estimated to be Rs. 2,034 billion (US$ 15.3 billion) and the overallbudget deficit is expected to be Rs. 499 billion (US$ 3.8 billion). The budget deficit is expected tobe financed through net domestic financing of Rs. 208 billion (US$ 1.6 billion) and net foreignfinancing of Rs. 291 billion (US$ 2.2 billion).
2015 Budget
The Budget for 2015 was presented to the Parliament on October 24, 2014 and approved on November24, 2014. The main objectives of the budget were to further strengthen the fiscal consolidation throughrationalizing public expenditure and increasing Government revenue, continue with infrastructuredevelopment in the rural areas, and facilitate human capital development through enhancing education(primary, secondary, university and vocational), supporting research and innovation, and improvinghealth services. Furthermore, the budget aims at promoting export of goods and services, increasingvalue addition to Sri Lankan products and improving productivity in all sectors of the economy andsimultaneously developing the economy in rural areas. In addition, the budget encourages urbandevelopment and focuses on strengthening social security and creating support for low incomefamilies. Fiscal operations are expected to improve further in 2015, with the overall fiscal deficitexpected to decline to 4.6% of GDP from an expected 5.2% in 2014. According to budget estimates,total revenue and grants for 2015 is estimated to be Rs. 1,625 billion (US$ 12.5 billion), totalexpenditure and net lending is estimated to be Rs. 2,210 billion (US$ 17.0 billion) and the overallbudget deficit is expected to be Rs. 521 billion (US$ 4.0 billion). The budget deficit is expected tobe financed through net domestic financing of Rs. 230 billion (US$ 1.8 billion) and net foreignfinancing of Rs. 291 billion (US$ 2.2 billion).
119
2014 Budget
The Budget for 2014 was presented to the Parliament on November 21, 2013 and approved onDecember 20, 2013. The main objectives of the budget were to sustain economic growth in anon-inflationary environment within a consistent policy framework, to strengthen the fiscalconsolidation process, to strengthen the rural economy and to alleviate poverty through inclusivegrowth. Fiscal operations were expected to improve further in 2014, with the overall fiscal deficitexpected to decline to 5.2% of GDP from 5.8% in 2013. According to budget estimates, total revenueand grants for 2014 was estimated to be Rs. 1,469.5 billion (US$ 11.2 billion), total expenditure andnet lending was estimated to be Rs. 1,985.6 billion (US$ 15.1 billion) and the overall budget deficitwas estimated to be Rs. 516.1 billion (US$ 3.9 billion). The budget deficit was expected to be financedthrough net domestic financing of Rs. 229.3 billion (US$ 1.7 billion) and net foreign financing of Rs.286.8 billion (US$ 2.2 billion).
2013 Budget
The Budget for 2013 was presented to the Parliament on November 8, 2012 and was approved onDecember 8, 2012. The 2013 Budget was presented with the objective of transforming the economyinto a poverty-free upper-middle income economy over the next three years starting from 2013 whilecontinuing the fiscal consolidation process. Accordingly, several measures were proposed in the fiscalfront to increase government revenue and streamline expenditure while encouragingregionally-balanced growth of the country. Measures introduced in the tax system were mainly focusedto broaden the tax base and improve tax administration. Total government revenue and grants in 2013was estimated to be Rs. 1,277.5 billion (US$ 9.9 billion), total expenditure and net lending wasestimated to be Rs. 1,784.9 billion (US$ 13.8 billion) and the overall budget deficit was estimated tobe Rs. 507.4 billion (US$ 3.9 billion). The budget was expected to be financed through net domesticfinancing of Rs. 359.4 billion (US$ 2.8 billion) and net foreign financing of Rs. 148 billion (US$ 1.1billion).
2012 Budget
The Budget for 2012 was presented in the Parliament on November 21, 2011 and it was approved onDecember 21, 2011. The budget targeted five major areas, namely supporting a caring family, ensuringfood security, empowering a healthy generation, creating a knowledge society and boosting anenterprise economy. According to the budget for 2012, the fiscal sector was expected to show severalpositive developments. New proposals were introduced to simplify the tax system, to streamline taxadministration and to broaden the tax base. Further, several tax incentives in terms of exemptions andconcessionary rates were proposed to increase investments in agriculture, information technology,business/knowledge process outsourcing, healthcare, education, tourism and sports related activities.Considering the fiscal sector, total government revenue and grants in 2012 was Rs. 1,067.5 billion(US$ 8.4 billion), total expenditure and net lending was to be Rs. 1,556.5 billion (US$ 12.2 billion),and the overall budget deficit was Rs. 489 billion (US$ 3.8 billion). The budget was financed throughnet domestic financing of Rs. 202.5 billion (US$ 1.6 billion) and net foreign financing of Rs. 286.5billion (US$ 2.2 billion).
120
The following table sets forth the 2017 Budget.
2017 BUDGET
Item 2017 Budget
(Rs. million)
Total revenue and Grants .................................................................... 2,020,300Total revenue ...................................................................................... 2,010,300Tax revenue ........................................................................................ 1,827,000
Income taxes ................................................................................... 334,550VAT ................................................................................................ 380,000Excise taxes .................................................................................... 579,035Import duties ................................................................................... 165,500Other taxes...................................................................................... 367,915
Non tax revenue..................................................................................... 183,300Grants .................................................................................................... 10,000Total expenditure and net lending ....................................................... 2,645,300
Current expenditure ............................................................................ 1,946,000Salaries and wages .......................................................................... 615,000Interest payments ............................................................................ 680,087Current transfers and subsidies ........................................................ 427,577Other............................................................................................... 223,336
Capital Expenditure and Lending minus Repayments.............................. 699,300Revenue Surplus/(Deficit) .................................................................... 64,300
Budget Deficit ....................................................................................... 625,000
Source: Central Bank of Sri Lanka
Debt
External Debt
In 2013, the Central Bank modified its system of collecting and reporting data based on BPM6, a setof revised and updated standards for concepts, definitions and classifications for internationalaccounts statistics published by the IMF. The following table sets forth the external debt of the countryfor 2012 to 2016 based on BPM6.
121
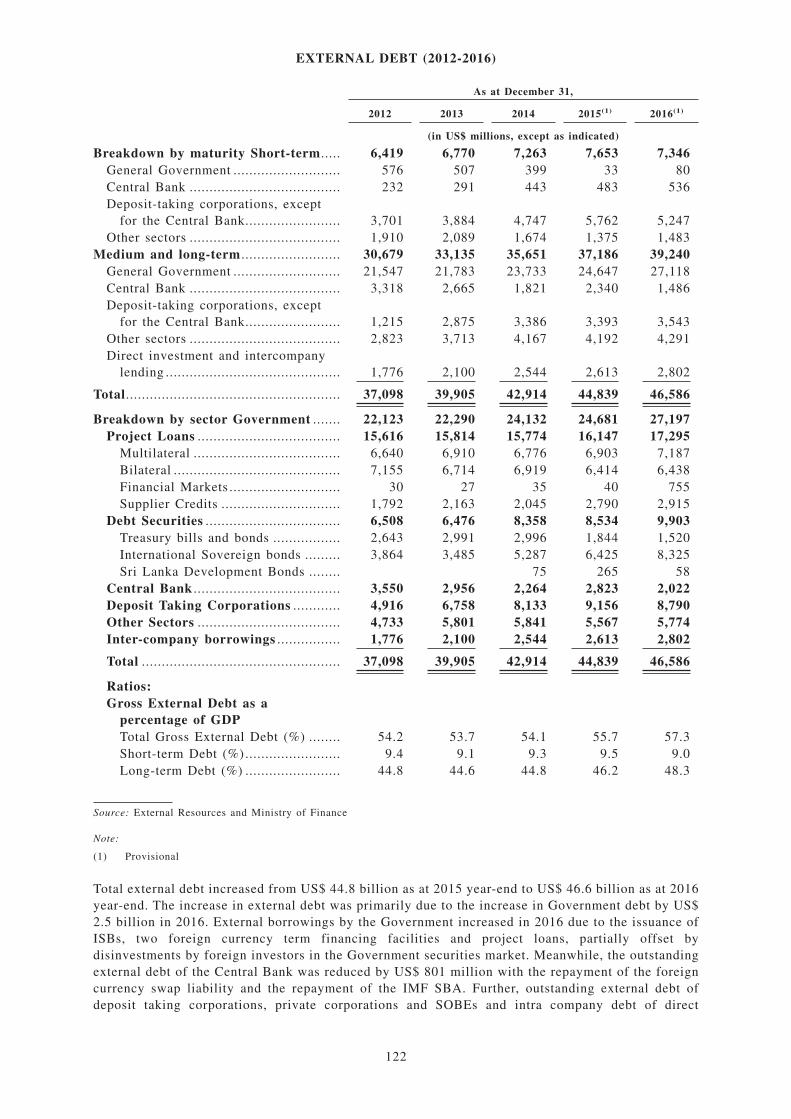
EXTERNAL DEBT (2012-2016)
As at December 31,
2012 2013 2014 2015(1) 2016(1)
(in US$ millions, except as indicated)
Breakdown by maturity Short-term..... 6,419 6,770 7,263 7,653 7,346General Government ........................... 576 507 399 33 80Central Bank ...................................... 232 291 443 483 536Deposit-taking corporations, except
for the Central Bank........................ 3,701 3,884 4,747 5,762 5,247Other sectors ...................................... 1,910 2,089 1,674 1,375 1,483
Medium and long-term ......................... 30,679 33,135 35,651 37,186 39,240General Government ........................... 21,547 21,783 23,733 24,647 27,118Central Bank ...................................... 3,318 2,665 1,821 2,340 1,486Deposit-taking corporations, except
for the Central Bank........................ 1,215 2,875 3,386 3,393 3,543Other sectors ...................................... 2,823 3,713 4,167 4,192 4,291Direct investment and intercompany
lending ............................................ 1,776 2,100 2,544 2,613 2,802
Total...................................................... 37,098 39,905 42,914 44,839 46,586
Breakdown by sector Government ....... 22,123 22,290 24,132 24,681 27,197Project Loans .................................... 15,616 15,814 15,774 16,147 17,295
Multilateral ..................................... 6,640 6,910 6,776 6,903 7,187Bilateral .......................................... 7,155 6,714 6,919 6,414 6,438Financial Markets ............................ 30 27 35 40 755Supplier Credits .............................. 1,792 2,163 2,045 2,790 2,915
Debt Securities .................................. 6,508 6,476 8,358 8,534 9,903Treasury bills and bonds ................. 2,643 2,991 2,996 1,844 1,520International Sovereign bonds ......... 3,864 3,485 5,287 6,425 8,325Sri Lanka Development Bonds ........ 75 265 58
Central Bank ..................................... 3,550 2,956 2,264 2,823 2,022Deposit Taking Corporations ............ 4,916 6,758 8,133 9,156 8,790Other Sectors .................................... 4,733 5,801 5,841 5,567 5,774Inter-company borrowings ................ 1,776 2,100 2,544 2,613 2,802
Total .................................................. 37,098 39,905 42,914 44,839 46,586
Ratios:Gross External Debt as a
percentage of GDPTotal Gross External Debt (%) ........ 54.2 53.7 54.1 55.7 57.3Short-term Debt (%) ........................ 9.4 9.1 9.3 9.5 9.0Long-term Debt (%) ........................ 44.8 44.6 44.8 46.2 48.3
Source: External Resources and Ministry of Finance
Note:
(1) Provisional
Total external debt increased from US$ 44.8 billion as at 2015 year-end to US$ 46.6 billion as at 2016year-end. The increase in external debt was primarily due to the increase in Government debt by US$2.5 billion in 2016. External borrowings by the Government increased in 2016 due to the issuance ofISBs, two foreign currency term financing facilities and project loans, partially offset bydisinvestments by foreign investors in the Government securities market. Meanwhile, the outstandingexternal debt of the Central Bank was reduced by US$ 801 million with the repayment of the foreigncurrency swap liability and the repayment of the IMF SBA. Further, outstanding external debt ofdeposit taking corporations, private corporations and SOBEs and intra company debt of direct
122
investment enterprises amounted to US$ 8,790 million, US$ 5,774 million and US$ 2,802 million,respectively, in 2016. Total outstanding external debt as a percentage of GDP increased to 57.3% asat 2016 year-end, compared to 55.7% as at 2015 year-end, primarily due to the increase in Governmentexternal debt. Outstanding position of Government external debt amounted to 58.4% of total externaldebt as at 2016 year-end, compared to 55.0% recorded as at 2015 year-end.
The total external debt of Sri Lanka increased to US$ 44.8 billion, which accounts for 55.7% of theGDP as at December 31, 2015, compared to US$ 42.9 billion, which amounts to 54.1% of the GDPas at December 31, 2014. This relatively marginal increase in outstanding external debt was mainlyattributable to the moderate inflow of foreign loans, coupled with the repayment of maturing debtsecurities and other scheduled debt repayments. The outstanding external debt in US dollar termsincreased only moderately as a result of the high level of exchange rate valuation differences.Meanwhile, the composition of short-term to long term debt remained at the same level in both thebeginning and the end of 2015. Outstanding foreign loans, which accounted for 58% of the totalexternal debt, were the main contributor to the total external debt as at December 31, 2015.Outstanding portfolio investments in the form of debt securities and currency and deposit liabilitiesamounted to 24% and 7%, respectively, as at December 31, 2015. On a sector wise breakdown, theoutstanding external debt of the Government accounted for the largest share of total external debt,with 55% of the total external debt, while deposit taking corporations, private sector corporations andSOBEs and the Central Bank, contributed 20%, 12% and 6%, respectively, to the total outstandingexternal debt as at December 31, 2015.
As at December 31, 2014, Sri Lanka’s total external debt amounted to US$ 43.0 billion, an increaseof 7.7% from the US$ 39.9 billion as at December 31, 2013. This was mainly attributable to theissuance of the sixth and the seventh international sovereign bonds amounting to US$ 1.5 billion intotal, the international bond issuances of NSB and SriLankan Airlines, net increase in long-termforeign loans of the Government, the SOBEs, the private sector and deposit taking corporations.However, total external debt as a percentage of GDP decreased to 57.5% as at December 31, 2014,from 57.4% as at December 31, 2013, primarily because the real GDP grew at a higher rate than thetotal external debt.
Higher inflows to the private sector and deposit taking corporations resulted in an increase in the totalexternal debt in 2013. According to the BPM6 guidelines, the external debt includes the outstandingposition of SDRs and intra-company lending of DIEs, both of which were not covered in previousstatistical publications. With the addition of new categories and reclassification of external debtstatistics, the total external debt of the country was recorded at US$ 39.9 billion at the end of 2013,a 7.5% increase from the US$ 37.1 billion recorded at the end of 2012. This increase was primarilydue to higher inflows to the private sector in the form of foreign borrowings and international debtsecurities issued by deposit taking corporations. Of the total external debt, 61% was in the form ofoutstanding loan liabilities at the end of 2013, compared to 64% recorded at the end of 2012. With theinclusion of new data categories in external debt statistics, total external debt as a percentage of GDPamounted to 59% at the end of 2013, compared to 62% at the end of 2012, reflecting a more significantincrease in GDP compared to the increase in external debt.
The Government could maintain the non-concessional debt level at a manageable level by encouragingboth domestic and foreign investors to undertake major infrastructure projects, perhaps in partnershipwith the Government. In this regard, it is necessary to encourage the private sector, especially thefinancially sound private sector enterprises to raise medium and long term external loans from theinternational markets and multilateral financial institutions to finance such infrastructure projects andtheir own operations. This would release domestic financial resources to private sector enterprises thatare not capable of raising external debt. If the Government is unsuccessful in harnessing privateinvestment and the access to the concession loans decreases, the effect will be an increase in theGovernment financing costs.
The external debt is expected to remain at current levels in the immediate future. The anticipateddirection of capital markets external financing may be offset by the decline in concessional borrowingmainly due to Sri Lanka’s advancement into the lower middle income country category.
123
Debt Service Payments
Capital payments on Sri Lanka’s external debt obligations moderated while interest paymentsincreased in 2016. Capital repayments on external debt amounted to US$ 3,157 million in 2016,compared to US$ 3,435 million in 2015. The notable decline in capital repayments of Governmentsecurities was due to the one-time repayment in 2015 of an ISB of US$ 500 million. However,repayments of the Central Bank increased with the settlement of foreign currency swaps, amountingto US$ 1,100 million, along with the repayments for the IMF SBA in 2016. Interest payments onoutstanding external debt obligations increased from US$ 1,190 million in 2015 to US$ 1,209 millionin 2016. The increase in interest payments was mainly due to the expansion in interest payments madeby the private sector and deposit taking corporations. Total external debt service payments as apercentage of exports declined in 2016. As a result of the decline in total debt service payments,coupled with an increase in export of merchandise goods and services, debt service payments as apercentage of export of goods and services declined to 25.0% in 2016, compared to 27.3% in 2015.
Debt service payments on Sri Lanka’s external debt obligations increased significantly in 2015. Bothcapital and interest payments increased in 2015 to US$ 3,435 million and US$ 1,190 million,respectively, compared to US$ 2,323 million of capital payments and US$ 1,156 million of interestpayments in 2014. Capital payments increased with the repayment of the Government’s foreign loansof US$ 798 million, matured ISBs of US$ 500 million, matured Treasury bonds of US$ 678 million,the SBA Facility repayment of US$ 507 million, the repayment of foreign loans by SOBEs and deposittaking corporations of US$ 577 million and the repayment of US$ 400 million of the RBI swap facilityby the Central Bank. Meanwhile, Sri Lanka made US$ 1,190 million of interest payments during 2015,compared to US$ 1,156 million in 2014, respectively, an increase of 3% over the previous year. Asa result of increased capital and interest payments and lower exports of goods, debt service paymentsas a percentage of export of goods and services increased significantly to 27.3% in 2015 compared to20.8% a year earlier.
Total foreign debt service payments, consisting of amortization and interest payments in 2014. Innominal terms, debt service payments declined to US$ 3,386 million in 2014, from US$ 3,540 millionin 2013, primarily due to a decrease in repayments of Treasury bills and Treasury bonds and a decreasein capital repayments on the long-term loans of the Government. Total capital repayments werecomprised of the repayment of long-term borrowings by the Government amounting to US$ 793million, the repayment of US$ 719 million to the IMF, the maturity of Government securitiesamounting to US$ 503 million and the repayment of private sector loan liabilities amounting to US$215 million. Meanwhile, debt service payments as a percentage of export of goods and servicesdeclined to 20.2% in 2014 compared to 23.5% in 2013, mainly due to decreased capital repaymentsand increased earnings of exports of goods and services.
Total foreign debt service payments increased in 2013. Total foreign debt service payments, whichconsisted of both principal and interest payments, increased by 32.0% from US$ 2,672 million in 2012to US$ 3,540 million in 2013. This was primarily due to an increase in capital payments by 50% andan increase in interest payments by 20% in 2013. The capital payments included repayment of the SBAFacility of US$ 453 million, repayment of Government long-term borrowings of US$ 836 million,repayment of private sector loans of US$ 474 million and the maturity of Government securities ofUS$ 719 million. The increase in interest payments was primarily due to the increase in interestpayments on Government securities. Accordingly, foreign debt service payments as a percentage ofexports of goods and services increased to 23.5% in 2013 from 19.7% in 2012.
Sri Lanka Credit Ratings
On February 27, 2009, Fitch revised its credit rating outlook for the country’s long term foreign andlocal currency Issuer Default Ratings to “negative” from “stable,” citing the “heightened concernregarding the sovereign’s external financial position in light of the marked decline in official foreignexchange reserves.” Fitch revised Sri Lanka’s sovereign rating outlook to “stable” from “negative” toreflect the country’s positive changes in sovereign credit fundamentals on October 9, 2009. Theagency has affirmed the long-term foreign and local currency Issuer Default Ratings and the CountryCeiling at “B+” and the short-term Issuer Default Rating at “B,” citing “the positive changes insovereign credit fundamentals following the end of the 26-year internal conflict, the approval of the
124
US$ 2.6 billion SBA Facility and the return of private capital inflows.” On September 21, 2010, Fitchagain revised the outlook to “positive” from “stable.” On July 18, 2011, Fitch upgraded Sri Lanka’slong-term foreign and local currency Issuer Default Rating to “BB-” from “B+”, with a stable outlookand affirmed Sri Lanka’s short-term Issuer Default Rating at “B.” The rating agency has also upgradedthe Country Ceiling to “BB-”. In Fitch’s view, the outlook revision reflects of Sri Lanka’s economicbenefits from the end of the internal conflict and further benefits from the disciplined policyframework put in place under the SBA Facility and from the improved external liquidity positionbolstered by the IMF program. On May 4, 2012, Fitch affirmed Sri Lanka’s long-term foreign and localcurrency Issuer Default Rating of “BB-”, with a stable outlook, and affirmed Sri Lanka’s short-termIssuer Default Rating at “B” and a Country Ceiling of “BB-”. In April 2013, having observed thecountry’s growth performance, level of human development and payment record against weakness offiscal and external balance sheet and moderate domestic savings relative to investment needs, Fitchaffirmed Sri Lanka at “BB-” with a stable outlook. On May 12, 2014, Fitch affirmed again its existingrating of “BB-” and the stable outlook of the Sri Lankan economy. On April 22, 2015, Fitch reaffirmedits existing rating of “BB-” with a stable outlook, citing Sri Lanka’s smooth political transitionfollowing the presidential elections, reinforcing perceptions of a functioning democracy withrelatively strong institutions. On February 29, 2016, Fitch revised Sri Lanka’s long-term foreigncurrency risk rating from “BB-” to “B+” with a negative outlook, highlighting an increasedvulnerability of the sovereign’s creditworthiness to adverse shocks. On February 9, 2017, Fitchconfirmed Sri Lanka’s rating at “B+” and revised the outlook from “negative” to “stable” consideringthe continuous improvement in fiscal performance, improved policy coherence and credibility with theon-going IMF-EFF programme and stable growth in the economy.
On August 25, 2009, S&P revised its sovereign rating outlook back to “stable” due to Sri Lanka’simproved external liquidity position in light of the SBA Facility. On October 15, 2009, S&P furtherrevised its sovereign rating outlook to “positive,” citing the “continued strengthening of Sri Lanka’sBOP position, and S&P’s expectation that the SBA Facility will be pursued to its conclusion,engendering modest improvement in public finances”. Accordingly, S&P affirmed its “B” long-termforeign currency credit rating and “B+” long term local currency sovereign credit rating on Sri Lanka.They also affirmed the “B” short-term ratings on the sovereign. On September 15, 2010, S&P raisedits long-term foreign currency sovereign credit rating on Sri Lanka to “B+” from “B,” and thelong-term local currency rating to “BB-” from “B+” taking into account the continued strengtheningof Sri Lanka’s BOP position and the expected sustainable decline in fiscal deficits and public debtunder the Government’s planned revenue reforms. On July 19, 2011, S&P raised its outlook on SriLanka’s long-term foreign currency sovereign credit rating to “positive” from “stable” based onimproved external liquidity, progress in addressing structural fiscal weaknesses and the Government’sinflation management efforts. On February 29, 2012, S&P changed its outlook on Sri Lanka’slong-term foreign currency sovereign credit rating to “stable” from “positive” while affirming its “B+”rating and lowering its long-term local currency sovereign credit rating to “B+” from “BB-.” OnAugust 1, 2013, S&P affirmed its “B+” long-term sovereign credit ratings, with a stable outlook. S&Pexpects that Sri Lanka’s gross international reserves will remain at a similar level to that in 2012 atthree months’ coverage of current account receipts. The stable outlook reflects S&P’s view that thecountry has strong prospects for per capita real GDP growth over the next few years and theimprovement of the Government’s fiscal profile. On July 8, 2014, S&P again affirmed its “B+”long-term and “B” short-term sovereign credit ratings. On August 6, 2015, S&P affirmed its “B+”long-term and “B” short-term sovereign credit ratings for Sri Lanka, with a stable outlook. S&P’stransfer and convertibility risk assessment remained unchanged at “B+”. S&P cited Sri Lanka’s strongeconomic growth outlook, moderate external imbalances and adequate monetary flexibility dampenedby weak fiscal indicators and institutional constraints. On March 10, 2016, S&P revised its creditrating outlook for the country’s long-term foreign-currency rating from “Stable” to “Negative”, citing“rising pressures on Sri Lanka’s external-liquidity position, stemming from a weaker than expectedtrade balance and falling remittances”. On March 7, 2017, S&P affirmed its current ratings andoutlook.
125
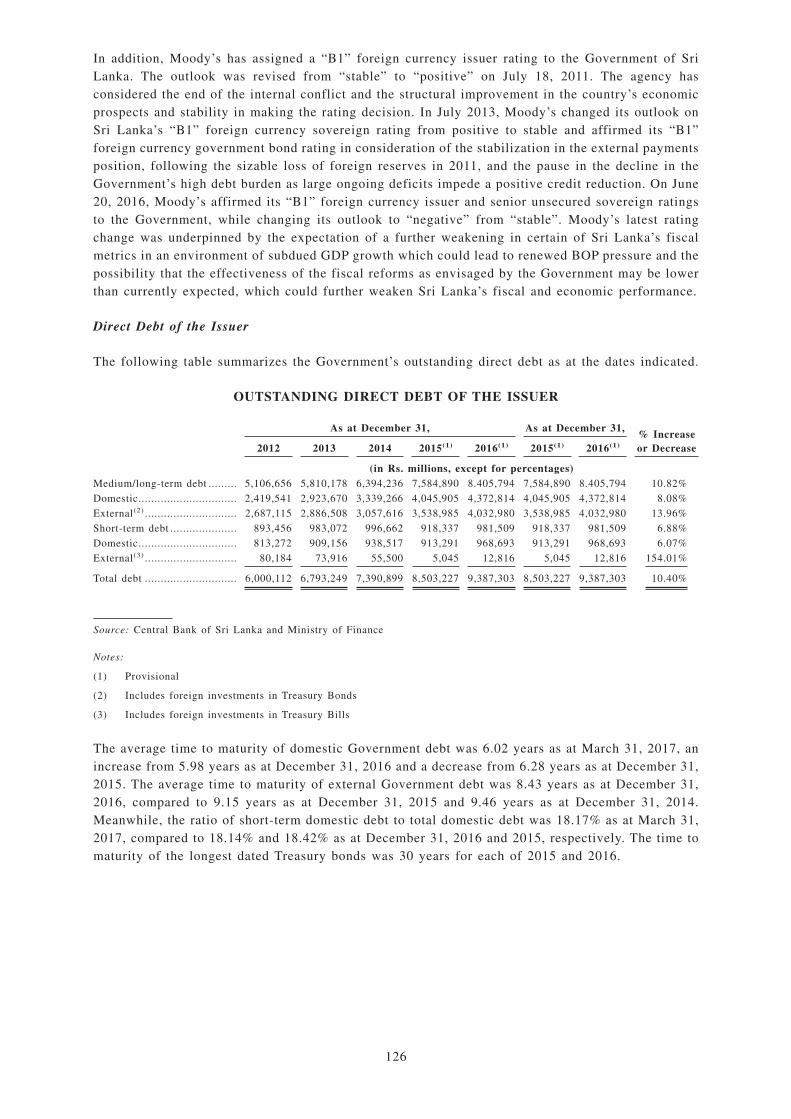
In addition, Moody’s has assigned a “B1” foreign currency issuer rating to the Government of SriLanka. The outlook was revised from “stable” to “positive” on July 18, 2011. The agency hasconsidered the end of the internal conflict and the structural improvement in the country’s economicprospects and stability in making the rating decision. In July 2013, Moody’s changed its outlook onSri Lanka’s “B1” foreign currency sovereign rating from positive to stable and affirmed its “B1”foreign currency government bond rating in consideration of the stabilization in the external paymentsposition, following the sizable loss of foreign reserves in 2011, and the pause in the decline in theGovernment’s high debt burden as large ongoing deficits impede a positive credit reduction. On June20, 2016, Moody’s affirmed its “B1” foreign currency issuer and senior unsecured sovereign ratingsto the Government, while changing its outlook to “negative” from “stable”. Moody’s latest ratingchange was underpinned by the expectation of a further weakening in certain of Sri Lanka’s fiscalmetrics in an environment of subdued GDP growth which could lead to renewed BOP pressure and thepossibility that the effectiveness of the fiscal reforms as envisaged by the Government may be lowerthan currently expected, which could further weaken Sri Lanka’s fiscal and economic performance.
Direct Debt of the Issuer
The following table summarizes the Government’s outstanding direct debt as at the dates indicated.
OUTSTANDING DIRECT DEBT OF THE ISSUER
As at December 31, As at December 31,% Increaseor Decrease2012 2013 2014 2015(1) 2016(1) 2015(1) 2016(1)
(in Rs. millions, except for percentages)Medium/long-term debt ......... 5,106,656 5,810,178 6,394,236 7,584,890 8.405,794 7,584,890 8.405,794 10.82%
Domestic............................... 2,419,541 2,923,670 3,339,266 4,045,905 4,372,814 4,045,905 4,372,814 8.08%
External(2) ............................. 2,687,115 2,886,508 3,057,616 3,538,985 4,032,980 3,538,985 4,032,980 13.96%
Short-term debt ..................... 893,456 983,072 996,662 918,337 981,509 918,337 981,509 6.88%
Domestic............................... 813,272 909,156 938,517 913,291 968,693 913,291 968,693 6.07%
External(3) ............................. 80,184 73,916 55,500 5,045 12,816 5,045 12,816 154.01%
Total debt ............................. 6,000,112 6,793,249 7,390,899 8,503,227 9,387,303 8,503,227 9,387,303 10.40%
Source: Central Bank of Sri Lanka and Ministry of Finance
Notes:
(1) Provisional
(2) Includes foreign investments in Treasury Bonds
(3) Includes foreign investments in Treasury Bills
The average time to maturity of domestic Government debt was 6.02 years as at March 31, 2017, anincrease from 5.98 years as at December 31, 2016 and a decrease from 6.28 years as at December 31,2015. The average time to maturity of external Government debt was 8.43 years as at December 31,2016, compared to 9.15 years as at December 31, 2015 and 9.46 years as at December 31, 2014.Meanwhile, the ratio of short-term domestic debt to total domestic debt was 18.17% as at March 31,2017, compared to 18.14% and 18.42% as at December 31, 2016 and 2015, respectively. The time tomaturity of the longest dated Treasury bonds was 30 years for each of 2015 and 2016.
126
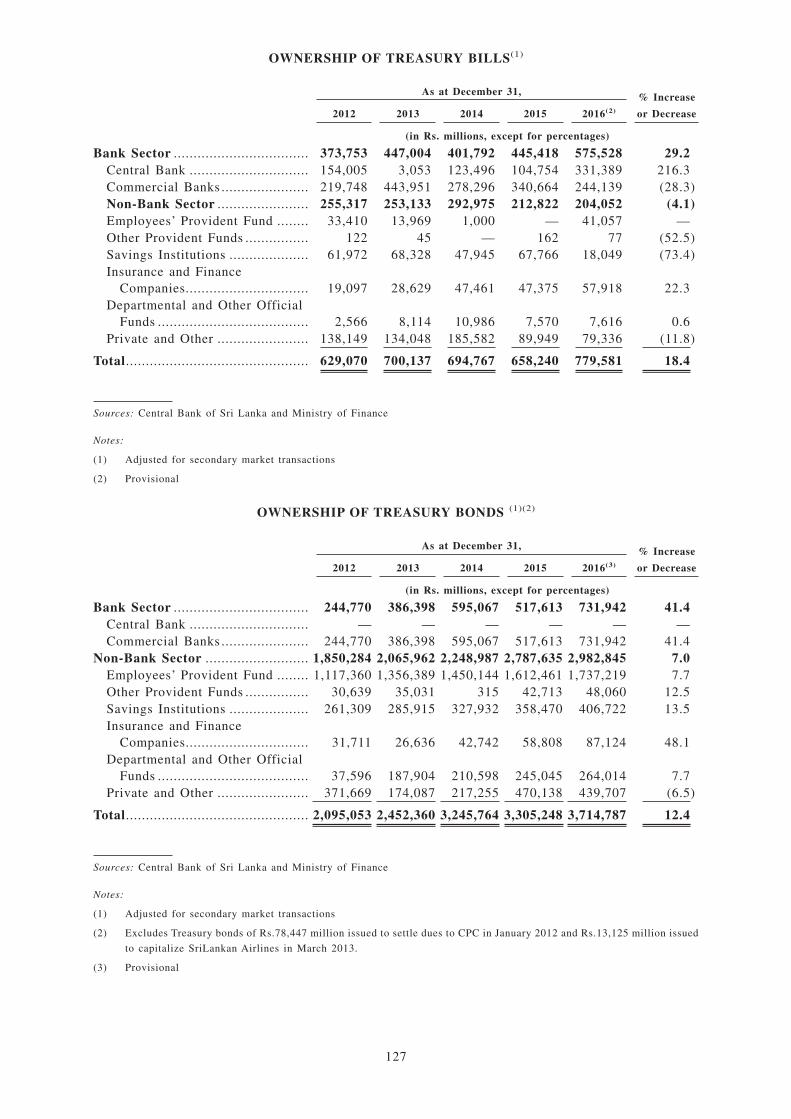
OWNERSHIP OF TREASURY BILLS(1)
As at December 31, % Increase
or Decrease2012 2013 2014 2015 2016(2)
(in Rs. millions, except for percentages)
Bank Sector .................................. 373,753 447,004 401,792 445,418 575,528 29.2Central Bank .............................. 154,005 3,053 123,496 104,754 331,389 216.3Commercial Banks ...................... 219,748 443,951 278,296 340,664 244,139 (28.3)Non-Bank Sector ....................... 255,317 253,133 292,975 212,822 204,052 (4.1)Employees’ Provident Fund ........ 33,410 13,969 1,000 — 41,057 —Other Provident Funds ................ 122 45 — 162 77 (52.5)Savings Institutions .................... 61,972 68,328 47,945 67,766 18,049 (73.4)Insurance and Finance
Companies............................... 19,097 28,629 47,461 47,375 57,918 22.3Departmental and Other Official
Funds ...................................... 2,566 8,114 10,986 7,570 7,616 0.6Private and Other ....................... 138,149 134,048 185,582 89,949 79,336 (11.8)
Total.............................................. 629,070 700,137 694,767 658,240 779,581 18.4
Sources: Central Bank of Sri Lanka and Ministry of Finance
Notes:
(1) Adjusted for secondary market transactions
(2) Provisional
OWNERSHIP OF TREASURY BONDS (1)(2)
As at December 31, % Increase
or Decrease2012 2013 2014 2015 2016(3)
(in Rs. millions, except for percentages)
Bank Sector .................................. 244,770 386,398 595,067 517,613 731,942 41.4Central Bank .............................. — — — — — —Commercial Banks ...................... 244,770 386,398 595,067 517,613 731,942 41.4
Non-Bank Sector .......................... 1,850,284 2,065,962 2,248,987 2,787,635 2,982,845 7.0Employees’ Provident Fund ........ 1,117,360 1,356,389 1,450,144 1,612,461 1,737,219 7.7Other Provident Funds ................ 30,639 35,031 315 42,713 48,060 12.5Savings Institutions .................... 261,309 285,915 327,932 358,470 406,722 13.5Insurance and Finance
Companies............................... 31,711 26,636 42,742 58,808 87,124 48.1Departmental and Other Official
Funds ...................................... 37,596 187,904 210,598 245,045 264,014 7.7Private and Other ....................... 371,669 174,087 217,255 470,138 439,707 (6.5)
Total.............................................. 2,095,053 2,452,360 3,245,764 3,305,248 3,714,787 12.4
Sources: Central Bank of Sri Lanka and Ministry of Finance
Notes:
(1) Adjusted for secondary market transactions
(2) Excludes Treasury bonds of Rs.78,447 million issued to settle dues to CPC in January 2012 and Rs.13,125 million issued
to capitalize SriLankan Airlines in March 2013.
(3) Provisional
127
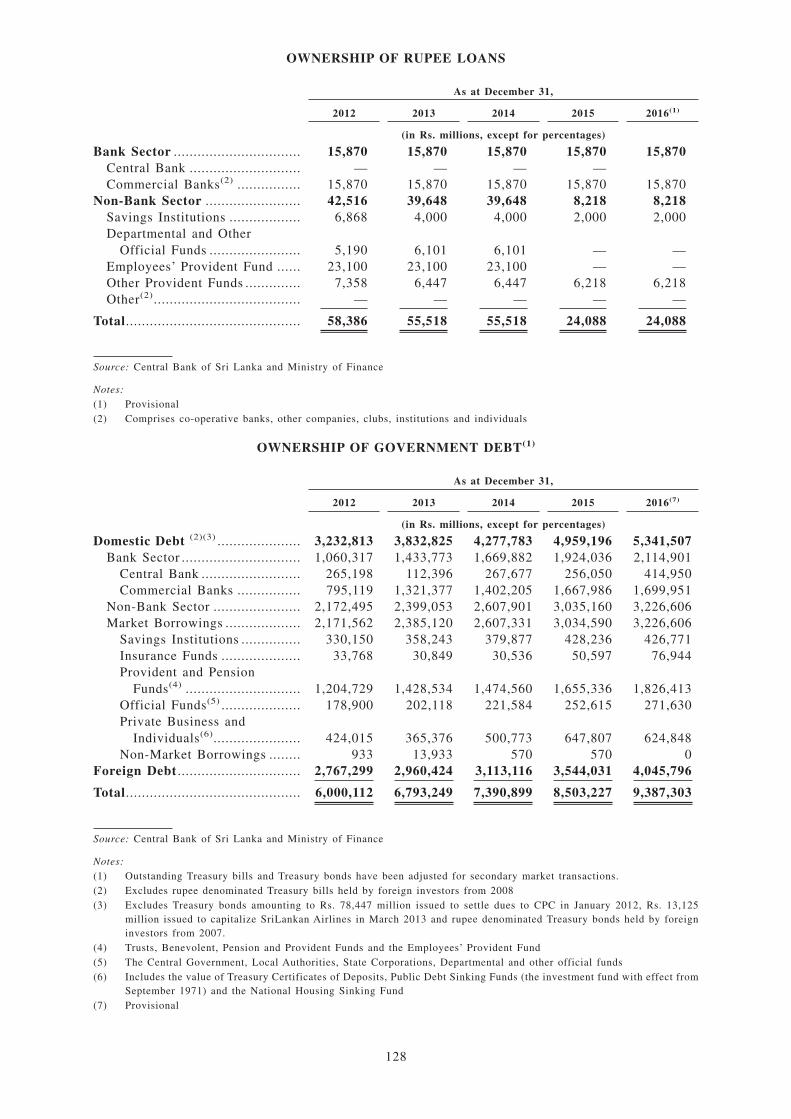
OWNERSHIP OF RUPEE LOANS
As at December 31,
2012 2013 2014 2015 2016(1)
(in Rs. millions, except for percentages)
Bank Sector ................................ 15,870 15,870 15,870 15,870 15,870Central Bank ............................ — — — —Commercial Banks(2) ................ 15,870 15,870 15,870 15,870 15,870
Non-Bank Sector ........................ 42,516 39,648 39,648 8,218 8,218Savings Institutions .................. 6,868 4,000 4,000 2,000 2,000Departmental and Other
Official Funds ....................... 5,190 6,101 6,101 — —Employees’ Provident Fund ...... 23,100 23,100 23,100 — —Other Provident Funds .............. 7,358 6,447 6,447 6,218 6,218Other(2)..................................... — — — — —
Total............................................ 58,386 55,518 55,518 24,088 24,088
Source: Central Bank of Sri Lanka and Ministry of Finance
Notes:(1) Provisional(2) Comprises co-operative banks, other companies, clubs, institutions and individuals
OWNERSHIP OF GOVERNMENT DEBT(1)
As at December 31,
2012 2013 2014 2015 2016(7)
(in Rs. millions, except for percentages)
Domestic Debt (2)(3) ..................... 3,232,813 3,832,825 4,277,783 4,959,196 5,341,507Bank Sector .............................. 1,060,317 1,433,773 1,669,882 1,924,036 2,114,901
Central Bank ......................... 265,198 112,396 267,677 256,050 414,950Commercial Banks ................ 795,119 1,321,377 1,402,205 1,667,986 1,699,951
Non-Bank Sector ...................... 2,172,495 2,399,053 2,607,901 3,035,160 3,226,606Market Borrowings ................... 2,171,562 2,385,120 2,607,331 3,034,590 3,226,606
Savings Institutions ............... 330,150 358,243 379,877 428,236 426,771Insurance Funds .................... 33,768 30,849 30,536 50,597 76,944Provident and Pension
Funds(4) ............................. 1,204,729 1,428,534 1,474,560 1,655,336 1,826,413Official Funds(5) .................... 178,900 202,118 221,584 252,615 271,630Private Business and
Individuals(6)...................... 424,015 365,376 500,773 647,807 624,848Non-Market Borrowings ........ 933 13,933 570 570 0
Foreign Debt ............................... 2,767,299 2,960,424 3,113,116 3,544,031 4,045,796
Total............................................ 6,000,112 6,793,249 7,390,899 8,503,227 9,387,303
Source: Central Bank of Sri Lanka and Ministry of Finance
Notes:(1) Outstanding Treasury bills and Treasury bonds have been adjusted for secondary market transactions.(2) Excludes rupee denominated Treasury bills held by foreign investors from 2008(3) Excludes Treasury bonds amounting to Rs. 78,447 million issued to settle dues to CPC in January 2012, Rs. 13,125
million issued to capitalize SriLankan Airlines in March 2013 and rupee denominated Treasury bonds held by foreigninvestors from 2007.
(4) Trusts, Benevolent, Pension and Provident Funds and the Employees’ Provident Fund(5) The Central Government, Local Authorities, State Corporations, Departmental and other official funds(6) Includes the value of Treasury Certificates of Deposits, Public Debt Sinking Funds (the investment fund with effect from
September 1971) and the National Housing Sinking Fund(7) Provisional
128
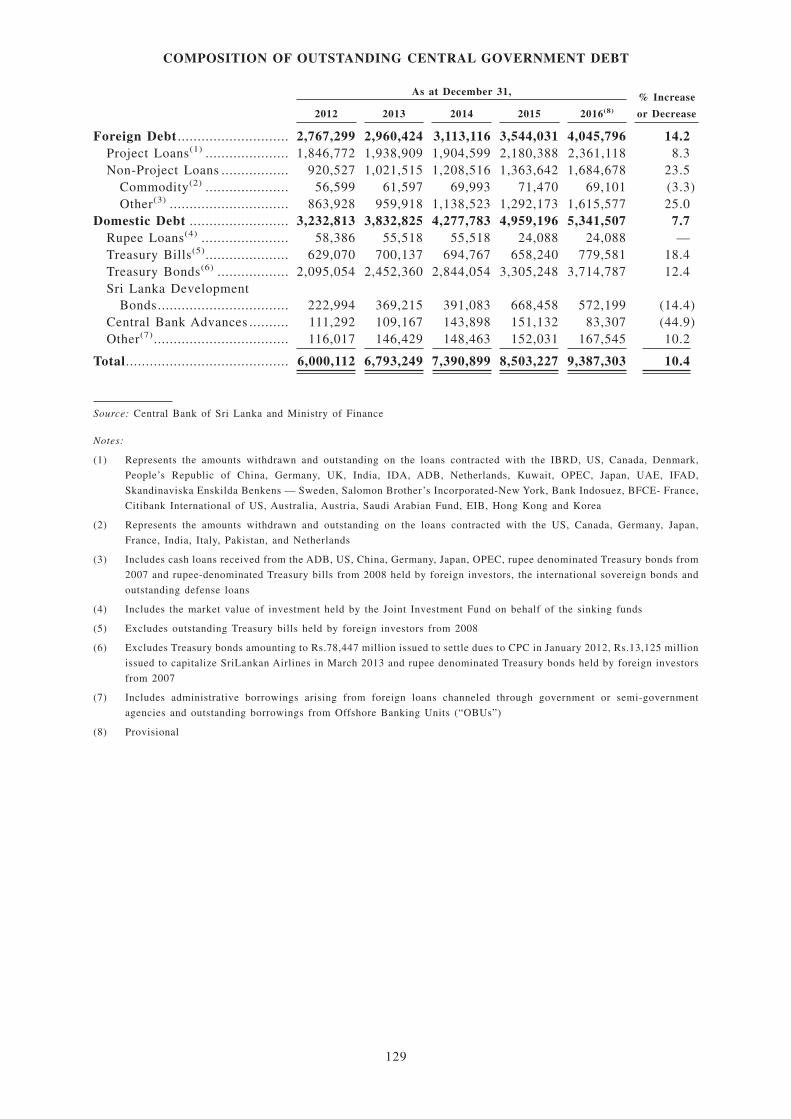
COMPOSITION OF OUTSTANDING CENTRAL GOVERNMENT DEBT
As at December 31, % Increase
or Decrease2012 2013 2014 2015 2016(8)
Foreign Debt ............................ 2,767,299 2,960,424 3,113,116 3,544,031 4,045,796 14.2Project Loans(1) ..................... 1,846,772 1,938,909 1,904,599 2,180,388 2,361,118 8.3Non-Project Loans ................. 920,527 1,021,515 1,208,516 1,363,642 1,684,678 23.5
Commodity(2) ..................... 56,599 61,597 69,993 71,470 69,101 (3.3)Other(3) .............................. 863,928 959,918 1,138,523 1,292,173 1,615,577 25.0
Domestic Debt ......................... 3,232,813 3,832,825 4,277,783 4,959,196 5,341,507 7.7Rupee Loans(4) ...................... 58,386 55,518 55,518 24,088 24,088 —Treasury Bills(5)..................... 629,070 700,137 694,767 658,240 779,581 18.4Treasury Bonds(6) .................. 2,095,054 2,452,360 2,844,054 3,305,248 3,714,787 12.4Sri Lanka Development
Bonds................................. 222,994 369,215 391,083 668,458 572,199 (14.4)Central Bank Advances .......... 111,292 109,167 143,898 151,132 83,307 (44.9)Other(7).................................. 116,017 146,429 148,463 152,031 167,545 10.2
Total......................................... 6,000,112 6,793,249 7,390,899 8,503,227 9,387,303 10.4
Source: Central Bank of Sri Lanka and Ministry of Finance
Notes:
(1) Represents the amounts withdrawn and outstanding on the loans contracted with the IBRD, US, Canada, Denmark,
People’s Republic of China, Germany, UK, India, IDA, ADB, Netherlands, Kuwait, OPEC, Japan, UAE, IFAD,
Skandinaviska Enskilda Benkens — Sweden, Salomon Brother’s Incorporated-New York, Bank Indosuez, BFCE- France,
Citibank International of US, Australia, Austria, Saudi Arabian Fund, EIB, Hong Kong and Korea
(2) Represents the amounts withdrawn and outstanding on the loans contracted with the US, Canada, Germany, Japan,
France, India, Italy, Pakistan, and Netherlands
(3) Includes cash loans received from the ADB, US, China, Germany, Japan, OPEC, rupee denominated Treasury bonds from
2007 and rupee-denominated Treasury bills from 2008 held by foreign investors, the international sovereign bonds and
outstanding defense loans
(4) Includes the market value of investment held by the Joint Investment Fund on behalf of the sinking funds
(5) Excludes outstanding Treasury bills held by foreign investors from 2008
(6) Excludes Treasury bonds amounting to Rs.78,447 million issued to settle dues to CPC in January 2012, Rs.13,125 million
issued to capitalize SriLankan Airlines in March 2013 and rupee denominated Treasury bonds held by foreign investors
from 2007
(7) Includes administrative borrowings arising from foreign loans channeled through government or semi-government
agencies and outstanding borrowings from Offshore Banking Units (“OBUs”)
(8) Provisional
129

OWNERSHIP OF OUTSTANDING FOREIGN DEBT (1)
As at December 31, % Increase
or decreaseSource 2012 2013 2014 2015 2016(1)
(in Rs. millions, except for percentages)
Multilateral .................................. 844,292 903,540 887,960 994,430 1,076,549 8.26%ADB ........................................... 448,421 478,796 471,762 533,806 569,686 6.72%EIB ............................................ 23,438 23,248 21,133 29,728 27,518 (7.43)%IBRD.......................................... 322 4,530 6,987 10,382 27,760 167.40%IDA ............................................ 349,997 373,085 363,052 391,149 417,636 6.77%IFAD .......................................... 16,013 17,419 17,098 18,631 21,520 15.51%OPEC ......................................... 2,699 2,998 4,783 7,547 9,309 23.34%Nordic Development Fund .......... 3,403 3,464 3,145 3,187 3,119 (2.14)%
Bi-lateral ...................................... 1,035,907 823,180 793,196 888,971 945,754 6.39%Canada ....................................... 8,269 7,409 6,339 5,373 5,275 (1.81)%France(2) ..................................... 24,273 26,861 24,698 25,406 24,448 (3.77)%Germany ..................................... 51,164 52,112 43,342 40,726 39,145 (3.88)%India........................................... 78,322 102,843 119,982 137,413 142,277 3.54%Japan .......................................... 547,515 468,366 416,408 457,483 486,199 6.28%Kuwait........................................ 6,194 5,749 5,357 6,765 7,774 14.92%Netherlands ................................ — — — — — —People’s Republic of China......... 67,434 67,154 87,743 117,284 131,604 12.21%Saudi Arabian Fund .................... 2,648 3,868 4,982 10,724 13,255 23.61%US.............................................. 41,386 38,854 35,246 34,594 31,798 (8.08)%Other .......................................... 208,702 49,963 49,100 53,205 63,978 20.25%
Financial Markets ........................ 887,100 1,233,704 1,431,959 1,660,630 2,023,493 21.85%Riggs National Bank................... 3,064 2,922 2,651 2,607 2,336 (10.42)%Indo-Suez Bank (France and
Stockholm) .............................. — — —Bankers’ Trust Co ....................... 356 275 184 101 _ (100.00)%France ........................................ — — — — _ —Solomon Bros. Inc. — New
York ........................................ — — — — _ —Citi Bank/NEXI .......................... — — — 201 _ (100.00)%Other(3)....................................... 883,680 1,230,507 1,429,125 1,657,721 2,021,157 21.92%
International Sovereign bonds . 445,063 457,636 655,243 958,014 1,220,870 27.44%Non-resident investments
in Treasury bills................... 80,184 73,916 55,500 5,045 12,816 154.03%in Treasury bonds ................ 317,604 403,486 401,710 298,734 247,222 (17.24)%
Other(3)....................................... 40,829 295,469 316,672 395,928 540,250 36.45%
Total.............................................. 2,767,300 2,960,424 3,113,116 3,544,031 4,045,796 14.16%
Source: Central Bank of Sri Lanka and Ministry of Finance
Notes:
(1) Provisional
(2) Includes loans from Financial Institutions
(3) Includes outstanding defense loans
130
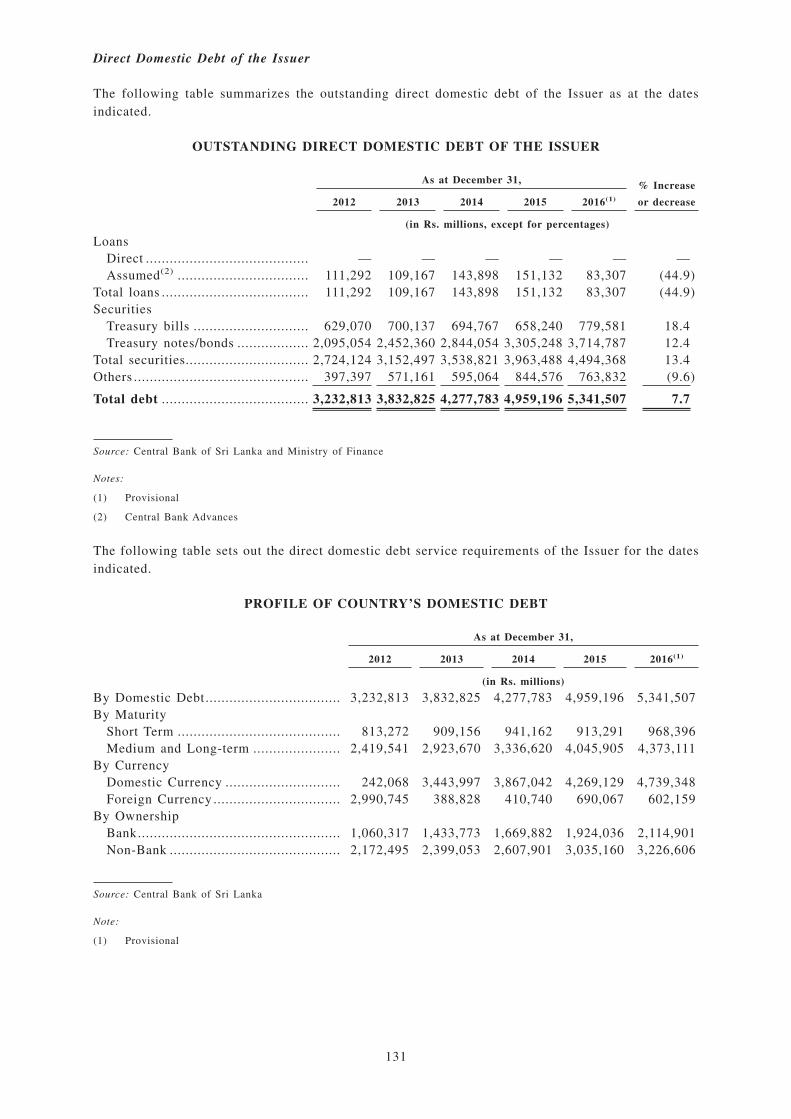
Direct Domestic Debt of the Issuer
The following table summarizes the outstanding direct domestic debt of the Issuer as at the datesindicated.
OUTSTANDING DIRECT DOMESTIC DEBT OF THE ISSUER
As at December 31, % Increase
or decrease2012 2013 2014 2015 2016(1)
(in Rs. millions, except for percentages)
LoansDirect ......................................... — — — — — —Assumed(2) ................................. 111,292 109,167 143,898 151,132 83,307 (44.9)
Total loans ..................................... 111,292 109,167 143,898 151,132 83,307 (44.9)Securities
Treasury bills ............................. 629,070 700,137 694,767 658,240 779,581 18.4Treasury notes/bonds .................. 2,095,054 2,452,360 2,844,054 3,305,248 3,714,787 12.4
Total securities............................... 2,724,124 3,152,497 3,538,821 3,963,488 4,494,368 13.4Others ............................................ 397,397 571,161 595,064 844,576 763,832 (9.6)
Total debt ..................................... 3,232,813 3,832,825 4,277,783 4,959,196 5,341,507 7.7
Source: Central Bank of Sri Lanka and Ministry of Finance
Notes:
(1) Provisional
(2) Central Bank Advances
The following table sets out the direct domestic debt service requirements of the Issuer for the datesindicated.
PROFILE OF COUNTRY’S DOMESTIC DEBT
As at December 31,
2012 2013 2014 2015 2016(1)
(in Rs. millions)
By Domestic Debt.................................. 3,232,813 3,832,825 4,277,783 4,959,196 5,341,507By Maturity
Short Term ......................................... 813,272 909,156 941,162 913,291 968,396Medium and Long-term ...................... 2,419,541 2,923,670 3,336,620 4,045,905 4,373,111
By CurrencyDomestic Currency ............................. 242,068 3,443,997 3,867,042 4,269,129 4,739,348Foreign Currency ................................ 2,990,745 388,828 410,740 690,067 602,159
By OwnershipBank................................................... 1,060,317 1,433,773 1,669,882 1,924,036 2,114,901Non-Bank ........................................... 2,172,495 2,399,053 2,607,901 3,035,160 3,226,606
Source: Central Bank of Sri Lanka
Note:
(1) Provisional
131
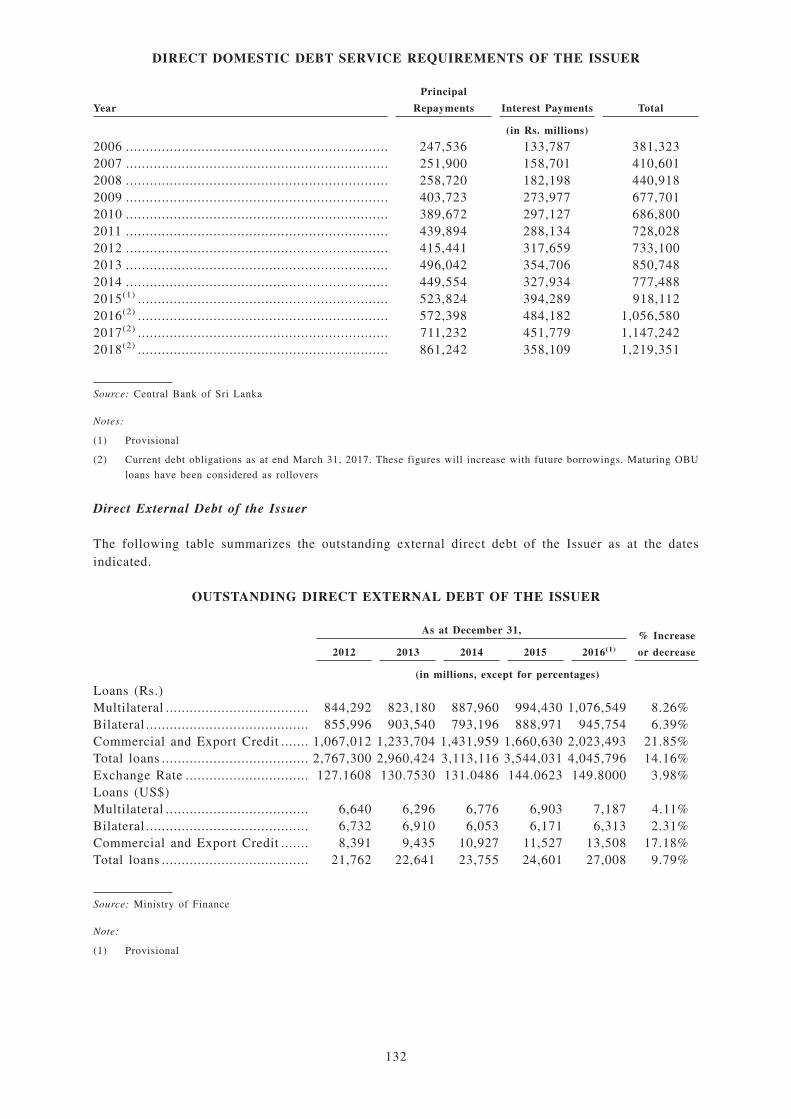
DIRECT DOMESTIC DEBT SERVICE REQUIREMENTS OF THE ISSUER
Year
Principal
Repayments Interest Payments Total
(in Rs. millions)
2006 .................................................................. 247,536 133,787 381,3232007 .................................................................. 251,900 158,701 410,6012008 .................................................................. 258,720 182,198 440,9182009 .................................................................. 403,723 273,977 677,7012010 .................................................................. 389,672 297,127 686,8002011 .................................................................. 439,894 288,134 728,0282012 .................................................................. 415,441 317,659 733,1002013 .................................................................. 496,042 354,706 850,7482014 .................................................................. 449,554 327,934 777,4882015(1) ............................................................... 523,824 394,289 918,1122016(2) ............................................................... 572,398 484,182 1,056,5802017(2) ............................................................... 711,232 451,779 1,147,2422018(2) ............................................................... 861,242 358,109 1,219,351
Source: Central Bank of Sri Lanka
Notes:
(1) Provisional
(2) Current debt obligations as at end March 31, 2017. These figures will increase with future borrowings. Maturing OBU
loans have been considered as rollovers
Direct External Debt of the Issuer
The following table summarizes the outstanding external direct debt of the Issuer as at the datesindicated.
OUTSTANDING DIRECT EXTERNAL DEBT OF THE ISSUER
As at December 31, % Increase
or decrease2012 2013 2014 2015 2016(1)
(in millions, except for percentages)
Loans (Rs.)Multilateral .................................... 844,292 823,180 887,960 994,430 1,076,549 8.26%Bilateral ......................................... 855,996 903,540 793,196 888,971 945,754 6.39%Commercial and Export Credit ....... 1,067,012 1,233,704 1,431,959 1,660,630 2,023,493 21.85%Total loans ..................................... 2,767,300 2,960,424 3,113,116 3,544,031 4,045,796 14.16%Exchange Rate ............................... 127.1608 130.7530 131.0486 144.0623 149.8000 3.98%Loans (US$)Multilateral .................................... 6,640 6,296 6,776 6,903 7,187 4.11%Bilateral ......................................... 6,732 6,910 6,053 6,171 6,313 2.31%Commercial and Export Credit ....... 8,391 9,435 10,927 11,527 13,508 17.18%Total loans ..................................... 21,762 22,641 23,755 24,601 27,008 9.79%
Source: Ministry of Finance
Note:
(1) Provisional
132
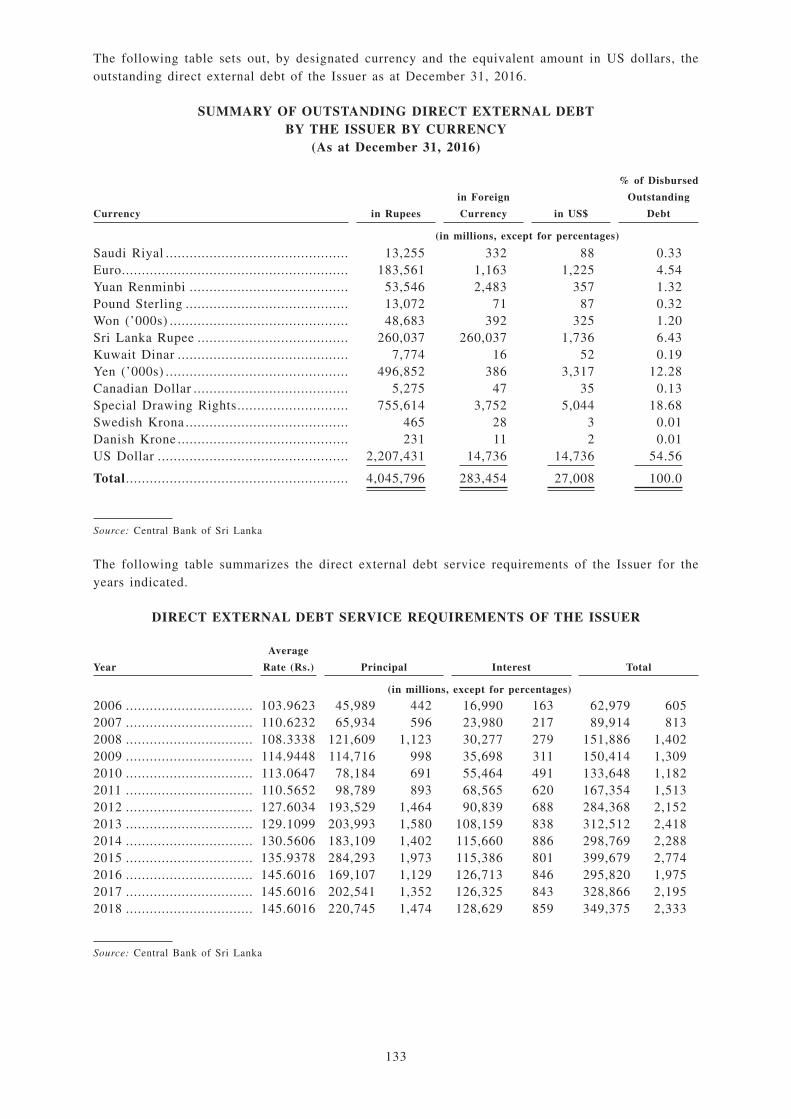
The following table sets out, by designated currency and the equivalent amount in US dollars, theoutstanding direct external debt of the Issuer as at December 31, 2016.
SUMMARY OF OUTSTANDING DIRECT EXTERNAL DEBTBY THE ISSUER BY CURRENCY
(As at December 31, 2016)
Currency in Rupees
in Foreign
Currency in US$
% of Disbursed
Outstanding
Debt
(in millions, except for percentages)
Saudi Riyal .............................................. 13,255 332 88 0.33Euro......................................................... 183,561 1,163 1,225 4.54Yuan Renminbi ........................................ 53,546 2,483 357 1.32Pound Sterling ......................................... 13,072 71 87 0.32Won (’000s) ............................................. 48,683 392 325 1.20Sri Lanka Rupee ...................................... 260,037 260,037 1,736 6.43Kuwait Dinar ........................................... 7,774 16 52 0.19Yen (’000s) .............................................. 496,852 386 3,317 12.28Canadian Dollar ....................................... 5,275 47 35 0.13Special Drawing Rights............................ 755,614 3,752 5,044 18.68Swedish Krona ......................................... 465 28 3 0.01Danish Krone ........................................... 231 11 2 0.01US Dollar ................................................ 2,207,431 14,736 14,736 54.56
Total........................................................ 4,045,796 283,454 27,008 100.0
Source: Central Bank of Sri Lanka
The following table summarizes the direct external debt service requirements of the Issuer for theyears indicated.
DIRECT EXTERNAL DEBT SERVICE REQUIREMENTS OF THE ISSUER
Year
Average
Rate (Rs.) Principal Interest Total
(in millions, except for percentages)
2006 ................................ 103.9623 45,989 442 16,990 163 62,979 6052007 ................................ 110.6232 65,934 596 23,980 217 89,914 8132008 ................................ 108.3338 121,609 1,123 30,277 279 151,886 1,4022009 ................................ 114.9448 114,716 998 35,698 311 150,414 1,3092010 ................................ 113.0647 78,184 691 55,464 491 133,648 1,1822011 ................................ 110.5652 98,789 893 68,565 620 167,354 1,5132012 ................................ 127.6034 193,529 1,464 90,839 688 284,368 2,1522013 ................................ 129.1099 203,993 1,580 108,159 838 312,512 2,4182014 ................................ 130.5606 183,109 1,402 115,660 886 298,769 2,2882015 ................................ 135.9378 284,293 1,973 115,386 801 399,679 2,7742016 ................................ 145.6016 169,107 1,129 126,713 846 295,820 1,9752017 ................................ 145.6016 202,541 1,352 126,325 843 328,866 2,1952018 ................................ 145.6016 220,745 1,474 128,629 859 349,375 2,333
Source: Central Bank of Sri Lanka
133
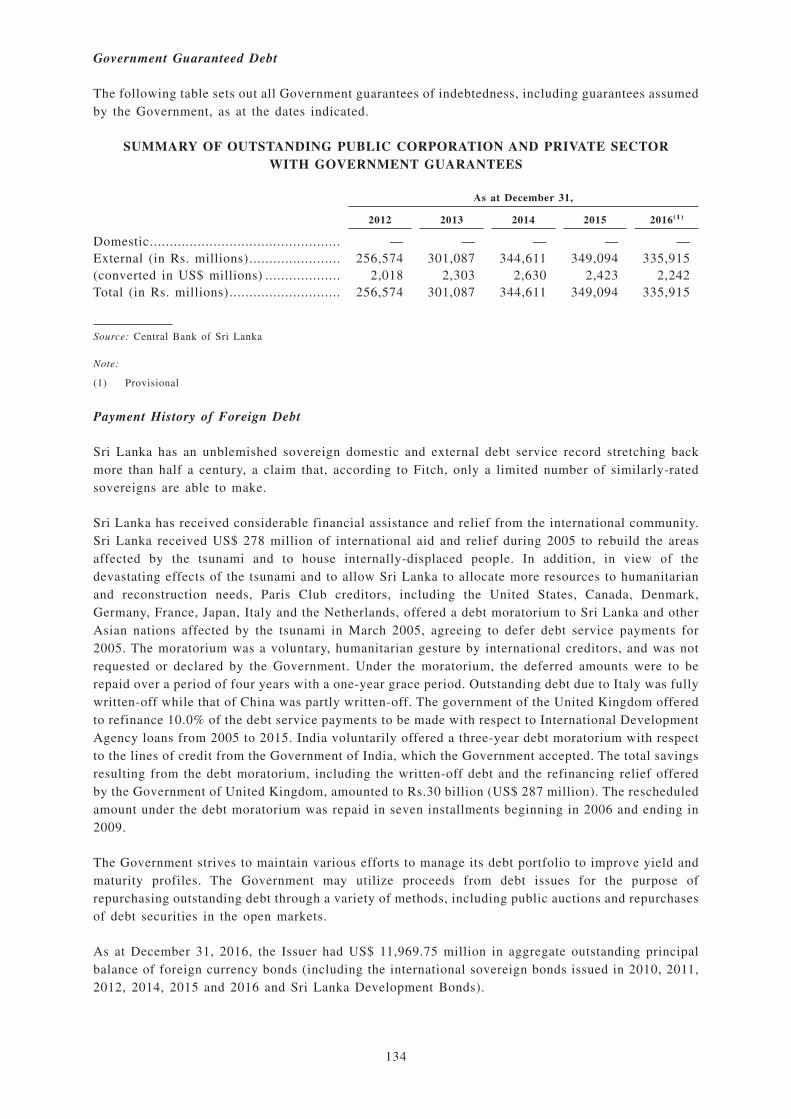
Government Guaranteed Debt
The following table sets out all Government guarantees of indebtedness, including guarantees assumedby the Government, as at the dates indicated.
SUMMARY OF OUTSTANDING PUBLIC CORPORATION AND PRIVATE SECTORWITH GOVERNMENT GUARANTEES
As at December 31,
2012 2013 2014 2015 2016(1)
Domestic................................................ — — — — —External (in Rs. millions)....................... 256,574 301,087 344,611 349,094 335,915(converted in US$ millions) ................... 2,018 2,303 2,630 2,423 2,242Total (in Rs. millions)............................ 256,574 301,087 344,611 349,094 335,915
Source: Central Bank of Sri Lanka
Note:
(1) Provisional
Payment History of Foreign Debt
Sri Lanka has an unblemished sovereign domestic and external debt service record stretching backmore than half a century, a claim that, according to Fitch, only a limited number of similarly-ratedsovereigns are able to make.
Sri Lanka has received considerable financial assistance and relief from the international community.Sri Lanka received US$ 278 million of international aid and relief during 2005 to rebuild the areasaffected by the tsunami and to house internally-displaced people. In addition, in view of thedevastating effects of the tsunami and to allow Sri Lanka to allocate more resources to humanitarianand reconstruction needs, Paris Club creditors, including the United States, Canada, Denmark,Germany, France, Japan, Italy and the Netherlands, offered a debt moratorium to Sri Lanka and otherAsian nations affected by the tsunami in March 2005, agreeing to defer debt service payments for2005. The moratorium was a voluntary, humanitarian gesture by international creditors, and was notrequested or declared by the Government. Under the moratorium, the deferred amounts were to berepaid over a period of four years with a one-year grace period. Outstanding debt due to Italy was fullywritten-off while that of China was partly written-off. The government of the United Kingdom offeredto refinance 10.0% of the debt service payments to be made with respect to International DevelopmentAgency loans from 2005 to 2015. India voluntarily offered a three-year debt moratorium with respectto the lines of credit from the Government of India, which the Government accepted. The total savingsresulting from the debt moratorium, including the written-off debt and the refinancing relief offeredby the Government of United Kingdom, amounted to Rs.30 billion (US$ 287 million). The rescheduledamount under the debt moratorium was repaid in seven installments beginning in 2006 and ending in2009.
The Government strives to maintain various efforts to manage its debt portfolio to improve yield andmaturity profiles. The Government may utilize proceeds from debt issues for the purpose ofrepurchasing outstanding debt through a variety of methods, including public auctions and repurchasesof debt securities in the open markets.
As at December 31, 2016, the Issuer had US$ 11,969.75 million in aggregate outstanding principalbalance of foreign currency bonds (including the international sovereign bonds issued in 2010, 2011,2012, 2014, 2015 and 2016 and Sri Lanka Development Bonds).
134
DESCRIPTION OF THE BONDS
The Bonds will be issued pursuant to an indenture (the “Indenture”) to be dated as at May 11, 2017between the Issuer and HSBC Bank USA, National Association as trustee for the Holders of the Bonds(the “Bonds Trustee”) and as registrar, paying and transfer agent. The following is a summary of thematerial provisions of the Bonds and the Indenture. This summary does not purport to be complete andis qualified in its entirety by reference to all of the provisions of the Indenture and the Bonds. It doesnot restate those agreements in their entirety. Whenever particular sections or defined terms of theIndenture not otherwise defined herein are referred to, such sections or defined terms are incorporatedherein by reference.
General
The Bonds will constitute direct, unconditional, unsubordinated and unsecured general obligations ofthe Issuer and will at all times rank pari passu among themselves in all respects, without anypreference of one over the other by reason of priority of date of issue or otherwise, and will at all timesrank at least equally with all other present and future unsecured and unsubordinated ExternalIndebtedness. The full faith and credit of Sri Lanka will be pledged for the due and punctual paymentof the principal of, and interest on, the Bonds.
Principal, Interest and Maturity
The Bonds will be issued in an aggregate principal amount of US$1,500,000,000 and will mature onMay 11, 2027 (the “Bonds Maturity Date”). Interest on the Bonds will be payable semi-annually inarrears on May 11 and November 11 of each year, commencing on November 11, 2017 (each, a “BondsInterest Payment Date”) to persons in whose names the Bonds are registered at the close of businesson the fifteenth calendar day preceding each Bonds Interest Payment Date. The Bonds will bearinterest at the rate of 6.20% per annum from and including May 11, 2017 or from the most recentBonds Interest Payment Date to which interest has been paid or provided to, and to and excluding, theBonds Maturity Date. Interest on the Bonds will be calculated on the basis of a 360-day yearconsisting of twelve 30-day months. Unless previously purchased or canceled as described herein, theBonds shall mature on the Bonds Maturity Date, and on the Bonds Maturity Date, the Holders of theBonds shall be entitled to a payment equal to the principal amount of the Outstanding Bonds on theBonds Maturity Date plus accrued and unpaid interest. The Bonds will not be redeemable prior tomaturity and will not be entitled to the benefit of any sinking fund.
Any payment of principal or interest otherwise required to be made in respect of a Bond on a date thatis not a Business Day need not be made on such date, but may be made on the next succeedingBusiness Day with the same force and effect as if made on such date, and no additional interest shallaccrue for the period from and after such date as a result of such delayed payment. “Business Day”means each Monday, Tuesday, Wednesday, Thursday and Friday that is not a day on which bankinginstitutions in London, New York or Singapore are authorized or obligated by law or executive orderto close.
Persons in whose name a registered Bond is held are herein referred to as “Bond Holders”.
The Bonds will be issued only in fully registered form, without coupons, in minimum denominationsof US$200,000 and integral multiples of US$1,000 in excess thereof.
Additional Amounts
The Issuer will make all payments on the Bonds without withholding or deducting any present orfuture taxes (“Taxes”) imposed by Sri Lanka or any of its political subdivisions, unless such deductionor withholding is required by law. If Sri Lankan law requires the Issuer to deduct or withhold Taxes,it will pay the Bond Holders such additional amounts as are necessary to ensure that they receive thesame amount as they would have received without such withholding or deduction.
135
The Issuer will not pay, however, any additional amounts if the Bond Holder or beneficial owner ofthe Bonds is liable for Sri Lankan Tax because:
• the Bond Holder or beneficial owner is connected with Sri Lanka other than by merely owningthe Bonds or receiving income or payments on the Bonds; or
• upon reasonable request by the Issuer or its agent, the Bond Holder or beneficial owner failedto comply in a timely manner with any certification, identification or other reporting requirementconcerning the Bond Holder’s or beneficial owner’s nationality, residence, identity or connectionwith Sri Lanka, if compliance with such requirement is required by any statute or regulation ofSri Lanka as a precondition to exemption from withholding or deduction of Taxes; or
• the Bond Holder failed to present its Bonds for payment (where presentation is required) within30 days of when the payment is due or when the Issuer makes available to the Bond Holder orthe Bonds Trustee a payment of principal or interest, whichever is later. Nevertheless, the Issuerwill pay additional amounts to the extent the Bond Holder would have been entitled to suchamounts had it presented its Bonds for payment on the last day of the 30 day period; or
• any combination of the above.
The obligation to pay such additional amounts shall not apply to (a) any estate, inheritance, gift, sales,transfer, personal property or any similar tax, assessment or other governmental charge or (b) any tax,assessment or other governmental charge which is payable otherwise than by deduction or withholdingfrom payments of principal of or interest on the Bonds; provided that, except as otherwise set forthin the Bonds and in the Indenture, the Issuer shall pay all stamp and other duties, if any, which maybe imposed by Sri Lanka or any political subdivision thereof or any taxing authority of or in theforegoing, with respect to the Indenture or as a consequence of the initial issuance of the Bonds.
Any reference in the Bonds to principal or interest shall be deemed also to refer to any additionalamounts which may be payable with respect thereto as described above.
Further Issues
The Issuer may from time to time, without notice to or the consent of the Holders, issue further bonds(“Additional Bonds”) having terms and conditions the same as the Bonds or the same in all respectsother than with respect to the date of issuance, issue price and first Bonds Interest Payment Dateapplicable to such Additional Bonds. The Issuer may consolidate such Additional Bonds with theOutstanding Bonds to form a single series and class for all purposes under the Indenture; provided thatAdditional Bonds that are so consolidated with the Outstanding Bonds must be fungible with theOutstanding Bonds for U.S. federal income tax purposes.
Limitation on Liens
So long as any Bonds remain Outstanding, the Issuer shall not create, incur, assume or permit tosubsist any Lien upon the whole or any part of its present or future assets or revenues to secure (1)any Public External Indebtedness; (2) any Guarantees in respect of Public External Indebtedness; or(3) the Public External Indebtedness of any other person, without at the same time or prior theretosecuring the Bonds equally and ratably therewith or providing such other arrangement (whether or notcomprising a Lien) as shall be approved by not less than 66 2/3% of the aggregate principal amountof Outstanding Bonds which are represented at a meeting of Bond Holders duly convened inaccordance with the Indenture.
Certain Definitions
“External Indebtedness” means Indebtedness expressed or denominated or payable, or which, at theoption of the relevant creditor, may be payable in or by reference to any currency other than the lawfulcurrency of Sri Lanka.
136
“Guarantee” means any obligation of a person to pay the Indebtedness of another person including(without limitation):
(a) an obligation to pay or purchase such Indebtedness;
(b) an obligation to lend money, to purchase or subscribe for shares or other securities or to purchaseassets or services, in order to provide funds for the payment of such Indebtedness;
(c) any indemnity against the consequences of a default in the payment of such Indebtedness; or
(d) any other agreement to be responsible for such Indebtedness;
“Indebtedness” means all unsecured, unsubordinated obligations of the Issuer or any Public SectorInstrumentality (whether present or future) in respect of money borrowed or raised (including moneyraised by forward sale or purchase agreements, acceptances and leasing or under any other transactionhaving the commercial effect of a borrowing) and any guarantee given by the Issuer in respect ofmoney borrowed by others. “Indebtedness” shall not include the borrowings of any Public SectorInstrumentality so long as such Indebtedness does not carry the full faith and credit of Sri Lanka.
“Lien” means any lien, pledge, mortgage, security interest, deed of trust, charge or other encumbranceor preferential arrangement which has the practical effect of constituting a security interest withrespect to the payment of any obligations with or from the proceeds of any assets or revenues of anykind, whether in effect on the date the Indenture becomes effective or at any time thereafter.
“Outstanding” means any Bond authenticated and delivered pursuant to the Indenture, as at any dateof determination, except: (1) Bonds theretofore canceled by the Bonds Trustee or delivered to theBonds Trustee for cancellation or held by the Bonds Trustee for reissuance but not reissued by theBonds Trustee; (2) Bonds which have been called for redemption in accordance with their terms orwhich have become due and payable at maturity or otherwise and with respect to which moniessufficient to pay the principal thereof (and, premium, if any) and any interest thereon shall have beenmade available to the Bonds Trustee; or (3) Bonds in lieu of or in substitution for which other Bondsshall have been authenticated and delivered pursuant to the Indenture; provided, however, that indetermining whether the Bond Holders of the requisite principal amount of Outstanding Bonds arepresent at a meeting of Bond Holders for quorum purposes or have consented to or voted in favor ofany request, demand, authorization, direction, notice, consent, waiver, amendment, modification orsupplement hereunder, Bonds owned, directly or indirectly, by the Issuer or any Public SectorInstrumentality shall be disregarded and deemed not to be Outstanding, except that in determiningwhether the Bonds Trustee shall be protected in relying upon any such request, demand, authorization,direction, notice, consent, waiver, amendment, modification or supplement, only Bonds which theBonds Trustee knows to be so owned shall be so disregarded.
“person” means any individual, company, corporation, firm, partnership, joint venture, association,organization, state or agency of a state or other entity, whether or not having a separate legalpersonality.
“Public External Indebtedness” means any External Indebtedness of, or guaranteed by, Sri Lanka,which (1) is publicly offered or privately placed in securities markets, (2) is in the form of, or isrepresented by, bonds, notes, debentures or other securities or instruments or any guarantees thereofand (3) is, or was intended at the time of issue to be, or is eligible to be, quoted, listed on any stockexchange, automated trading system or traded on any over-the-counter or other established securitiesmarket (including securities eligible for sale pursuant to Rule 144A under the Securities Act (or anysuccessor law or regulation of similar effect)).
137
“Public Sector Instrumentality” means the Central Bank of Sri Lanka (the “Central Bank”) and anydepartment, ministry or agency of the central government of Sri Lanka or any corporation, trust,financial institution or other entity owned or controlled by the central government of Sri Lanka or anyof the foregoing, and “control” means the power, directly or indirectly, through the ownership ofvoting securities or other ownership interests or otherwise, to direct the management of or elect orappoint a majority of the board of directors or other persons performing similar functions in lieu of,or in addition to, the board of directors of a corporation, trust, financial institution or entity.
Exceptions
The following exceptions apply to the Issuer’s obligations under “— Limitation on Liens”:
(a) any Lien upon property to secure Public External Indebtedness incurred for the purpose offinancing the acquisition of such property and any renewal and extension of such Lien which islimited to the original property covered thereby and which (in either case) secures any renewalor extension of the original secured financing;
(b) any Lien existing on any property or asset at the time of its acquisition (or arising after itsacquisition pursuant to an agreement entered into prior to, and not in contemplation of, suchacquisition), and extensions and renewals of such Lien limited to the original property or assetcovered thereby and securing any extension or renewal of the original secured financing;
(c) any Lien arising by operation of law, provided that any such Lien is not created or permitted tobe created by the Issuer to secure any Public External Indebtedness; and
(d) any Lien securing Public External Indebtedness incurred for the purpose of financing all or partof the costs of the acquisition, construction or development of a project; provided that (i) theholders of such Public External Indebtedness expressly agree to limit their recourse to the assetsand revenues of such project or the proceeds of insurance thereon as the principal source ofrepayments of such Public External Indebtedness and (ii) the property over which such Lien isgranted consists solely of such assets and revenues.
The Central Bank holds International Monetary Assets, including gold and foreign exchange. Becausethe Central Bank is a judicial entity separate from the Issuer, the Issuer believes that the limitationon liens covenant described herein does not apply to the International Monetary Assets held by theCentral Bank. The Central Bank could therefore incur Public External Indebtedness secured byInternational Monetary Assets without securing amounts payable under the Bonds.
Events of Default
The occurrence and continuance of any of the following will constitute events of default (“Events ofDefault”) with respect to the Bonds:
(1) Non-payment
The Issuer fails to pay any interest or principal on any of the Bonds when due and payable and suchfailure continues for a period of 7 days (in the case of principal) or 30 days (in the case of interest),or
(2) Breach of other obligations
The Issuer fails to duly observe or perform any of the other covenants or agreements contained in theBonds or in the Indenture for a period of 30 days after the date on which written notice specifying suchfailure and demanding that the Issuer remedy the same shall have been given to the Issuer by theBonds Trustee or to the Issuer and the Bonds Trustee by the Bond Holders of at least 25.0% of theaggregate principal amount of the Outstanding Bonds, or
138
(3) Cross-default
(a) any External Indebtedness shall become (or shall become capable of being declared) due andpayable prior to its stated maturity (otherwise than at the option of the Issuer); or
(b) any default shall occur in the payment of principal of, or premium or prepayment charge (if any)or interest on, any External Indebtedness when and as the same shall become due and payableif such default shall continue for more than the period of grace, if any, originally applicablethereto; or
(c) any default shall occur in the payment when due and called upon (after the expiry of anyoriginally applicable grace period) of any Guarantee of the Issuer in respect of any ExternalIndebtedness of any other person, provided that the aggregate amount of the relevant ExternalIndebtedness in respect of which one or more of the events mentioned in this paragraph (3) haveoccurred equals or exceeds US$25.0 million (or its equivalent in any other currency orcurrencies), or
(4) Moratorium
A general moratorium on the payment of principal of or interest on or the performance of theobligation in respect of the External Indebtedness of the Issuer shall be declared by the Issuer, or
(5) IMF Membership
The Issuer shall cease to be a member of the IMF or shall cease to be eligible to use the generalresources of the IMF, or
(6) Validity
The validity of the Bonds shall be contested by the Issuer or any legislative or executive body orofficial of Sri Lanka which is authorized in each case by law to do so and, acting alone or togetherwith another such body or official, has the legal power and authority to declare the Bonds invalid orunenforceable, or the Issuer shall deny any of its obligations under the Bonds (whether by a generalsuspension of payments or a moratorium on the payment of debt or otherwise), or any constitutionalprovision, treaty, convention, law, regulation, official communique, decree, ordinance or policy of SriLanka or any final and non-appealable decision by any court in Sri Lanka having jurisdiction, shallpurport to render any provision of the Bonds invalid or unenforceable or shall purport to prevent ordelay the performance or observance by the Issuer of any of its obligations thereunder, or
(7) Revocation of Authority
Any constitutional provision, treaty, convention, law, regulation, ordinance, decree, consent, approval,license or other authority necessary to enable the Issuer to make or perform its obligations under theBonds or for the validity or enforceability thereof, shall expire, be withheld, revoked, terminated orotherwise cease to remain in full force and effect or remain valid and subsisting, or shall be modifiedin a manner which adversely affects or will adversely affect any rights or claims of any of the BondHolders, or
(8) International Monetary Assets
The Issuer or the Central Bank shall not at any time exercise full ownership, power and control overany of their International Monetary Assets as they exist from time to time (unless, prior to theoccurrence of such an event, a public sector entity has substantially all powers and assets of theCentral Bank (including, without limitation, all of its International Monetary Assets) and performs thefunctions of a central bank and shall assume and acquire such assets, powers and functions).
If any of the above Events of Default occurs and is continuing, then the Bonds Trustee or the BondHolders of not less than 25.0% in aggregate principal amount of the Bonds then Outstanding by noticein writing to the Issuer (and to the Bonds Trustee if such notice is given by the Bond Holders) may,
139
and the Bonds Trustee at the written direction of the Bond Holders, subject to being indemnified toits satisfaction, shall, declare the principal amount of all such Bonds to be immediately due andpayable whereupon they shall become immediately due and payable at their principal amount togetherwith accrued interest without further formality unless such Event of Default shall have been remediedprior to the receipt of such notice by the Bonds Trustee.
At any time after such a declaration of acceleration has been made and before a judgment or decreefor payment of the money due has been obtained by the Bonds Trustee, the Bond Holders of a majorityin principal amount of the Outstanding Bonds, by written notice to the Issuer and the Bonds Trustee,may rescind and annul such declaration and its consequences in accordance with the terms andconditions of the Indenture.
Definitions
“International Monetary Assets” means all (1) gold, (2) Special Drawing Rights, (3) Reserve Positionin the Fund and (4) Foreign Exchange, and the terms “Special Drawing Rights,” “Reserve Position inthe Fund” and “Foreign Exchange” have, as to the type of assets included, the meaning given to themin the IMF’s publication entitled “International Financial Statistics” or such other meanings as shallbe formally adopted by the IMF from time to time.
Redemption, Repurchase and Cancellation
Unless previously purchased and canceled, the Bonds will be redeemed at their principal amount onthe Bonds Maturity Date. The Issuer may at any time purchase the Bonds by tender (available to allBond Holders alike) or in the open market or otherwise at any price. If the Issuer shall acquire anyBonds, such acquisition shall not operate as or be deemed for any purpose to be a satisfaction of theindebtedness represented by such Bonds unless and until such Bonds are delivered to the BondsTrustee for cancellation and are canceled and retired by the Bonds Trustee.
Modifications and Amendments; Meetings of Holders
A meeting of the Bond Holders may be called by the Bonds Trustee at any time. The Issuer or the BondHolders of at least 10.0% in aggregate principal amount of the Outstanding Bonds may call a meetingif the Issuer or such Bond Holders have requested the Bonds Trustee in writing to call such a meetingand the Bonds Trustee has not given notice of such a meeting within 20 days of receiving the request.Notices of meetings must include (a) the time and place of the meeting, (b) a general description ofthe action proposed to be taken at the meeting, (c) whether modifications will be proposed under aSingle Series Extraordinary Resolution, a Single Series Written Resolution, Multiple Series SingleLimb Extraordinary Resolution, a Multiple Series Two Limb Extraordinary Resolution, a MultipleSeries Single Limb Written Resolution or a Multiple Series Two Limb Written Resolution and, ifrelevant, in relation to which other series of debt securities it applies, (d) if the proposed modificationor action relates to two or more series of debt securities issued by the Issuer and contemplates suchseries of debt securities being aggregated in more than one group of debt securities, a description ofthe proposed treatment of each such group of debt securities, (e) such information that is required tobe provided by the Issuer pursuant to “ — Information”, (f) the identity of the Aggregation Agent andthe Calculation Agent for any proposed modification or action to be voted on at the meeting, and thedetails of any applicable methodology referred to in “Aggregation Agent; Aggregation Procedures”;and (g) any additional procedures which may be necessary and, if applicable, the conditions underwhich a cross series aggregation will be deemed to have been satisfied if it is approved as to somebut not all of the affected series of debt securities. Such notices must be given not less than 30 daysnor more than 60 days before the date of the meeting, except that notices of meetings reconvened afteradjournment must be given not less than 10 days nor more than 60 days before the date of the meeting.Any modifications to or waivers in respect of the Indenture or the Bonds will be conclusive and
140
binding on all Bond Holders, whether or not they have given their consent (unless required under theIndenture) or were present at any duly held meeting. To be entitled to vote at any meeting of BondHolders, a person shall be a Bond Holder of Outstanding Bonds or, in the case of registered Bonds,a person duly appointed by an instrument in writing as proxy for such a Bond Holder.
In addition, the Indenture contains provisions relating to Written Resolutions. All information to beprovided in a notice convening any meeting as set forth above shall also be provided, mutatismutandis, in respect of Written Resolutions.
A “record date” in relation to any proposed modification or action means the date fixed by the Issuerfor determining the Bond Holders and, in the case of a multiple series aggregation, the holders of debtsecurities of each other affected series that are entitled to vote on a Multiple Series Single LimbExtraordinary Resolution or a Multiple Series Two Limb Extraordinary Resolution, or to sign aMultiple Series Single Limb Written Resolution or a Multiple Series Two Limb Written Resolution.
An “Extraordinary Resolution” means any of a Single Series Extraordinary Resolution, a MultipleSeries Single Limb Extraordinary Resolution and/or a Multiple Series Two Limb ExtraordinaryResolution, as the case may be.
A “Written Resolution” means any of a Single Series Written Resolution, a Multiple Series SingleLimb Written Resolution and/or a Multiple Series Two Limb Written Resolution, as the case may be.
Any reference to “debt securities” means any notes, bonds (including the Bonds), debentures or otherdebt securities issued by the Issuer in one or more series with an original stated maturity of more thanone year.
“Debt Securities Capable of Aggregation” means those debt securities which include or incorporate byreference the provisions described in “Modifications and Amendments; Meetings of Holders” and“Aggregation Agent; Aggregation Procedures” or provisions substantially in these terms whichprovide for the debt securities which include such provisions to be capable of being aggregated forvoting purposes with other series of debt securities.
Modification of this Series of Bonds only
At any meeting of Bond Holders, other than a meeting to discuss a Reserved Matter, the personsentitled to vote a majority of the aggregate principal amount of the Outstanding Bonds shall constitutea quorum, and at the reconvening of any such meeting adjourned for a lack of a quorum, the personsentitled to vote 25.0% of the aggregate principal amount of the Outstanding Bonds shall constitute aquorum for the taking of any action set forth in the notice of the original meeting. At any meeting ofBond Holders held to discuss a Reserved Matter, the persons entitled to vote 75.0% of the aggregateprincipal amount of the Outstanding Bonds shall constitute a quorum, and at the reconvening of anysuch meeting adjourned for a lack of quorum, the persons entitled to vote 75.0% of the aggregateprincipal amount of the Outstanding Bonds shall constitute a quorum for the taking of any action setforth in the original meeting. The Bonds Trustee may make such reasonable and customary regulationsas it shall deem advisable for any meeting of Bond Holders with respect to the appointment of proxiesin respect of Bond Holders of registered Bonds, the record date for determining the registered ownersof registered Bonds who are entitled to vote at such meeting (which date shall be set forth in the noticecalling such meeting hereinabove referred to and which shall be not less than 15 nor more than 30 daysprior to such meeting), the adjournment and chairmanship of such meeting, the appointment and dutiesof inspectors of votes, the submission and examination of proxies, certificates and other evidence ofthe right to vote and such other matters concerning the conduct of the meeting as it shall deemappropriate.
Any modification of any provision of, or any action in respect of, the terms of the Bonds or theIndenture in respect of the Bonds may be made or taken if approved by a Single Series ExtraordinaryResolution or a Single Series Written Resolution as set out below.
141
A “Single Series Extraordinary Resolution” means a resolution passed at a meeting of Bond Holdersduly convened and held in accordance with the procedures prescribed by the Indenture by a majorityof:
(a) in the case of a Reserved Matter, at least 75.0% of the aggregate principal amount of theOutstanding Bonds; or
(b) in the case of a matter other than a Reserved Matter, more than 50.0% of the aggregate principalamount of the Outstanding Bonds (unless such meeting is adjourned for a lack of a quorum, inwhich case a majority of at least 25.0% of the aggregate principal amount of the OutstandingBonds shall be sufficient).
A “Single Series Written Resolution” means a resolution in writing signed or confirmed in writing byor on behalf of the Bond Holders of:
(a) in the case of a Reserved Matter, at least 75.0% of the aggregate principal amount of theOutstanding Bonds; or
(b) in the case of a matter other than a Reserved Matter, more than 50.0% of the aggregate principalamount of the Outstanding Bonds.
Any Single Series Extraordinary Resolution duly passed or Single Series Written Resolution approvedshall be binding on all Bond Holders, whether or not they attended any meeting, whether or not theyvoted in favor thereof and whether or not they signed or confirmed in writing any such Single SeriesWritten Resolution, as the case may be.
Multiple Series Aggregation — Single limb voting
In relation to a proposal that includes a Reserved Matter, any modification to the terms and conditionsof, or any action with respect to, two or more series of Debt Securities Capable of Aggregation maybe made or taken if approved by a Multiple Series Single Limb Extraordinary Resolution or by aMultiple Series Single Limb Written Resolution as set out below, provided that the UniformlyApplicable condition is satisfied.
A “Multiple Series Single Limb Extraordinary Resolution” means a resolution considered at separatemeetings of the holders of each affected series of Debt Securities Capable of Aggregation, dulyconvened and held in accordance with the procedures prescribed by the Indenture, as supplemented ifnecessary, which is passed by a majority of at least 75% of the aggregate principal amount of theoutstanding debt securities of all affected series of Debt Securities Capable of Aggregation (taken inaggregate).
A “Multiple Series Single Limb Written Resolution” means each resolution in writing (with a separateresolution in writing or multiple separate resolutions in writing distributed to the holders of eachaffected series of Debt Securities Capable of Aggregation, in accordance with the applicable bonddocumentation) which, when taken together, has been signed or confirmed in writing by or on behalfof the holders of at least 75% of the aggregate principal amount of the outstanding debt securities ofall affected series of Debt Securities Capable of Aggregation (taken in aggregate). Any Multiple SeriesSingle Limb Written Resolution may be contained in one document or several documents insubstantially the same form, each signed or confirmed in writing by or on behalf of one or more BondHolders or one or more holders of each affected series of debt securities.
Any Multiple Series Single Limb Extraordinary Resolution duly passed or Multiple Series SingleLimb Written Resolution approved shall be binding on all Bond Holders and holders of each otheraffected series of Debt Securities Capable of Aggregation, whether or not they attended any meeting,whether or not they voted in favor thereof, whether or not any other holder or holders of the sameseries voted in favor thereof and whether or not they signed or confirmed in writing any such MultipleSeries Single Limb Written Resolution, as the case may be.
142

The “Uniformly Applicable” condition will be satisfied if:
(a) the holders of all affected series of Debt Securities Capable of Aggregation are invited toexchange, convert, or substitute their debt securities, on the same terms, for (x) the same newinstrument or other consideration or (y) a new instrument, new instruments or otherconsideration from an identical menu of instruments or other consideration; or
(b) the amendments proposed to the terms and conditions of each affected series of Debt SecuritiesCapable of Aggregation would, following implementation of such amendments, result in theamended instruments having identical provisions (other than provisions which are necessarilydifferent, having regard to different currency of issuance).
It is understood that a proposal will not be considered to satisfy the Uniformly Applicable conditionif each exchanging, converting, substituting or amending holder of each affected series of DebtSecurities Capable of Aggregation is not offered the same amount of consideration per amount ofprincipal, the same amount of consideration per amount of interest accrued but unpaid and the sameamount of consideration per amount of past due interest, respectively, as that offered to each otherexchanging, converting, substituting or amending holder of each affected series of Debt SecuritiesCapable of Aggregation (or, where a menu of instruments or other consideration is offered, eachexchanging, converting, substituting or amending holder of each affected series of Debt SecuritiesCapable of Aggregation is not offered the same amount of consideration per amount of principal, thesame amount of consideration per amount of interest accrued but unpaid and the same amount ofconsideration per amount of past due interest, respectively, as that offered to each other exchanging,converting, substituting or amending holder of each affected series of Debt Securities Capable ofAggregation electing the same option from such menu of instruments).
Any modification or action proposed under a Multiple Series Single Limb Extraordinary Resolutionor a Multiple Series Single Limb Written resolution may be made in respect of some series only ofthe Debt Securities Capable of Aggregation and, for the avoidance of doubt, the provisions describedin “ — Multiple Series Aggregation — Single Limb Voting” may be used for different groups of twoor more series of Debt Securities Capable of Aggregation simultaneously.
Multiple Series Aggregation — Two limb voting
In relation to a proposal that includes a Reserved Matter, any modification to the terms and conditionsof, or any action with respect to, two or more series of Debt Securities Capable of Aggregation maybe made or taken if approved by a Multiple Series Two Limb Extraordinary Resolution or by aMultiple Series Two Limb Written Resolution as set out below.
A “Multiple Series Two Limb Extraordinary Resolution” means a resolution considered at separatemeetings of the holders of each affected series of Debt Securities Capable of Aggregation, dulyconvened and held in accordance with the procedures prescribed by the Indenture, as supplemented ifnecessary, which is passed by a majority of:
(a) at least 66 2/3% of the aggregate principal amount of the outstanding debt securities of all theaffected series of Debt Securities Capable of Aggregation (taken in aggregate); and
(b) more than 50.0% of the aggregate principal amount of the outstanding debt securities in eachaffected series of Debt Securities Capable of Aggregation (taken individually).
A “Multiple Series Two Limb Written Resolution” means each resolution in writing (with a separateresolution in writing or multiple separate resolutions in writing distributed to the holders of eachaffected series of Debt Securities Capable of Aggregation, in accordance with the applicable bonddocumentation) which, when taken together, has been signed or confirmed in writing by or on behalfof the holders of:
(a) at least 66 2/3% of the aggregate principal amount of the outstanding debt securities of all theaffected series of Debt Securities Capable of Aggregation (taken in aggregate); and
143
(b) more than 50.0% of the aggregate principal amount of the outstanding debt securities in eachaffected series of Debt Securities Capable of Aggregation (taken individually).
Any Multiple Series Two Limb Extraordinary Resolution duly passed or Multiple Series Two LimbWritten Resolution approved shall be binding on all Bond Holders and holders of each other affectedseries of Debt Securities Capable of Aggregation, whether or not they attended any meeting, whetheror not they voted in favor thereof, whether or not any other holder or holders of the same series votedin favor thereof and whether or not they signed or confirmed in writing any such Multiple Series TwoLimb Written Resolution, as the case may be.
Any modification or action proposed under a Multiple Series Two Limb Extraordinary Resolution ora Multiple Series Two Limb Written Resolution may be made in respect of some series only of theDebt Securities Capable of Aggregation and, for the avoidance of doubt, the provisions described in“ — Multiple Series Aggregation — Two Limb Voting” may be used for different groups of two or moreseries of Debt Securities Capable of Aggregation simultaneously.
Reserved Matters
“Reserved Matters” consist of any modification, amendment, supplement or waiver of the Indentureor the terms and conditions of the Bonds that would (a) change the due date for the payment of theprincipal of, or any installment of interest on, any Bond, (b) reduce the principal amount of, or theportion of such principal amount which is payable upon acceleration of the maturity of, or the interestrate on, any Bond, (c) change the coin or currency in which or the required places at which paymentwith respect to interest or principal in respect of Bonds is payable, (d) permit the Issuer to redeem theBonds prior to the Bonds Maturity Date, (e) reduce the proportion of the principal amount of Bondsthe vote or consent of the Bond Holders of which is necessary to modify, amend or supplement theIndenture or the terms and conditions of the Bonds or to make, take or give any request, demand,authorization, direction, notice, consent, waiver or other action provided in the Indenture or the Bondsto be made, taken or given, or change the definition of “Outstanding” with respect to the Bonds, (f)change the obligation of the Issuer to pay additional amounts with respect to the Bonds, (g) changethe governing law provision of the Bonds, (h) change the courts to the jurisdiction of which the Issuerhas submitted, the Issuer’s obligation to appoint and maintain an Authorized Agent in the Borough ofManhattan, The City of New York, or the Issuer’s waiver of immunity, in respect of actions orproceedings brought by any Bond Holder based upon the Bonds, (i) in connection with an exchangeoffer for the Bonds, amend any Event of Default (as defined in the Indenture), (j) change the paripassu ranking of the Bonds, (k) change this definition, or the definition of “Extraordinary Resolution”,“Single Series Extraordinary Resolution”, “Multiple Series Single Limb Extraordinary Resolution”,“Multiple Series Two Limb Extraordinary Resolution”, “Written Resolution”, “Single Series WrittenResolution”, “Multiple Series Single Limb Written Resolution” or “Multiple Series Two Limb WrittenResolution”, (l) change the definition of “debt securities” or “Debt Securities Capable ofAggregation”, (m) change the definition of “Uniformly Applicable” and (n) change the definition of“Outstanding” or to modify the provisions set forth in “Aggregation Agent; Aggregation Procedures”.
Information
Prior to or on the date that the Issuer proposes any Extraordinary Resolution or Written Resolution asdescribed in “ — Modification of this Series of Bonds only”, “ — Multiple Series Aggregation — SingleLimb Voting” or “ — Multiple Series Aggregation — Two Limb Voting”, the Issuer shall publish inaccordance with “Aggregation Agent — Manner of Publication”, and provide the Bonds Trustee withthe following information:
(a) a description of the Issuer’s economic and financial circumstances which are, in the Issuer’sopinion, relevant to the request for any potential modification or action, a description of theIssuer’s existing debts and a description of its broad policy reform program and provisionalmacroeconomic outlook;
144
(b) if the Issuer shall at the time have entered into an arrangement for financial assistance withmultilateral and/ or other major creditors or creditor groups and/or an agreement with any suchcreditors regarding debt relief, a description of any such arrangement or agreement. Wherepermitted under the information disclosure policies of the multilateral or such other creditors, asapplicable, a copy of the arrangement or agreement shall be provided;
(c) a description of the Issuer’s proposed treatment of external debt securities that fall outside thescope of any multiple series aggregation and its intentions with respect to any other debtsecurities and its other major creditor groups; and
(d) if any proposed modification or action contemplates debt securities being aggregated in morethan one group of debt securities, a description of the proposed treatment of each such group, asrequired for a notice convening a meeting of the Bond Holders.
Claims Valuation
For the purpose of calculating the par value of the Bonds and any affected series of debt securitieswhich are to be aggregated with the Bonds as described in “ — Multiple Series Aggregation — SingleLimb Voting” or “ — Multiple Series Aggregation — Two Limb Voting”, the Issuer may appoint aCalculation Agent. The Issuer shall, with the approval of the Aggregation Agent and any appointedCalculation Agent, promulgate the methodology in accordance with which the par value of the Bondsand such affected series of debt securities will be calculated. In any such case where a CalculationAgent is appointed, the same person will be appointed as the Calculation Agent for the Bonds and eachother affected series of debt securities for these purposes, and the same methodology will bepromulgated for each affected series of debt securities.
Other Modifications
The Indenture and the Bonds may be modified or amended, without the consent of the Bond Holders,to:
• add covenants of the Issuer that benefit the Bond Holders;
• surrender any right or power conferred upon the Issuer;
• secure the Bonds;
• cure any ambiguity or correct or supplement any defective provision in the Indenture or theBonds; or
• amend the Indenture or the Bonds in any other manner which the Issuer and the Bonds Trusteemay determine and which are not inconsistent with the provisions of the Bonds and will notadversely affect the interests of any Bond Holder in any material respect.
It is not necessary for the Bond Holders to approve the particular form of any proposed modificationof the Indenture, but it is sufficient if that consent approves the substance of the proposedmodification. The Issuer may at any time purchase Bonds in the open market or otherwise at any price.Bonds owned by the Issuer or any Public Sector Instrumentality will not be considered Outstandingfor the purpose of determining whether the requisite aggregate principal amount of Bonds hasconcurred in any request, demand, notice, consent or waiver under the Indenture.
145
Bonds controlled by the Issuer
For the purposes of (i) determining the right to attend and vote at any meeting of Bond Holders, orthe right to sign or confirm in writing, or authorize the signature of, any Written Resolution, (ii) theIndenture and (iii) Events of Default, any Bonds which are for the time being held by or on behalf ofthe Issuer or by or on behalf of any person which is owned or controlled directly or indirectly by theIssuer or by any Public Sector Instrumentality shall be disregarded and be deemed not to remainOutstanding.
A Bond will also be deemed to be not Outstanding if the Bond has previously been cancelled ordelivered for cancellation or held for reissuance but not reissued, or, where relevant, the Bond haspreviously been called for redemption in accordance with its terms or previously become due andpayable at maturity or otherwise and the Issuer has previously satisfied its obligations to make allpayments due in respect of the Bond in accordance with its terms.
In advance of any meeting of Bond Holders, or in connection with any Written Resolution, the Issuershall provide to the Aggregation Agent a copy of the certificate prepared by the Aggregation Agentdescribed in “ — Aggregation Agent; Aggregation Procedures — Certificate,” which includesinformation on the total number of Bonds which are for the time being held by or on behalf of theIssuer or by or on behalf of any person which is owned or controlled directly or indirectly by the Issueror by any Public Sector Instrumentality of the Issuer and, as such, such Bonds shall be disregardedand deemed not to remain Outstanding for the purposes of ascertaining the right to attend and vote atany meeting of Bond Holders or the right to sign, or authorize the signature of, any Written Resolutionin respect of any such meeting. The Aggregation Agent shall make any such certificate available forinspection during normal business hours at its specified office and, upon reasonable request, willallow copies of such certificate to be taken.
Publication
The Issuer shall publish all Extraordinary Resolutions and Written Resolutions which have beendetermined by the Aggregation Agent to have been duly passed in accordance with the noticeprovisions described in “Aggregation Agent; Aggregation Procedures — Manner of Publication.”
Exchange and Conversion
Any Extraordinary Resolutions or Written Resolutions which have been duly passed and which modifyany provision of, or action in respect of, the terms of the Bonds may be implemented at the Issuer’soption by way of a mandatory exchange or conversion of the Bonds and each other affected series ofdebt securities, as the case may be, into new debt securities containing the modified terms andconditions if the proposed mandatory exchange or conversion of the Bonds is notified to Bond Holdersat the time notification is given to the Bond Holders as to the proposed modification or action. Anysuch exchange or conversion shall be binding on all Bond Holders.
Aggregation Agent; Aggregation Procedures
Appointment
The Issuer will appoint an Aggregation Agent to calculate whether a proposed modification or actionhas been approved by the required principal amount of the Outstanding Bonds, and, in the case of amultiple series aggregation, by the required principal amount of outstanding debt securities of eachaffected series of debt securities. In the case of a multiple series aggregation, the same person will beappointed as the Aggregation Agent for the proposed modification of any provision of, or any actionin respect of, the terms of the Bonds or the Indenture (including the schedules thereto) in respect ofthe Bonds and in respect of the terms and conditions or bond documentation in respect of each otheraffected series of debt securities. The Aggregation Agent shall be independent of the Issuer.
146
Extraordinary Resolutions
If an Extraordinary Resolution has been proposed at a duly convened meeting of Bond Holders tomodify any provision of, or action in respect of, the terms of the Bonds and other affected series ofdebt securities, as the case may be, the Aggregation Agent will, as soon as practicable after the timethe vote is cast, calculate whether holders of a sufficient portion of the aggregate principal amount ofthe Outstanding Bonds and, where relevant, each other affected series of debt securities, have votedin favor of the Extraordinary Resolution such that the Extraordinary Resolution is passed. If so, theAggregation Agent will determine that the Extraordinary Resolution has been duly passed.
Written Resolutions
If a Written Resolution has been proposed under the terms of the Bonds to modify any provision of,or action in respect of, the terms of the Bonds and the terms and conditions of other affected seriesof debt securities, as the case may be, the Aggregation Agent will, as soon as reasonably practicableafter the relevant Written Resolution has been signed or confirmed in writing, calculate whetherholders of a sufficient portion of the aggregate principal amount of the Outstanding Bonds and, whererelevant, each other affected series of debt securities, have signed or confirmed in writing in favor ofthe Written Resolution such that the Written Resolution is passed. If so, the Aggregation Agent willdetermine that the Written Resolution has been duly passed.
Certificate
For the purposes of this section “Aggregation Agent; Aggregation Procedures”, the Issuer will providea certificate to the Aggregation Agent up to three days prior to, and in any case no later than, withrespect to an Extraordinary Resolution, the date of the meeting referred to, as applicable, and, withrespect to a Written Resolution, the date arranged for the signing of the Written Resolution.
The certificate shall:
(a) list the total principal amount of the Bonds and, in the case of a multiple series aggregation, thetotal principal amount of each other affected series of debt securities outstanding on the recorddate; and
(b) clearly indicate the Bonds which shall be disregarded and deemed not to remain Outstanding and,in the case of a multiple series aggregation, debt securities of each other affected series of debtsecurities which shall be disregarded and deemed not to remain outstanding on the record dateidentifying the holders of the Bonds and, in the case of a multiple series aggregation, debtsecurities of each other affected series of debt securities.
The Aggregation Agent may rely upon the terms of any certificate, notice, communication or otherdocument believed by it to be genuine.
Notification
The Aggregation Agent will cause each determination made by it for the purposes of this section“Aggregation Agent; Aggregation Procedures” to be notified to the Bonds Trustee and the Issuer assoon as practicable after such determination. Notice thereof shall also promptly be given to the BondHolders in accordance with the Indenture.
Binding nature of determinations; no liability
All notifications, opinions, determinations, certificates, calculations, quotations and decisions given,expressed, made or obtained for the purposes of this section “Aggregation Agent; AggregationProcedures” and any appointed Calculation Agent will (in the absence of manifest error) be bindingon the Issuer, the Bonds Trustee, the Bond Holders and (subject as aforesaid) no liability to any suchperson will attach to the Aggregation Agent or the Calculation Agent in connection with the exerciseor non-exercise by it of its powers, duties and discretions for such purposes.
147
Manner of publication
The Issuer will publish all notices and other matters required to be published pursuant to the termsof the Bonds and the Indenture including all Extraordinary Resolutions and Written Resolutions whichhave been determined by the Aggregation Agent to have been duly passed:
(a) on www.cbsl.gov.lk;
(b) through DTC, Euroclear, Clearstream, Luxembourg and any other clearing system in which theBonds are held;
(c) in such other places and in such other manner as may be required by applicable law or regulation;and
(d) in such other places and in such other manner as may be customary.
Waiver of Certain Covenants
The Issuer may omit in any particular instance to comply with any covenant or condition set forthunder “Limitation on Liens” if before the time for such compliance the Bond Holders of at least amajority in principal amount of the Outstanding Bonds shall, in accordance with the terms of theIndenture, either waive such compliance in such instance or generally waive compliance with suchcovenant or condition, but no such waiver shall extend to or affect such covenant or condition exceptto the extent so expressly waived, and, until such waiver shall become effective, the obligations of theIssuer and the duties of the Bonds Trustee in respect of any such covenant or condition shall remainin full force and effect.
The Issuer will not, directly or indirectly, pay or cause to be paid any consideration, whether by wayof interest, fee or otherwise, to any Bond Holder for or as an inducement to any consent, waiver oramendment of any of the terms or provisions of the Indenture or of the Bonds unless suchconsideration is offered to be paid or agreed to be paid to all Bond Holders that consent, waive oragree to amend in the time frame set forth in the solicitation documents relating to such consent,waiver or agreement.
Notices
Where the Indenture provides for notice to Bond Holders of any event, such notice shall be sufficientlygiven (unless otherwise expressly provided in the Indenture) (a) for so long as the Bonds arerepresented by a Global Bond held on behalf of DTC, if sent electronically to DTC (or itsrepresentatives) or (b) if the Bonds are not represented by a Global Bond held on behalf of DTC, ifin writing and mailed, first-class postage prepaid, to each Bond Holder affected by such event, at hisaddress as it appears in the Security Register and published once in a leading daily newspaper ofgeneral circulation in London and in a leading daily newspaper of general circulation in the UnitedStates or, under certain limited circumstances, in other English language newspapers of generalcirculation in Europe or the United States. Any such Notice shall be deemed to have been given onthe later of the date of such publication and the seventh day after being so mailed, as the case maybe.
Trustee; Paying Agent; Transfer Agent
The Bonds Trustee may resign at any time or may be removed by act of the Bond Holders of a majorityin principal amount of the Outstanding Bonds. If the Bonds Trustee resigns, is removed or becomesincapable of acting as Bonds Trustee or if a vacancy occurs in the office of the Bonds Trustee for anyreason, a successor Bonds Trustee will be appointed in accordance with the provisions of theIndenture.
The corporate trust office of the Bonds Trustee as at the date hereof is located at 452 Fifth Avenue,New York, NY 10018-2706, United States. The Paying Agent and Transfer Agent are appointed inaccordance with the Indenture and, as initially appointed, are set forth on the inside back cover hereof.
148
Governing Law and Jurisdiction
The Bonds and the Indenture will be governed by and construed in accordance with the laws of theState of New York. The Issuer will submit to the non-exclusive jurisdiction of any State or FederalCourt in the Borough of Manhattan, the City of New York and the courts of Sri Lanka (the “SpecifiedCourts”) in any action arising out of or based on the Bonds brought by any Bond Holder of a Bond(a “Related Proceeding”). The Issuer will waive any objection to Related Proceedings in such courtswhether on the grounds of venue, residence or domicile or on the ground that the Related Proceedingshave been brought in an inconvenient forum. The Issuer will agree that a final non-appealablejudgment obtained in any such Related Proceeding (a “Related Judgment”) shall be conclusive andbinding upon it and, may be enforced in any Specified Court or in any other courts to the jurisdictionof which the Issuer is or may be subject, by a suit upon such judgment or appropriate enforcementproceedings in Sri Lanka.
Waiver of Immunity
To the extent that the Issuer or any of its revenues, assets or properties are entitled, in any jurisdictionin which any Specified Court is located, in which any Related Proceeding may at any time be broughtagainst it or any of its revenues, assets or properties, or in any jurisdiction in which any SpecifiedCourt is located in which any suit, action or proceeding may at any time be brought solely for thepurpose of enforcing or executing any Related Judgment, to any immunity from suit, from set-off,from the jurisdiction of any such court, from attachment prior to judgment, from attachment in aid ofexecution of a judgment, from execution of a judgment or from any other legal or judicial process orremedy, and to the extent that in any such jurisdiction there shall be attributed such an immunity, theIssuer will irrevocably agree not to claim and will irrevocably waive such immunity to the fullestextent permitted by the laws of such jurisdiction (and will consent generally for the purposes of theU.S. Foreign Sovereign Immunities Act of 1976, as amended, to the giving of any relief or the issueof any process in connection with any Related Proceeding or Related Judgment). The waiver ofimmunities given above constitutes only a limited and specific waiver for the purposes of the Bondsand under no circumstances shall it be interpreted as a general waiver by the Issuer or a waiver withrespect to proceedings unrelated to the payment under the Bonds. The Issuer will not waive suchimmunity in respect of (i) present or future “premises of the mission” as defined in the ViennaConvention on Diplomatic Relations signed in 1961; (ii) “consular premises” as defined in the ViennaConvention on Consular Relations signed in 1963; (iii) military property or military assets or propertyor assets of Sri Lanka related thereto; or (iv) properties and assets located in Sri Lanka and used solelyor mainly for public or governmental purposes.
The Global Bonds
The Bonds sold outside the United States in offshore transactions in reliance on Regulation S underthe Securities Act, subject to certain exceptions, will be represented by one or more global Bonds infully registered form, without coupons (collectively, the “Regulation S Global Bonds”).
The Regulation S Global Bonds will be registered in the name of a nominee of DTC and deposited witha custodian for DTC for the accounts of Euroclear and Clearstream, Luxembourg.
The Bonds sold in reliance on Rule 144A under the Securities Act, subject to certain exceptions, willbe represented by one or more global certificates in fully registered form, without coupons(collectively, the “Rule 144A Global Bonds,” and together with the Regulation S Global Bonds, the“Global Bonds”).
The Rule 144A Global Bonds will be registered in the name of a nominee of DTC and deposited withHSBC Bank USA, National Association as custodian for DTC. The Rule 144A Global Bonds will besubject to certain restrictions on transfer as set forth in a legend appearing thereon as described in“Notice to Investors.”
149
Interests in a Rule 144A Global Bond may be transferred to a person who takes delivery in the formof an interest in a Regulation S Global Bond only upon receipt by the Bonds Trustee of, among otherthings, a written certification (in the form provided for in the Indenture) from the transferor.
Any interest in one Global Bond will, upon transfer and delivery in the form of an interest in anotherGlobal Bond, cease to be an interest in the first Global Bond and become an interest in the otherGlobal Bond and, accordingly, will thereafter be subject to all of its transfer restrictions and otherprocedures for as long as it remains such an interest. Interests in the Bonds represented by such GlobalBonds will be shown on, and transfers thereof will be effected only through, records maintained byDTC, Euroclear and Clearstream, Luxembourg, and their respective direct and indirect participants.
DTC, as registered Bond Holder of such Global Bond, will be considered the sole owner or BondHolder of the Bonds represented by such Global Bond for all purposes under such Bonds and theIndenture, unless otherwise provided therein.
Payments of principal and interest on any Global Bond will be made in accordance with the settlementand clearing procedures of DTC. None of the Issuer, the Bonds Trustee or any Paying Agent orTransfer Agent will have any responsibility or liability for any aspect of any participant’s records,policies or procedures relating to, or for payments made on account of, beneficial interests in a GlobalBond or for any other aspect of the relationship between DTC, Euroclear or Clearstream, Luxembourg,as the case may be, and their participants, or for maintaining, supervising or reviewing any recordsrelating to such beneficial interests.
All payments on principal and interest on the Global Bonds will be made in immediately availablefunds.
The Issuer expects that DTC or its nominee, upon receipt of any payment of principal or interest, willcredit participants’ accounts with payments in amounts proportionate to their respective beneficialinterests in the principal amount of such Global Bonds as shown on the records of DTC. The Issueralso expects that the payments by participants to owners of beneficial interests in such Global Bondsheld through such participants will be governed by standing instructions and customary practices, asis now the case with securities held for the account of customers registered in “street names,” and willbe the responsibility of such participants.
Depositary Procedures
The following description of the operations and procedures of DTC, Euroclear and Clearstream,Luxembourg are provided solely as a matter of convenience. These operations and procedures aresolely within the control of the respective settlement systems and are subject to change by them fromtime to time. The Issuer and the Bonds Trustee take no responsibility for these operations andprocedures and urge investors to contact the system or their participants directly to discuss thesematters.
DTC, Euroclear and Clearstream, Luxembourg have advised the Issuer as follows:
DTC. The Issuer understands that DTC is a limited purpose trust company organized under the lawsof the State of New York, a member of the Federal Reserve System, a “clearing corporation” withinthe meaning of the New York Uniform Commercial Code, and a “clearing agency” registered pursuantto the provisions of Section 17A of the Exchange Act. DTC was created to hold securities for itsparticipants and to facilitate the clearance and settlement of securities transactions among itsparticipants in such securities through electronic book entry changes in accounts of its participants,thereby eliminating the need for physical movement of securities certificates. DTC’s participantsinclude securities brokers and dealers, banks, trust companies, clearing corporations, and certain otherorganizations, some of whom own DTC, and may include the Initial Purchasers. Indirect access to theDTC system is also available to others that clear through or maintain a custodial relationship with a
150
DTC participant, either directly or indirectly. Transfers of ownership or other interests in Bonds heldby DTC may be made only through DTC participants. In addition, beneficial owners of Bonds held byDTC will receive all distributions of principal of and interest on the Bonds from the Trustee throughsuch DTC participant.
Euroclear. Euroclear advises that it was created in 1968 to hold securities for its participants and toclear and settle transactions between its participants through simultaneous electronic book entrydelivery against payment, thereby eliminating the need for physical movement of securitiescertificates and any risk from lack of simultaneous transfers of securities and cash. Euroclear providesvarious other services, including securities lending and borrowing, and interfaces with domesticmarkets in several countries. Euroclear is operated by the Brussels, Belgium office of MorganGuaranty Trust Company of New York (the “Euroclear Operator”), under contract with EuroclearClearance Systems, S.C., a Belgian cooperative corporation (the “Cooperative”). All operations areconducted by the Euroclear Operator, and all Euroclear securities clearance accounts and Euroclearcash accounts are accounts with the Euroclear Operator, not the Cooperative. The Cooperativeestablishes policy for Euroclear on behalf of Euroclear participants. Euroclear participants includebanks (including central banks), securities brokers and dealers and other professional financialintermediaries and may include the Initial Purchasers. Indirect access to Euroclear is also available toothers that clear through or maintain a custodial relationship with a Euroclear participant, eitherdirectly or indirectly.
The Euroclear Operator is the Belgian branch of a New York banking corporation which is a memberbank of the United States Federal Reserve System. As such, it is regulated and examined by the Boardof Governors of the United States Federal Reserve System and the New York State BankingDepartment, as well as the Belgian Banking Commission.
Bonds clearance accounts and cash accounts with the Euroclear Operator are governed by the Termsand Conditions Governing Use of Euroclear and the related Operating Procedures of the EuroclearSystem, and applicable Belgian law (collectively, the “Terms and Conditions”). The Terms andConditions govern transfers of securities and cash within Euroclear, withdrawals of securities and cashfrom Euroclear, and receipts of payments with respect to securities in Euroclear. All securities inEuroclear are held on a fungible basis without attribution of specific certificates to specific securitiesclearance accounts. The Euroclear Operator acts under the Terms and Conditions only on behalf ofEuroclear participants and has no record of or relationship with persons holding through Euroclearparticipants.
Distributions with respect to Bonds held beneficially through Euroclear will be credited to the cashaccounts of Euroclear participants in accordance with the Terms and Conditions, to the extent receivedby Euroclear.
Clearstream, Luxembourg. Clearstream, Luxembourg advises that it is incorporated under the laws ofThe Grand Duchy of Luxembourg as a professional depositary. Clearstream, Luxembourg holdssecurities for its participants and facilitates the clearance and settlement of securities transactionsbetween its participants through electronic book-entry changes in accounts of its participants, therebyeliminating the need for physical movement of securities certificates. Clearstream, Luxembourgprovides to its participants, among other things, services for safekeeping, administration, clearanceand settlement of internationally traded securities and securities lending and borrowing. Clearstream,Luxembourg interfaces with domestic markets in several countries. As a professional depositary,Clearstream, Luxembourg is subject to regulation by the Luxembourg Monetary Institute. Clearstream,Luxembourg participants are financial institutions around the world, including securities brokers anddealers, banks, trust companies, clearing corporations and certain other organizations and may includethe Initial Purchasers. Indirect access to Clearstream, Luxembourg is also available to others that clearthrough or maintain a custodial relationship with a Clearstream, Luxembourg participant eitherdirectly or indirectly.
Distributions with respect to Bonds held beneficially through Clearstream, Luxembourg will becredited to cash accounts of Clearstream, Luxembourg participants in accordance with its rules andprocedures, to the extent received by Clearstream, Luxembourg.
151
Settlement and Clearance
Initial settlement for the Bonds will be made in same-day funds. Transfers between participants inDTC will be effected in accordance with DTC’s procedures, which currently provide for settlement insame-day funds. Transfers between participants in Euroclear and Clearstream, Luxembourg will beeffected in the ordinary way in accordance with their respective rules and operating procedures.
Ownership of beneficial interests in a Global Bond will be limited to persons who have accounts withDTC participants or persons who hold interests through participants. Upon the issuance of a GlobalBond, DTC or its custodian will credit, on its internal system, the respective principal amount of thebeneficial interests represented by such Global Bond to the accounts of its participants. Such accountinitially will be designated by or on behalf of the Initial Purchasers. Ownership of beneficial interestsin a Global Bond will be shown only on, and the transfer of such ownership interests will be effectedonly through, records maintained by DTC or its nominee (with respect to interests of participants), orby any such participant (with respect to interests of persons held by such participants on their behalf).
Payments, transfers, exchanges and other matters relating to beneficial interests in a Global Bond maybe subject to various policies and procedures adopted by DTC, Euroclear or Clearstream, Luxembourg,as the case may be, from time to time.
Subject to compliance with the transfer restrictions applicable to the Bonds described above and under“Notice to Investors” below, cross-market transfers of Bonds between DTC, on the one hand, andEuroclear or Clearstream, Luxembourg, on the other hand, will be effected in DTC in accordance withDTC rules on behalf of Euroclear or Clearstream, Luxembourg, as the case may be, by its respectivedepositary; however, such cross-market transactions will require delivery instructions to Euroclear orClearstream, Luxembourg, as the case may be, by the counterpart in such system in accordance withits rules and procedures and within its established deadlines (Brussels time). Each of Euroclear orClearstream, Luxembourg, as the case may be, will, if the transaction meets its settlementrequirements, deliver instructions to its respective depositary to take action to effect final settlementon its behalf by delivering or receiving interests in the Regulation S Global Bonds in DTC, and makingor receiving payment in accordance with normal procedures for same-day funds settlement applicableto DTC. Clearstream, Luxembourg accountholders and Euroclear accountholders may not deliverinstructions directly to the depositaries for Clearstream, Luxembourg or Euroclear.
Because of time zone differences, the securities account of a Euroclear or Clearstream, Luxembourgaccountholder purchasing an interest in the Bonds from a DTC participant will be credited during thesecurities settlement processing day (which must be a business day for Euroclear and Clearstream,Luxembourg) immediately following the DTC settlement date, and such credit of any transactions ininterests in a Global Bond settlement during such processing day will be reported to the relevantEuroclear or Clearstream, Luxembourg accountholder on such day. Cash received in Euroclear orClearstream, Luxembourg as a result of sales of interests in a Global Bond by or through a Euroclearor Clearstream, Luxembourg accountholder to a DTC participant will be received with value on theDTC settlement date but will be available in the relevant Euroclear or Clearstream, Luxembourg cashaccount only as at the business day following settlement in DTC. Settlement between Euroclear orClearstream, Luxembourg accountholders and DTC participants cannot be made on a delivery versuspayment basis. The arrangements for transfer of payments must be established separately from thearrangements for transfer of securities, the latter being effected on a free delivery basis. Thecustomary arrangements for delivery versus payment between Euroclear and Clearstream,Luxembourg accountholders or between DTC participants are not affected.
Although DTC, Euroclear and Clearstream, Luxembourg have agreed to the procedures describedabove in order to facilitate transfers of interests in the Global Bonds among participants of DTC,Euroclear and Clearstream, Luxembourg, they are under no obligation to perform or continue toperform such procedures and such procedures may be modified or discontinued at any time. None ofthe Issuer, the Bonds Trustee or any of their respective agents will have any responsibility for theperformance by DTC, Euroclear or Clearstream, Luxembourg or their respective participants orindirect participants of their respective obligations under the rules and procedures governing theiroperations.
152
Definitive Bonds
Beneficial interests in any Global Bond may be exchanged for definitive (i.e., non-global) Bonds infully registered form, without coupons (collectively, the “Definitive Bonds” and each, a “DefinitiveBond”) only in the event that (1) DTC notifies the Issuer in writing at any time that DTC is unwillingor unable to continue as depositary or ceases to be a “clearing agency” registered under the ExchangeAct, and a successor is not appointed by the Issuer within 90 days after the Issuer is notified by DTCor (2) the Bonds have become immediately due and payable pursuant to the Indenture.
Payment of the principal of any Definitive Bond shall be made, upon presentation and surrender ofsuch Bond, by check drawn on a bank in The City of New York at the option of the Bond Holder,either:
(A) AT THE CORPORATE TRUST OFFICE OF THE BONDS TRUSTEE, OR
(B) SUBJECT TO ANY APPLICABLE LAWS OR REGULATIONS AND THE RIGHT OF THEISSUE TO TERMINATE THE APPOINTMENT OF ANY PAYING AGENT, AT THEOFFICES OF SUCH OTHER PAYING AGENTS AS THE ISSUER MAY DESIGNATEFROM TIME TO TIME.
Unless the manner of payment is otherwise agreed by the Issuer and the Bonds Trustee, payments ofinterest on any Definitive Bond shall be made solely in Dollars by check drawn on a bank in The Cityof New York, mailed to the address of the person entitled thereto as such address shall appear on theSecurity Register. The Issuer and the Bonds Trustee may deem and treat the Bond Holder in whosename a Definitive Bond is registered at the close of business on the fifteenth day preceding such BondsInterest Payment Date as the absolute owner of the Definitive Bond (notwithstanding any notice ofownership or other writing on such Definitive Bond) for the purposes of receiving payment on suchDefinitive Bond or on account of such Definitive Bond and for all other purposes.
The Bond Holders of Definitive Bonds shall present directly at the corporate trust office of the BondsTrustee or of any other Transfer Agent, all requests for the registration of any transfer of suchDefinitive Bonds, for the exchange of such Definitive Bonds for one or more new Definitive Bondsin the like aggregate principal amount and in authorized denominations and for the replacement ofsuch Definitive Bonds in cases of mutilation, destruction, loss or theft. Every certificate representingDefinitive Bonds presented or surrendered for registration of transfer or for exchange shall be dulyendorsed, or be accompanied by a written instrument of transfer in form satisfactory to the Issuer andthe Bonds Trustee, duly executed by the Bond Holder thereof or his attorney duly authorized inwriting. The registration of any transfer of Definitive Bonds in the Security Register is also subjectto any reasonable requirements of the Issuer and the Bonds Trustee. Except for the expenses ofdelivery other than by regular mail, no service charge shall be made for any exchange or registrationof transfer, but the Issuer may require payment of a sum sufficient to cover any stamp tax or otherGovernmental charge payable in connection therewith.
The Indenture provides that Definitive Bonds will be issued to replace Definitive Bonds which havebeen mutilated, destroyed, stolen or lost upon payment of certain costs associated with suchreplacement and on certain terms as to evidence and indemnity. In the case of destroyed, stolen or lostDefinitive Bonds, replacement Definitive Bonds will not be issued if either the Issuer or the BondsTrustee has notice that such Definitive Bonds have been acquired by a bona fide purchaser. MutilatedDefinitive Bonds must be surrendered before replacements will be issued. In the event any suchmutilated, destroyed, stolen or lost Definitive Bond has become or is about to become due andpayable, the issuer in its discretion may, instead of issuing a new Definitive Bond, pay or cause to bepaid such Definitive Bond.
153
All Definitive Bonds issued as a result of any partial or whole transfer, exchange or replacement ofBonds will be delivered to the Bond Holder at the corporate trust office of the Issuer or at the officeof any such other Transfer Agent as the Issuer may designate from time to time, or (at the risk of theBond Holder) sent by mail to such address as is specified by the Bond Holder in the Bond Holder’srequest for transfer, exchange or replacement.
Restrictions on Transfer
The Bonds may not be sold or otherwise transferred except as described above under “— The GlobalBonds” and “— Definitive Bonds”.
154
TAXATION
Sri Lankan Taxation
Income tax
The relevant taxation laws of Sri Lanka are embodied in the Inland Revenue Act No. 10 of 2006 (asamended) (“the Inland Revenue Act”).
Under the Inland Revenue Act, income tax is charged in respect of the profits and income of everyperson. For the purposes of the Act “profits and income” in the current instance means, inter alia,interest and discounts.
Persons resident in Sri Lanka are subject to income tax on their worldwide income. A company isconsidered to be a resident company if its registered or principal office is in Sri Lanka or if the controland management of its business are exercised in Sri Lanka. An individual who is physically presentin Sri Lanka for a period of one hundred and eighty three days or more during a year of assessmentis deemed to be a resident in Sri Lanka for that year of assessment. Also, an individual who is deemedto be resident for two or more consecutive years of assessment is deemed to be resident until such timeas he is absent from Sri Lanka for a continuous period of three hundred and sixty five days.
In the case of persons who are not resident in Sri Lanka, any profits and income arising in or derivedfrom Sri Lanka generally are subject to income tax in Sri Lanka. Where interest is payable to anon-resident person on a loan made by such person and the interest on such loan is borne, directly orindirectly, by a person resident in Sri Lanka, such interest is deemed to be profits and income arisingin or derived from Sri Lanka.
However, the Inland Revenue Act provides for an exemption from income tax in respect of any interestor discount paid or allowed to any non-resident person on any sovereign bond issued by theGovernment of Sri Lanka (the term “person” includes a company or body of persons or anygovernment). In view of the aforesaid exemption, any interest or discount arising on the Bonds willnot be subject to Sri Lanka tax and could be made without any deduction for or on account ofwithholding tax.
Furthermore, the Inland Revenue Act provides that the profits and income earned by any non-residentperson from the sale of any sovereign bond issued by the Government of Sri Lanka would also beexempt from income tax. Please see “General Information — Authorization”.
Stamp Duty
The Stamp Duty Act No. 43 of 1982 read with the Stamp Duty (Special Provisions) Act No. 12 of 2006exempts from the payment of stamp duty any instrument executed by or on behalf of the Government.
United States Federal Income Taxation
The following discussion is a summary based on present law of certain material U.S. federal incometax considerations relevant to the purchase, ownership and disposition of the Bonds. This discussionaddresses only U.S. Holders described below who purchase Bonds in the original offering at the issueprice (as defined herein), hold the Bonds as capital assets and use the US dollar as their functionalcurrency. This discussion is not a complete description of all U.S. tax considerations relating to theBonds. It does not address all of the tax consequences to prospective investors subject to special rules,such as banks, dealers, traders that elect to mark to market, insurance companies, partnerships or otherpass through entitles (or persons that hold Bonds through pass through entities), regulated investmentcompanies, real estate investment trusts, U.S. expatriates and former long term residents of the UnitedStates, tax-exempt entities or persons holding the Bonds as part of a hedge, straddle, conversion orother integrated financial transaction. The following discussion does not address any U.S. federaltaxes (such as the estate tax or the gift tax) other than U.S. federal income taxes, or any aspect of theU.S. federal Medicare tax on net investment income, the alternative minimum tax or any non-U.S.,state or local taxes.
155
EACH PROSPECTIVE PURCHASER IS URGED TO CONSULT ITS OWN TAX ADVISORABOUT THE TAX CONSEQUENCES OF AN INVESTMENT IN THE BONDS UNDER THESTATE AND LOCAL LAWS OF THE UNITED STATES, SRI LANKA AND THE LAWS OF ANYOTHER JURISDICTION WHERE THE PURCHASER MAY BE SUBJECT TO TAXATION.
For purposes of this discussion, a “U.S. Holder” is a beneficial owner of Bonds that is, for purposesof U.S. federal income taxation, (1) a citizen or resident of the United States, (2) a corporation createdor organized in or under the laws of the United States or its political subdivisions, (3) a trust that (i)is subject to the control of a U.S. person and the primary supervision of a U.S. court or (ii) has a validelection in effect under applicable U.S. Treasury regulations to be treated as a U.S. person, or (4) anestate the income of which is subject to U.S. federal income taxation regardless of its source.
If a partnership acquires or holds the Bonds, the tax treatment of a partner generally will depend uponthe status of the partner and the activities of the partnership. A partnership and partners of apartnership that acquires or holds the Bonds should consult their own tax advisor.
Interest
Payments of stated interest to a U.S. Holder on a Bond, including any additional amounts paid withrespect to withholding tax (if any) on the Bonds, will be includible in such U.S. Holder’s gross incomeas ordinary interest income at the time such payments are received or accrued in accordance with suchU.S. Holder’s regular method of tax accounting for U.S. federal income tax purposes. It is expected,and the remainder of this discussion assumes, that the Bonds will not be issued with original issuediscount for U.S. federal income tax purposes.
Interest on the Bonds will be treated as foreign source income for U.S. federal income tax purposesand will constitute “passive category” income, or in certain cases, “general category income” forforeign tax credit purposes, which may be relevant to a U.S. Holder in computing its foreign tax creditlimitations.
Disposition
Upon the sale, exchange or other taxable disposition (including redemption) of a Bond, a U.S. Holdergenerally will recognize taxable gain or loss equal to the difference between the amount realized onthe sale, exchange or other taxable disposition (other than accrued but unpaid interest, which will betaxable as such) and the U.S. Holder’s adjusted tax basis in the Bond. A U.S. Holder’s adjusted taxbasis in a Bond generally will be equal to the amount that the U.S. Holder paid for the Bond. Any suchgain or loss generally will be U.S. source capital gain or loss and will be long-term capital gain or lossif the Bond has been held for more than one year at the time of its sale, exchange or other taxabledisposition. Certain non-corporate U.S. Holders (including individuals) may be eligible forpreferential rates of U.S. federal income tax in respect of long-term capital gains. The deductibilityof capital losses is subject to limitations.
Information Reporting and Backup Withholding
Payments of interest and proceeds from the sale, redemption or other disposition of a Bond may bereported to the U.S. Internal Revenue Service unless the U.S. Holder is a corporation or other exemptrecipient and, if required, establishes a basis for such exemption.
Backup withholding may apply to amounts subject to reporting if the U.S. Holder fails to provide anaccurate taxpayer identification number. Backup withholding is not an additional tax. A U.S. Holdercan claim a credit against its U.S. federal income tax liability for the amount of any backupwithholding and may be entitled to a refund of any excess, provided the required information isfurnished to the U.S. Internal Revenue Service in a timely manner.
156
“Specified Foreign Financial Assets” Reporting
Certain owners of “specified foreign financial assets” with an aggregate value in excess of US$ 50,000(and in some circumstances, a higher threshold), may be required to file an information statement withrespect to such assets with their U.S. federal income tax returns, currently on IRS Form 8938. TheBonds generally are not expected to constitute “specified foreign financial assets” for so long as theyare held in accounts maintained by certain financial institutions (but the accounts in which the Bondsare held may be reportable if maintained by foreign financial institutions). U.S. Holders are urged toconsult their tax advisors regarding the application of this legislation to their ownership of the Bonds.
157
PLAN OF DISTRIBUTION
Subject to the terms and conditions in the purchase agreement, dated May 4, 2017, between the Issuerand the initial purchasers named below (the “Initial Purchasers”), each of the Initial Purchasers hasseverally agreed with the Issuer to purchase the principal amount of Bonds set forth opposite suchInitial Purchaser’s name:
Initial Purchaser
Principal Amount
of the Bonds
Percentage of
Interest of
the Bonds
Citigroup Global Capital Markets Inc................................... US$214,286,000 14.3%CLSA Limited...................................................................... US$214,286,000 14.3%Deutsche Bank AG, Singapore Branch.................................. US$214,286,000 14.3%The Hongkong and Shanghai Banking Corporation Limited .. US$214,286,000 14.3%ICBC International Securities Limited.................................. US$214,286,000 14.3%J.P. Morgan (S.E.A.) Limited ............................................... US$214,285,000 14.3%Standard Chartered Bank...................................................... US$214,285,000 14.3%
Total .................................................................................... US$1,500,000,000 100.0%
The Issuer will also reimburse the Initial Purchasers in respect of certain of their expenses, and hasagreed to indemnify the Initial Purchasers against certain liabilities (including liabilities under theSecurities Act), incurred in connection with the issue of the Bonds, or to contribute to payments thatthe Initial Purchasers may be required to make because of any of these liabilities. The PurchaseAgreement may be terminated in certain circumstances prior to payment of the net purchase amountsin respect of the Bonds to the Issuer.
The Initial Purchasers initially propose to offer the Bonds for resale at the issue price that appears onthe cover of this Offering Circular. After the initial offering, the Initial Purchasers may change theoffering price and any other selling terms. The Initial Purchasers may offer and sell the Bonds throughtheir affiliates.
Other Relationships
The Initial Purchasers and their affiliates are full service financial institutions engaged in variousactivities which may include securities trading, commercial and investment banking, financial advice,investment management, principal investment, hedging, financing and brokerage activities. Each ofthe Initial Purchasers may have engaged in, and may in the future engage in, investment banking andother commercial dealings in the ordinary course of business with the Issuer or its controlled orassociated entities from time to time. In the ordinary course of their various business activities, theInitial Purchasers and their affiliates may make or hold (on their own account, on behalf of clients orin their capacity of investment advisers) a broad array of investments and actively trade debt andequity securities (or related derivative securities) and financial instruments (including bank loans) fortheir own account and for the accounts of their customers and may at any time hold long and shortpositions in such securities and instruments and enter into other transactions, including creditderivatives (such as asset swaps, repackaging and credit default swaps) in relation thereto. Suchtransactions, investments and securities activities may involve securities and instruments of the Issueror its controlled or associated entities, may be entered into at the same time or proximate to offers andsales of the Bonds or at other times in the secondary market and be carried out with counterpartiesthat are also purchasers, holders or sellers of Bonds. Bonds may be purchased by or be allocated toany Initial Purchasers or an affiliate for asset management and/or proprietary purposes but not witha view to distribution.
The Initial Purchasers or certain of their respective affiliates may purchase the Bonds and be allocatedBonds for asset management and/or proprietary purposes and not with a view to distribution.
158
United States
The Bonds have not been and will not be registered under the Securities Act and, subject to certainexceptions, may not be offered or sold within the United States except pursuant to an exemption from,or in a transaction not subject to, the registration requirements of the Securities Act. Accordingly, theBonds are being offered and sold only (a) outside the United States as defined in Regulation S inoffshore transactions in accordance with Regulation S and (b) in the United States to a limited numberof QIBs as defined in Rule 144A in connection with resales by the Initial Purchasers in accordancewith Rule 144A.
In addition, until 40 days after the commencement of the Offering, an offer or sale of Bonds withinthe United States by any dealer (whether or not participating in the Offering) may violate theregistration requirements of the Securities Act if such offer or sale is made otherwise than inaccordance with Rule 144A or another exemption from registration under the Securities Act.
The Bonds have not been approved or disapproved by the United States Securities and ExchangeCommission, any state securities commission in the United States or any other United Statesregulatory authority, nor have any of the foregoing authorities passed upon or endorsed the merits ofthe offering or the accuracy or adequacy of this Offering Circular. Any representation to the contraryis a criminal offense in the United States.
Sri Lanka
The Bonds will not directly or indirectly be offered or sold in Sri Lanka. No offering circular,prospectus, form of application or advertisement in relation to the Bonds shall be distributed withinSri Lanka.
United Kingdom
Each Initial Purchaser has agreed that:
• it has only communicated or caused to be communicated, and will only communicate or causeto be communicated, any invitation or inducement to engage in investment activity (within themeaning of section 21 of the Financial Services and Markets Act 2000 (the “FSMA”)) receivedby it in connection with the issue or sale of any Bonds in circumstances in which section 21(1)of the FSMA does not apply to the Issuer; and
• it has complied with, and will comply with, all applicable provisions of the FSMA with respectto anything done by it in relation to the Bonds in, from or otherwise involving the UK.
Hong Kong
Each Initial Purchaser has represented and agreed that:
(1) it has not offered or sold and will not offer or sell in Hong Kong, by means of any document,any Bonds other than (a) to “professional investors” as defined in the Securities and FuturesOrdinance (Cap. 571) of Hong Kong (the “SFO”) and any rules made under the SFO; or (b) inother circumstances which do not result in the document being a “prospectus” as defined in theCompanies (Winding Up and Miscellaneous Provisions Ordinance (Cap. 32) of Hong Kong (the“C(WUMP)O”) or which do not constitute an offer to the public within the meaning of theC(WUMP)O; and
(2) it has not issued or had in its possession for the purposes of issue, and will not issue or have inits possession for the purposes of issue, whether in Hong Kong or elsewhere, any advertisement,invitation or document relating to the Bonds, which is directed at, or the contents of which arelikely to be accessed or read by, the public of Hong Kong (except if permitted to do so under thesecurities laws of Hong Kong) other than with respect to Bonds which are or are intended to bedisposed of only to persons outside Hong Kong or only to “professional investors” as defined inthe SFO and any rules made under the SFO.
159
Japan
The Bonds have not been and will not be registered under the Financial Instruments and Exchange Actof Japan (Act No. 25 of 1948), as amended (the “FIEA”). Accordingly, each of the Initial Purchasershas represented and agreed that it has not, directly or indirectly, offered or sold and will not, directlyor indirectly, offer or sell any Bonds in Japan or to, or for the benefit of, a resident of Japan (whichterm as used herein means any person resident in Japan, including any corporation or other entityorganized under the laws of Japan) or to others for re-offering or resale, directly or indirectly, in Japanor to, or for the benefit of, any resident in Japan, except pursuant to an exemption from the registrationrequirements of, and otherwise in compliance with, the FIEA and other relevant laws and regulationsof Japan.
Singapore
Each Initial Purchaser has acknowledged that this Offering Circular has not been and will not beregistered as a prospectus with the Monetary Authority of Singapore (the “MAS”) under the Securitiesand Futures Act (Chapter 289 of Singapore) (the “SFA”). Accordingly, each Initial Purchaser hasrepresented, warranted and agreed that it has not offered or sold any Bonds or caused the Bonds tobe made the subject of an invitation for subscription or purchase and will not offer or sell any Bondsor cause the Bonds to be made the subject of an invitation for subscription or purchase, and has notcirculated or distributed, nor will it circulate or distribute, this Offering Circular or any otherdocument or material in connection with the offer or sale, or invitation for subscription or purchase,of the Bonds, whether directly or indirectly, to any person in Singapore other than (i) to aninstitutional investor under Section 274 of the SFA, (ii) to a relevant person pursuant to Section275(1), or any person pursuant to Section 275(1A), and in accordance with the conditions specifiedin Section 275, of the SFA, or (iii) otherwise pursuant to, and in accordance with the conditions of,any other applicable provision of the SFA.
Where the Bonds are subscribed or purchased under Section 275 of the SFA by a relevant person whichis:
(a) a corporation (which is not an accredited investor (as defined in Section 4A of the SFA)) the solebusiness of which is to hold investments and the entire share capital of which is owned by oneor more individuals, each of whom is an accredited investor; or
(b) a trust (where the trustee is not an accredited investor) whose sole purpose is to hold investmentsand each beneficiary of the trust is an individual who is an accredited investor,
securities (as defined in Section 239(1) of the SFA) of that corporation or the beneficiaries’ rights andinterest (howsoever described) in that trust shall not be transferred within six months after thatcorporation or that trust has acquired the Bonds pursuant to an offer made under Section 275 of theSFA except:
(1) to an institutional investor or to a relevant person defined in Section 275(2) of the SFA, or to anyperson arising from an offer referred to in Section 275(1A) or Section 276(4)(i)(B) of the SFA;
(2) where no consideration is or will be given for the transfer;
(3) where the transfer is by operation of law;
(4) as specified in Section 276(7) of the SFA; or
(5) as specified in Regulation 32 of the Securities and Futures (Offers of Investments) (Shares andDebentures) Regulations 2005 of Singapore.
160
Republic of Italy
The offering of the Bonds has not been registered pursuant to Italian securities legislation and,accordingly, no Bonds may be offered, sold or delivered, nor may copies of the Offering Circular orof any other document relating to the Bonds be distributed in the Republic of Italy, except:
a. to qualified investors (investitori qualificati), as defined pursuant to Article 100 of LegislativeDecree No. 58 of February 24, 1998, as amended (the “Financial Services Act”) and Article34-ter, first paragraph, letter b) of CONSOB Regulation No. 11971 of May 14, 1999, as amendedfrom time to time (“Regulation No. 11971”); or
b. in other circumstances which are exempted from the rules on public offerings pursuant to Article100 of the Financial Services Act and Article 34-ter of Regulation No. 11971.
Any offer, sale or delivery of the Bonds or distribution of copies of the Offering Circular or any otherdocument relating to the Bonds in the Republic of Italy under a. or b. above must:
i. be made by an investment firm, bank or financial intermediary permitted to conduct suchactivities in the Republic of Italy in accordance with the Financial Services Act, CONSOBRegulation No. 16190 of October 29, 2007 (as amended from time to time) and LegislativeDecree No. 385 of September 1, 1993, as amended (the “Banking Act”); and
ii. comply with any other applicable laws and regulations or requirement imposed by CONSOB, theBank of Italy (including the reporting requirements, where applicable, pursuant to Article 129 ofthe Banking Act and the implementing guidelines of the Bank of Italy, as amended from time totime) and/or any other Italian authority.
European Economic Area
In relation to each Member State of the European Economic Area which has implemented theProspectus Directive (each, a “Relevant Member State”), each Initial Purchaser has represented andagreed that with effect from and including the date on which the Prospectus Directive is implementedin that Relevant Member State (the “Relevant Implementation Date”) it has not made and will notmake an offer of Bonds which are the subject of the offering contemplated by this Offering Circularto the public in that Relevant Member State except that it may, with effect from and including theRelevant Implementation Date, make an offer of such Bonds to the public in that Relevant MemberState:
(a) to any legal entity which is a qualified investor as defined in the Prospectus Directive;
(b) to fewer than 150 natural or legal persons (other than qualified investors as defined in theProspectus Directive), subject to obtaining the prior consent of the relevant Initial Purchaser orInitial Purchasers nominated by the Issuer for any such offer; or
(c) in any other circumstances falling within Article 3(2) of the Prospectus Directive, provided thatno such offer of Bonds shall require the Issuer or any Initial Purchaser to publish a prospectuspursuant to Article 3 of the Prospectus Directive or supplement a prospectus pursuant to Article16 of the Prospectus Directive.
For the purposes of this provision, the expression an “offer of Bonds to the public” in relation to anyBonds in any Relevant Member State means the communication in any form and by any means ofsufficient information on the terms of the offer and the Bonds to be offered so as to enable an investorto decide to purchase or subscribe the Bonds, as the same may be varied in that Member State by anymeasure implementing the Prospectus Directive in that Member State and the expression “ProspectusDirective” means Directive 2003/71/EC (as amended, including by Directive 2010/73/EU), andincludes any relevant implementing measure in the Relevant Member State.
161
General
No action has been taken by the Issuer or any of the Initial Purchasers that would, or is intended to,permit a public offer of the Bonds or possession or distribution of this Offering Circular or any otheroffering or publicity material relating to the Bonds in any country or jurisdiction where any suchaction for that purpose is required. Accordingly, each Initial Purchaser has undertaken that it will not,directly or indirectly, offer or sell any Bonds or distribute or publish any offering circular, prospectus,form of application, advertisement or other document or information in any country or jurisdictionexcept under circumstances that will, to the best of its knowledge and belief, result in compliance withany applicable laws and regulations and all offers and sales of Bonds by it will be made on the sameterms.
The materials relating to the offering of the Bonds do not constitute, and may not be used inconnection with, an offer or solicitation in any place where offers or solicitations are not permittedby law. If a jurisdiction requires that the offering of the Bonds be made by a licensed broker or dealerand the Initial Purchasers or any affiliate of the Initial Purchasers is a licensed broker or dealer in thatjurisdiction, the offering shall be deemed to be made by the Initial Purchasers or such affiliate onbehalf of the Government in such jurisdiction.
The Bonds are a new issue of securities with no established trading market. Approval in-principle hasbeen received from the SGX-ST for the listing and quotation of the Bonds on the SGX-ST. However,the Issuer cannot assure you that the prices at which the Bonds will sell in the market after thisoffering will not be lower than the initial offering price or that an active trading market for the Bondswill develop and continue after this Offering. The Initial Purchasers have advised the Issuer that theycurrently intend to make a market in the Bonds. However, they are not obligated to do so and they maydiscontinue any market-making activities with respect to the Bonds at any time without notice. Inaddition, market-making activity will be subject to the limits imposed by the Securities Act and theExchange Act. Accordingly, the Issuer cannot assure you as to the liquidity of or the trading marketfor the Bonds.
In connection with the Offering, The Hongkong and Shanghai Banking Corporation Limited, as theStabilizing Manager or any person acting for it, on behalf of the Initial Purchasers, may engage intransactions that stabilize or otherwise affect the market price of the Bonds. These transactions consistof bids or purchases for the purpose of pegging, fixing or maintaining the price of the Bonds. If theStabilizing Manager or its agent creates a short position in the Bonds in connection with the Offering,(i.e., if the Stabilizing Manager or its agent sells more Bonds than are set forth on the cover page ofthis Offering Circular), the Stabilizing Manager or its agent may reduce that short position bypurchasing the Bonds in the open market. In general, purchases of a bond for the purpose ofstabilization or to reduce a short position could cause the price of the Bonds to be higher than it mightbe in the absence of such purchases. These transactions may be effected in the over-the-counter marketat any time. If such activities are commenced, they may be discontinued by the Stabilizing Manageror its agent(s) at any time. The Stabilizing Manager or its agent also may impose a penalty bid. Thisoccurs when a particular Initial Purchaser repays to the Stabilizing Manager or its agent a portion ofthe underwriting discount received by it because the Stabilizing Manager or its agent has repurchasedthe Bonds sold by or for the account of such Initial Purchaser in stabilizing or short coveringtransactions.
Neither the Issuer nor the Stabilizing Manager makes any representation or prediction as to thedirection or magnitude of any effect that the transactions described above may have on the price ofthe Bonds. In addition, neither the Issuer nor the Stabilizing Manager makes any representation thatthe Stabilizing Manager or its agent will engage in such transactions or that such transactions, oncecommenced, will not be discontinued with or without notice.
162
It is expected that the Bonds will be delivered against payment for the Bonds on or about the datespecified in the last paragraph of the cover page of this Offering Circular, which will be the fourthbusiness day following the date of the pricing of the Bonds. Since trades in the secondary marketgenerally settle in three business days pursuant to Rule 15c6-1 of the Exchange Act, purchasers whowish to trade Bonds on the date of pricing will be required, by virtue of the fact that the Bonds initiallywill settle in T+5 on a delayed basis, to specify alternative settlement arrangements to prevent a failedsettlement. Purchasers of Bonds who wish to make such trades should consult their own advisors.
163
NOTICE TO INVESTORS
Due to the following significant transfer restrictions applicable to the Bonds, investors are advisedto consult legal counsel prior to making any reoffer, resale, pledge, transfer or disposal of Bonds.
The Bonds have not been registered and will not be registered under the Securities Act or any othersecurities laws, and may not be offered or sold in the United States (as defined in Regulation S) exceptpursuant to an exemption from, or in a transaction not subject to, the registration requirements of theSecurities Act. Accordingly, the Bonds are being offered and sold (1) in the United States only topersons reasonably believed to be QIBs, as defined in Rule 144A under the Securities Act incompliance with Rule 144A and (2) outside the United States in offshore transactions pursuant toRegulation S.
Each investor of a Bond, by its acceptance thereof, will be deemed to have acknowledged, representedto and agreed with the Issuer and the Initial Purchasers as follows:
(1) represent that it is purchasing the Bonds for its own account or an account with respect to whichit exercises sole investment discretion and that it and any such account is (a) a QIB, and is awarethat the sale to it is being made in reliance on Rule 144A or (b) located outside the United States;
(2) acknowledge that the Bonds have not been registered under the Securities Act and may not beoffered or sold within the United States except as set forth below;
(3) if it is a person other than a purchaser located outside the United States, agree that if it shouldresell or otherwise transfer the Bonds within the time period referred to in Rule 144(d) under theSecurities Act after the original issuance of the Bonds, it will do so only (a) to the Issuer, (b)to a QIB in compliance with Rule 144A, (c) outside the United States in an offshore transactionin compliance with Rule 903 or 904 of Regulation S under the Securities Act, (d) pursuant to theexemption from registration provided by Rule 144 (if available) but only upon delivery to theIssuer of an opinion of counsel in form and scope satisfactory to the Issuer or (e) pursuant to aneffective registration statement under the Securities Act;
(4) agree that it will deliver to each person to whom it transfers Bonds notice of any restriction ontransfer of such Bonds;
(5) understand and agree that Bonds initially offered in the United States to QIBs will be representedby one or more Rule 144A Global Bonds and that Bonds offered outside the United States inoffshore transactions pursuant to Regulation S will be represented by one or more Regulation SGlobal Bonds;
(6) understand that unless registered under the Securities Act, the Rule 144A Global Bond and BondCertificates issued in exchange for a beneficial interest in the Rule 144A Global Bond will beara legend to the following effect, unless otherwise agreed by the Issuer and the holder thereof:
THE SECURITIES EVIDENCED HEREBY HAVE NOT BEEN REGISTERED UNDERTHE UNITED STATES SECURITIES ACT OF 1933, AS AMENDED (THE “SECURITIESACT”), OR WITH ANY SECURITIES REGULATORY AUTHORITY OF ANY STATE OFTHE UNITED STATES OR ANY OTHER JURISDICTION AND (A) ACCORDINGLY, THESECURITIES MAY NOT BE OFFERED, SOLD, PLEDGED OR OTHERWISETRANSFERRED EXCEPT (1) TO A PERSON WHOM THE SELLER REASONABLYBELIEVES IS A QUALIFIED INSTITUTIONAL BUYER WITHIN THE MEANING OFRULE 144A UNDER THE SECURITIES ACT PURCHASING FOR ITS OWN ACCOUNTOR FOR THE ACCOUNT OF A QUALIFIED INSTITUTIONAL BUYER IN ATRANSACTION COMPLYING WITH THE REQUIREMENTS OF RULE 144A, (2) IN ANOFFSHORE TRANSACTION COMPLYING WITH RULE 903 OR 904 OF REGULATIONS UNDER THE SECURITIES ACT, (3) PURSUANT TO AN EXEMPTION FROMREGISTRATION UNDER THE SECURITIES ACT PROVIDED BY RULE 144THEREUNDER (IF AVAILABLE), (4) PURSUANT TO ANY OTHER AVAILABLEEXEMPTION FROM REGISTRATION UNDER THE SECURITIES ACT, OR (5)PURSUANT TO AN EFFECTIVE REGISTRATION STATEMENT UNDER THE
164
SECURITIES ACT, IN EACH CASE IN ACCORDANCE WITH ALL APPLICABLESECURITIES LAWS OF THE STATES OF THE UNITED STATES; (B) THE HOLDERWILL, AND EACH SUBSEQUENT HOLDER IS REQUIRED TO, NOTIFY ANYSUBSEQUENT PURCHASER OF THESE SECURITIES FROM IT OF THE RESALERESTRICTIONS REFERRED TO IN (A) ABOVE; AND (C) NO REPRESENTATION CANBE MADE AS TO THE AVAILABILITY OF THE EXEMPTION PROVIDED BY RULE 144UNDER THE SECURITIES ACT FOR RESALES OF THE SECURITIES.
(7) acknowledge that the Issuer and the Initial Purchasers will rely upon the truth and accuracy ofthe foregoing acknowledgments, representations and agreements, and agree that if any of theacknowledgments, representations or warranties deemed to have been made by it by its purchaseof Bonds are no longer accurate, it shall promptly notify the Issuer and the Initial Purchasers;and
(8) if it is acquiring Bonds as a fiduciary or agent for one or more investor accounts, represent thatit has sole investment discretion with respect to each such account and it has full power to makethe foregoing acknowledgments, representations and agreements on behalf of each such account.
165
LEGAL MATTERS
The validity of the Bonds will be passed upon on behalf of the Issuer by the Attorney General of SriLanka, counsel for the Issuer as to matters of Sri Lankan law, and by Allen & Overy, internationalcounsel for the Issuer as to matters of United States and New York State law. Certain legal matters willbe passed upon for the Initial Purchasers by F. J. & G. de Saram, counsel for the Initial Purchasersas to matters of Sri Lankan law, and by Milbank, Tweed, Hadley & McCloy LLP, international counselfor the Initial Purchasers as to matters of United States and New York State law.
PUBLIC OFFICIAL STATEMENTS AND DOCUMENTS
Information included herein which is designated as being taken from a publication of Sri Lanka or anagency or instrumentality of the Issuer is included on the authority of the Issuer or such agency orinstrumentality.
The information set forth herein relating to Sri Lanka is provided by the Central Bank of theDemocratic Socialist Republic of Sri Lanka acting in its official capacity and is included on itsauthority.
166
GENERAL INFORMATION
Authorization
The Issuer has obtained all necessary consents, approvals and authorizations under the laws of theDemocratic Socialist Republic of Sri Lanka in connection with the issue and performance of theBonds. The issue of the Bonds and the bond holders for the time being and from time to time havebeen approved on April 4, 2017 by the Cabinet of Ministers pursuant to the Foreign Loans Act No.29 of 1957 (as amended). The signing of the Bonds and the relevant agreements has been approvedon April 25, 2017 by the President under the Foreign Loans Act No 29 of 1957 (as amended). TheDeputy Commissioner General of Inland Revenue has confirmed on April 21, 2017 that (a) the interestpayments on the Bonds are exempt from income tax in Sri Lanka pursuant to Section 9(b) of the InlandRevenue Act No. 10 of 2006 (as amended); (b) the interest earned on the Bonds by any person orpartnership located outside Sri Lanka is exempt from income tax in Sri Lanka, under and in terms ofSection 9(b) of the Inland Revenue Act No 10 of 2006, (as amended); and (c) the fees derived fromthe transaction by the Initial Purchasers would not be liable to tax as such fees are not derived frombusiness transacted in Sri Lanka by such institution or through a permanent establishment in Sri Lankaby such institution. Special permission has been given to the Issuer on April 20, 2017 by the Controllerof Exchange for purposes and in terms of the Exchange Control Act No. 24 of 1953 (as amended) inrelation to the proposed borrowing through the Bonds and for payments by the Issuer under or inconnection with the Bonds under Section 7 of the Exchange Control Act No. 24 of 1953 (as amended).Permission has also been granted to the Issuer by the Controller of Exchange pursuant to Sections 10,11 and 22(1)(f) of the Exchange Control Act No. 24 of 1953 (as amended). The Controller of Exchangehas also confirmed on April 20, 2017 that all permissions necessary for the Issuer for purposes andin terms of the Exchange Control Act in relation to the proposed borrowing through the issue of theBonds have been granted. Approval has been granted by the Monetary Board of the Central Bank ofSri Lanka for the issuance of the Bonds under the Monetary Law Act (Cap 422), as evidenced by anextract of the minutes of the meeting of the Monetary Board No. 40/2016 held on December 30, 2016.Confirmation that the borrowing resulting from the issuance of the Bonds is within the limitsauthorized by the Parliament of Sri Lanka was given by a letter dated April 24, 2017 issued by theActing Secretary to the Treasury, Ministry of Finance.
Listing
Approval in-principle has been received from the SGX-ST for the listing and quotation of the Bondson the SGX-ST. For so long as the Bonds are listed on the SGX-ST and the rules of the SGX-ST sorequire, the Bonds will be traded on the SGX-ST in a minimum board lot size of S$200,000 (or itsequivalent in foreign currencies). Listing of the Bonds on the SGX-ST is conditional upon satisfactionof the requirements of the SGX-ST.
So long as the Bonds are listed on the SGX-ST and the rules of the SGX-ST so require, in the eventthat the Global Bonds are exchanged for Definitive Bonds, the Issuer shall appoint and maintain apaying agent in Singapore (the “Singapore Paying Agent”), where the Definitive Bonds may bepresented or surrendered for payment or redemption. In addition, in the event that the Global Bondsare exchanged for Definitive Bonds, an announcement of such exchange shall be made through theSGX-ST and such announcement will include all material information with regard to the delivery ofthe Definitive Bonds, including details of the Singapore Paying Agent.
Clearing Systems
The Bonds have been accepted for clearance through DTC, Euroclear and Clearstream, Luxembourg.
167
With respect to the Bonds
The ISIN for the Rule 144A Global Bonds is US85227SAT33 and for the Regulation S Global Bondsis USY8137FAH11. The CUSIP number for the Rule 144A Global Bonds is 85227S AT3 and for theRegulation S Global Bonds is Y8137F AH1. The Common Code for the Rule 144A Global Bonds is161254584 and for the Regulation S Global Bonds is 161142611.
Application will be made for acceptance of the Bonds into DTC’s book-entry settlement system.
Annual Reports
Copies of the 2015 Annual Report and all future monthly bulletins may be obtained on thewebsite of the Central Bank of Sri Lanka at http://www.cbsl.gov.lk/pics_n_docs/10_pub/_docs/efr/annual_report/AR2015/English/content.htm, so long as any of the Bonds are listed on the SGX-ST. Noinformation contained on the website of the Central Bank of Sri Lanka is incorporated by referenceherein. The aforementioned 2015 Annual Report contains certain summary information regarding theannual budget of the Government.
Documents
Copies of the Indenture containing the forms of the Certificates will be available for inspection, at thespecified offices of each of the Paying Agents during normal business hours, so long as any of theBonds, as applicable, are outstanding. Copies of the Indenture and the Constitution of Sri Lanka willbe available for inspection at the specified office of the Paying Agent during normal business hoursso long as the Bonds, as applicable, are listed on the SGX-ST.
Available Information
The Issuer is a foreign government as defined in Rule 405 under the Securities Act and is eligible toregister securities on Schedule B of the Securities Act. Therefore, the Issuer is not subject to theinformation provision requirements of Rule 144A(d)(4)(i) under the Securities Act.
168
INDEBTEDNESS OF THE DEMOCRATIC SOCIALIST REPUBLIC OF SRI LANKA
Page
GOVERNMENT DEBT . . . . . . . . . . . . . . . . . . . . . . . . . . . . . . . . . . . . . . . . . . . . . . . . . . . . T-2
OUTSTANDING CENTRAL GOVERNMENT DEBT . . . . . . . . . . . . . . . . . . . . . . . . . . . . . . T-3
EXTERNAL DEBT OUTSTANDING AND BANKING SECTOR EXTERNALLIABILITIES (DISBURSEMENTS) (2013-2016) . . . . . . . . . . . . . . . . . . . . . . . . . . . . . . . . T-5
T-1
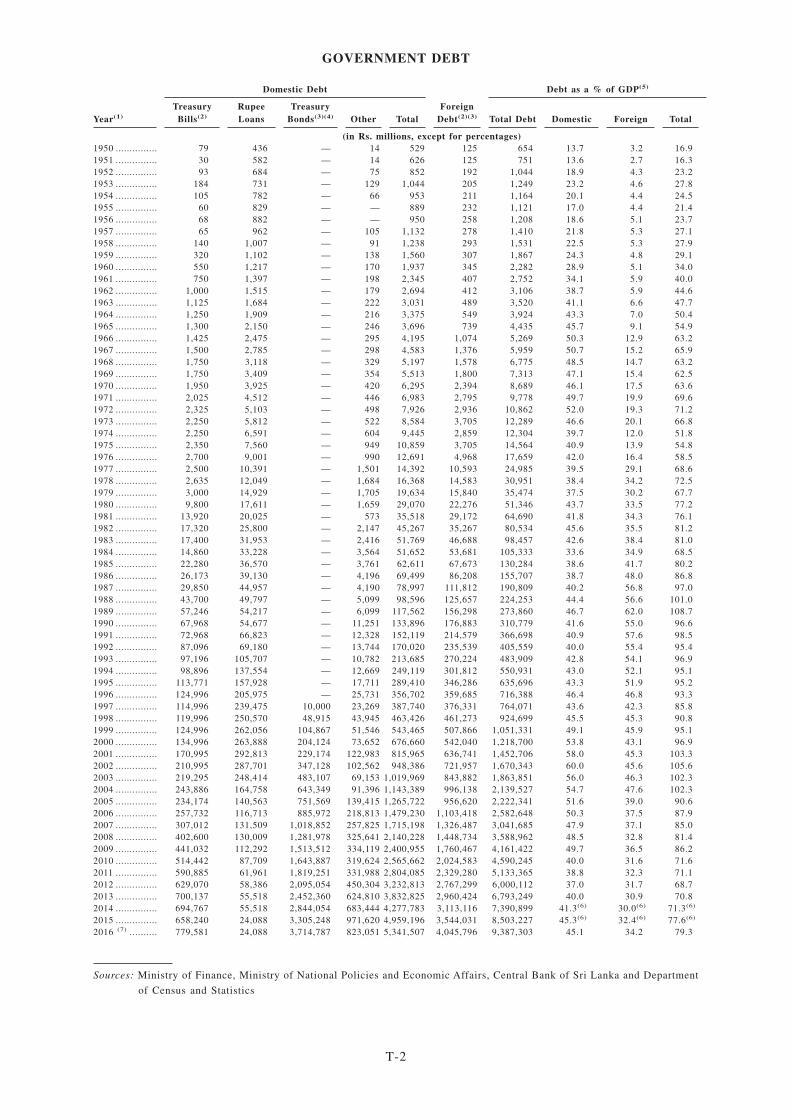
GOVERNMENT DEBT
Domestic Debt
ForeignDebt(2)(3)
Debt as a % of GDP(5)
Year(1)
TreasuryBills(2)
RupeeLoans
TreasuryBonds(3)(4) Other Total Total Debt Domestic Foreign Total
(in Rs. millions, except for percentages)1950 ............... 79 436 — 14 529 125 654 13.7 3.2 16.91951 ............... 30 582 — 14 626 125 751 13.6 2.7 16.31952 ............... 93 684 — 75 852 192 1,044 18.9 4.3 23.21953 ............... 184 731 — 129 1,044 205 1,249 23.2 4.6 27.81954 ............... 105 782 — 66 953 211 1,164 20.1 4.4 24.51955 ............... 60 829 — — 889 232 1,121 17.0 4.4 21.41956 ............... 68 882 — — 950 258 1,208 18.6 5.1 23.71957 ............... 65 962 — 105 1,132 278 1,410 21.8 5.3 27.11958 ............... 140 1,007 — 91 1,238 293 1,531 22.5 5.3 27.91959 ............... 320 1,102 — 138 1,560 307 1,867 24.3 4.8 29.11960 ............... 550 1,217 — 170 1,937 345 2,282 28.9 5.1 34.01961 ............... 750 1,397 — 198 2,345 407 2,752 34.1 5.9 40.01962 ............... 1,000 1,515 — 179 2,694 412 3,106 38.7 5.9 44.61963 ............... 1,125 1,684 — 222 3,031 489 3,520 41.1 6.6 47.71964 ............... 1,250 1,909 — 216 3,375 549 3,924 43.3 7.0 50.41965 ............... 1,300 2,150 — 246 3,696 739 4,435 45.7 9.1 54.91966 ............... 1,425 2,475 — 295 4,195 1,074 5,269 50.3 12.9 63.21967 ............... 1,500 2,785 — 298 4,583 1,376 5,959 50.7 15.2 65.91968 ............... 1,750 3,118 — 329 5,197 1,578 6,775 48.5 14.7 63.21969 ............... 1,750 3,409 — 354 5,513 1,800 7,313 47.1 15.4 62.51970 ............... 1,950 3,925 — 420 6,295 2,394 8,689 46.1 17.5 63.61971 ............... 2,025 4,512 — 446 6,983 2,795 9,778 49.7 19.9 69.61972 ............... 2,325 5,103 — 498 7,926 2,936 10,862 52.0 19.3 71.21973 ............... 2,250 5,812 — 522 8,584 3,705 12,289 46.6 20.1 66.81974 ............... 2,250 6,591 — 604 9,445 2,859 12,304 39.7 12.0 51.81975 ............... 2,350 7,560 — 949 10,859 3,705 14,564 40.9 13.9 54.81976 ............... 2,700 9,001 — 990 12,691 4,968 17,659 42.0 16.4 58.51977 ............... 2,500 10,391 — 1,501 14,392 10,593 24,985 39.5 29.1 68.61978 ............... 2,635 12,049 — 1,684 16,368 14,583 30,951 38.4 34.2 72.51979 ............... 3,000 14,929 — 1,705 19,634 15,840 35,474 37.5 30.2 67.71980 ............... 9,800 17,611 — 1,659 29,070 22,276 51,346 43.7 33.5 77.21981 ............... 13,920 20,025 — 573 35,518 29,172 64,690 41.8 34.3 76.11982 ............... 17,320 25,800 — 2,147 45,267 35,267 80,534 45.6 35.5 81.21983 ............... 17,400 31,953 — 2,416 51,769 46,688 98,457 42.6 38.4 81.01984 ............... 14,860 33,228 — 3,564 51,652 53,681 105,333 33.6 34.9 68.51985 ............... 22,280 36,570 — 3,761 62,611 67,673 130,284 38.6 41.7 80.21986 ............... 26,173 39,130 — 4,196 69,499 86,208 155,707 38.7 48.0 86.81987 ............... 29,850 44,957 — 4,190 78,997 111,812 190,809 40.2 56.8 97.01988 ............... 43,700 49,797 — 5,099 98,596 125,657 224,253 44.4 56.6 101.01989 ............... 57,246 54,217 — 6,099 117,562 156,298 273,860 46.7 62.0 108.71990 ............... 67,968 54,677 — 11,251 133,896 176,883 310,779 41.6 55.0 96.61991 ............... 72,968 66,823 — 12,328 152,119 214,579 366,698 40.9 57.6 98.51992 ............... 87,096 69,180 — 13,744 170,020 235,539 405,559 40.0 55.4 95.41993 ............... 97,196 105,707 — 10,782 213,685 270,224 483,909 42.8 54.1 96.91994 ............... 98,896 137,554 — 12,669 249,119 301,812 550,931 43.0 52.1 95.11995 ............... 113,771 157,928 — 17,711 289,410 346,286 635,696 43.3 51.9 95.21996 ............... 124,996 205,975 — 25,731 356,702 359,685 716,388 46.4 46.8 93.31997 ............... 114,996 239,475 10,000 23,269 387,740 376,331 764,071 43.6 42.3 85.81998 ............... 119,996 250,570 48,915 43,945 463,426 461,273 924,699 45.5 45.3 90.81999 ............... 124,996 262,056 104,867 51,546 543,465 507,866 1,051,331 49.1 45.9 95.12000 ............... 134,996 263,888 204,124 73,652 676,660 542,040 1,218,700 53.8 43.1 96.92001 ............... 170,995 292,813 229,174 122,983 815,965 636,741 1,452,706 58.0 45.3 103.32002 ............... 210,995 287,701 347,128 102,562 948,386 721,957 1,670,343 60.0 45.6 105.62003 ............... 219,295 248,414 483,107 69,153 1,019,969 843,882 1,863,851 56.0 46.3 102.32004 ............... 243,886 164,758 643,349 91,396 1,143,389 996,138 2,139,527 54.7 47.6 102.32005 ............... 234,174 140,563 751,569 139,415 1,265,722 956,620 2,222,341 51.6 39.0 90.62006 ............... 257,732 116,713 885,972 218,813 1,479,230 1,103,418 2,582,648 50.3 37.5 87.92007 ............... 307,012 131,509 1,018,852 257,825 1,715,198 1,326,487 3,041,685 47.9 37.1 85.02008 ............... 402,600 130,009 1,281,978 325,641 2,140,228 1,448,734 3,588,962 48.5 32.8 81.42009 ............... 441,032 112,292 1,513,512 334,119 2,400,955 1,760,467 4,161,422 49.7 36.5 86.22010 ............... 514,442 87,709 1,643,887 319,624 2,565,662 2,024,583 4,590,245 40.0 31.6 71.62011 ............... 590,885 61,961 1,819,251 331,988 2,804,085 2,329,280 5,133,365 38.8 32.3 71.12012 ............... 629,070 58,386 2,095,054 450,304 3,232,813 2,767,299 6,000,112 37.0 31.7 68.72013 ............... 700,137 55,518 2,452,360 624,810 3,832,825 2,960,424 6,793,249 40.0 30.9 70.82014 ............... 694,767 55,518 2,844,054 683,444 4,277,783 3,113,116 7,390,899 41.3(6) 30.0(6) 71.3(6)
2015 ............... 658,240 24,088 3,305,248 971,620 4,959,196 3,544,031 8,503,227 45.3(6) 32.4(6) 77.6(6)
2016 (7) .......... 779,581 24,088 3,714,787 823,051 5,341,507 4,045,796 9,387,303 45.1 34.2 79.3
Sources: Ministry of Finance, Ministry of National Policies and Economic Affairs, Central Bank of Sri Lanka and Department
of Census and Statistics
T-2
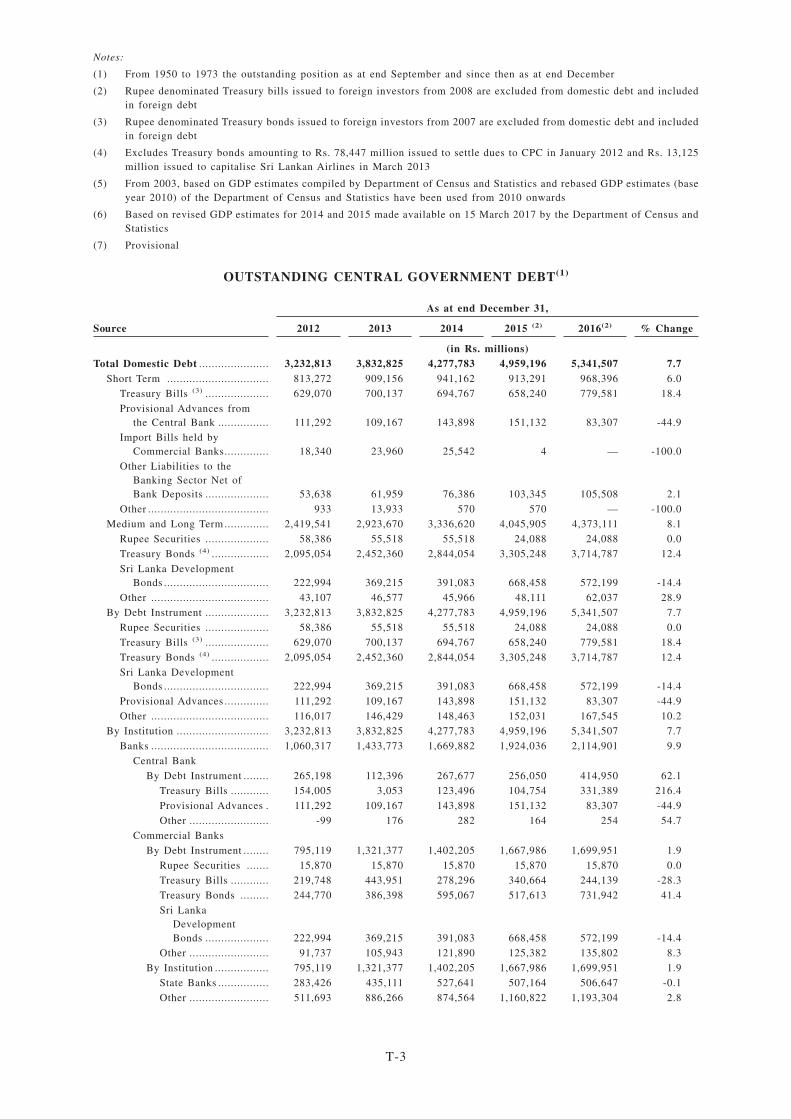
Notes:
(1) From 1950 to 1973 the outstanding position as at end September and since then as at end December
(2) Rupee denominated Treasury bills issued to foreign investors from 2008 are excluded from domestic debt and includedin foreign debt
(3) Rupee denominated Treasury bonds issued to foreign investors from 2007 are excluded from domestic debt and includedin foreign debt
(4) Excludes Treasury bonds amounting to Rs. 78,447 million issued to settle dues to CPC in January 2012 and Rs. 13,125million issued to capitalise Sri Lankan Airlines in March 2013
(5) From 2003, based on GDP estimates compiled by Department of Census and Statistics and rebased GDP estimates (baseyear 2010) of the Department of Census and Statistics have been used from 2010 onwards
(6) Based on revised GDP estimates for 2014 and 2015 made available on 15 March 2017 by the Department of Census andStatistics
(7) Provisional
OUTSTANDING CENTRAL GOVERNMENT DEBT(1)
As at end December 31,
Source 2012 2013 2014 2015 (2) 2016(2) % Change
(in Rs. millions)Total Domestic Debt ...................... 3,232,813 3,832,825 4,277,783 4,959,196 5,341,507 7.7
Short Term ................................ 813,272 909,156 941,162 913,291 968,396 6.0
Treasury Bills (3) .................... 629,070 700,137 694,767 658,240 779,581 18.4
Provisional Advances fromthe Central Bank ................ 111,292 109,167 143,898 151,132 83,307 -44.9
Import Bills held byCommercial Banks.............. 18,340 23,960 25,542 4 — -100.0
Other Liabilities to theBanking Sector Net ofBank Deposits .................... 53,638 61,959 76,386 103,345 105,508 2.1
Other ...................................... 933 13,933 570 570 — -100.0
Medium and Long Term .............. 2,419,541 2,923,670 3,336,620 4,045,905 4,373,111 8.1
Rupee Securities .................... 58,386 55,518 55,518 24,088 24,088 0.0
Treasury Bonds (4) .................. 2,095,054 2,452,360 2,844,054 3,305,248 3,714,787 12.4
Sri Lanka DevelopmentBonds ................................. 222,994 369,215 391,083 668,458 572,199 -14.4
Other ..................................... 43,107 46,577 45,966 48,111 62,037 28.9
By Debt Instrument .................... 3,232,813 3,832,825 4,277,783 4,959,196 5,341,507 7.7
Rupee Securities .................... 58,386 55,518 55,518 24,088 24,088 0.0
Treasury Bills (3) .................... 629,070 700,137 694,767 658,240 779,581 18.4
Treasury Bonds (4) .................. 2,095,054 2,452,360 2,844,054 3,305,248 3,714,787 12.4
Sri Lanka DevelopmentBonds ................................. 222,994 369,215 391,083 668,458 572,199 -14.4
Provisional Advances .............. 111,292 109,167 143,898 151,132 83,307 -44.9
Other ..................................... 116,017 146,429 148,463 152,031 167,545 10.2
By Institution ............................. 3,232,813 3,832,825 4,277,783 4,959,196 5,341,507 7.7
Banks ..................................... 1,060,317 1,433,773 1,669,882 1,924,036 2,114,901 9.9
Central Bank
By Debt Instrument ........ 265,198 112,396 267,677 256,050 414,950 62.1
Treasury Bills ............ 154,005 3,053 123,496 104,754 331,389 216.4
Provisional Advances . 111,292 109,167 143,898 151,132 83,307 -44.9
Other ......................... -99 176 282 164 254 54.7
Commercial Banks
By Debt Instrument ........ 795,119 1,321,377 1,402,205 1,667,986 1,699,951 1.9
Rupee Securities ....... 15,870 15,870 15,870 15,870 15,870 0.0
Treasury Bills ............ 219,748 443,951 278,296 340,664 244,139 -28.3
Treasury Bonds ......... 244,770 386,398 595,067 517,613 731,942 41.4
Sri LankaDevelopmentBonds .................... 222,994 369,215 391,083 668,458 572,199 -14.4
Other ......................... 91,737 105,943 121,890 125,382 135,802 8.3
By Institution ................. 795,119 1,321,377 1,402,205 1,667,986 1,699,951 1.9
State Banks ................ 283,426 435,111 527,641 507,164 506,647 -0.1
Other ......................... 511,693 886,266 874,564 1,160,822 1,193,304 2.8
T-3
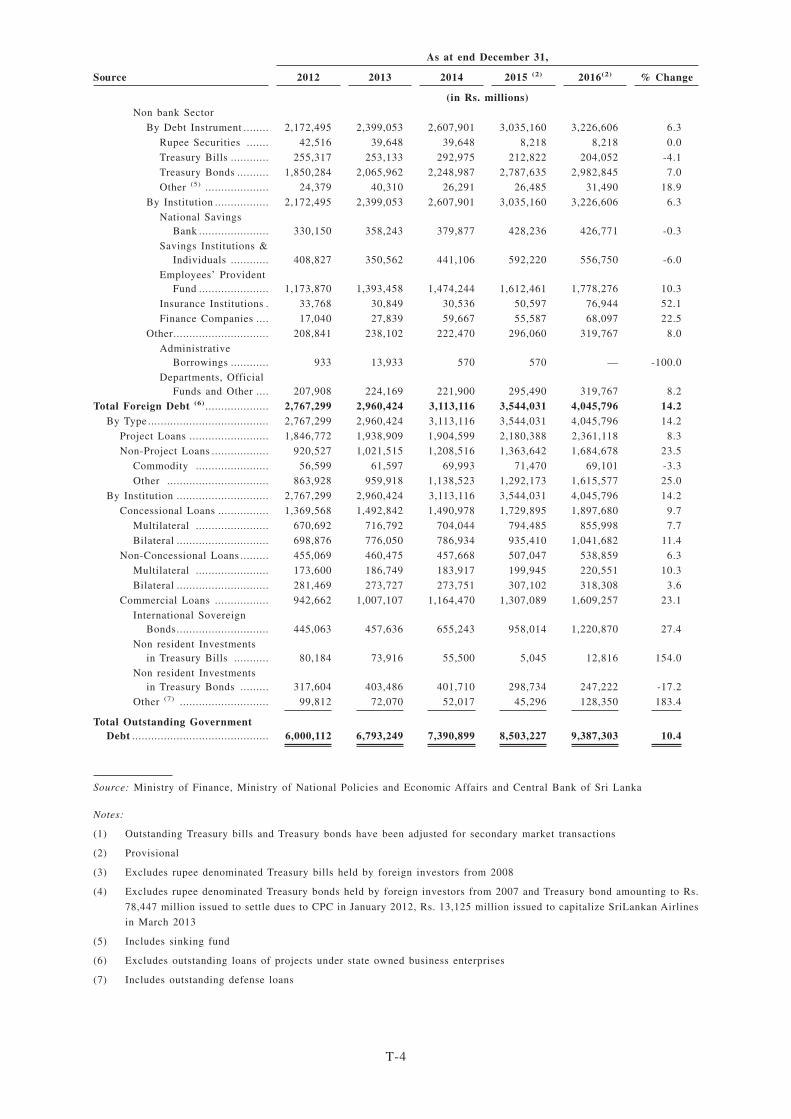
As at end December 31,
Source 2012 2013 2014 2015 (2) 2016(2) % Change
(in Rs. millions)Non bank Sector
By Debt Instrument ........ 2,172,495 2,399,053 2,607,901 3,035,160 3,226,606 6.3
Rupee Securities ....... 42,516 39,648 39,648 8,218 8,218 0.0
Treasury Bills ............ 255,317 253,133 292,975 212,822 204,052 -4.1
Treasury Bonds .......... 1,850,284 2,065,962 2,248,987 2,787,635 2,982,845 7.0
Other (5) .................... 24,379 40,310 26,291 26,485 31,490 18.9
By Institution ................. 2,172,495 2,399,053 2,607,901 3,035,160 3,226,606 6.3
National SavingsBank ...................... 330,150 358,243 379,877 428,236 426,771 -0.3
Savings Institutions &Individuals ............ 408,827 350,562 441,106 592,220 556,750 -6.0
Employees’ ProvidentFund ...................... 1,173,870 1,393,458 1,474,244 1,612,461 1,778,276 10.3
Insurance Institutions . 33,768 30,849 30,536 50,597 76,944 52.1
Finance Companies .... 17,040 27,839 59,667 55,587 68,097 22.5
Other.............................. 208,841 238,102 222,470 296,060 319,767 8.0
AdministrativeBorrowings ............ 933 13,933 570 570 — -100.0
Departments, OfficialFunds and Other .... 207,908 224,169 221,900 295,490 319,767 8.2
Total Foreign Debt (6) .................... 2,767,299 2,960,424 3,113,116 3,544,031 4,045,796 14.2By Type ...................................... 2,767,299 2,960,424 3,113,116 3,544,031 4,045,796 14.2
Project Loans ......................... 1,846,772 1,938,909 1,904,599 2,180,388 2,361,118 8.3
Non-Project Loans .................. 920,527 1,021,515 1,208,516 1,363,642 1,684,678 23.5
Commodity ....................... 56,599 61,597 69,993 71,470 69,101 -3.3
Other ................................ 863,928 959,918 1,138,523 1,292,173 1,615,577 25.0
By Institution ............................. 2,767,299 2,960,424 3,113,116 3,544,031 4,045,796 14.2
Concessional Loans ................ 1,369,568 1,492,842 1,490,978 1,729,895 1,897,680 9.7
Multilateral ....................... 670,692 716,792 704,044 794,485 855,998 7.7
Bilateral ............................. 698,876 776,050 786,934 935,410 1,041,682 11.4
Non-Concessional Loans ......... 455,069 460,475 457,668 507,047 538,859 6.3
Multilateral ....................... 173,600 186,749 183,917 199,945 220,551 10.3
Bilateral ............................. 281,469 273,727 273,751 307,102 318,308 3.6
Commercial Loans ................. 942,662 1,007,107 1,164,470 1,307,089 1,609,257 23.1
International SovereignBonds............................. 445,063 457,636 655,243 958,014 1,220,870 27.4
Non resident Investmentsin Treasury Bills ........... 80,184 73,916 55,500 5,045 12,816 154.0
Non resident Investmentsin Treasury Bonds ......... 317,604 403,486 401,710 298,734 247,222 -17.2
Other (7) ............................ 99,812 72,070 52,017 45,296 128,350 183.4
Total Outstanding GovernmentDebt ........................................... 6,000,112 6,793,249 7,390,899 8,503,227 9,387,303 10.4
Source: Ministry of Finance, Ministry of National Policies and Economic Affairs and Central Bank of Sri Lanka
Notes:
(1) Outstanding Treasury bills and Treasury bonds have been adjusted for secondary market transactions
(2) Provisional
(3) Excludes rupee denominated Treasury bills held by foreign investors from 2008
(4) Excludes rupee denominated Treasury bonds held by foreign investors from 2007 and Treasury bond amounting to Rs.
78,447 million issued to settle dues to CPC in January 2012, Rs. 13,125 million issued to capitalize SriLankan Airlines
in March 2013
(5) Includes sinking fund
(6) Excludes outstanding loans of projects under state owned business enterprises
(7) Includes outstanding defense loans
T-4
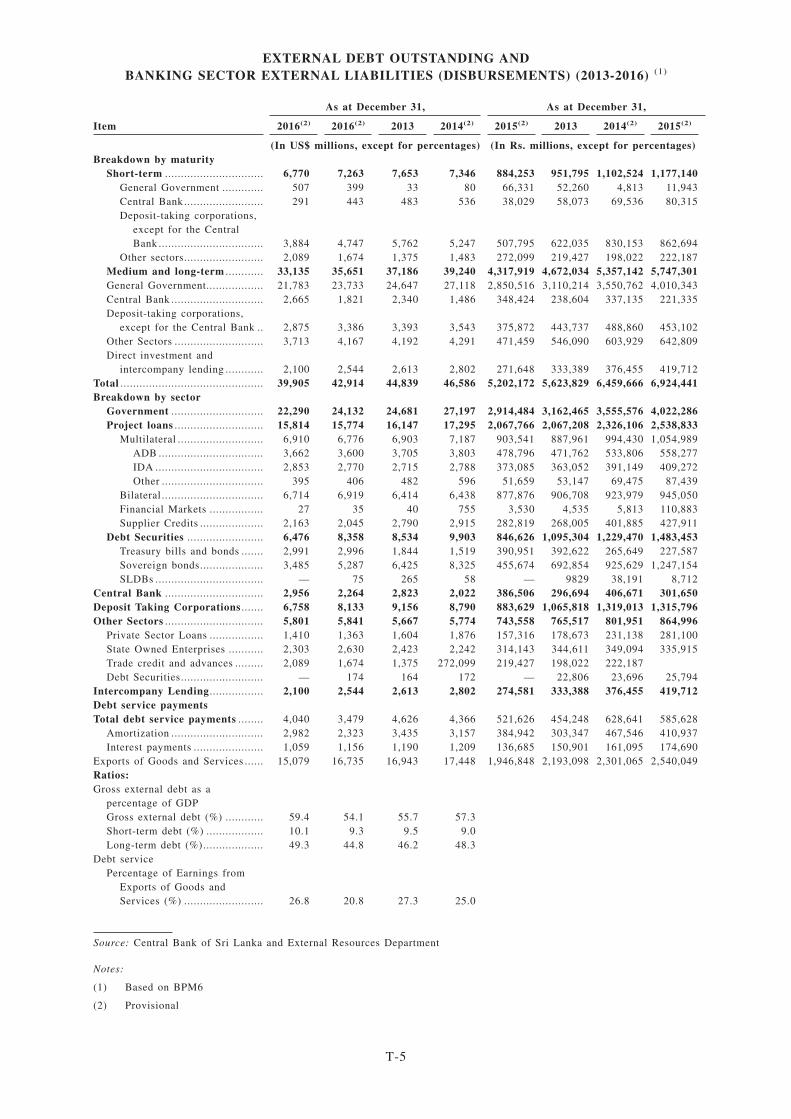
EXTERNAL DEBT OUTSTANDING ANDBANKING SECTOR EXTERNAL LIABILITIES (DISBURSEMENTS) (2013-2016) (1)
As at December 31, As at December 31,
Item 2016(2) 2016(2) 2013 2014(2) 2015(2) 2013 2014(2) 2015(2)
(In US$ millions, except for percentages) (In Rs. millions, except for percentages)Breakdown by maturity
Short-term ............................... 6,770 7,263 7,653 7,346 884,253 951,795 1,102,524 1,177,140General Government ............. 507 399 33 80 66,331 52,260 4,813 11,943Central Bank......................... 291 443 483 536 38,029 58,073 69,536 80,315Deposit-taking corporations,
except for the CentralBank ................................. 3,884 4,747 5,762 5,247 507,795 622,035 830,153 862,694
Other sectors......................... 2,089 1,674 1,375 1,483 272,099 219,427 198,022 222,187Medium and long-term ............ 33,135 35,651 37,186 39,240 4,317,919 4,672,034 5,357,142 5,747,301General Government.................. 21,783 23,733 24,647 27,118 2,850,516 3,110,214 3,550,762 4,010,343Central Bank ............................. 2,665 1,821 2,340 1,486 348,424 238,604 337,135 221,335Deposit-taking corporations,
except for the Central Bank .. 2,875 3,386 3,393 3,543 375,872 443,737 488,860 453,102Other Sectors ............................ 3,713 4,167 4,192 4,291 471,459 546,090 603,929 642,809Direct investment and
intercompany lending ............ 2,100 2,544 2,613 2,802 271,648 333,389 376,455 419,712Total ............................................. 39,905 42,914 44,839 46,586 5,202,172 5,623,829 6,459,666 6,924,441Breakdown by sector
Government ............................. 22,290 24,132 24,681 27,197 2,914,484 3,162,465 3,555,576 4,022,286Project loans ............................ 15,814 15,774 16,147 17,295 2,067,766 2,067,208 2,326,106 2,538,833
Multilateral ........................... 6,910 6,776 6,903 7,187 903,541 887,961 994,430 1,054,989ADB ................................. 3,662 3,600 3,705 3,803 478,796 471,762 533,806 558,277IDA .................................. 2,853 2,770 2,715 2,788 373,085 363,052 391,149 409,272Other ................................ 395 406 482 596 51,659 53,147 69,475 87,439
Bilateral ................................ 6,714 6,919 6,414 6,438 877,876 906,708 923,979 945,050Financial Markets ................. 27 35 40 755 3,530 4,535 5,813 110,883Supplier Credits .................... 2,163 2,045 2,790 2,915 282,819 268,005 401,885 427,911
Debt Securities ........................ 6,476 8,358 8,534 9,903 846,626 1,095,304 1,229,470 1,483,453Treasury bills and bonds ....... 2,991 2,996 1,844 1,519 390,951 392,622 265,649 227,587Sovereign bonds.................... 3,485 5,287 6,425 8,325 455,674 692,854 925,629 1,247,154SLDBs .................................. — 75 265 58 — 9829 38,191 8,712
Central Bank ............................... 2,956 2,264 2,823 2,022 386,506 296,694 406,671 301,650Deposit Taking Corporations ....... 6,758 8,133 9,156 8,790 883,629 1,065,818 1,319,013 1,315,796Other Sectors ............................... 5,801 5,841 5,667 5,774 743,558 765,517 801,951 864,996
Private Sector Loans ................. 1,410 1,363 1,604 1,876 157,316 178,673 231,138 281,100State Owned Enterprises ........... 2,303 2,630 2,423 2,242 314,143 344,611 349,094 335,915Trade credit and advances ......... 2,089 1,674 1,375 272,099 219,427 198,022 222,187Debt Securities.......................... — 174 164 172 — 22,806 23,696 25,794
Intercompany Lending................. 2,100 2,544 2,613 2,802 274,581 333,388 376,455 419,712Debt service paymentsTotal debt service payments ........ 4,040 3,479 4,626 4,366 521,626 454,248 628,641 585,628
Amortization ............................. 2,982 2,323 3,435 3,157 384,942 303,347 467,546 410,937Interest payments ...................... 1,059 1,156 1,190 1,209 136,685 150,901 161,095 174,690
Exports of Goods and Services ...... 15,079 16,735 16,943 17,448 1,946,848 2,193,098 2,301,065 2,540,049Ratios:Gross external debt as a
percentage of GDPGross external debt (%) ............ 59.4 54.1 55.7 57.3Short-term debt (%) .................. 10.1 9.3 9.5 9.0Long-term debt (%)................... 49.3 44.8 46.2 48.3
Debt servicePercentage of Earnings from
Exports of Goods andServices (%) ......................... 26.8 20.8 27.3 25.0
Source: Central Bank of Sri Lanka and External Resources Department
Notes:
(1) Based on BPM6
(2) Provisional
T-5
ISSUER
The Government of the Democratic Socialist Republic of Sri LankaMinistry of Finance
The SecretariatColombo 1Sri Lanka
LEGAL ADVISERS TO THE DEMOCRATIC SOCIALIST REPUBLIC OF SRI LANKA
As to U.S. and New York State law: As to Sri Lankan law:
Allen & Overy9th Floor
Three Exchange SquareCentral
Hong Kong
Attorney GeneralAttorney General’s Department Colombo 12
Sri Lanka
LEGAL ADVISERS TO THE INITIAL PURCHASERS
As to U.S. and New York State law: As to Sri Lankan law:
Milbank, Tweed, Hadley & McCloy LLP30/F Alexandra House
18 Chater Road, CentralHong Kong
F.J. & G. de Saram216 de Saram Place
Colombo 10Sri Lanka
TRUSTEE, PAYING AGENT, TRANSFER AGENT, REGISTRAR AND DTC CUSTODIAN
HSBC Bank USA, National Association452 Fifth Avenue
New York, NY 10018-2706United States
LEGAL ADVISERS TO THE TRUSTEE, PAYING AGENT,TRANSFER AGENT, REGISTRAR AND DTC CUSTODIAN
Milbank, Tweed, Hadley & McCloy LLP30/F Alexandra House
18 Chater Road, CentralHong Kong
SINGAPORE LISTING AGENT
Shook Lin & Bok LLP1 Robinson Road
#18-00 AIA TowerSingapore 048542
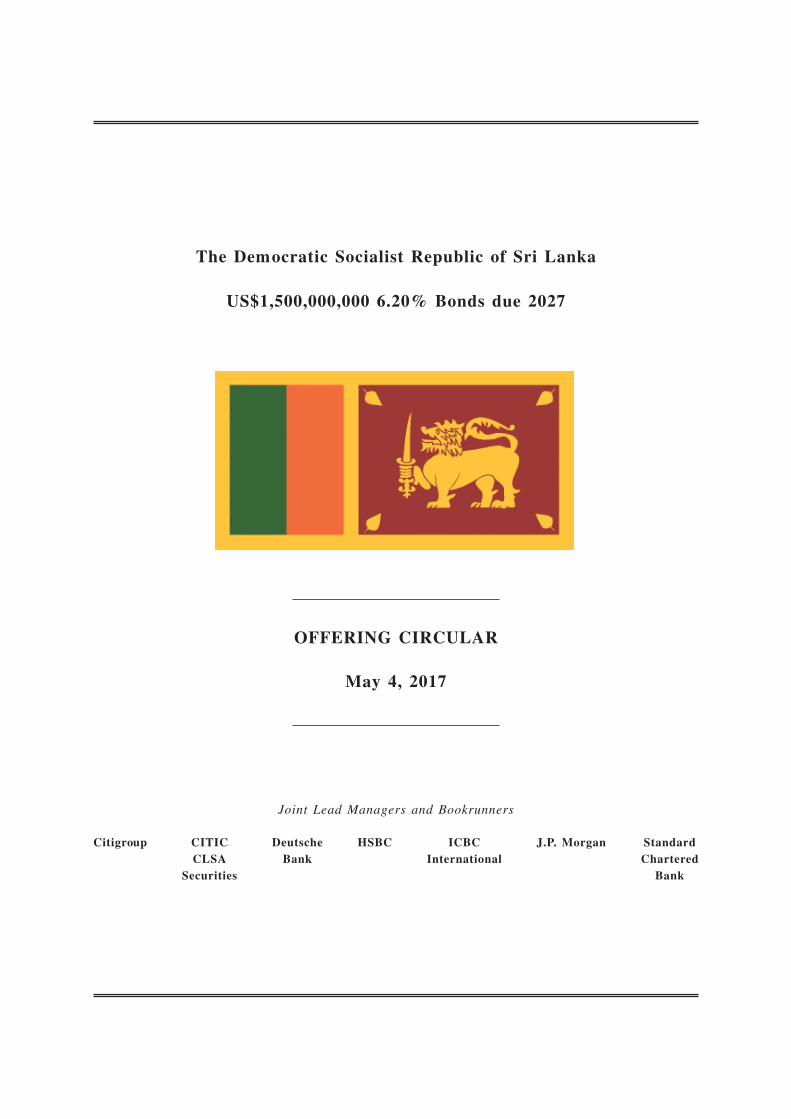
The Democratic Socialist Republic of Sri Lanka
US$1,500,000,000 6.20% Bonds due 2027
OFFERING CIRCULAR
May 4, 2017
Joint Lead Managers and Bookrunners
Citigroup CITICCLSA
Securities
DeutscheBank
HSBC ICBCInternational
J.P. Morgan StandardChartered
Bank
Related Documents