METHODOLOGY ARTICLE Open Access Importance of replication in analyzing time-series gene expression data: Corticosteroid dynamics and circadian patterns in rat liver Tung T Nguyen 1 , Richard R Almon 4,5,6 , Debra C DuBois 4,5 , William J Jusko 4,6 , Ioannis P Androulakis 2,3* Abstract Background: Microarray technology is a powerful and widely accepted experimental technique in molecular biology that allows studying genome wide transcriptional responses. However, experimental data usually contain potential sources of uncertainty and thus many experiments are now designed with repeated measurements to better assess such inherent variability. Many computational methods have been proposed to account for the variability in replicates. As yet, there is no model to output expression profiles accounting for replicate information so that a variety of computational models that take the expression profiles as the input data can explore this information without any modification. Results: We propose a methodology which integrates replicate variability into expression profiles, to generate so-called ‘true’ expression profiles. The study addresses two issues: (i) develop a statistical model that can estimate ‘true’ expression profiles which are more robust than the average profile, and (ii) extend our previous micro- clustering which was designed specifically for clustering time-series expression data. The model utilizes a previously proposed error model and the concept of ‘relative difference’. The clustering effectiveness is demonstrated through synthetic data where several methods are compared. We subsequently analyze in vivo rat data to elucidate circadian transcriptional dynamics as well as liver-specific corticosteroid induced changes in gene expression. Conclusions: We have proposed a model which integrates the error information from repeated measurements into the expression profiles. Through numerous synthetic and real time-series data, we demonstrated the ability of the approach to improve the clustering performance and assist in the identification and selection of informative expression motifs. Background Global gene expression analysis using microarrays has become an essential tool to study genome-wide tran- scriptional responses. Although this high-throughput technology produces a huge volume of useful data, enabling researchers to study the response of thousands of genes simultaneously, it faces many potential sources of uncertainties (e.g. technical noise, experimental treat- ments, biological sampling) [1,2]. As such, a number of statistical methods have demonstrated that the informa- tion contained in replicates is a valuable asset in order to assign proper confidence levels [3-6]. Rocke et al. [7] proposed a model accounting for measurement error to model gene expression profiles which has been used often in conjunction with variance-stabilizing transfor- mation [8-11] and model-based clustering [12,13]. Con- sequently, researchers are designing more experiments with repeated measurements per gene per chip even though it is significantly more costly and time consum- ing. However, properly incorporating the replicate infor- mation remains a challenge. A typical step in analyzing gene microarray data involves filtering for differential expression [14]. A num- ber of methods have been proposed in this direction demonstrating the extensive insight gained in utilizing the information from replicates for determining the change of gene expression values e.g. t-test [15-17], ANOVA [18,19], SAM [20], EDGE [21]. An equally important part of the analysis is clustering which has * Correspondence: [email protected] 2 Biomedical Engineering Department, Rutgers University, Piscataway, New Jersey, USA Nguyen et al. BMC Bioinformatics 2010, 11:279 http://www.biomedcentral.com/1471-2105/11/279 © 2010 Nguyen et al; licensee BioMed Central Ltd. This is an Open Access article distributed under the terms of the Creative Commons Attribution License (http://creativecommons.org/licenses/by/2.0), which permits unrestricted use, distribution, and reproduction in any medium, provided the original work is properly cited.

Welcome message from author
This document is posted to help you gain knowledge. Please leave a comment to let me know what you think about it! Share it to your friends and learn new things together.
Transcript
METHODOLOGY ARTICLE Open Access
Importance of replication in analyzing time-seriesgene expression data: Corticosteroid dynamicsand circadian patterns in rat liverTung T Nguyen1, Richard R Almon4,5,6, Debra C DuBois4,5, William J Jusko4,6, Ioannis P Androulakis2,3*
Abstract
Background: Microarray technology is a powerful and widely accepted experimental technique in molecularbiology that allows studying genome wide transcriptional responses. However, experimental data usually containpotential sources of uncertainty and thus many experiments are now designed with repeated measurements tobetter assess such inherent variability. Many computational methods have been proposed to account for thevariability in replicates. As yet, there is no model to output expression profiles accounting for replicate informationso that a variety of computational models that take the expression profiles as the input data can explore thisinformation without any modification.
Results: We propose a methodology which integrates replicate variability into expression profiles, to generateso-called ‘true’ expression profiles. The study addresses two issues: (i) develop a statistical model that can estimate‘true’ expression profiles which are more robust than the average profile, and (ii) extend our previous micro-clustering which was designed specifically for clustering time-series expression data. The model utilizes a previouslyproposed error model and the concept of ‘relative difference’. The clustering effectiveness is demonstrated throughsynthetic data where several methods are compared. We subsequently analyze in vivo rat data to elucidatecircadian transcriptional dynamics as well as liver-specific corticosteroid induced changes in gene expression.
Conclusions: We have proposed a model which integrates the error information from repeated measurementsinto the expression profiles. Through numerous synthetic and real time-series data, we demonstrated the ability ofthe approach to improve the clustering performance and assist in the identification and selection of informativeexpression motifs.
BackgroundGlobal gene expression analysis using microarrays hasbecome an essential tool to study genome-wide tran-scriptional responses. Although this high-throughputtechnology produces a huge volume of useful data,enabling researchers to study the response of thousandsof genes simultaneously, it faces many potential sourcesof uncertainties (e.g. technical noise, experimental treat-ments, biological sampling) [1,2]. As such, a number ofstatistical methods have demonstrated that the informa-tion contained in replicates is a valuable asset in orderto assign proper confidence levels [3-6]. Rocke et al. [7]proposed a model accounting for measurement error to
model gene expression profiles which has been usedoften in conjunction with variance-stabilizing transfor-mation [8-11] and model-based clustering [12,13]. Con-sequently, researchers are designing more experimentswith repeated measurements per gene per chip eventhough it is significantly more costly and time consum-ing. However, properly incorporating the replicate infor-mation remains a challenge.A typical step in analyzing gene microarray data
involves filtering for differential expression [14]. A num-ber of methods have been proposed in this directiondemonstrating the extensive insight gained in utilizingthe information from replicates for determining thechange of gene expression values e.g. t-test [15-17],ANOVA [18,19], SAM [20], EDGE [21]. An equallyimportant part of the analysis is clustering which has
* Correspondence: [email protected] Engineering Department, Rutgers University, Piscataway, NewJersey, USA
Nguyen et al. BMC Bioinformatics 2010, 11:279http://www.biomedcentral.com/1471-2105/11/279
© 2010 Nguyen et al; licensee BioMed Central Ltd. This is an Open Access article distributed under the terms of the Creative CommonsAttribution License (http://creativecommons.org/licenses/by/2.0), which permits unrestricted use, distribution, and reproduction inany medium, provided the original work is properly cited.

been proven to be a powerful tool to rationalize tran-scriptional responses, identify possible functional rela-tionships among them, and further elucidate importanttranscription factors as well as relevant biological path-ways [13]. However, most clustering methods do nottake into account the variability of gene expression pro-files in the form of replicates. Variability is usuallylumped into a mean effect and expression profiles areclustered based on average values of independentlyrepeated measurements for each gene, thus missing,potentially, useful information [12].Given that replicates can provide important insights
into the nature of inherent variability among geneexpression profiles [3], recent approaches haveattempted to incorporate repeated measurements. Thereare two primary ways to handle replicated data: (i) indir-ectly integrate the error information among replicatesinto a pairwise similarity metric between two expressionprofiles to produce a more robust distance metric, and(ii) directly integrate the replicate information into clus-tering models. The former offers a relative advantagesince clustering methods that take the distance metricas input can be utilized without any modification e.g.standard deviation-weighted correlation coefficient [22],shrinkage correlation coefficient [23]. Meanwhile, var-ious models have been proposed for (ii) including thosewhose design centers around a specific statistical model(e.g. Bayesian mixture model [24,25], linear mixedmodel [12], random-effects model [13]) and those thatare more general (e.g. CORE [26], trajectory clustering[27], mass distributed clustering [28]). Although suchapproaches produce more promising results, they arelimited in that only a small number of computationalmethods can explore this information while many othersrequiring expression profiles as the input cannot.In the present study we address a somewhat different
question, namely whether we can integrate the errorinformation into the time-series expression profiles sothat we can utilize a variety of computational models[29-31] that take the expression profiles as the requiredinput without any modification while taking intoaccount the advantage of using replicated data (espe-cially for clustering methods e.g. mclust [32], som [33],micro-clustering [34], consensus clustering [35], etc.).The most straightforward approach to estimate time-
series gene expression profiles is by computing the aver-age expression levels over all replicates for each gene ateach time-point (or condition in general). Of course,this approach does not properly take into account thevariability in repeated measurements [23,36]. Therefore,in an attempt to estimate more robust expression pro-files that integrate the error information from replicates,so-called ‘true’ expression profiles, we explore the errormodel [22] to estimate the ‘true’ mean expression value
of a gene across all time-points and the concept of ‘rela-tive difference’ driven by the theory of t-statistic [16,20]to compute the difference between the ‘true’ meanexpression value across all time-points and the meanexpression value at each time-point. Those relative dif-ferences are then used to infer the ‘true’ expression pro-file of the gene. Alternatively, we also explore thecapability of using spline to find ‘smoothing’ expressionprofiles that take into account all repeated measure-ments [37].We next demonstrate the effects of using the ‘true’
expression profiles in conjunction with clustering algo-rithms through synthetic and real time-series expressiondata. Following the convention of previous studies[23,36], we generated synthetic microarray data withknown structure of classes and used the adjusted Randindex [36,38] to evaluate the performance of clusteringvia three popular clustering methods: hierarchical clus-tering, partitional clustering (kmeans [39], pam [40])and model-based clustering (mclust [32]). Finally, weextend our earlier work that proposed a micro-cluster-ing approach designed specifically for clustering time-series expression data [34,41]. The approach involvestwo main steps: (1) a fine grained clustering step toidentify an extensive list of putative clusters based on asymbolic transformation, and (2) a selection step aimingat the determination of which clusters are significant asrepresentative of the underlying response. Additionally,we also propose a heuristic to automatically select theparameter values for the clustering method. For the finegrained clustering step, the basic formalism of SymbolicAggregate approXimation of time-series (SAX) has beenadopted and modified [42,43]. Each ‘true’ expressionprofile is transformed to a corresponding sequence ofsymbols and then hashed to a particular motif value. Asa result, all expression profiles with similar expressionpatterns will have identical symbolic representations andthus will be assigned to the same cluster.However, the fine grained clustering step produces a
large number of putative clusters while many of themare not significant enough to be considered as a repre-sentative expression pattern. Therefore, we propose aselection step based on the hypothesis that significantexpression patterns will more likely consist of a largenumber of individuals compared to random data, givena threshold (p-value). As a result, only those clusterswith a large-enough (based on the corresponding p-value) sizes are reported for subsequent investigations.Furthermore, due to the symbolic transformation heuris-tic of SAX the approach may produce several clusterswith similar expression patterns and thus we also pro-vide a heuristic to merge such clusters based on a criter-ion of maximizing the total homogeneity and separationof selected clusters.
Nguyen et al. BMC Bioinformatics 2010, 11:279http://www.biomedcentral.com/1471-2105/11/279
Page 2 of 15

Our results on synthetic data demonstrate that theclustering performance using ‘true’ expression profiles issuperior to that when using average expression profilesand also to other methods with integrated error infor-mation. The output of this process can be used as inputto a variety of other clustering methods without anymodification while taking into account the informationcontent in replicated data. Finally, we derive ‘true’ pro-files for three real (rat liver) time-series datasets (acute/chronic corticosteroid administration [30,44] and circa-dian [45]) and the explore the extended version ofmicro-clustering to select significant patterns of tran-scriptional response. Computational results are furthervalidated predicated upon literature evidence.
MethodsThe ‘true’ expression profilesIn order to utilize a variety of computational modelsthat take the expression profiles as the required inputwithout any modification while taking into account theinformation of repeated measurements, we will estimatea more robust expression profile that integrate the errorinformation from replicates. Let us assume that the‘average’ time-series expression profile of gene i acrossT time-points with Rt replicates at each time-point canbe generally represented as
g g gRt
gi it t
Tit itr
r= { } == ∑1
1,
The subscripts i, t, r indicate the gene id, time, andreplicate respectively. The procedure to estimate the‘true’ expression profile consists of two main steps:i. Estimate the ‘true’ mean expression value of a geneacross all time-pointsUtilizing the variance (error) of repeated measurementsat each time-point sit, the error model weights the aver-age expression values at each time-point when comput-ing the mean expression value of the gene across alltime-points [22]
gwtt
w g where
w itif
if or R
i t it
t
T
tit
it t
∧ =∑
=≠
= =
⎡
⎣
⎢⎢⎢
=∑1
10
1 0 1
1
iit itr itrRt
g g2 211
=−
−( )∑
(1)
The variance of g i∧ can be calculated in two ways: one
is to propagate the errors sit and the other is from thescatter of around g i
∧
p tt
s t it it
w or
w g gT wtt
2 2
22
1
11
=
= −⎛⎝⎜
⎞⎠⎟
∑
∑− ∑∧
( )
(2)
The propagation of variance sp is based on the errorestimation of each individual time-point, leading to biasand/or systematic uncertainties whereas the other ss haslarge fluctuation when the number of measurements issmall although it is an unbiased measure. Statisticallyone can combine these two variances in estimation ofthe variance for g i
∧ [22]
gi
p T sT∧
=+ −( )1
(3)
ii. Estimate the relative difference between the ‘true’ meanexpression value across all time-points and that at eachtime-point (one is replaced for the ‘true’ mean expressionvalue)In order to infer the expression value at each time-pointof a gene, we utilized the concept of ‘relative difference’[16,20] from the t-statistic to estimate its differencefrom the ‘true’ mean expression value of the gene. Letdit represent the relative difference between the ‘true’mean expression value across all time-points and themean value at a specific time-point:
dit
git gi
st Rt T
= −
+
∧
1 1(4)
where st is the standard deviation of these two quanti-ties
s
Rt it T
g iRt Tt =
−( ) + −( )
+ −
∧1 2 1 2
2
(5)
And thus, we propose a more accurate estimation ofthe average expression value at a specific time-point asfollows
g g dit i it’ = +∧ (6)
As we rationalized the importance of microarray repli-cates in the background section, we hypothesize that theexpression profiles would be more robust if there issome statistical approach that integrates the error infor-mation from replicates into the estimation. For averageexpression profiles, the expression value at a specifictime-point is g g g g where g git i it i i ittT= + −( ) = ∑1 .In a similar manner we obtain formula (6) in a way that
Nguyen et al. BMC Bioinformatics 2010, 11:279http://www.biomedcentral.com/1471-2105/11/279
Page 3 of 15
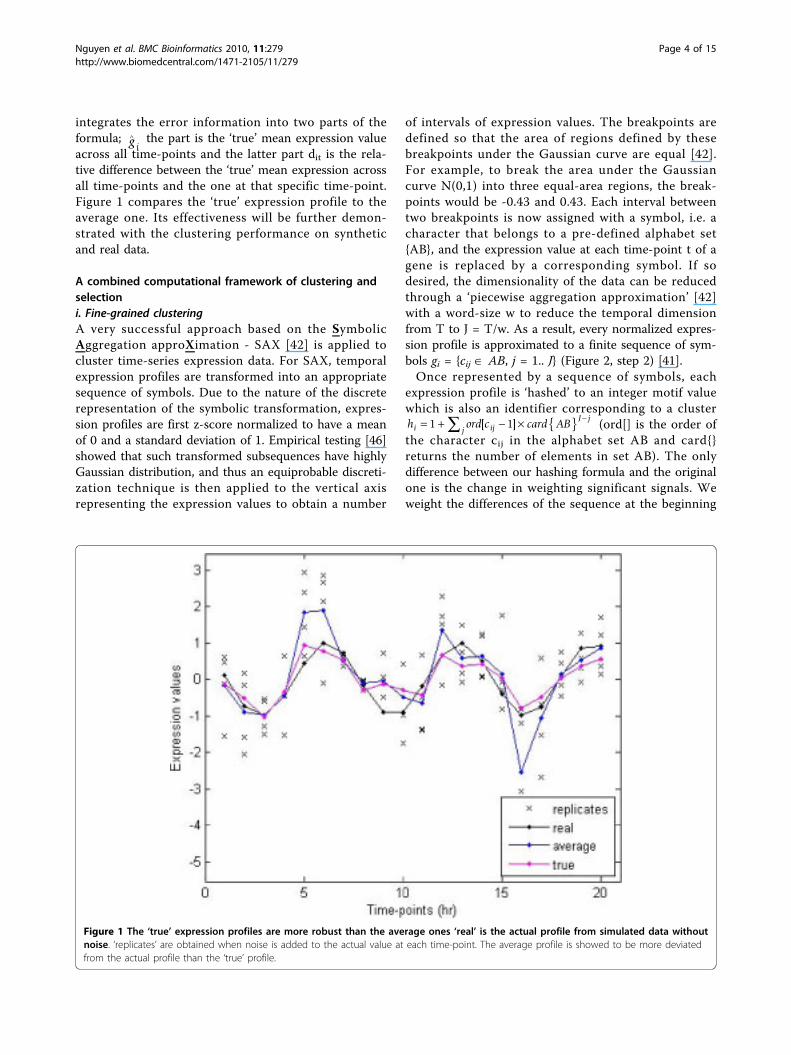
integrates the error information into two parts of theformula; g i
∧ the part is the ‘true’ mean expression valueacross all time-points and the latter part dit is the rela-tive difference between the ‘true’ mean expression acrossall time-points and the one at that specific time-point.Figure 1 compares the ‘true’ expression profile to theaverage one. Its effectiveness will be further demon-strated with the clustering performance on syntheticand real data.
A combined computational framework of clustering andselectioni. Fine-grained clusteringA very successful approach based on the SymbolicAggregation approXimation - SAX [42] is applied tocluster time-series expression data. For SAX, temporalexpression profiles are transformed into an appropriatesequence of symbols. Due to the nature of the discreterepresentation of the symbolic transformation, expres-sion profiles are first z-score normalized to have a meanof 0 and a standard deviation of 1. Empirical testing [46]showed that such transformed subsequences have highlyGaussian distribution, and thus an equiprobable discreti-zation technique is then applied to the vertical axisrepresenting the expression values to obtain a number
of intervals of expression values. The breakpoints aredefined so that the area of regions defined by thesebreakpoints under the Gaussian curve are equal [42].For example, to break the area under the Gaussiancurve N(0,1) into three equal-area regions, the break-points would be -0.43 and 0.43. Each interval betweentwo breakpoints is now assigned with a symbol, i.e. acharacter that belongs to a pre-defined alphabet set{AB}, and the expression value at each time-point t of agene is replaced by a corresponding symbol. If sodesired, the dimensionality of the data can be reducedthrough a ‘piecewise aggregation approximation’ [42]with a word-size w to reduce the temporal dimensionfrom T to J = T/w. As a result, every normalized expres-sion profile is approximated to a finite sequence of sym-bols gi = {cij Î AB, j = 1.. J} (Figure 2, step 2) [41].Once represented by a sequence of symbols, each
expression profile is ‘hashed’ to an integer motif valuewhich is also an identifier corresponding to a clusterh ord c card ABi ij
J j
j= + − × { } −∑1 1[ ] (ord[] is the order of
the character cij in the alphabet set AB and card{}returns the number of elements in set AB). The onlydifference between our hashing formula and the originalone is the change in weighting significant signals. Weweight the differences of the sequence at the beginning
Figure 1 The ‘true’ expression profiles are more robust than the average ones ‘real’ is the actual profile from simulated data withoutnoise. ‘replicates’ are obtained when noise is added to the actual value at each time-point. The average profile is showed to be more deviatedfrom the actual profile than the ‘true’ profile.
Nguyen et al. BMC Bioinformatics 2010, 11:279http://www.biomedcentral.com/1471-2105/11/279
Page 4 of 15

heavier than that of the end. Consistent with this is theobservation that the signals that are correlated at earlytime-points will be more closely related than those thatare correlated at the end of the time series [34]. As aresult, we attain a number of clusters for the data whichis up to two most important parameters of the hashingformula i.e. the alphabet size a = card{AB} and theword size w (Figure 2, step 3) (a more detail discussionis presented in [41]).ii. Selection of significant clustersThe fine-grained clustering step assigns a unique identi-fier to all transcriptional profiles so that genes withsimilar expression profiles will be hashed to the samemotif values. However, the approach generates a largenumber of identifiers due to the nature of the hash for-mula, resulting in a huge number of clusters with manytrivial ones i.e. clusters with sizes too small to be con-sidered as significant expression patterns of transcrip-tional responses. Therefore, following our previous work[35] we assign each cluster a simple hypothetical quan-tity called ‘cluster significance’ which is simply the clus-ter size. In order to select significant clusters, we firstestimate the distribution of cluster significance usingrandom data and then compute the p-value for eachcluster above. The data after step 1 is randomlyresampled (based on the convex-hull approach [47]),and the entire process starting from step 2 to step 3 isrun with the same parameters. The process is repeatednr times (nr = 100 in this study) and we get totally Nrandom clusters. Because of the underlying equiprobabledistribution associated with SAX, random expression
profiles will be assigned to different hash values withequal probability, resulting in the small size for almostall random clusters. Therefore, we hypothesized that thesmaller the size of the cluster, the more likely the corre-sponding clusters are to be random. Based on thishypothesis, the p-value of a cluster with size ‘s’ isdefined as the total number of random clusters with thesizes at least s over N random clusters. As a result,given a p-value we can infer the cluster-size cutoff forthe selection process and only those clusters whose sizesare larger than that cutoff are reported as significantclusters for further investigation (Figure 2, step 4).iii. Merging similar expression patternsBecause converting an expression profile to a sequenceof symbols is an approximation, related expression pro-files may be hashed to similar (not the same) sequencesof symbols albeit different motif values. Consequently,resulting clusters can have similar expression patternsbut assigned to two or more clusters. Since the clusterhomogeneity reflects how similar are expression profilesin the same cluster whereas cluster separation quantifieshow well different expression profiles are separated, wepropose an optional procedure in order to merge similarclusters together based on the assumption that the sumof homogeneity and separation of all final clusters ismaximized (Figure 2, step 5). Starting with all signifi-cantly selected clusters, the procedure searches for agrouping of two clusters so that their combination cangenerate a maximal increase of the sum of homogeneityand separation of all current clusters after mergingthose two clusters. The process is repeated until no
Figure 2 Computational framework for clustering and selection.
Nguyen et al. BMC Bioinformatics 2010, 11:279http://www.biomedcentral.com/1471-2105/11/279
Page 5 of 15
more combinations are found i.e. any new combinationalways reduces the sum of homogeneity and separation.Eventually, a list of significant expression patterns thatcharacterize the underlying transcriptional response isgenerated.
MaterialsSynthetic dataFollowing the convention of previous studies [23,36], wegenerate synthetic data which contain 6 clusters ofgenes, each of which consists of 66 genes across T = 20time-points. Four of six clusters are generated using thesine function plus some noise
g t T xitr m m i it itr= +( ) +sin
and the other two are generated following a non-peri-odic linear function plus some noise
g t T xitr i it itr= ± +
Here the subscript m denotes the cluster number andi, t, r indicate the gene id, the time, and the replicatenumbers respectively. Therefore, {gitr} is a syntheticexpression profile of a simulated gene with r replicatesfor each of T time-points. The parameters ωm and jm
represent the random wavelength and random shift forcluster m (ωm Î [0.5π, 5π], jm Î [0,2π]). a is the levelof noise which is 1.0 for low noise and 2.5 for highnoise in this study. The parameters si and sit representthe error levels for gene i and for experiment at time-point t which are randomly drawn from a uniformdistribution in the interval [0.2, 1.2]. Finally, xitr is a ran-dom variable drawn from a standard normal distributionto create the variability for replicates.
Acute corticosteroid dataForty-seven male ADX Wistar rats weighting from 225 to250 g underwent right jugular vein cannulation underlight ether anesthesia 1 day before the study [30]. Forty-three rats were injected with a single intravenous bolusdose of methylprednisolone (MPL) of 50 mg/kg. Animalswere sacrificed by exsanguinations under anesthesia andliver samples were harvested at 0.25, 0.5, 0.75, 1, 2, 4, 5,5.5, 6, 7, 8, 12, 18, 30, 48, and 72 after dosing. The sam-pling time points were selected based on preliminary stu-dies describing GR dynamics and enzyme induction inliver. Four untreated rats were randomly sacrificed as con-trols. The gene expression was obtained via the AffymetrixRG-U34A array which consists of 8,799 probesets. Thedata are publicly available through the GEO OmnibusDatabase (http://www.ncbi.nlm.nih.gov/geo/) under theaccession number GDS253. After filtering by ANOVA
(p-value = 0.05) [19,35], 2,920 probesets considered as dif-ferential expression are used for further analysis.
Chronic corticosteroid dataIn a similar experiment model, forty rats were adminis-tered a low level of 0.3 mg/kg/hr infusions of MPL over168 h via an Azlet pump [44]. The pump drug solutionswere prepared for each rat based on its predose bodyweight. Animals were sacrificed at various times up to7 days; specifically the time-points included are 6, 10, 13,18, 24, 36, 48, 72, 96, and 168 h. A control group of fouranimals was implanted with a saline-filled pump andkilled at various times throughout the 7-day study period.Unlike the previous experiment, the microarray platformfor this dataset is the RAE230A which consists of 15,923probesets. The data are publicly available through theGEO Omnibus Database under the accession numberGDS972. After filtering by ANOVA (p-value = 0.05),4,361 probesets are selected as significantly differentiallyexpressed probesets for further analysis.
Circadian dataTo examine the fluctuations of gene expression patternsin liver within the 24 hour circadian cycle in normalanimals, fifty four normal male Wistar rats (bodyweights ~ 225-275 g) were housed and allowed to accli-matize in a constant-temperature environments (22°C)equipped with 12 h light/dark cycle [45]. Twenty-sevenrats (Group I) were acclimatized for 2 weeks prior tostudy to a normal light/dark cycle where lights went onat 8 AM and off at 8 PM whereas the other 27 rats(Group II) were acclimatized a reserved light/dark cyclewhere lights went on at 8 PM and off at 8 AM. Rats inGroup I were killed in three successive days at 0.25, 1,2, 4, 6, 8, 10, 11, 11.75 hr after lights on to capture thelight period. Rats in Group II were killed on three suc-cessive days at 12.25, 13, 14, 16, 18, 20, 22, 23, 23.75 hafter lights on to capture the dark period. Animals sacri-ficed at the same time on successive days were treatedas triplicate measurements. The gene expression wasobtained via the Affymetrix RAE230A array which con-sists of 15,923 probesets. The data are publicly availablethrough the GEO Omnibus Database under the acces-sion number GSE8988. After filtering by ANOVA(p-value = 0.05), 2,468 probesets considered as differen-tial expression are used for further analysis.
Results and DiscussionThe ‘true’ expression profile improves cluster quality onsynthetic dataTo evaluate the effectiveness of the ‘true’ expressionprofile compared to using the ‘average’ profile, we usethe synthetic data with known class structure asdescribed earlier. As in previous studies [23], we also
Nguyen et al. BMC Bioinformatics 2010, 11:279http://www.biomedcentral.com/1471-2105/11/279
Page 6 of 15
assess the effect of the number of replicates on clusterquality. Each synthetic data contains 20 time-pointswith r replicates (r = 2, 3, 4, 5, 6, 7, 8, 9, 10) at eachtime-point and two different levels of noise (low andhigh). In addition to comparing the clustering perfor-mance using the ‘true’ profiles with the average profile,we also compare with several other methods that takeinto account error information from replicated data.Specifically, we measure cluster quality when using twotypical similarity distance metrics which include theerror information, namely the standard deviation (SD)-weighted correlation coefficient [22] and the shrinkagecorrelation coefficient [23]. Since our model generatesexpression profiles which are applicable to any cluster-ing method, we also tested an alternative methodwhich uses cubic splines to infer expression profileswhich account for repeated measurements, so-called‘smoothing’ profiles. For each gene, we establish twovectors - one consist of all replicates and another con-tains corresponding time-points. They are then inputinto function ‘smooth.spline’ in stats R package [37];other parameters (e.g. the degree of freedom, smoothingparameters) are optimized from an internal ‘generalized’cross-validation process provided by the tool. After that,the expression value at each time-point is inferred tocreate the ‘smoothing’ profile for the gene. Subsequently,the Pearson correlation coefficient is applied to estimatethe similarity distance between two genes with the aver-age profiles, the ‘true’ ones, and the ‘smoothing’ ones.After obtaining the pairwise distance matrix, we applythree popular clustering methods: hierarchical clustering(with average linkage option, available in MATLAB),partitional clustering (k-means [39], pam [40]), andmodel-based clustering (mclust [32]) to cluster the datainto six clusters. In order to assess the clustering perfor-mance, we use the adjusted Rand index [36,38] which isa statistic that measures the extent of concurrencebetween the clustering results and the underlyingknown class structure. The larger the Rand index is, thehigher the agreement between clustering results andprior knowledge of class structure i.e. better clusteringperformance.Figure 3 depicts the clustering performance when
using our proposed model compared to otherapproaches. We evaluate the average of 1000 randomlygenerated synthetic data sets. Figure 3a and 3b show thecomparisons using hierarchical clustering. For the low-noise level (Figure 3a), the clustering performance usingthe ‘true’ profiles is slightly worse than that whenusing the SD-weighted correlation coefficient metricor ‘smoothing’ profiles. However, it is still muchbetter than that when using the average profiles. For thehigh-noise level, it is comparable to the best achievableby any other method (Figure 3b). When other clustering
methods are used (e.g. kmeans - Figure 3c &3d, pam -Figures 3e &3f, mclust - Figures 3g &3h), the clusteringperformance on the ‘true’ expression profiles is alwayssuperior, or comparable, to any other approach on bothlow and high noise data, and far better than that of theaverage profiles in high noise data. Additionally, whendatasets are sampled with few time instants, the pro-posed approach is more advantageous than the alter-native method that uses spline to infer expressionprofiles due to the ‘overfitting’ issue (detailed results inAdditional File 1 and Additional File 2).
Liver response to acute corticosteroid administrationWe analyze 2,920 probesets that are significantly differ-entially expressed. Cluster analysis and selection withour framework (Figure 2) yields fourteen significantclusters given a p-value = 0.05 for the selection, corre-sponding to the cutoff cluster-size 34 (Figure 4a). Theresults presented here are based on the alphabet sizea = 3 and the word size w = 3 (see Statistical andComputational Issues section). In total, we identify1,219 probesets which are divided into two main expres-sion patterns: early up or down regulation followed byreturning to the baseline state. This is shown moreclearly with the 4 clusters after merging (Figure 4b). Inbrief, clusters 1 & 4 (51 and 768 probesets respectively)exhibit an up-expression pattern. These clusters showan induction with a maximum at around 5 h with somefluctuation around the peak and then exhibit a fastdecline to the baseline after about 18 h. Cluster 2 & 3which consist of 58 and 342 probesets respectively exhi-bit a down-expression pattern. As depicted in Figure 4b,they exhibit a down-regulation during the first 5 h andthen return to baseline at around 18 h. Generally, theprogression of the transcriptional responses of the acutecorticosteroid dataset is comprised of a deviation awayfrom the baseline as the drug is injected into the systemand an eventual return back to the baseline. This overallsystemic response is similar to the response describedby an indirect effect model presented in [48]. Althoughthe drug is cleared within about 6 hours the longer timeto return to baseline is due to a continuing cascade ofevents that were initiated by the drug but continue longafter the drug is gone.Liver response to chronic corticosteroid administrationUnder a chronic administration of corticosteroids, 4,361probesets are selected as differential expression usingANOVA (p-value = 0.05). Similarly, we apply the pro-posed model to convert these expression profiles to‘true’ expression profiles and then further analyze themthrough our clustering and selection process. In thiscase, we also use the threshold p-value = 0.05 for theselection of significant clusters but the clustering para-meters are different, specifically the alphabet size a = 3
Nguyen et al. BMC Bioinformatics 2010, 11:279http://www.biomedcentral.com/1471-2105/11/279
Page 7 of 15

Figure 3 The performance of typical clustering methods on different error-measurement integrated approaches. ‘stddev’ represents forthe clustering performance on synthetic data using the approach with the SD-weighted correlation coefficient metric; similarly, ‘shrinkage’ is forthe approach with the shrinkage correlation coefficient metric; ‘average’ is for the clustering performance on average profiles; ‘true’ is for that on‘true’ profiles; and ‘smoothing’ is for that when using method ‘spline’ to infer the expression profiles and then clustering. The horizontal axisshows the corresponding number of replicates in the dataset while the vertical axis demonstrates the clustering performance of thecorresponding approach (the higher the better). Results are the average of clustering accuracies over 1000 randomly generated syntheticdatasets.
Nguyen et al. BMC Bioinformatics 2010, 11:279http://www.biomedcentral.com/1471-2105/11/279
Page 8 of 15

Figure 4 Selected expression patterns from the acute corticosteroid dataset; (a) before merging and (b) after merging. The horizontalaxis is seventeen time-points (0, 0.25, 0.5, 0.75, 1, 2, 4, 5, 5.5, 6, 7, 8, 12, 18, 30, 48, 72 hours) and the vertical axis is the normalized (z-score) ofexpression values from ‘true’ expression profiles. Error bars are two standard deviations of expression values at each particular time-point.
Nguyen et al. BMC Bioinformatics 2010, 11:279http://www.biomedcentral.com/1471-2105/11/279
Page 9 of 15

and the word size w = 2 (see Statistical and Computa-tional Issues section). Results are shown in Figure 5with 23 clusters and a total number of 1,060 selectedprobesets (Figure 5a). After merging using the criterionof maximal sum of the homogeneity and separation, weobtain 8 clusters which show more clearly the patternsof the transcriptional responses when the drug ischronically administrated over a long period (Figure 5b).Generally, there are four main expression patternswhich are very different from the transcriptionalresponses of acute corticosteroid administration. Inbrief, cluster 1, 2, and 5 which contain 176, 38, 34 pro-besets respectively characterize a pattern with a slightlyearly down-regulation early followed by a sustained up-regulation and eventual convergence to a new steadystate in the presence of the drug. The second patterncharacterized by cluster 3, 6, and 8 (583, 63, 64 probe-sets respectively) exhibits an induction of about 10 hand then down-regulated and stabilization to a newsteady state. Cluster 4 (41 probesets) shows the thirdexpression pattern which exhibits a simple repressionwith a maximum at around 18 h followed by an induc-tion at around 50 h and a slower return and evolvingdynamics as late as 168 h. Opposite with this, cluster 7(61 probesets) shows the pattern that consists of a sim-ple induction with a maximum at around 18 h followedby a repression at around 50 h and a similarly evolvingdynamics.
Circadian patterns in liverIn order to have a comparison between circadian regu-lated gene expression patterns with those directly regu-lated by corticosteroids, we provide here an analysis ofcircadian rhythms of mRNA expression in the liver ofadult male rats. The dataset consists of 2,468 signifi-cantly differentially expressed probesets (filtered byANOVA with p-value = 0.05) for which we further iden-tify the ‘true’ expression profiles. Subsequently, we applythe proposed framework to cluster and select significanttranscriptional responses with the alphabet size a = 3,the word size w = 3 (see Statistical and ComputationalIssues section), and the threshold p-value = 0.05 for theselection of significant clusters. We identify 816 probe-sets which are divided into 24 statistically significantexpression patterns (Figure 6a). However, after the mer-ging process we obtain eight main expression patterns(Figure 6b). In brief, cluster 1 (65 probesets) shows anearly down-regulation at around 5 h (in the light period)and then up-regulation with a maximal peak at around15 h (in the dark period). Similarly to this pattern, clus-ter 4 (259 probesets) shows a late down regulationat around 10 h and then up-regulation at around 20 h.In contrast to these two patterns, cluster 8 (63 probe-sets) and cluster 5 (113 probesets) present a pattern
with early, and late respectively, up-regulation and thendown regulation. Cluster 2 (168 probesets) and cluster 3(32 probesets) are characterized by an simple inductionwith a maximum at around 12 h and 15 h respectivelyfollowed by a return to the baseline at 24 h. In theopposite direction, cluster 6 (78 probesets) and cluster 7(38 probesets) show a simple repression with a maxi-mum at around 10 h and 15 respectively. Therefore,without any assumption about the periodicity of thedata it is still possible to capture the underlying tran-scriptional responses, i.e., expression patterns, within thedata. Selected patterns are in concurrence with those ina previous report that assumes the periodicity [45].
Statistical and computational issuesWith the importance of information implicitly includedin the replicates, several pairwise similarity distancemetrics as well as particular clustering models havebeen proposed to take this information into account.However, unless these specific metrics are employed,replicate information cannot be utilized in conjunctionwith alternative methods. As an example, distancemetrics that take replicates into account (e.g. stddev,shrinkage) are not applicable to model-based clustering(mclust), micro-clustering or any consensus-clusteringmethod since these require the application of a collec-tion of multiple, alternative, clustering methods. There-fore, we proposed a model to generate more robustgene expression profiles for general computational ana-lyses so that they can be applied without any modifica-tion while still taking into account the replicateinformation. Alternatively, ones can explore the benefitsfrom ‘smoothing’ expression profiles which are alsoexpression profiles with integrated error information.However when ‘smoothing’ profiles are used in conjunc-tion with clustering it is very critical to identify andselect appropriate smoothing parameters. Due to thedistribution of replicates around the mean expressionvalues, ‘smoothing’ approaches can easily fail in detect-ing proper parameters to recover the actual profiles. Asa result, the cluster quality using ‘smoothing’ profilesgets progressively worse on data with high-noise levelsalthough it offers some advantages at low-noise levels.The ‘true’ expression profile approach does not only
consider the error information from repeated measure-ments at each time-point but also takes into account thedynamics of expression across all time-points when esti-mating the ‘true’ mean expression value of a gene g i
∧ .Such characteristics are best demonstrated through theexamination of the clustering performance on the syn-thetic data. Generally, in all cases the clustering perfor-mance using the ‘true’ expression profiles is superior tothat when the average profiles are used, suggesting thatour proposed model which integrates the error
Nguyen et al. BMC Bioinformatics 2010, 11:279http://www.biomedcentral.com/1471-2105/11/279
Page 10 of 15

Figure 5 Selected expression patterns from the chronic corticosteroid dataset; (a) before merging and (b) after merging. The horizontalaxis is eleven time-points (0, 6, 10, 13, 18, 24, 36, 48, 72, 96, 168 hours) and the vertical axis is the normalized (z-score) of expression values from‘true’ expression profiles. Error bars are two standard deviations of expression values at each particular time-point.
Nguyen et al. BMC Bioinformatics 2010, 11:279http://www.biomedcentral.com/1471-2105/11/279
Page 11 of 15

Figure 6 Selected expression patterns from the circadian dataset; (a) before merging and (b) after merging. The horizontal axis iseighteen time-points (0.25, 1, 2, 4, 6, 8, 10, 11, 11.75, 12.25, 13, 14, 16, 18, 20, 22, 23, 23.75 hours) and the vertical axis is the normalized (z-score)of expression values from ‘true’ expression profiles. Error bars are two standard deviations of expression values at each particular time-point.
Nguyen et al. BMC Bioinformatics 2010, 11:279http://www.biomedcentral.com/1471-2105/11/279
Page 12 of 15

information from repeated measurements into expressionprofiles offers clear advantage when used in clustering.Regarding the micro-clustering, there are two most
important parameters in our symbolic transformationstep: the alphabet size ‘a’ and the word size ‘w’. Differ-ent values of these parameters can lead to different clus-tering results. Therefore, we have proposed a heuristicto select the values for those parameters by defining aquantity, so-called ‘the quality of the selection’, thattakes into account both the number of selected probe-sets and their coherence in selected clusters as follows
QS a wof selected probesets
of all probesetshomogeneity se( , )
##
= × + pparation( ) 2
The homogeneity and separation is estimated as instep 5 of the framework (Figure 2). For each dataset, wemake an exhaustive search for all commonly used valuesof these two parameters (’a’ from 3 to 5, ‘w’ from 1to 3) and select the one corresponding to the maximalQS (Figure 7). The heuristic is applied in order to pro-vide parameters for the clustering analysis of real time-series datasets used in this study. Besides, another
Figure 7 Effects of parameters on the selection. (a) Illustration results from the acute corticosteroid dataset (left is the optimal parameters fora given dataset and right is the corresponding cluster-size for a given p-value); (b) Illustration results from the chronic corticosteroid dataset; and(c) Illustration results from the circadian dataset.
Nguyen et al. BMC Bioinformatics 2010, 11:279http://www.biomedcentral.com/1471-2105/11/279
Page 13 of 15

important threshold is the significant p-value for clusterselection which can be inferred to corresponding clus-ter-size cutoff values (Figure 7). In this study, we consid-ered only one value (p-value = 0.05) for this parameterin the selection process. As a result, given a dataset theproposed framework can automatically select therequired parameters and do the analysis without anyprior knowledge.
ConclusionsWe have proposed a statistical model that accounts forthe variability in repeated measurements to estimatemore robust expression profiles, so-called ‘true’ expres-sion profiles. The effectiveness of the model has beendemonstrated on synthetic data as the method thatachieves superior and/or comparable clustering perfor-mance to that of other related approaches, especiallymuch better to that when using the average expressionprofiles. The output of this representation can be usedas a powerful input to a variety of computational modelsthat require gene expression profiles as their input,especially when used in conjunction with clustering.Furthermore, we extend our prior micro-clustering algo-rithm, designed specifically for clustering time-seriesexpression data, by developing a criterion for the selec-tion of significant clusters; the merging of similarexpression patterns; and providing a heuristic to identifyparameters for optimal cluster selection. Results on realtime-series gene expression data have demonstrated theeffectiveness and usefulness of the approach.
Additional file 1: Supplemental Data. Provide detailed clusteringresults in this study, including cluster_id, probeset_id, gene_id andcorresponding ‘true’ expression profiles of identified probesets inresponses to acute/chronic corticosteroid administration and in circadianpatterns. Detailed results of Figure 3 are also included.
Additional file 2: Expression Paterns. Provide detailed clustering resultsin this study, including cluster_id, probeset_id, gene_id andcorresponding ‘true’ expression profiles of identified probesets inresponses to acute/chronic corticosteroid administration and in circadianpatterns.
AcknowledgementsTTN and IPA acknowledge financial support from the NIH under grantGM082974, the EPA under grant GAD R 832721-010. RRA, DCD and WJJacknowledge financial support from the NIH under grant GM 2421. Theauthors would like to thank Dr. Ka Yee Yeung and Dr. Jianchao Yao forhelpful guidance.
Author details1BioMaPS Institute for Quantitative Biology, Rutgers University, Piscataway,New Jersey, USA. 2Biomedical Engineering Department, Rutgers University,Piscataway, New Jersey, USA. 3Chemical & Biochemical EngineeringDepartment, Rutgers University, Piscataway, New Jersey, USA. 4Departmentof Pharmaceutical Sciences, State University of New York at Buffalo, Buffalo,New York, USA. 5Department of Biological Sciences, State University of NewYork at Buffalo, Buffalo, New York, USA. 6New York State Center of Excellencein Bioinformatics and Life Sciences, Buffalo, New York, USA.
Authors’ contributionsTTN designed the algorithms and experiments, devised and implementedthe algorithms. RRA, DCD and WJJ reviewed the material and contributed tothe discussion. IPA organized the activities and structured the approach. Allauthors all authors read and approved the final manuscript.
Received: 8 October 2009 Accepted: 26 May 2010Published: 26 May 2010
References1. Altman N: Replication, variation and normalisation in microarray
experiments. Appl Bioinformatics 2005, 4(1):33-44.2. Churchill GA: Fundamentals of experimental design for cDNA
microarrays. Nat Genet 2002, 32(Suppl):490-495.3. Lee ML, Kuo FC, Whitmore GA, Sklar J: Importance of replication in
microarray gene expression studies: statistical methods and evidencefrom repetitive cDNA hybridizations. Proc Natl Acad Sci USA 2000,97(18):9834-9839.
4. Lonnstedt I, Speed T: Replicated microarray data. Statistica Sinica 2002,12:31-46.
5. Pan W, Lin J, Le CT: How many replicates of arrays are required to detectgene expression changes in microarray experiments? A mixture modelapproach. Genome Biol 2002, 3:5.
6. Pavlidis P, Li Q, Noble WS: The effect of replication on gene expressionmicroarray experiments. Bioinformatics 2003, 19(13):1620-1627.
7. Rocke DM, Durbin B: A model for measurement error for gene expressionarrays. J Comput Biol 2001, 8(6):557-569.
8. Durbin BP, Hardin JS, Hawkins DM, Rocke DM: A variance-stabilizingtransformation for gene-expression microarray data. Bioinformatics 2002,18(Suppl 1):S105-110.
9. Huber W, von Heydebreck A, Sultmann H, Poustka A, Vingron M: Variancestabilization applied to microarray data calibration and to thequantification of differential expression. Bioinformatics 2002, 18(Suppl 1):S96-104.
10. Lin SM, Du P, Huber W, Kibbe WA: Model-based variance-stabilizingtransformation for Illumina microarray data. Nucleic Acids Res 2008, 36(2):e11.
11. Motakis ES, Nason GP, Fryzlewicz P, Rutter GA: Variance stabilization andnormalization for one-color microarray data using a data-drivenmultiscale approach. Bioinformatics 2006, 22(20):2547-2553.
12. Celeux G, Martin O, Lavergne C: Mixture of linear mixed models forclustering gene expression profiles from repeated microarrayexperiments. Statistical Modelling 2005, 5(3):243-267.
13. Ng SK, McLachlan GJ, Wang K, Ben-Tovim Jones L, Ng SW: A mixturemodel with random-effects components for clustering correlated gene-expression profiles. Bioinformatics 2006, 22(14):1745-1752.
14. Pan W: A comparative review of statistical methods for discoveringdifferentially expressed genes in replicated microarray experiments.Bioinformatics 2002, 18(4):546-554.
15. Begun A: Power estimation of the t test for detecting differential geneexpression. Funct Integr Genomics 2008, 8(2):109-113.
16. de Menezes RX, Boer JM, van Houwelingen HC: Microarray data analysis: ahierarchical T-test to handle heteroscedasticity. Appl Bioinformatics 2004,3(4):229-235.
17. McCarthy DJ, Smyth GK: Testing significance relative to a fold-changethreshold is a TREAT. Bioinformatics 2009, 25(6):765-771.
18. Churchill GA: Using ANOVA to analyze microarray data. Biotechniques2004, 37(2):173-175, 177.
19. Pavlidis P: Using ANOVA for gene selection from microarray studies ofthe nervous system. Methods 2003, 31(4):282-289.
20. Tusher VG, Tibshirani R, Chu G: Significance analysis of microarraysapplied to the ionizing radiation response. Proc Natl Acad Sci USA 2001,98(9):5116-5121.
21. Storey JD, Xiao W, Leek JT, Tompkins RG, Davis RW: Significance analysis oftime course microarray experiments. Proc Natl Acad Sci USA 2005,102(36):12837-12842.
22. Hughes TR, Marton MJ, Jones AR, Roberts CJ, Stoughton R, Armour CD,Bennett HA, Coffey E, Dai H, He YD, et al: Functional discovery via acompendium of expression profiles. Cell 2000, 102(1):109-126.
Nguyen et al. BMC Bioinformatics 2010, 11:279http://www.biomedcentral.com/1471-2105/11/279
Page 14 of 15

23. Yao J, Chang C, Salmi ML, Hung YS, Loraine A, Roux SJ: Genome-scalecluster analysis of replicated microarrays using shrinkage correlationcoefficient. BMC Bioinformatics 2008, 9:288.
24. Medvedovic M, Sivaganesan S: Bayesian infinite mixture model basedclustering of gene expression profiles. Bioinformatics 2002,18(9):1194-1206.
25. Medvedovic M, Yeung KY, Bumgarner RE: Bayesian mixture model basedclustering of replicated microarray data. Bioinformatics 2004,20(8):1222-1232.
26. Tjaden B: An approach for clustering gene expression data with errorinformation. BMC Bioinformatics 2006, 7:17.
27. Phang TL, Neville MC, Rudolph M, Hunter L: Trajectory clustering: a non-parametric method for grouping gene expression time courses, withapplications to mammary development. Pac Symp Biocomput 2003,351-362.
28. Matsumoto S, Aisaki K, Kanno J: Mass distributed clustering: a newalgorithm for repeated measurements in gene expression data. GenomeInform 2005, 16(2):183-194.
29. Asyali MH, Colak D, Demirkaya O, Inan MS: Gene expression profileclassification: a review. Current Bioinformatics 2006, 1:55-73.
30. Jin JY, Almon RR, DuBois DC, Jusko WJ: Modeling of corticosteroidpharmacogenomics in rat liver using gene microarrays. J Pharmacol ExpTher 2003, 307(1):93-109.
31. Ramakrishnan R, DuBois DC, Almon RR, Pyszczynski NA, Jusko WJ:Pharmacodynamics and pharmacogenomics of methylprednisoloneduring 7-day infusions in rats. J Pharmacol Exp Ther 2002, 300(1):245-256.
32. Fraley Raftery A: mclust: Model-Based Clustering/Normal MixtureModeling. R packages 2007.
33. Yan J: som: Self-Organizing Map. R packages 2004.34. Yang E, Maguire T, Yarmush ML, Berthiaume F, Androulakis IP:
Bioinformatics analysis of the early inflammatory response in a ratthermal injury model. BMC Bioinformatics 2007, 8:10.
35. Nguyen TT, Nowakowski RS, Androulakis IP: Unsupervised Selection ofHighly Coexpressed and Noncoexpressed Genes Using a ConsensusClustering Approach. Omics 2009.
36. Yeung KY, Medvedovic M, Bumgarner RE: Clustering gene-expression datawith repeated measurements. Genome Biol 2003, 4(5):R34.
37. R Development Core Team: The R stats package. R packages 2008.38. Hubert L, Arabie P: Comparing partitions. J Classification 1985, 2(1):193-218.39. Jang RJ: DCPR (Data Clustering and Pattern Recognition) Toolbox. [http://
www.cs.nthu.edu.tw/~jang].40. Maechler M, Rousseeuw P, Struyf A, Hubert M: cluster: Cluster Analysis
Basics and Extensions. R packages 2005.41. Yang E, Almon RR, DuBois DC, Jusko WJ, Androulakis IP: Identification of
global transcriptional dynamics. PLoS 2009.42. Keogh E, Lin J, Fu A: HOT SAX: efficiently finding the most unusual time
series subsequence. 5th IEEE International Conference on Data Mining 2005.43. Keogh E, Lin J, Truppel W: Clustering of Time Series Subsequences is
Meaningless: Implications for Previous and Future Research. 3rd IEEEInternational Conference on Data Mining 2003, 115.
44. Almon RR, DuBois DC, Jusko WJ: A microarray analysis of the temporalresponse of liver to methylprednisolone: a comparative analysis of twodosing regimens. Endocrinology 2007, 148(5):2209-2225.
45. Almon RR, Yang E, Lai W, Androulakis IP, DuBois DC, Jusko WJ: Circadianvariations in rat liver gene expression: relationships to drug actions.J Pharmacol Exp Ther 2008, 326(3):700-716.
46. Lin J, Keogh E, Lonardi S, Chiu B: A Symbolic Representation of TimeSeries, with Implications for Streaming Algorithms. Proceeding of 8th ACMSIGMOD 2003, (Data Mining and Knowledge Discovery.).
47. Munneke B, Schlauch KA, Simonsen KL, Beavis WD, Doerge RW: Addingconfidence to gene expression clustering. Genetics 2005,170(4):2003-2011.
48. Dayneka NL, Garg V, Jusko WJ: Comparison of four basic models ofindirect pharmacodynamic responses. J Pharmacokinet Biopharm 1993,21(4):457-478.
doi:10.1186/1471-2105-11-279Cite this article as: Nguyen et al.: Importance of replication in analyzingtime-series gene expression data: Corticosteroid dynamics and circadianpatterns in rat liver. BMC Bioinformatics 2010 11:279.
Submit your next manuscript to BioMed Centraland take full advantage of:
• Convenient online submission
• Thorough peer review
• No space constraints or color figure charges
• Immediate publication on acceptance
• Inclusion in PubMed, CAS, Scopus and Google Scholar
• Research which is freely available for redistribution
Submit your manuscript at www.biomedcentral.com/submit
Nguyen et al. BMC Bioinformatics 2010, 11:279http://www.biomedcentral.com/1471-2105/11/279
Page 15 of 15
Related Documents