Implications of the International Energy Agency Net Zero Emissions by 2050 Scenario for Net Zero Committed Financial Institutions Briefing Paper 2022 Oxford Sustainable Finance Group, Smith School of Enterprise and the Environment, University of Oxford

Welcome message from author
This document is posted to help you gain knowledge. Please leave a comment to let me know what you think about it! Share it to your friends and learn new things together.
Transcript

Implications of the International Energy Agency Net Zero Emissions by 2050 Scenario for Net Zero Committed Financial Institutions
Briefing Paper
2022
Oxford Sustainable Finance Group, Smith School of Enterprise and the Environment, University of Oxford

1
About the Oxford Sustainable Finance Group
Aligning finance with sustainability is a necessary condition for tackling the environmental and social
challenges facing humanity. It is also necessary for financial institutions and the broader financial
system to manage the risks and capture the opportunities associated with the transition to global
environmental sustainability.
The University of Oxford has world-leading researchers and research capabilities relevant to
understanding these challenges and opportunities. Established in 2012 the Oxford Sustainable Finance
Group is the focal point for these activities. The Group is multidisciplinary and works globally across
asset classes, finance professions, and with different parts of the financial system. We are the largest
such centre globally and are working to be the world's best place for research and teaching on
sustainable finance and investment.
The Group is based in one of the world's great universities and the oldest university in the English-
speaking world. We work with leading practitioners from across the investment chain (including
actuaries, asset owners, asset managers, accountants, banks, data providers, investment consultants,
lawyers, ratings agencies, stock exchanges), with firms and their management, and with experts from
a wide range of related subject areas (including finance, economics, management, geography, data
science, anthropology, climate science, law, area studies, psychology) within the University of Oxford
and beyond.
Since our foundation we have made significant and sustained contributions to the field, including in
some of the following areas:
• Developing the concept of "stranded assets", now a core element of the theory and practice of
sustainable finance.
• Contributions to the theory and practice of measuring environmental risks and impacts via new
forms of geospatial data and analysis, including introducing the idea and importance of "spatial
finance" and "asset-level data".
• Shaping the theory and practice of supervision as it relates to sustainability by working with the
Bank of England, the central banks' and supervisors' Network for Greening the Financial
System (NGFS), and the US Commodity Futures Trading Commission (CFTC), among others.
• Working with policymakers to design and implement policies to support sustainable finance,
including through the UK Green Finance Taskforce, UK Green Finance Strategy, COP26, and
the high-level Transition Plan Taskforce.
• Nurturing the expansion of a rigorous academic community internationally by conceiving,
founding, and co-chairing the Global Research Alliance for Sustainable Finance and
Investment (GRASFI), an alliance of 30 global research universities promoting rigorous and
impactful academic research on sustainable finance.
The Global Sustainable Finance Advisory Council that guides our work contains many of the key
individuals and organisations working on sustainable finance. The Oxford Sustainable Finance Group's
founding Director is Dr Ben Caldecott.

2
Briefing Paper Series
A Briefing Paper is intended to frame an issue and stimulate discussion among users of research. The views
expressed in it represent those of the author(s) and do not necessarily represent those of the host institutions or
funders.
Suggested citation
Wilson, C., Limburg, A., & Caldecott, B. (2022). Implications of the International Energy Agency Net Zero Emissions
by 2050 Scenario for Net Zero Committed Financial Institutions. Briefing Paper. Oxford Sustainable Finance Group,
Smith School of Enterprise and the Environment, University of Oxford.
Disclaimer
The views expressed in this paper represent those of the authors and do not necessarily represent those of the
Smith School or other institution or funder. The paper is intended to promote discussion and to provide public
access to results emerging from our research. It may have been submitted for publication in academic journals. It
has been reviewed by at least one internal referee before publication.
The Chancellor, Masters, and Scholars of the University of Oxford make no representations and provide no
warranties in relation to any aspect of this publication, including regarding the advisability of investing in any
particular company or investment fund or other vehicle. While we have obtained information believed to be reliable,
neither the University, nor any of its employees, students, or appointees, shall be liable for any claims or losses of
any nature in connection with information contained in this document, including but not limited to, lost profits or
punitive or consequential damages.
3
Implications of the International Energy Agency Net Zero
Emissions by 2050 Scenario for Net Zero Committed
Financial Institutions
Christian Wilson, Anthony Limburg, and Ben Caldecott
Oxford Sustainable Finance Group, Smith School of Enterprise and the Environment, University of Oxford
Executive Summary
In 2021, the International Energy Agency (IEA) published the Net Zero Emissions by 2050
Scenario (IEA NZE) consistent with holding the increase in the global average temperature to 1.5
degrees above pre-industrial levels. The roadmap in the IEA NZE provides clear milestones for
the future role of fossil fuel energy.
First, apart from projects already in existence or approved for development in 2021, the
development of new oil, natural gas, and coal reserves is not required. As a result, upstream oil &
gas capital expenditure (CAPEX) falls sharply as production winds down, with upstream
investment limited to existing reserves and fields approved for development in 2021.
Second, in power generation, overall net zero emissions electricity is achieved by 2035 in
advanced economies and by 2040 globally. This requires no additional coal power stations, with
generation from unabated plants phased out by 2030 in advanced economies and by 2040
globally. In the G7, unabated gas power generation is reduced by 93% by 2035 from 2020,
accounting for just 2% of total generation. By 2040 generation falls by 96% and accounts for 0.8%
of generation. Globally, unabated natural gas power generation falls by 90% by 2040, accounting
for 1.1% of total generation, while capacity falls at a slower rate of 63% by 2040. As remaining
generation is focused on providing reserve power and grid flexibility, sharp falls in capacity
utilisation occur. Gas with carbon capture overtakes unabated gas power generation by 2040 but
is equivalent to only 11% of unabated gas generation in 2020.
However, these milestones on the route to net zero are at odds with the current trajectory of our
energy system, with significant expansion planned in both fossil fuel reserves and fossil fuel power.
They are also at odds with the financial flows supporting this expansion, despite financial
institutions with $130 trillion in assets committing at COP26 to align their portfolios with net zero
by 2050.

4
The purpose of this briefing is to examine the implications of the IEA NZE for these financial
institutions and to identify corresponding changes to fossil fuel financing policies. To do this, the
conclusions of the IEA NZE for fossil fuel production are reviewed, focusing on the ability of existing
reserves to meet demand to 2050. For fossil fuel power generation, the changes in the IEA NZE
for the generation and capacity for natural gas and coal power are considered.
For fossil fuel production, financial institutions need to:
• End project finance for the development of new fossil fuel reserves not approved for
development as of 2021.
• To be eligible for corporate finance and underwriting, require companies to implement
transition plans ending the expansion of new fossil fuel reserves if not approved for
development as of 2021, with production then reduced over time as existing reserves are
utilised.
For fossil fuel power generation, financial institutions need to:
• End project financing for new coal-fired power generation.
• To be eligible for corporate finance and underwriting, require companies to implement
transition plans ending the expansion of coal-fired power generation, with existing generation
phased out by 2030 in advanced economies and 2040 in the rest of the world.
• Require companies to detail and implement transition plans to reduce unabated gas generation
in line with IEA NZE phase out dates, falling in absolute terms from 2025 and by over 90% by
2040.
Next, through illustrative case studies, the disconnect between current financing activity and the
conclusions of the IEA NZE is demonstrated. This is achieved by analysing the financing activity
of one investment bank (Barclays) and one asset manager (BlackRock ETFs). Using the World
Electric Power Plants (WEPP) database from S&P and the Global Oil & Gas Exit (GOGEL)
database from Urgewald List, the energy mix of power generation companies financed and the
exploration activities of oil & gas companies financed is tracked. We also provide an overview of
the fossil fuel financing policies of development banks.
For the companies financed in the illustrative case studies, 12% of gas capacity is under 10 years
in age and between 9% (BlackRock) and 29% (Barclays) of coal capacity is under 20 years in age.
In terms of expansion, new gas assets under construction or planned represent a growth in
capacity of approximately 10%. For fossil fuel production, the case studies show that oil & gas
companies financed are continuing to expand fossil fuel reserves, allocating approximately 10%
of CAPEX to exploration related activities.
5
As new fossil fuel power generation assets often have operational lives of 30-40 years, there is an
urgent need to implement financing policies consistent with net zero by 2050 to reduce stranded
asset risk and carbon lock-in. Given IEA NZE phase-out dates, this requires an immediate end to
financing for coal-fired power expansion, and a rapid phase-out of existing generation. While
unbated gas-fired power continues to have a reduced role in the IEA NZE as a source of reserve
power, generation and capacity fall sharply after 2030 relative to 2020 levels, requiring a reduction
in financing for new gas power.
These findings make clear the need for companies to develop credible transition plans aligned with
net zero, and for financial institutions to make them a pre-requisite for financing. Yet, at present,
neither Barclays nor BlackRock require companies financed to halt coal power expansion or have
transition plans to fully phase out generation in line with IEA NZE phase out dates. While many
financial institutions have developed policies to address the financing of coal, few have addressed
fossil fuel reserve expansion, or the need to reduce financing for unabated gas. For financial
institutions committed to net zero by 2050, these policies need to be developed and implemented.
Passive funds, and use of proceeds financing such as green bonds, cannot be carved out from
these policies.
The energy transition brings opportunities for financial institutions, given the vast amount of capital
needed for low-carbon energy and supporting infrastructure. In addition, financial institutions are
able to support high-carbon companies in their transition. However, delivering this in a manner
consistent with net zero commitments requires transparent and science-based financing policies.
Developing these policies is the objective of this briefing paper. The recommendations made for
financing policies are not exhaustive, but focused on fossil fuel expansion and the IEA NZE.
6
1. Introduction: A Framework for Net Zero Financing
Ahead of COP26, the UK Presidency requested that the IEA develop a roadmap for reaching net
zero emissions by 2050 (IEA, 2021c). In response, the IEA developed the Net Zero Emissions by
2050 Scenario (IEA NZE), showing a pathway to net zero CO2 emissions from the energy sector
by 2050 with a 50% probability, in line with IPCC recommendations (IPCC, 2018). In addition, in
the IEA NZE cuts to emissions by 2030 are in line with IPCC pathways with limited or no overshoot
with respect to 1.5C of warming.
Transforming the energy system at the pace required in a 1.5C scenario will require a
corresponding step change in investment in low-carbon technologies and supporting infrastructure.
For example, in the IEA NZE, investment in electricity generation rises from $0.5 trillion per year
in 2021 to $1.6 trillion in 2030, of which renewables account for $1.3 trillion (IEA, 2021b, p. 81).
Similarly, investment in low-carbon energy infrastructure (including networks, EV charging, and
pipelines) rises from $0.3 trillion in 2021 to $0.9 trillion in 2030 (IEA, 2021b, p. 82).
Meeting the requirements of this “decade of delivery” depends on the ability of financial institutions
and policymakers to mobilise capital. But this alone is not sufficient. High-carbon investment must
also be phased out. In the IEA NZE, investment in upstream oil & gas falls from $575 billion per
year in 2020 to $110 billion in 2050 (limited to existing fields) (IEA, 2021b, p. 81). Similarly, for
electricity generation, investment in fossil fuel power without CCUS drops from $131 billion per
year to $36 billion (IEA, 2021b, p. 82).
At COP26, the Glasgow Financial Alliance for Net Zero (GFANZ) brought together financial
institutions representing $130 trillion in assets committed to aligning their activities and portfolios
with net zero emissions by 2050 (GFANZ, 2021). In doing so, these financial institutions face a
challenge. While new entrants drive innovation, incumbent energy companies have a crucial role
in the net zero transition given their scale and skills. But if incumbent energy companies continue
to develop fossil fuel assets at the current rate, this will lead to carbon lock-in and stranded assets
(Caldecott, 2018; Pfeiffer, Hepburn, Vogt-Schilb, & Caldecott, 2018; Saygin, Rigter, Caldecott,
Wagner, & Gielen, 2019).
Therefore, financial institutions need to support carbon-intensive companies to transition, but only
in a manner consistent with net zero commitments. Striking this balance and translating long-term
targets into the present requires financial institutions to develop transparent polices outlining what
is eligible for financing. This briefing focuses on one element of these policies: financing fossil fuel
expansion in the energy sector.

7
This briefing is structured as follows. In Part 1, the findings of the IEA NZE for fossil production
and generation are summarised. In Part 2, the implications for financing policies are discussed. In
Part 3, case studies are provided, exploring the compatibility of financing by banks and asset
managers with the IEA NZE conclusions. When discussing the implications for financing policies,
the following high-level principles are applied:
1. Focus on Capital Flows
Capital allocation is identified as one of three mechanisms for financial institutions to generate
“impact”, alongside engagement and indirect impacts (Kölbel, Heeb, Paetzold, & Busch, 2020).
These different mechanisms demonstrate the trade-off between divestment and engagement
(Braungardt, van den Bergh, & Dunlop, 2019). To address this, one can distinguish between capital
allocation in primary and secondary markets.
In primary markets, new financial securities are issued, while in secondary markets, existing
securities are traded. Therefore, it is through primary markets that capital flows from the financial
system to the real economy, directly supporting the construction and operation of energy
infrastructure (Wilson & Caldecott, 2021). Financing policies that restrict high-carbon investment
should first and foremost focus on equity and debt primary markets, encompassing both corporate
finance, project finance, and underwriting.
With regard to secondary markets, financial institutions need to carefully consider whether
engagement activities generate sufficient “impact” to offset the benefits of providing liquidity and
demand for securities. This is not an exact science. In equity markets, enhanced investor
engagement and stewardship using secondary market holdings can influence companies’ internal
capital allocation decisions. Engagement activities within debt markets are less established but
can also be effective. However, financial institutions need to ensure that engagement is robust and
timebound, as secondary market demand can reduce the cost of capital in debt primary markets,
where the majority of fossil fuel finance is provided (Cojoianu, Ascui, Clark, Hoepner, & Wójcik,
2020; Goldstein, Hotchkiss, & Pedersen, 2019; Wilson & Caldecott, 2021).
2. Use Transparent Science-Based Scenarios
If policies dictate which activities can be financed and when, to ensure they are credible, the use
of science-based pathways or scenarios is required. IEA scenarios are not the only option, but are
already used for this purpose by financial institutions as a common point of reference. For example,
nine of the 25 largest European banks use either Sustainable Development Scenario (SDS) or
Beyond 2 Degrees Scenario (B2DS), giving a 50% chance to limit warming to below 1.65C and
1.75C respectively, for portfolio target setting (ShareAction, 2021).
8
Financial institutions committed to reaching net zero by 2050 need to update financing policies in
line with the IEA NZE or an alternative that will limit the increase in the global average temperature
to 1.5 degrees. The IEA NZE represents one of many possible paths to net zero emissions by
2050, with pathways dependent on, among other factors, the pace of technological change, the
availability of resources, and the willingness of populations to change behaviour. If alternative
scenarios are used, transparency is key, to ensure that stakeholders can scrutinise the basis on
which policies are developed.
3. Apply the Precautionary Principle
Although IEA scenarios provide valuable insights for governments, companies, and civil society,
they have historically underestimated the falling costs of renewables (Way et al., 2021). These
challenges are not limited to the IEA, but are inherent in economic modelling methods such as
Integrated Assessment Models that struggle to capture the dynamics of non-linear change that
characterise the low-carbon transition (Farmer, Hepburn, Mealy, & Teytelboym, 2015).
The climate, economic, and financial systems are complex systems, with tail risks and tipping
points (Chichilnisky, Rezai, Hepburn, & Farmer, 2020). Climate-related risks, therefore, differ from
typical financial risks due to long-time horizons, a lack of historical precedent, irreversible
consequences, and endogeneity and path dependency (Chenet, Ryan-Collins, & van Lerven,
2019). Capturing this non-linearity within and between systems is a major challenge for IAMs,
which can result in an underweighting of the future impacts of climate change, with a gradual policy
response seen as optimal over stronger short-term climate policies (Chichilnisky et al., 2020).
When faced with the radical uncertainty of climate change and associated modelling challenges,
the “precautionary principle” can be applied (Chenet et al., 2019). This requires a market-shaping
approach to be taken, whereby policymakers actively steer the market onto an optimal pathway to
minimise long-term systemic risks. This logic can be extended beyond regulators to financial
institutions themselves, who can seek to “create their preferred scenario” through collective action,
rather than taking action to just minimise their climate-related risk exposure.
Applying the precautionary framework requires preventative measures regarding “undesirable
economic activities” (Chenet et al., 2019). Within the context of the low-carbon transition, this
requires an end to the expansion of activities incompatible with a 1.5C scenario, such as coal
power. Furthermore, financial institutions need to be cautious about relying on future technologies
with uncertain commercial viability — natural gas power expansion dependent on future carbon
capture and storage, for example.
This change in approach requires financial institutions to move beyond “climate risk management”
to “alignment with climate outcomes” (Caldecott, 2020a). This is akin to acting as “universal
9
owners”. These are financial institutions with broad-based portfolios, making them more dependent
in the long-term on the performance of the overall economy than any specific company or sector
(Schoon, 2011). As a result, activities that may be profitable in isolation (e.g. fossil fuel production)
may be negative for the overall portfolio due to negative externalities (e.g. carbon emissions)
(Dimson, Kreutzer, Lake, Sjo, & Starks, 2013). As discussed in Principle 1, in practical terms this
requires a decarbonisation mandate in primary markets and targeted engagement in secondary
markets (Quigley, 2019).
A challenge in adopting this approach is that while the most severe impacts of climate change will
be felt in the long-term, financial institutions typically have short-term time horizons (Carney, 2015).
For example, asset managers may aim to minimize quarterly fund tracking error, or banks may
aim to top annual league tables. For financial institutions to deliver on their net zero commitments,
they need to look beyond these short-term time horizons.
2. Fossil Fuel Energy in the IEA NZE
This part of the briefing identifies the drivers of falling fossil fuel demand and the key elements of
the IEA NZE regarding fossil fuel production, covering oil, natural gas, and coal, and fossil fuel
power generation, focusing on natural gas and coal.
2.1. Drivers of a Net Zero Energy System
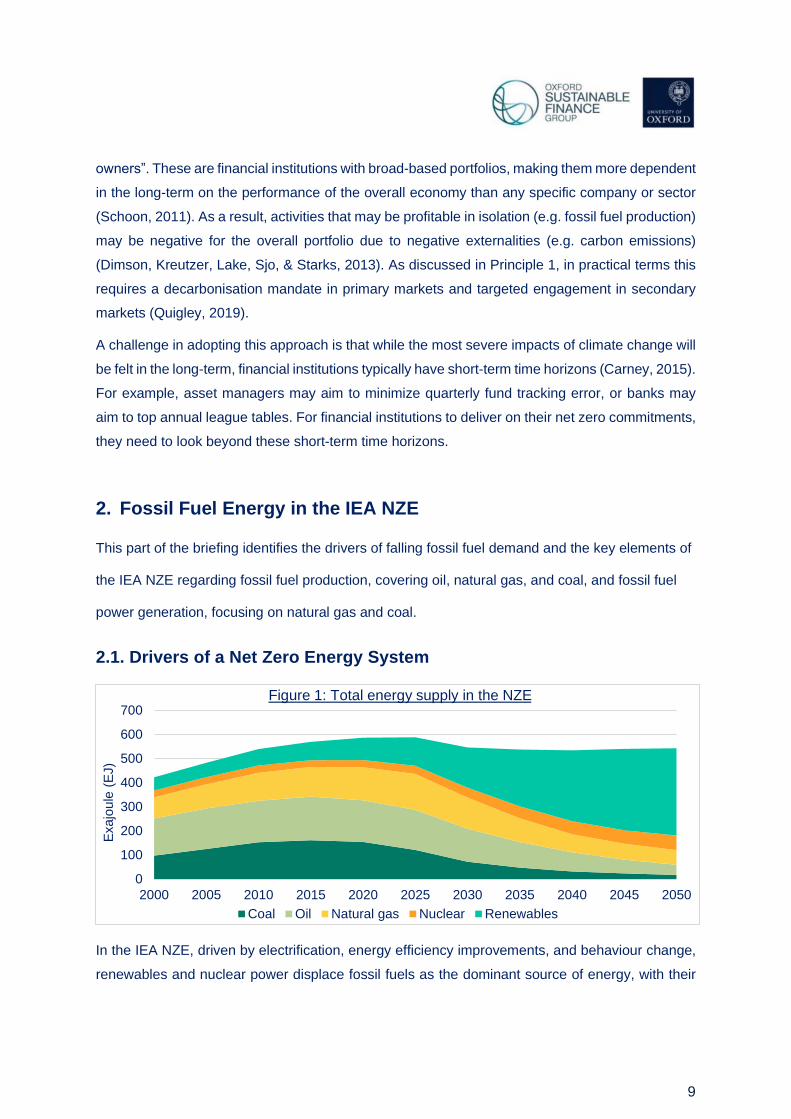
In the IEA NZE, driven by electrification, energy efficiency improvements, and behaviour change,
renewables and nuclear power displace fossil fuels as the dominant source of energy, with their
0
100
200
300
400
500
600
700
2000 2005 2010 2015 2020 2025 2030 2035 2040 2045 2050
Exajo
ule
(E
J)
Figure 1: Total energy supply in the NZE
Coal Oil Natural gas Nuclear Renewables
10
share in the energy mix rising from 20% to 80% from 2020 to 2050, as shown by Figure 1. These
dynamics are summarised below:
• Electrification: within global energy consumption, the share of electricity in the energy mix
rises from 20% in 2020 to 50% in 2050. For example, within transport, the share of
electricity in energy consumption rises from 1.5% in 2020 to 45% in 2050, while heat pumps
installation results in electricity accounting for 66% of energy consumption in buildings by
2050. In heavy industries, the role of electricity in heat production also rises, with the
proportion of steel produced with an electric arc furnace rising from 24% to 53%.
• Energy efficiency: the key to keeping energy consumption stable, despite growing
populations and economies, is improvements in energy efficiency. These improvements
play their most major role from 2020 to 2030. For example, 2.5% of existing buildings are
retrofitted each year with energy efficient heating, while transport fuel standards reduce
emissions from heavy-duty road vehicles.
• Behaviour change: in the IEA NZE, 55% of emission reductions include the deployment of
low-carbon technologies that require the participation of citizens or consumers by, for
example, installing a heat pump or buying an electric vehicle. A further 8% arise from
consumer choices that reduce energy demand from existing technologies, such as saving
energy usage in houses, reducing flying, and recycling.
• Development and deployment of low-carbon energy: the doubling in electricity demand
that occurs in the IEA NZE is primarily met by a rising share of renewables, increasing from
29% in 2020 to 90% in 2050. This growth is met by wind and solar with support from
dispatchable hydropower and bioenergy. In sectors where electrification is challenging,
such as heavy industry or transport, low-carbon fuels play a critical role. For example, low-
carbon hydrogen provides 60% of fuel consumption in shipping by 2050. Bioenergy also
plays a critical role in displacing fossil fuels in harder-to-abate industries, both as a fuel
(e.g. in aviation) and for heat generation in industry (e.g. cement production).
2.2. Fossil Fuel Production
Combined, these drivers result in a sharp drop in the demand for fossil fuels in the IEA NZE.
However, Figure 1 shows ongoing residual demand, with fossil fuels accounting for 20% of energy
supply in 2050. At this point, the majority of demand arises from chemicals, harder-to-abate
industries, and hydrogen production. However, the IEA is clear that existing fossil fuel reserves
are sufficient to meet this demand, as detailed below.

11
Oil:
• Oil demand falls 4% a year, falling from 88 mb/d in 2020 to 24 mb/d in 2050.
• To meet ongoing demand, existing reserves are sufficient, meaning that no exploration of
further oil resources is required, and no development of new oil fields is required beyond
those already approved for development as of 2021.
• Investment in existing oil production facilities or those approved for development continues.
This will enable production to match falling demand.
Natural Gas:
• Natural gas demand falls 2.6% a year from 2020 to 2050, equivalent to 55%. Demand
peaks in the mid-2020s at 4,300 bcm, falling to 3,700 bcm in 2030 and 1,750 bcm in 2050.
• No new gas fields are required apart from those currently being developed.
• Investment in existing natural gas production facilities or those approved for development
continues. This will enable continued production to match falling demand.
Coal:
• Coal demand falls by 7% a year, falling from 5,250 mt in 2020 to less than 600 mt in 2050.
• No new coal mines or expansion of existing mines is required.
• Although demand for coking coal falls at a slower rate, current reserves are sufficient to
meet demand to 2050.
2.3. Fossil Fuel Power Generation
Key to decarbonising the energy system in the IEA NZE is meeting increased electricity demand
from low-carbon generation. Figure 2 provides an overview of global electricity generation in the
IEA NZE, with wind and solar PV generation growing to account for 88% of electricity generation
by 2050. This transition happens at different speeds, with advanced economies phasing out
unabated fossil fuel power and fully decarbonising electricity generation in the 2030s, followed by
developing economies in the 2040s. Table 1 provides more detail on the role of different
technologies in the IEA NZE. This is summarised and discussed below for coal-fired power
generation and gas-fired power generation.

12
Table 1 Generation (TWh) Capacity (GW)
2020 2030 2040 2050 2020 2030 2040 2050
Total 26778 37316 56553 71164 7795 14933 26384 33415
Coal 9426 2947 0 0 2117 1192 432 158
% Total 35.2% 7.9% 0.0% 0.0% 27.2% 8.0% 1.6% 0.5%
Coal + CCUS 4 289 966 663 1 53 182 222
% Total 0.0% 0.8% 1.7% 0.9% 0.0% 0.4% 0.7% 0.7%
Natural Gas 6200 6222 626 253 1829 1950 679 495
% Total 23.2% 16.7% 1.1% 0.4% 23.5% 13.1% 2.6% 1.5%
Natural Gas + CCUS 0 170 694 669 0 28 130 171
% Total 0.0% 0.5% 1.2% 0.9% 0.0% 0.2% 0.5% 0.5%
Oil 756 189 6 6 422 178 39 25
% Total 2.8% 0.5% 0.0% 0.0% 5.4% 1.2% 0.1% 0.1%
2.3.1. Coal-Fired Power Generation
• Unbated coal-fired powerplants are phased out globally by 2040 at the latest, with developed
countries retiring all unabated coal power stations by 2030. The phase out of coal power begins
immediately from 2020.
• While the share of generation from unabated coal falls to 0%, some residual capacity is
maintained following a 93% drop in 2050 from 2020.
• Coal-fired power generation with CCUS grows from a low base, and obtains a higher share of
generation than capacity relative to unabated generation, indicating higher capacity utilisation
rates due to the prioritisation of lower carbon-intensity power.
0
10
20
30
40
50
60
70
80
2010 2015 2020 2025 2030 2035 2040 2045 2050
TW
hT
housands
Figure 2: Global electricity generation by source in the NZE
Other renewables
Hydropower
Wind
Solar PV
Nuclear
Fossil fuels withCCUSHydrogen based
Unabated naturalgasUnabated coal

13
The phase out dates of 2030 in advanced economies and 2040 globally are in line with studies
using IPCC 1.5C scenarios (Climate Analytics, 2019). As the historical average operational life of
coal power stations is 46 years globally, and approximately 60 in the US, 20 in China, and 50 in
EU (Cui et al., 2019), new assets lives are incompatible with IEA NZE phase out dates, unless
retrofitted. The IEA state that there are “no new investment decisions for the construction of coal-
fired power in the NZE” (IEA, 2021d).
The average current age of coal power stations is approximately 40, 12, and 33 years respectively
in the US, China, and EU (IEA, 2021d), meaning that many plants will reach the end of their
operational life by 2030. However, to meet the reduction in coal power required in a 1.5C scenario,
early retirement of coal assets is needed. In a 1.5C scenario, even if no new coal power stations
are built, the existing global stock of assets will need to have their average operational life reduced
to 20 years (Cui et al., 2019). If new plants currently under construction become operational, this
is reduced by a further five years (Cui et al., 2019). This overcapacity is reflected in the WEO 2021,
with generation from existing assets shown to be above that required not only in the IEA NZE, but
also in the STEPS and APS scenarios aligned with 2.6C and 2.1C respectively (IEA, 2021d).
2.3.2. Gas-Fired Power Generation
• Generation using unabated natural gas rises in the short-term displacing coal in the
energy mix and then falls from 2025, with generation in 2030 comparable to 2020.
Generation is 90% lower by 2040 compared with 2020, and in 2050 is just 0.4% of the
electricity mix.
• Unabated natural gas capacity also rises slightly by 2030 compared to 2020, but then
falls sharply by 65% by 2040 and 75% by 2050, accounting for 1.5% of capacity.
• Natural gas with CCUS generation rises from 0% of the electricity mix to 0.5% in 2030,
eventually reaching 0.9% by 2050.
• Relative to unabated natural gas, the share of abated generation is higher than
capacity, indicating higher capacity utilisation rates due to the prioritisation of lower-
carbon power in the energy mix.
Like coal, natural gas-fired power stations have long operational lifetimes. Taking a five year
average of US data from 2014-2018, gas-powered gas turbines and combined-cycle units retired
with operational lives of 32 and 33 years (S&P Global, 2019). Therefore, if current trends continue,
new plants could have operational lives extending into the 2050s. Unlike coal, in the IEA NZE
natural gas generation grows globally in the short-term until 2025. In advanced economies, natural
gas generation is stable up until 2030, while in emerging market and developing countries, it
14
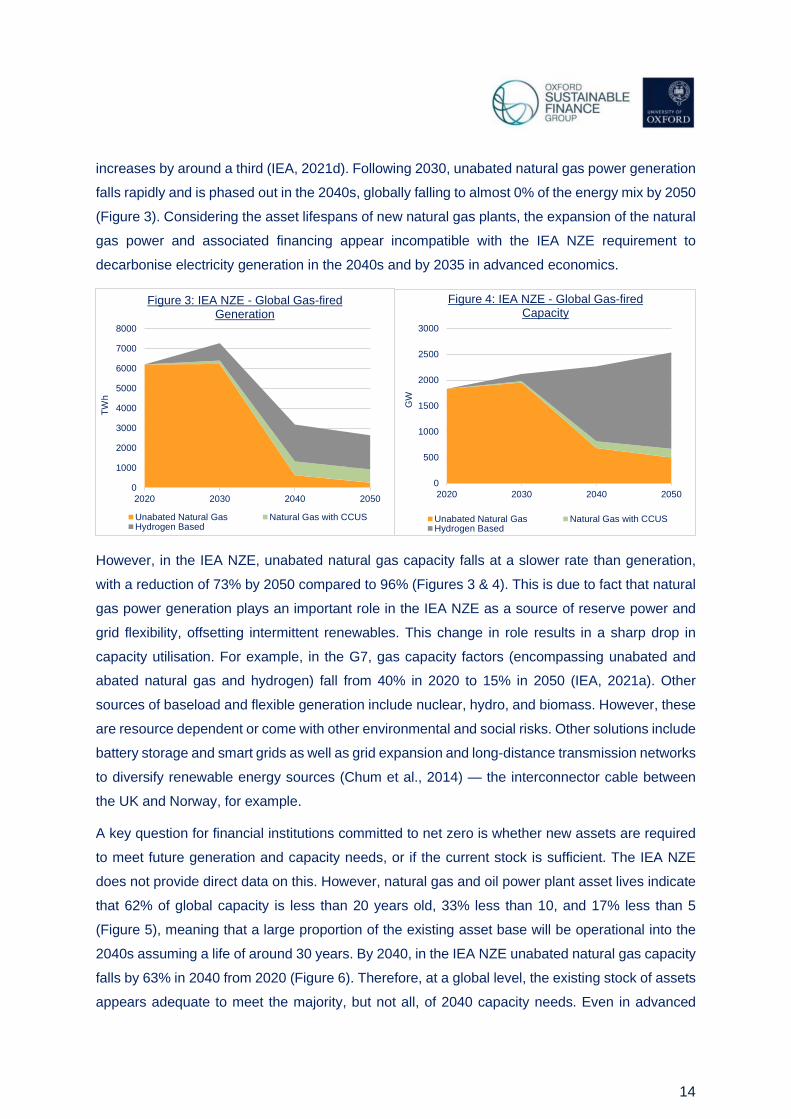
increases by around a third (IEA, 2021d). Following 2030, unabated natural gas power generation
falls rapidly and is phased out in the 2040s, globally falling to almost 0% of the energy mix by 2050
(Figure 3). Considering the asset lifespans of new natural gas plants, the expansion of the natural
gas power and associated financing appear incompatible with the IEA NZE requirement to
decarbonise electricity generation in the 2040s and by 2035 in advanced economics.
However, in the IEA NZE, unabated natural gas capacity falls at a slower rate than generation,
with a reduction of 73% by 2050 compared to 96% (Figures 3 & 4). This is due to fact that natural
gas power generation plays an important role in the IEA NZE as a source of reserve power and
grid flexibility, offsetting intermittent renewables. This change in role results in a sharp drop in
capacity utilisation. For example, in the G7, gas capacity factors (encompassing unabated and
abated natural gas and hydrogen) fall from 40% in 2020 to 15% in 2050 (IEA, 2021a). Other
sources of baseload and flexible generation include nuclear, hydro, and biomass. However, these
are resource dependent or come with other environmental and social risks. Other solutions include
battery storage and smart grids as well as grid expansion and long-distance transmission networks
to diversify renewable energy sources (Chum et al., 2014) — the interconnector cable between
the UK and Norway, for example.
A key question for financial institutions committed to net zero is whether new assets are required
to meet future generation and capacity needs, or if the current stock is sufficient. The IEA NZE
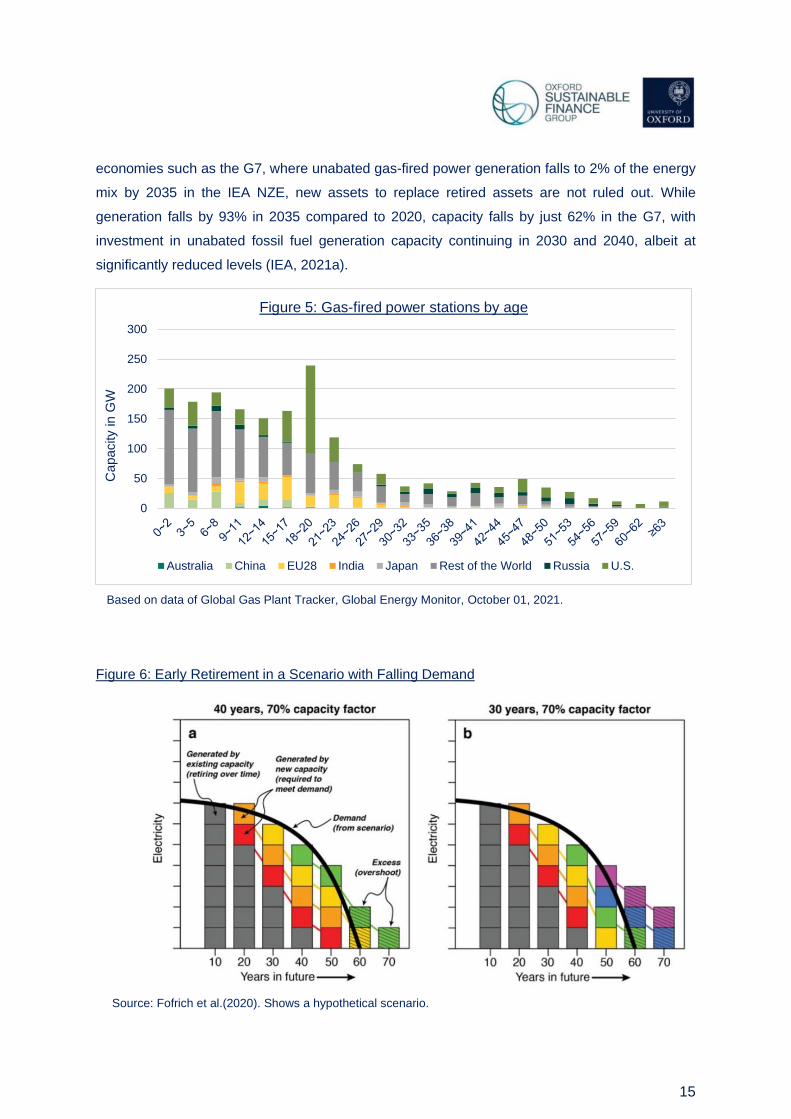
does not provide direct data on this. However, natural gas and oil power plant asset lives indicate
that 62% of global capacity is less than 20 years old, 33% less than 10, and 17% less than 5
(Figure 5), meaning that a large proportion of the existing asset base will be operational into the
2040s assuming a life of around 30 years. By 2040, in the IEA NZE unabated natural gas capacity
falls by 63% in 2040 from 2020 (Figure 6). Therefore, at a global level, the existing stock of assets
appears adequate to meet the majority, but not all, of 2040 capacity needs. Even in advanced
0
1000
2000
3000
4000
5000
6000
7000
8000
2020 2030 2040 2050
TW
h
Figure 3: IEA NZE - Global Gas-fired Generation
Unabated Natural Gas Natural Gas with CCUSHydrogen Based
0
500
1000
1500
2000
2500
3000
2020 2030 2040 2050
GW
Figure 4: IEA NZE - Global Gas-fired Capacity
Unabated Natural Gas Natural Gas with CCUSHydrogen Based
15
economies such as the G7, where unabated gas-fired power generation falls to 2% of the energy
mix by 2035 in the IEA NZE, new assets to replace retired assets are not ruled out. While
generation falls by 93% in 2035 compared to 2020, capacity falls by just 62% in the G7, with
investment in unabated fossil fuel generation capacity continuing in 2030 and 2040, albeit at
significantly reduced levels (IEA, 2021a).
Figure 6: Early Retirement in a Scenario with Falling Demand
0
50
100
150
200
250
300
Capacity
in G
W
Figure 5: Gas-fired power stations by age
Australia China EU28 India Japan Rest of the World Russia U.S.
Based on data of Global Gas Plant Tracker, Global Energy Monitor, October 01, 2021.
Source: Fofrich et al.(2020). Shows a hypothetical scenario.
16
The challenge is that any new capacity may need to be retired early or “stranded”, although this
depends on the operational life assumed, with model assumptions ranging from 25 to 45 years for
new gas power (Fofrich et al., 2020). This is represented in Figure 6 by a hypothetical scenario
taken from the same source. Prior studies have shown that all new fossil fuel power infrastructure
is incompatible with a 1.5C scenario. For example, Tong et al. (2019) model committed emissions
from the electricity sector and find that absent negative emission technologies and CCUS, there
can be no new fossil fuel power, and that existing assets will have to reduce lifetimes from 40 to
25 years or reduce capacity factors to below 30% to remain compatible with a 1.5C scenario.
Pfeiffer et al.( 2016) show that with asset lives of 40 years, the stock of fossil fuel generation assets
compatible with a 2C scenario has already been reached, requiring new generation to be zero
carbon, retrofitted with CCUS or retired early. In further analysis, Pfeiffer et al. (2018) find that in a
1.5-2C scenario, 20% of existing global capacity will need to be stranded, even if planned projects
are stopped. Fofrich et al. (2020) find that in 1.5-2C scenarios, existing fossil fuel power plants are
retired before their historical operational lifetimes, and as a result, stress the incompatibility of
continued investments in fossil fuel power. Meanwhile, the risks of early asset stranding have
already materialized, especially in Europe (Caldecott et al., 2017).
From the perspective of financial institutions, if new natural gas power assets are financed, their
ability to avoid premature stranding in a 1.5C scenario will in part depend on the ability to be
retrofitted with CCUS or co-fired with low-carbon fuels such as hydrogen. However, there is
uncertainty about commercial viability, with significant levels of further research and development
required in CCUS (Norhasyima & Mahlia, 2018; Tapia, Lee, Ooi, Foo, & Tan, 2018). CCUS
technologies have historically lagged behind expected technological progress (De Coninck &
Benson, 2014), with high technology costs posing a challenge to deployment (Wilberforce,
Baroutaji, Soudan, Al-Alami, & Olabi, 2019). If negative emissions technologies play no role in
pathways compatible with 2C scenarios, more stringent policies are needed to mitigate emissions
(Larkin, Kuriakose, Sharmina, & Anderson, 2018) and fewer fossil fuel reserves can be consumed
(Budinis, Krevor, Dowell, Brandon, & Hawkes, 2018).
This is not to say that CCUS technologies do not have a crucial role, but their future potential
cannot justify the rapid expansion of fossil fuel power. Retiring plants early and decommissioning
trillions in private capital comes with significant political, economic, and social issues that can result
in inertia within the energy system (Busch & Gimon, 2014; Fofrich et al., 2020). Reducing the
amount of new fossil fuel power assets constructed reduces these barriers. Similarly, continued
deployment can add to path dependence that drives carbon lock-in (Unruh, 2000), with only an
eighth of electric utilities companies prioritising renewables over fossil fuels since 2000 (Alova,
2020). There also needs to be a focus on allocating resources to solar, wind, batteries, and

17
hydrogen, as maintaining deployment growth rates will drive down costs and accelerate the speed
of the low-carbon transition (Way et al., 2021).
Summary
The IEA NZE is unambiguous about the need to rapidly reduce unabated gas-fired power
generation from 2030 onwards, with generation falling to below 2% of the energy mix by 2035 in
advanced economics. However, as residual capacity is maintained through to 2050, this section
does not conclude that no further capacity additions occur. When additions do occur, new capacity
will be generally focused on providing grid flexibility and reserve power, with utilisation rates
significantly lower and ongoing viability dependent on retrofitting with CCUS or hydrogen,
technologies where there is uncertainty regarding future commercial viability. As a result, stranded
assets risks are significant.
18
3. Fossil Fuel Financing Policy
In this section, the implications of IEA NZE conclusions are explored for financial institutions
committed to net zero. This is done for fossil fuel production and power generation, first for project
finance and then corporate finance.
3.1 Project Finance
Corporate finance relates to the balance sheet of the borrowing entity, while in project finance, a
separate special purpose vehicle (SPV) is used by the project sponsor to obtain financing (Krupa
& Harvey, 2017). For renewable energy finance, although the share of project finance has grown
over the past decade, corporate finance still accounts for the majority of asset finance (FS-UNEP,
2018). For fossil fuel energy, corporate finance plays an even larger role, as the scale and
diversification of incumbent energy companies enable them to obtain a low cost of capital (Duff &
Phelps, 2018).
Although corporate finance from company balance sheets provides the majority of financing for
new energy infrastructure, project finance also plays a critical role (Ameli et al., 2021; Duff &
Phelps, 2018). Unlike corporate finance, project finance lending has no recourse to the project
sponsors’ assets beyond the project’s assets, with the assets in question also delivering the cash
flows needed to pay back the loan (Dentons, 2013). Project finance, therefore, reduces
contamination risk between the project and project sponsor, reducing bankruptcy risk for the
sponsor, especially for large or high-risk projects (Steffen, 2018). Off-balance sheet project
finance, via an SPV, also enables highly indebted companies to continue to develop new projects,
or for companies with an historically high-risk asset base to obtain a lower cost of capital (Helms,
Salm, & Wüstenhagen, 2015; Steffen, 2018).
Given the financing structure of project finance, with loan repayment provided by cash generated
by a specific asset, lenders face significant stranded asset risks if fossil fuel power assets are
phased out before the maturity of loans provided. In such a situation, creditors could take control
of the asset, but if early retirement occurs, it is unlikely that there would be demand as value is
derived from the ability to generate future cash flows (Dentons, 2013).
19
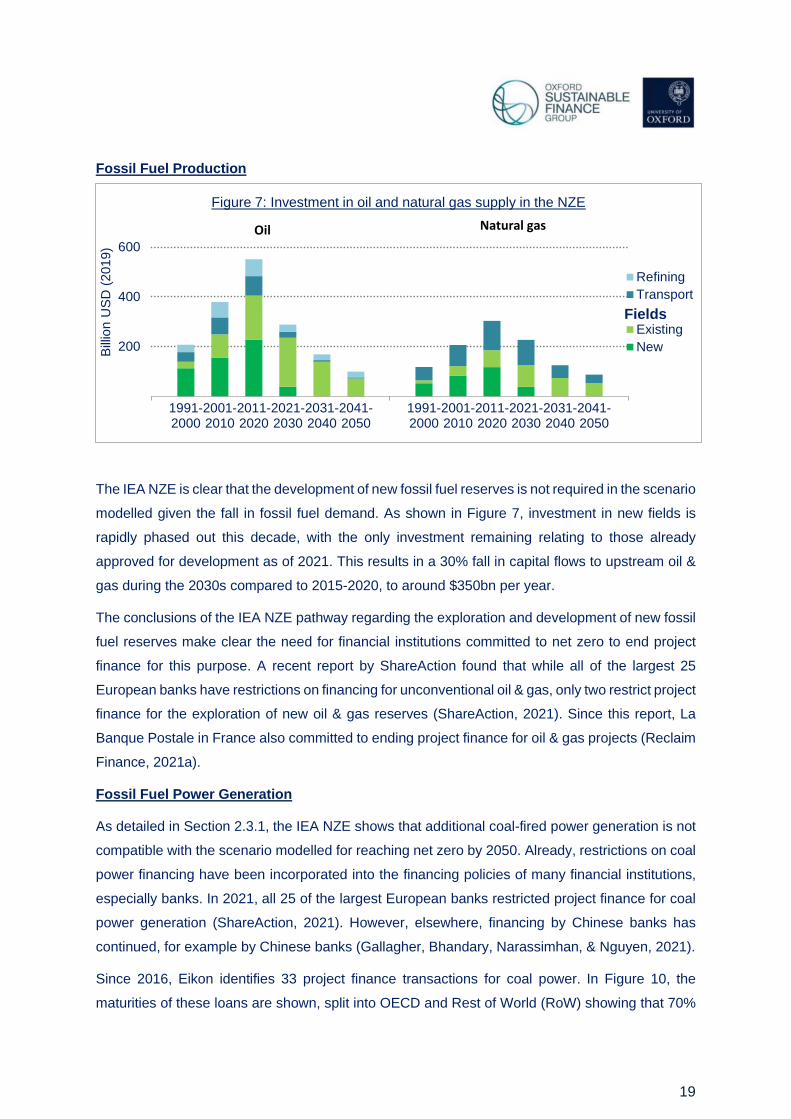
Fossil Fuel Production
The IEA NZE is clear that the development of new fossil fuel reserves is not required in the scenario
modelled given the fall in fossil fuel demand. As shown in Figure 7, investment in new fields is
rapidly phased out this decade, with the only investment remaining relating to those already
approved for development as of 2021. This results in a 30% fall in capital flows to upstream oil &
gas during the 2030s compared to 2015-2020, to around $350bn per year.
The conclusions of the IEA NZE pathway regarding the exploration and development of new fossil
fuel reserves make clear the need for financial institutions committed to net zero to end project
finance for this purpose. A recent report by ShareAction found that while all of the largest 25
European banks have restrictions on financing for unconventional oil & gas, only two restrict project
finance for the exploration of new oil & gas reserves (ShareAction, 2021). Since this report, La
Banque Postale in France also committed to ending project finance for oil & gas projects (Reclaim
Finance, 2021a).
Fossil Fuel Power Generation
As detailed in Section 2.3.1, the IEA NZE shows that additional coal-fired power generation is not
compatible with the scenario modelled for reaching net zero by 2050. Already, restrictions on coal
power financing have been incorporated into the financing policies of many financial institutions,
especially banks. In 2021, all 25 of the largest European banks restricted project finance for coal
power generation (ShareAction, 2021). However, elsewhere, financing by Chinese banks has
continued, for example by Chinese banks (Gallagher, Bhandary, Narassimhan, & Nguyen, 2021).
Since 2016, Eikon identifies 33 project finance transactions for coal power. In Figure 10, the
maturities of these loans are shown, split into OECD and Rest of World (RoW) showing that 70%
200
400
600
1991-2000
2001-2010
2011-2020
2021-2030
2031-2040
2041-2050
1991-2000
2001-2010
2011-2020
2021-2030
2031-2040
2041-2050
Bill
ion U
SD
(2019)
Figure 7: Investment in oil and natural gas supply in the NZE
Refining
Transport
Existing
New
Oil Natural gas
Fields

20
of transactions mature after 2030, of which 26% are in OECD countries. Assuming new coal power
plants linked to these transactions have operational lives of 40 years, they are due to operate well
beyond IEA NZE phase out dates of 2030 in advanced economics and 2040 elsewhere.
A challenge is that around 90% of coal power plants operate in a form of regulated market, where
long-term contracts up to 30 years in length or state ownership insulate plants from cost pressures
(Bodnar et al., 2020). This results in inertia within energy systems, whereby even if coal power
plants are economically uncompetitive relative to renewables, actors are incentivised to maintain
operations. The need to repay project finance creditors over time horizons beyond phase out dates
adds to this inertia.
Unlike coal-fired power generation, the IEA NZE does not rule out further investment in unabated
gas power within the scenario modelled, with the compatibility of these assets with a 1.5C scenario
context-dependent — depending, for example, on whether construction facilitates a higher
penetration of renewables by providing grid flexibility where alternatives are not feasible (IEA,
2021d). Furthermore, while unabated gas capacity increases by 7% globally between 2020 and
2030, it increases by a third in developing economies and falls by 19% in the G7. Data compiled
by Global Data shows a planned increase in global gas capacity of 560GW, equivalent to a 24%
increase (Ferris, 2021). This indicates that at a global level, a proportion of this planned capacity
is not compatible with the pathway in the IEA NZE.
Major private financial institutions are yet to exclude financing for unabated natural gas. However,
the European Investment Bank (EIB) has fully restricted lending for unabated natural gas power
stations as of 2022, when the development bank’s de facto blanket ban on all fossil fuel financing
0
10
20
30
40
50
60
70
No.
of
Tra
nsactions
Figure 9: Gas Project Finance Loans (2016-2021)
OECD Gas RoW Gas
0
2
4
6
8
10
12
14
No.
of
Tra
nsactions
Figure 8: Coal Project Finance Loans (2016-2021)
OECD Coal RoW Coal

21
kicks in (E3G, 2022). The Biden administration’s latest orders from December 2021 to halt
overseas public financing in fossil fuel power projects are also noteworthy, affecting institutions
such as the U.S. International Development Finance Corporation (DFC) and the U.S. Export-
Import Bank (EXIM), but with an exception in cases of national security (Volcovici, 2021).
A policy that mirrors coal power financing restrictions through a blanket ban of project financing for
gas power expansion may not be appropriate if using IEA NZE as a reference point. But given the
need to rapidly reduce natural gas power from 2030, project finance for new assets needs to be
sharply curtailed going forward, especially in advanced economies where unabated generation
falls below 2% of the energy mix by 2035. Regional specific drivers also need to be considered,
such as the availability of alternatives to natural gas to provide baseload power and grid flexibility.
Analysing 122 project finance transactions for gas power from Eikon indicates that transactions
are dominated by OECD borrowers, accounting for 92% (Figure 11). Loans also have short
maturities, with those maturing after 2030 accounting for only 23% of transactions and 22% of the
total amount lent.
3.2. Corporate Finance
Developing a corporate financing policy consistent with the IEA NZE or equivalent scenario is less
clear cut, as financing is not tied to a single project but the overall balance sheet of a company
and energy companies may engage in both low- and high-carbon projects. This section considers
the appropriateness of different types of corporate financing policies to be consistent with the
conclusions of the IEA NZE, focusing first on fossil fuel production and then fossil fuel power
generation.
3.2.1. Complete Restrictions
Fossil Fuel Production
For fossil fuel production, the IEA NZE is clear that the development of new fossil fuel reserves is
not required in the scenario modelled to reach net zero by 2050. Therefore, the most
straightforward financing policy is to rapidly phase out and end corporate financing and
underwriting for companies involved in the expansion of fossil fuel reserves. Of the 25 largest
banks within Europe, one has committed to end corporate financing based on the development of
new fossil fuel reserves, with Crédit Mutuel Alliance Fédérale stating that it “will refrain... from
providing banking and financial services to groups… which undertake explorations of new oil fields
(conventional or unconventional) and new unconventional gas fields” (Crédit Mutuel, 2021;
ShareAction, 2021).
22
Fossil Fuel Power Generation
For fossil fuel power generation, the IEA NZE is clear that no further coal power assets are required
in the scenario modelled to reach net zero by 2050. Several leading banks have begun to restrict
corporate finance to companies developing new coal power assets, with nine of the largest 25
European banks implementing such a policy (ShareAction, 2021). Credit Agricole, for example,
will not finance new clients expanding coal power since 2020 nor existing clients developing new
coal power capacity (Crédit Agricole, 2020). Furthermore, this policy encompasses the acquisition
of assets from a third party, closing an important loophole.
Although financing for new unabated gas-fired power needs to be sharply curtailed, the IEA NZE
is not explicit that all capacity additions need to end. Therefore, this section does not state the
need for a complete restriction on corporate finance at present.
3.2.2. Credible Transition Plans
Fossil Fuel Production
Requiring companies to have a credible transition plan to remain eligible for financing is an option
taken by Natwest and Danske Bank, who require oil & gas companies to have these plans in place
in 2021 and 2023 respectively (these banks also exclude project finance for oil & gas expansion)
(ShareAction, 2021).
In their updated guidance on Metrics, Targets, and Transition Plans, the Task Force on Climate-
related Financial Disclosures (TCFD) state that a transition plan needs to contain “sufficient
information to enable users to assess its credibility” (TCFD, 2021). This needs to include whether
a company is engaged in fossil fuel reserves expansion. The Institutional Investors Group on
Climate Change (IIGCC), for example, call on oil & gas companies to “disclose total CAPEX in oil
and gas exploration activities in the last financial year and a forward-looking budget (minimum
three years ahead)” and that exploration CAPEX can be further split into greenfield and brownfield
sites (IIGCC, 2021). For context, in 2019, less than one per cent (0.8%) of capital expenditure by
oil & gas majors was directed towards low-carbon activities (IEA, 2019).
Defining a credible transition plan is complex, but ending fossil fuel reserves expansion in line with
the IEA NZE or equivalent scenarios ought to be a prerequisite for a transition plan to be credible.
Including M&A within this is important to avoid a loophole whereby new reserves are developed
by another company and then bought.
23
Many quantitative emission targets for oil & gas companies that feature in climate-related
disclosures focus on relative rather than absolute emissions. These carbon-intensity metrics allow
for progress towards emission targets while also growing or maintaining fossil fuel production, for
example, by reducing upstream flaring and methane slippage, or by investing in renewables. An
end to fossil fuel reserve expansion is key to the credibility of these targets, as this will result in a
gradual wind-down of absolute production and therefore emissions.
Finally, there is a range of strategies that can be pursued by oil & gas companies to transition,
including diversification, working with supply chains to decarbonise, and investing in low-carbon
technologies (Caldecott et al., 2018; IIGCC, 2021). These strategies are important but need to be
accompanied by a rapid phase out of exploration and production.
Fossil Fuel Power Generation
Banks such as Natwest also require companies engaged in electric utilities with coal exposure to
have a credible transition plan to remain eligible for financing if exposure to thermal coal is greater
than 15%. For transition plans to be credible, an end to coal power expansion and a phase out of
generation in line with the IEA NZE or equivalent scenarios needs to be a pre-requisite. Additional
aspects of a credible transition plan include, but are not limited to, policies that ensure the closure
of assets as coal power is phased out, rather than the sale of assets to a third party that continues
operations (Reclaim Finance, 2021b).
To our knowledge, no financial institutions require credible transition plans from companies
engaged in natural gas power generation. However, if financial institutions adopt such an
approach, a credible transition plan using the IEA NZE as a reference point would document how
unabated generation will be phased out in the 2040s, with absolute reductions in generation
In the UK net zero transition plans will be required for all large companies, asset managers,
and asset owners (and investment products) on a comply or explain basis initially, with this
being introduced via new Sustainability Disclosure Requirements from 2023. This is world-
leading and will almost certainly be adopted by other jurisdictions.
The UK Government is establishing a new high-level Transition Plan Taskforce (TPT)
announced at COP26 (HM Treasury, 2021). The TPT will start in Q1 2022 with a two-year
mandate and is being tasked with, among other things, making recommendations on what
good transition plans look like and the metrics that could be used to track progress towards
delivery. The Taskforce will cover real economy sectors, as well as different finance sub-
sectors. There will be strong connectivity with international processes and initiatives, including
the newly launched ISSB and GFANZ.
24
starting in the 2030s. Regarding any planned expansion, companies should detail how expected
operating lives are compatible with these phase out dates.
3.2.4. Thresholds
Fossil Fuel Production
At present, thresholds are used by financial institutions to identify energy companies eligible for
financing. These thresholds can be financial (e.g. % of revenue) or activity-based (e.g. % of oil
production or electricity generated). For example, Credit Agricole requires companies to generate
less than 25% of turnover from thermal coal and to provide a phase out plan in line with the Paris
Agreement to be eligible for corporate financing (Crédit Agricole, 2020). For oil & gas, corporate
finance thresholds are used by banks when providing financing to companies involved in
unconventional oil & gas (e.g. arctic oil & gas and tar sands).
Within the context of reserve expansion, thresholds could be applied to oil & gas companies based
on the proportion of revenue or CAPEX attributable to upstream exploration related activities.
Given that certain banks are likely to resist an immediate end to financing for this purpose, this
provides a mechanism to reduce financing over time as thresholds fall. Resistance from banks can
be attributable to the significant investment banking fees generated relative to sectors such as coal
mining, where banks are more willing to restrict financing. However, the IEA NZE does not see
fossil fuel reserve expansion gradually phased out within the scenario modelled but is ended
immediately (apart from those already approved in 2021).
In contrast to banks, asset owners do not have commercial relationships with investee fossil fuel
companies, and so are more willing to restrict financing, with many pension funds implementing
full divestment policies covering oil & gas as well as coal (350.org, 2021). Asset managers
committed to net zero by 2050 need to follow suit and ensure that capital is not provided to
companies engaged in new fossil fuel reserve expansion. Yet many asset managers, especially
those engaged in passive investment, state that this is not possible given the inclusion of upstream
oil & gas companies in mainstream indices (Jahnke, 2019). However, as argued by Wilson &
Caldecott (2021), even passive managers are able to stop the financing of fossil fuels through
primary markets, while De Jong & Nguyen (2016) have shown a reduction in portfolio carbon-
intensity through the exclusion of fossil fuels has limited impact on tracking error.
Fossil Fuel Power Generation
As highlighted above, thresholds are already often used when financing power generation
companies with exposure to coal-based power generation. This approach can incentivise
companies to reduce their exposure to coal-based power generation and manage the exposure of
25
financial institutions to stranded asset risk. However, a drawback of only using thresholds is that
companies can reduce their relative exposure through investments in other power sources, such
as natural gas, while keeping coal-fired power generation constant or even increasing. Therefore,
threshold-based lending policies need to be combined with a requirement for companies to end
the expansion of coal-based power generation and reduce absolute generation and capacity
overtime.
For gas-based power generation, thresholds can also be used to manage stranded asset risk and
incentivise companies to transition. However, in the IEA NZE, absolute reductions in generation
and capacity do not begin globally until after 2030, after which point the share of generation falls
sharply. Therefore, implementing a threshold-based policy for natural gas, based on the IEA NZE
or alternative scenario, could be challenging at present. An advantage of a threshold-based policy
is that it can be adjusted over time as unabated natural gas generation is phased out. Crucially,
this doesn’t prevent companies from maintaining gas capacity for grid flexibility needs.
3.2.5 Use of Proceeds
The development of financing policies in the energy sector has coincided with the innovation of
green financing instruments. This includes green bonds, where the issuer commits to using funds
for “green” projects by specifying the use of proceeds. This element is similar to project finance,
which provides capital for a specific activity. For example, in Credit Agricole’s coal policy,
companies that have exposure to coal above 25% are still eligible for financing if capital raised is
dedicated to renewable energy or GHG reduction projects (Crédit Agricole, 2020). The advantage
of such a policy is that financial institutions can support companies through their transition.
However, if the company is engaged in the expansion of fossil fuel assets, financial institutions
have to consider whether use of proceeds corporate financing, even for green projects, is wise.
Financing of this nature frees up capacity for companies to fund fossil fuel expansion through their
own balance sheet, or via other financial institutions not concerned with supporting this activity.
Green loans or bonds issued by these companies could also be “greenwashing”. Finally, as use
of proceeds financing is tied to the risk of the overall balance sheet, financial institutions will be
exposed to the climate risk of these activities. Therefore, when providing use of proceeds finance,
financial institutions need to ensure that the transition plans of companies financed are credible,
which in the context of oil & gas, requires an end to fossil fuel reserve expansion, and in electric
utilities, an end to the development of coal assets and a phase out of fossil fuel generation.
For example, before COP26, the president of the European Investment Bank (EIB) stated that the
bank will stop lending from 2021 onwards to companies that partake in activities incompatible with
the Paris Agreement, including increasing production from existing oil & gas assets and investing

26
in new unconventional oil & gas production (not all oil & gas expansion) (European Investment
Bank, 2021). Included in this policy is an end to financing for low-carbon projects by companies
deemed incompatible, although exceptions can be made for important demonstration projects that
can drive down costs in emerging technologies. Similarly, the EIB will not fund a low-carbon
subsidiary if the activities of the parent company are incompatible (European Investment Bank,
2021). However, ring-fenced SPVs with more than one shareholder are out of scope (European
Investment Bank, 2021).
3.2.6 Sustainability-linked Finance
An interest in transition finance, in order to support the decarbonisation of high-carbon sectors,
has grown in prevalence in recent years (Caldecott, 2020b). An example of innovation in this area
is sustainability-linked finance. In contrast to use-of-proceeds instruments, sustainability-linked
financial products do not require that the proceeds be employed for a green purpose (ICMA, 2020).
Rather than that, its conditions incentivise the issuer to enhance its sustainability performance
against predefined sustainability performance targets (SPT) based on key performance indicators
(KPIs). Particularly, the key element is a sustainability linked pricing ratchet, which means that if
the issuer meets the SPTs, the margin on the security is adjusted accordingly. Sustainability-
linked pricing ratchets can be one-way or two-way (Linklaters, 2021). The one-way
structure means that if the issuer meets the SPTs, the margin is decreased. The profit margin
remains unchanged if the sustainability targets are not met. The alternative two-way strategy
reduces the margin when SPTs are satisfied but provides a margin premium when they are not.
Five years after the first sustainability-linked loan was issued, the market for sustainability-linked
loans has surpassed USD 440 billion in 2021 (Environmental Finance, 2021). Issuance in specific
energy industries reached USD 90 billion at the end of 2021, accounting for about 20% of the
market's total size since inception. However, in the electric utilities sector, only 10% link metrics to
reductions in scope 3 emissions (Environmental Finance, 2021). Similarly, landmark issuances in
the fossil fuel production sector, such as Eni S.p.A issuance of the world’s first sustainability-linked
bond, did not include scope 3 emissions (Crédit Agricole, 2021). Therefore, while sustainability-
linked finance has an important role to play in supporting companies to transition, as a form of
corporate finance, financial institutions need to ensure that the overall transition plan of the
company is credible.
3.3 Summary
Section 3 of this briefing evaluated different options for financing policies in the energy sector,
focusing on fossil fuel expansion within the IEA NZE. The conclusions are summarised below.
27
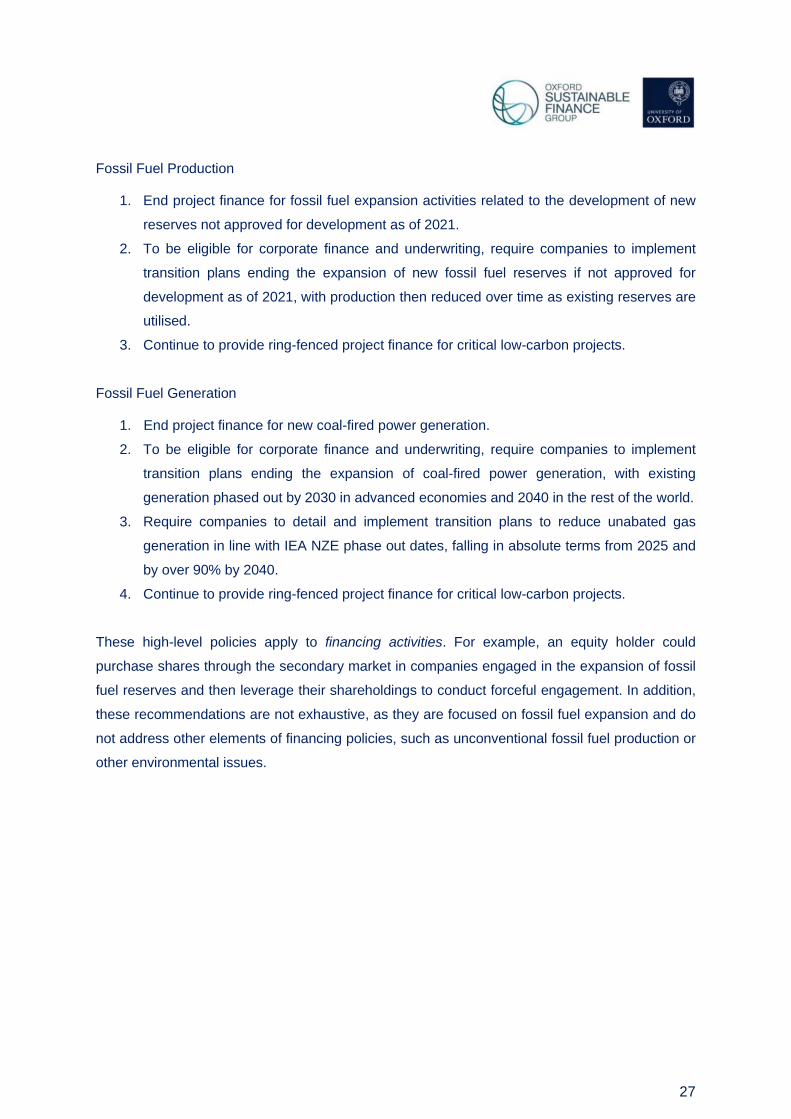
Fossil Fuel Production
1. End project finance for fossil fuel expansion activities related to the development of new
reserves not approved for development as of 2021.
2. To be eligible for corporate finance and underwriting, require companies to implement
transition plans ending the expansion of new fossil fuel reserves if not approved for
development as of 2021, with production then reduced over time as existing reserves are
utilised.
3. Continue to provide ring-fenced project finance for critical low-carbon projects.
Fossil Fuel Generation
1. End project finance for new coal-fired power generation.
2. To be eligible for corporate finance and underwriting, require companies to implement
transition plans ending the expansion of coal-fired power generation, with existing
generation phased out by 2030 in advanced economies and 2040 in the rest of the world.
3. Require companies to detail and implement transition plans to reduce unabated gas
generation in line with IEA NZE phase out dates, falling in absolute terms from 2025 and
by over 90% by 2040.
4. Continue to provide ring-fenced project finance for critical low-carbon projects.
These high-level policies apply to financing activities. For example, an equity holder could
purchase shares through the secondary market in companies engaged in the expansion of fossil
fuel reserves and then leverage their shareholdings to conduct forceful engagement. In addition,
these recommendations are not exhaustive, as they are focused on fossil fuel expansion and do
not address other elements of financing policies, such as unconventional fossil fuel production or
other environmental issues.

28
4. Case Studies
In this section, illustrative case studies are provided covering one asset manager, investment bank,
and development bank. Barclays and BlackRock are selected because of their size and significant
financing of fossil fuels. For development banks, an overview of fossil fuel financing policies is
provided for several institutions, but with a focus on the World Bank. The objective of these case
studies is to highlight the potential challenges for financial institutions in relation to the conclusions
of the IEA NZE, specifically their exposure to fossil fuel expansion and fossil fuel assets with long
operational lives. This is achieved by taking financial transactions and evaluating the underlying
activities of companies financed.
5.1 Asset Manager
BlackRock is the world’s largest asset manager, with over $10 trillion in AUM, and is the world’s
second largest asset manager in terms of investments in the coal industry (Tom Saunders, 2021).
BlackRock’s AUM is dominated by passive funds, which account for two-thirds of total assets
(Pensions & Investments, 2021) and 88.7% of fossil fuel holdings (Greenfield, 2019). BlackRock
has made clear that passive fund structures limit their ability to reduce their exposure to fossil fuels
(Jolly, 2019). However, not only do passive funds hold significant fossil fuel assets, but they also
make active decisions to channel capital into these sectors via primary market transactions,
despite tracking indexes that rebalance monthly (Wilson & Caldecott, 2021).
Fossil Fuel Power Generation
Unlike mutual funds that report holdings monthly or quarterly, daily holdings are disclosed for ETFs,
allowing for primary market trades to be tracked. Using the same method as C. Wilson & Caldecott
(2021) this is done from Jan 2016 to Dec 2021 for BlackRock’s two largest investment grade and
high yield corporate bond ETFs: iShares iBoxx $ Investment Grade Corporate Bond ETF (LQD)
with an AUM of $37 billion and iShares iBoxx $ High Yield Corporate Bond ETF (HYG) with an
AUM of $20 billion. This results in 38 companies being financed in the electric utilities sector that
are then matched to the S&P World Electric Power Plant (WEPP) database from September 2021,
with 84% of companies successfully matched to WEPP. Using WEPP, the current and planned
asset mix of these companies is aggregated and shown in Table 2. As the asset mix is not weighted
by transaction value, this is not a representation of the financing energy mix, but rather a
representation of the combined asset base.
29
Table 2 Operational Planned and Under Construction
Fuel Capacity (MW)
Energy Mix
Age (Weighted)
Capacity (MW)
Energy Mix Expansion
Gas 143,024 32.0% 25.0 9,962 22.20% 6.97%
Coal 108,847 24.3% 42.2 - - -
Nuclear 63,691 14.2% 41.4 2,234 4.98% 3.51%
Waste 42,901 9.6% 16.3 1,941 4.33% 4.52%
Wind 37,816 8.5% 9.2 13,723 30.58% 36.29%
Hydro 21,415 4.8% 56.3 668 1.49% 3.12%
Oil 15,521 3.5% 42.2 31.6 0.07% 0.20%
Solar 12,349 2.8% 4.8 16,190 36.08% 131.10%
Geothermal 1,395 0.3% 41.7 128 0.29% 9.18%
Bioenergy 272 0.1% 23.3 - - -
Other 63 0.0% 25.8 - - -
As LQD and HYD only include dollar denominated debt, there is a strong US focus in the underlying
asset base. As a result, it is unsurprising that while coal accounts for 24.3% of the energy mix, no
further coal power is planned. However, within the planned and under construction capacity, gas
accounts for 22.2%, with wind and solar accounting for 30.6% and 36.1% respectively. For gas,
this expansion represents an increase in capacity of 7%. This divergence between coal and gas
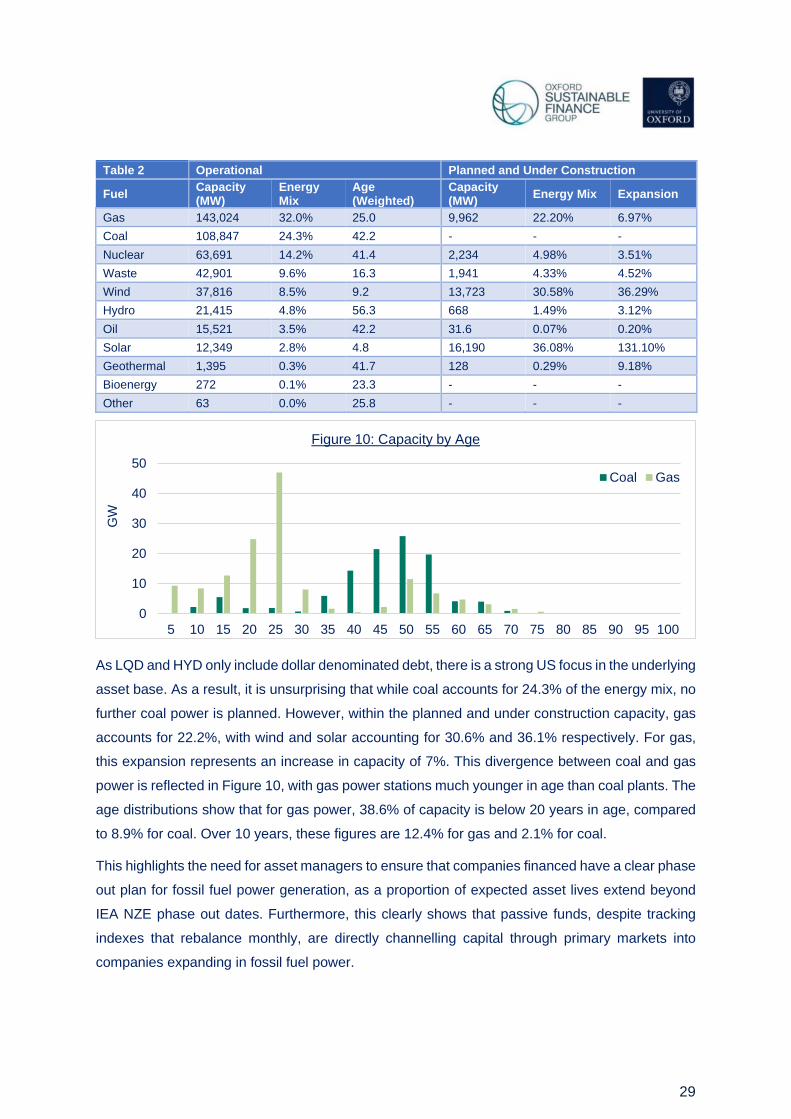
power is reflected in Figure 10, with gas power stations much younger in age than coal plants. The
age distributions show that for gas power, 38.6% of capacity is below 20 years in age, compared
to 8.9% for coal. Over 10 years, these figures are 12.4% for gas and 2.1% for coal.
This highlights the need for asset managers to ensure that companies financed have a clear phase
out plan for fossil fuel power generation, as a proportion of expected asset lives extend beyond
IEA NZE phase out dates. Furthermore, this clearly shows that passive funds, despite tracking
indexes that rebalance monthly, are directly channelling capital through primary markets into
companies expanding in fossil fuel power.
0
10
20
30
40
50
5 10 15 20 25 30 35 40 45 50 55 60 65 70 75 80 85 90 95 100
GW
Figure 10: Capacity by Age
Coal Gas
30
Fossil Fuel Production
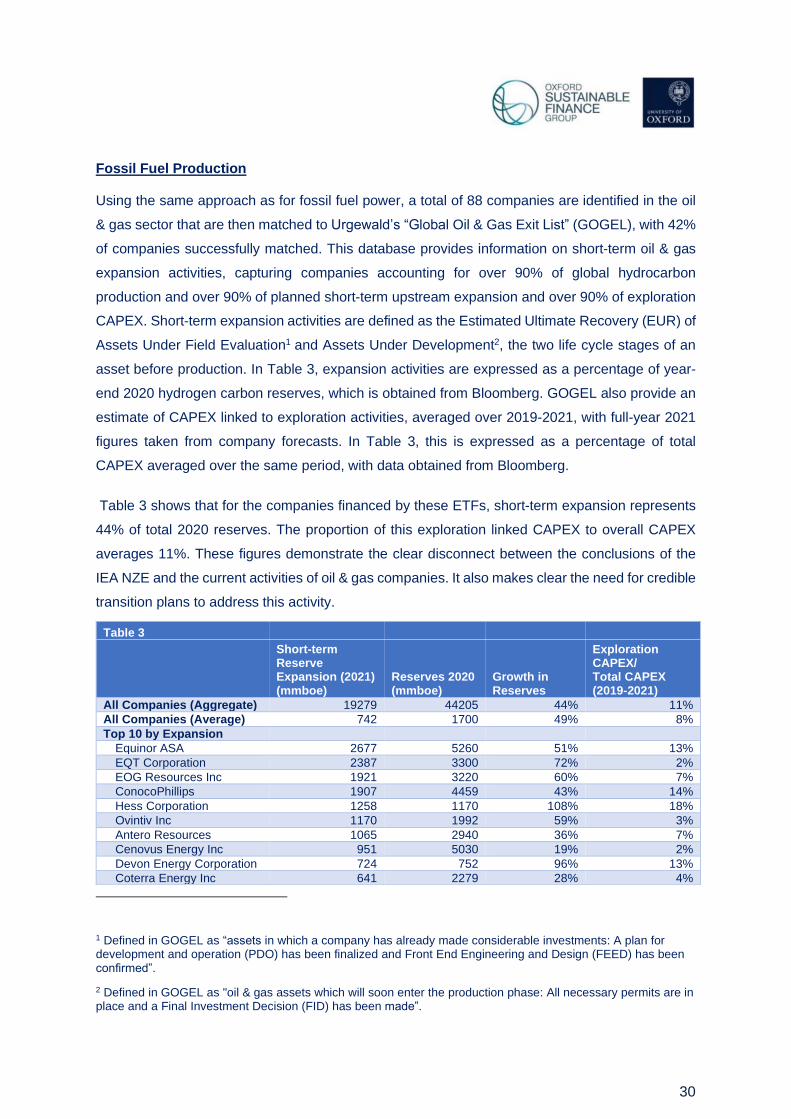
Using the same approach as for fossil fuel power, a total of 88 companies are identified in the oil
& gas sector that are then matched to Urgewald’s “Global Oil & Gas Exit List” (GOGEL), with 42%
of companies successfully matched. This database provides information on short-term oil & gas
expansion activities, capturing companies accounting for over 90% of global hydrocarbon
production and over 90% of planned short-term upstream expansion and over 90% of exploration
CAPEX. Short-term expansion activities are defined as the Estimated Ultimate Recovery (EUR) of
Assets Under Field Evaluation1 and Assets Under Development2, the two life cycle stages of an
asset before production. In Table 3, expansion activities are expressed as a percentage of year-
end 2020 hydrogen carbon reserves, which is obtained from Bloomberg. GOGEL also provide an
estimate of CAPEX linked to exploration activities, averaged over 2019-2021, with full-year 2021
figures taken from company forecasts. In Table 3, this is expressed as a percentage of total
CAPEX averaged over the same period, with data obtained from Bloomberg.
Table 3 shows that for the companies financed by these ETFs, short-term expansion represents
44% of total 2020 reserves. The proportion of this exploration linked CAPEX to overall CAPEX
averages 11%. These figures demonstrate the clear disconnect between the conclusions of the
IEA NZE and the current activities of oil & gas companies. It also makes clear the need for credible
transition plans to address this activity.
1 Defined in GOGEL as “assets in which a company has already made considerable investments: A plan for development and operation (PDO) has been finalized and Front End Engineering and Design (FEED) has been confirmed”.
2 Defined in GOGEL as "oil & gas assets which will soon enter the production phase: All necessary permits are in place and a Final Investment Decision (FID) has been made”.
Table 3
Short-term Reserve Expansion (2021) (mmboe)
Reserves 2020 (mmboe)
Growth in Reserves
Exploration CAPEX/ Total CAPEX (2019-2021)
All Companies (Aggregate) 19279 44205 44% 11%
All Companies (Average) 742 1700 49% 8%
Top 10 by Expansion
Equinor ASA 2677 5260 51% 13%
EQT Corporation 2387 3300 72% 2%
EOG Resources Inc 1921 3220 60% 7%
ConocoPhillips 1907 4459 43% 14%
Hess Corporation 1258 1170 108% 18%
Ovintiv Inc 1170 1992 59% 3%
Antero Resources 1065 2940 36% 7%
Cenovus Energy Inc 951 5030 19% 2%
Devon Energy Corporation 724 752 96% 13%
Coterra Energy Inc 641 2279 28% 4%

31
5.2 Investment Bank
To illustrate the challenges raised by the IEA NZE for an investment bank, we analyse the activity
of Barclays in the electric utilities sector. Barclays is chosen for several reasons. First, Barclays
has committed to be a net zero bank by 2050 and is part of the Net Zero Banking Alliance. Second,
Barclays is in the top 10 fossil fuel financiers globally and the largest in Europe (BankTrack, 2021).
Fossil Fuel Power
Taking Barclays’ syndicated loan transactions, as well as bond and equity underwriting activity
since 2016 from Eikon, 256 companies (including joint ventures) are identified, of which 62% are
successfully matched to the WEPP database. Capacity is aggregated to provide an illustrative
energy mix for the operational footprint of these companies. As capacity is not weighted by the
amount financed, this is not intended to be a representation of the energy mix of financing.
Furthermore, as this includes equity and debt underwriting, Barclays is likely to not have direct
credit exposure to many of these companies.
Table 4 Operational Planned and Under Construction
Fuel Capacity
(MW) Energy
Mix Age
(Weighted) Capacity
(MW) Energy
Mix Expansion
Gas 339,784 23.80% 23.6 43,987 16.64% 12.9%
Coal 325,981 22.80% 33.2 17,869 6.76% 5.5%
Nuclear 202,350 14.10% 37.5 16,604 6.28% 8.2%
Hydro 199,581 14.00% 46.3 19,153 7.25% 9.6%
Wind 155,391 10.90% 8.7 106,060 40.13% 68.3%
Waste 94,407 6.60% 16.6 7,478 2.83% 7.9%
Oil 61,324 4.30% 38.8 809 0.31% 1.3%
Solar 37,765 2.60% 4.9 50,457 19.09% 133.6%
Bioenergy 7,576 0.50% 14.2 582 0.22% 7.7%
Geothermal 3,658 0.30% 30.5 1,269 0.48% 34.7%
Other 2,346 0.20% 29.6 - - -
0
20
40
60
80
100
0 5 10 15 20 25 30 35 40 45 50 55 60 65 70 75 80 85 90 95 100
Capacity
-G
W
Figure 12: Capacity by Age
Gas Coal
32
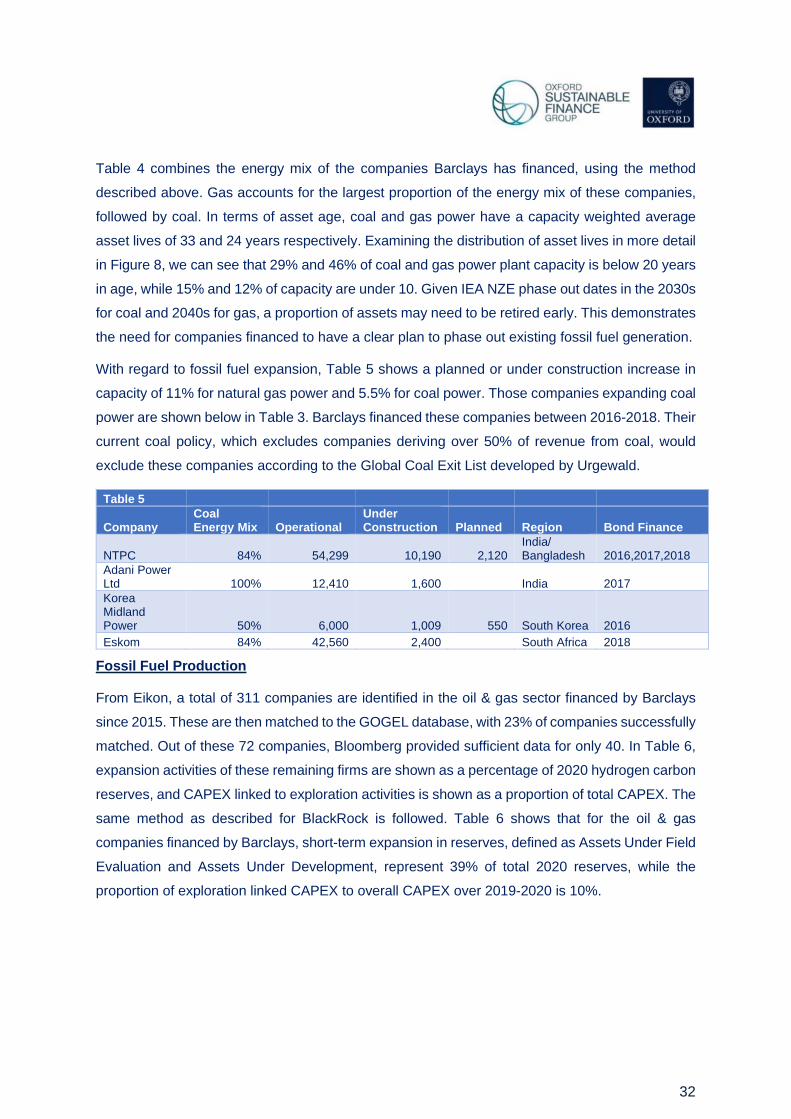
Table 4 combines the energy mix of the companies Barclays has financed, using the method
described above. Gas accounts for the largest proportion of the energy mix of these companies,
followed by coal. In terms of asset age, coal and gas power have a capacity weighted average
asset lives of 33 and 24 years respectively. Examining the distribution of asset lives in more detail
in Figure 8, we can see that 29% and 46% of coal and gas power plant capacity is below 20 years
in age, while 15% and 12% of capacity are under 10. Given IEA NZE phase out dates in the 2030s
for coal and 2040s for gas, a proportion of assets may need to be retired early. This demonstrates
the need for companies financed to have a clear plan to phase out existing fossil fuel generation.
With regard to fossil fuel expansion, Table 5 shows a planned or under construction increase in
capacity of 11% for natural gas power and 5.5% for coal power. Those companies expanding coal
power are shown below in Table 3. Barclays financed these companies between 2016-2018. Their
current coal policy, which excludes companies deriving over 50% of revenue from coal, would
exclude these companies according to the Global Coal Exit List developed by Urgewald.
Table 5
Company Coal Energy Mix Operational
Under Construction Planned Region Bond Finance
NTPC 84% 54,299 10,190 2,120 India/ Bangladesh 2016,2017,2018
Adani Power Ltd 100% 12,410 1,600 India 2017
Korea Midland Power 50% 6,000 1,009 550 South Korea 2016
Eskom 84% 42,560 2,400 South Africa 2018
Fossil Fuel Production
From Eikon, a total of 311 companies are identified in the oil & gas sector financed by Barclays
since 2015. These are then matched to the GOGEL database, with 23% of companies successfully
matched. Out of these 72 companies, Bloomberg provided sufficient data for only 40. In Table 6,
expansion activities of these remaining firms are shown as a percentage of 2020 hydrogen carbon
reserves, and CAPEX linked to exploration activities is shown as a proportion of total CAPEX. The
same method as described for BlackRock is followed. Table 6 shows that for the oil & gas
companies financed by Barclays, short-term expansion in reserves, defined as Assets Under Field
Evaluation and Assets Under Development, represent 39% of total 2020 reserves, while the
proportion of exploration linked CAPEX to overall CAPEX over 2019-2020 is 10%.
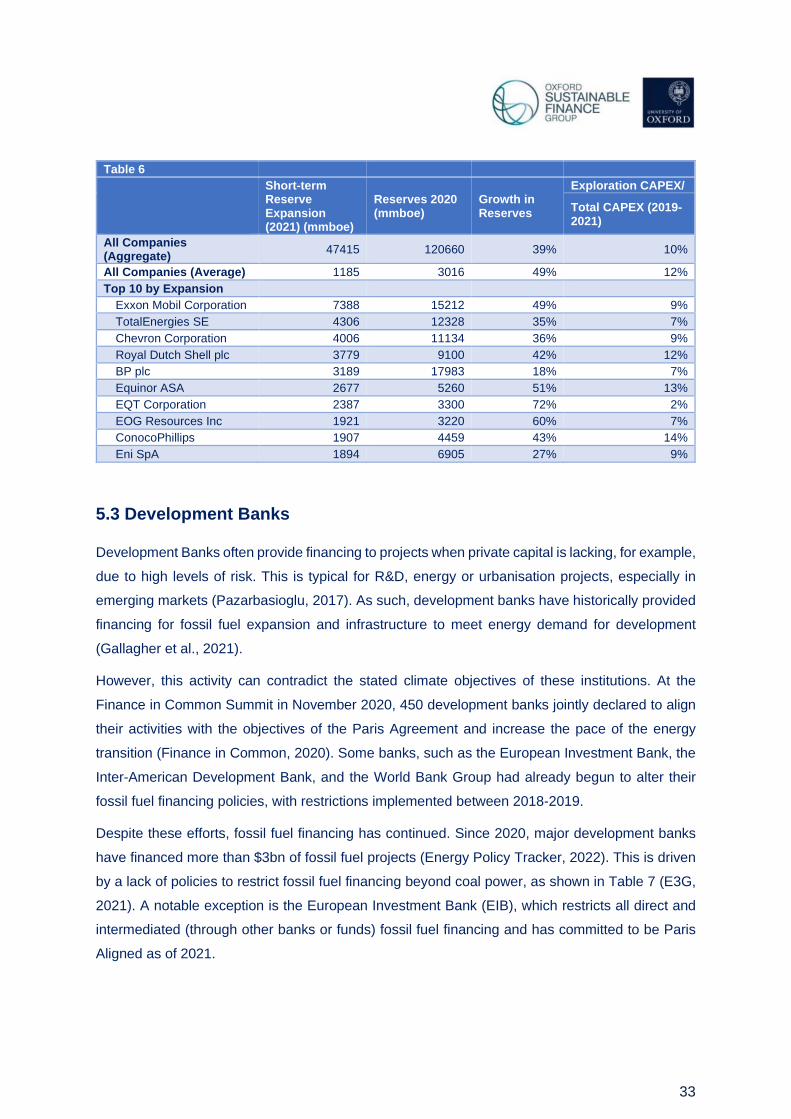
33
Table 6
Short-term Reserve Expansion (2021) (mmboe)
Reserves 2020 (mmboe)
Growth in Reserves
Exploration CAPEX/
Total CAPEX (2019-2021)
All Companies (Aggregate)
47415 120660 39% 10%
All Companies (Average) 1185 3016 49% 12%
Top 10 by Expansion
Exxon Mobil Corporation 7388 15212 49% 9%
TotalEnergies SE 4306 12328 35% 7%
Chevron Corporation 4006 11134 36% 9%
Royal Dutch Shell plc 3779 9100 42% 12%
BP plc 3189 17983 18% 7%
Equinor ASA 2677 5260 51% 13%
EQT Corporation 2387 3300 72% 2%
EOG Resources Inc 1921 3220 60% 7%
ConocoPhillips 1907 4459 43% 14%
Eni SpA 1894 6905 27% 9%
5.3 Development Banks
Development Banks often provide financing to projects when private capital is lacking, for example,
due to high levels of risk. This is typical for R&D, energy or urbanisation projects, especially in
emerging markets (Pazarbasioglu, 2017). As such, development banks have historically provided
financing for fossil fuel expansion and infrastructure to meet energy demand for development
(Gallagher et al., 2021).
However, this activity can contradict the stated climate objectives of these institutions. At the
Finance in Common Summit in November 2020, 450 development banks jointly declared to align
their activities with the objectives of the Paris Agreement and increase the pace of the energy
transition (Finance in Common, 2020). Some banks, such as the European Investment Bank, the
Inter-American Development Bank, and the World Bank Group had already begun to alter their
fossil fuel financing policies, with restrictions implemented between 2018-2019.
Despite these efforts, fossil fuel financing has continued. Since 2020, major development banks
have financed more than $3bn of fossil fuel projects (Energy Policy Tracker, 2022). This is driven
by a lack of policies to restrict fossil fuel financing beyond coal power, as shown in Table 7 (E3G,
2021). A notable exception is the European Investment Bank (EIB), which restricts all direct and
intermediated (through other banks or funds) fossil fuel financing and has committed to be Paris
Aligned as of 2021.
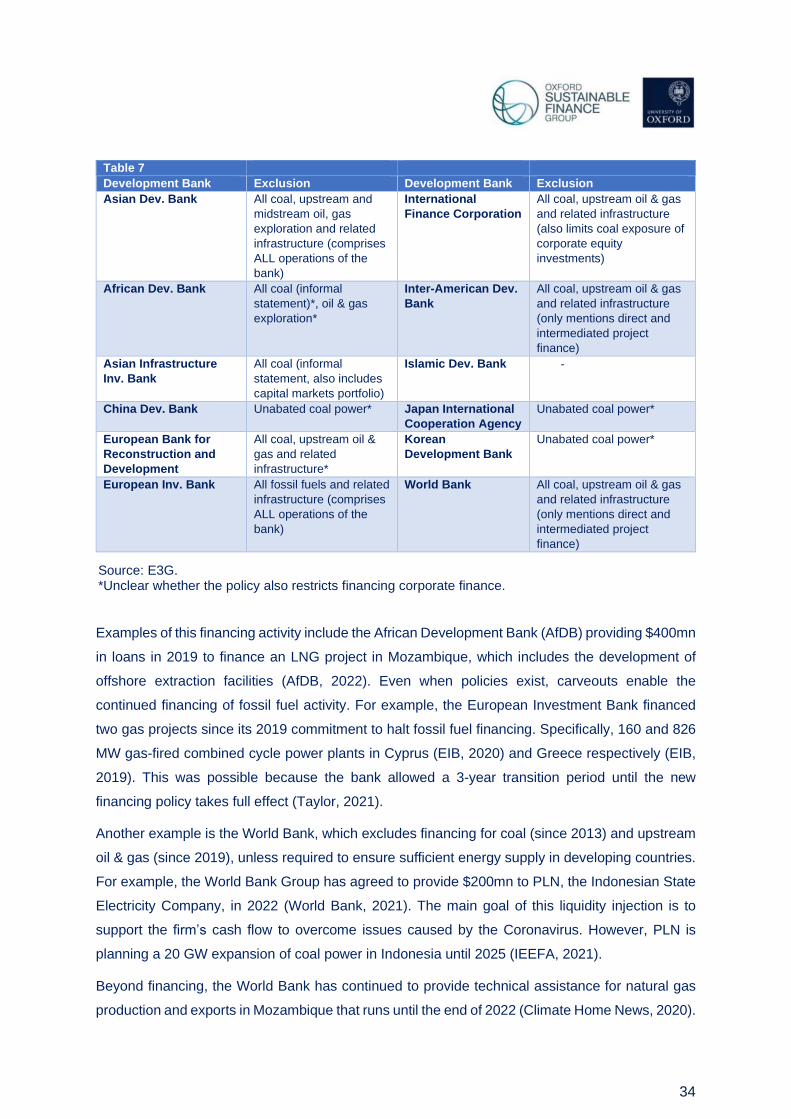
34
Table 7
Development Bank Exclusion Development Bank Exclusion
Asian Dev. Bank All coal, upstream and
midstream oil, gas
exploration and related
infrastructure (comprises
ALL operations of the
bank)
International
Finance Corporation
All coal, upstream oil & gas
and related infrastructure
(also limits coal exposure of
corporate equity
investments)
African Dev. Bank All coal (informal
statement)*, oil & gas
exploration*
Inter-American Dev.
Bank
All coal, upstream oil & gas
and related infrastructure
(only mentions direct and
intermediated project
finance)
Asian Infrastructure
Inv. Bank
All coal (informal
statement, also includes
capital markets portfolio)
Islamic Dev. Bank -
China Dev. Bank Unabated coal power* Japan International
Cooperation Agency
Unabated coal power*
European Bank for
Reconstruction and
Development
All coal, upstream oil &
gas and related
infrastructure*
Korean
Development Bank
Unabated coal power*
European Inv. Bank All fossil fuels and related
infrastructure (comprises
ALL operations of the
bank)
World Bank All coal, upstream oil & gas
and related infrastructure
(only mentions direct and
intermediated project
finance)
Examples of this financing activity include the African Development Bank (AfDB) providing $400mn
in loans in 2019 to finance an LNG project in Mozambique, which includes the development of
offshore extraction facilities (AfDB, 2022). Even when policies exist, carveouts enable the
continued financing of fossil fuel activity. For example, the European Investment Bank financed
two gas projects since its 2019 commitment to halt fossil fuel financing. Specifically, 160 and 826
MW gas-fired combined cycle power plants in Cyprus (EIB, 2020) and Greece respectively (EIB,
2019). This was possible because the bank allowed a 3-year transition period until the new
financing policy takes full effect (Taylor, 2021).
Another example is the World Bank, which excludes financing for coal (since 2013) and upstream
oil & gas (since 2019), unless required to ensure sufficient energy supply in developing countries.
For example, the World Bank Group has agreed to provide $200mn to PLN, the Indonesian State
Electricity Company, in 2022 (World Bank, 2021). The main goal of this liquidity injection is to
support the firm’s cash flow to overcome issues caused by the Coronavirus. However, PLN is
planning a 20 GW expansion of coal power in Indonesia until 2025 (IEEFA, 2021).
Beyond financing, the World Bank has continued to provide technical assistance for natural gas
production and exports in Mozambique that runs until the end of 2022 (Climate Home News, 2020).
Source: E3G. *Unclear whether the policy also restricts financing corporate finance.

35
Part of this assistance is designing transaction contracts between ENI and ExxonMobil for the $20
billion LNG project in Mozambique, due to begin operation in 2024 (Energies, 2021; Urgewald,
2020). While this activity does not directly provide liquidity to the company, it supports new
upstream natural gas production.
In light of these cases, it is encouraging that at COP26, four development banks, including the EIB,
and 35 countries signed the Statement on International Public Support for the Clean Energy
Transition (COP26 UK, 2021). This requires signatories to “end new direct public support for the
international unabated fossil fuel energy sector by the end of 2022, except in limited and clearly
defined circumstances”. Signatories then commit to encourage other countries to follow this policy,
and to work to ensure multilateral development banks take the same approach. Even though few
development banks signed the document, the signatory countries have significant voting power at
multilateral development organisations (The Big Shift, 2021), which increases the likelihood of
adoption (Table 8).
5.3 Summary
In this section, transaction-level data was mapped to asset-level power station databases (WEPP)
and a database tracking oil & gas expansion activity (GOGEL). This was done for BlackRock and
Barclays, two of the largest financial institutions in their respective sectors, both in terms of size
and fossil fuel financing. The conclusions of these case studies are summarised below.
• In fossil fuel power generation, the combined asset base of companies financed shows
that a significant proportion of capacity is below 20 and 10 years in age, with expected
operational lives extending into the 2030s and 2040s, when coal power is phased out and
gas generation reduced to only 1% of the energy mix in the IEA NZE. This demonstrates
the need for financial institutions to require electric utilities companies to detail and
implement transition plans with clear phase out dates for fossil fuel power generation, and
to address the compatibility of any gas power expansion.
o For matched companies financed by BlackRock ETFs selected, 38.6% of gas
capacity is below 20 years in age, while 12.4% is below 10. For coal power, these
figures are 8.9% and 2.1%.
Table 8
Development Bank Voting Power Development Bank Voting Power
Asian Dev. Bank 35% European Bank for
Reconstruction and Development
67%
African Dev. Bank 38% Inter-American Dev. Bank 51%
Asian Infrastructure Inv. Bank 22% World Bank 45%
Source: Big Shift Global.
36
o For matched companies financed by Barclays 46% of gas capacity is below 20
years in age, while 12% is under 10 years. For coal power, these figures are 29%
and 15%.
o For matched companies financed by BlackRock ETFs selected, 22% of planned or
under construction capacity is in gas. For matched companies financed by
Barclays, this figure is 17%. This is equivalent to a growth in capacity of 7% and
13%.
• In the fossil fuel production sector, there is a stark disconnect between the conclusions of
the IEA NZE, with requires a halt to fossil fuel reserve expansion, and the current activities
of oil & gas companies. As oil & gas companies develop transition plans and financial
institutions require them to remain eligible for financing, an end to fossil fuel expansion
must be a prerequisite for credibility.
o For matched companies financed by BlackRock ETFs selected, short-term
expansion plans in 2021 represent an increase of 44% relative to total 2020
reserves, while over 2019-2021, expansion linked CAPEX represents 11% of
overall CAPEX.
o For matched companies financed by Barclays, short-term expansion plans in 2021
represent an increase of 39% relative to total 2020 reserves, while over 2019-2021,
expansion linked CAPEX represents 10% of overall CAPEX.
• With regard to development banks, a lack of policies, or loopholes in financing policies,
such as those of the World Bank, enable the continued support of activities related to fossil
fuel expansion. Development banks need to revisit these financing policies in the light of
the conclusions of the IEA NZE.
37
References
350.org. (2021). The database of fossil fuel divestment commitments made by institutions worldwide.
https://divestmentdatabase.org/
AfDB. (2022). Mozambique - Mozambique LNG Area 1.
https://projectsportal.afdb.org/dataportal/VProject/show/P-MZ-FD0-003
Alova, G. (2020). A global analysis of the progress and failure of electric utilities to adapt their
portfolios of power-generation assets to the energy transition. Nature Energy.
https://doi.org/10.1038/s41560-020-00686-5
Ameli, N., Dessens, O., Winning, M., Cronin, J., Chenet, H., Drummond, P., Calzadilla, A.,
Anandarajah, G., & Grubb, M. (2021). Higher cost of finance exacerbates a climate investment
trap in developing economies. Nature Communications, 12(1), 4046.
https://doi.org/10.1038/s41467-021-24305-3
BankTrack. (2021). Banking on Climate Chaos 2021.
https://www.banktrack.org/article/new_report_world_s_60_largest_banks_have_poured_3_8_trill
ion_into_fossil_fuels_since_paris_agreement_climate_groups_sound_alarm_as_financing_for_f
ossil_fuel_expansion_continues_to_rise
Bodnar, P., Gray, M., Grbusic, T., Herz, S., Lonsdale, A., Mardell, S., Ott, C., Sundaresan, S., &
Varadarajan, U. (2020). How to retire early: Making Accelerated Coal Phaseout Feasible and
Just.
Braungardt, S., van den Bergh, J., & Dunlop, T. (2019). Fossil fuel divestment and climate change:
Reviewing contested arguments. Energy Research and Social Science, 50(June 2018), 191–
200. https://doi.org/10.1016/j.erss.2018.12.004
Budinis, S., Krevor, S., Dowell, N. Mac, Brandon, N., & Hawkes, A. (2018). An assessment of CCS
costs, barriers and potential. Energy Strategy Reviews, 22(May), 61–81.
https://doi.org/10.1016/j.esr.2018.08.003
Busch, C., & Gimon, E. (2014). Natural Gas versus Coal: Is Natural Gas Better for the Climate?
Electricity Journal, 27(7), 97–111. https://doi.org/10.1016/j.tej.2014.07.007
Caldecott, B. (2018). Stranded Assets and the Environment: Risk, Resilience and Opportunity.
Routledge. https://doi.org/https://doi.org/10.4324/9781315651606
Caldecott, B. (2020a). Climate risk management (CRM) and how it relates to achieving alignment with
climate outcomes (ACO). https://doi.org/10.1080/20430795.2020.1848142
Caldecott, B. (2020b). Defining transition finance and embedding it in the post-Covid-19 recovery.
38
Journal of Sustainable Finance and Investment, 0(0), 1–5.
https://doi.org/10.1080/20430795.2020.1813478
Caldecott, B., Holmes, I., Kruitwagen, L., Orozco, D., Tomlinson, S., Mitchell, B., Stevens, P., Marcel,
V., Burke, T., Mabey, N., Larson, F., Dimsdale, T., Grafham, O., Duval, C., & Adams, J. (2018).
Crude Awakening: Making Oil Ma Jor Business Models Climate-Compatible Authors. March.
www.e3g.org
Caldecott, Tulloch, D. J., Bouveret, G., Pfeiffer, A., Kruitwagen, L., McDaniels, J., & Dericks, G.
(2017). The fate of European coal-fired power stations planned in the mid-2000s. Sustainable
Finance Programme, August. http://www.smithschool.ox.ac.uk/research/sustainable-
finance/publications/The-fate-of-European-coal-fired-power-stations-planned-in-the-mid-2000s-
Working-Paper.pdf
Carney, M. (2015). Breaking the Tragedy of the Horizon – climate change and financial stability -
Speech given by Mark Carney at Lloyd’s of London.
www.bankofengland.co.uk/publications/Pages/speeches/default.aspx
Chenet, H., Ryan-Collins, J., & van Lerven, F. (2019). Climate-Related Financial Policy in a World of
Radical Uncertainty: Towards a Precautionary Approach. UCL Institute for Innovation and Public
Purpose, Working Paper Series (IIPP WP 2019-13). https://doi.org/10.2139/ssrn.3520224
Chichilnisky, G., Rezai, A., Hepburn, C., & Farmer, J. D. (2020). Less precision, more truth:
uncertainty in climate economics and macroprudential policy. Handbook on the Economics of
Climate Change, 2012, 420–438. https://doi.org/10.4337/9780857939067.00026
Chum, H., Navarro, A. D. la V., Edmonds, J., Faaij, A., Fungtammasan, B., Garg, A., Hertwich, E.,
Honnery, D., Infield, D., Kainuma, M., Khennas, S., Kim, S., Nimir, H. B., Riahi, K., Strachan, N.,
Wiser, R., & Zhang, X. (2014). 2014: Energy Systems. In Climate Change 2014: Mitigation of
Climate Change. Contribution of Working Group III to the Fifth Assessment Report of the
Intergovernmental Panel on Climate Change.
Climate Analytics. (2019). Global and regional coal phase-out requirements of the Paris Agreement :
Insights from the IPCC Special Report on 1 . 5 ° C.
Climate Home News. (2020). World Bank policy advice boosts oil and gas, undermining climate goals.
https://www.climatechangenews.com/2020/07/21/world-bank-policy-advice-boosts-oil-gas-
industry-undermining-climate-goals/
Cojoianu, T. F., Ascui, F., Clark, G. L., Hoepner, A. G. F., & Wójcik, D. (2020). Does the fossil fuel
divestment movement impact new oil and gas fundraising? Journal Of Economic Geography, 1–
24. https://doi.org/10.1093/jeg/lbaa027
COP26 UK. (2021). Statement on International Public Support for the Clean Energy Transition.
39
https://ukcop26.org/statement-on-international-public-support-for-the-clean-energy-transition/
Crédit Agricole. (2020). Crédit Agricole Climate Strategy. https://www.credit-
agricole.com/index.php/en/responsible-and-committed/our-csr-strategy-partnering-a-
sustainable-economy/climate-finance
Crédit Agricole. (2021). Eni Issues the World’s First Sustainability Linked Bond in the Oil & Gas
Sector. https://www.ca-cib.com/pressroom/news/eni-issues-worlds-first-sustainability-linked-
bond-oil-gas-sector
Crédit Mutuel. (2021). Sector policy - Hydrocarbons.
Cui, R. Y., Hultman, N., Edwards, M. R., Mcjeon, H., Iyer, G., Patel, P., Yu, S., Nace, T., & Shearer,
C. (2019). Quantifying operational lifetimes for coal power plants under the Paris goals. Nature
Communications, 1–9. https://doi.org/10.1038/s41467-019-12618-3
De Coninck, H., & Benson, S. M. (2014). Carbon dioxide capture and storage: Issues and prospects.
Annual Review of Environment and Resources, 39, 243–270. https://doi.org/10.1146/annurev-
environ-032112-095222
De Jong, M., & Nguyen, A. (2016). Weathered for climate risk: A bond investment proposition.
Financial Analysts Journal, 72(3), 34–39. https://doi.org/10.2469/faj.v72.n3.2
Dentons. (2013). A Guide to Project Finance A Guide to Project Finance.
Dimson, E., Kreutzer, I., Lake, R., Sjo, H., & Starks, L. (2013). Responsible Investment and the
Norwegian Government Pension Fund Global. November, 1–34.
Duff & Phelps. (2018). Oil & Gas Intelligence Report: Financing Instruments in the Upstream Sector.
April, 1–17.
E3G. (2021). The Position of Multilateral Development Banks Ahead of COP26.
E3G. (2022). European Investment Bank: Fossil fuel exclusion policies. https://www.e3g.org/bank-
metrics/fossil-fuel-exclusion-policies-eib/
EIB. (2019). MYTILINEOS SA - AGIOS NIKOLAOS POWER PLANT.
https://www.eib.org/en/projects/pipelines/all/20190291
EIB. (2020). EAC VASILIKOS CCGT UNIT 6. https://www.eib.org/fr/projects/pipelines/all/20190376
Energies, T. (2021). About the Mozambique Liquefied Natural Gas Project.
https://mzlng.totalenergies.co.mz/en/about-mozambique-liquefied-natural-gas-
project?__cf_chl_jschl_tk__=KganUGcUXmfKbBkkTetzyLnd8v93wpoTShyx0JfEXwU-
1641489446-0-gaNycGzNCqU
Energy Policy Tracker. (2022). Multilateral Development Banks Analysis.
40
https://www.energypolicytracker.org/institution_analysis/mdbs/
Environmental Finance. (2021). Environmental Finance Bond Database. https://www.bonddata.org/
European Investment Bank. (2021). The EIB Group PATH Framework.
Farmer, J. D., Hepburn, C., Mealy, P., & Teytelboym, A. (2015). A Third Wave in the Economics of
Climate Change. Environmental and Resource Economics, 62(2), 329–357.
https://doi.org/10.1007/s10640-015-9965-2
Ferris, N. (2021). Exclusive natural gas data reveals trillions of dollars of upcoming projects. Energy
Monitor. https://energymonitor.ai/finance/risk-management/exclusive-natural-gas-data-reveals-
trillions-of-dollars-of-upcoming-gas-projects
Finance in Common. (2020). Joint Declaration of all Public Development Banks in the World.
Fofrich, R., Tong, D., Calvin, K., De Boer, H. S., Emmerling, J., Fricko, O., Fujimori, S., Luderer, G.,
Rogelj, J., & Davis, S. J. (2020). Early retirement of power plants in climate mitigation scenarios.
Environmental Research Letters, 15(9). https://doi.org/10.1088/1748-9326/ab96d3
FS-UNEP. (2018). Global Trends in Renewable Energy Investment 2018.
Gallagher, K. S., Bhandary, R., Narassimhan, E., & Nguyen, Q. T. (2021). Banking on coal? Drivers of
demand for Chinese overseas investments in coal in Bangladesh, India, Indonesia and Vietnam.
Energy Research and Social Science, 71, 101827. https://doi.org/10.1016/j.erss.2020.101827
GFANZ. (2021). Glasgow Financial Alliance for Net Zero: Membership.
https://www.gfanzero.com/membership/
Goldstein, M. A., Hotchkiss, E. S., & Pedersen, D. J. (2019). Secondary Market Liquidity and Primary
Market Pricing of Corporate Bonds. Journal of Risk and Financial Management, 12(2), 86.
https://doi.org/10.3390/jrfm12020086
Greenfield, P. (2019). World’s top three asset managers oversee $300bn fossil fuel investments. The
Guardian. https://www.theguardian.com/environment/2019/oct/12/top-three-asset-managers-
fossil-fuel-investments
Helms, T., Salm, S., & Wüstenhagen, R. (2015). Investor-Specific Cost of Capital and Renewable
Energy Investment Decisions. In Charles W Donovan (ed.),RENEWABLE ENERGY FINANCE
Funding the Future of Energy (p. Chapter 5, pages 85-111).
HM Treaury. (2021). Fact Sheet: Net Zero-aligned Financial Centre.
https://www.gov.uk/government/publications/fact-sheet-net-zero-aligned-financial-centre/fact-
sheet-net-zero-aligned-financial-centre
ICMA. (2020). Sustainability-Linked Bond Principles.
https://www.icmagroup.org/assets/documents/Regulatory/Green-Bonds/June-

41
2020/Sustainability-Linked-Bond-PrinciplesJune-2020-100620.pdf
IEA. (2019). The Oil and Gas Industry in Energy Transitions.
IEA. (2021a). Achieving Net Zero Electricity Sectors in G7 Members.
IEA. (2021b). Net Zero by 2050. Net Zero by 2050. https://doi.org/10.1787/c8328405-en
IEA. (2021c). Pathway to critical and formidable goal of net-zero emissions by 2050 is narrow but
brings huge benefits, according to IEA special report. https://www.iea.org/news/pathway-to-
critical-and-formidable-goal-of-net-zero-emissions-by-2050-is-narrow-but-brings-huge-benefits
IEA. (2021d). World Energy Outlook 2021.
IEEFA. (2021). PLN plans finish to 20GW coal projects before going to renewables.
https://ieefa.org/pln-plans-finish-to-20gw-coal-projects-before-going-to-renewables/
IIGCC. (2021). Net Zero Standard for Oil and Gas (Issue September).
IPCC. (2018). IPCC Special Report 1.5 - Summary for Policymakers. In Global Warming of 1.5°C. An
IPCC Special Report on the impacts of global warming of 1.5°C above pre-industrial levels and
related global greenhouse gas emission pathways, in the context of strengthening the global
response to the threat of climate change,.
Jahnke, P. (2019). Holders of Last Resort: The Role of Index Funds and Index Providers in
Divestment and Climate Change. SSRN Electronic Journal, March, 1–22.
https://doi.org/10.2139/ssrn.3314906
Jolly, J. (2019). World’s biggest investor accused of dragging feet on climate crisis. The Guardian.
https://www.theguardian.com/business/2019/may/21/blackrock-investor-climate-crisis-blackrock-
assets
Kölbel, J. F., Heeb, F., Paetzold, F., & Busch, T. (2020). Can Sustainable Investing Save the World?
Reviewing the Mechanisms of Investor Impact. Organization and Environment, 33(4), 554–574.
https://doi.org/10.1177/1086026620919202
Krupa, J., & Harvey, L. D. D. (2017). Renewable electricity fi nance in the United States : A state-of-
the-art review. Energy, 135, 913–929. https://doi.org/10.1016/j.energy.2017.05.190
Larkin, A., Kuriakose, J., Sharmina, M., & Anderson, K. (2018). What if negative emission
technologies fail at scale? Implications of the Paris Agreement for big emitting nations. Climate
Policy, 18(6), 690–714. https://doi.org/10.1080/14693062.2017.1346498
Linklaters. (2021). Sustainability linked lending in the European leveraged loan market.
Norhasyima, R. S., & Mahlia, T. M. I. (2018). Advances in CO2 utilization technology: A patent
landscape review. Journal of CO2 Utilization, 26(May), 323–335.

42
https://doi.org/10.1016/j.jcou.2018.05.022
Pazarbasioglu, C. (2017). A new role for development banks? World Bank Blog.
https://blogs.worldbank.org/voices/new-role-development-banks
Pensions & Investments. (2021). No end in sight to BlackRock’s growth as it approaches $10 trillion.
https://www.pionline.com/money-management/blackrock-surging-toward-10-trillion-assets
Pfeiffer, A., Hepburn, C., Vogt-Schilb, A., & Caldecott, B. (2018). Committed emissions from existing
and planned power plants and asset stranding required to meet the Paris Agreement.
Environmental Research Letters, 13(5). https://doi.org/10.1088/1748-9326/aabc5f
Pfeiffer, A., Millar, R., Hepburn, C., & Beinhocker, E. (2016). The “2°C capital stock” for electricity
generation: Committed cumulative carbon emissions from the electricity generation sector and
the transition to a green economy. https://doi.org/10.1016/j.apenergy.2016.02.093
Quigley, E. (2019). Universal Ownership in the Anthropocene. SSRN Electronic Journal, 1–39.
https://doi.org/10.2139/ssrn.3457205
Reclaim Finance. (2021a). French bank La Banque Postale quits oil & gas, sets international
precedent. https://reclaimfinance.org/site/en/2021/10/14/french-bank-la-banque-postale-quits-oil-
gas-sets-international-precedent/
Reclaim Finance. (2021b). Methodology for the Coal Companies Watchlist.
https://reclaimfinance.org/site/2021/12/16/methodology-for-the-coal-companies-watchlist/
S&P Global. (2019). Average age of US power plant fleet flat for 4th-straight year in 2018.
https://www.spglobal.com/marketintelligence/en/news-
insights/trending/gfjqeFt8GTPYNK4WX57z9g2
Saygin, D., Rigter, J., Caldecott, B., Wagner, N., & Gielen, D. (2019). Energy Sources, Part B:
Economics, Planning, and Policy Power sector asset stranding effects of climate policies Power
sector asset stranding effects of climate policies.
https://doi.org/10.1080/15567249.2019.1618421
Schoon, N. (2011). Pension Funds as Universal Owners: Opportunity Beckons and Leadership Calls.
CFA Digest, 41(3), 76–77. https://doi.org/10.2469/dig.v41.n3.19
ShareAction. (2021). Countdown to COP26 An analysis of the climate and biodiversity practices of
Europe ’ s largest banks.
Steffen, B. (2018). The importance of project finance for renewable energy projects. Energy
Economics, 69, 280–294. https://doi.org/10.1016/j.eneco.2017.11.006
Tapia, J. F. D., Lee, J. Y., Ooi, R. E. H., Foo, D. C. Y., & Tan, R. R. (2018). A review of optimization
and decision-making models for the planning of CO2 capture, utilization and storage (CCUS)
43
systems. Sustainable Production and Consumption, 13(April), 1–15.
https://doi.org/10.1016/j.spc.2017.10.001
Taylor, K. (2021). Not quite over yet: EIB spent €890 million on fossil gas since phase out, activists
say. EURACTIV. https://www.euractiv.com/section/energy-environment/news/not-quite-over-yet-
eib-spent-e890-million-on-fossil-gas-during-phase-out-activists-say/
TCFD. (2021). Task Force on Climate-related Financial Disclosures Guidance on Metrics, Targets,
and Transition Plans (Issue October). https://doi.org/10.1142/9789811213960_0001
The Big Shift. (2021). Multilateral Development Banks Absent from Glasgow Pact to Shift Fossil
Finance to Renewables Signed by Major Shareholder Governments.
https://bigshiftglobal.org/multilateral-development-banks-absent-glasgow-pact-shift-fossil-
finance-renewables-signed-major
Tom Saunders. (2021). Vanguard and BlackRock uncovered as largest investors in coal industry. City
A.M. https://www.cityam.com/vanguard-and-blackrock-uncovered-as-largest-investors-in-coal-
industry/
Tong, D., Zhang, Q., Zheng, Y., Caldeira, K., Shearer, C., Hong, C., Qin, Y., & Davis, S. J. (2019).
Committed emissions from existing energy infrastructure jeopardize 1.5 °C climate target.
Nature, 572(7769), 373–377. https://doi.org/10.1038/s41586-019-1364-3
Unruh, G. C. (2000). Understanding carbon lock-in. Energy Policy, 28, 817–830.
Urgewald. (2020). World Bank involved in conflict of interest cases in Mozambique LNG development.
https://urgewald.org/medien/world-bank-involved-conflict-interest-cases-mozambique-lng-
development
Volcovici, V. (2021). Biden orders U.S. to stop financing new carbon-intense projects abroad.
Reuters. https://www.reuters.com/business/energy/biden-orders-us-stop-financing-carbon-
intense-overseas-fuel-projects-2021-12-10/
Way, R., Ives, M., Mealy, P., Farmer, J. D., Way, R., Ives, M. C., Mealy, P., & Farmer, J. D. (2021).
Empirically grounded technology forecasts and the energy transition Empirically grounded
technology forecasts and the energy transition. INET Oxford Working Paper No. 2021-01.
Wilberforce, T., Baroutaji, A., Soudan, B., Al-Alami, A. H., & Olabi, A. G. (2019). Outlook of carbon
capture technology and challenges. Science of the Total Environment, 657, 56–72.
https://doi.org/10.1016/j.scitotenv.2018.11.424
Wilson, C., & Caldecott, B. (2021). Breaking the Bond: Primary Markets and Carbon-Intensive
Financing. Smith School of Enterprise and the Environment - Working Paper No. 21-05.
World Bank. (2021). Indonesia - PLN Financial Stabilization and Reform Project.

44
https://projects.worldbank.org/en/projects-operations/project-detail/P174560
Related Documents