88 Amity Journal of Finance ADMAA Amity Journal of Finance 4 (2), (88-109) ©2019 ADMAA Implications of NPAs on the Profitability of SCBs – A Comparative Study of Public, Private and Foreign Banks Inchara P M Gowda Kuvempu University, Karnataka, India Introduction Financial system plays a stupendous role in the economic development of any country. Within the broader financial sector, banking sector occupies an important place. This is true even in the case of India. Indian banking industry is fairly matured in terms of products/services, delivery of services, automation, branch expansion to reach even the rural parts of the country, ability to face competition, etc. These achievements are attributable to the initiatives taken by the government to Abstract The Reserve Bank of India has directed all banks in India to undertake asset quality review exercise and this exercise has unearthed colossal amount of non-performing loans and advances. This non-performing loan/asset is haunting all kinds of banking companies including scheduled commercial banks (SCBs) which broadly comprise both domestic banks [i.e., both public sector banks (PSBs) and private sector banks (PVSBs)] and branches of foreign banks (FBs). Though both the regulatory authorities and the banks concerned initiated many measures to resolve the problem of continuously increasing NPAs, both the amount and the rate of NPAs are increasing on an incessant basis which should be a matter of great concern for all stakeholders including the government and banking companies. This is because of the reason that, NPAs have been adversely affecting the financial performance of not only SCBs but also different sectors of the economy. However, the incidence of NPAs and their implications on the financial results differ from one group of SCBs to another. In the above backdrop, this paper examines and compares the financial performance of PSBs, PVSBs and FBs, and the implications of NPAs and the Provision against these NPAs on their profit and profitability. For this purpose, relevant statistics for a period of ten years, 2008-09 to 2017- 18, are collected and used. Trend Analysis and Regression Analysis are carried out besides the CAGR for the purpose of analysis. The study shows that deteriorating asset quality is the root-cause for the mounting NPAs requiring higher amount of Provision against NPAs causing either reduction in profit and profitability or converting profit situation into loss situation. Key words: Financial Performance, Non-Performing Assets, Provision, Profitability, Return on Assets, Return on Equity JEL Classification: E50, E51, G21 Paper Classification: Research Paper

Welcome message from author
This document is posted to help you gain knowledge. Please leave a comment to let me know what you think about it! Share it to your friends and learn new things together.
Transcript
88 Amity Journal of FinanceADMAA
Volume 4 Issue 2 2019AJF
Amity Journal of Finance4 (2), (88-109)
©2019 ADMAA
Implications of NPAs on the Profitability of SCBs – A Comparative Study of Public, Private and Foreign Banks
Inchara P M GowdaKuvempu University, Karnataka, India
IntroductionFinancial system plays a stupendous role in the economic development of any country. Within
the broader financial sector, banking sector occupies an important place. This is true even in the case of India. Indian banking industry is fairly matured in terms of products/services, delivery of services, automation, branch expansion to reach even the rural parts of the country, ability to face competition, etc. These achievements are attributable to the initiatives taken by the government to
AbstractThe Reserve Bank of India has directed all banks in India to undertake asset quality review exercise and
this exercise has unearthed colossal amount of non-performing loans and advances. This non-performing loan/asset is haunting all kinds of banking companies including scheduled commercial banks (SCBs) which broadly comprise both domestic banks [i.e., both public sector banks (PSBs) and private sector banks (PVSBs)] and branches of foreign banks (FBs). Though both the regulatory authorities and the banks concerned initiated many measures to resolve the problem of continuously increasing NPAs, both the amount and the rate of NPAs are increasing on an incessant basis which should be a matter of great concern for all stakeholders including the government and banking companies. This is because of the reason that, NPAs have been adversely affecting the financial performance of not only SCBs but also different sectors of the economy. However, the incidence of NPAs and their implications on the financial results differ from one group of SCBs to another. In the above backdrop, this paper examines and compares the financial performance of PSBs, PVSBs and FBs, and the implications of NPAs and the Provision against these NPAs on their profit and profitability. For this purpose, relevant statistics for a period of ten years, 2008-09 to 2017-18, are collected and used. Trend Analysis and Regression Analysis are carried out besides the CAGR for the purpose of analysis. The study shows that deteriorating asset quality is the root-cause for the mounting NPAs requiring higher amount of Provision against NPAs causing either reduction in profit and profitability or converting profit situation into loss situation.
Key words: Financial Performance, Non-Performing Assets, Provision, Profitability, Return on Assets, Return on Equity
JEL Classification: E50, E51, G21
Paper Classification: Research Paper
89Amity Journal of Finance
Volume 4 Issue 2 2019 AJF
ADMAA
establish, nurture, expand and strengthen the banking sector. The government initiatives include, among others, nationalization of major private sector banks, opening of more branches of public sector banks, permission for private players to enter the banking sector, allowing foreign banks to open their branches in India, etc.
Indian banking industry broadly comprises scheduled and non-scheduled banks. It may be noted here that ‘scheduled banks’ refer to the banks included in the 2nd Schedule of the Reserve Bank of India Act, 1934. It may be noted here that, to be eligible for inclusion in the 2nd Schedule of the Act, a bank must satisfy certain conditions such as (i) satisfying the apex bank that it does not conduct its activities in a manner prejudicial to the interest of its depositors, (ii) it has a paid-up capital and reserves of at least ` 2.5 million, etc.These scheduled banks comprise public sector banks (PSBs), private sector banks (PVSBs), branches of foreign banks (FBs), regional rural banks (RRBs), etc.
A Glimpse of NPAs and Resolution Mechanisms Though Indian banking industry is matured, it is plagued with perennially increasing amount
of non-performing assets or loans (NPAs or NPLs). It may be noted here that the term, ‘non-performing asset’ (NPA) is used in India in place of the term, ‘non-performing loan’ (NPL). In this work also, the term, ‘non-performing assets’ (NPAs) is used. However, a few facts and figures presented below2 throw light on the gravity of this menace.
Indian banks have been reporting continuously increasing amount of NPAs – `2,750 Billion in March 2015 to `7,330 Billion by June 2017 and to `8,500 Billion by the end of 2017. It increased further to `10,387 Billion by 31 December 2018. This is a conservative estimation and the actual amount of NPAs may be higher than the reported amount. However, ‘NPAs of PSBs’>‘NPAs of PVSBs’>‘NPAs of FBs’. This is natural as the PSBs are the major players in the Indian banking industry/sector. As PSBs are major players, they also have larger share in the NPAs of SCBs.
Gross NPA Ratio is also increasing continuously – from 5.05% in March 2015 to 12.34% by March 2017. Even the Net NPA Ratio is positive indicating higher amount of NPAs than the amount of Provision created against these NPAs. Both the positive amount and rate of Net NPAs signify inadequacy of the amount of Provision made by the banking companies against their NPAs. And most importantly, the amount of Provision made against NPAs is a charge to the Statement of Profit and Loss. Therefore, it (i.e., Provision) affects both the profits and profitability ratios of banking companies adversely. Besides, increasing overdue leads to higher level of NPAs caused by deterioration in the asset quality. This reduces the lending capacity of banks and curtails the funds for developmental activities hindering socio-economic development of the economy (Kashyap, 2014).
The relative shares in the NPAs are, industry 55.14%, services 23.78%, agriculture 15.49%, and personal 5.59%. Willful defaulters are also increasing – already identified 8,915 defaulters who can repay the loan but not repaying. The amount due from these wilful defaulters is estimated at `923.76 Billion. Surprisingly, even the educational loans are contributing to the problems of banking companies as about 7.67% of educational loan is in default (in repayment). And most importantly, most of these educational loan borrowers have well-paying jobs and therefore, they can repay the borrowed sums. Unfortunately, some of these borrowers are not repaying. Above all, the country ranks 5th in the list of 39 major world economies with highest NPA levels (Money Control, 2017).
In order to address and resolve this problem, both the Government of India (GoI), the RBI
90 Amity Journal of FinanceADMAA
Volume 4 Issue 2 2019AJF
and the lending banks have designed and implemented many schemes, regulations, laws, etc. SARFAESI Act 2002, establishment of Debt Recovery Tribunals, Lok Adalats, Joint Lenders’ Forum, Corporate Debt Restructuring 2001, Strategic Debt Restructuring, Scheme for Sustainable Structuring of Stressed Assets, Revised Prompt Corrective Action Plan 2017, Recapitalization Scheme, etc., are some of the initiatives taken to address the souring NPA problem. However, despite these measures, the country has not been able to remove the NPAs completely from the balance sheets of banking companies (Gowda, I & Manjunath, K.R. 2017).
Literature Review Berge & Boye (2007) examined the macro-economic factors which are the sources of ‘problem
loans’ of banking companies. The amount of problem loans is highly sensitive to cyclical developments and increases during economic downturns. The results show that the decline in the relative share is due to the developments in the real interest rates and unemployment. After examining the problems of Chinese banks, Killion (2009) addressed the specific problems of banking sector ranging from NPAs to Chinese money market and inter-bank lending business. The author is of the opinion that, these problems are directly associated with the liberalisation of financial sector along with the requirements of both the WTO rules and the Chinese WTO protocol. Jong-Wha & Changyong (2007) analysed the process of recovery from the 1997 financial crisis in South Korea. The authors observed that the government acted quickly to restore financial stability. Two important policy initiatives of government resulting in the faster restoration were (i) early closure of non-viable financial institutions and (ii) quicker resolution of NPAs.
Caporale, Di Colli & Lopez (2014) examined the macro-economic and financial determinants of bad loans to find out whether the excess loan sanctioned during expansionary phases explains the greater-than proportional increase in NPAs during contractionary phases. The results showed that the NPAs on the excess loan are significant and persistent for corporate bad loans but not for household bad loans. Bodla &Verma (2006-2007) attempted to identify the key determinants of profitability of Indian PSBs. Using Stepwise Multivariate Regression Model on temporal data from 1991-92 to 2003-04, the study established the existence of significant relationship between non-interest income, operating expenses, provisions and contingencies, and spread on the one hand, and net profit on the other. Arora & Singh (2015/2016) attempted to examine the core credit risk management processes of Indian PSBs to identify the grey areas. They analysed the perception of three groups of credit and risk managers on credit risk management practices viz., managers of large and small banks, managers with different lengths of banking experience, and managers at different levels of management. It is found that, human resource potential development through risk trainings, data management, integration across credit departments, increasing consistencies in risk rating approaches, reducing subjectivity in credit ratings and loan processing time, and increasing focal attention on problem loans are the key areas which need improvement.
Rao, Yue & Zhu (2015) examined the impact of credit borrower concentration and controlling shareholder/s on NPAs, and the financial performance of banking companies. The study found that, (i) voting power of bank’s controlling shareholder/s is positively related to the borrower’ concentration, (ii) controlling shareholders divert resources away from banks by extending huge amount of loans to a few related parties leading to borrower concentration, (iii) a few seemingly unrelated large borrowers are actually related to controlling shareholders, and (iv) borrower concentration is positively related to NPAs and negatively related to financial performance. Ataullah, Cockerill and Le (2004) made a comparative study of impact of reforms on the performance of banking companies in India and Pakistan. The authors used Data Envelopment Analysis (DEA) to two alternative input-output specifications to measure technical efficiency
91Amity Journal of Finance
Volume 4 Issue 2 2019 AJF
ADMAA
which is decomposed into pure technical efficiency and scale efficiency. The results show that, (i) overall technical efficiency of banking companies of both the countries has improved gradually over the years, (ii) unlike PSBs in India, PSBs in Pakistan registered improvement only in scale efficiency, (iii) banks are relatively more efficient in generating earning assets than in generating income, and (iv) the gap between pure technical efficiency of different size groups has declined over the years.
Vithessonthi (2016) examined the relationship between the growth in bank credit and NPAs in an economy with deflationary pressures. Relevant data from 82 publicly listed commercial banks in Japan from1993 to 2003 were used for the study. The results show the time-varying relationship between bank credit growth and NPAs. Further, the findings demonstrate that the increase in the supply of bank loan increases the level of NPAs, but it does not lead to higher profitability. For the purpose of evaluating the performance of Indian PSBs, Annapurna& Manchala (2017) used the concept of balanced scorecard (BSC). The authors selected three top PSBs viz., State Bank of India, Bank of Baroda and Punjab National Bank, and used their performance statistics from 2006 to 2015. The authors examined the relationship between profitability and variables in BSC framework using Correlation and Multiple Regressions. The results showed statistically significant relationship of variables viz., Capital Adequacy Ratio (CAR), Net NPA Ratio, number of ATMs and number of skilled employees with Return on Assets (RoA). Further, the analysis showed statistically significant relationship between (i)CAR, Net NPA Ratio, number of ATMs, number of skilled employees and ratio of wage bill to total income on the one hand, and (ii)Return on Equity (RoE) on the other. The results of Regression Analysis also showed that the Net NPA Ratio has a significant direct linear relationship with RoA, and CAR was found to have a direct relationship with RoE. However, the Net NPA Ratio had an inverse relationship with RoE.
Considering the relevant data for a period of eight years from 1998-99 to 2005-06 and using production approach of DEA, Bodla and Bajaj (2010) examined the efficiency of 29 PVSBs in India. Based on the analysis, they inferred that, only about 31.25% of PVSBs are found to be efficient during the study period, and majority of PVSBs have failed to acquire full efficiency score. Further, they felt that the PVSBs are required to take necessary steps to reduce the NPA Ratio on the one hand and to improve the output variables such as deposits, advances and investments on the other. Keeping in mind the importance of channelizing loans to certain sectors of the economy, the RBI has directed the banks in India to earmark a portion of their loanable fund for the purpose of lending to priority sectors. When it was introduced in 1967-68, the target was not fixed but over the years, the apex bank started fixing the target – starting from 15% to about 40% now. In this backdrop, Parimalarani (2011) attempted to analyse the performance of commercial banks for a period of 14 years (1996-97 to 2009-10) in the area of priority sector lending. The results show that, (i) majority of banks have achieved the target in terms of loans to priority sectors, (ii) loans to priority sectors have registered an increasing trend, and (iii) NPAs of priority sector lending were very high during two years of study period and declined in the subsequent years.
Satpathy, Behera & Digal (2015) examined the macro- and micro-economic factors causing the rise in the NPA levels in Indian banking sector. For this purpose, the authors considered 45 SCBs from three ownership categories of banks (viz., PSBs, PVSBs and FBs), and used their performance statistics from 2005 to 2013. It is found that the macro-economic factors such as GDP, trade balance with other countries, higher government deficit and inflation level explain the recent upward trend in the NPA levels of SCBs. On the other hand, micro-economic factors (i.e., bank specific factors) such as restructuring activities, operating efficiency and credit growth are found to have control over the NPA levels significantly. Mahapatra & Mohanty (2012) examined the performance of branches of foreign banks functioning in India and compared their performance with Indian
92 Amity Journal of FinanceADMAA
Volume 4 Issue 2 2019AJF
PSBs and PVSBs. It is found that the FBs have fared better than PSBs and PVSBs in terms of profitability. Even the Net NPA Ratio of foreign banks has declined when compared to PSBs.
Profitability of banks depends upon their alertness, customer orientation, operational efficiency, optimal level of working, etc. Another crucial variable of successful functioning of banks is their ability to build up large volumes of quality loan-assets while complying with prudential norms. Further, productivity and efficiency play an important role in the banking industry. Continuous up-gradation at all levels, and commitment to the vision and mission of banks require the attention of banks in future. Jain,V. (2007) felt that the banks which are pro-active respond quickly to the changing needs of customers, hence, will survive and prosper in this competitive world.
Arindam (2018) attempted to measure the efficiency of Indian commercial banks during pre- and post-global recession (2001-02 to 2006-07, and 2007-08 to 2012-13 respectively). For this purpose, the author used Data Envelopment Analysis as an operation research technique and input-oriented variable return to scale approach. Linear programme was formulated to determine the efficiency and super efficiency scores of different commercial banks. Besides, to test whether there was a significant difference between the ranks obtained by the banks during pre- and post-recession periods, Spearman’s Rank Correlation was used. It is found that the recession had little impact on the performance though the PVSBs were able to function better than PSBs during the post-recession period as compared to pre-recession period.
Karnataka State Financial Corporation (KSFC) is a state level development financial institution established by the Government of Karnataka in 1959 to assist the industrial units in the state of Karnataka. During this six decades, the corporation has provided loans and advances to more 1.70 lakh units to the tune of ` 152.75 Billion and more than 75% of this assistance is for the MSMEs. In this background, Inchara (2018) evaluated the overall performance of the corporation using its performance statistics for a period of 20 years, 1997-98 to 2016-17. The study results demonstrated the improvement in its performance from the point of view of net interest spread (by not allowing its interest cost to increase significantly), surplus (i.e., excess of net total income over non-interest costs) and Provision for NPAs (by not allowing it to increase substantially owing to its effort to improve asset quality). It is felt that this is not satisfactory. Therefore, it is suggested that the corporation should improve its performance by undertaking the credit appraisal as objectively as required, by improving its recovery performance further, by improving its standard assets and by lowering the sub-standard assets, doubtful assets and loss assets.
Pillai (2018) observed that the Indian banking sector has achieved commendable success even in the wake of global financial landslide. This is attributable to sound and effective regulatory framework ensuring perennial surveillance of Indian banks. However, this regulatory framework has not ensured protection to banking companies from potential credit risk. As is known, there has been a continuous increase in the bad loans eroding otherwise productive assets. And the problem of NPA is still unresolved. In this backdrop, it is attempted to examine the chronological trend in NPAs of Indian banking system in the recent years. It is felt that addressing the NPA problem requires greater attention of both the government and higher authorities, and bank level effort.
Jaslene, Vinay, Mitra & Sankarshan (2019) attempted to examine the panel data of 46 Indian banks for eight years (2007 to 2014) with the help of 31 financial/accounting ratios. They used GMM model which deals with endogeneity issues present in the data. And 31 ratios are used to evaluate different dimensions of performance such as operating capability, liquidity, solvency, profitability, capital adequacy and business development capacity which together affect the NPAs. The study found negative significant relationship between intermediation cost ratio, RoA and NPAs.
93Amity Journal of Finance
Volume 4 Issue 2 2019 AJF
ADMAA
Using the data presented by the apex bank in its report(i.e., Report on Trend and Progress of Banking in India for the year ended 30 June 2019 submitted to the Central Government), Kalyanasundaram (2020) concludes that the major factor responsible for the decline in the gross NPAs of SCBs in India is not the improvement in the recovery performance but the increase in the amount of NPAs written-off. For instance, during 2018-19, the SCBs recovered ` 1,797 billion of NPAs (and standard loans) as against ` 2,369 billion of NPAs written-off. It may be noted here that these write-offs are charged to the Statements of Profit and Loss affecting the financial results of banking companies adversely.
Based on the performance statistics of Karnataka State Financial Corporation for a period of 10 years, 2007-08 to 2016-17, Inchara (2019) examined its recovery performance. The results of the analysis showed that there has been a substantial improvement in its recovery performance. However, there is a scope for further improvement which the corporation has shown in one or the other years of the study period but allowed it to decline in other years. Hence, it is suggested that the corporation should now aim at consistent improvement in its recovery performance.
Objectives of the Study In the light of the above theoretical framework, the study primarily aims at examining and
comparing the implications of NPAs on the profitability of three groups of SCBs in India viz., PSBs, PVSBs and FBs. This primary objective is supported by three supporting objectives as presented below.
(1) To evaluate and compare the financial performance of three groups of SCBs with the objective of identifying whether there is any improvement in their performance during the study period.
(2) To examine and compare the trend in asset quality of three groups of SCBs during the study period and to analyze the implications of changes in the trend in asset quality on their NPAs.
(3) To assess and compare the impact of NPAs on Provision and the implications of Provision on the profitability of three groups of SCBs.
Scope of the Study The study examines the financial implications of NPAs on the profitability of three groups of
SCBs. As the NPAs reflect the deteriorating asset quality, the paper also examines the composition of loans viz., standard assets and NPAs. Further, as the Provision is required to be created on the loans (including NPAs at higher rates) and as this Provision is a charge to the Statement of Profit and Loss, the study covers even the Provisions made against loans including NPAs.
For the purpose of examining and comparing the implications of NPAs on the profitability, the study covers three ownership groups of SCBs in the country viz., PSBs (21 PSBs with 90,281 branches); PVSBs (21 PVSBs with 28,805 branches) and branches of FBs (286 branches of 44 FBs) as on 31 March 2018.
Further, with the objective of making the study more comprehensive and to analyse and compare the trend in their performance over the years, performance statistics are collected and used for a period of 10 years from 2008-09 to 2017-18.
94 Amity Journal of FinanceADMAA
Volume 4 Issue 2 2019AJF
Methodology - Sources of Data, Tools for Data Analysis, etc For obvious reasons, the study is primarily based on secondary data/sources. And the major
source of data is the RBI (reports of RBI). However, necessary statistics/details are also collected from a few other secondary sources such as reports, websites, journals, reference books, business dailies, etc.
For the purpose of evaluating and comparing the performance of SCBs and for examining the implications of NPAs on the profitability of SCBs, a few accounting ratios and statistical tools are used. Ratios, graphical presentation, Trend Analysis, Regression Analysis and Compound Annual Growth Rate (CAGR) are the accounting and statistical tools/techniques used for the purpose of analysis of performance statistics and to achieve the objectives of the study.
The present study is an empirical study as it analyses and examines the performance of SCBs and attempts to quantify the financial implications of deteriorating asset quality on NPAs, Provision and Profitability.
Limitations of the Study Though the SCBs comprise seven categories of banks viz., PSBs, PVSBs, branches of FBs, RRBs,
cooperative banks, small finance banks and payments banks, the last four categories are outside the scope of the study. This is because of the reason that the geographical area of operation of each of these banks is confined to a state or to a part of a state.Even the volume of business is very small. Hence, the study focuses on the remaining three categories of SCBs viz., PSBs, PVSBs and branches of FBs.
Of course, these three groups of SCBs also differ in their size – PSBs still dominating the market with 66.53% of business followed by PVSBs with 29.33% share and branches of FBs with mere 3.94% share (in terms of loans as at 31 March 2018). Still, these three groups are considered to examine whether domestic SCBs can learn from the branches of FBs and whether the PSBs can learn from PVSBs, and vice-versa.
Besides, due to wide difference in the volume of business of these three groups of SCBs, more emphasis is laid, for analysis and comparison, on the relative shares (i.e., ratios – percentages, rates, etc.)of PSBs, PVSBs and branches of FBs.
Empirical Results In the light of the above research design, an attempt is made here to evaluate and compare
the performance of three groups of SCBs and to assess the extent to which NPAs are affecting their profitability. And the analysis made here is based on the performance statistics presented in Annexures – 1 to 5. Though it is possible to use a few more variables/parameters to evaluate and compare the performance of SCBs, it is limited to only the following variables/parameters.
(a) For performance evaluation and comparison, the focus is on the analysis of interest cost, non-interest cost, total cost, interest income, non-interest income, total income and profit, and
(b) For examining and comparing the implications of NPAs on profitability, the emphasis is on gross advances, standard loans, NPAs, provision and profitability wherein profitability is measured and examined based on two important ratios viz., Return on Assets (RoA) and Return on Equity (RoE).
95Amity Journal of Finance
Volume 4 Issue 2 2019 AJF
ADMAA
Cost Analysis In the case of banking companies, total cost comprises both interest cost and non-interest
cost. Of the two categories, interest expended accounts for more than 70% of their total costs. It includes interest on deposits, borrowings, RBI/inter-bank borrowings, and on other borrowings. On the other hand, non-interest costs (also called, operating expenses) include payment to (and provision for) employees; rent, rates and taxes; printing and stationery; advertisement and publicity; depreciation on bank’s property; directors’ fees, allowances; auditors’ fees and expenses, legal expenses; repairs and maintenance; insurance, etc.It may be noted here that the banking companies should make attempts to keep their costs under control by avoiding all unnecessary and wasteful expenses as all costs are influenced by the decisions and actions of the people who are internal to the banks.
For the purpose of evaluation and comparison of cost effectiveness of SCBs, initially, three-year moving averages are computed followed by CAGR and regression analysis (based on the data presented in Annexure - 1). A perusal of contents of Annexure - 1 shows a continuous increase in both the interest cost, non-interest cost and total cost. However, during two to three years, the SCBs have succeeded in lowering their costs – either interest cost or non-interest cost or both (2009-10, 2017-18, etc.).
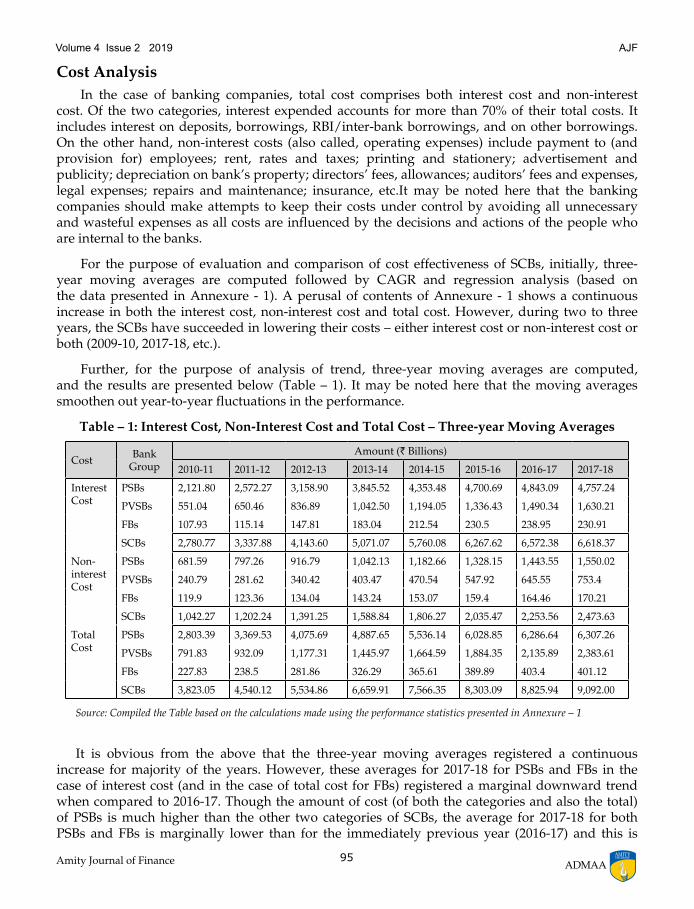
Further, for the purpose of analysis of trend, three-year moving averages are computed, and the results are presented below (Table – 1). It may be noted here that the moving averages smoothen out year-to-year fluctuations in the performance.
Table – 1: Interest Cost, Non-Interest Cost and Total Cost – Three-year Moving Averages
Cost Bank Group
Amount (` Billions)
2010-11 2011-12 2012-13 2013-14 2014-15 2015-16 2016-17 2017-18
Interest Cost
PSBs 2,121.80 2,572.27 3,158.90 3,845.52 4,353.48 4,700.69 4,843.09 4,757.24
PVSBs 551.04 650.46 836.89 1,042.50 1,194.05 1,336.43 1,490.34 1,630.21
FBs 107.93 115.14 147.81 183.04 212.54 230.5 238.95 230.91
SCBs 2,780.77 3,337.88 4,143.60 5,071.07 5,760.08 6,267.62 6,572.38 6,618.37
Non-interest Cost
PSBs 681.59 797.26 916.79 1,042.13 1,182.66 1,328.15 1,443.55 1,550.02
PVSBs 240.79 281.62 340.42 403.47 470.54 547.92 645.55 753.4
FBs 119.9 123.36 134.04 143.24 153.07 159.4 164.46 170.21
SCBs 1,042.27 1,202.24 1,391.25 1,588.84 1,806.27 2,035.47 2,253.56 2,473.63
Total Cost
PSBs 2,803.39 3,369.53 4,075.69 4,887.65 5,536.14 6,028.85 6,286.64 6,307.26
PVSBs 791.83 932.09 1,177.31 1,445.97 1,664.59 1,884.35 2,135.89 2,383.61
FBs 227.83 238.5 281.86 326.29 365.61 389.89 403.4 401.12
SCBs 3,823.05 4,540.12 5,534.86 6,659.91 7,566.35 8,303.09 8,825.94 9,092.00
Source: Compiled the Table based on the calculations made using the performance statistics presented in Annexure – 1
It is obvious from the above that the three-year moving averages registered a continuous increase for majority of the years. However, these averages for 2017-18 for PSBs and FBs in the case of interest cost (and in the case of total cost for FBs) registered a marginal downward trend when compared to 2016-17. Though the amount of cost (of both the categories and also the total) of PSBs is much higher than the other two categories of SCBs, the average for 2017-18 for both PSBs and FBs is marginally lower than for the immediately previous year (2016-17) and this is
96 Amity Journal of FinanceADMAA
Volume 4 Issue 2 2019AJF
appreciable in the light of inflationary situation in the economy and also in the light of increase in the volume of business. However, category-wise and total costs for overall SCBs have registered an uptrend continuously.
Using the data in Annexure – 1, CAGR is computed for interest cost, non-interest cost and total cost for each of three groups of SCBs and for all SCBs put together. SCBs (all three groups put together) have registered a 9.48% CAGR in the case of interest cost, 11.62% in the case of non-interest cost and 10.06% in the case of total cost. Other expenses (other than the interest cost) increased at a higher rate (11.62%) than the interest cost (9.48%) during this ten-year period. Among three groups of SCBs, branches of FBs are more economical as the CAGRs are only 5.27%, 3.89% and 4.61% respectively. And the next most economical group is the PSBs with CAGRs of 8.93%, 11.46% and 9.55% respectively. Even in this case, the rate of increase (CAGR) in non-interest cost (11.46%) is higher than that in interest cost (8.93%). And the PVSBs have experienced higher CAGRs with 11.83%, 14.79% and 12.72% respectively. Another note-worthy point is, in the case of FBs, the CAGR for non-interest cost is lower (3.89%) than that for interest cost (5.27%), whereas it is opposite in the case of both the categories of domestic banks (viz., PSBs and PVSBs) and also for all SCBs put together.
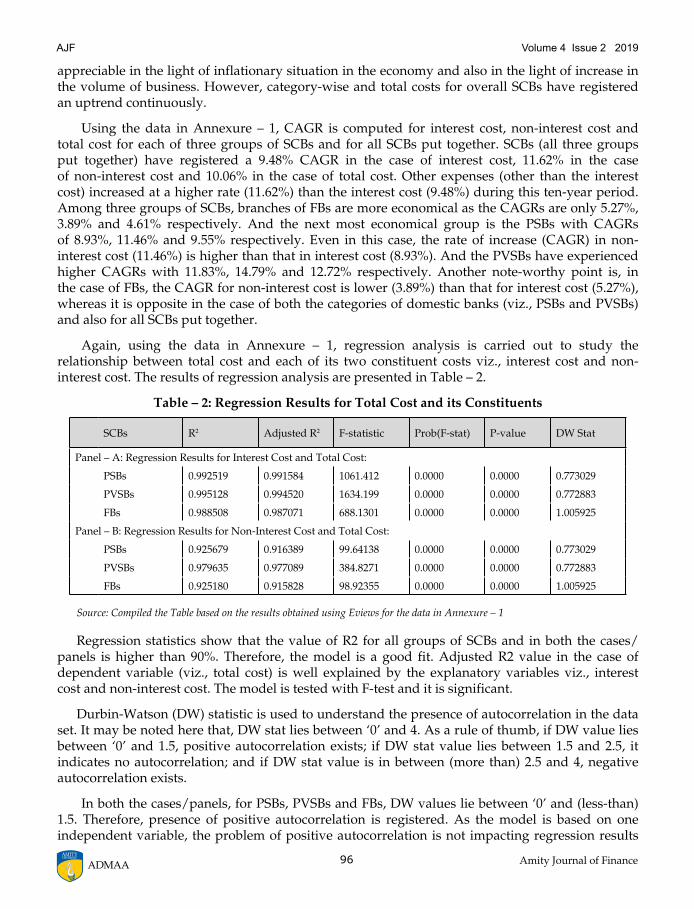
Again, using the data in Annexure – 1, regression analysis is carried out to study the relationship between total cost and each of its two constituent costs viz., interest cost and non-interest cost. The results of regression analysis are presented in Table – 2.
Table – 2: Regression Results for Total Cost and its Constituents
SCBs R2 Adjusted R2 F-statistic Prob(F-stat) P-value DW Stat
Panel – A: Regression Results for Interest Cost and Total Cost:
PSBs 0.992519 0.991584 1061.412 0.0000 0.0000 0.773029
PVSBs 0.995128 0.994520 1634.199 0.0000 0.0000 0.772883
FBs 0.988508 0.987071 688.1301 0.0000 0.0000 1.005925
Panel – B: Regression Results for Non-Interest Cost and Total Cost:
PSBs 0.925679 0.916389 99.64138 0.0000 0.0000 0.773029
PVSBs 0.979635 0.977089 384.8271 0.0000 0.0000 0.772883
FBs 0.925180 0.915828 98.92355 0.0000 0.0000 1.005925
Source: Compiled the Table based on the results obtained using Eviews for the data in Annexure – 1
Regression statistics show that the value of R2 for all groups of SCBs and in both the cases/panels is higher than 90%. Therefore, the model is a good fit. Adjusted R2 value in the case of dependent variable (viz., total cost) is well explained by the explanatory variables viz., interest cost and non-interest cost. The model is tested with F-test and it is significant.
Durbin-Watson (DW) statistic is used to understand the presence of autocorrelation in the data set. It may be noted here that, DW stat lies between ‘0’ and 4. As a rule of thumb, if DW value lies between ‘0’ and 1.5, positive autocorrelation exists; if DW stat value lies between 1.5 and 2.5, it indicates no autocorrelation; and if DW stat value is in between (more than) 2.5 and 4, negative autocorrelation exists.
In both the cases/panels, for PSBs, PVSBs and FBs, DW values lie between ‘0’ and (less-than) 1.5. Therefore, presence of positive autocorrelation is registered. As the model is based on one independent variable, the problem of positive autocorrelation is not impacting regression results
97Amity Journal of Finance
Volume 4 Issue 2 2019 AJF
ADMAA
that much, and it is normal in the case of time series data. As the P-values are significant at 5% level of significance, it is established that there is a close relationship between each of interest cost and non-interest cost on the one hand, and the total cost on the other.
Income Analysis Income of banking companies also comprises two broad categories of income viz., interest
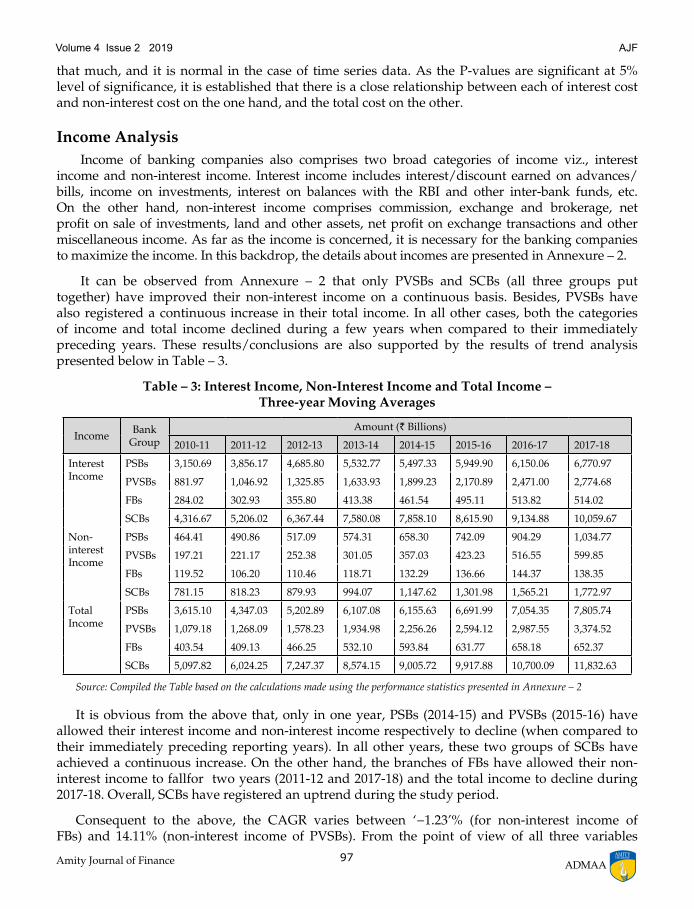
income and non-interest income. Interest income includes interest/discount earned on advances/bills, income on investments, interest on balances with the RBI and other inter-bank funds, etc. On the other hand, non-interest income comprises commission, exchange and brokerage, net profit on sale of investments, land and other assets, net profit on exchange transactions and other miscellaneous income. As far as the income is concerned, it is necessary for the banking companies to maximize the income. In this backdrop, the details about incomes are presented in Annexure – 2.
It can be observed from Annexure – 2 that only PVSBs and SCBs (all three groups put together) have improved their non-interest income on a continuous basis. Besides, PVSBs have also registered a continuous increase in their total income. In all other cases, both the categories of income and total income declined during a few years when compared to their immediately preceding years. These results/conclusions are also supported by the results of trend analysis presented below in Table – 3.
Table – 3: Interest Income, Non-Interest Income and Total Income – Three-year Moving Averages
Income Bank Group
Amount (` Billions)
2010-11 2011-12 2012-13 2013-14 2014-15 2015-16 2016-17 2017-18
Interest Income
PSBs 3,150.69 3,856.17 4,685.80 5,532.77 5,497.33 5,949.90 6,150.06 6,770.97
PVSBs 881.97 1,046.92 1,325.85 1,633.93 1,899.23 2,170.89 2,471.00 2,774.68
FBs 284.02 302.93 355.80 413.38 461.54 495.11 513.82 514.02
SCBs 4,316.67 5,206.02 6,367.44 7,580.08 7,858.10 8,615.90 9,134.88 10,059.67
Non-interest Income
PSBs 464.41 490.86 517.09 574.31 658.30 742.09 904.29 1,034.77
PVSBs 197.21 221.17 252.38 301.05 357.03 423.23 516.55 599.85
FBs 119.52 106.20 110.46 118.71 132.29 136.66 144.37 138.35
SCBs 781.15 818.23 879.93 994.07 1,147.62 1,301.98 1,565.21 1,772.97
Total Income
PSBs 3,615.10 4,347.03 5,202.89 6,107.08 6,155.63 6,691.99 7,054.35 7,805.74
PVSBs 1,079.18 1,268.09 1,578.23 1,934.98 2,256.26 2,594.12 2,987.55 3,374.52
FBs 403.54 409.13 466.25 532.10 593.84 631.77 658.18 652.37
SCBs 5,097.82 6,024.25 7,247.37 8,574.15 9,005.72 9,917.88 10,700.09 11,832.63
Source: Compiled the Table based on the calculations made using the performance statistics presented in Annexure – 2
It is obvious from the above that, only in one year, PSBs (2014-15) and PVSBs (2015-16) have allowed their interest income and non-interest income respectively to decline (when compared to their immediately preceding reporting years). In all other years, these two groups of SCBs have achieved a continuous increase. On the other hand, the branches of FBs have allowed their non-interest income to fallfor two years (2011-12 and 2017-18) and the total income to decline during 2017-18. Overall, SCBs have registered an uptrend during the study period.
Consequent to the above, the CAGR varies between ‘−1.23’% (for non-interest income of FBs) and 14.11% (non-interest income of PVSBs). From the point of view of all three variables
98 Amity Journal of FinanceADMAA
Volume 4 Issue 2 2019AJF
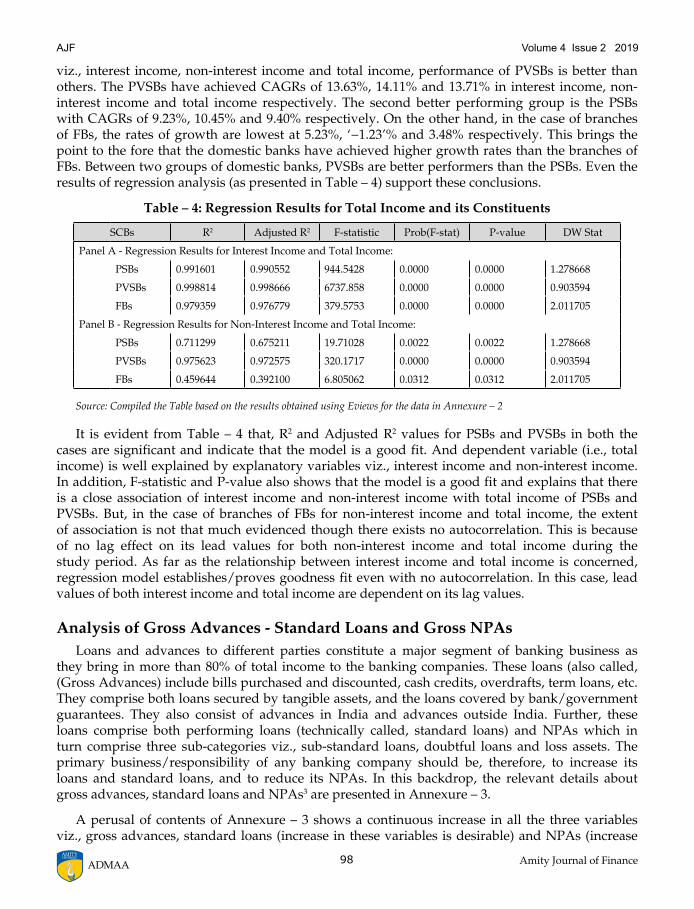
viz., interest income, non-interest income and total income, performance of PVSBs is better than others. The PVSBs have achieved CAGRs of 13.63%, 14.11% and 13.71% in interest income, non-interest income and total income respectively. The second better performing group is the PSBs with CAGRs of 9.23%, 10.45% and 9.40% respectively. On the other hand, in the case of branches of FBs, the rates of growth are lowest at 5.23%, ‘−1.23’% and 3.48% respectively. This brings the point to the fore that the domestic banks have achieved higher growth rates than the branches of FBs. Between two groups of domestic banks, PVSBs are better performers than the PSBs. Even the results of regression analysis (as presented in Table – 4) support these conclusions.
Table – 4: Regression Results for Total Income and its Constituents
SCBs R2 Adjusted R2 F-statistic Prob(F-stat) P-value DW Stat
Panel A - Regression Results for Interest Income and Total Income:
PSBs 0.991601 0.990552 944.5428 0.0000 0.0000 1.278668
PVSBs 0.998814 0.998666 6737.858 0.0000 0.0000 0.903594
FBs 0.979359 0.976779 379.5753 0.0000 0.0000 2.011705
Panel B - Regression Results for Non-Interest Income and Total Income:
PSBs 0.711299 0.675211 19.71028 0.0022 0.0022 1.278668
PVSBs 0.975623 0.972575 320.1717 0.0000 0.0000 0.903594
FBs 0.459644 0.392100 6.805062 0.0312 0.0312 2.011705
Source: Compiled the Table based on the results obtained using Eviews for the data in Annexure – 2
It is evident from Table – 4 that, R2 and Adjusted R2 values for PSBs and PVSBs in both the cases are significant and indicate that the model is a good fit. And dependent variable (i.e., total income) is well explained by explanatory variables viz., interest income and non-interest income. In addition, F-statistic and P-value also shows that the model is a good fit and explains that there is a close association of interest income and non-interest income with total income of PSBs and PVSBs. But, in the case of branches of FBs for non-interest income and total income, the extent of association is not that much evidenced though there exists no autocorrelation. This is because of no lag effect on its lead values for both non-interest income and total income during the study period. As far as the relationship between interest income and total income is concerned, regression model establishes/proves goodness fit even with no autocorrelation. In this case, lead values of both interest income and total income are dependent on its lag values.
Analysis of Gross Advances - Standard Loans and Gross NPAsLoans and advances to different parties constitute a major segment of banking business as
they bring in more than 80% of total income to the banking companies. These loans (also called, (Gross Advances) include bills purchased and discounted, cash credits, overdrafts, term loans, etc. They comprise both loans secured by tangible assets, and the loans covered by bank/government guarantees. They also consist of advances in India and advances outside India. Further, these loans comprise both performing loans (technically called, standard loans) and NPAs which in turn comprise three sub-categories viz., sub-standard loans, doubtful loans and loss assets. The primary business/responsibility of any banking company should be, therefore, to increase its loans and standard loans, and to reduce its NPAs. In this backdrop, the relevant details about gross advances, standard loans and NPAs3 are presented in Annexure – 3.
A perusal of contents of Annexure – 3 shows a continuous increase in all the three variables viz., gross advances, standard loans (increase in these variables is desirable) and NPAs (increase
99Amity Journal of Finance
Volume 4 Issue 2 2019 AJF
ADMAA
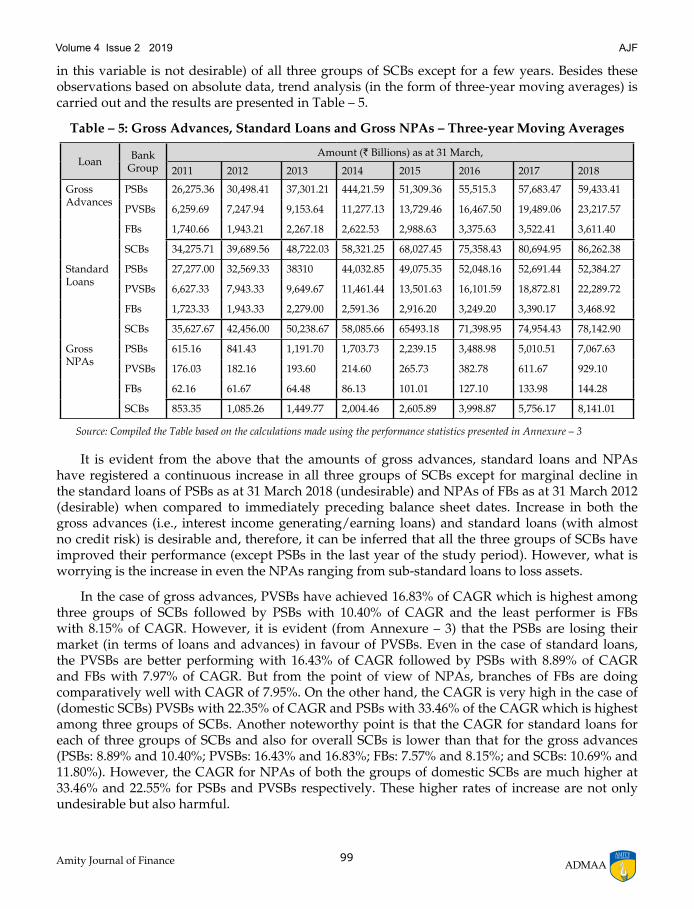
in this variable is not desirable) of all three groups of SCBs except for a few years. Besides these observations based on absolute data, trend analysis (in the form of three-year moving averages) is carried out and the results are presented in Table – 5.
Table – 5: Gross Advances, Standard Loans and Gross NPAs – Three-year Moving Averages
Loan Bank Group
Amount (` Billions) as at 31 March,
2011 2012 2013 2014 2015 2016 2017 2018
Gross Advances
PSBs 26,275.36 30,498.41 37,301.21 444,21.59 51,309.36 55,515.3 57,683.47 59,433.41
PVSBs 6,259.69 7,247.94 9,153.64 11,277.13 13,729.46 16,467.50 19,489.06 23,217.57
FBs 1,740.66 1,943.21 2,267.18 2,622.53 2,988.63 3,375.63 3,522.41 3,611.40
SCBs 34,275.71 39,689.56 48,722.03 58,321.25 68,027.45 75,358.43 80,694.95 86,262.38
Standard Loans
PSBs 27,277.00 32,569.33 38310 44,032.85 49,075.35 52,048.16 52,691.44 52,384.27
PVSBs 6,627.33 7,943.33 9,649.67 11,461.44 13,501.63 16,101.59 18,872.81 22,289.72
FBs 1,723.33 1,943.33 2,279.00 2,591.36 2,916.20 3,249.20 3,390.17 3,468.92
SCBs 35,627.67 42,456.00 50,238.67 58,085.66 65493.18 71,398.95 74,954.43 78,142.90
Gross NPAs
PSBs 615.16 841.43 1,191.70 1,703.73 2,239.15 3,488.98 5,010.51 7,067.63
PVSBs 176.03 182.16 193.60 214.60 265.73 382.78 611.67 929.10
FBs 62.16 61.67 64.48 86.13 101.01 127.10 133.98 144.28
SCBs 853.35 1,085.26 1,449.77 2,004.46 2,605.89 3,998.87 5,756.17 8,141.01
Source: Compiled the Table based on the calculations made using the performance statistics presented in Annexure – 3
It is evident from the above that the amounts of gross advances, standard loans and NPAs have registered a continuous increase in all three groups of SCBs except for marginal decline in the standard loans of PSBs as at 31 March 2018 (undesirable) and NPAs of FBs as at 31 March 2012 (desirable) when compared to immediately preceding balance sheet dates. Increase in both the gross advances (i.e., interest income generating/earning loans) and standard loans (with almost no credit risk) is desirable and, therefore, it can be inferred that all the three groups of SCBs have improved their performance (except PSBs in the last year of the study period). However, what is worrying is the increase in even the NPAs ranging from sub-standard loans to loss assets.
In the case of gross advances, PVSBs have achieved 16.83% of CAGR which is highest among three groups of SCBs followed by PSBs with 10.40% of CAGR and the least performer is FBs with 8.15% of CAGR. However, it is evident (from Annexure – 3) that the PSBs are losing their market (in terms of loans and advances) in favour of PVSBs. Even in the case of standard loans, the PVSBs are better performing with 16.43% of CAGR followed by PSBs with 8.89% of CAGR and FBs with 7.97% of CAGR. But from the point of view of NPAs, branches of FBs are doing comparatively well with CAGR of 7.95%. On the other hand, the CAGR is very high in the case of (domestic SCBs) PVSBs with 22.35% of CAGR and PSBs with 33.46% of the CAGR which is highest among three groups of SCBs. Another noteworthy point is that the CAGR for standard loans for each of three groups of SCBs and also for overall SCBs is lower than that for the gross advances (PSBs: 8.89% and 10.40%; PVSBs: 16.43% and 16.83%; FBs: 7.57% and 8.15%; and SCBs: 10.69% and 11.80%). However, the CAGR for NPAs of both the groups of domestic SCBs are much higher at 33.46% and 22.55% for PSBs and PVSBs respectively. These higher rates of increase are not only undesirable but also harmful.
100 Amity Journal of FinanceADMAA
Volume 4 Issue 2 2019AJF
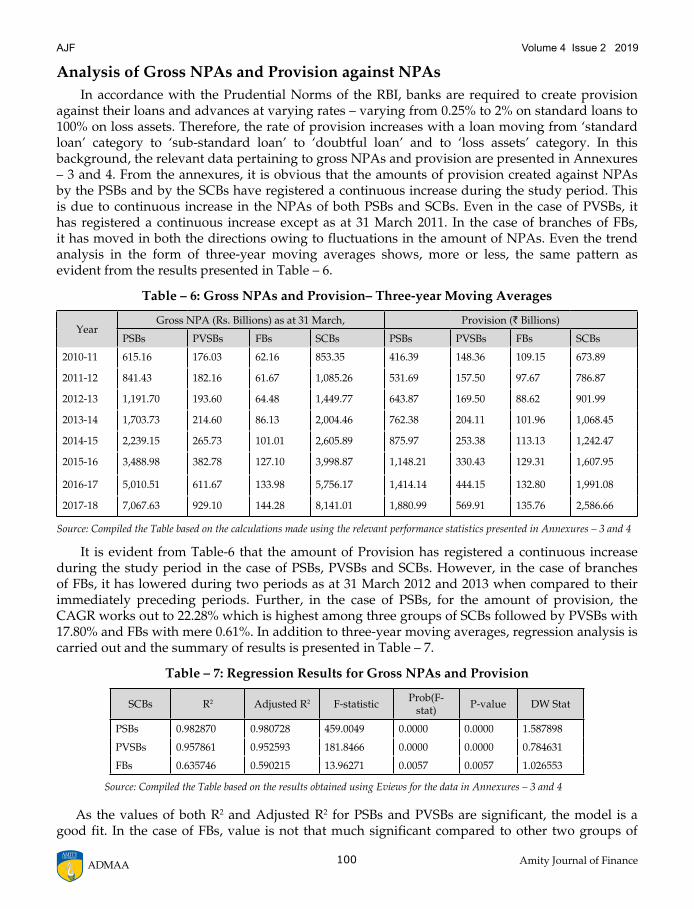
Analysis of Gross NPAs and Provision against NPAs In accordance with the Prudential Norms of the RBI, banks are required to create provision
against their loans and advances at varying rates – varying from 0.25% to 2% on standard loans to 100% on loss assets. Therefore, the rate of provision increases with a loan moving from ‘standard loan’ category to ‘sub-standard loan’ to ‘doubtful loan’ and to ‘loss assets’ category. In this background, the relevant data pertaining to gross NPAs and provision are presented in Annexures – 3 and 4. From the annexures, it is obvious that the amounts of provision created against NPAs by the PSBs and by the SCBs have registered a continuous increase during the study period. This is due to continuous increase in the NPAs of both PSBs and SCBs. Even in the case of PVSBs, it has registered a continuous increase except as at 31 March 2011. In the case of branches of FBs, it has moved in both the directions owing to fluctuations in the amount of NPAs. Even the trend analysis in the form of three-year moving averages shows, more or less, the same pattern as evident from the results presented in Table – 6.
Table – 6: Gross NPAs and Provision– Three-year Moving Averages
YearGross NPA (Rs. Billions) as at 31 March, Provision (` Billions)
PSBs PVSBs FBs SCBs PSBs PVSBs FBs SCBs
2010-11 615.16 176.03 62.16 853.35 416.39 148.36 109.15 673.89
2011-12 841.43 182.16 61.67 1,085.26 531.69 157.50 97.67 786.87
2012-13 1,191.70 193.60 64.48 1,449.77 643.87 169.50 88.62 901.99
2013-14 1,703.73 214.60 86.13 2,004.46 762.38 204.11 101.96 1,068.45
2014-15 2,239.15 265.73 101.01 2,605.89 875.97 253.38 113.13 1,242.47
2015-16 3,488.98 382.78 127.10 3,998.87 1,148.21 330.43 129.31 1,607.95
2016-17 5,010.51 611.67 133.98 5,756.17 1,414.14 444.15 132.80 1,991.08
2017-18 7,067.63 929.10 144.28 8,141.01 1,880.99 569.91 135.76 2,586.66
Source: Compiled the Table based on the calculations made using the relevant performance statistics presented in Annexures – 3 and 4
It is evident from Table-6 that the amount of Provision has registered a continuous increase during the study period in the case of PSBs, PVSBs and SCBs. However, in the case of branches of FBs, it has lowered during two periods as at 31 March 2012 and 2013 when compared to their immediately preceding periods. Further, in the case of PSBs, for the amount of provision, the CAGR works out to 22.28% which is highest among three groups of SCBs followed by PVSBs with 17.80% and FBs with mere 0.61%. In addition to three-year moving averages, regression analysis is carried out and the summary of results is presented in Table – 7.
Table – 7: Regression Results for Gross NPAs and Provision
SCBs R2 Adjusted R2 F-statistic Prob(F-stat) P-value DW Stat
PSBs 0.982870 0.980728 459.0049 0.0000 0.0000 1.587898
PVSBs 0.957861 0.952593 181.8466 0.0000 0.0000 0.784631
FBs 0.635746 0.590215 13.96271 0.0057 0.0057 1.026553
Source: Compiled the Table based on the results obtained using Eviews for the data in Annexures – 3 and 4
As the values of both R2 and Adjusted R2 for PSBs and PVSBs are significant, the model is a good fit. In the case of FBs, value is not that much significant compared to other two groups of
101Amity Journal of Finance
Volume 4 Issue 2 2019 AJF
ADMAA
SCBs. Still, the model can be fit to explain the relationship between variables. F-statistic for both PSBs and PVSBs indicate the existence of significant relationship between Gross NPAs and Provision amount with significant P-values. From DW statistic, it can be inferred that positive autocorrelation exists in the regression model indicating that error terms are also significant enough to explain the relationship between variables and the presence of lag-lead relationship with the data set.
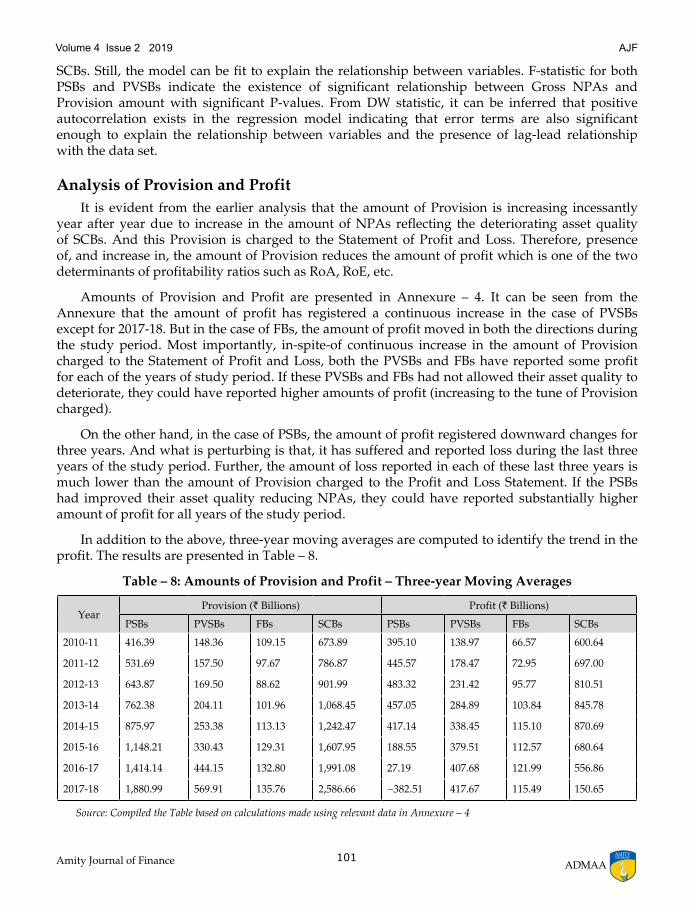
Analysis of Provision and Profit It is evident from the earlier analysis that the amount of Provision is increasing incessantly
year after year due to increase in the amount of NPAs reflecting the deteriorating asset quality of SCBs. And this Provision is charged to the Statement of Profit and Loss. Therefore, presence of, and increase in, the amount of Provision reduces the amount of profit which is one of the two determinants of profitability ratios such as RoA, RoE, etc.
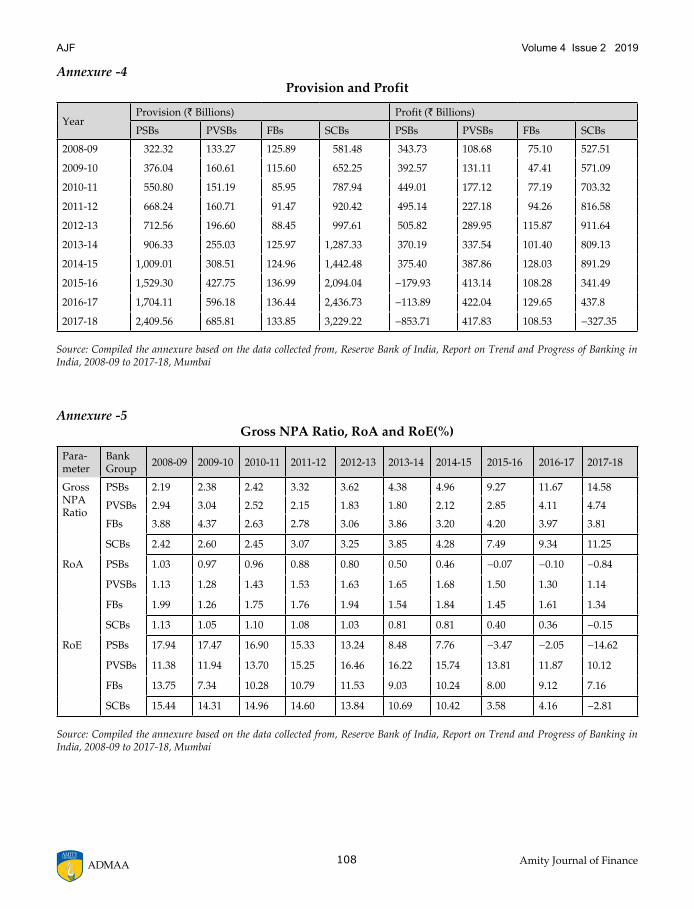
Amounts of Provision and Profit are presented in Annexure – 4. It can be seen from the Annexure that the amount of profit has registered a continuous increase in the case of PVSBs except for 2017-18. But in the case of FBs, the amount of profit moved in both the directions during the study period. Most importantly, in-spite-of continuous increase in the amount of Provision charged to the Statement of Profit and Loss, both the PVSBs and FBs have reported some profit for each of the years of study period. If these PVSBs and FBs had not allowed their asset quality to deteriorate, they could have reported higher amounts of profit (increasing to the tune of Provision charged).
On the other hand, in the case of PSBs, the amount of profit registered downward changes for three years. And what is perturbing is that, it has suffered and reported loss during the last three years of the study period. Further, the amount of loss reported in each of these last three years is much lower than the amount of Provision charged to the Profit and Loss Statement. If the PSBs had improved their asset quality reducing NPAs, they could have reported substantially higher amount of profit for all years of the study period.
In addition to the above, three-year moving averages are computed to identify the trend in the profit. The results are presented in Table – 8.
Table – 8: Amounts of Provision and Profit – Three-year Moving Averages
YearProvision (` Billions) Profit (` Billions)
PSBs PVSBs FBs SCBs PSBs PVSBs FBs SCBs
2010-11 416.39 148.36 109.15 673.89 395.10 138.97 66.57 600.64
2011-12 531.69 157.50 97.67 786.87 445.57 178.47 72.95 697.00
2012-13 643.87 169.50 88.62 901.99 483.32 231.42 95.77 810.51
2013-14 762.38 204.11 101.96 1,068.45 457.05 284.89 103.84 845.78
2014-15 875.97 253.38 113.13 1,242.47 417.14 338.45 115.10 870.69
2015-16 1,148.21 330.43 129.31 1,607.95 188.55 379.51 112.57 680.64
2016-17 1,414.14 444.15 132.80 1,991.08 27.19 407.68 121.99 556.86
2017-18 1,880.99 569.91 135.76 2,586.66 −382.51 417.67 115.49 150.65
Source: Compiled the Table based on calculations made using relevant data in Annexure – 4
102 Amity Journal of FinanceADMAA
Volume 4 Issue 2 2019AJF
It is evident from Table -8 that there is an upward trend in the amount of Provision created by all three groups of SCBs. However, there is a difference in the profit. Only PVSBs have earned profit for all years. And in the case of FBs, three-year moving averages are lower for two years when compared to their immediately preceding years. But in the case of PSBs, for majority of the years (five years), three-year moving average profits have registered downward trend. The primary reason is the increase in the amount of Provision against NPAs.
The CAGR for the profits of PSBs works out to only 1.27%4and this is lowest among three groups of SCBs. PVSBs have registered a 14.42% of CAGR which is highest among three groups of SCBs followed by FBs with 3.75% of CAGR. And the CAGR for all SCBs5is negative at ‘−2.05’% owing to negative profit reported by the PSBs. Besides the trend analysis and CAGR, regression analysis is carried out and the summary of results is presented in Table – 9.
Table – 9: Regression Results for Amounts of Provision and Profit
SCBs R2 Adjusted R2 F-statistic Prob(F-stat) P-value DW Stat
PSBs 0.863645 0.846600 50.67021 0.0001 0.0001 1.019297
PVSBs 0.680525 0.640591 17.04108 0.0033 0.0033 0.397746
FBs 0.084372 −0.030081 0.737176 0.4155 0.4155 1.088219
Source: Compiled the Table based on the results obtained using Eviews for the data in Annexure – 4
It is evident from R2 and Adjusted R2 values that the regression model is a good fit explaining the relationship between provisioning and profit of PSBs and PVSBs. In these two groups of SCBs (viz., PSBs and PVSBs), it is established that there exists a strong relationship between provisioning and profit indicating that the increase in provisioning decreases profit. On the other hand, in the case of FBs, the model failed to explain the relationship. In addition, the presence of serial correlation (autocorrelation) in the regression model evidences that error terms or residuals are more competent to capture the relationship with the dependant variable compared to independent variable selected in the model. In other words, profit is influenced not only by the changes in amount of Provision but also by other factors which are not considered in the regression model and these other factors have strong and positive impact on the profit of FBs.
Analysis of Gross NPA Ratio, RoA and RoE As already stated, NPAs have direct but adverse impact on the profits of banks. This is
because of the reason that the amount of Provision (a charge to the Statement of Profit and Loss) depends upon the amount of NPAs. Therefore, an attempt is made here to examine the relationship between the Gross NPA Ratio on the one hand, and each of RoA and RoE on the other. The relevant data pertaining to the Gross NPA Ratio, RoA and RoE are presented in Annexure – 5.
It is obvious from the contents of Annexure – 5 that the Gross NPA Ratio of PSBs has registered a continuous increase during the study period. It increased from 2.19% to 14.58% during the study period which should be a matter of great concern. Even in the case of PVSBs, the Gross NPA Ratio has increased over the study period from 2.94% to 4.74%. However, during this period, PVSBs have lowered the Gross NPA Ratio for four years (as at 31 March 2011, 2012, 2013 and 2014) when compared to their immediately preceding balance sheet dates. On the other hand, FBs have lowered their Gross NPA Ratio marginally from 3.88% to 3.81%. Further, both the Gross NPA Ratio of FBs and the rate of change are lowest among three groups of SCBs. Another interesting aspect is, PSBs had the lowest Gross NPA Ratio at the end of the first year of the study
103Amity Journal of Finance
Volume 4 Issue 2 2019 AJF
ADMAA
period (2.19%) and the FBs had the highest Gross NPA Ratio of 3.88%. By the end of the study period, the position changed – PSBs with highest Gross NPA Ratio (14.58%) and FBs with lowest Gross NPA Ratio (3.81%).
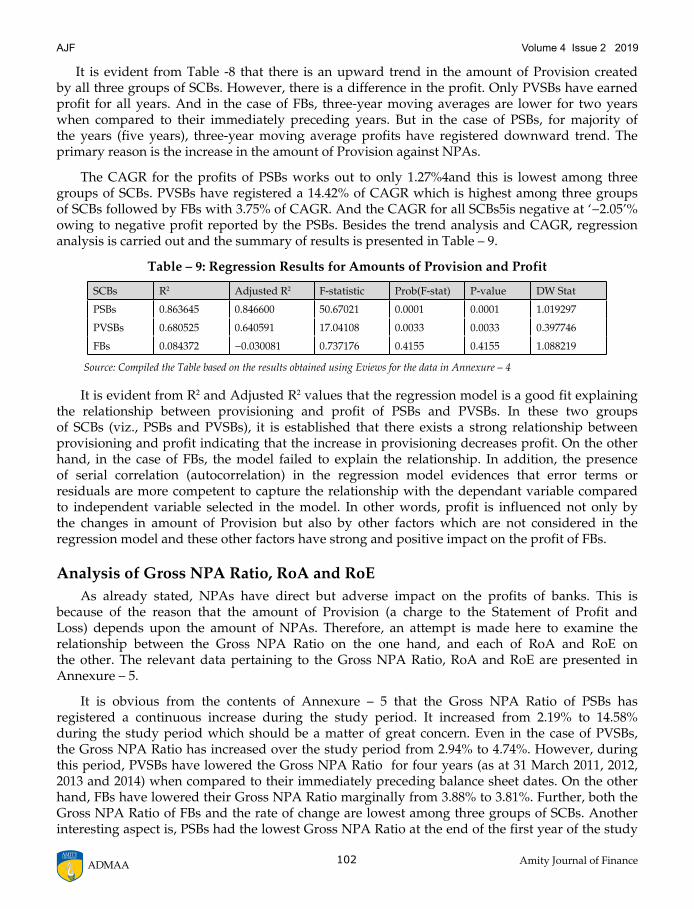
With the increase in the Gross NPA Ratio of PSBs, the RoA and RoE Ratios of PSBs have declined continuously from 1.03% to −0.84% and from 17.94% to −14.62% respectively during the study period showing adverse implications of NPAs and NPA Ratio on the profitability of PSBs. Similarly, with the increase in the Gross NPA Ratio of PVSBs from 2.94% to 4.74%, the RoE has declined from 11.38% to 10.12%. But the RoA Ratio improved marginally from 1.13% to 1.14%. Even in the case of FBs, these ratios declined from 1.99% to 1.34% (RoA) and from 13.75% to 7.16% (RoE) during the study period. These relationships become clear from the following line graphs (Figures – 1 to 3).
Note: Values 1, 2, 3, … 10 of X-axis represent balance sheet dates 31 March 2009, 2010, 2011, 2012, 2013, 2014, 2015, 2016, 2017 and 2018.
Figure – 1: GNPA Ratio, RoA and RoE of PSBs Figure – 2: GNPA Ratio, RoA and RoE of PVSBs Figure – 3: GNPA Ratio, RoA and RoE of FBs
In order to examine the impact of Gross NPA Ratio on RoA and on RoE, regression analysis is carried out, and the results of the same are presented in Table – 10.
Table – 10: Regression Results for Gross NPA Ratio, and RoA and RoE
SCBs R2 Adjusted R2 F-statistic Prob(F-stat) P-value DW Stat
Part – A: Regression Results for Gross NPA and RoA:
PSBs 0.963367 0.958787 210.3795 0.0000 0.0000 2.029638
PVSBs 0.660692 0.618278 15.57737 0.0004 0.0004 0.375540
FBs 0.390095 0.313857 5.116793 0.0536 0.0536 1.797507
Part – B: Regression Results for Gross NPA Ratio and RoE:
PSBs 0.956694 0.951280 176.7309 0.0000 0.0000 1.910850
PVSBs 0.817017 0.794144 35.71984 0.0003 0.0003 0.321030
FBs 0.224111 0.127125 2.310755 0.1669 0.1670 1.244341
Source: Compiled the Table based on results obtained using Eviews for the data in Annexure – 5
It is obvious from Table 10 that, for both the PSBs and PVSBs, R2 and Adjusted R2 values and F-statistic are significant and, therefore, it shows that change in Gross NPA Ratio has a strong
104 Amity Journal of FinanceADMAA
Volume 4 Issue 2 2019AJF
impact on Return on Assets. But, in the case of FBs, the regression model is not a good fit and, therefore, there is no significant impact of Gross NPA Ratio on RoA of FBs. As far as DW statistic is concerned, for PSBs, RoA is in declining trend and even negative for a few years owing to increase in Gross NPA Ratio and it is evidenced that Gross NPA Ratio itself explains the changes in RoA to the extent of 96⅓%. In the case of PVSBs and FBs, along with Gross NPA Ratio, other factors have impact on RoA but not independently Gross NPA ratio itself.
Similarly, for PSBs and PVSBs, both R2 and Adjusted R2 values are significant indicating that Gross NPA Ratio has a strong impact on RoE. F- Statistic and P-values are also significant indicating that RoE is influenced by Gross NPA Ratio. As far as DW statistic is concerned, there is no autocorrelation for PSBs meaning Gross NPA Ratio is itself strong enough to explain RoE to the extent of 95.66%, and for PVSBs and FBs, it shows positive autocorrelation meaning other factors impacting the RoE much compared to the variable considered in the model. In the case of FBs, the results of R2 and Adjusted R2 values are not significant and therefore, there is no significant impact of Gross NPA Ratio on RoE.
Conclusion From the above analysis, it is evident that both the categories of costs and incomes have
registered increase during the study period for all groups of SCBs with a few exceptions for one or two years/groups of SCBs. In terms of costs, CAGRs are lowest in the case of FBs followed by PSBs and PVSBs. From the point of view of income, the CAGRs are highest in the case of PVSBs followed by PSBs and FBs. Even from the point of view of gross advances and standard loans, PVSBs have registered highest CAGRs of 16.83% and 16.43% respectively and lowest by FBs with 8.15% and 2.97% of CAGRs respectively. However, in the case of CAGR of NPAs, FBs are more efficient with 7.95% followed by PVSBs and PSBs with 22.55% and 33.46% of CAGRs respectively. This is true even from the point of view of amount of Provision. Consequently, PVSBs have recorded 14.42% of CAGR in the amount of profit followed by FBs and PSBs with 3.75% and 1.27% of CAGR respectively.
Trend analysis for Gross NPAs, Provision and Profitability shows an upward trend in Gross NPAs and Provisioning but variations in the case of Profitability among three groups of SCBs. This is due to variations in Gross NPAs and Provisioning during the study period.
In order to capture the impact of NPAs on the profitability of SCBs, regression analysis is employed. The results of regression analysis show that, interest income and non-interest income have a close association with total income. For Gross NPAs and Provisioning, it is found that there is a close relationship between both the variables and increase in Gross NPAs results in parallel increase in provisioning for all the three groups of SCBs. There is a strong (negative/inverse) relationship between Provision and Profitability in the case of both PSBs and PVSBs. But in the case of FBs, impact of provision on profitability was not explained. Further, for PSBs and PVSBs, increase in Gross NPA Ratio resulted in decrease in RoA and RoE during the study period. But, for FBs, it is different. From Autocorrelation perspective, for most of all regression model results, presence of positive autocorrelation (serial correlation) in the data set is evidenced. This is one of the common issues in time series data i.e., future values (lead) are dependent on its past values (lag) (called, error term or residual). It is observed that though there is a presence of positive serial correlation, regression model seems to be good fit - this is because of one dependent variable is explained by one or two explanatory variable/s and the extent of influence by error terms is only minimum. Overall, it is established that, NPAs have a strong but negative impact on the profitability of PSBs and PVSBs.
105Amity Journal of Finance
Volume 4 Issue 2 2019 AJF
ADMAA
Hence, there is a need for domestic SCBs, more particularly PSBs, to improve their asset quality which in turn reduces NPAs and provision resulting in higher profitability. For this purpose, it is necessary to take up the credit appraisal work seriously together with obtaining adequate collaterals for the loan sanctioned. Further, it is necessary to ensure that the amount of loan sanctioned and disbursed is utilised by the borrowers for the purpose for which it was provided. It is also necessary to monitor the progress in the funded projects periodically to ensure that the work is progressing satisfactorily and in accordance with the proposal.
Notes(1) Section 42(6)(a) of the Reserve Bank Act, 1934 specifies the conditions which a banking
company should satisfy to be eligible for inclusion under 2nd Schedule of the Reserve Bank of India Act, 1934.
(2) Collected these statistics from different sources including a few research papers published by this Researcher.
(3) Details and analysis of sub-categories of NPAs viz., Sub-Standard Loans, Doubtful Loans and Loss Assets are not given/made here due to the size of the paper.
(4) As the profit of PSBs is negative in the last year (and for two more years) of the study period, the CAGR is ascertained considering only the first seven years of the study period.
(5) As the profit of SCBs is negative in the last year of the study period, the CAGR is ascertained considering only the first nine years of the study period.
ReferencesAnnapurna V& Manchala G. (2017). Balanced scorecard evaluation of the performance of Indian public sector
banks. Indian Journal of Finance, 11(9), 7-21.
Banerjee A. (2018). An empirical study to compute the efficiency of Indian banks during the pre and post periods of recession with the help of data envelopment analysis. Indian Journal of Finance, 12(4), 37-53.
Gowda, I & Manjunatha K.R. (2017). RBI’s revised PCA framework for ailing banks. AMBER – ABBS Management Business and Entrepreneurship Review, 8(1), 41-52.
Gowda, I. (2018). Performance evaluation of SFCs: case study of KSFC. SCMS Journal of Indian Management, XV(4), 85-95.
Gowda, I. (2019). Recovery management – a case study of KSFC. The Indian Journal of Commerce, 72(2), 102-121.
Bawa, Goyal & Basu. (2019). An analysis of NPAs of Indian banks using a comprehensive framework of 31 financial ratios. IIMB Management Review, 31(1), 51-62.
Lee & Rhee. (2007). Crisis and recovery: what we have learned from the South Korean experience? Asian Economic Policy Review, 2(1),146-164.
Kashyap, M (2014). Asset quality of Indian banks: an empirical analysis. Journal of Institute of Public Enterprise, 37(1/2), 5.
Mahapatra & Mohanty (2012). Performance of foreign banks in India: an assessment. Aweshkar Research Journal, 14(2), 52-61.
Parimalarani, G. (2011). Performance of commercial banks in priority sector lending. Asia Pacific Journal of Research in Business Management, 2(7),221-230.
Pillai, (2018). Temporal and institutional essence of non-performing assets in banks: an Indian scenario. Indian Journal of Finance, 12(3), 58-68.
106 Amity Journal of FinanceADMAA
Volume 4 Issue 2 2019AJF
Rao, Pingui, Yue, Heng & Zhu, Jigao. (2015). An investigation of credit borrower concentration. Journal of Banking & Finance,54, 208-221.
Satpathy, Behera, Ranjan & Digal (2015). Macroeconomic factors affecting the NPAs in the Indian banking system: an empirical assessment. IUP Journal of Bank Management, 14(1), 57-74.
Jain,V,. (2007). Non-Performing Assets in Commercial Banks. New Delhi, India: Regal Publications.
Vithessonthi (2016). Deflation, bank credit growth, and non-performing loans: evidence from Japan. International Review of Financial Analysis, 45, 295-305.
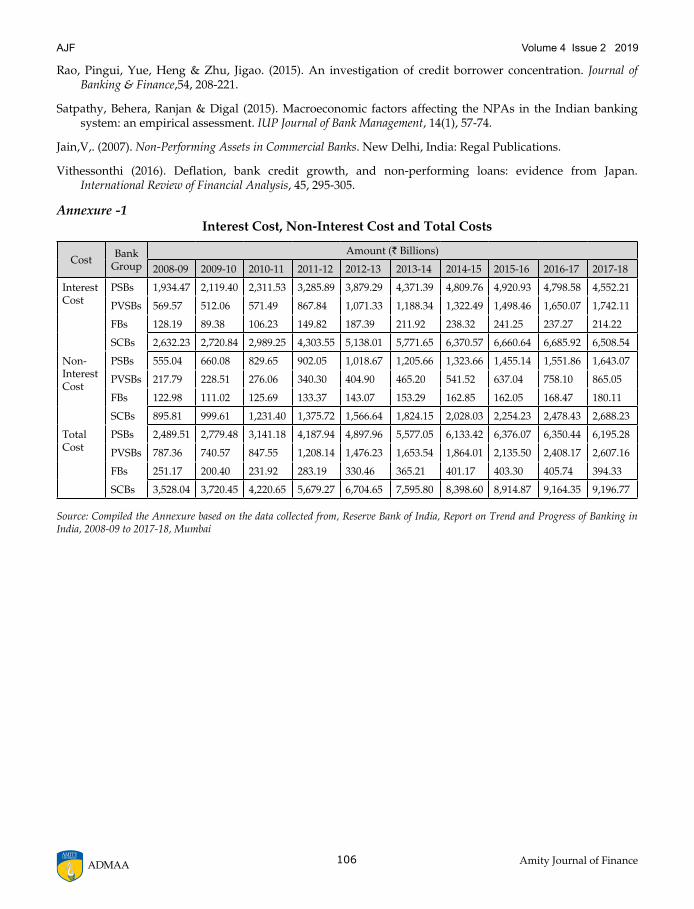
Annexure -1Interest Cost, Non-Interest Cost and Total Costs
Cost Bank Group
Amount (` Billions)
2008-09 2009-10 2010-11 2011-12 2012-13 2013-14 2014-15 2015-16 2016-17 2017-18
Interest Cost
PSBs 1,934.47 2,119.40 2,311.53 3,285.89 3,879.29 4,371.39 4,809.76 4,920.93 4,798.58 4,552.21
PVSBs 569.57 512.06 571.49 867.84 1,071.33 1,188.34 1,322.49 1,498.46 1,650.07 1,742.11
FBs 128.19 89.38 106.23 149.82 187.39 211.92 238.32 241.25 237.27 214.22
SCBs 2,632.23 2,720.84 2,989.25 4,303.55 5,138.01 5,771.65 6,370.57 6,660.64 6,685.92 6,508.54
Non-Interest Cost
PSBs 555.04 660.08 829.65 902.05 1,018.67 1,205.66 1,323.66 1,455.14 1,551.86 1,643.07
PVSBs 217.79 228.51 276.06 340.30 404.90 465.20 541.52 637.04 758.10 865.05
FBs 122.98 111.02 125.69 133.37 143.07 153.29 162.85 162.05 168.47 180.11
SCBs 895.81 999.61 1,231.40 1,375.72 1,566.64 1,824.15 2,028.03 2,254.23 2,478.43 2,688.23
Total Cost
PSBs 2,489.51 2,779.48 3,141.18 4,187.94 4,897.96 5,577.05 6,133.42 6,376.07 6,350.44 6,195.28
PVSBs 787.36 740.57 847.55 1,208.14 1,476.23 1,653.54 1,864.01 2,135.50 2,408.17 2,607.16
FBs 251.17 200.40 231.92 283.19 330.46 365.21 401.17 403.30 405.74 394.33
SCBs 3,528.04 3,720.45 4,220.65 5,679.27 6,704.65 7,595.80 8,398.60 8,914.87 9,164.35 9,196.77
Source: Compiled the Annexure based on the data collected from, Reserve Bank of India, Report on Trend and Progress of Banking in India, 2008-09 to 2017-18, Mumbai
107Amity Journal of Finance
Volume 4 Issue 2 2019 AJF
ADMAA
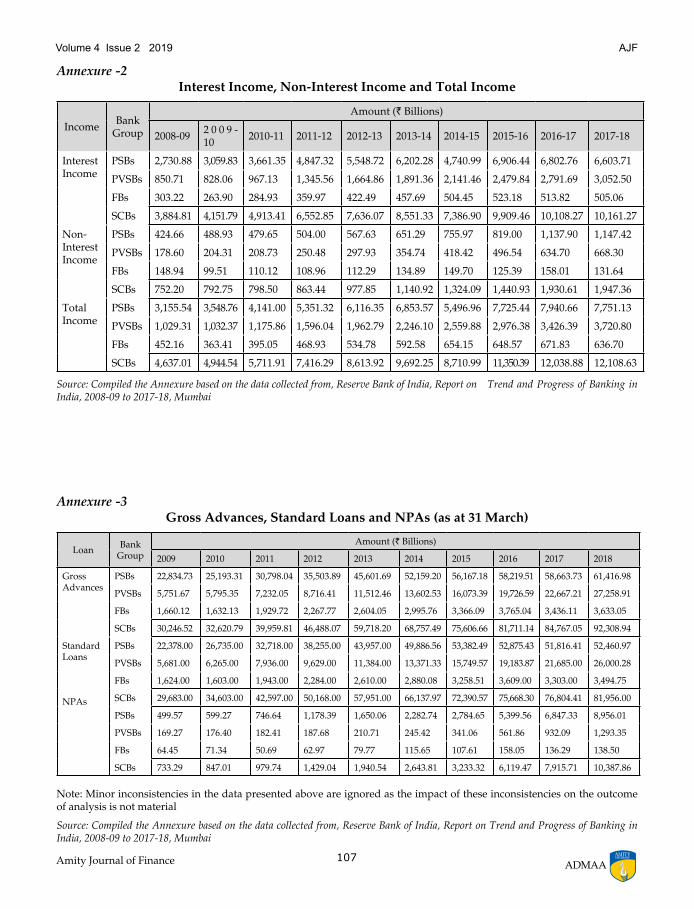
Annexure -2Interest Income, Non-Interest Income and Total Income
Income Bank Group
Amount (` Billions)
2008-09 2 0 0 9 -10 2010-11 2011-12 2012-13 2013-14 2014-15 2015-16 2016-17 2017-18
Interest Income
PSBs 2,730.88 3,059.83 3,661.35 4,847.32 5,548.72 6,202.28 4,740.99 6,906.44 6,802.76 6,603.71
PVSBs 850.71 828.06 967.13 1,345.56 1,664.86 1,891.36 2,141.46 2,479.84 2,791.69 3,052.50
FBs 303.22 263.90 284.93 359.97 422.49 457.69 504.45 523.18 513.82 505.06
SCBs 3,884.81 4,151.79 4,913.41 6,552.85 7,636.07 8,551.33 7,386.90 9,909.46 10,108.27 10,161.27
Non-Interest Income
PSBs 424.66 488.93 479.65 504.00 567.63 651.29 755.97 819.00 1,137.90 1,147.42
PVSBs 178.60 204.31 208.73 250.48 297.93 354.74 418.42 496.54 634.70 668.30
FBs 148.94 99.51 110.12 108.96 112.29 134.89 149.70 125.39 158.01 131.64
SCBs 752.20 792.75 798.50 863.44 977.85 1,140.92 1,324.09 1,440.93 1,930.61 1,947.36
Total Income
PSBs 3,155.54 3,548.76 4,141.00 5,351.32 6,116.35 6,853.57 5,496.96 7,725.44 7,940.66 7,751.13
PVSBs 1,029.31 1,032.37 1,175.86 1,596.04 1,962.79 2,246.10 2,559.88 2,976.38 3,426.39 3,720.80
FBs 452.16 363.41 395.05 468.93 534.78 592.58 654.15 648.57 671.83 636.70
SCBs 4,637.01 4,944.54 5,711.91 7,416.29 8,613.92 9,692.25 8,710.99 11,350.39 12,038.88 12,108.63
Source: Compiled the Annexure based on the data collected from, Reserve Bank of India, Report on Trend and Progress of Banking in India, 2008-09 to 2017-18, Mumbai
Annexure -3Gross Advances, Standard Loans and NPAs (as at 31 March)
Loan Bank Group
Amount (` Billions)
2009 2010 2011 2012 2013 2014 2015 2016 2017 2018
Gross Advances
PSBs 22,834.73 25,193.31 30,798.04 35,503.89 45,601.69 52,159.20 56,167.18 58,219.51 58,663.73 61,416.98
PVSBs 5,751.67 5,795.35 7,232.05 8,716.41 11,512.46 13,602.53 16,073.39 19,726.59 22,667.21 27,258.91
FBs 1,660.12 1,632.13 1,929.72 2,267.77 2,604.05 2,995.76 3,366.09 3,765.04 3,436.11 3,633.05
SCBs 30,246.52 32,620.79 39,959.81 46,488.07 59,718.20 68,757.49 75,606.66 81,711.14 84,767.05 92,308.94
Standard Loans
NPAs
PSBs 22,378.00 26,735.00 32,718.00 38,255.00 43,957.00 49,886.56 53,382.49 52,875.43 51,816.41 52,460.97
PVSBs 5,681.00 6,265.00 7,936.00 9,629.00 11,384.00 13,371.33 15,749.57 19,183.87 21,685.00 26,000.28
FBs 1,624.00 1,603.00 1,943.00 2,284.00 2,610.00 2,880.08 3,258.51 3,609.00 3,303.00 3,494.75
SCBs 29,683.00 34,603.00 42,597.00 50,168.00 57,951.00 66,137.97 72,390.57 75,668.30 76,804.41 81,956.00
PSBs 499.57 599.27 746.64 1,178.39 1,650.06 2,282.74 2,784.65 5,399.56 6,847.33 8,956.01
PVSBs 169.27 176.40 182.41 187.68 210.71 245.42 341.06 561.86 932.09 1,293.35
FBs 64.45 71.34 50.69 62.97 79.77 115.65 107.61 158.05 136.29 138.50
SCBs 733.29 847.01 979.74 1,429.04 1,940.54 2,643.81 3,233.32 6,119.47 7,915.71 10,387.86
Note: Minor inconsistencies in the data presented above are ignored as the impact of these inconsistencies on the outcome of analysis is not material
Source: Compiled the Annexure based on the data collected from, Reserve Bank of India, Report on Trend and Progress of Banking in India, 2008-09 to 2017-18, Mumbai
108 Amity Journal of FinanceADMAA
Volume 4 Issue 2 2019AJF
Annexure -4Provision and Profit
YearProvision (` Billions) Profit (` Billions)
PSBs PVSBs FBs SCBs PSBs PVSBs FBs SCBs
2008-09 322.32 133.27 125.89 581.48 343.73 108.68 75.10 527.51
2009-10 376.04 160.61 115.60 652.25 392.57 131.11 47.41 571.09
2010-11 550.80 151.19 85.95 787.94 449.01 177.12 77.19 703.32
2011-12 668.24 160.71 91.47 920.42 495.14 227.18 94.26 816.58
2012-13 712.56 196.60 88.45 997.61 505.82 289.95 115.87 911.64
2013-14 906.33 255.03 125.97 1,287.33 370.19 337.54 101.40 809.13
2014-15 1,009.01 308.51 124.96 1,442.48 375.40 387.86 128.03 891.29
2015-16 1,529.30 427.75 136.99 2,094.04 −179.93 413.14 108.28 341.49
2016-17 1,704.11 596.18 136.44 2,436.73 −113.89 422.04 129.65 437.8
2017-18 2,409.56 685.81 133.85 3,229.22 −853.71 417.83 108.53 −327.35
Source: Compiled the annexure based on the data collected from, Reserve Bank of India, Report on Trend and Progress of Banking in India, 2008-09 to 2017-18, Mumbai
Annexure -5Gross NPA Ratio, RoA and RoE(%)
Para- meter
Bank Group 2008-09 2009-10 2010-11 2011-12 2012-13 2013-14 2014-15 2015-16 2016-17 2017-18
Gross NPA Ratio
PSBs 2.19 2.38 2.42 3.32 3.62 4.38 4.96 9.27 11.67 14.58
PVSBs 2.94 3.04 2.52 2.15 1.83 1.80 2.12 2.85 4.11 4.74
FBs 3.88 4.37 2.63 2.78 3.06 3.86 3.20 4.20 3.97 3.81
SCBs 2.42 2.60 2.45 3.07 3.25 3.85 4.28 7.49 9.34 11.25
RoA PSBs 1.03 0.97 0.96 0.88 0.80 0.50 0.46 −0.07 −0.10 −0.84
PVSBs 1.13 1.28 1.43 1.53 1.63 1.65 1.68 1.50 1.30 1.14
FBs 1.99 1.26 1.75 1.76 1.94 1.54 1.84 1.45 1.61 1.34
SCBs 1.13 1.05 1.10 1.08 1.03 0.81 0.81 0.40 0.36 −0.15
RoE PSBs 17.94 17.47 16.90 15.33 13.24 8.48 7.76 −3.47 −2.05 −14.62
PVSBs 11.38 11.94 13.70 15.25 16.46 16.22 15.74 13.81 11.87 10.12
FBs 13.75 7.34 10.28 10.79 11.53 9.03 10.24 8.00 9.12 7.16
SCBs 15.44 14.31 14.96 14.60 13.84 10.69 10.42 3.58 4.16 −2.81
Source: Compiled the annexure based on the data collected from, Reserve Bank of India, Report on Trend and Progress of Banking in India, 2008-09 to 2017-18, Mumbai
109Amity Journal of Finance
Volume 4 Issue 2 2019 AJF
ADMAA
Authors’ Profile
Inchara P M Gowda is working as ICSSR Post-Doctoral Research Fellow in Kuvempu University, Karnataka, India. She obtained MBA from Visvesvaraya Technological University, Belgaum, Karnataka, India She obtained Ph.D. (Management) from Kuvempu University, Karnataka, India. She has authored two books and co-authored a dozen books published by reputed publishers. She has published more than 50 research papers in International & National Journals.
Related Documents