Proceedings of the International Conference on Industrial Engineering and Operations Management Bandung, Indonesia, March 6-8, 2018 © IEOM Society International Implications of Human Resource Management Against Organizational Culture, Work Motivation, Job Satisfaction and Employee Performance at State Own Enterprise Hospitals in Indonesia (Empirical Study on the 5 Biggest Pertamina Hospitals in Indonesia) Uli Wildan Nuryanto Doctoral Student Postgraduate Program University Mercubuana Jakarta, Indonesia [email protected] Asep Saefudin Doctoral Student Postgraduate Program University Mercubuana Jakarta, Indonesia [email protected] Prof. Dr. S. Pantja Djati, M.Si, MA Chairman of Postgraduate Program Doctoral Management University Mercubuana Jakarta, Indonesia Abstract With more hospitals emerging in Indonesia has leads to increased competition to get the number of patients. From that reason the hospital is required to have maximum performance in terms of service in order to win the patient's choice. To increase the employee performance of hospital it can be generated if job satisfaction from employees can be full filled, so it necessary to improve job satisfaction by create the organizational culture and encouragement from the management level to work motivation of employees. This research was conducted in 5 biggest hospitals owned by PT. Pertamina Bina Medika, the sample is 338 employees from population of 2,172 employees. To know the pattern of relationship between variables with the aim of knowing the direct or indirect effect on exogenous and endogenous variables, this research uses Structural Equation Model (SEM). Outer model test results using convergence test validity obtained all the loading factor values for the indicator greater than 0.70 it illustrates that the indicator is valid. The test results using discriminant validity obtained the value of loading factor for each indicator is greater to the intended construct than to the unintended construct, so it can be concluded that the indicator has a high discriminant validity value. Composite reliability test results show the value of composite reliability to four variables greater than 0.70 so it concluded that the variable has a good internal consistency. As for the value of variance of each indicator in the constraint obtained the value of AVE is greater than 0.50 so it can be concluded that the indicators in the construct can be caught by these variables more than the variance caused by measurement error. The reliability test results for each latent variable are obtained for Cronbach's Alpha value greater than 0.70 which means the reliability of the four variables is high. Inner model test results obtained R 2 value of 0.2906 for job satisfaction that describe that organizational culture and job motivation has an influence of 29.06% to the job satisfaction. The result of R 2 for 1127

Welcome message from author
This document is posted to help you gain knowledge. Please leave a comment to let me know what you think about it! Share it to your friends and learn new things together.
Transcript

Proceedings of the International Conference on Industrial Engineering and Operations Management Bandung, Indonesia, March 6-8, 2018
© IEOM Society International
Implications of Human Resource Management Against
Organizational Culture, Work Motivation, Job Satisfaction and
Employee Performance at State Own Enterprise Hospitals
in Indonesia (Empirical Study on the 5 Biggest Pertamina Hospitals in Indonesia)
Uli Wildan Nuryanto Doctoral Student
Postgraduate Program
University Mercubuana
Jakarta, Indonesia
Asep Saefudin Doctoral Student
Postgraduate Program
University Mercubuana
Jakarta, Indonesia
Prof. Dr. S. Pantja Djati, M.Si, MA Chairman of Postgraduate Program Doctoral Management
University Mercubuana
Jakarta, Indonesia
Abstract
With more hospitals emerging in Indonesia has leads to increased competition to get the number of patients.
From that reason the hospital is required to have maximum performance in terms of service in order to win the
patient's choice. To increase the employee performance of hospital it can be generated if job satisfaction from
employees can be full filled, so it necessary to improve job satisfaction by create the organizational culture and
encouragement from the management level to work motivation of employees. This research was conducted in 5
biggest hospitals owned by PT. Pertamina Bina Medika, the sample is 338 employees from population of 2,172
employees. To know the pattern of relationship between variables with the aim of knowing the direct or indirect
effect on exogenous and endogenous variables, this research uses Structural Equation Model (SEM). Outer
model test results using convergence test validity obtained all the loading factor values for the indicator greater
than 0.70 it illustrates that the indicator is valid. The test results using discriminant validity obtained the value
of loading factor for each indicator is greater to the intended construct than to the unintended construct, so it
can be concluded that the indicator has a high discriminant validity value. Composite reliability test results
show the value of composite reliability to four variables greater than 0.70 so it concluded that the variable has
a good internal consistency. As for the value of variance of each indicator in the constraint obtained the value
of AVE is greater than 0.50 so it can be concluded that the indicators in the construct can be caught by these
variables more than the variance caused by measurement error. The reliability test results for each latent
variable are obtained for Cronbach's Alpha value greater than 0.70 which means the reliability of the four
variables is high. Inner model test results obtained R2 value of 0.2906 for job satisfaction that describe that
organizational culture and job motivation has an influence of 29.06% to the job satisfaction. The result of R2 for
1127
Proceedings of the International Conference on Industrial Engineering and Operations Management Bandung, Indonesia, March 6-8, 2018
© IEOM Society International
employee performance is 0.3761 which describe organizational culture, work motivation and job satisfaction
have impact 37.61% to employee performance. For hypothesis test 1 to hypothesis 5 has got the value of t-
statistic > 1.96 that describe the significantly positive impact between organizational impact on job satisfaction,
work motivation on job satisfaction, job satisfaction on employee performance, organizational culture on
employee performance, and work motivation on employee performance. Result from hypothesis no 6 and
hypothesis no 7 for exogenous construct shown z score> 1.98 at significance level of 0.05, that describe the
exogenous construct has significantly positive impact on the endogenous construct through the intervening
construct, and for the Hypothesis No 8 shown F value > F table (104.44 > 3.00) it concluded that organizational
culture and work motivation simultaneously have a significantly positive impact on employee performance.
Keywords Organizational Culture, Work Motivation, Job Satisfaction, Employee Performance, PT. Pertamina Bina
Medika (PT. Pertamedika).
1. Background
The hospital industry in Indonesia has experienced significant growth in recent years, especially in the increasing number
of private hospitals in big cities. If previous patients are looking for hospitals then the present condition is just the opposite,
hospitals are looking for patients to remain able to survive in global competition. The research was conducted in 5 biggest
hospitals owned by PT. Pertamina Bina Medika. Based on its history PT. Pertamina Hospital was founded in 1967 on the
idea of Dr. Ibnu Soetowo, who was then the President Director of PT. Pertamina. The hospital was then inaugurated in 1972
by the President of the Republic of Indonesia. At the beginning of its establishment, PT. Pertamina Hospital was only
devoted to serving the health care and treatment of PT. Pertamina's workers and their families. Over time, facing the
dynamics of changes in the national and global oil and gas industries, PT. Pertamina makes efforts to structuring all aspects,
as outlined in the PT. Pertamina Restructuring as a whole. On July 4, 2002, PT.RSPP changed its name to PT. Pertamina
Bina Medika (PT Pertamedika). PT. Pertamina Bina Medika is tasked with managing assets and health services by PT
Pertamina on; 6 Hospitals (Pertamina Central Hospital Jakarta, Pertamina Jaya Hospital Jakarta, Pertamina Prabumulih
Hospital, Pertamina Hospital Balikpapan, Pertamina Hospital Cirebon, Pertamina Tanjung Hospital, 19 Polyclinic (Medical
Center) in the Jabodetabek area, a Nursing Academy and a Health Maintenance Management Control unit On October 21,
2002, PT. Pertamina Bina Medika in cooperation with the private sector manages PT. Pertamedika Hospital Tarakan (IPM)
East Kalimantan, in 2009 its management was done in full by PT. Pertamina Bina Medika, also manages the School of
Health Sciences.
PT. Pertamina Bina Medika as the subsidiary of PT. Pertamina try to continuously improve its service to patients with good
human resources management program. Human resource management can be interpreted as a resource management
technique that regulates the relationship between employees with companies such as recruitment, staffing, training,
performance management, compensation, labor relations, health and safety. This is the underlying importance of HRM in
supporting the success of a company organization. With the vital role of human resource management as supporting the
company's success hence required existence of standard reference which enacted by hospital to can improve intellectual
ability, communication, interpersonal, technical and moral ability of an employee. The reference is an organizational culture
that systematically leads employees to increase their work commitment to the hospital. According to Jones (1998: 30),
"Organizational culture is a collection of values and norms that control the interaction between members of the organization
with other members and with people outside the organization”.
In addition to the standard reference sourced to the organizational culture, the hospital is also required to be able to improve
job satisfaction nurse by increasing work motivation. Because work motivation is a condition that encourages or becomes
the cause of a person doing a deed or activity that is done consciously. Abraham Sperling in Mangkunegara (2013: 93),
define that "Motive is defined as a tendency to activity, started by a drive and ended by an adjustment. The adjustment is
said to satisfy the motive". Given the high work motivation of employees is expected to create a high job satisfaction in the
hospital, so that with high levels of job satisfaction in the hospital expected problems that arise in the hospital such as
conflict between the leadership and workers can be avoided because the conflict can lower employee satisfaction levels.
According to Armstrong (2006: 264), suggests that "The term job satisfaction refers to the attitude and feelings of people
have about their work. Positive and favorable attitudes towards the job indicate job satisfaction".
1128

Proceedings of the International Conference on Industrial Engineering and Operations Management Bandung, Indonesia, March 6-8, 2018
© IEOM Society International
2. Literature Review
2.1. Organizational Culture
Here it seems to emphasize the collective aspect, that culture is the work of a number of minds and not just one individual
mind. In English, culture comes from the word culture, which comes from the Latin word colere, that is to manage and do.
Wibowo (2007: 15), describes culture is a systematic human activity passed down from generation to generation through
various learning processes to create a particular way of living that best suits the environment where he lived. According to
Kusdi (2011: 12), culture derived from the sanskrit language is buddhayah, is the plural form of buddhi (character and
mind) is defined as matters relating to the mind and human reason. Organizational culture can be an instrument of major
competitive advantage, that is, when an organizational culture can answer or address environmental challenges quickly and
appropriately.
Organizational culture is also called corporate culture, often called work culture because it can not be separated by the
performance of human resources. The stronger of corporate culture, will be drive the achievement. One of the factors that
distinguishes an organization from another organization is its culture. Culture is a very important factor in improving
organizational effectiveness. Organizational culture can be a major competitive competitiveness tool, when organizational
culture supports organizational strategy and can answer or address environmental challenges quickly and appropriately.
Robbins (2001: 523-524), describes how an organization's culture is built and maintained. Indigenous culture is shown from
the philosophy of its founder. Furthermore, this culture greatly influences the criteria used in hiring employees. The actions
of top management determine the general climate of acceptable or unacceptable behavior. Whichever employee is
socialized, the level of success achieved will depend on the suitability of the values embraced by the new employee with
the organization's values in the selection process as well as on the preferences. According to Robbins (2006: 279), there are
7 primary characteristics that essence to the organizational culture that is:
1. Innovation and risk taking
Innovation and risk-taking are related to the extent to which members of the organization or employees are encouraged
to be innovative and risk-averse.
2. Attention to detail
Attention to details is related to the extent to which members of the organization or employees are expected to
demonstrate accuracy, analysis and attention to detail.
3. Outcome orientation
Outcome orientation, is the extent to which management focuses on results, not on the techniques and processes used
to obtain the results.
4. People Orientation
The individual's orientation, that is, the extent to which management decisions take into account the effect of outcomes
to people within the organization.
5. Team Orientation
The team's orientation, which relates to the extent to which the organization's work activities are carried out in the work
teams, not on the individuals.
6. Aggressiveness
Aggressiveness, ie the extent to which people in the organization exhibit aggressiveness and competitive rather than
relax.
7. Stability
Stability is the extent to which organizational activities emphasize maintaining the status quo as opposed to growth or
innovation.
2.2 Work Motivation
The word motivation is basically the word motive which means encouragement, cause or reason someone doing something.
Thus, motivation means a condition that encourages or becomes the cause of a person doing an act or activity, which takes
place consciously. Motivation is a set of attitudes and values that affect individuals to achieve specific things. According to
Robbins (2003: 424), said motivation is the desire to use high-level energy from his efforts to achieve organizational goals,
conditioned by the ability to satisfy some of the individual goals. Meanwhile, according to Hasibuan (2007: 95), motivation
is the provision of the driving force that creates the excitement of one's work so that they will work with all the power to
reach satisfaction. Then Uno (2007: 1), defines motivation is a process that determines the intensity, direction, persistence
of individuals in the effort to achieve goals, motivation is the strength of both from within and outside that encourage a
person to achieve certain predetermined goals.
1129
Proceedings of the International Conference on Industrial Engineering and Operations Management Bandung, Indonesia, March 6-8, 2018
© IEOM Society International
Sedarmayanti (2014: 233), said motivation is a willingness to expend high levels of effort toward organizational goals
conditioned by the ability of the effort to meet individual needs. The element of effort is intensity. When a person is
motivated he will try strongly. The purpose of the organization is the effort it should be. The need for something internal
circumstance that causes certain outcomes appears attractive. From the limitations that have been expressed in simple can
be said that the motivation is the emergence of behaviors that lead to certain goals with full commitment until the
achievement of the intended purpose. The motivational approach is that leaders create a climate that can make members
feel motivated. Members should be inspired to feel a sense of hope and availability within the organization in which they
work. leadership and motivation are two things that can not be separated. In most cases, an individual's motivation will arise
because of effective leader influence. Motivation is the psychological reliability and mental attitude of the human being that
energizes the activity or movement and directs or distributes behaviors toward meeting the needs that satisfy or reduce the
imbalance. Therefore, work motivation is the driving force to direct employees and it also shows how important motivation
in job satisfaction within an organization. Abraham Maslow put forward a theory of motivation called Maslow's Need
Hierarchy Theory. Maslow in Hasibuan (2009: 154-156), argued that the five hierarchies of human needs are as follows:
1. Physiological Needs
Physiological Needs is the need to survive. Included in this need is the need for food, drink, housing, and so forth. The
desire to meet this need stimulates a person to behave or work hard.
2. Safety and Security Needs
Safety and Security Needs is the need for freedom from the threat of feeling safe from the threat of accidents and safety
in carrying out the work. This necessity leads to two forms: (1) the need for security in the workplace; (2) The need for
security of property in the workplace during working hours.
3. Affiliation or Acceptance Needs
Affiliation or Acceptance Needs is a social need, friends, affiliation, interaction, loved and loved, and accepted in the
association of workers and community groups environment. Since man is a social being, it is clear that he has social
needs consisting of four groups, namely: (1) Needs to be accepted by others (sense of belonging); (2) Needs to be
respected (sense of importance); (3) Need for progress and not fail (sense of achievement); (4) The need for a sense of
participation.
4. Esteem or Status Needs
Esteem or Status Needs is a need for self-esteem and recognition and prestige awards from employees and the community
of the environment. Prestige and status are manifested by many things that are used as status symbols.
5. Self Actualization
Self Actualization is the need for self-actualization by using the ability, skill, and the optimal potential to achieve job
performance is very satisfactory.
2.3 Job Satisfaction
Job satisfaction becomes an interesting problem to be studied and important, because it proved to be of great benefit. Job
satisfaction is the starting point of problems that arise in organizations such as employee-headed conflicts and employee
turnover. Job satisfaction is an important condition that every employee must have, where the person is able to interact with
his work environment and work passionately. According to Mathis and Jackson (2011: 121), defining job satisfaction is a
positive emotional state that is the result of an evaluation of one's work experience. Meanwhile, according to Gibson et.al
(2009: 152), states that job satisfaction is an attitude of workers regarding their work resulting from their perception of their
work based on factors that exist in the work environment such as supervisory style, policies and procedures, working
conditions, and other benefits for workers. According to Handoko (2008: 193), job satisfaction is a pleasant or unpleasant
emotional state by which employees view their work. Meanwhile Locke in Sopiah (2008: 170), explains that "Job
satisfaction is a positive or pleasant emotional expression as a result of an assessment of a job or work experience". While
George and Jones (2008: 78), said "Job satisfaction is the collection of feeling and beliefs that people have about their
work". Wexley and Yukl in Mangkunegara (2013: 117), defines job satisfaction "is the way an employee feels about his or
her job".
Based on the opinions of Wexley, and Yukl, job satisfaction is a feeling that endorses or does not support the employee
associated with his work or with his condition. Job-related feelings involve aspects such as wages or salaries received,
career development opportunities, relationships with other employees, job placements, occupations, organizational structure
of the company, quality of supervision. While the feelings associated with himself, including age, health condition, ability,
education. Employees will feel satisfied in working if aspects of work and aspects of himself support and vice versa if these
aspects are not support, employees will feel dissatisfied. While Robbins and Judge (2009: 119), states there are five factors
of job satisfaction are:
1130
Proceedings of the International Conference on Industrial Engineering and Operations Management Bandung, Indonesia, March 6-8, 2018
© IEOM Society International
1. Satisfaction with Work
This satisfaction is achieved when an employee's work is consistent with the employee's own interests and abilities.
2. Satisfaction with Rewards
Where employees feel the salary or wages received in accordance with the workload and balanced with other employees
working in the organization.
3. Satisfaction with Supervisor Supervision
Employees feel they have a boss who is able to provide technical assistance and motivation.
4. Satisfaction with Colleagues
Employees are satisfied with their colleagues who are able to provide technical assistance and social encouragement.
5. Promotion Opportunity
Opportunity to improve position on the organizational structure.
2.4 Employee Performance
Understanding performance according to Armstrong (2006: 119), is "Performance is often defined simply in the output
terms-the achievement of quantified objectives. But performance is a matter of what the people achieve but how they achieve
it". Performance is not just the end result seen but we can see the performance process by seeing how people achieve it.
Then Ivancevich (2010: 229), said the performance is the achievement of the work of employees in a certain period of time
to achieve organizational goals. Assessment of the implementation of the work is a guideline in terms of employees who
are expected to demonstrate the performance of employees regularly and regularly so as to benefit the career development
of assessed employees as well as for the organization as a whole. Performance appraisal is a formal system for periodically
reviewing or reviewing and evaluating a person's performance. performance can also be seen as a combination of work
(what one has to achieve) and Competency (how one achieves it). Employee performance indicators according to Chester
I. Barnard in Suyadi Prawirosentono (2008: 27-32), are as follows:
1. Effectiveness and Efficiency
The effectiveness of an organization if the goals of an organization can be achieved in accordance with the planned
needs, the efficiency associated with the amount of sacrifices incurred in achieving the goal.
2. Authority and Responsibility
In this case the authority is the authority that someone has to govern others to perform tasks assigned to each subordinate
within an organization. Responsibility is an inseparable part or as a result of the ownership of such authority. If there is
a meaningful authority it automatically arises responsibility.
3. Discipline
Discipline when obeying applicable laws and regulations. Employee discipline as the employee's obedience in respecting
the employment agreement where employees work.
4. Initiative
One's initiative is related to thinking power, creativity in the form of ideas for something related to organizational goals.
Each reverse initiative gets the attention or positive response from the leader.
3. Methodology
3.1. Conceptual Framework
This research is designed to answer the problems that have been formulated through hypothesis testing. The design made
by Kerlinger (2000) is an inquiry structure that is structured in such a way as to help researchers obtain a definite answer.
It uses a deductive approach consisting of exploratory research to find some relatively new relationships and explanatory
research, a study conducted by explaining the indications emerging from the research object. By applying a deductive
approach, the researcher seeks to look at the data empirically and systematically, then compare it with existing theories. As
seen from the objectives, causal studies attempt to explain causal relationships on the influence of organizational culture,
work motivation, and job satisfaction on the performance of employees at pertamina hospitals managed by PT. Pertamedika.
3.2. Population and Sample
The research was conducted in 5 of Pertamina's largest hospitals including Pertamina Central Hospital (RSPP), Pertamina
Hospital Balikpapan (RSPB), Pertamina Jaya Hospital Jakarta (RSPJ), Pertamina Hospital of Cirebon (RSPC) and
Pertamina Prabumulih Hospital (RSPPBM) . The population is total employees in the 5 largest hospitals pertamina that is
as many as 2.172 employees while the number of respondents is 338 employees selected by using proportionate stratified
random sampling. The amount is based on the Slovin equation where n = N / (N.d2 + 1), then: 2.172 / (2.172 (0.05) 2 + 1)
= 338 respondents.
1131

Proceedings of the International Conference on Industrial Engineering and Operations Management Bandung, Indonesia, March 6-8, 2018
© IEOM Society International
3.3. Classification of Variables Research
The study was grouped into three groups of variables; first, organizational culture, work motivation included into
independent variable (exogenous variable), second is job satisfaction including intervening variable and third is employee
performance including dependent variable (endogenous variable). The data collected from the questionnaire were calculated
using the interval scale where the scale of value are 10 for the highest value and the value of 1 for the lowest. Value 10
shows strongly agree with the actual condition at the field while value 1 strongly disagree that describe the opposite
conditions.
3.4. Model Analysis
This study aims to obtain the best model in explaining the influence of organizational culture, work motivation, and job
satisfaction on employee performance in the 5 largest hospitals PT. Pertamina Bina Medika. This research uses a statistical
technique Structural Equation Model (SEM). According to Ferdinand (2002), SEM is well suited to: (1) confirm the un-
dimensionality of various indicators for dimensions or constructs, (2) test the compatibility or accuracy of models based on
observed empirical data, (3) test model compatibility and causality relationships between observed factors or built in models.
Basically, a complete modeling consists of measurement models and structural models. The purpose of outer model test is
to specifies the relationship between latent variables with the indicators or it can be said that the outer model defines how
each indicator relates to its latent variable.While the purpose of Inner model test is a model of the relationship structure that
forms or explains the causality between variable.
3.5. Hypothesis
Based on the past research and presented in the literature review and following model framework above there are several
hypothesis was proposed as below:
1. Organizational Culture (X1) significantly positive impact on the Job Satisfaction (Y)
2. Work Motivation (X2) significantly positive impact on Job Satisfaction (Y)
3. Job Satisfaction (Y) significantly positive impact on the Employee Performance (Z)
4. Organizational Culture (X1) significantly positive impact on the Employee Performance (Z)
5. Work Motivation (X2) significantly positive impact on the Employee’s Performance (Z)
6. Organizational Culture (X1) through the Job Satisfaction (Y) significantly positive impact on the Employee Performance
(Z).
7. Work Motivation (X2) through the Job Satisfaction (Y) significantly positive impact on the Employee Performance (Z)
8. Organizational Culture (X1) and Work Motivation (X2) simultaneously and significantly positive impact to the
Employee Performance (Z)
4. Result & Discussion
4.1 Descriptive test result
The demographic of the respondents tabulated in table 4.1, were derived from descriptive analysis. The majority of the
sample is female (64.58%), category of age 31-40 years (38.46%), with majority service years 16-20 years (35.26%),
majority of education is Diploma (57.95%), and majority of job function is nurses (53.8%).
Table 4.1. Demographic of the respondents
Profile Frequency %
1. Gender
Male 120 35.42
Female 218 64.58
2. Age
20-30 Years 71 20.91
31-40 years 130 38.46
41-50 Years 111 32.98
>50 Years 26 7.65
3. Service Years
0-5 Years 55 16.17
6-10 Years 68 20.24
11-15 Years 71 21.23
16-20 Years 119 35.26
1132

Proceedings of the International Conference on Industrial Engineering and Operations Management Bandung, Indonesia, March 6-8, 2018
© IEOM Society International
>20 Years 24 7.10
4. Education
Secondary High School 45 13.27
Diploma 196 57.95
Bachelor Degree 81 23.91
Master Degree 16 4.70
Ph.D 1 1
5. Work Function
Director 1 0.30
Managements Level 3 0.89
Doctor 28 8.28
Nurses 181 53.8
Medical Support 80 23.7
Non Medic 44 13.0
4.2 SEM Analysis Result by Partial Least Square
4.2.1. Outer Model Test
Outer model is a model that specifies the relationship between latent variables with the indicators or it can be said that the
outer model defines how each indicator relates to its latent variable. The Outer model is interpreted by looking at several
things, including: convergent validity, discriminant validity, composite reliability, Average Variance Extracted (AVE) and
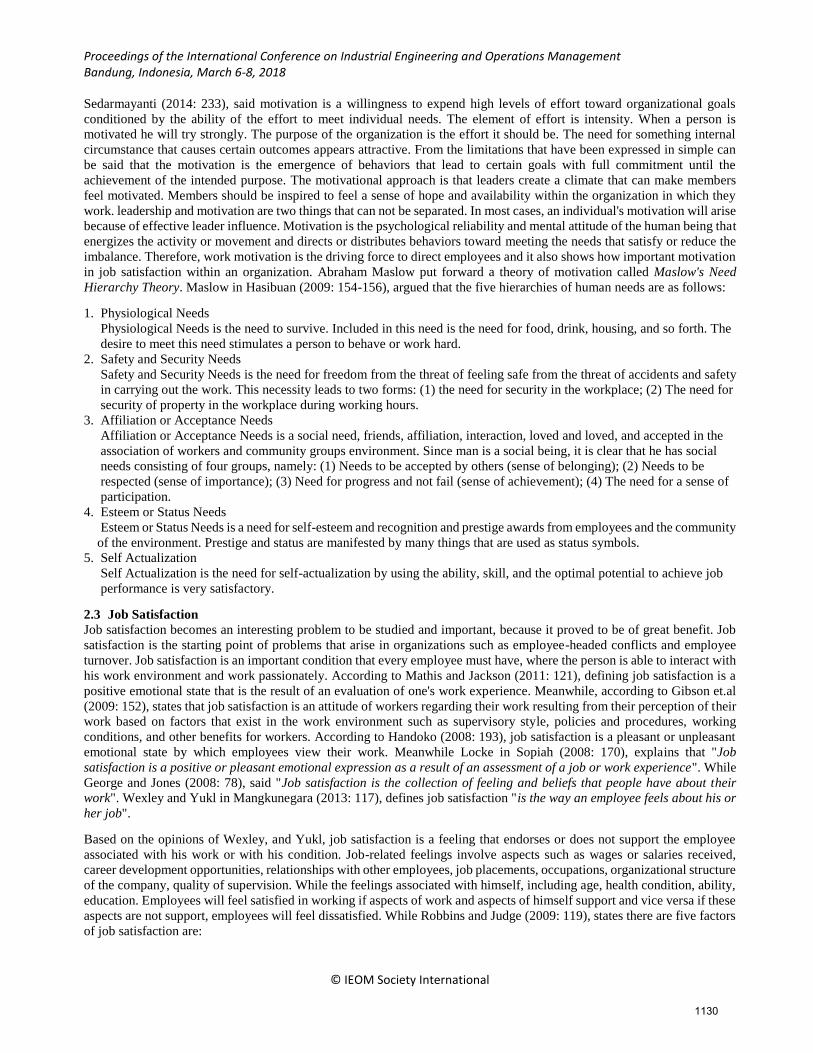
alpha cronbach's. The PLS Algorithm model is presented in the figure below.
Figure 4.2.1. Model PLS Algorithm
4.2.2.1. Convergent Validity
Convergent value is measuring the amount of loading factor for each latent variable. Loading factor above 0.70 is highly
recommended, however the above factor loading factor of 0.60 can still be tolerated as long as the model is still in
development stage. Full value indicator loading indicator is presented in the table below.
Table 4.2.2.1. Value of Loading Indicator
Indicator Employee
Performance
Job
Satisfaction
Organisation
Culture
Work
Motivation
X1 0,9666
X2 0,9693
X3 0,9611
X4 0,9702
X5 0,9498
X6 0,9534
1133

Proceedings of the International Conference on Industrial Engineering and Operations Management Bandung, Indonesia, March 6-8, 2018
© IEOM Society International
X7 0,9586
X8 0,8876
X9 0,904
X10 0,9246
X11 0,9255
X12 0,9086
Y1 0,9049
Y2 0,8954
Y3 0,9148
Y4 0,9031
Y5 0,8855
Z1 0,958
Z2 0,9658
Z3 0,955
Z4 0,9723 From table above the result shows all of the indicator loading values obtained > 0.7, this proves that all indicators are valid
as a constituent measure.
4.2.1.2. Discriminant Validity
Discriminant value is useful to assess whether the variable has an adequate discriminative validity that is by comparing the
correlation of the indicator with the intended construct must be greater than the correlation with the other construct. If the
correlation of the indicator has a higher value than the correlation indicator with other construct, it is said that the variable
has a high discriminant validity. This value can be seen on the value of cross loading factor as follows:
Table 4.2.1.2. Value of Cross Loading
Indicator Employee
Performance
Job
Satisfaction
Organization
Culture
Work
Motivation
X1 0,5103 0,4652 0,9666 0,4607
X2 0,5241 0,4673 0,9693 0,4848
X3 0,528 0,4627 0,9611 0,4906
X4 0,517 0,4566 0,9702 0,4794
X5 0,5006 0,4632 0,9498 0,4674
X6 0,4926 0,4675 0,9534 0,46
X7 0,5218 0,4409 0,9586 0,4736
X8 0,3616 0,3722 0,408 0,8876
X9 0,4078 0,427 0,4686 0,904
X10 0,4087 0,4023 0,4626 0,9246
X11 0,4401 0,4122 0,442 0,9255
X12 0,3706 0,4362 0,4589 0,9086
Y1 0,4686 0,9049 0,4087 0,407
Y2 0,4032 0,8954 0,4368 0,3788
Y3 0,4413 0,9148 0,4234 0,3957
Y4 0,4335 0,9031 0,4199 0,4232
Y5 0,4754 0,8855 0,4663 0,4239
Z1 0,958 0,459 0,499 0,4206
1134

Proceedings of the International Conference on Industrial Engineering and Operations Management Bandung, Indonesia, March 6-8, 2018
© IEOM Society International
Z2 0,9658 0,4969 0,526 0,4378
Z3 0,955 0,4481 0,4957 0,3837
Z4 0,9723 0,4974 0,5347 0,4422
From the table above can be seen that the value of loading indicator X1 to the construct directed organization culture is
0.9666 higher than other constants that is to work motivation of 0.4607, to employee performance 0.5103, to job satisfaction
only 0.4652. Similarly, for the indicator X2 - X9 has the highest loading value to Organizational culture as construct. On
the indicator X8 loading value of the work motivation the construct is 0.8876, while to the other construct of employee
performance is 0.3616, job satisfaction 0.3722 and organization culture 0.408. Similarly, for other indicators X8 - X12 has
a higher loading value to the intended construct than to unintended construct. Indicator Y1-Y5 has a higher loading value
to Job satisfaction and indicator Z1 - Z4 also higher to employee performance than to the unintended construct.
4.2.1.3. Composite reliability
The high value of composite reliability indicates a good consistency of each indicator in the latent variable to measure the
variable. Criteria value composite reliability is > 0.7 indicates that the variable has a good internal consistency. Composite
reliability values are presented as per following table.
Table 4.2.1.3. Value of Composite Reliability
Construct Composite Reliability
Employee Performance 0,9807
Job Satisfaction 0,9556
Organisation Culture 0,9884
Work Motivation 0,9602
From the table above shows that the value of composite reliability construct Organization culture is 0.9884, work motivation
is 0.9602, job satisfaction is 0.9556 and Employee performance is 0.9807. The four composite values of composite reliability
> 0.70 that’s mean has a good internal consistency.
4.2.1.4. Average Variance Extracted (AVE)
The value of AVE shows the variance value of each indicator in the constancy that the variable can capture more than the
variance caused by the measurement error. AVE value is expected > 0.5. Value of AVE constellation Organization culture
0.9241, work motivation 0.8284, job satisfaction 0.8115 and Employee performance of 0.927. The full results are presented
in the table below.
Table 4.2.1.4. Value of Average Variance Extracted (AVE)
Construct AVE
Employee Performance 0,927
Job Satisfaction 0,8115
Organization Culture 0,9241
Work Motivation 0,8284
4.2.1.5. Cronbach’s Alpha Reliability test also compared with value of alpha cronbach's value. Limitations of alpha cronbach's for reliability test is >
0.7. The result for Organization culture is 0.9861, work motivation is 0.9482, job satisfaction is 0.9415 and Employee
performance is 0.9738. The results of the Cronbach's alpha are presented in the table below.
Table 4.2.1.5. Value of Cronbach’s Alpha
Construct Cronbachs
Alpha
Employee Performance 0,9738
Job Satisfaction 0,9419
Organization Culture 0,9863
Work Motivation 0,9482
1135

Proceedings of the International Conference on Industrial Engineering and Operations Management Bandung, Indonesia, March 6-8, 2018
© IEOM Society International
4.2.2. Inner Model Test
4.2.2.1. Goodness of fit test
To test the structural model is done by looking at the value of R2 which is called the test of Goodness of fit. The job
satisfaction obtains R2 value of 0.2906 which can be interpreted that the variant in job satisfaction can be explained by
organization culture and work motivation is 29.06% while the rest is 70.94% explained by other variables. For employee
performance the R2 values is 0.3761, this value indicates that employee performance can be 37,61% explained by work
motivation, organizational culture and job satisfaction while the rest of 62.39% is explained by other variables. The results
of the full R-square values are presented as following table.
Table 4.2.2.1. Value of R-Square
Construct R Square
Employee Performance 0,3761
Job Satisfaction 0,2906
4.2.2.2. Hypothesis test
The next analysis is hypothesis test to see the significance of the influence between independent construct on the dependent
construct and answer what has been hypothesized. Testing with a significance level of 5% if the value of t-statistic > 1.96
then the null hypothesis (H0) is rejected. The t-statistical coefficient of influence of the latent constraint is obtained from
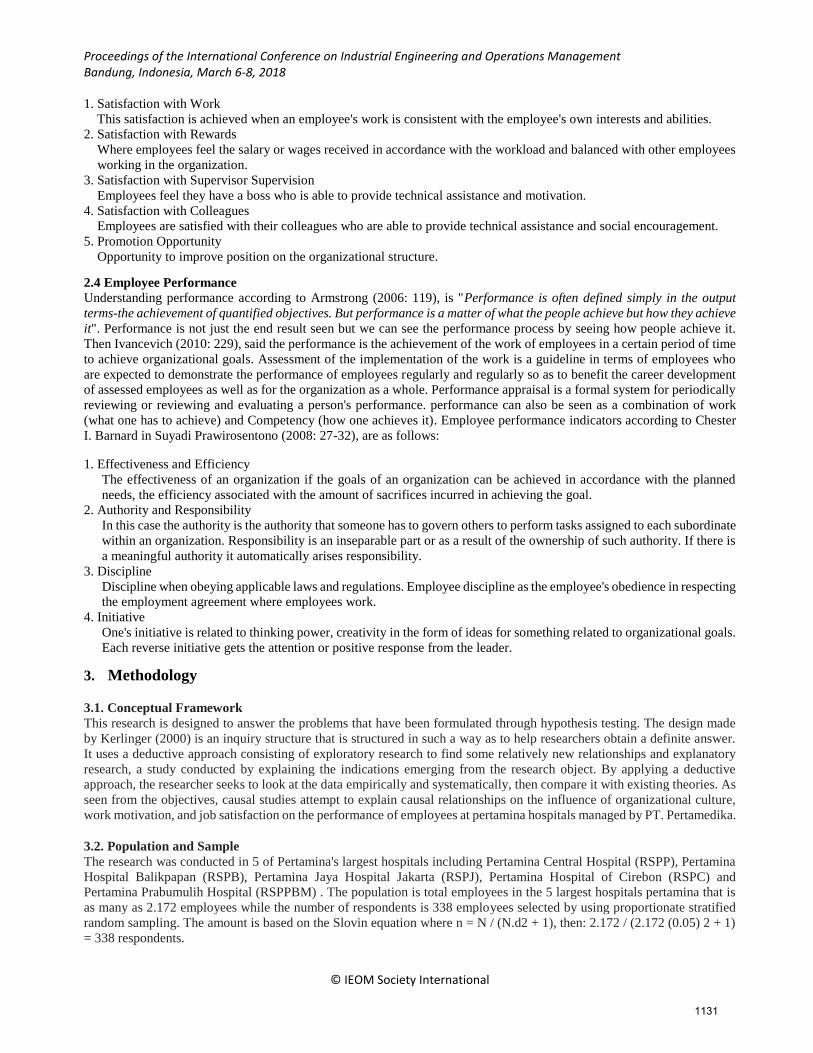
PLS Bootstrapping. The results of the Bootstrapping PLS Model are presented in the figure below.
Figure 4.2.2.2. Model PLS Bootstraping
The value of the parameter coefficient can be seen in the value of (original sample) and the value of t-statistical significance
can be seen in the table below.
Table 4.2.2.2. Coefficients value (Original Sample), Standard Error and T-Statistics
Significance Test Original
Sample (O)
Standard Error
(STERR)
T Statistics
(|O/STERR|) Result
Job Satisfaction -> Employee Performance 0,2663 0,0663 4,0166 Significant
Organisation Culture -> Employee
Performance 0,3302 0,0622 5,3043 Significant
Organisation Culture -> Job Satisfaction 0,3391 0,0607 5,5886 Significant
Work Motivation -> Employee
Performance 0,1552 0,0679 2,2856 Significant
Work Motivation -> Job Satisfaction 0,284 0,0663 4,2865 Significant
Hypothesis 1
The coefficient value of organizational culture influence on job satisfaction is 0.3391, standard error 0,0607 and t-statistic
5,5886. Because the value of t-statistics 5.886> 1.96 then reject H0. That mean the organizational culture has a significantly
positive impact on job satisfaction.
Hypothesis 2
1136

Proceedings of the International Conference on Industrial Engineering and Operations Management Bandung, Indonesia, March 6-8, 2018
© IEOM Society International
The coefficient value of work motivation effect on job satisfaction is 0.284, standard error 0.0663 and t-statistic value
4.2865. Because the value of t-statistics 4.2865> 1.96 then reject H0. That mean the work motivation significantly positive
impact on job satisfaction.
Hypothesis 3
The coefficient value of job satisfaction effect to employee performance is 0.2663, standard error 0.0663 and t-statistic
value 4,0166. Because the value of t-statistics 4,0166 > 1.96 then reject H0. That mean the job satisfaction has a significantly
positive impact on employee performance.
Hypothesis 4
The coefficient value of organizational culture influence on employee performance is 0.3302, standard error 0.0622 and t-
statistic value 5.3043. Because the value of t-statistics 5.3043 > 1.96 then reject H0. That mean the organizational culture
has a significantly positive impact on employee performance.
Hypothesis 5 The coefficient of the effect of work motivation on employee performance is 0.1552, the standard error value is 0.0679 and
the t-statistic value is 2.2856. Because the value of t-statistics 2.2856 > 1.96 then reject H0. That mean the work motivation
has a significantly positive impact on employee performance.
Hypothesis 6
The coefficient of indirect influence from organization culture to employee performance through job satisfaction is 0.3391
x 0.2663 = 0.0903. Calculation of the value of z Sobel test as follows:
𝑧 =𝑎𝑏
√(𝑏2𝑆𝐸𝑎2) + (𝑎2𝑆𝐸𝑏
2)
𝑧 =0.3391 𝑥 0.2663
√(0.266320.06072) + (0.339120.06632)
𝑧 =0.0903
√0.00076
𝑧 = 3.261
Where :
a = coefficient influence organization culture on job satisfaction
b = coefficient influence job satisfaction on employee performance
SEa = standard error organization culture on job satisfaction
SEb = standard error job satisfaction on employee performance
Since z score is 3,261 greater than Z 1.98 at the 0.05 significance level it can be concluded that the coefficient of mediation
0.0903 is significant. This shows that job satisfaction significantly mediates the influence of organization culture on
employee performance.
Hypothesis 7
The coefficient of indirect influence from work motivation to employee performance through job satisfaction is 0.284 x
0.2664 = 0.0663. Calculation of the value of the test Sobel as follows:
𝑧 =𝑎𝑏
√(𝑏2𝑆𝐸𝑎2) + (𝑎2𝑆𝐸𝑏
2)
𝑧 =0.284 𝑥 0.2663
√(0.266320.06632) + (0.28420.06632)
𝑧 =0.0756
√0.00066
𝑧 = 2.929
Where :
a = coefficient influence work motivation on job satisfaction
b = coefficient influence job satisfaction on employee performance
SEa = standard error work motivation on job satisfaction
SEb = standard error job satisfaction on employee performance
Since z score is 2.929 greater than Z 1.98 at the level of significance of 0.05 it can be concluded that the coefficient of
mediation 0.0756 is significant. This shows that job satisfaction significantly mediates the effect of work motivation on
employee performance.
Hypothesis 8
1137

Proceedings of the International Conference on Industrial Engineering and Operations Management Bandung, Indonesia, March 6-8, 2018
© IEOM Society International
To get F value for simultaneously testing it can use the following formula:
𝐹ℎ𝑖𝑡 = 𝑅2/𝑘
(1 − 𝑅2)/(𝑁 − 𝑘 − 1)
𝐹ℎ𝑖𝑡 = 0.3761/2
(1 − 0.3761)/(339 − 2 − 1)
𝐹ℎ𝑖𝑡 = 0.1880
(1 − 0.3761)/(339 − 2 − 1)
𝐹ℎ𝑖𝑡 = 0.1880
0.6239/336
𝐹ℎ𝑖𝑡 = 0.1880
0.0018
𝐹ℎ𝑖𝑡 = 104.44
F-table value with error (alpha) 5%, df1 = 2 and df2 = 337 (N-k) where N number of sample and k number of independent
indicator is 3,00. Because the value of F-hit > F-table (104.44 > 3.00) then it is proven that the organization culture and
work motivation simultaneously have a significantly positive impact on employee performance.
5. Conclusion
From Outer model test results using convergence test validity obtained all the loading factor values for the indicator greater
than 0.70 it illustrates that the indicator is valid. While the test results using discriminant, validity obtained the value of
loading factor for each indicator is greater to the intended construct than the unintended construct, it can be concluded that
the indicator has a high discriminant validity value. Composite reliability test results show the value of composite reliability
to four variables greater than 0.70 so concluded that the variable has a good internal consistency. As for the value of variance
of each indicator in the constraint obtained the value of AVE is greater than 0.50 so it can be concluded that the indicators
in the construct that can be caught by these variables more than the variance caused by measurement error. The reliability
test results for each latent variable are obtained for Cronbach's Alpha value greater than 0.70 which means the reliability of
the four variables is high.
Inner model test results obtained R2 0.2906 for job satisfaction that describe the organizational culture and job motivation
has an influence of 29.06% of job satisfaction. While for R2 employee performance variable is 0.3761 which describe that
organizational culture variable, work motivation and job satisfaction have impact 37.61% to employee performance.
Hypothesis 1 results obtained t-statistical for organizational culture on job satisfaction is 5.886, this value is higher than
1.96 so H0 rejected and proved that organizational culture significantly positive impact on job satisfaction. Result of
Hypothesis 2 got t-statistic for work motivation on job satisfaction is 4,286, this value is higher than 1.96 so H0 rejected
and prove that work motivation significantly positive impact on job satisfaction. Hypothesis 3 got t-statistic job satisfaction
on employee performance is 4,016, this value is higher than 1.96 so H0 rejected and prove that job satisfaction significantly
positive impact on employee performance. Hypothesis test 4 shows that t-statistic of organizational culture toward
employee performance is 5,304, this value is higher than 1.96 so that H0 is rejected and proves that organizational culture
has a significantly positive impact on employee performance. Hypothesis 5 results obtained t-statistic work motivation on
employee performance is 2,285, this value is greater than 1.96 so H0 rejected and proved that work motivation significantly
positive impact on employee performance. Hypothesis 6 shows that the coefficient of indirect (z) effect from organizational
culture to employee performance through job satisfaction is 3,261, this value is greater than 1.98 at the 0.05 significance
level which shows that organizational culture significantly impact on employee performance through job satisfaction.
Hypothesis test 7 shows that the coefficient of influence (z) is not directly from work motivation to employee performance
through job satisfaction 2,929, this value is greater than 1.98 at significance level of 0.05 which illustrates that work
motivation significantly affect employee performance through job satisfaction. Hypothesis 8 results obtained by the F-hit
(104.44) where this value is higher than F-table (3.00) it can be concluded that organizational culture and work motivation
simultaneously have a significantly positive impact on employee performance.
References
Amstrong, M. A Handbook of Human Resource Management Practice, Tenth Edition, London: Kogan Page Publishing,
2006.
1138

Proceedings of the International Conference on Industrial Engineering and Operations Management Bandung, Indonesia, March 6-8, 2018
© IEOM Society International
Anoraga, Pandji. Psikologi Kerja, Jakarta: PT. Rineka Cipta, 2006.
As’ad, Moh. Seri Ilmu Sumber Daya Manusia Psikologi Industri, Cetakan Kesembilan, Yogyakarta: Liberty, 2004.
Armstrong, Michael. Performance Management, United States: Kogan Page, 2006.
Baldoni, John, Great Motivation Secrets of Great Leaders, United States of America: McGraw-Hill, 2005.
Chuck, Williams. Management, Texas: Texas Christian University, Thomson South-Western, 3rd Edition, 2005.
Colquitt, Jason A, Jeffery A. LePine, & Michael J. Wesson. Organizational Behavior, New York: McGraw-Hill, Inc, 2009.
Darma, Agus. Manajemen Supervisi, Jakarta: PT. Raja Grafindo Perkasa, 2003.
Daft, Richard L. Organization Theory and Design, 6th Edition. United States of Amerika: South-Western College
Publishing, 1998.
Ferdinand, A., Structral Equation Modelling dalam penelitian manajemen, Semarang: FE UNDIP, 2002
George, J.M. & G.R. Jones. Understanding and Managing Organizational Behavior, Fifth Edition, New Jersey: Pearson
Prentice Hall, 2008.
Gibson, J.L., J.M. Ivancevich, Donnelly Jr. Organisasi: Perilaku, Struktur, Proses, Edisi Bahasa Indonesia, Tangerang:
Bina Rupa Aksara, 2009.
Hakim, A., Effect of organizational culture, organizational commitment, to performance : study in hospital of district South
Konawe of Southeast Sulawesi. International Journal of Engineering and Sciences, vol 4, no 5, pp. 33-41, 2015.
Handoko, T. Hani. Dasar-Dasar Manajemen Operasi dan Produksi, Cetakan Kesepuluh, Yogyakarta: BPFE, 2008.
Hasibuan, Malayu S.P. Organisasi dan Motivasi, Jakarta: PT. Bumi Aksara, 2007.
Hasibuan, Malayu S.P. Manajemen Sumber Daya Manusia, Cetakan Ketigabelas, Edisi Revisi, Jakarta: PT. Bumi Aksara,
2009.
Hertanto, E., Kuesioner Budaya Organisasi (Model Stephen P. Robbins), Available :
https://www.academia.edu/24615409/KUESIONER_BUDAYA_ORGANISASI_MODEL_STEPHEN_P._ROB
BINS, October 20, 2017.
Hertanto, E., Kuesioner Kepuasan Kerja Karyawan (Model Robbin & Judge), Available :
https://www.academia.edu/23819725/KUESIONER_KEPUASAN_KERJA_KARYAWAN_MODEL_ROBBIN
S_and_JUDGE, October 20, 2017.
Hertanto, E., Kuesioner Kinerja Karyawan (Model Chester I. Barnanrd), Available :
https://www.academia.edu/23819627/KUESIONER_KINERJA_KARYAWAN_MODEL_CHESTER_I._BARN
ARD, October 20, 2017.
Hertanto, E., Kuesioner Motivasi Kerja Pegawai (Model Abraham Maslow), Available :
https://www.academia.edu/24055395/KUESIONER_MOTIVASI_KERJA_PEGAWAI_MODEL_ABRAHAM_
MASLOW_, October 20, 2017.
Ishak & Hendri Tanjung, Manajemen Motivasi, Jakarta: PT. Raja Grafindo Perkasa, 2003.
Ivancevich, John M. Human Resource Management, 11th International Edition, Singapore: McGraw-Hill, 2010.
Jones, Gareth R. Organization Theory, Text and Cases. Second Edition, United States of America: Addison-Wesley
Longman Publishing Company, Inc, 1998.
Kusdi. Budaya Organisasi, Jakarta: Salemba Empat, 2011.
Kerlinger, F.N., Azas-azas penelitian behavioral. Yogyakarta: Gajah Mada University Press, 2000.
Kreitner, Robert, dan Angelo Kinicki. Organizational Behavior: Key Concepts, Skills and Best Practices, New York:
McGraw-Hill, 2008.
Mangkunegara, Anwar Prabu. Manajemen Sumber Daya Manusia Perusahaan, Bandung: PT. Remaja Rosdakarya, 2013.
Mathis, Robert L, & John H. Jackson. Human Resource Management, Jakarta: Salemba Empat, 2011.
Mathis, Robert L., dan John H, Jackson. Manajemen Sumber Daya Manusia, Buku 1, Jakarta: Salemba, 2001.
Mathis, Robert L, & John H. Jackson. Manajemen Sumber Daya Manusia, Jakarta: Salemba Empat, 2002.
McShane, Steven L, & Mary Ann Von Glinow. Organizational Behavior, 4th Edition, New York: McGraw-Hill Companies,
Inc, 2010.
Munandar, A. Sunyoto. Psikologi Industri dan Organisasi, Jakarta; Penerbit Universitas Indonesia, 2008.
Pabundu, Moh. Budaya Organisasi dan Peningkatan Kinerja Karyawan, Jakarta: Bumi Aksara, 2010.
Prawirosentono, Suyadi. Manajemen Sumberdaya Manusia “Kebijakan Kinerja Karyawan”, Yogyakarta: BPFE UGM,
2008.
Rivai, Veithzal. Manajemen Sumber Daya Manusia Untuk Perusahaan,: Dari Teori ke Praktik, Jakarta: PT. Raja Grafindo
Persada, 2004.
Robbins, Stephen P. Organizational Behavior, 9th Edition. New Jersey: Prentice-Hall, Inc, 2001.
Robbins, Stephen P. Management, New Jersey: Prentice Hall Seventh Edition, 2003.
Robbins, Stephen P. Perilaku Organisasi, Jakarta: Gramedia, 2006.
1139

Proceedings of the International Conference on Industrial Engineering and Operations Management Bandung, Indonesia, March 6-8, 2018
© IEOM Society International
Robbins, Stephen P, & Timothy A Judge. Organizational Behavior, Thirteenth Edition. New Jersey: Pearson Prentice Hall,
2009.
Roe, Leslie W, Lloyd L. Byars. Management Skills and Application, Tenth Edition, New York: McGraw-Hill Irwin, 2003.
Sastrohadiwiryo, Siswanto. Manajemen Tenaga Kerja Indonesia Pendekatan Administratif dan Operasional, Cetakan
Pertama, Jakarta: PT. Bumi Aksara, 2003.
Sedarmayanti. Manajemen Sumber Daya Manusia, Reformasi Birokrasi dan Manajemen Pegawai Negeri Sipil, Cetakan
Ketujuh Bandung: PT. Refika Aditama, 2014.
Shani, A.B Rami & James B. Lau. Behavior in Organization an Experimental Approach, New York: McGraw Hill
International Edition, 2009.
Sopiah, Perilaku Organisasional, Edisi I, Yogyakarta: Andi Offset, 2008.
Susanto, A.B., Gede Prama, Dkk. Strategi Organisasi, Yogyakarta: Amara Books, 2006.
Tika, Moh. Pabundu. Budaya Organisasi dan Peningkatan Kinerja Perusahaan, Jakarta: Bumi Aksara, 2006.
Tunggal, Amin Widjaja. Corporate Culture Konsep dan Kasus, Jakarta: Harvarindo, 2007.
Uno, Hamzah B. Teori Motivasi & Pengukurannya Analisis di Bidang Pendidikan, Jakarta: PT. Bumi Aksara, 2007.
Wibowo. Manajemen Perubahan, Jakarta: PT. Raja Grafindo Persada, 2006. Manajemen Kinerja, Jakarta: Rajawali Pers,
2007.
Wibowo. Manajemen Kinerja, Jakarta: Rajawali Pers, 2007.
Wirawan. Budaya dan Iklim Organisasi Teori Aplikasi dan Penelitian, Jakarta: Salemba Empat, 2007.
Wexley, Kenneth N., dan Gary Yukl. Perilaku Organisasi dan Psikologi Personalia, terjemahan Muh Sobaruddin, Jakarta:
Rineka Cipta, 2000.
Biographies
Uli Wildan Nuryanto is a Doctoral student at Mercu Buana University, Jakarta. Diploma from Bogor Agriculture Institute
majoring in chemical analyst, bachelor degree from University Jayabaya, majoring in chemical engineering, and master
degree from STIMA IMMI with majoring of human resources management. Uli work as a operations manager at chemical
manufacturer for 14 years and also career as a permanent lecturer of private universities in Serang for 7 years. His research
interests include the employee performance, job satisfaction, work motivation and organizational culture.
Asep Saefudin is a Doctoral student at Mercu Buana University, Jakarta. Bachelor degree from University of Indonesia,
majoring in economic law, and master degree from University of Budi Luhur Jakarta with majoring of human resources
management. Asep work as Vice President of Human Capital & General Affair Pertamedika which is the Holding of
Pertamina Hospitals over Indonesia. His research interests include the employee performance, job satisfaction, work
motivation and organizational culture.
Prof. Dr. S. Pantja Djati, M.Si, MA is a chairman of the Postgraduate program doctoral management Mercu Buana
University, Jakarta, Indonesia. He had many experience as academic more than 30 years. He also served at various
universities such as Petra Christian University Surabaya, Catholic University Widya Mandala Surabaya, University
Christian of Indonesia, University of Trisakti, University of Prof. Dr. Moestopo
1140
Related Documents