Airborne particulate organics at the summit (2060 m, a.s.l.) of Mt. Hua in central China during winter: Implications for biofuel and coal combustion Jianjun Li a, b , Gehui Wang a, c, ⁎, Bianhong Zhou d , Chunlei Cheng a , Junji Cao a, c , Zhenxing Shen b, a , Zhisheng An a a State Key Laboratory of Loess and Quaternary Geology, Institute of Earth Environment, Chinese Academy of Sciences, Xi'an 710075, China b Department of Environmental Science and Engineering, Xi'an Jiaotong University, Xi'an 710049, China c School of Human Settlements and Civil Engineering, Xi'an Jiaotong University, Xi'an 710049, China d Department of Geographical Science and Environment Engineering, Baoji University of Art and Science, Baoji 721013, China article info abstract Article history: Received 28 June 2011 Received in revised form 30 November 2011 Accepted 30 November 2011 Sugars, n-alkanes and PAHs in PM 10 and size-segregated samples collected from the summit (2060 m, altitude) of Mt. Hua in Guanzhong Plain, central China during the winter of 2009 were characterized using a GC/MS technique. Concentrations of sugars, n-alkanes and PAHs in PM 10 are 107 ± 52, 121 ± 63, 7.3 ± 3.4 ng m -3 , respectively. Levoglucosan and fossil fuel de- rived n-alkanes are more abundant in the air masses transported from southern China than in those from northern China with no spatial difference found for PAHs, suggesting that emissions from biomass burning and vehicle exhausts are more significant in southern part of the country. Dehydrated sugars, fossil fuel derived n-alkanes and PAHs presented a unimode size distribu- tion, peaking at the size of 0.7–1.1 μm, whereas non-dehydrated sugars and plant wax derived n-alkanes showed a bimodal pattern, peaking at 0.7–2.1 and 5.8–9.0 μm, respectively. Principal component analysis showed that biofuel combustion plus plant emission is the most important source in Mt. Hua, being different from the cases in Chinese urban areas where fossil fuel combustion is the major source. By comparison with previous mountain and lowland ob- servations and aircraft measurements we found that wintertime PAHs in China are still char- acterized by coal burning emissions especially in the inland regions, although in the country increasing rate of SO 2 emission from coal combustion has decreased and emissions of vehicle exhaust has sharply increased. © 2011 Elsevier B.V. All rights reserved. Keywords: Levoglucosan n-Alkanes and PAHs Molecular composition and size distribution High mountain Free troposphere Source identification 1. Introduction No other region on Earth is as large and diverse a source of aerosols and trace gases as the Asian continent, especially in East Asia, where much more absorbing soot and carbonaceous aerosols have been emitted into the atmosphere. Those an- thropogenic aerosols may result in heavily polluted clouds and evaporate much of their water before precipitation can occur. Rosenfeld et al. (2007) reported that in the past 50 years increasing aerosols in central China have resulted in a decreasing rainfall. Menon et al. (2002) also pointed out that high loading of carbonaceous aerosols (e.g., black carbon) in China is one of major factors leading to the increased floods in the south and droughts in the north. Coal is the major ener- gy source in China, and more than 2 billion tons of coal are burned each year without a strict emission control in some cases, especially in winter when coals are combusted for heat- ing (Huebert et al., 2003; Wang et al., 2006, 2009a). In addi- tion, biomass burning for cooking and heating is still common in rural area of China, adding additional carbona- ceous particles into the atmosphere. Atmospheric Research 106 (2012) 108–119 ⁎ Corresponding author at: State Key Laboratory of Loess and Quaternary Geology, Institute of Earth Environment, Chinese Academy of Sciences, Xi'an 710075, China. Tel.: +86 29 8832 9320; fax: +86 29 8832 0456. E-mail addresses: [email protected], [email protected] (G. Wang). 0169-8095/$ – see front matter © 2011 Elsevier B.V. All rights reserved. doi:10.1016/j.atmosres.2011.11.012 Contents lists available at SciVerse ScienceDirect Atmospheric Research journal homepage: www.elsevier.com/locate/atmos

Welcome message from author
This document is posted to help you gain knowledge. Please leave a comment to let me know what you think about it! Share it to your friends and learn new things together.
Transcript

Atmospheric Research 106 (2012) 108–119
Contents lists available at SciVerse ScienceDirect
Atmospheric Research
j ourna l homepage: www.e lsev ie r .com/ locate /atmos
Airborne particulate organics at the summit (2060 m, a.s.l.) of Mt. Hua incentral China during winter: Implications for biofuel and coal combustion
Jianjun Li a,b, Gehui Wang a,c,⁎, Bianhong Zhou d, Chunlei Cheng a, Junji Cao a,c,Zhenxing Shen b,a, Zhisheng An a
a State Key Laboratory of Loess and Quaternary Geology, Institute of Earth Environment, Chinese Academy of Sciences, Xi'an 710075, Chinab Department of Environmental Science and Engineering, Xi'an Jiaotong University, Xi'an 710049, Chinac School of Human Settlements and Civil Engineering, Xi'an Jiaotong University, Xi'an 710049, Chinad Department of Geographical Science and Environment Engineering, Baoji University of Art and Science, Baoji 721013, China
a r t i c l e i n f o
⁎ Corresponding author at: State Key Laboratory ofGeology, Institute of Earth Environment, Chinese Acad710075, China. Tel.: +86 29 8832 9320; fax: +86 29
E-mail addresses: [email protected], gehuiwang@(G. Wang).
0169-8095/$ – see front matter © 2011 Elsevier B.V. Adoi:10.1016/j.atmosres.2011.11.012
a b s t r a c t
Article history:Received 28 June 2011Received in revised form 30 November 2011Accepted 30 November 2011
Sugars, n-alkanes and PAHs in PM10 and size-segregated samples collected from the summit(2060 m, altitude) of Mt. Hua in Guanzhong Plain, central China during the winter of 2009were characterized using a GC/MS technique. Concentrations of sugars, n-alkanes and PAHsin PM10 are 107±52, 121±63, 7.3±3.4 ng m−3, respectively. Levoglucosan and fossil fuel de-rived n-alkanes are more abundant in the air masses transported from southern China than inthose from northern China with no spatial difference found for PAHs, suggesting that emissionsfrom biomass burning and vehicle exhausts aremore significant in southern part of the country.Dehydrated sugars, fossil fuel derived n-alkanes and PAHs presented a unimode size distribu-tion, peaking at the size of 0.7–1.1 μm, whereas non-dehydrated sugars and plant wax derivedn-alkanes showed a bimodal pattern, peaking at 0.7–2.1 and 5.8–9.0 μm, respectively.Principal component analysis showed that biofuel combustion plus plant emission is the mostimportant source in Mt. Hua, being different from the cases in Chinese urban areas where fossilfuel combustion is the major source. By comparison with previous mountain and lowland ob-servations and aircraft measurements we found that wintertime PAHs in China are still char-acterized by coal burning emissions especially in the inland regions, although in the countryincreasing rate of SO2 emission from coal combustion has decreased and emissions of vehicleexhaust has sharply increased.
© 2011 Elsevier B.V. All rights reserved.
Keywords:Levoglucosann-Alkanes and PAHsMolecular composition and size distributionHigh mountainFree troposphereSource identification
1. Introduction
No other region on Earth is as large and diverse a source ofaerosols and trace gases as the Asian continent, especially inEast Asia, wheremuchmore absorbing soot and carbonaceousaerosols have been emitted into the atmosphere. Those an-thropogenic aerosols may result in heavily polluted clouds
Loess and Quaternaryemy of Sciences, Xi'an8832 0456.yahoo.com.cn
ll rights reserved.
and evaporate much of their water before precipitation canoccur. Rosenfeld et al. (2007) reported that in the past50 years increasing aerosols in central China have resultedin a decreasing rainfall. Menon et al. (2002) also pointed outthat high loading of carbonaceous aerosols (e.g., black carbon)in China is one of major factors leading to the increased floodsin the south and droughts in the north. Coal is themajor ener-gy source in China, and more than 2 billion tons of coal areburned each year without a strict emission control in somecases, especially inwinterwhen coals are combusted for heat-ing (Huebert et al., 2003; Wang et al., 2006, 2009a). In addi-tion, biomass burning for cooking and heating is stillcommon in rural area of China, adding additional carbona-ceous particles into the atmosphere.
109J. Li et al. / Atmospheric Research 106 (2012) 108–119
A five-year satellite observation suggests that North ChinaPlain, Guanzhong Plain, and Sichuan Basin in China are thethree most heavily polluted regions in the world, where aver-aged annual PM2.5 on the ground surface are more than80 μg m−3 (van Donkelaar et al., 2010). Being differentfrom North China Plain and Sichuan Basin, Guanzhong Plainis a semi-arid region, where economic development level isrelatively lower. Therefore influence of anthropogenic pollut-ants on the air quality is expected to be different from that ineconomically developed regions like North China Plain.Mountain area is a receptor for anthropogenic aerosols origi-nating from lowlands by long-range transport, and thus char-acterizations of alpine organic aerosols can improve ourunderstanding the impact of anthropogenic activities on alarge-scale of atmospheric environment. Organic aerosols inChinese mega-cities have been given much attention, butcharacteristics of organic aerosols from Guanzhong Plainwere documented in a limited number (Wang et al., 2010;Xie et al., 2009, 2010) with no report for those in the atmo-sphere over alpine regions. An aerosol sampling campaignwas performed during the winter of 2008 at Mt. Hua inGuanzhong Plain, central China to investigate the propertiesof air pollution in the region. Here we first characterizedthe molecular composition and size distributions of organicaerosols in the Mt. Hua atmosphere, and then compared theobservation with those conducting at lowland sites to identi-fy the characters of air pollution over the mountain region.
2. Experiment
2.1. Sampling
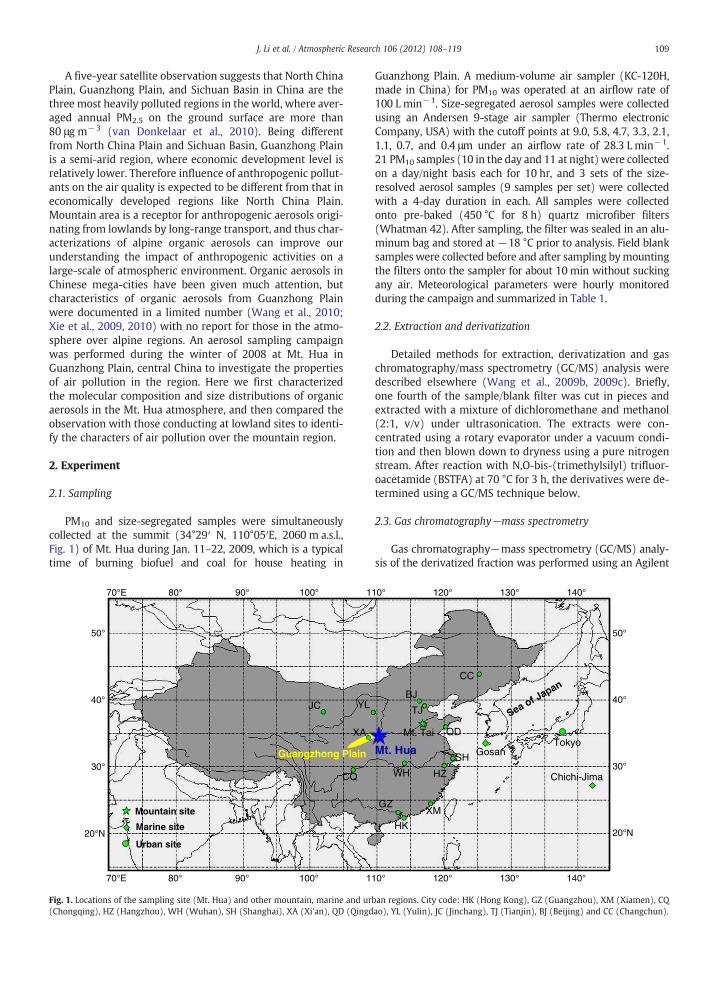
PM10 and size-segregated samples were simultaneouslycollected at the summit (34°29′ N, 110°05′E, 2060 m a.s.l.,Fig. 1) of Mt. Hua during Jan. 11–22, 2009, which is a typicaltime of burning biofuel and coal for house heating in
JC YL
CQ
180° 90° 100°70°E
180° 90° 100°70°E
40°
50°
20°N
30°
XA
Guangzhong Plain
Mountain site
Marine site
Urban site
Fig. 1. Locations of the sampling site (Mt. Hua) and other mountain, marine and ur(Chongqing), HZ (Hangzhou), WH (Wuhan), SH (Shanghai), XA (Xi'an), QD (Qingd
Guanzhong Plain. A medium-volume air sampler (KC-120H,made in China) for PM10 was operated at an airflow rate of100 L min−1. Size-segregated aerosol samples were collectedusing an Andersen 9-stage air sampler (Thermo electronicCompany, USA) with the cutoff points at 9.0, 5.8, 4.7, 3.3, 2.1,1.1, 0.7, and 0.4 μm under an airflow rate of 28.3 L min−1.21 PM10 samples (10 in the day and 11 at night) were collectedon a day/night basis each for 10 hr, and 3 sets of the size-resolved aerosol samples (9 samples per set) were collectedwith a 4-day duration in each. All samples were collectedonto pre-baked (450 °C for 8 h) quartz microfiber filters(Whatman 42). After sampling, the filter was sealed in an alu-minum bag and stored at −18 °C prior to analysis. Field blanksamples were collected before and after sampling bymountingthe filters onto the sampler for about 10 min without suckingany air. Meteorological parameters were hourly monitoredduring the campaign and summarized in Table 1.
2.2. Extraction and derivatization
Detailed methods for extraction, derivatization and gaschromatography/mass spectrometry (GC/MS) analysis weredescribed elsewhere (Wang et al., 2009b, 2009c). Briefly,one fourth of the sample/blank filter was cut in pieces andextracted with a mixture of dichloromethane and methanol(2:1, v/v) under ultrasonication. The extracts were con-centrated using a rotary evaporator under a vacuum condi-tion and then blown down to dryness using a pure nitrogenstream. After reaction with N,O-bis-(trimethylsilyl) trifluor-oacetamide (BSTFA) at 70 °C for 3 h, the derivatives were de-termined using a GC/MS technique below.
2.3. Gas chromatography−mass spectrometry
Gas chromatography−mass spectrometry (GC/MS) analy-sis of the derivatized fraction was performed using an Agilent
CC
BJ
TJ
Mt. Hua
Mt. Tai QD
WH
SH
HZ
GZ
HK
XM
10° 120° 130°
10° 120° 130°
40°
50°
20°N
30°
140°
140°
Sea of Japan
Gosan
Chichi-Jima
Tokyo
ban regions. City code: HK (Hong Kong), GZ (Guangzhou), XM (Xiamen), CQao), YL (Yulin), JC (Jinchang), TJ (Tianjin), BJ (Beijing) and CC (Changchun).
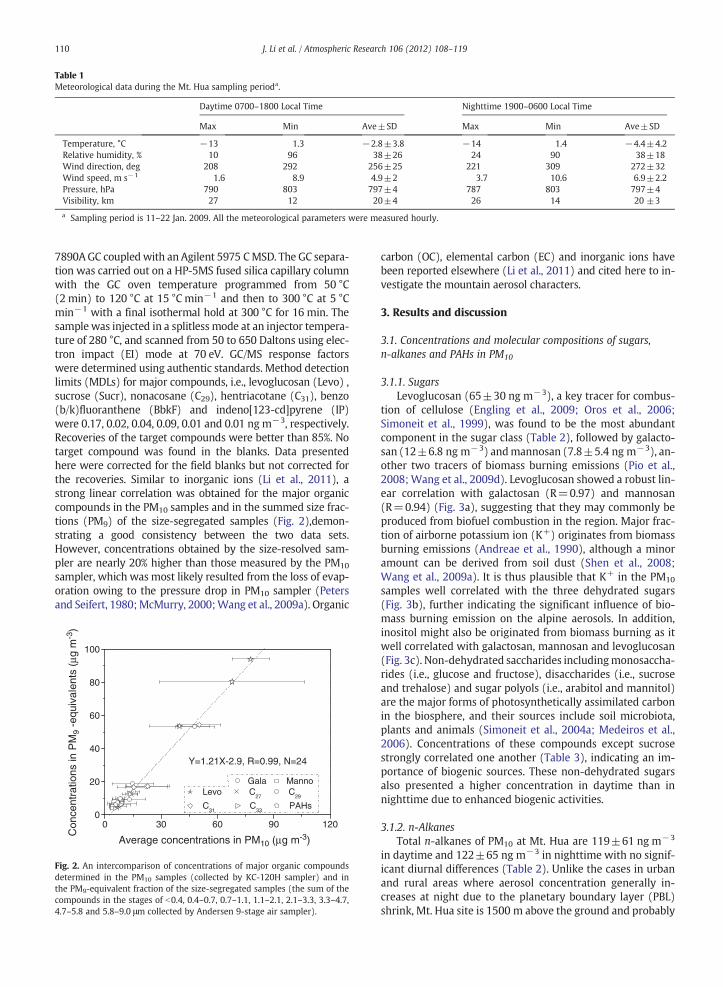
Table 1Meteorological data during the Mt. Hua sampling perioda.
Daytime 0700–1800 Local Time Nighttime 1900–0600 Local Time
Max Min Ave±SD Max Min Ave±SD
Temperature, °C −13 1.3 −2.8±3.8 −14 1.4 −4.4±4.2Relative humidity, % 10 96 38±26 24 90 38±18Wind direction, deg 208 292 256±25 221 309 272±32Wind speed, m s−1 1.6 8.9 4.9±2 3.7 10.6 6.9±2.2Pressure, hPa 790 803 797±4 787 803 797±4Visibility, km 27 12 20±4 26 14 20 ±3
a Sampling period is 11–22 Jan. 2009. All the meteorological parameters were measured hourly.
110 J. Li et al. / Atmospheric Research 106 (2012) 108–119
7890AGC coupledwith an Agilent 5975 CMSD. The GC separa-tion was carried out on a HP-5MS fused silica capillary columnwith the GC oven temperature programmed from 50 °C(2 min) to 120 °C at 15 °C min−1 and then to 300 °C at 5 °Cmin−1 with a final isothermal hold at 300 °C for 16 min. Thesample was injected in a splitless mode at an injector tempera-ture of 280 °C, and scanned from 50 to 650 Daltons using elec-tron impact (EI) mode at 70 eV. GC/MS response factorswere determined using authentic standards. Method detectionlimits (MDLs) for major compounds, i.e., levoglucosan (Levo) ,sucrose (Sucr), nonacosane (C29), hentriacotane (C31), benzo(b/k)fluoranthene (BbkF) and indeno[123-cd]pyrene (IP)were 0.17, 0.02, 0.04, 0.09, 0.01 and 0.01 ng m−3, respectively.Recoveries of the target compounds were better than 85%. Notarget compound was found in the blanks. Data presentedhere were corrected for the field blanks but not corrected forthe recoveries. Similar to inorganic ions (Li et al., 2011), astrong linear correlation was obtained for the major organiccompounds in the PM10 samples and in the summed size frac-tions (PM9) of the size-segregated samples (Fig. 2),demon-strating a good consistency between the two data sets.However, concentrations obtained by the size-resolved sam-pler are nearly 20% higher than those measured by the PM10
sampler, which was most likely resulted from the loss of evap-oration owing to the pressure drop in PM10 sampler (Petersand Seifert, 1980;McMurry, 2000;Wang et al., 2009a). Organic
0 30 60 90 1200
20
40
60
80
100
Average concentrations in PM10 (µg m-3)
Con
cent
ratio
ns in
PM
9 -e
quiv
alen
ts (
µg m
-3)
Y=1.21X-2.9, R=0.99, N=24
Gala Manno Levo C
27 C
29
C31
C33
PAHs
Fig. 2. An intercomparison of concentrations of major organic compoundsdetermined in the PM10 samples (collected by KC-120H sampler) and inthe PM9-equivalent fraction of the size-segregated samples (the sum of thecompounds in the stages of b0.4, 0.4–0.7, 0.7–1.1, 1.1–2.1, 2.1–3.3, 3.3–4.7,4.7–5.8 and 5.8–9.0 μm collected by Andersen 9-stage air sampler).
carbon (OC), elemental carbon (EC) and inorganic ions havebeen reported elsewhere (Li et al., 2011) and cited here to in-vestigate the mountain aerosol characters.
3. Results and discussion
3.1. Concentrations and molecular compositions of sugars,n-alkanes and PAHs in PM10
3.1.1. SugarsLevoglucosan (65±30 ng m−3), a key tracer for combus-
tion of cellulose (Engling et al., 2009; Oros et al., 2006;Simoneit et al., 1999), was found to be the most abundantcomponent in the sugar class (Table 2), followed by galacto-san (12±6.8 ng m−3) andmannosan (7.8±5.4 ng m−3), an-other two tracers of biomass burning emissions (Pio et al.,2008;Wang et al., 2009d). Levoglucosan showed a robust lin-ear correlation with galactosan (R=0.97) and mannosan(R=0.94) (Fig. 3a), suggesting that they may commonly beproduced from biofuel combustion in the region. Major frac-tion of airborne potassium ion (K+) originates from biomassburning emissions (Andreae et al., 1990), although a minoramount can be derived from soil dust (Shen et al., 2008;Wang et al., 2009a). It is thus plausible that K+ in the PM10
samples well correlated with the three dehydrated sugars(Fig. 3b), further indicating the significant influence of bio-mass burning emission on the alpine aerosols. In addition,inositol might also be originated from biomass burning as itwell correlated with galactosan, mannosan and levoglucosan(Fig. 3c). Non-dehydrated saccharides includingmonosaccha-rides (i.e., glucose and fructose), disaccharides (i.e., sucroseand trehalose) and sugar polyols (i.e., arabitol and mannitol)are the major forms of photosynthetically assimilated carbonin the biosphere, and their sources include soil microbiota,plants and animals (Simoneit et al., 2004a; Medeiros et al.,2006). Concentrations of these compounds except sucrosestrongly correlated one another (Table 3), indicating an im-portance of biogenic sources. These non-dehydrated sugarsalso presented a higher concentration in daytime than innighttime due to enhanced biogenic activities.
3.1.2. n-AlkanesTotal n-alkanes of PM10 at Mt. Hua are 119±61 ng m−3
in daytime and 122±65 ng m−3 in nighttime with no signif-icant diurnal differences (Table 2). Unlike the cases in urbanand rural areas where aerosol concentration generally in-creases at night due to the planetary boundary layer (PBL)shrink, Mt. Hua site is 1500 m above the ground and probably
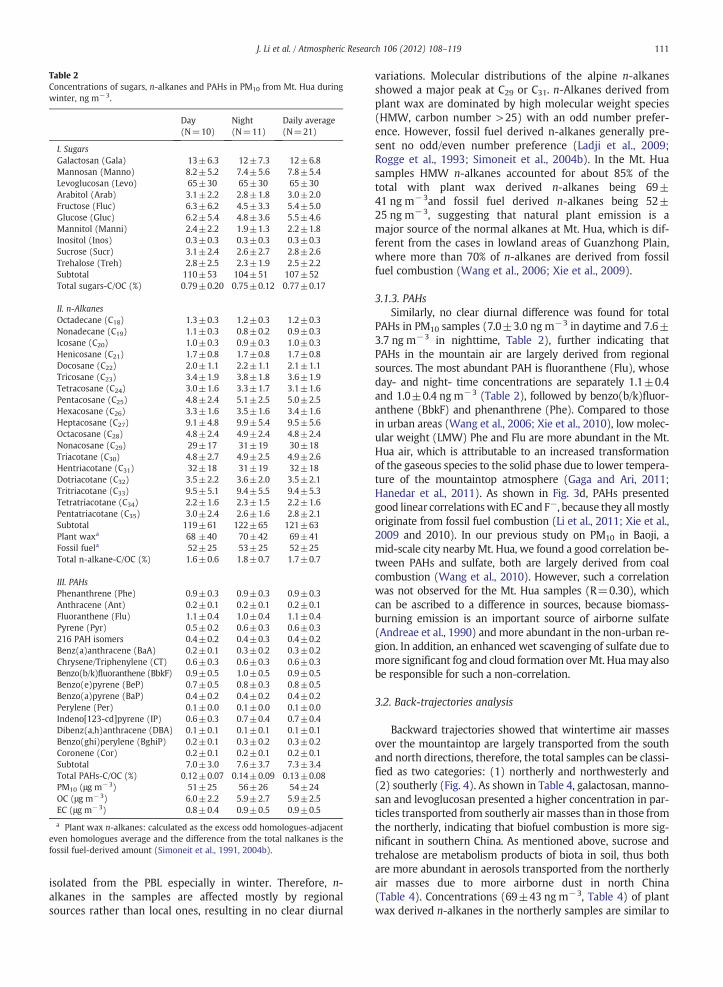
Table 2Concentrations of sugars, n-alkanes and PAHs in PM10 from Mt. Hua duringwinter, ng m−3.
Day(N=10)
Night(N=11)
Daily average(N=21)
I. SugarsGalactosan (Gala) 13±6.3 12±7.3 12±6.8Mannosan (Manno) 8.2±5.2 7.4±5.6 7.8±5.4Levoglucosan (Levo) 65±30 65±30 65±30Arabitol (Arab) 3.1±2.2 2.8±1.8 3.0±2.0Fructose (Fluc) 6.3±6.2 4.5±3.3 5.4±5.0Glucose (Gluc) 6.2±5.4 4.8±3.6 5.5±4.6Mannitol (Manni) 2.4±2.2 1.9±1.3 2.2±1.8Inositol (Inos) 0.3±0.3 0.3±0.3 0.3±0.3Sucrose (Sucr) 3.1±2.4 2.6±2.7 2.8±2.6Trehalose (Treh) 2.8±2.5 2.3±1.9 2.5±2.2Subtotal 110±53 104±51 107±52Total sugars-C/OC (%) 0.79±0.20 0.75±0.12 0.77±0.17
II. n-AlkanesOctadecane (C18) 1.3±0.3 1.2±0.3 1.2±0.3Nonadecane (C19) 1.1±0.3 0.8±0.2 0.9±0.3Icosane (C20) 1.0±0.3 0.9±0.3 1.0±0.3Henicosane (C21) 1.7±0.8 1.7±0.8 1.7±0.8Docosane (C22) 2.0±1.1 2.2±1.1 2.1±1.1Tricosane (C23) 3.4±1.9 3.8±1.8 3.6±1.9Tetracosane (C24) 3.0±1.6 3.3±1.7 3.1±1.6Pentacosane (C25) 4.8±2.4 5.1±2.5 5.0±2.5Hexacosane (C26) 3.3±1.6 3.5±1.6 3.4±1.6Heptacosane (C27) 9.1±4.8 9.9±5.4 9.5±5.6Octacosane (C28) 4.8±2.4 4.9±2.4 4.8±2.4Nonacosane (C29) 29±17 31±19 30±18Triacotane (C30) 4.8±2.7 4.9±2.5 4.9±2.6Hentriacotane (C31) 32±18 31±19 32±18Dotriacotane (C32) 3.5±2.2 3.6±2.0 3.5±2.1Tritriacotane (C33) 9.5±5.1 9.4±5.5 9.4±5.3Tetratriacotane (C34) 2.2±1.6 2.3±1.5 2.2±1.6Pentatriacotane (C35) 3.0±2.4 2.6±1.6 2.8±2.1Subtotal 119±61 122±65 121±63Plant waxa 68 ±40 70±42 69±41Fossil fuela 52±25 53±25 52±25Total n-alkane-C/OC (%) 1.6±0.6 1.8±0.7 1.7±0.7
III. PAHsPhenanthrene (Phe) 0.9±0.3 0.9±0.3 0.9±0.3Anthracene (Ant) 0.2±0.1 0.2±0.1 0.2±0.1Fluoranthene (Flu) 1.1±0.4 1.0±0.4 1.1±0.4Pyrene (Pyr) 0.5±0.2 0.6±0.3 0.6±0.3216 PAH isomers 0.4±0.2 0.4±0.3 0.4±0.2Benz(a)anthracene (BaA) 0.2±0.1 0.3±0.2 0.3±0.2Chrysene/Triphenylene (CT) 0.6±0.3 0.6±0.3 0.6±0.3Benzo(b/k)fluoranthene (BbkF) 0.9±0.5 1.0±0.5 0.9±0.5Benzo(e)pyrene (BeP) 0.7±0.5 0.8±0.3 0.8±0.5Benzo(a)pyrene (BaP) 0.4±0.2 0.4±0.2 0.4±0.2Perylene (Per) 0.1±0.0 0.1±0.0 0.1±0.0Indeno[123-cd]pyrene (IP) 0.6±0.3 0.7±0.4 0.7±0.4Dibenz(a,h)anthracene (DBA) 0.1±0.1 0.1±0.1 0.1±0.1Benzo(ghi)perylene (BghiP) 0.2±0.1 0.3±0.2 0.3±0.2Coronene (Cor) 0.2±0.1 0.2±0.1 0.2±0.1Subtotal 7.0±3.0 7.6±3.7 7.3±3.4Total PAHs-C/OC (%) 0.12±0.07 0.14±0.09 0.13±0.08PM10 (μg m−3) 51±25 56±26 54±24OC (μg m−3) 6.0±2.2 5.9±2.7 5.9±2.5EC (μg m−3) 0.8±0.4 0.9±0.5 0.9±0.5
a Plant wax n-alkanes: calculated as the excess odd homologues-adjacenteven homologues average and the difference from the total nalkanes is thefossil fuel-derived amount (Simoneit et al., 1991, 2004b).
111J. Li et al. / Atmospheric Research 106 (2012) 108–119
isolated from the PBL especially in winter. Therefore, n-alkanes in the samples are affected mostly by regionalsources rather than local ones, resulting in no clear diurnal
variations. Molecular distributions of the alpine n-alkanesshowed a major peak at C29 or C31. n-Alkanes derived fromplant wax are dominated by high molecular weight species(HMW, carbon number >25) with an odd number prefer-ence. However, fossil fuel derived n-alkanes generally pre-sent no odd/even number preference (Ladji et al., 2009;Rogge et al., 1993; Simoneit et al., 2004b). In the Mt. Huasamples HMW n-alkanes accounted for about 85% of thetotal with plant wax derived n-alkanes being 69±41 ng m−3and fossil fuel derived n-alkanes being 52±25 ng m−3, suggesting that natural plant emission is amajor source of the normal alkanes at Mt. Hua, which is dif-ferent from the cases in lowland areas of Guanzhong Plain,where more than 70% of n-alkanes are derived from fossilfuel combustion (Wang et al., 2006; Xie et al., 2009).
3.1.3. PAHsSimilarly, no clear diurnal difference was found for total
PAHs in PM10 samples (7.0±3.0 ng m−3 in daytime and 7.6±3.7 ng m−3 in nighttime, Table 2), further indicating thatPAHs in the mountain air are largely derived from regionalsources. The most abundant PAH is fluoranthene (Flu), whoseday- and night- time concentrations are separately 1.1±0.4and 1.0±0.4 ng m−3 (Table 2), followed by benzo(b/k)fluor-anthene (BbkF) and phenanthrene (Phe). Compared to thosein urban areas (Wang et al., 2006; Xie et al., 2010), low molec-ular weight (LMW) Phe and Flu are more abundant in the Mt.Hua air, which is attributable to an increased transformationof the gaseous species to the solid phase due to lower tempera-ture of the mountaintop atmosphere (Gaga and Ari, 2011;Hanedar et al., 2011). As shown in Fig. 3d, PAHs presentedgood linear correlationswith EC and F−, because they allmostlyoriginate from fossil fuel combustion (Li et al., 2011; Xie et al.,2009 and 2010). In our previous study on PM10 in Baoji, amid-scale city nearby Mt. Hua, we found a good correlation be-tween PAHs and sulfate, both are largely derived from coalcombustion (Wang et al., 2010). However, such a correlationwas not observed for the Mt. Hua samples (R=0.30), whichcan be ascribed to a difference in sources, because biomass-burning emission is an important source of airborne sulfate(Andreae et al., 1990) andmore abundant in the non-urban re-gion. In addition, an enhanced wet scavenging of sulfate due tomore significant fog and cloud formation overMt. Huamay alsobe responsible for such a non-correlation.
3.2. Back-trajectories analysis
Backward trajectories showed that wintertime air massesover the mountaintop are largely transported from the southand north directions, therefore, the total samples can be classi-fied as two categories: (1) northerly and northwesterly and(2) southerly (Fig. 4). As shown in Table 4, galactosan, manno-san and levoglucosan presented a higher concentration in par-ticles transported from southerly air masses than in those fromthe northerly, indicating that biofuel combustion is more sig-nificant in southern China. As mentioned above, sucrose andtrehalose are metabolism products of biota in soil, thus bothare more abundant in aerosols transported from the northerlyair masses due to more airborne dust in north China(Table 4). Concentrations (69±43 ngm−3, Table 4) of plantwax derived n-alkanes in the northerly samples are similar to

0
40
80
120
160
200
240
F-:Y=9.7X-9.8, R=0.86N=21
F-
(ng
m-3
)
0
10
20
30
Gal
a &
Man
no(n
g m
-3)
Levoglucosan (ng m-3)
Gala:Y=0.2X-2.1, R=0.97Manno:Y=0.2X-3.2, R=0.94N=21
0
40
80
120
160
0
10
20
30
40
50
60
Gal
a &
Man
no(n
g m
-3)
Levo
(ng
m-3
)
K+ (ng m-3)
Levo: Y=0.2X+17, R=0.90
N=21
Gala: Y=0.03X+1.5, R=0.89Manno:Y=0.02X-0.06, R=0.82
0
40
80
120
160
0
20
40
60
Levo
(ng
m-3
)
Gal
a &
Man
no(n
g m
-3)Levo: Y=100X+32, R=0.89
Inositol (ng m-3)
Gala:Y=22X+5, R=0.88Manno:Y=18X+2, R=0.89N=21
(a) (b)
(d)(c)
0 20 40 60 80 100 120 140 0 200 400 600 800
0.0 0.2 0.4 0.6 0.8 1.0 0 4 8 12 160.0
0.5
1.0
1.5
2.0
2.5
Total PAHs (ng m-3)
EC
(µg
m-3
)
EC:Y=0.1X+0.1, R=0.74
Fig. 3. Liner correlations between the measured species: (a) galactosan and mannosan vs levoglucosan (the typical biomass burning tracers); (b) organic tracersvs inorganic tracer (K+) of biomass burning; (c) organic tracers of biomass burning vs inositol; (d) inorganic tracers (EC and F−) vs organic tracers (total PAHs) offossil fuel combustion.
112 J. Li et al. / Atmospheric Research 106 (2012) 108–119
those (75±3.2 ng m−3) in the southerly. However, fossil fuelderived n-alkanes (82±11 ngm−3) in the southerly samplesare more abundant than in the northerly ones (49±24 ngm−3), together with a lower value of CPI (carbon prefer-ence index, odd-to-even, 2.8±0.3 for the southerly and 3.6±0.9 for the northerly), further suggesting more significant pol-lution due to fossil fuel combustion in southern China, whichis consistent with our previous reported results on SO4
2− andNO3
− (Li et al., 2011). Coal burning emission is themajor sourceof PAHs in the country as mentioned above, therefore, similarratios of IP/BghiP (2.6±0.4 for the northerly versus 2.9±0.1for the southerly, thereinafter) and BghiP/BeP (0.35±0.06 ver-sus 0.34±0.01) were observed for the southerly and northerlysamples.
3.3. Size distribution of sugars, n-alkanes and PAHs
3.3.1. SugarsTable 5 shows the concentrations and geometric mean
diameters (GMD) of sugars, n-alkanes and PAHs in fine
Table 3Correlation coefficients (R) of sugars in PM10 (N=21).
Arabitol Fructose Glucose Mannitol Sucrose Trehalose
Arabitol 1Fructose 0.85 1Glucose 0.85 0.99 1Mannitol 0.95 0.95 0.94 1Sucrose 0.45 0.45 0.46 0.49 1Trehalose 0.91 0.88 0.88 0.94 0.60 1
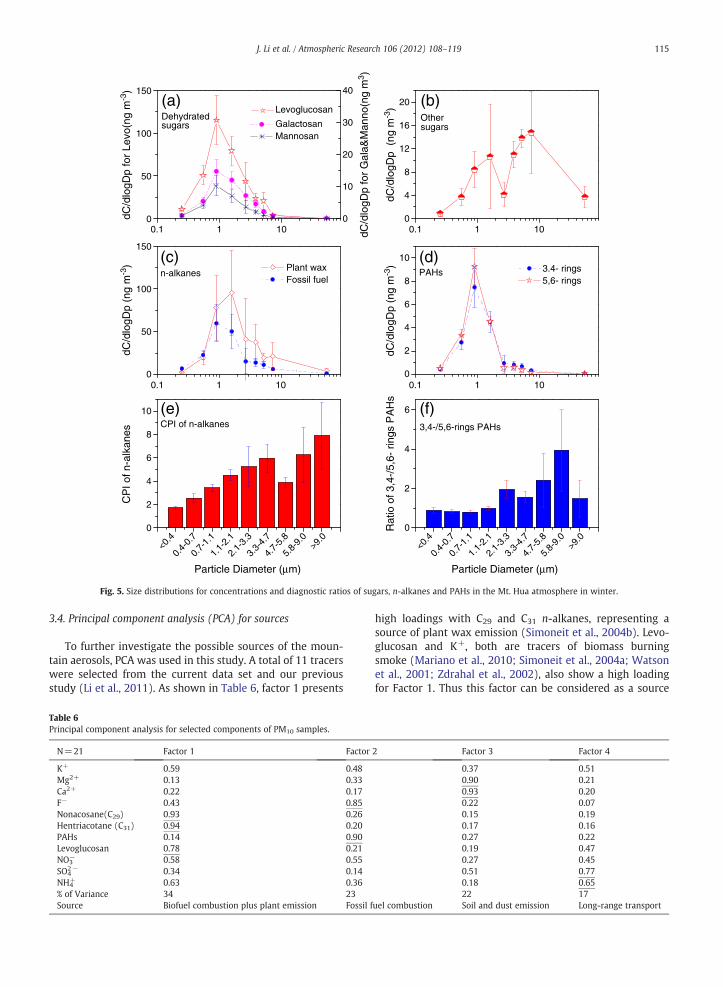
(b2.1 μm) and coarse (>2.1 μm) modes, while Fig. 5 plotstheir detailed distributions in each size range.
Levoglucosan, galactosan and mannosan presented aunimodal size distribution, peaking at the size of 0.7–1.1 μm(Fig. 5a). A similar pattern was also found for inositol andK+ (Li et al., 2011), again confirming those species are de-rived from biomass burning emissions. Such a unimodal dis-tribution was also obtained in Baoji, a city near Mt. Hua(Wang et al., 2011a), and Nanjing, a city located in east coast-al China (Wang et al., 2009d). Being different from thedehydrated sugars, non-dehydrated sugars like glucose andmannitol are characterized by a bimodal distribution patternwith two equivalent peaks at the ranges of 1.1–2.1 μm and5.8–9.0 μm, respectively (Fig. 5b). Coarse mode of these com-pounds is generally produced via mechanical processes suchas wind abrasion with plant surface and resuspension ofsoil, while fine mode of these sugars is derived from uncom-busted biomass materials. For example, Wang et al. (2011b)found that glycerol, a reduced sugar, is enriched in freshsmoke particles of wheat straw burning with a minor amountof glucose and mannitol and mostly stay in particles with adiameter less than 2 μm.
3.3.2. n-AlkanesAs shown in Table 5, both fossil fuel derived (35±
11 ngm−3) and plant wax derived n-alkanes (48±24 ngm−3) are enriched in fine mode, being 4 and 2 timesmore than those in coarse mode, respectively. Simoneit et al.(2004b) has reported that n-alkanes originated from plantwax presents an odd number preference, in contrast to thosederived from fossil fuel combustion, which have no odd/evencarbon number preference. Thus, carbon preference index
110°80° 90° 100° 120° 130°70°60°E
40°
50°
20°
30°
60°
10°N
40°
50°
20°
30°
60°
10°N110°80° 90° 100° 120° 130°70°60°E
Northerly
2009-1-11 24h~1-18 24h,and 1-20 12h~1-21 24hlocal time, 12 hrs interval
Southerly
2009-1-19 11h ~ 22h local time, 1 hr interval.
Mt.Hua
Fig. 4. Backward air mass trajectories passing over Mt. Hua (34°29′ N, 110°05′E, and the altitude were set as 2070 m above the mean sea level) in winter (I. Jan.11–18, and 20–21, 12 h interval; II. Jan. 19 and 22, 1 h interval).
113J. Li et al. / Atmospheric Research 106 (2012) 108–119
(CPI, odd/even) of n-alkanes has been employed to recognizethe contributions from different sources, as it is nearly unityand >5 for fossil fuel derived and plant wax derived n-alkanes, respectively (Simoneit et al., 2004b; Mazquiarán andde Pinedo, 2007). Carbon preference index (CPI, odd-to-even)in the coarse mode is 5.9±1.5 and much higher than that(3.5±0.5) in fine mode, indicating that n-alkanes in coarseparticles are of biogenic origins. GMD of plant wax derived n-
Table 4Concentrations (ng m−3) and diagnostic ratios of sugars, n-alkanes andPAHs in PM10 from northerly and southerly air masses.
Northerly(N=19)
Southerly(N=2)
S/N ratioa
I. SugarsGalactosan 11±5.4 26±2.2 2.4Mannosan 6.3±3.1 22±0.6 3.4Levoglucosan 59±24 125±2.5 2.1Sucrose 2.9±2.7 1.9±0.10 0.70Trehalose 2.6±2.3 1.8±0.39 0.67
II. n-alkanesTotal n-alkanes 118±65 157±7.6 1.3Plant wax 69±43 75±3.2 1.1Fossil fuel 49±24 82±11 1.7CPIb 3.6±0.9 2.8±0.31
III. PAHsTotal PAHs 7.3±3.5 7.8±2.1 1.1IP/BghiP 2.6±0.4 2.9±0.10BghiP/BeP 0.35±0.06 0.34±0.01BaP/BeP 0.48±0.10 0.51±0.05PM10 (μg m−3) 52±27 67±4.3 1.3OC (μg m−3) 5.6±2.3 9.6±0.6 1.7EC (μg m−3) 0.8±0.5 1.1±0.2 1.4
a Ratios of mean concentrations from southerly to northerly.b CPI, carbon prefence index for n-alkanes: (C19+C21+C23+C25+C27+
C29+C31+C33+C35)/(C18+C20+C22+C24+C26+C28+C30+C32+C34).
alkanes are 1.12±0.03 μm and 7.75±3.21 μm in fine andcoarse modes, respectively, larger than those originated fromfossil fuel (0.89±0.06 μm in fine mode and 6.40±2.15 μm incoarse mode, respectively, Table 5).
As can be seen in Fig. 5c, concentrations of plant wax de-rived n-alkanes in particles less than 1.1 μm are similar tothose of fossil fuel derived n-alkanes but more abundantthan fossil fuel derived n-alkanes in particles larger than1.1 μm. CPI values of n-alkanes in particles larger than2.1 μm ranged from 3.9 to 7.9 (Fig. 5e), further revealingthat n-alkanes in coarse particles are mostly originated fromnatural sources. In contrast, CPI values in particles less than2.1 μm decrease as a decrease in particle size with the smal-lest (CPI=1.7) found for the backup stage (particle with adiameterb0.4 μm) (Fig.5e), indicating that fossil fuel derivedn-alkanes are preferentially enriched in submicrometerparticles.
3.3.3. PAHsPAHs are 7.9±1.3 ng m−3 in fine mode and 0.8±
0.4 ng m−3 in coarse mode (Table 5). HMW BbkF and IP arethe dominant species in fine mode, whereas the mostabundant PAHs in coarse mode are LMW ones (e.g., Phe andFlu). As shown in Fig. 5d, both LMW (i.e., 3,4-ring) andHMW (i.e., 5,6-ring) PAHs displayed a unimodal pattern,maximizing at the size of 0.7–1.1 μm. Concentration ratiosof 3,4- ring PAHs to 5,6- ring PAHs are 0.8–1.0 in fine modeand 1.5–3.9 in coarse mode (Fig. 5f). LMW PAHs (i.e., 3,4-ring PAHs) in solid phase can evaporate into the air and sub-sequently adsorb/condense onto pre-existing particles due totheir volatile nature (Birgul et al., 2011; Offenberg and Baker,1999). Thus Phe and Flu move toward larger particles fasterthan HMW PAHs (e.g., 5,6- ring PAHs), resulting in relativelymore abundant Phe and Flu in coarse mode (Fig. 5f). GMD ofPAHs is 0.90±0.02 μm in fine mode, which is very close to

Table 5Concentrations (ng m−3), and geometric mean diameters (GMD, μm) of sugars, n-alkanes and PAHs in fine and coarse particles from Mt. Hua during winter.
N=3 Fine (b2.1 μm) Coarse (>2.1 μm)
Concentration GMDa Concentration GMDa
I. SugarsGalactosan (Gala) 8.3±1.8 0.95±0.03 2.1±1.1 4.71±1.35Mannosan (Manno) 5.5±1.4 0.90±0.04 1.1±0.5 4.81±1.47Levoglucosan (Levo) 64±14 0.87±0.03 12±5.8 4.41±1.18Arabitol (Arab) 0.6±0.2 0.87±0.06 2.0±0.6 10.66±1.19Fructose (Fluc) 1.4±0.7 0.85±0.07 2.3±1.1 14.55±0.89Glucose (Gluc) 2.8±1.9 0.94±0.19 2.6±1.2 14.36±1.18Mannitol (Manni) 0.6±0.6 0.98±0.24 1.3±0.3 10.68±1.31Inositol (Inos) 0.2±0.1 0.83±0.02 0.1±0.0 11.21±3.77Sucrose (Sucr) 0.3±0.2 0.85±0.04 0.9±0.4 14.88±1.76Trehalose (Treh) 0.2±0.1 1.06±0.06 1.2±0.6 10.24±1.8Subtotal 84±19 0.88±0.04 26±11 6.71±1.33
II. n-alkanesOctadecane (C18) 1.0±0.28 0.76±0.06 0.8±0.4 7.22±1.11Nonadecane (C19) 0.7±0.1 0.57±0.03 0.3±0.2 8.13±2.03Icosane (C20) 0.8±0.2 0.64±0.03 0.3±0.1 6.45±1.47Henicosane (C21) 1.6±0.5 0.76±0.05 0.3±0.2 6.14±1.78Docosane (C22) 2.0±0.7 0.84±0.04 0.3±0.2 5.62±1.67Tricosane (C23) 3.2±1.1 0.89±0.04 0.5±0.3 6.00±2.40Tetracosane (C24) 2.7±0.9 0.87±0.04 0.4±0.2 5.67±1.95Pentacosane (C25) 4.4±1.5 0.92±0.06 0.8±0.5 6.42±2.93Hexacosane (C26) 2.8±0.9 0.89±0.07 0.5±0.3 5.97±2.37Heptacosane (C27) 6.2±2.4 0.99±0.07 1.7±1.2 6.55±3.04Octacosane (C28) 2.7±0.9 0.93±0.08 0.6±0.4 6.11±2.14Nonacosane (C29) 22±10 1.10±0.03 9.5±7.2 6.82±2.76Triacotane (C30) 2.8±0.9 0.95±0.08 0.7±0.4 6.51±2.34Hentriacotane (C31) 20±10 1.13±0.03 12±9.2 8.31±3.32Dotriacotane (C32) 2.1±0.7 0.97±0.08 0.5±0.2 6.71±2.80Tritriacotane (C33) 5.8±2.6 1.08±0.04 2.3±1.6 9.18±3.85Tetratriacotane (C34) 1.2±0.4 0.99±0.04 0.3±0.2 7.03±2.33Pentatriacotane (C35) 2.1±0.9 1.00±0.14 0.6±0.3 7.15±2.73Subtotal 84±35 1.01±0.05 32±23 7.36±2.89Plant wax n-alkanesb 48±24 1.12±0.03 24±19 7.75±3.21Fossil fuel n-alkanesb 35±11 0.89±0.06 8.2±4.4 6.40±2.15
III. PAHsPhenanthrene (Phe) 0.76±0.24 0.93±0.03 0.17±0.07 6.31±1.6Anthracene (Ant) 0.08±0.02 0.87±0.02 0.03±0.01 6.86±1.06Fluoranthene (Flu) 0.89±0.22 0.93±0.03 0.14±0.07 5.46±1.48Pyrene (Pyr) 0.61±0.12 0.91±0.02 0.07±0.04 5.66±1.65216 PAH isomers 0.4±0.1 0.88±0.02 nd ndBenz(a)anthracene (BaA) 0.2±0.01 0.91±0.01 nd ndChrysene/Triphenylene (CT) 0.7±0.14 0.93±0.01 0.06±0.03 5.77±2.28Benzo(b/k)fluoranthene (BbkF) 1.21±0.19 0.89±0.02 0.12±0.07 6.84±1.03Benzo(e)pyrene (BeP) 1.0±0.2 0.9±0.01 0.1±0.0 5.66±1.65Benzo(a)pyrene (BaP) 0.46±0.04 0.91±0.02 nd ndPerylene (Per) 0.1±0.0 0.91±0.05 nd ndIndeno[123-cd]pyrene (IP) 0.92±0.12 0.89±0.03 0.05±0.04 5.32±1.97Dibenz(a,h)anthracene (DBA) 0.18±0.05 0.85±0.14 0.05±0.05 11.9±1.46Benzo(ghi)perylene (BghiP) 0.34±0.04 0.86±0.04 0.04±0.03 8.84±1.31Subtotal 7.9±1.3 0.90±0.02 0.8±0.4 6.44±1.35
a logGMD=(ΣCi log Dpi)/ ΣCi , where Ci is the concentration of compound in size i and Dpi is the geometric mean particle diameter collected on stage i (Hinds,1999).
b Plant wax n-alkanes: calculated as the excess odd homologues-adjacent even homologues average and the difference from the total nalkanes is the fossil fuel-derived amount (Simoneit et al., 1991, 2004b).
114 J. Li et al. / Atmospheric Research 106 (2012) 108–119
the value (0.89±0.06 μm, Table 5) of fossil fuel derived n-alkanes, suggesting a common source of fossil fuel combus-tion. Compared to those in Chinese urban areas like Baoji(Wang et al., 2009a) and Nanjing (Wang et al., 2009d),GMDs of PAHs in fine mode at Mt. Hua is about 8–20% larger.This is probably caused by a difference in sources, becausePAHs in the urban areas are mostly derived from fossilfuel combustion, which are of smaller sizes, whereas the
mountain PAHs are in part derived from rural biofuel burn-ing, which are of larger sizes (Wang et al., 2009d). Further-more, we found that the fine mode GMDs of PAHs at Mt.Hua is smaller than those (0.99±0.11 μm) observed at Mt.Tai in North China Plain during winter (Wang et al., 2009a),which can be ascribed to the more significant biomass burn-ing emission in the Mt. Tai region (Wang et al., 2011a), con-tributing more large size of PAH aerosols.
0
2
4
6
8
10
dC/d
logD
p (n
g m
-3) 3.4- rings
5,6- rings
0
2
4
6
8
10
CP
I of n
-alk
anes
Particle Diameter (µm) Particle Diameter (µm)
>9.0
5.8-
9.0
4.7-
5.8
3.3-
4.7
2.1-
3.3
1.1-
2.1
0.7-
1.1
0.4-
0.7
<0.4
0
2
4
6
Rat
io o
f 3,4
-/5,
6- r
ings
PA
Hs
>9.0
5.8-
9.0
4.7-
5.8
3.3-
4.7
2.1-
3.3
1.1-
2.1
0.7-
1.1
0.4-
0.7
<0.4
0
50
100
150
dC/d
logD
p (n
g m
-3) Plant wax
Fossil fuel
0
4
8
12
16
20
dC/d
logD
p (
ng m
-3)
0.1 1 100.1 1 10
0.1 1 100.1 1 100
50
100
150
0
10
20
30
40
dC/d
logD
p fo
r G
ala&
Man
no(n
g m
3 )
dC/d
logD
p fo
r Le
vo(n
g m
-3)
Levoglucosan
GalactosanMannosan
(a)Dehydratedsugars
(b)Othersugars
(c)n-alkanes
(d)PAHs
(e)CPI of n-alkanes
(f)3,4-/5,6-rings PAHs
Fig. 5. Size distributions for concentrations and diagnostic ratios of sugars, n-alkanes and PAHs in the Mt. Hua atmosphere in winter.
115J. Li et al. / Atmospheric Research 106 (2012) 108–119
3.4. Principal component analysis (PCA) for sources
To further investigate the possible sources of the moun-tain aerosols, PCA was used in this study. A total of 11 tracerswere selected from the current data set and our previousstudy (Li et al., 2011). As shown in Table 6, factor 1 presents
Table 6Principal component analysis for selected components of PM10 samples.
N=21 Factor 1 Factor
K+ 0.59 0.48Mg2+ 0.13 0.33Ca2+ 0.22 0.17F− 0.43 0.85Nonacosane(C29) 0.93 0.26Hentriacotane (C31) 0.94 0.20PAHs 0.14 0.90Levoglucosan 0.78 0.21NO3
− 0.58 0.55SO4
2− 0.34 0.14NH4
+ 0.63 0.36% of Variance 34 23Source Biofuel combustion plus plant emission Fossil f
high loadings with C29 and C31 n-alkanes, representing asource of plant wax emission (Simoneit et al., 2004b). Levo-glucosan and K+, both are tracers of biomass burningsmoke (Mariano et al., 2010; Simoneit et al., 2004a; Watsonet al., 2001; Zdrahal et al., 2002), also show a high loadingfor Factor 1. Thus this factor can be considered as a source
2 Factor 3 Factor 4
0.37 0.510.90 0.210.93 0.200.22 0.070.15 0.190.17 0.160.27 0.220.19 0.470.27 0.450.51 0.770.18 0.6522 17
uel combustion Soil and dust emission Long-range transport
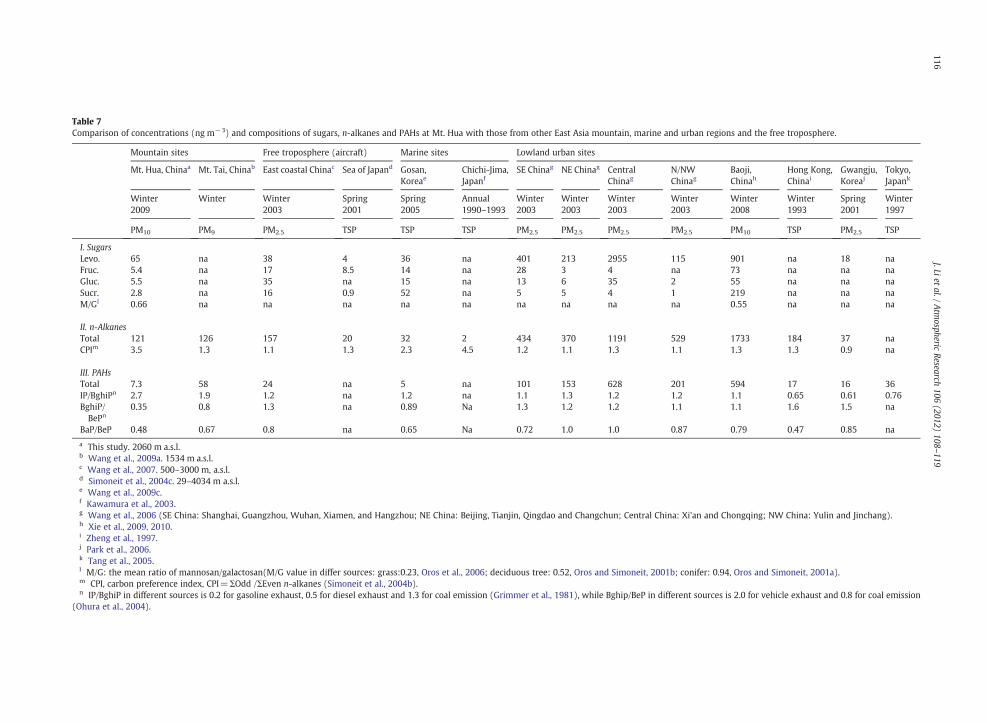
Table 7Comparison of concentrations (ng m−3) and compositions of sugars, n-alkanes and PAHs at Mt. Hua with those from other East Asia mountain, marine and urban regions and the free troposphere.
Mountain sites Free troposphere (aircraft) Marine sites Lowland urban sites
Mt. Hua, Chinaa Mt. Tai, Chinab East coastal Chinac Sea of Japand Gosan,Koreae
Chichi-Jima,Japanf
SE Chinag NE Chinag CentralChinag
N/NWChinag
Baoji,Chinah
Hong Kong,Chinai
Gwangju,Koreaj
Tokyo,Japank
Winter2009
Winter Winter2003
Spring2001
Spring2005
Annual1990–1993
Winter2003
Winter2003
Winter2003
Winter2003
Winter2008
Winter1993
Spring2001
Winter1997
PM10 PM9 PM2.5 TSP TSP TSP PM2.5 PM2.5 PM2.5 PM2.5 PM10 TSP PM2.5 TSP
I. SugarsLevo. 65 na 38 4 36 na 401 213 2955 115 901 na 18 naFruc. 5.4 na 17 8.5 14 na 28 3 4 na 73 na na naGluc. 5.5 na 35 na 15 na 13 6 35 2 55 na na naSucr. 2.8 na 16 0.9 52 na 5 5 4 1 219 na na naM/Gl 0.66 na na na na na na na na na 0.55 na na na
II. n-AlkanesTotal 121 126 157 20 32 2 434 370 1191 529 1733 184 37 naCPIm 3.5 1.3 1.1 1.3 2.3 4.5 1.2 1.1 1.3 1.1 1.3 1.3 0.9 na
III. PAHsTotal 7.3 58 24 na 5 na 101 153 628 201 594 17 16 36IP/BghiPn 2.7 1.9 1.2 na 1.2 na 1.1 1.3 1.2 1.2 1.1 0.65 0.61 0.76BghiP/BePn
0.35 0.8 1.3 na 0.89 Na 1.3 1.2 1.2 1.1 1.1 1.6 1.5 na
BaP/BeP 0.48 0.67 0.8 na 0.65 Na 0.72 1.0 1.0 0.87 0.79 0.47 0.85 na
a This study. 2060 m a.s.l.b Wang et al., 2009a. 1534 m a.s.l.c Wang et al., 2007. 500–3000 m, a.s.l.d Simoneit et al., 2004c. 29–4034 m a.s.l.e Wang et al., 2009c.f Kawamura et al., 2003.g Wang et al., 2006 (SE China: Shanghai, Guangzhou, Wuhan, Xiamen, and Hangzhou; NE China: Beijing, Tianjin, Qingdao and Changchun; Central China: Xi'an and Chongqing; NW China: Yulin and Jinchang).h Xie et al., 2009, 2010.i Zheng et al., 1997.j Park et al., 2006.k Tang et al., 2005.l M/G: the mean ratio of mannosan/galactosan(M/G value in differ sources: grass:0.23, Oros et al., 2006; deciduous tree: 0.52, Oros and Simoneit, 2001b; conifer: 0.94, Oros and Simoneit, 2001a).m CPI, carbon preference index, CPI=ΣOdd /ΣEven n-alkanes (Simoneit et al., 2004b).n IP/BghiP in different sources is 0.2 for gasoline exhaust, 0.5 for diesel exhaust and 1.3 for coal emission (Grimmer et al., 1981), while Bghip/BeP in different sources is 2.0 for vehicle exhaust and 0.8 for coal emission
(Ohura et al., 2004).
116J.Liet
al./Atm
osphericResearch
106(2012)
108–119
117J. Li et al. / Atmospheric Research 106 (2012) 108–119
of biomass burning plus plant emission. Factor 2 is dominat-ed by F− and PAHs, and representative of fossil fuel combus-tion. Factor 3 well correlates with crustal matters (e.g., Ca2+
and Mg2+), therefore, is indicative of soil and dust emission.Since factor 4 shows strong correlation with sulfate and am-monium and a relatively weaker correlation with K+, PAHsand levoglucosan, here we think it represents a long-rangetransport. As seen in Table 6, biofuel combustion plus plantemission is the most important source of the mountain aero-sols, accounting for 34% of the total variance, followed by fos-sil fuel combustion, soil and dust emission and long-rangetransport, explaining 23%, 22% and 17% of the variance,respectively.
3.5. Comparison with data from other urban, mountain, marineand aircraft observations
To obtain a panorama of organic aerosols over East Asia,here we compare the compositions of sugars, n-alkanes andPAHs at Mt. Hua with those data acquired from other urban,mountain, marine and aircraft measurements conducted inEast Asia (see Table 7). Levoglucosan is detectable at all siteswith a range from 4 ngm−3 in Japan Sea to 2955 ng m−3 incentral China, indicating an ubiquity of biomass burningemission in this region. Levoglucosan is abundant in allChinese cities (115–2955 ng m−3), suggesting that pollutioncaused by biomass burning in the country cannot be neglectedsince much effort has been concentrated in reducing emissionsfrom coal combustion. Mean ratio of mannosan to galactosan(M/G) in the Mt. Hua PM10 samples was 0.66, indicating thatmore deciduous trees (M/G=0.52, Oros and Simoneit,2001b) rather than conifer trees (0.94, Oros and Simoneit,2001a) and grass (0.23, Oros et al., 2006) are burned for cook-ing and heating in Guanzhong Plain, which is consist with theprevious study at Baoji (M/G=0.55) (Xie et al., 2010), amiddlescale city near Mt. Hua. Sugars derived from soil microorgan-isms (e.g. fructose, glucose and sucrose) are 0.9–219 ng m−3
at all the sites, indicating that wintertime dust emission inEast Asia is also significant.
Concentrations of n-alkanes in Chinese inland cities are 4–40 times higher than other developed cities (e.g., Hong Kong,China, Gwangju, South Korea and Tokyo, Japan, Table 7) withCPI close to unity, demonstrating a high level of anthropo-genic pollution in these developing areas. n-Alkanes at Mt.Hua (121 ng m−3, Table 7) and Mt. Tai (126 ng m−3) aresimilar to those (157 ng m−3) measured over east coastalChina by aircraft, revealing a homogeneous distribution inthe free troposphere from the central to the east coastal.However, compared to the CPI (3.5, Table 7) of n-alkanes atMt. Hua, the much lower CPI (1.3 at Mt. Tai and 1.1 overeast coastal China, Table 7) in the free troposphere over theeast coastal region indicates more significant pollution fromfossil fuel emissions. CPI of n-alkanes in all the cities are inthe range of 0.9–1.3, revealing a predominance of fossil fuelemission in urban area of East Asia. In general, n-alkaneswith a CPI more than 5 are considered as plant wax(Simoneit et al., 2004b; Mazquiarán and de Pinedo, 2007),thus the CPI values of 2.3 (Table 7) at Jeju Island, Korea and4.5 (Table 7) at Chichi-jima Japan may suggest that primaryorganic pollutants emitted from fossil fuel combustion are
abundant in marine region near the Asia continent but al-most disappear in remote marine area.
Similar to n-alkanes, concentrations of PAHs are muchhigher in Chinese inland cities than in other urban areas.Moreover, PAHs at Mt. Tai are nearly one order of magnitudehigher than those at Mt. Hua, again confirming an enhancedanthropogenic pollution in east China, which is consistentwith satellite observations (Wittrock et al., 2006; vanDonkelaar et al., 2010). Grimmer et al. (1981) reportedthat diagnostic ratios of IP/BghiP are 0.2, 0.5, and 1.3 in thesmokes from gasoline, diesel, and coal combustions, respec-tively. Ohura et al. (2004) further reported that BghiP/BeP is2.0 and 0.8 in emissions from vehicle exhaust and coal burn-ing. These ratios are cited here to investigate PAH sources. IP/BghiP ratios are 1.1–1.3 in Chinese cities and 2.7 at Mt. Hua,which suggests that coal-burning emission is the majorsource especially in inland China. In contrast, IP/BghiP ratiosin Hong Kong (China), Gwangju (Korea) and Tokyo (Japan)are 0.65, 0.61 and 0.76, respectively, which indicates that ve-hicle exhaust is the major source. Same results can also beobtained by comparing the BghiP/BeP ratios. Such a spatialdistribution pattern of PAH compositions over East Asia fur-ther confirmed our previous conclusion that PAHs in Chinaare mostly derived from coal combustion while those inother developed countries are largely originated from vehicleexhausts (Wang et al., 2006, 2007, 2009a, 2009c).
BaP is labile to photochemical degradation while itsisomer BeP is much stable, thus the ratio of BaP/BeP can bethought as an indicator of aerosol ageing (Wang et al.,2009c; Xie et al., 2009). As shown in Table 7, BaP/BeP inHong Kong is the lowest among all Chinese urban sites, sug-gesting aerosols are more aged in Hong Kong. In inlandChina, BaP/BeP increased from 0.72 in the southeast citiesto 1.0 in the northeast cities, suggesting that photochemicaldegradation of aerosols is stronger in southern China thanin northern China, most likely due to a difference in winter-time temperature. Furthermore, the ratio showed an increas-ing trend with a decrease in altitude, ranging from 0.48 atMt. Hua (2060 m, a.s.l.), 0.67 at Mt. Tai (1545 m, a.s.l.) to1.0 in central Chinese cities (b500 m, a.s.l.), suggesting an en-hanced photochemical oxidation in the free troposphere.
4. Summary and Conclusion
Wintertime PM10 and size-resolved samples in Mt. Hua,central China were determined for sugars, n-alkanes and PAHson a molecular level. Levoglucosan (65±30 ngm−3) in PM10
samples was the most abundant species among the sugarclass, followed by galactosan (12±6.8 ng m−3) andmannosan(7.8±5.4 ng m−3). n-Alkanes in PM10 was 121±63 ngm−3
with C31 (32±18 ng m−3) and C29 (30±18 ng m−3) beingthe most abundant congeners, and characterized by a CPI of3.5 with about 40% of the total from fossil fuel combustions.PAHs in the samples was 7.3±3.4 ng m−3 with Flu (1.1±0.4 ng m−3) and BbkF (0.9±0.5 ng m−3) being the highestspecies. These organics are 1–2 orders of magnitude lowerthan those in urban areas in central China. Levoglucosan andfossil fuel derived n-alkanes are more abundant in the airmasses from southern China than in those from northernChina, although such a spatial difference was not found forPAHs, suggesting that emissions from biomass burning and
118 J. Li et al. / Atmospheric Research 106 (2012) 108–119
vehicle exhausts are more significant in southern part of thecountry. Size distributions showed that combustion derived or-ganics suchas dehydrated sugars, fossil fuel n-alkanes and PAHspresented a unimodal pattern, peaking at 0.7–1.1 μm, whilenon-dehydrated sugars (e.g., glucose, mannitol and sucrose)and plant wax derived n-alkanes displayed a bimodal pattern,peaking at 0.7–2.1 and 5.8–9.0 μm ranges.
PCA analysis indicates that biomass burning plus plantemission is the major source of wintertime airborne particlesat Mt. Hua, followed by fossil fuel combustion, soil and dustemission and long-range transport, which is different fromthe cases in inland urban areas where fossil fuel combustionis the most important source. Molecular compositions dem-onstrate that coal burning is still the major source of PAHsin the country, although vehicle number has sharply in-creased recently. Diagnostic ratios of PAHs further indicatethat photo-oxidation of aerosols was more significant in thetropospheres of Mt. Hua and Mt. Tai compared to those inlowland urban areas.
Acknowledgements
This work was financially supported by China Natural Sci-ence Foundation (No. 40873083) and the Knowledge Innova-tion Program of Chinese Academy of Sciences (No. kzcx2-yw-148).
References
Andreae, M.O., Talbot, R.W., Berresheim, H., Beecher, K.M., 1990. Pricipitationchemistry in central Amazonia. J. Geophys. Res. Atmos. 95, 16987–16999.
Birgul, A., Tasdemir, Y., Cindoruk, S.S., 2011. Atmospheric wet and dry depo-sition of polycyclic aromatic hydrocarbons (PAHs) determined using amodified sampler. Atmos. Res. 101, 341–353.
Engling, G., Lee, J.J., Tsai, Y.W., Lung, S.C.C., Chou, C.C.K., Chan, C.Y., 2009.Size-resolved anhydrosugar composition in smoke aerosol from con-trolled field burning of rice straw. Aerosol Sci. Technol. 43, 662–672.
Gaga, E.O., Ari, A., 2011. Gas-particle partitioning of polycyclic aromatic hy-drocarbons (PAHs) in an urban traffic site in Eskisehir, Turkey. Atmos.Res. 99, 207–216.
Grimmer, G., Jacob, J., Naujack, K.W., Dettbarn, G., 1981. Profile of the polycy-clic aromatic hydrocarbons from used engine oil — inventory by GC GC/MS — PAH in environmental materials, Part 2. Fresenius Z. Anal. Chem.309, 13–19.
Hanedar, A., Alp, K., Kaynak, B., Baek, J., Avsar, E., Odman, M.T., 2011. Concen-trations and sources of PAHs at three stations in Istanbul, Turkey. Atmos.Res. 99, 391–399.
Hinds, W.C., 1999. Aerosol Technology: Properties, Behavior, and Measure-ment of Airborne Particles. John Wiley and Sons, New York.
Huebert, B.J., Bates, T., Russell, P.B., Shi, G.Y., Kim, Y.J., Kawamura, K., Carmi-chael, G., Nakajima, T., 2003. An overview of ACE-Asia: Strategies forquantifying the relationships between Asian aerosols and their climaticimpacts. J. Geophys. Res.-Atmos. 108, D23. doi:10.1029/2003jd003550.
Kawamura, K., Ishimura, Y., Yamazaki, K., 2003. Four years' observations ofterrestrial lipid class compounds in marine aerosols from the westernNorth Pacific. Global Biogeochem. Cycles 17. doi:10.1029/2001GB001810.
Ladji, R., Yassaa, N., Balducci, C., Cecinato, A., Meklati, B.Y., 2009. Annual var-iation of particulate organic compounds in PM(10) in the urban atmo-sphere of Algiers. Atmos. Res. 92, 258–269.
Li, J.J., Wang, G.H., Zhou, B.H., Cheng, C.L., Cao, J.J., Shen, Z.X., An, Z.S., 2011.Chemical composition and size distribution of wintertime aerosols inthe atmosphere of Mt. Hua in central China. Atmos. Environ. 45,1251–1258.
Mariano, G.L., Lopes, F.J.S., Jorge, M., Landulfo, E., 2010. Assessment of bio-mass burnings activity with the synergy of sunphotometric and LIDARmeasurements in Sao Paulo, Brazil. Atmos. Res. 98, 486–499.
Mazquiarán, M.A.B., de Pinedo, L.C.O., 2007. Organic composition of atmo-spheric urban aerosol: Variations and sources of aliphatic and polycyclicaromatic hydrocarbons. Atmos. Res. 85, 288–299.
McMurry, P.H., 2000. A review of atmospheric aerosol measurements.Atmos. Environ. 34, 1959–1999.
Medeiros, P.M., Conte, M.H., Weber, J.C., Simoneit, B.R.T., 2006. Sugars assource indicators of biogenic organic carbon in aerosols collectedabove the Howland Experimental Forest, Maine. Atmos. Environ. 40,1694–1705.
Menon, S., Hansen, J., Nazarenko, L., Luo, Y., 2002. Climate effects of blackcarbon aerosols in China and India. Science 297, 2250–2253.
Offenberg, J.H., Baker, J.E., 1999. Aerosol size distributions of polycyclic aro-matic hydrocarbons in urban and over water atmospheres. Environ.Sci. Technol. 33, 3324–3331.
Ohura, T., Amagai, T., Fusaya, M., Matsushita, H., 2004. Polycyclic aromatichydrocarbons in indoor and outdoor environments and factors affectingtheir concentrations. Environ. Sci. Technol. 38, 77–83.
Oros, D.R., Simoneit, B.R.T., 2001a. Identification and emission factors of mo-lecular tracers in organic aerosols from biomass burning Part 1. Temper-ate climate conifers. Appl. Geochem. 16, 1513–1544.
Oros, D.R., Simoneit, B.R.T., 2001b. Identification and emission factors of mo-lecular tracers in organic aerosols from biomass burning Part 2. Decidu-ous trees. Appl. Geochem. 16, 1545–1565.
Oros, D.R., bin Abas, M.R., Omar, N., Rahman, N.A., Simoneit, B.R.T., 2006.Identification and emission factors of molecular tracers in organic aero-sols from biomass burning: Part 3. Grasses. Appl. Geochem. 21, 919–940.
Park, S.S., Bae, M.S., Schauer, J.J., Kim, Y.J., Cho, S.Y., Kim, S.J., 2006. Molecularcomposition of PM2.5 organic aerosol measured at an urban site ofKorea during the ACE-Asia campaign. Atmos. Environ. 40, 4182–4198.
Peters, J., Seifert, B., 1980. Losses of benzo(a)pyrene under the conditions ofhigh-volume sampling. Atmos. Environ. 14, 117–119.
Pio, C.A., Legrand, M., Alves, C.A., Oliveira, T., Afonso, J., Caseiro, A., Puxbaum,H., Sanchez-Ochoa, A., Gelencser, A., 2008. Chemical composition of at-mospheric aerosols during the 2003 summer intense forest fire period.Atmos. Environ. 42, 7530–7543.
Rogge, W.F., Hildemann, L.M., Mazurek, M.A., Cass, G.R., Simoneit, B.R.T.,1993. Sources of fine organic aerosol. 4. Particulate abrasion productsfrom leaf surfaces of urban plants. Environ. Sci. Technol. 27, 2700–2711.
Rosenfeld, D., Dai, J., Yu, X., Yao, Z.Y., Xu, X.H., Yang, X., Du, C.L., 2007. Inverserelations between amounts of air pollution and orographic precipitation.Science 315, 1396–1398.
Shen, Z.X., Arimoto, R., Cao, J.J., Zhang, R.J., Li, X.X., Du, N., Okuda, T., Nakao, S.,Tanaka, S., 2008. Seasonal variations and evidence for the effectivenessof pollution controls on water-soluble inorganic species in total sus-pended particulates and fine particulate matter from Xi'an, China. J. AirWaste Manage. Assoc. 58, 1560–1570.
Simoneit, B.R.T., Sheng, G.Y., Chen, X.J., Fu, J.M., Zhang, J., Xu, Y.P., 1991. Mo-lecular marker study of extractable organic matter in aerosols fromurban areas of China. Atmos. Environ. Part A 25, 2111–2129.
Simoneit, B.R.T., Schauer, J.J., Nolte, C.G., Oros, D.R., Elias, V.O., Fraser, M.P.,Rogge, W.F., Cass, G.R., 1999. Levoglucosan, a tracer for cellulose in bio-mass burning and atmospheric particles. Atmos. Environ. 33, 173–182.
Simoneit, B.R.T., Elias, V.O., Kobayashi, M., Kawamura, K., Rushdi, A.I., Medei-ros, P.M., Rogge, W.F., Didyk, B.M., 2004a. Sugars-Dominant water-soluble organic compounds in soils and characterization as tracers in at-mospheric particulate matter. Environ. Sci. Technol. 38, 5939–5949.
Simoneit, B.R.T., Kobayashi, M., Mochida, M., Kawamura, K., Lee, M., Lim, H.J.,Turpin, B.J., Komazaki, Y., 2004b. Composition and major sources of or-ganic compounds of aerosol particulate matter sampled during theACE-Asia campaign. J. Geophys. Res.-Atmos. 109, D19s10. doi:10.1029/2004jd004598.
Simoneit, B.R.T., Kobayashi, M., Mochida, M., Kawamura, K., Huebert, B.J.,2004c. Aerosol particles collected on aircraft flights over the northwest-ern Pacific region during the ACE-Asia campaign: Composition andmajor sources of the organic compounds. J. Geophys. Res.-Atmos. 109,D19. doi:10.1029/2004jd004565.
Tang, N., Hattori, T., Taga, R., Igarashi, K., Yang, X.Y., Tamura, K., Kakimoto, H.,Mishukov, V.F., Toriba, A., Kizu, R., Hayakawa, K., 2005. Polycyclic aro-matic hydrocarbons and nitropolycyclic aromatic hydrocarbons inurban air particulates and their relationship to emission sources in thePan-Japan Sea countries. Atmos. Environ. 39, 5817–5826.
van Donkelaar, A., Martin, R.V., Brauer, M., Kahn, R., Levy, R., Verduzco, C.,Villeneuve, P.J., 2010. Global estimates of ambient fine particulate mat-ter concentrations from satellite-based aerosol optical depth: Develop-ment and application. Environ. Heal. Perspect. 118, 847–855.
Wang, G.H., Kawamura, K., Lee, S., Ho, K.F., Cao, J.J., 2006. Molecular, season-al, and spatial distributions of organic aerosols from fourteen Chinesecities. Environ. Sci. Technol. 40, 4619–4625.
Wang, G.H., Kawamura, K., Hatakeyama, S., Takami, A., Li, H., Wang, W.,2007. Aircraft measurement of organic aerosols over China. Environ.Sci. Technol. 41, 3115–3120.
Wang, G., Kawamura, K., Xie, M., Hu, S., Gao, S., Cao, J., An, Z., Wang, Z., 2009a.Size-distributions of n-alkanes, PAHs and hopanes and their sources in
119J. Li et al. / Atmospheric Research 106 (2012) 108–119
the urban, mountain and marine atmospheres over East Asia. Atmos.Chem. Phys. 9, 8869–8882.
Wang, G.H., Kawamura, K., Umemoto, N., Xie, M.J., Hu, S.Y., Wang, Z.F.,2009b. Water-soluble organic compounds in PM2.5 and size-segregated aerosols over Mount Tai in North China Plain. J. Geophys.Res.-Atmos. 114, D19208. doi:10.1029/2008jd011390.
Wang, G.H., Kawamura, K., Lee, M., 2009c. Comparison of organic composi-tions in dust storm and normal aerosol samples collected at Gosan,Jeju Island, during spring 2005. Atmos. Environ. 43, 219–227.
Wang, G.H., Kawamura, K., Xie, M.J., Hu, S.Y., Cao, J.J., An, Z.S., Waston, J.G.,Chow, J.C., 2009d. Organic Molecular Compositions and Size Distribu-tions of Chinese Summer and Autumn Aerosols from Nanjing: Charac-teristic Haze Event Caused by Wheat Straw Burning. Environ. Sci.Technol. 43, 6493–6499.
Wang, G., Xie, M., Hu, S., Gao, S., Tachibana, E., Kawamura, K., 2010. Dicar-boxylic acids, metals and isotopic compositions of C and N in atmospher-ic aerosols from inland China: implications for dust and coal burningemission and secondary aerosol formation. Atmos. Chem. Phys. 10,6087–6096.
Wang, G.H., Kawamura, K., Xie, M.J., Hu, S.Y., Li, J.J., Zhou, B.H., Cao, J.J., An, Z.S., 2011a. Selected water-soluble organic compounds found in sized-resolved aerosols collected from urban, mountain, and marine atmo-spheres over East Asia. Tellus B 63, 371–381.
Wang, G.H., Cheng, C.L., Li, J.J., Zhou, B.H., Xie, M.J., Hu, S.Y., Kawamura, K.,Chen, Y., 2011b. Molecular composition and size distribution of sugars,
sugar-alcohols and carboxylic acids in airborne particles during a severeurban haze event caused by wheat straw burning. Atmos. Environ. 45,2473–2479.
Watson, J.G., Chow, J.C., Houck, J.E., 2001. PM2.5 chemical source profiles forvehicle exhaust, vegetative burning, geological material, and coal burn-ing in Northwestern Colorado during 1995. Chemosphere 43,1141–1151.
Wittrock, F., Richter, A., Oetjen, H., Burrows, J.P., Kanakidou, M., Myriokefali-takis, S., Volkamer, R., Beirle, S., Platt, U., Wagner, T., 2006. Simultaneousglobal observations of glyoxal and formaldehyde from space. Geophys.Res. Lett. 33, L16804. doi:10.1029/2006GL026310.
Xie, M.J., Wang, G.H., Hu, S.Y., Han, Q.Y., Xu, Y.J., Gao, Z.C., 2009. Aliphatic al-kanes and polycyclic aromatic hydrocarbons in atmospheric PM10 aero-sols from Baoji, China: Implications for coal burning. Atmos. Res. 93,840–848.
Xie, M., Wang, G., Hu, S., Gao, S., Han, Q., Xu, Y., Feng, J., 2010. Polar organicand inorganic markers in PM10 aerosols from an inland city of China -seasonal trends and sources. Sci. Total. Environ. 408, 5452–5460.
Zdrahal, Z., Oliveira, J., Vermeylen, R., Claeys, M., Maenhaut, W., 2002. Im-proved method for quantifying levoglucosan and related monosaccha-ride anhydrides in atmospheric aerosols and application to samplesfrom urban and tropical locations. Environ. Sci. Technol. 36, 747–753.
Zheng, M., Wan, T.S.M., Fang, M., Wang, F., 1997. Characterization of the non-volatile organic compounds in the aerosols of Hong Kong - Identifica-tion, abundance and origin. Atmos. Environ. 31, 227–237.
Related Documents


![Author's personal copy - UAB Barcelonaicta.uab.cat/Etnoecologia/Docs/[410]-hunsberg.pdfAuthor's personal copy Livelihood impacts of biofuel crop production: Implications for governance](https://static.cupdf.com/doc/110x72/5f33bfcc0da3f66a4c264305/authors-personal-copy-uab-410-hunsbergpdf-authors-personal-copy-livelihood.jpg)


