Implementing the Solid Waste Management Act of 1989 Stephen S. Jenlcs he Solid Waste Management Act of 1989 is a good T example of an intergovernmental mandate that in- volva actions on all three levels of government: national, state, and local. The state of North Carolina in effect an- ticipated federal regulations on solid \caste landfills when it passed the act in 1989. Though states nationiiide are expected to carry out federal requirements concerning landfills, individual states liave a range of options for deal- ing with the generation, collection, and disposal of solid waste. Some states have taken strong actions, including bans on beverage containers, mandator!. recycling, and source reduction. At the other end there are states that have basically left these issues to local governments to handle. North Carolina chose a middlc ground in its Solid Waste Management Act of 1989. The Solid Waste Management Act inclutlcs some el- ements that are typical of intergovei-nmental mandates, such as requirements for reports and plans ;ind a system for measuring the volume of wxstc disposed of at land- fills. T h e law also set a very ambitious goal of a 25 per- cent reduction in per capita solid waste volume going into landfills by June 30, 1993. Howevci-, the la\. did not tell local governments /ZOW to achieve the rctluction, but instead gave them considerable flexibilit!. and discretion for selecting their own approaches for ;ichieving the goal. Now that the 1993 date has passed, time is ail opportu- nity to assess the degree of success acliici et1 in the state through its solid waste mandate. Tliis article discusses the events leading up to the passage of thc Solid \\/aste YIanagement Act and the issues that local governments had to face in preparing to implenicnt thc act. It then The author is un rissistant professor of politmil sciciicc ut thc University of Centrul Okluhoniu. IHc u.ishc.a to tlitrrik Ed lic~an and the North Carolinu Associution of Couiiti. Conin7I~~ioners for their suRDort and ussistance in this Drojcct. ~ ~~ ~~ ~ ~~ .~~ ~~. . ~~~ ~~ ~~~ ~_~ discusses the findings of a study conducted to determine the success of the first ycars of implementation. Background Legislative History Historically solid wastc nianagenient has been seen as a policy area that falls priinarily undcr the jurisdiction of local governments. Conscqucntly thc collection antl tlis- posal of solid (noiihaxai-doiis) wastc have been activities largely carried out by county antl municipal govern- ments, private contractors, antl individual businesses and citizens. Until relatively recent times, the national and state govcrnments had taken little action that would af- fect how these activities werc conductctl. \Vithin the past two tlecatles both national antl statc levels of govci-nment have gratlually given solid waste management increased attention. At thc national levcl thc liesource Conservation antl liccovcry Act (RCliA) of 1976 set thc stage for federal regulation of solid wastc tlisposal facilitics. Thc United States Environmental Protection Agency (EPA) was assignctl rcsponsibility for administering IICIIA and, through its regulations imple- menting the law (known as “Subtitle 11” for that section of thc law pertaining to nonhazartlous wastes), estab- lished minimum national performance standards rcgartl- ing the siting, design, and operation of all solid wastc tlispos;il fxilitics.’ The I--Iazai-dous antl Solid Wastc Amendments of 19St cxtcndcd the national government’s role by requir- ing the EPA to reexamine antl revise the regulations to ens~i re they atleqi la tel y protected huinan health and the en\-ironment from groundwater contamination. Of par- ticular relevance were requirements that the EPA de- velop a inorc specific system for groundwater monitoring 24 POPULAR GOVERNMENT Winter 1995 ii

Welcome message from author
This document is posted to help you gain knowledge. Please leave a comment to let me know what you think about it! Share it to your friends and learn new things together.
Transcript
Implementing the Solid Waste Management Act of 1989
Stephen S. Jenlcs
he Solid Waste Management Act of 1989 is a good T example of an intergovernmental mandate that in- volva actions on all three levels of government: national, state, and local. The state of North Carolina in effect an- ticipated federal regulations on solid \caste landfills when it passed the act in 1989. Though states nationiiide are expected to carry out federal requirements concerning landfills, individual states liave a range of options for deal- ing with the generation, collection, and disposal of solid waste. Some states have taken strong actions, including bans on beverage containers, mandator!. recycling, and source reduction. At the other end there are states that have basically left these issues to local governments to handle. North Carolina chose a middlc ground in its Solid Waste Management Act of 1989.
The Solid Waste Management Act inclutlcs some el- ements that are typical of intergovei-nmental mandates, such as requirements for reports and plans ;ind a system for measuring the volume of wxstc disposed of at land- fills. The law also set a very ambitious goal of a 25 per- cent reduction in per capita solid waste volume going into landfills by June 30, 1993. Howevci-, the la\. did not tell local governments /ZOW to achieve the rctluction, but instead gave them considerable flexibilit!. and discretion for selecting their own approaches for ;ichieving the goal. Now that the 1993 date has passed, t ime is ail opportu- nity to assess the degree of success acliici et1 in the state through its solid waste mandate. Tliis article discusses the events leading up to the passage of thc Solid \\/aste YIanagement Act and the issues that local governments had to face in preparing to implenicnt thc act. I t then
The author is u n rissistant professor of po l i tm i l sciciicc ut thc University of Centrul Okluhoniu. IHc u.ishc.a to tlitrrik Ed l i c ~ a n and the North Carolinu Associution of Couiiti. Conin7I~~ioners for their suRDort and ussistance in this Drojcct.
~ ~~ ~~ ~ ~~ .~~ ~~.
. ~~~ ~~ ~~~ ~_~
discusses the findings of a study conducted to determine the success of the first ycars of implementation.
Background
Legislative History
Historically solid wastc nianagenient has been seen as a policy area that falls priinarily undcr the jurisdiction of local governments. Conscqucntly thc collection antl tlis- posal of solid (noiihaxai-doiis) wastc have been activities largely carried out by county antl municipal govern- ments, private contractors, antl individual businesses and citizens. Until relatively recent times, the national and state govcrnments had taken little action that would af- fect how these activities werc conductctl.
\Vithin the past two tlecatles both national antl statc levels of govci-nment have gratlually given solid waste management increased attention. At thc national levcl thc liesource Conservation antl liccovcry Act (RCliA) of 1976 set thc stage for federal regulation of solid wastc tlisposal facilitics. Thc United States Environmental Protection Agency (EPA) w a s assignctl rcsponsibility for administering IICIIA and, through its regulations imple- menting the law (known as “Subtitle 11” for that section of thc law pertaining to nonhazartlous wastes), estab- lished minimum national performance standards rcgartl- ing the siting, design, and operation of all solid wastc tlispos;il fxilitics.’
The I--Iazai-dous antl Solid Wastc Amendments of 19St cxtcndcd the national government’s role by requir- ing the EPA to reexamine antl revise the regulations to ens~i re they atleqi la tel y protected huinan health and the en\-ironment from groundwater contamination. Of par- ticular relevance were requirements that the EPA de- velop a inorc specific system for groundwater monitoring
24 POPULAR GOVERNMENT Winter 1995
i i

, I
and develop stricter criteria for the siting of facilities. The EPA also decided to incorporate such issues as landfill design, restrictions on various types of waste, financial responsibility, and requirements for closure of landfills into the regulations covering solid waste disposal facili- ties. In its “Agenda for Action” the EPA initiated a na- tional recycling goal of 25 percent of the waste stream, to be achieved by 1992. In addition, the EPA proposed a hierarchy of prefcrred methods for managing an inte- grated solid waste management program, beginning with reuse, reduction, and recycling of solid wastes; incinera- tion and landfilling were at the bottom of the hierarchy.’
In 1988 the El’A proposed new rules for landfills to carry out the 1984 anientlments. While the EPA had in- tended to complete work on the regulations by 1989, officials did not issue the final regulations until October 1991. The final regulations established more comprehen- sive standards for designing and monitoring disposal fa- cilities. These staiidarcls are of significant consequence to jurisdictions with landfills. In essence these require- ments substantially increase the cost of building and maintaining landfills that are developed in the future, starting within two years from the date the final regula- tions were issued.
Because of the extended process of completing the regulations at the federal level, officials at the state level as well as in many local governments were aware that they would need to begin preparing for the day when existing landfills would have to be replaced by disposal facilities that must meet more stringent and expensive requirements. In North Carolina early initiatives in- cluded a statement of a goal to reduce the volume of solid waste going into landfills (by the Department of Human Resources and the Department of Natural Re- sources and Community Development in June 1987) and the strengthening of state agencies’ policies governing the siting, design, and operation of landfills in the state.
In 1987 North Carolina’s General Assembly autho- rized the Legislative Research Commission (LRC) to study the management of solid waste. Based on the ini- tial study performed by the LRC, a Committee on Solid Waste llanagement was created to expand the study and to hold public meetings. During a series of ten meetings between November 1987 and December 1988, the com- mittee heard from state agency staff, representatives of state-level associations and organizations such as the North Carolina Association of County Commissioners and the Sierra Club, officials from county governments, technical and policy experts, persons involved in com- mercial recycling, and businesses that would be affected by legislation on solid waste.
*
9
?
*
The Coinmittee on Solid Waste Management submit- ted its report on Deceinber 14, 1988, to the General As- sembly and included a number of recommendations and legislative proposals. The first recommendation of the committee was that the General Assembly should estab- lish a state policy regarding solid waste management. This recommendation included the following statement of findings:
North Carolina faces a crisis in the near future in solid waste management due to a shortage of landfill space, an increased risk of contamination of the groundwater, and stricter fctleral regulations, which will he much more expensive for counties to comply with. More ef- fective I I ~ A I I ~ I ~ ~ I ~ C I I ~ of solid waste is necessary to protect the public health and safety, to protect the en- vironmcnt, and to protect the long term economic well- being of the State. The interests of the State are served by the proper voluntary management of solid waste by units of local government; therefore, it is in the best interests of the State and its citizens to develop a State solid waste management policy that will provide guid- ance to units of lociil government and assist them in developing their own comprehensive solid waste man- agement programs.
It should be the policy of the State to promote meth- ods of solid waste inanageinent that are alternatives to landfilling and to assist units of local government with solid waste managcment. The following hierarchy of methods o f solid waste management should be estab- lished, in clescentling order of preference:
(1) \\‘astc volumc reduction at the source; ( 2 ) Rccvcling and reuse; (3) Composting; (4) Incineration with energy production; ( 5 ) Incineration foi- volume reduction; (6) Disposal in lantlfills.i
The recommendation also proposed that the state establish a minimum 25 percent recycling goal for the state to attempt to accomplish by January 1,1993, as well as other milestones for state agencies and counties to develop plans and programs in support of this goal.
During the 1989 session of the General Assembly, both the Senate and House considered and eventually approved legislation on solid waste management. The Senate version (Senate 13ill 11 1) was a brief proposal that essentially incorporatetl the Committee on Solid Waste Management’s statement of findings, the hierarchy of methods, and the 25 percent recycling goal. (The Solid Waste Management Act of 1989 set a state goal that by January 1, 1993, 25 percent of solid waste should he re- cycled. In 1991 thc General Assembly passed House Bill 1109, which amended the act and changed the recycling goal to a reduction goal of 25 percent to be achieved by June 30, 1993.)
POPULAR GOVERNMENT Winter 1995 1:

In contrast to the six-page Senate bill, Rep. Joe Hackney’s bill, House Bill 1225, was a comprehensiie approach encompassing expectations and requirements for both state agencies and local governments. In its original form the seventy-four-page bill largely folloivect a Florida law and incorporated such elements as a state program of planning, technical assistance, and financial assistance; local government plans and programs, includ- ing recycling and public cducation; development of markets for recycled materials; preference in state go\’- ernment procurement for products with recycled con- tent; bans on certain types of products from landfills; advance disposal fees for containers; and container deposits.
In large measure, Senate Rill 11 1 as approved by both houses of the General Assembly was actually House Rill 1225 as revised to remove or modify those sections that received the most strenuous objections. It was enacted on August 12, 1989, and became effective as of Octo- ber 1 of that year.4
The Situation in the Counties as of 1989 In the area of solid waste, counties in the state haw
historically been responsible primarily for the disposal of solid waste while municipalities provided solid waste col- lection services. However, by the 1980s the nature of the task for counties shifted from “maintaining garbage dumps” to “solid waste management,” and consequently solid waste for county governments came to involve ii more complicated series of policy decisions than coun- ties had previously dealt with.
Though North Carolina’s Solid Waste Management Act was enacted by the General Assembly in August of 1989, it is highly likely that county officials were aware of this potential legislation well before that formal action was taken. For example, numerous articles on pending legislation appeared in County Lines, the biweekly nen.s- letter of the North Carolina Association of County Com- missioners (NCACC), during 1987 and 1988.
In addition, there was considerable substantive infor- mation that would have indicated the level of impor- tance of the issue to counties. In the December 16, 1987, issue of County Lines, Ed Regan of NCACC noted that “many counties are running out of space at existing permitted landfills. We believe that this problem may soon become a crisis of statewide proportions.”’ He also noted concerns about the increasing costs of land- fills, especially those that would be lined, and offered recommendations on who should be responsible for
26 POPULAR GOVERNAIENT Winter 1995
solid waste management to the Committee on Solid \\’aste R lanagement.”
Thus, in the period nearing the passage of the Solid \\/ask Management Act, county officials who had been reading the information provided by their association must certainly have been aware that state and federal actions were very likely to have a major impact on their solid waste practices and policies. But being aware of the new requirements does not necessarily mcan that all counties would be ready to respond to them.
With the passage of the 1989 state legislation on solid waste, many counties faced a situation for which they were not well prepared. As Mike McLaughlin of tlic North Carolina Center for Public Policy liesearch a s - sessed the situation in 1989, the legislation addressed only a portion of the scope of the problem:
[Tllic legislation cstablislics lofty goals Iiut does not chart ii clear coiirsc for rcaching tlicni. Intlcctl, the ncu law raises trouliling questions. How will tlic counties reach the 25 pcrccnt waste divcrsion goal? And diiit will become o f tlic waste that is clivcrtetl? Will it IIC rc- cycled and put to productive use? Or will it siinply I)c wal-cliouscd, \vitli no inarkct for ;I hugc inf lux of woultl- be raw inaterials that used to IIC rdhisli? I’olicymakcl-s readily conceded they (lo not have all tlic answcrs, hi t they say the countics--facing hugc incrcascs in the cost of lantlfilling waste--arc rcatly to face the questions.;
McLaughlin further noted that “the clear omission in the bill, and the issue that needs immediate attention, is money. Implementing a statewide solid waste manage- ment strategy, and recycling 25 percent of the state’s M.ilste stream, cannot be accomplished on good intcn- tions alone. Somebody has to pay the bill.”s
The Solid Waste Management Act of 1989, as is the case with intergovernmental mandates in general, struc- tured the nature of the relationship between the state and local governments and provided a basic delineation of responsibilities. Terry Henderson of the North Caro- lina League of hhnicipalities interpreted the law as sug- gesting a four-tiered partnership, where “the state must find and create markets for recyclable materials, multi- county regions get the role of implementing expensive wxte management options that require a pooling of Io- cal resources, counties claim responsibility for disposing of waste and getting recyclables to market, and cities collect solid waste and recyclables.” Henderson further noted that “this is truly one area where we are going to have to be intergovernmental and interdependent.’”
When the Solid Waste Management Act was enacted in the late summer of 1989, counties in North Carolina

varied greatly in their degree of readiness to meet the chdlenges of recycling and reducing their volumes of solid waste. A study on recycling conducted in 1989 by the North Carolina Center for Public Policy Research found the following:
Ninety of one hundred counties operated a landfill. Nineteen counties had a paid recycling coordina- tor. Forty-four counties had at least one of three types of recycling collection: buyback centers, curbsidc collection, and drop-off centers. Fol-ty-three counties reported “none” as their cur- rent recycling activities, and four counties indi- cated they were “planning” to implement recycling activities. Twenty-three counties had a program for the col- lection and diversion of yard waste from their sani- tary landfill.”’
One thing that was apparent from the Center for Public Policy Research study was that counties across the state faced very different types of situations in trying to formulate and adopt policies to respond to the state mandate on recycling. The most common factor cited by respondents in the study was the difference between rural and urban counties. This was a significant factor, given that a majority of counties in the state are classi- fied as rural.” In describing the relatively successful ef- forts of one rural county in the state to implement a recycling program, it was noted that recycling repre- sented only 2 percent of that county’s waste stream. As a consequence,
despite these efforts, Chatham and other rural counties hdve a long way to go before reaching the state’s 25 percent recycling goal. Officials in rural counties say they have neither the money nor the personnel to op- erate extensive recycling programs. Since Chatham is sparsely populated, curbside collection of trash and recyclables would be cost-effective only in the towns and larger subdivisions in the county.’’
This introduces a second issue that is important in understanding the situation of counties in North Caro- lina in 1989. There is a distinction to be made between counties that are well-off and those that might be con- sidered relatively poor. While financial capacity may be measured in different ways, a common approach is to look at the tax base as reflected in per capita property valuation for tax purposes. In North Carolina there is a large spread in the per capita property valuations, rang- ing from thirty-six counties with less than $20,000 to
seventeen counties with more than $35,000.” I11 addi- tion, most though not all counties with low property tax bases are also rural in nature, further complicating their problem in dealing with the mandate to reduce solid waste.
A third factor that may serve to cliffercntiate counties is the volume and composition of their wastc stream. According to the State Data Center of North Carolina, counties in the state vary in the per capita wastc tonnage by a significant degree, with eight counties with less than half a ton per capita and fifteen counties with more than one and a quarter. In general the difference comes from two sources: (1) the number of part-time residents and tourists in the county (who are not counted in the popu- lation base, but who produce solid waste) and (2) the volume of waste produced by business and industry. Re- cause there is some relationship between part-timers and tourists to per capita property valuations, counties with high per capita tonnage also tend to be those with higher tax bases, providing them with the potential financial ca- pacity to handle their higher volumes of waste.
Counties with large industrial or commercial produc- ers of solid waste have not only the advantage of their property valuations, but also the potential advantage of being able to target a relatively small number of busi- nesses to produce a large reduction in solid waste.
A related factor is the composition of the waste stream, which can vary greatly across counties. In coun- ties with a higher proportion of residences, there are higher volumes of household waste such as food waste, mixed paper, and yard waste. Rut in counties with more commercial and industrial firms, the waste stream may be higher in corrugated cardboard, wood products, and other materials that have value in the recyclable materi- als market. Again, counties with different waste streams would need to take different approaches to achieve re- ductions in their volumes of solid waste, and not all ap- proaches take the same level of resources, effort, or educational outreach.
Early Period of Implementation by the Counties
Subsequent to the enactment of Senate 13ill 11 1, the Association of County Commissioners engaged in a ma- jor campaign to inform county officials about the content and implications of the legislation. On September 11, 1989, an “Information Alert” was sent to all county man- agers, which provided a thorough summary of the law and its requirements for local governments. It also listed the major duties of state agencies, including assistance to and
POPULAK GOVERNMENT Winter 1995 27

A
Table 1 Summary of Requirements for Counties froin the Solid Waste Management Act of 1989
Milestone 1)eadline llate
Submit first annual report on solid waste management and recycling activities
in solid waste management over a one-year period
Initiate a recycling program, requiring the separation of recyclablcs antl construction/deniolition debris
Develop analysis of all costs incurred
Weigh all solid waste received at a landfill Develop a countywide solid waste
Ban certain materials from the landfills Used oil White goods and lead-acid batteries Yard waste
Achieve a goal of 25 perccnt recycling
Completion of training coiirse for
management plan
of solid waste
operators of solid waste facilities ___-. .... - .
Octol,cr 1, 1000
July I , 1991 JUIY 1, 1991
h4arch 1, 1992
October 1, 1990 Jailiiary 1, 1991 January 1, 1993
July 1 , 1993
Source: N.C. Association of County Coniniissioners, "North Carolinci Solid Wastc L.aw licvisctl," County Lines 15 (Oct. 1 I , 1980): 1.
promotion of the recycling industry, performance of mar- ket analyses, and a role for the Department of Public In- struction in the promotion of recycling in tlie public school system and development of curriculum materials for a recycling awareness program through all grade levels.
The October 11 issue of County Lines presented a list of requirements that counties were to meet and the key dates associated with the requirements and new reports, as indicated in Table 1.
At this point it should be evident that county officials faced a daunting situation. A complex state law had es- tablished a series of requirements that counties must meet over the next few years. The counties woulcl need to formulate and implement new policies that were likely to change substantially not only coiinty policies and pro- grams for solid waste management, but also the behav- iors of county residents and businesses. In addition, each county faced the same set of statewide requirements and expectations, while trying to assess its own unique situ- ation. Individual county considerations included the composition of the waste stream as well as a series of relatively unknown financial and political factors that would affect each county's ability to meet the state and federal requirements.
Assessing the Success of Implementation
Study Design
A comprehensive study of tlie implementation of the Solid Waste Management Act was condiicted by tlic author over a period of approximately eighteen months in 1992 and 1993. The study used a mixed-method ap- proach for data collection and analysis. This approach enables the researcher to draw on the strengths of mul- tiple methods, in part to compensate for the wcakncsses of any single method of data collection or data analysis. This study incorporated ii large-scalc survcy of county officials, personal intcrviews with state officials, and multiple county case studies.
-4t the state level, personal intcrviews werc conducted \\.it11 two senior administrators in tlic Departnicnt of En\.ironment, Health, and Natural lksources, a lobbyist for two statewide cnvironmental groups, two staff nicm- Iiers of committees of the Gencral Assembly responsi1)lc for solid waste legislation, and the state represcntativc \\.I10 sponsored the Ii i l l that bccamc the fountlation for the law adopted by the legislature.
The survey of North Carolina's 100 counties, con- ducted in the fall of 1992 in conjunction with tlic N&i Carolina Association of County Commissioners, was de- signed to obtain a broad base of information on tlie atti- tudes and views of county officials. Iksponscs wcrc received from fifty-five commission chairs, eighty-three county managers, and sixty-four solid waste managers, for an o\erall response rate of 202 out of 300, or67 pcrcent."
Six counties were selectctl for in-tlcptli case studies. :i total of twenty county officials were interviewed, eighteen through personal intcrviews and two by tele- phone. In addition, teleplione interviews were con- ducted with sources knowledgcable about solid wastc issues in each county, including city officials, represcn- tatkes of the business and environmental cominunitics, ant1 newspaper reporters. County documents and rcc- ords and newspaper articles were collected antl analyzctl to complement information obtained through tlic inter\-iews.
Findings
In the early period of implementing the state mandate on solid waste, local government officials faced varicd situations in counties across tlic state in terms of poten- tial support for the types of actions that might be needed to carry out the mandate. In the 1992 survey county of-
28 POPULAR GOVERNMENT Winter 1995

ficials were asked to think back to that early period, with their responses presented in Table 2. Clearly, county officials had been expecting some resistance from citi- zens and industry in particular, with a number of survey respondents indicating that one or both groups would oppose the needed solid wastc programs.
The ability of county governments to implement the solid waste mandatc is not solely a function of their abil- ity to gather local political support and financial resourccs. County officials also need a good working re- lationship with the state officials responsible for provid- ing technical assistancc as wcll as monitoring county efforts. Table 3 reveals tlic views of county officials as to thc naturc of their relationship with state officials. Overall the survey results present a positive picture of the relationship between state and county officials, though there is a sizable minority reporting some diffi- culties. In addition, within typcs of county officials there were further differences, as solid waste managers gen- erally tended to be more positive in their assessment of relations with state officials than either county manag- ers or county commissioners.
In gcneral county officials did agree that there is a necessary role for the state to play in the management of solid waste. However, there was less agrecment on the nature of that role. Some respondents found that the legislation was unnecessarily restrictive and failed to take into account sufficiently the differences across the coun- ties of the state. This comment by a manager from a county with a very small population is representative of this perspective:
*
!
Most will agree with the premise that this is a statewide problem. The i-egiilations do not and cannot take into account thc size and other differcnces of the many counties involved. There should be policies based on parameters of county size, region, population, economic base, etc., plus a good portion of common sense. We need a statewide umbrella policy with rational (not nec- essarily minimum) standards.
O n the other hand, a contrasting perspective on the state mandate is represented by this thoughtful com- ment by a manager from a I-ural county with a below- average per capita tax base:
Senate Bill 11 1 is a good piccc of legislation. It is viewed in this county niorc ;is an cst;il~lishnient of goals that are needed as opposed to a state mandate. Senate Bill 11 1 has assisted this county in establishing needed recycling programs, tipping fees, etc. We have used [it] as a means to accomplish needed priorities. However, the legisla- tion does not establish fines or penalties. To my mind, it struck a balance between state priorities and the need for local consider a t. ions.
‘I’ablc 2 Responses to Survey Qucstiou on Community Support or Opposition in Early Period
Strongly Strongly Supportetl Opposctl
I % ) (”/I 7 73 39 21 10 Citizens in our county
Industry in our county 5 75 52 16 3 Environmental groups in our county 42 34 IS 4 2 Board of county commissioners 26 31 33 9 3
The sur iq~ question: “Oidicute the degree to which you t h i i i k cuch of ihe fol- h w l i l g groups supported or o{~/iosed the iiiip~enieiit~rtioii of solid 14~cisie pro- grams Whe11 county offici& were first considering /zow to respoiid io the sftrte niundute.”
Nos: Totals m y not ;itltl to 100 pcrccnt chic to rounding.
Table 3 Responses to Survey Qncstion on State-County Relations
Strongly Agree
( % I
Strongly Disagrec
( % I State officials havc Iiccn very willing 21 30 27 14 9 to work with county officials. State officials havc I)ccii very firm in 10 34 39 13 3 their expcctations that wc mcct the requirements of the mand:itc. State officials havc provitlctl assistance 15 28 33 14 10 on a timely basis. County officials have 1)ccn receptive to 22 45 26 7 1 state assistance.
The survey question: “Pletrse iizdictrte the exteiif to iihich you would ugree or disagree with the following stciteinelits regurdiiig your county’s esperieiice with stute solid wuste officiuls over the /Just severti1 yeurs.”
Thus, for another group of officials, Senate Hill 11 1 provided a mechanism for counties to use to take actions that they may have found difficult on their own. This rationale for state action was arnong the questions asked on the survey, as indicated in the second question in Table 4. A clear majority of respondents agreed that it would be difficult for individual counties to put policies in place that might be costly for businesses, with a po- tential consequence of losing those businesses to other counties.
It seems evident that most county officials in 1992 rec- ognized that one role for the state to play in solid waste management was to set the general rules so as to not leave
POPULAR GOVERN~~ENT Winter 1995 29

Table 4 Responses to Survey Question on the Role of State in Solid Waste Policy
Strong1 y Strongly hgrec Disagree
(%I (%.) ~ ~ _ _ _ ~ ~ __
It is in the best interests of the citizens 47 29 1 5 8 2 of the state that North Carolina has 21
comprehensive, statewide policy for im- proving the management of solid waste. It is difficult for individual counties 37 39 12 10 3 to put in place policies that might be costly for businesses and thus possibly lose businesses to other counties.
The survey question: “The solid waste mundate ussumes thut there is a need for the state to regulate the activities o f the counties. Please indicate the de- gree to which you agree or disagree with euch o f the following statements.” __
-. ___.__.__
Table 5 Responses to Survey Question on the Importance of Solid Waste Management Issues
Not Very Important Important
(%) (%I Reducing the amount of solid 0 4 16 32 49 waste produced in our county Complying with the state mandate 1 11 24 36 29 to reduce solid waste by 25 perccnt Keeping landfill tipping fees 5 16 30 23 25 and other solid waste fees at their current level Keeping tax rates at their 2 2 17 29 50 current level
The survey question: “County governments huve to decide what priority to give to the implementation ofeolicies and programs for issues thut are important to its citizens. For each o f the following, please indicate how importunt you think the issue is in your county.”
individual counties vulnerable if they attempted to insti- tute measures that would leave them in a noncompetitive position relative to other counties. O n the other hand, the Solid Waste Management Act of 1989 left enough room for individual decisions so that counties may have found themselves being compared, favorably or unfavorably, to other counties in the state for the types of policies they chose to adopt and implement.
As noted previously, different counties face different circumstances in terms of the degree to which solid waste may be a problem in their area. The need to meet
the state requirements may need to be balanced off against local consitlerations. Table 5 presents several is- sues that county officials had to address as they consid- ered their options.
It is evident from these results that most county officials believed that solid waste was an important issue and that 25 percent reduction was an important goal. However, these results also indicate that the majority of county officials felt the goal of reducing solid waste would have to take into account the importance of main- taining tax rates or solid waste fees at their current lev- els. There was also a significant minority of county officials who did not feel that keeping solid waste or tip- ping fees at their current levels was important, which may very well represent those counties with low or no fees at the time of the survey.
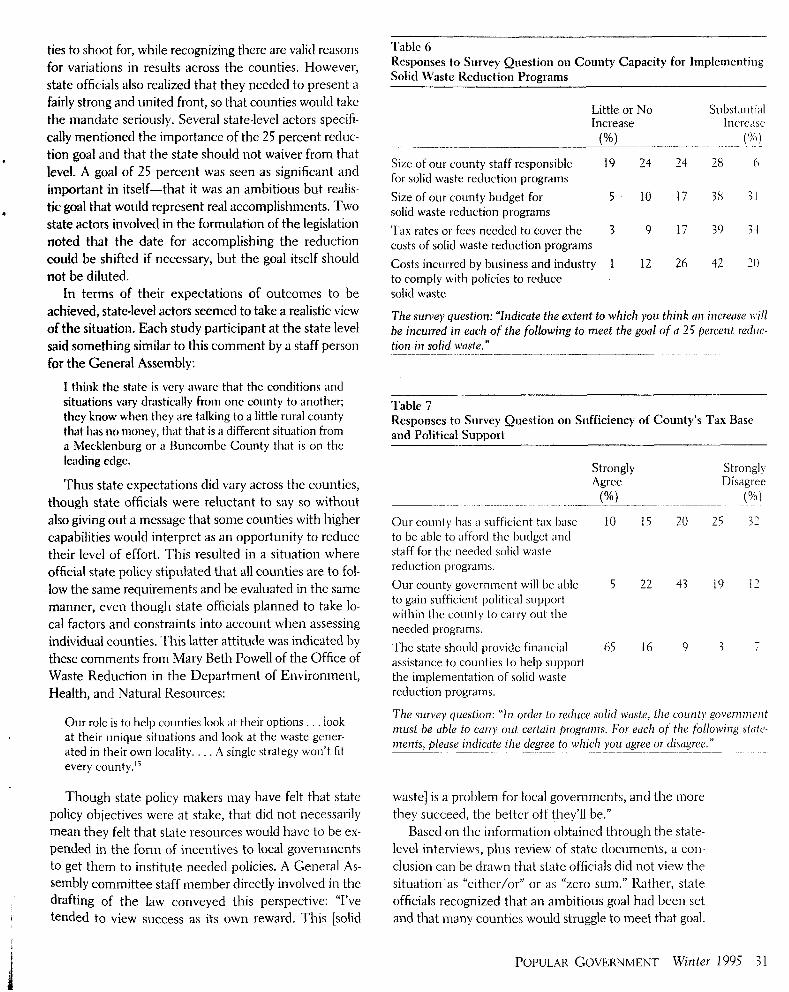
The capacity for implementing solid waste reduction programs varies greatly across counties in the state. At the time of the survey some counties already had sub- stantial budgets and staffs for programs such as recycling, while others either lacked the capacity or did not find this to be a priority in their county. Thus different counties had very different starting points when trying to meet state expectations for improved solid waste management practices. As Table 6 shows, a large portion of county officials felt their counties would have to increase sub- stantially the size of their budgets as well as tax rates or fees (or the costs incurred by business and industry) to meet the state goal.
Faced with the likelihood of having to increase bud- gets, taxes, fees, or other costs to carry out the necessary changes in solid waste management in their county, of- ficials had to gauge if they had the financial and politi- cal resources to do the job. A series of survey questions provides a good indication of the range of circumstances in the counties across the state. In Table 7 the first ques- tion demonstrates the range of financial capacities in counties in the state, while the second question shows that political support also varied widely. Given the results of this and prior survey questions, it is not surprising to see in the third question that there was substantial agree- ment among county officials that the state should pro- vide financial assistance to counties to defray the costs of implementing solid waste reduction programs. Inter- estingly, based on further analysis of the survey results, the county officials that indicated they had a sufficient tax base were also well represented among those advo- cating state assistance.
Based on the interviews conducted with state-level actors, there is substantial evidence that state officials saw the mandate as establishing an overall goal for coun-
30 POPULAR GOVERNMENT Winter 1995
ties to shoot for, while recognizing there are valid reasons for variations in results across the counties. However, state officials also realized that they needed to present a fairly strong and united front, so that counties would take the mandate seriously. Several state-level actors specifi- cally mentioned the importance of the 25 percent reduc- tion goal and that the state should not waiver from that level. A goal of 25 percent was seen as significant and important in itself-that it was an ambitious but realis- tic goal that would represent real accomplishments. Two skate actors involved in the formulation of the legislation notcd that the date for accomplishing the reduction could be shifted if necessary, but the goal itself should not be diluted.
In terms of their expectations of outcomes to be achieved, state-level actors seemed to take a realistic view of the situation. Each study participant at the state level said something similar to this comment by a staff person for the General Assembly:
.
I think the state is very aware that the conditions and situations vary tlrustically from one county to another; they know when they <ire talking to a little rural county that has no money, tli& that i s a different situ‘ition from a Mcdlenburg or a Buncombe County that is on the leading edge.
Thus state expectations did vary across the counties, though state officials were reluctant to say so without also giving out a message that some counties with higher capabilities would interpret as an opportunity to reduce their level of effort. This resulted in a situation where official state policy stipulated that all counties are to fol- low the same requirements and be evaluated in the same manner, even though state officials planned to take lo- cal factors and constraints into account when assessing individual counties. This latter attitude was indicated by these comments from Mary Beth Powell of the Office of Waste Reduction in the Department of Environment, Health, and Natural Resources:
Our role is to help counties look at their options . . . look at their unique situations and look at the waste gener- ated in their own locality. . . . A single strategy won’t fit every county.”
Though state policy makers may have felt that state policy objectives were at stake, that did not necessarily mean they felt that state resources would have to be ex- pended in the form of incentives to local governments to get them to institute needed policies. A General As- sembly committee staff member directly involved in the drafting of the law conveyed this perspective: “I’ve tended to view success as its own reward. This [solid
~-
l’ablc 6 Responses to Srirvey Question 011 County Capacity for Implementing Solid Waste Reduction Programs
Little 01 No Sul,\t<lntl<ll Increase Inc1 cdje
(”/.I ( (81) _____ ___-- - -- -
Six of our county staff iesponsible 19 24 24 28 6 for sohcl wdste rcdiiction programs Size of our county budget for 5 10 17 3s i l solid waste reduction programs Tax rates oi fees needed to cover the 3 9 17 30 34 costs of solid waste reduction programs Costs incuired by business and industry 1 12 26 42 20 to coinply with policies to reduce solid waste
The sunqj question: “Indicute the extent to which you think un increuse I I i [ l
be incurred in emh o f the following to meet the goal o f u 25 percent reduc tion in solid waste.” __ - __ _ _ _ _ _ _ __ -_____
Table 7 Responses to Survey Question on Sufficiency of County’s Tax Basc and Political Support
Strongly Agree
(”/.I
Strongly Disagree
( % I Our county h a s ii sufficient t ax I~asc 10 I 5 20 25 32 to be able to afford thc budget and staff for the needed solid waste reduction programs. Our county government will be al)le 5 22 43 19 12 to gain sufficient political support within the county to carry out the needed programs. The state should proviclc financial 65 16 9 3 assistance to counties to help support the iinplementation of solid waste reduction programs.
The survey question: “In order to reduce solid wuste, the county governnwiit must be uble to curry out ceriuin progrdnis. For euch o f the following sttite- ments, please iiidicute the degree to which you ugree or disugree.”
- I
~ ~~ . .-.. . .
waste] is a problem for local governments, and the more they succeed, the better off they’ll be.”
Based on the information obtained through the state- level interviews, plus review of state documents, a con- clusion can be drawn that state officials did not view the situation as “either/or” or as “zero sum.” Rather, state officials recognized that an ambitious goal had been set and that many counties would struggle to meet that goal.
POPULAR GOVERNMENT Winter 1995 31

I
1
I
Table 8 Change in Solid Waste Per Capita from 1991-92 to 1992-93
Number of Counticz _ _ ._ .. Perwnt Change
Increase 32 Decrease of less than 5% 20 Decrease of 5% to less than 10% 18 Decrease of 10% to less than 15% 12 Decrease of 15% to less than 20% 4 Decrease of 20% to iesc than 25% 5 Decrease of 25 % or more 9
Note: The nine counties with a rctluction of more thiin 25 percent from 1991-92 to 1992-93 werc :\very, Allegli;iny, Transylvania, Tyrrell, Yancey, Jones, h,litchcll, h,lontgomcry, and North;impton.
However, state officials were willing to work with indi- vidual counties and take their circumstances into ac- count when evaluating the effort made by tlie counties. State officials just did not want to give out signals that they had low expectations, because of the likelihood that lowered expectations would produce lowered outcomes. The situation facing the state is summarized by this statement by a state agency official:
I don’t think the state is worried about one county or a few counties, it is more or less when you have a lai-gc percentage of the counties that are breathing clown your back or saying that the law was not right in this or thdt aspect, then we have to go with the majority opinion. And there is no way we can keep 100 counties and 600 municipalities happy; you’ll hear complaints from diffcr- ent ones at the same time you’ll get accolades from the other ones saying this is the greatest thing that ever happened. I think maybe the state is more concerned about doing what is right and what is good for the ma- jority of the local governments, realizing there will al- ways be some that are unhappy with the decisions that are made.
Implementation Results
Subsequent to completing the initial survey study, the Department of Environment, Health, and Natural Rc- sources published a special report on the results of county efforts to meet the reduction goal by June 30, 1993.16 One important caution needs to be made concerning tlicsc results. Due to the fact that relatively few counties had tlie scales and record-keeping systems in place to begin track- ing their tonnage of solid waste in 1989 when the law was passed, most counties were unable to document their solid waste for the initial fiscal year of 1989-90. Conse- quently the state decided to use 1991-92 as the base year,
unless a countv requested an earlier year for which it could document its record-keeping methods. Despite tlie fact that we have only a comparison of 1991-92 to the target year of 1992-93, North Carolina counties were still able to show an average decrease in per capita solid waste tonnage of 6.4 percent. Table 8 presents tlie range of re- sults over this one-year period.
Whcn attempting to assess the degree of success o f North Carolina counties in meeting tlie state require- ments and expectations, the varying circumstances of those counties need to be taken into account. One might expect to find that tlie counties that were the most suc- cessful also hac1 tlie most financial capacity, tlie most po- litical support, or the highest population densities that enabled them to implement cost-effective recycling pro- grams. However, an analysis of a number of demographic indicators presents quite a different picture. Counties with higher levels of property valuations, government expenditures, and population density were not overly rep resented among tlie most successful counties. In fact tlie majority of tlie most successful counties have moderate levels of property valuations and are rural rather than ur- ban. Further, county officials who indicated on the survey that their counties had a sufficient tax base or sufficient political support were no more likely to be successful than counties whose respondents indicated the opposite.
While these findings may seem to leave us at some- thing of a loss to cxplain why some counties were morc successful than others in reducing their volume of solid waste, tlie counties that were part of the case studies provide evidence that may be useful in answering this question. In contrasting the most successful and least successful of the six case study counties, there are a num- ber of factors whose presence seemed to contribute to the ability of a county to achieve the intended goal. The most important of these factors are discussed below. (All of the six case studies were assigned fictitious names to protect the confidentiality of the interviews.)
T h e ability to market its recyclables. The ability to markct recyclables produced two very different types of responses. Piedmont and Collegia counties had developed strategies that enabled them to largely neutralize this as a potentially adverse factor. Piedmont awarded tlie rights to recyclables to a waste management firm and let the com- pany worry about tlie markets. Piedmont had also care- fully looked at the markets of a range of recyclables before targeting a select group to ban from the landfill. The solid waste manager in Collegia County had made a conscious decision to gain full control over the recyclables they col- lected. He obtained old trailers for storing and hauling various materials. Once a large enough load was collected,
32 POPULAR GOVERNMENT Winter 1995 1

he was then able to bargain for a good price. He refused to sign any contracts with private firms that would give them the rights to recyclables over any period of time.
In contrast, officials in Eastern and Bay counties stated that their counties were too small and too distant from major markets to be able to net a decent return on the sale of their recyclables. The recycling coordinator for Ray County noted that “the larger volume that you have, the better you can bargain with your price. The rural cmnties get kind of screwed on that.”
Devisiiig an approach to reducing solid waste that will be accepted in the community. County officials revealed that they thought it was very important to find an approach to reducing solid waste that was consistent with what they saw as the character of their community. Officials in most of the case study counties thought that their citizens were too independent-minded for any ap- proach that wasn’t voluntary. Yet Piedmont County had the most successful program of the six counties and ba- sically used a mandatory approach by means of banning a series of recyclables from disposal at the landfill.
Education of the public about the problem and how they can help. The importance of educating the public was widely cited by study participants. Piedmont, East- em, and Bay County officials felt that this had been a crucial factor in their success. Several officials mentioned that they thought it had been helpful to have personnel in the collection centers at all times because they were able to hand out informational materials, assist people in understanding the policies on separating recyclables, and promote separation by those who hadn’t been doing so. In contrast, county officials in Lake and Collegia sug- gested that the lack of educational activities to date had hampered their efforts.
Interestingly, several factors that might have played an important role did not seem to do so in the view of the case study participants. Factors that were not impor- tant for the majority of the case study counties included the availability of financial resources, political support, a willingness of elected officials to make tough decisions, help of volunteers, or the composition of the county’s waste stream.
Conclusion The Solid Waste AIanagement Act of 1989 was a
major piece of legislation affecting local governments throughout the state. Even though the state, due to bud- getary constraints, was not able to provide the financial assistance originally intended in the law, many counties were able to make substantial progress in reducing their 1
6
volume of solid waste over the period from 1989 to 1993. hlost county officials recognized the need for a state
mandate in this policy area and that success in meeting state requirements and expectations would ultimately proie to be to their own benefit. Though the coopcra- tion of some counties may have been reluctant at times (possibly due to the cumulative impact of numerous na- tional and state mandates), most counties demonstrated a good working relationship with state officials. Possibly the most interesting finding of this analysis is that coun- ties from a variety of circumstances could be successful in reducing their solid waste, in some cases by rather as- tounding margins. While further research is still needed on the cost implications of various methods to reducing solid waste, North Carolina does seem to have come up with an approach that relies on a good balance of state authority and local responsibilities.
Notes 1. Resource Conservation and Recovery Act, 42 U.S.C.
5 6901. 2. Claire L. Felbinger and Robert R. Whitehead, ”Manage-
ment of Solid-Wastes Disposal,” in Managing Local Govern- ment: Public Administration in Practice, ed. Richard D. Bingham, et al. (Newbury Park, Calif.: SAGE, 1991).
3 . Legislative Research Commission, Solid Waste Manage- ment: Report to the 1989 General Assembly of North Carolina, 1989 Session (Raleigh, N.C.: State of North Carolina, 1988): 33-34.
4. N.C. Gen. Stat. Ch. 784. 5. Ed Regan, “NCACC Addresses Committee on Solid
Waste Management,” County Lines 13 (Dec. 16, 1987): 1. 6. Regan, “NCACC Addresses Committee on Solid Waste
Management,” 12. 7. Mike McLaughlin and Amy Carr, “Recycling North
Carolina’s Resources: The Long Campaign to Cut Tar Heel Waste,” North Carolina Insight 12 (Dec. 1989): 4 (hereinafter “Recycling North Carolina’s Resources“).
8. “Recycling North Carolina’s Resources,” 36. 9. “Recycling North Carolina’s Resources,” 33.
10. “Recycling North Carolina’s Resources,” 14-27. 11. The North Carolina Rural Economic Development
Commission classified seventy-five counties as rural and twenty-five as urban in 1991.
12. “Recycling North Carolina’s Resources,” 18. 13. Computerized information, State Data Center of North
Carolina, 1990. 14. The actual number of responses for particular questions
on the survey varies slightly, as not all respondents answered every question, but the total number of responses does not fall below 195 for any question.
15. Mary Beth Powell, “Waste Reduction Office Offers Help as 1993 Deadline Nears,” County Lines 18 (May 27, 1992): 3.
16. N.C. Department of Environment, Health, and Natu- ral Resources, 1993 Special Report: North Carolina Solid Waste Disposal (Raleigh, N.C.: NCDEHNR, 1994).
POPULAR GOVERNMENT Winter 1995 33
Related Documents