Implementing public private partnerships during challenging economic times: Case study of the 495 Express Lanes on the Virginia portion of the Washington Capital Beltway Project (USA) Nobuhiko Daito 1 , Zhenhua Chen 2 , Jonathan L. Gifford 3 , Tameka Porter 4 , John E. Gudgel * George Mason University, 3351 Fairfax Dr. Arlington, VA 22201, United States 1. Introduction How has the 2008 Economic Crisis impacted the design, financing, and construction of highway public–private partner- ship (PPP or P3) projects in the United States? In December 2007, on the eve of the economic crisis, the Virginia legislature approved a P3 to construct a 14-mile (22.5 km) high occupancy toll (HOT) road (the 495 Express Lanes) to alleviate heavy traffic on the Capital Beltway around Washington, DC. This case study looks at the impact the 2008 Economic Crisis and associated economic challenges between 2008 and 2012 had on this project and considers what governments and other stakeholders should be aware of when implementing P3s during adverse economic times. The hypotheses of the analysis are that, despite the economic downturn, the employment of a P3 procurement approach on the 495 Express Lanes project made it possible to: (1) secure infrastructure investment, which would have been very difficult without the partnership with the private sector; (2) implement a project that was otherwise unfunded within the constrained regional and state long-range transportation plans; (3) deliver the project on-time and on-budget; and (4) achieve higher service quality and potentially life-time operational cost savings (Valila and Timo, 2005). While some states and municipalities have been pondering public–private partnerships in order to fund the operations and maintenance of increasingly deteriorated roads, others are considering aligning with private companies so that they may finance, develop, design, and build roads in addition to performing operations and maintenance functions. These state and local governments are turning to P3 innovations because they believe that these entities can improve capital investments and transpor- tation capacity while upholding existing roadway standards (US Department of Transportation Federal Highway Administration, 2011). With existing P3 legislation, a P3-focused transportation office in place and many years of P3 experience, Virginia is poised to be at the forefront of the P3 project delivery initiative in the coming years. One of Virginia’s most recent P3 projects has been the design and construction of the 495 Express Lanes (Fig. 1), which began operation on November 17, 2012. The Capital Beltway (Fig. 2) is a 64-mile (103 km) circumferential interstate highway that sur- rounds the District of Columbia and the nearby Maryland and Virginia suburbs. The original concept of the Beltway dates back to the 1940s when Fred W. Tummler, former director of the National Capital Park and Planning Commission, suggested a freeway that surrounded the Washington suburbs (McDevitt and Betty, 1944). The road was originally envisioned as a bypass thoroughfare for Case Studies on Transport Policy 1 (2013) 35–45 A R T I C L E I N F O Article history: Received 21 March 2013 Received in revised form 28 June 2013 Accepted 11 July 2013 Available online 8 August 2013 Keywords: 495 Express Lanes Virginia Washington Capital Beltway Public–private partnerships (P3s) Transportation financing A B S T R A C T This case study examines the implementation of the 495 Express Lanes – a major public–private partnership (P3) project in the Commonwealth of Virginia outside of Washington, DC. The project was approved by the Virginia legislature in December 2007 and construction was begun in the shadow of the 2008 Economic Crisis. This paper examines the enactment of P3 legislation in Virginia; the role that it played in the design, financing, and construction of this highway project under harsh economic conditions; and its impact on the evolution of P3 policy in the United States. ß 2013 World Conference on Transport Research Society. Published by Elsevier Ltd. All rights reserved. * Corresponding author. Tel.: +1 703 362 2684. E-mail addresses: [email protected] (N. Daito), [email protected] (Z. Chen), [email protected] (J.L. Gifford), [email protected] (T. Porter), [email protected] (J.E. Gudgel). 1 Tel: +1 703 993 3359. 2 Tel: +1 703 993 3564. 3 Tel: +1 703 993 2275. 4 Tel: +1 615 400 4338. Contents lists available at ScienceDirect Case Studies on Transport Policy jo u rn al h om ep age: ww w.els evier.c o m/lo c ate/c stp 2213-624X/$ – see front matter ß 2013 World Conference on Transport Research Society. Published by Elsevier Ltd. All rights reserved. http://dx.doi.org/10.1016/j.cstp.2013.07.001

Welcome message from author
This document is posted to help you gain knowledge. Please leave a comment to let me know what you think about it! Share it to your friends and learn new things together.
Transcript

Case Studies on Transport Policy 1 (2013) 35–45
Implementing public private partnerships during challenging economic times:Case study of the 495 Express Lanes on the Virginia portion of theWashington Capital Beltway Project (USA)
Nobuhiko Daito 1, Zhenhua Chen 2, Jonathan L. Gifford 3, Tameka Porter 4, John E. Gudgel *
George Mason University, 3351 Fairfax Dr. Arlington, VA 22201, United States
A R T I C L E I N F O
Article history:
Received 21 March 2013
Received in revised form 28 June 2013
Accepted 11 July 2013
Available online 8 August 2013
Keywords:
495 Express Lanes
Virginia
Washington Capital Beltway
Public–private partnerships (P3s)
Transportation financing
A B S T R A C T
This case study examines the implementation of the 495 Express Lanes – a major public–private
partnership (P3) project in the Commonwealth of Virginia outside of Washington, DC. The project was
approved by the Virginia legislature in December 2007 and construction was begun in the shadow of the
2008 Economic Crisis. This paper examines the enactment of P3 legislation in Virginia; the role that it
played in the design, financing, and construction of this highway project under harsh economic
conditions; and its impact on the evolution of P3 policy in the United States.
� 2013 World Conference on Transport Research Society. Published by Elsevier Ltd. All rights reserved.
Contents lists available at ScienceDirect
Case Studies on Transport Policy
jo u rn al h om ep age: ww w.els evier .c o m/lo c ate /c stp
1. Introduction
How has the 2008 Economic Crisis impacted the design,financing, and construction of highway public–private partner-ship (PPP or P3) projects in the United States? In December 2007,on the eve of the economic crisis, the Virginia legislature approveda P3 to construct a 14-mile (22.5 km) high occupancy toll (HOT)road (the 495 Express Lanes) to alleviate heavy traffic on theCapital Beltway around Washington, DC. This case study looks atthe impact the 2008 Economic Crisis and associated economicchallenges between 2008 and 2012 had on this project andconsiders what governments and other stakeholders should beaware of when implementing P3s during adverse economic times.The hypotheses of the analysis are that, despite the economicdownturn, the employment of a P3 procurement approach on the495 Express Lanes project made it possible to: (1) secureinfrastructure investment, which would have been very difficultwithout the partnership with the private sector; (2) implement aproject that was otherwise unfunded within the constrained
* Corresponding author. Tel.: +1 703 362 2684.
E-mail addresses: [email protected] (N. Daito), [email protected] (Z. Chen),
[email protected] (J.L. Gifford), [email protected] (T. Porter),
[email protected] (J.E. Gudgel).1 Tel: +1 703 993 3359.2 Tel: +1 703 993 3564.3 Tel: +1 703 993 2275.4 Tel: +1 615 400 4338.
2213-624X/$ – see front matter � 2013 World Conference on Transport Research Soci
http://dx.doi.org/10.1016/j.cstp.2013.07.001
regional and state long-range transportation plans; (3) deliver theproject on-time and on-budget; and (4) achieve higher servicequality and potentially life-time operational cost savings (Valilaand Timo, 2005).
While some states and municipalities have been ponderingpublic–private partnerships in order to fund the operations andmaintenance of increasingly deteriorated roads, others areconsidering aligning with private companies so that they mayfinance, develop, design, and build roads in addition to performingoperations and maintenance functions. These state and localgovernments are turning to P3 innovations because they believethat these entities can improve capital investments and transpor-tation capacity while upholding existing roadway standards (USDepartment of Transportation Federal Highway Administration,2011). With existing P3 legislation, a P3-focused transportationoffice in place and many years of P3 experience, Virginia is poisedto be at the forefront of the P3 project delivery initiative in thecoming years.
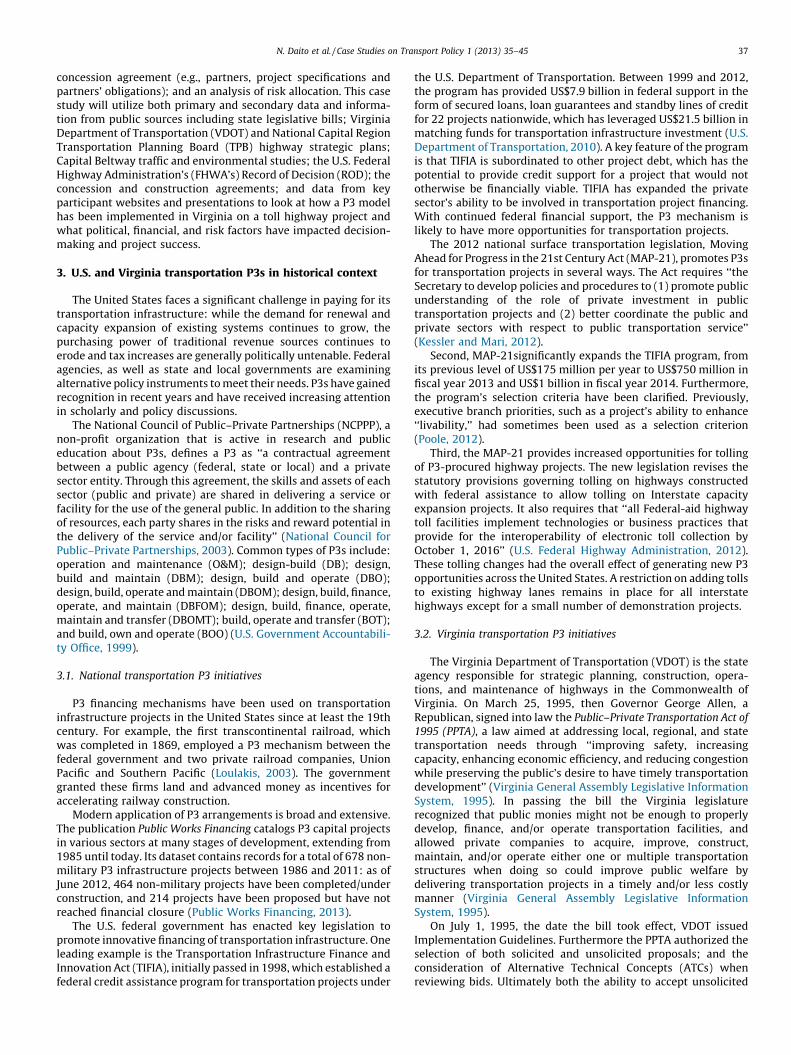
One of Virginia’s most recent P3 projects has been the designand construction of the 495 Express Lanes (Fig. 1), which beganoperation on November 17, 2012. The Capital Beltway (Fig. 2) is a64-mile (103 km) circumferential interstate highway that sur-rounds the District of Columbia and the nearby Maryland andVirginia suburbs. The original concept of the Beltway dates back tothe 1940s when Fred W. Tummler, former director of the NationalCapital Park and Planning Commission, suggested a freeway thatsurrounded the Washington suburbs (McDevitt and Betty, 1944).The road was originally envisioned as a bypass thoroughfare for
ety. Published by Elsevier Ltd. All rights reserved.

Fig. 1. 495 Express (HOT) Lanes.
Lynch, J. ‘‘Virginia Megaprojects.’’ Presentation (Lynch, 2010).
Fig. 2. The Capital Beltway.
N. Daito et al. / Case Studies on Transport Policy 1 (2013) 35–4536
long-distance east coast drivers wishing to avoid traveling directlythrough Washington. As businesses and industry grew in theWashington suburbs, the Beltway became a popular, heavilytraveled highway. Though the road has seen many revitalizationprojects, excessive traffic is a persistent problem.
2. Analytical framework
The framework of the case study will follow Yin, whorecommends that researchers base their case studies on thetheories and previous studies on the subject (Yin, 2009). In terms ofthe structure of the analysis, this study will follow Levy, whoauthored several P3 case studies (Levy, 2011). The followingelements of a P3 project will be discussed: historical context of P3legislation both nationally as well as in the Commonwealth ofVirginia; the Virginia and metropolitan Washington, DC planningprocess; a project description including the initial proposal, scope,and key milestones; project demand; characteristics of the
N. Daito et al. / Case Studies on Transport Policy 1 (2013) 35–45 37
concession agreement (e.g., partners, project specifications andpartners’ obligations); and an analysis of risk allocation. This casestudy will utilize both primary and secondary data and informa-tion from public sources including state legislative bills; VirginiaDepartment of Transportation (VDOT) and National Capital RegionTransportation Planning Board (TPB) highway strategic plans;Capital Beltway traffic and environmental studies; the U.S. FederalHighway Administration’s (FHWA’s) Record of Decision (ROD); theconcession and construction agreements; and data from keyparticipant websites and presentations to look at how a P3 modelhas been implemented in Virginia on a toll highway project andwhat political, financial, and risk factors have impacted decision-making and project success.
3. U.S. and Virginia transportation P3s in historical context
The United States faces a significant challenge in paying for itstransportation infrastructure: while the demand for renewal andcapacity expansion of existing systems continues to grow, thepurchasing power of traditional revenue sources continues toerode and tax increases are generally politically untenable. Federalagencies, as well as state and local governments are examiningalternative policy instruments to meet their needs. P3s have gainedrecognition in recent years and have received increasing attentionin scholarly and policy discussions.
The National Council of Public–Private Partnerships (NCPPP), anon-profit organization that is active in research and publiceducation about P3s, defines a P3 as ‘‘a contractual agreementbetween a public agency (federal, state or local) and a privatesector entity. Through this agreement, the skills and assets of eachsector (public and private) are shared in delivering a service orfacility for the use of the general public. In addition to the sharingof resources, each party shares in the risks and reward potential inthe delivery of the service and/or facility’’ (National Council forPublic–Private Partnerships, 2003). Common types of P3s include:operation and maintenance (O&M); design-build (DB); design,build and maintain (DBM); design, build and operate (DBO);design, build, operate and maintain (DBOM); design, build, finance,operate, and maintain (DBFOM); design, build, finance, operate,maintain and transfer (DBOMT); build, operate and transfer (BOT);and build, own and operate (BOO) (U.S. Government Accountabili-ty Office, 1999).
3.1. National transportation P3 initiatives
P3 financing mechanisms have been used on transportationinfrastructure projects in the United States since at least the 19thcentury. For example, the first transcontinental railroad, whichwas completed in 1869, employed a P3 mechanism between thefederal government and two private railroad companies, UnionPacific and Southern Pacific (Loulakis, 2003). The governmentgranted these firms land and advanced money as incentives foraccelerating railway construction.
Modern application of P3 arrangements is broad and extensive.The publication Public Works Financing catalogs P3 capital projectsin various sectors at many stages of development, extending from1985 until today. Its dataset contains records for a total of 678 non-military P3 infrastructure projects between 1986 and 2011: as ofJune 2012, 464 non-military projects have been completed/underconstruction, and 214 projects have been proposed but have notreached financial closure (Public Works Financing, 2013).
The U.S. federal government has enacted key legislation topromote innovative financing of transportation infrastructure. Oneleading example is the Transportation Infrastructure Finance andInnovation Act (TIFIA), initially passed in 1998, which established afederal credit assistance program for transportation projects under
the U.S. Department of Transportation. Between 1999 and 2012,the program has provided US$7.9 billion in federal support in theform of secured loans, loan guarantees and standby lines of creditfor 22 projects nationwide, which has leveraged US$21.5 billion inmatching funds for transportation infrastructure investment (U.S.Department of Transportation, 2010). A key feature of the programis that TIFIA is subordinated to other project debt, which has thepotential to provide credit support for a project that would nototherwise be financially viable. TIFIA has expanded the privatesector’s ability to be involved in transportation project financing.With continued federal financial support, the P3 mechanism islikely to have more opportunities for transportation projects.
The 2012 national surface transportation legislation, MovingAhead for Progress in the 21st Century Act (MAP-21), promotes P3sfor transportation projects in several ways. The Act requires ‘‘theSecretary to develop policies and procedures to (1) promote publicunderstanding of the role of private investment in publictransportation projects and (2) better coordinate the public andprivate sectors with respect to public transportation service’’(Kessler and Mari, 2012).
Second, MAP-21significantly expands the TIFIA program, fromits previous level of US$175 million per year to US$750 million infiscal year 2013 and US$1 billion in fiscal year 2014. Furthermore,the program’s selection criteria have been clarified. Previously,executive branch priorities, such as a project’s ability to enhance‘‘livability,’’ had sometimes been used as a selection criterion(Poole, 2012).
Third, the MAP-21 provides increased opportunities for tollingof P3-procured highway projects. The new legislation revises thestatutory provisions governing tolling on highways constructedwith federal assistance to allow tolling on Interstate capacityexpansion projects. It also requires that ‘‘all Federal-aid highwaytoll facilities implement technologies or business practices thatprovide for the interoperability of electronic toll collection byOctober 1, 2016’’ (U.S. Federal Highway Administration, 2012).These tolling changes had the overall effect of generating new P3opportunities across the United States. A restriction on adding tollsto existing highway lanes remains in place for all interstatehighways except for a small number of demonstration projects.
3.2. Virginia transportation P3 initiatives
The Virginia Department of Transportation (VDOT) is the stateagency responsible for strategic planning, construction, opera-tions, and maintenance of highways in the Commonwealth ofVirginia. On March 25, 1995, then Governor George Allen, aRepublican, signed into law the Public–Private Transportation Act of
1995 (PPTA), a law aimed at addressing local, regional, and statetransportation needs through ‘‘improving safety, increasingcapacity, enhancing economic efficiency, and reducing congestionwhile preserving the public’s desire to have timely transportationdevelopment’’ (Virginia General Assembly Legislative InformationSystem, 1995). In passing the bill the Virginia legislaturerecognized that public monies might not be enough to properlydevelop, finance, and/or operate transportation facilities, andallowed private companies to acquire, improve, construct,maintain, and/or operate either one or multiple transportationstructures when doing so could improve public welfare bydelivering transportation projects in a timely and/or less costlymanner (Virginia General Assembly Legislative InformationSystem, 1995).
On July 1, 1995, the date the bill took effect, VDOT issuedImplementation Guidelines. Furthermore the PPTA authorized theselection of both solicited and unsolicited proposals; and theconsideration of Alternative Technical Concepts (ATCs) whenreviewing bids. Ultimately both the ability to accept unsolicited

Fig. 3. Value of greenfield transportation P3s closed in 2012.
OTP3 Fact Sheet (OTP3, 2013b).
N. Daito et al. / Case Studies on Transport Policy 1 (2013) 35–4538
bids and to consider ATCs played a major role in the developmentof the 495 Express Lanes project. On April 6, 2002, then GovernorMark Warner, a Democrat, signed into legislation an amendmentto the PPTA to allow tolling on existing interstate systems toincrease highway capacity.
The development of transportation P3s in Virginia has enjoyedbroad bipartisan support. Both Democratic and Republicanlegislatures and governors have approved the creation of P3s fortransportation projects in the Commonwealth.
However, despite the PPTA’s mission, very few highwayprojects were completed during the first sixteen years of thelegislation’s existence. Since it was enacted in 1995, only four PPTAprojects have been completed: State Route 895 (the PocahontasParkway), a 9-mile (14.5-km) toll road in Richmond, Virginia,connecting Interstate 95 with Interstate 295, which opened in2002; State Route 288, a 17.5-mile (28-km) stretch aroundRichmond (2004); State Route 199 near Williamsburg (2005);and State Route 58, a 36-mile (5-km) corridor from Hillsville toStuart in western Virginia (Phase 1 in 2006, Phase 2 in 2011).Pocahontas Parkway has experienced financial problems, notmeeting traffic expectations and toll revenue, and was unable topay its P3 debt. Despite bringing on private concessionaireTransurban in 2006 to operate and maintain the road, it hascontinued to flounder and, subsequently, Transurban wrote downthe US$138 million debt for the project and registered a 50% fall inprofit in 2012 due to the highway’s failure (O’Sullivan, 2012).Further, in June 2013 Transurban’s board decided to concede thetransfer of the underperforming road to its lenders (Glazier,2013a). Nevertheless, throughout this process, Transurban stillcontinued its obligation to the 495 Express Lanes project, which itsigned in December 2007.
In June 2011, Virginia Governor Bob McDonnell, a Republican,established the Office of Transportation Public–Private Partner-ships (OTP3) for the purpose of developing and implementing astatewide program for transportation project delivery via the PPTA.Under this mission, OTP3 is sanctioned to work in conjunction with
Fig. 4. Virginia PPTA projects completed and under construction.
OTP3 (OTP3, 2013a).
the Secretary of Transportation, Virginia Department of Transpor-tation, Virginia Department of Rail and Public Transportation,Virginia Department of Aviation, Virginia Department of MotorVehicles, Virginia Commercial Space Flight Authority, and theVirginia Port Authority on the development of public–privateprojects across all modes of transportation (OTP3, 2013a).
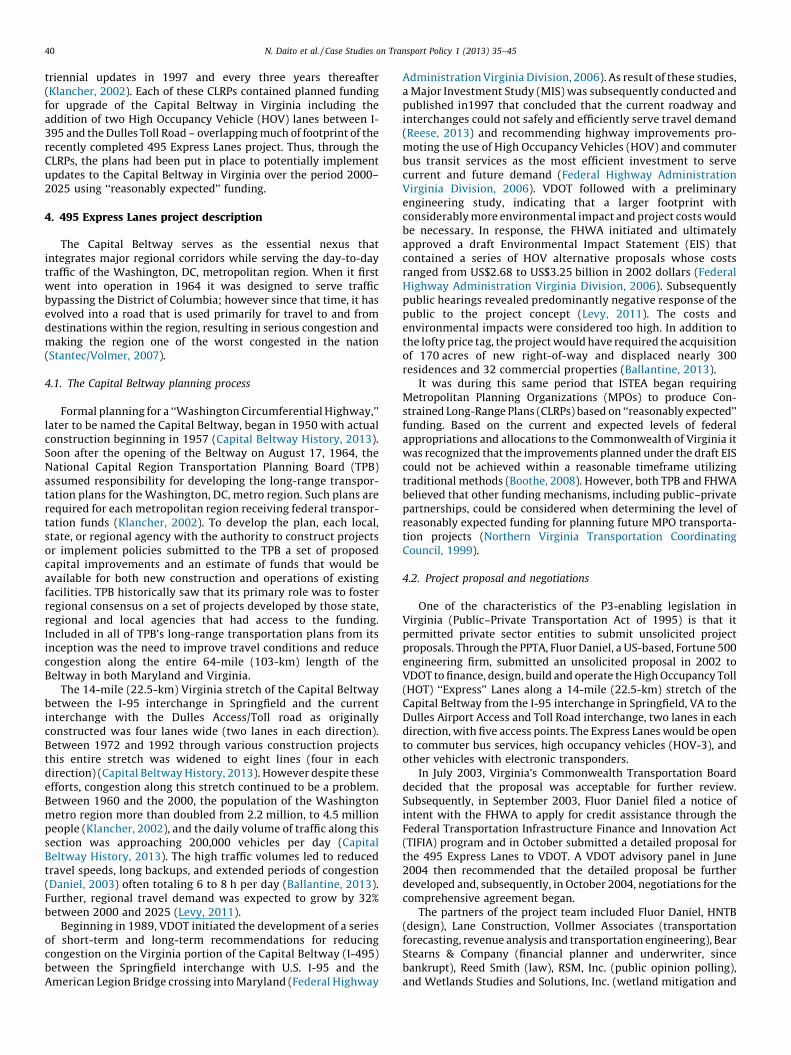
The year following the creation of the OTP3 saw significantincrease in the amount of P3 activity in Virginia. In 2012, financialclose was reached on the US$1.4 billion U.S. 460 corridor,groundbreaking occurred on the US$2.1 billion Midtown Tunneland US$935 million 95 Express Lane projects, and the 495 ExpressLanes were completed and opened for traffic. All told, the OTP3estimates that nearly US$3 billion in greenfield transportation P3sclosed in 2012, placing Virginia second in the world behind theUnited Kingdom in the value of projects closed by a governmentjurisdiction in 2012 (Fig. 3). In addition, four PPTA projects areunder construction (Fig. 4), two are under procurement, andanother fourteen are under consideration (Fig. 5).

Fig. 5. Virginia OTP3 project pipeline through June 2012.
OTP3 (OTP3, 2013a).
N. Daito et al. / Case Studies on Transport Policy 1 (2013) 35–45 39
The OTP3, Virginia’s Public–Private Transportation Act and thepublic–private partnerships they have spawned are not withoutcontroversy. Some opponents feel that the PPTA lacks adequatesafeguards to protect the public interest, that too little informationis being shared with the public, and that too much power has beencentralized within the OTP3 (Pollard, 2012). The ability of firms tosubmit unsolicited bids has raised concerns about the competi-tiveness of the P3 process. Some feel that the PPTA underminessound transportation planning by advancing projects that are nothigh priorities for the public and consequently using staterevenues at the expense of other projects (VCN, 2013). Othersbelieve that users are being burdened with excessive tolls and thatconcessionaires are reaping too much revenue at the public’sexpense. This issue was cited in a Virginia circuit court judge’sruling in May 2013 declaring that the tolling provisions establishedunder the Virginia Public–Private Transportation Act, violated thestate’s constitution (Glazier, 2013b). The decision is currentlybeing appealed. Finally there are concerns that highway projectslike the 495 Express Lanes, described further below, subsidizesprawl and increase motor vehicle dependence, destroying openspace and increasing air and water pollution (VCN, 2013).
3.3. Virginia and regional Washington metro transportation planning
process
In December 1991, the U.S. Congress enacted the IntermodalSurface Transportation Efficiency Act (ISTEA), which included arequirement for all U.S. states to implement a statewidetransportation planning process that considers all transportationmodes and connections between and within each state (VirginiaStatewide Intermodal Long-Range Transportation PolicyPlan, 1995). Current Virginia law directs the Commonwealth
Transportation Board (CTB) to develop the Virginia StatewideMultimodal Transportation Plan (SMTP); and, within that plan,VDOT has responsibility to develop the State Highway Plan SHP(Virginia Department of Transportation, 2013). As of thepublication of the last SMTP in November 2010, VDOT wasmaintaining 57,729 centerline miles (92,906 km) of roadway,including 1119 miles (1801 km) of interstate highways, makingit the third largest system in the country behind North Carolinaand Texas (Virginia Surface Transportation Plan 2035, 2010).Virginia’s State Highway Plan is reviewed and updated by VDOTevery four years and is not financially constrained and is thusintended to provide an inventory of recommended improve-ments needed to address capacity and other highway issues,regardless of funding (Virginia Department of Transportation,2013).
However, ISTEA also amended the Federal-Aid Highway Act of
1962 by requiring all Metropolitan Planning Organizations (MPOs)to now develop financially constrained long-range transportationplans. Unlike the VDOT SHP, the MPO plans are financiallyconstrained to include only projects that the region can afford tobuild and operate during a minimum 20-year planning period.Thus, under federal planning regulations, MPOs must be able toimplement the projects in what is known as the Constrained Long-Range Plan (CLRP) within the time frame of the plan with revenuesthat are ‘‘reasonably expected’’ to be available (Klancher, 2002).
The MPO for the Washington, DC, metropolitan region is theNational Capital Region Transportation Planning Board (TPB),which is comprised of representatives of local governments, statetransportation agencies (including VDOT), the Maryland andVirginia General Assemblies; and the Washington MetropolitanArea Transit Authority (WMATA). The TPB produced the first CLRPfor the metropolitan Washington region in 1994, with subsequent
N. Daito et al. / Case Studies on Transport Policy 1 (2013) 35–4540
triennial updates in 1997 and every three years thereafter(Klancher, 2002). Each of these CLRPs contained planned fundingfor upgrade of the Capital Beltway in Virginia including theaddition of two High Occupancy Vehicle (HOV) lanes between I-395 and the Dulles Toll Road – overlapping much of footprint of therecently completed 495 Express Lanes project. Thus, through theCLRPs, the plans had been put in place to potentially implementupdates to the Capital Beltway in Virginia over the period 2000–2025 using ‘‘reasonably expected’’ funding.
4. 495 Express Lanes project description
The Capital Beltway serves as the essential nexus thatintegrates major regional corridors while serving the day-to-daytraffic of the Washington, DC, metropolitan region. When it firstwent into operation in 1964 it was designed to serve trafficbypassing the District of Columbia; however since that time, it hasevolved into a road that is used primarily for travel to and fromdestinations within the region, resulting in serious congestion andmaking the region one of the worst congested in the nation(Stantec/Volmer, 2007).
4.1. The Capital Beltway planning process
Formal planning for a ‘‘Washington Circumferential Highway,’’later to be named the Capital Beltway, began in 1950 with actualconstruction beginning in 1957 (Capital Beltway History, 2013).Soon after the opening of the Beltway on August 17, 1964, theNational Capital Region Transportation Planning Board (TPB)assumed responsibility for developing the long-range transpor-tation plans for the Washington, DC, metro region. Such plans arerequired for each metropolitan region receiving federal transpor-tation funds (Klancher, 2002). To develop the plan, each local,state, or regional agency with the authority to construct projectsor implement policies submitted to the TPB a set of proposedcapital improvements and an estimate of funds that would beavailable for both new construction and operations of existingfacilities. TPB historically saw that its primary role was to fosterregional consensus on a set of projects developed by those state,regional and local agencies that had access to the funding.Included in all of TPB’s long-range transportation plans from itsinception was the need to improve travel conditions and reducecongestion along the entire 64-mile (103-km) length of theBeltway in both Maryland and Virginia.
The 14-mile (22.5-km) Virginia stretch of the Capital Beltwaybetween the I-95 interchange in Springfield and the currentinterchange with the Dulles Access/Toll road as originallyconstructed was four lanes wide (two lanes in each direction).Between 1972 and 1992 through various construction projectsthis entire stretch was widened to eight lines (four in eachdirection) (Capital Beltway History, 2013). However despite theseefforts, congestion along this stretch continued to be a problem.Between 1960 and the 2000, the population of the Washingtonmetro region more than doubled from 2.2 million, to 4.5 millionpeople (Klancher, 2002), and the daily volume of traffic along thissection was approaching 200,000 vehicles per day (CapitalBeltway History, 2013). The high traffic volumes led to reducedtravel speeds, long backups, and extended periods of congestion(Daniel, 2003) often totaling 6 to 8 h per day (Ballantine, 2013).Further, regional travel demand was expected to grow by 32%between 2000 and 2025 (Levy, 2011).
Beginning in 1989, VDOT initiated the development of a seriesof short-term and long-term recommendations for reducingcongestion on the Virginia portion of the Capital Beltway (I-495)between the Springfield interchange with U.S. I-95 and theAmerican Legion Bridge crossing into Maryland (Federal Highway
Administration Virginia Division, 2006). As result of these studies,a Major Investment Study (MIS) was subsequently conducted andpublished in1997 that concluded that the current roadway andinterchanges could not safely and efficiently serve travel demand(Reese, 2013) and recommending highway improvements pro-moting the use of High Occupancy Vehicles (HOV) and commuterbus transit services as the most efficient investment to servecurrent and future demand (Federal Highway AdministrationVirginia Division, 2006). VDOT followed with a preliminaryengineering study, indicating that a larger footprint withconsiderably more environmental impact and project costs wouldbe necessary. In response, the FHWA initiated and ultimatelyapproved a draft Environmental Impact Statement (EIS) thatcontained a series of HOV alternative proposals whose costsranged from US$2.68 to US$3.25 billion in 2002 dollars (FederalHighway Administration Virginia Division, 2006). Subsequentlypublic hearings revealed predominantly negative response of thepublic to the project concept (Levy, 2011). The costs andenvironmental impacts were considered too high. In addition tothe lofty price tag, the project would have required the acquisitionof 170 acres of new right-of-way and displaced nearly 300residences and 32 commercial properties (Ballantine, 2013).
It was during this same period that ISTEA began requiringMetropolitan Planning Organizations (MPOs) to produce Con-strained Long-Range Plans (CLRPs) based on ‘‘reasonably expected’’funding. Based on the current and expected levels of federalappropriations and allocations to the Commonwealth of Virginia itwas recognized that the improvements planned under the draft EIScould not be achieved within a reasonable timeframe utilizingtraditional methods (Boothe, 2008). However, both TPB and FHWAbelieved that other funding mechanisms, including public–privatepartnerships, could be considered when determining the level ofreasonably expected funding for planning future MPO transporta-tion projects (Northern Virginia Transportation CoordinatingCouncil, 1999).
4.2. Project proposal and negotiations
One of the characteristics of the P3-enabling legislation inVirginia (Public–Private Transportation Act of 1995) is that itpermitted private sector entities to submit unsolicited projectproposals. Through the PPTA, Fluor Daniel, a US-based, Fortune 500engineering firm, submitted an unsolicited proposal in 2002 toVDOT to finance, design, build and operate the High Occupancy Toll(HOT) ‘‘Express’’ Lanes along a 14-mile (22.5-km) stretch of theCapital Beltway from the I-95 interchange in Springfield, VA to theDulles Airport Access and Toll Road interchange, two lanes in eachdirection, with five access points. The Express Lanes would be opento commuter bus services, high occupancy vehicles (HOV-3), andother vehicles with electronic transponders.
In July 2003, Virginia’s Commonwealth Transportation Boarddecided that the proposal was acceptable for further review.Subsequently, in September 2003, Fluor Daniel filed a notice ofintent with the FHWA to apply for credit assistance through theFederal Transportation Infrastructure Finance and Innovation Act(TIFIA) program and in October submitted a detailed proposal forthe 495 Express Lanes to VDOT. A VDOT advisory panel in June2004 then recommended that the detailed proposal be furtherdeveloped and, subsequently, in October 2004, negotiations for thecomprehensive agreement began.
The partners of the project team included Fluor Daniel, HNTB(design), Lane Construction, Vollmer Associates (transportationforecasting, revenue analysis and transportation engineering), BearStearns & Company (financial planner and underwriter, sincebankrupt), Reed Smith (law), RSM, Inc. (public opinion polling),and Wetlands Studies and Solutions, Inc. (wetland mitigation and

N. Daito et al. / Case Studies on Transport Policy 1 (2013) 35–45 41
development and processing of permits). Transurban joined theteam in 2004 as an investor and the concession operator.
Over the next year, negotiations continued, the scope of workwas revised, and the FHWA approved the work agreementauthorizing the negotiation of a comprehensive agreement andconfirmed that the project did not have significant environmentalimpacts. After FHWA and VDOT agreed to proceed with Fluor-Transurban’s proposal, the public partners agreed to a series ofprocurement procedures. In April 2005, the public–privatepartners entered into a Comprehensive Agreement to develop,design, finance, build, maintain, and operate (DBFOM) the 495Express Lanes. A year later, in April 2006, the FHWA signed theenvironmental impact study of the 495 Express Lanes concept withfour additional lanes with significantly smaller project footprintsthan the previous proposals. Meanwhile, the negotiation betweenthe Fluor-Transurban team and VDOT continued. Many challengeswere presented in examining the environmental impact of theproject. Right-of-way restrictions, high ground water, caving soil,
Fig. 6. 495 Express Lanes from I-95 to Dulles Toll Road.
Virginia Megaprojects Capital Beltway HOT Lanes in Virginia (Capital Beltway HOT Lan
overhead power lines, and limited capabilities for installing soundwalls hampered project delivery (GeoStructures Inc., 2013).
On December 1, 2007 a Master Indenture of Trust was createdbetween Capital Beltway Funding Corporation of Virginia andWells Fargo Bank, and on December 19th the contractualobligation was transferred to the combined Fluor-Transurbanentity called the Capital Beltway Express (CBE). Financial closeoccurred on December 20th with the signing of the Amended andRestated Comprehensive Agreement (ARCA) by VDOT and CBE,effectively advancing the project to the construction stage. As Levypoints out, the negotiations from start to finish lasted for five yearsbefore closing (Levy, 2011).
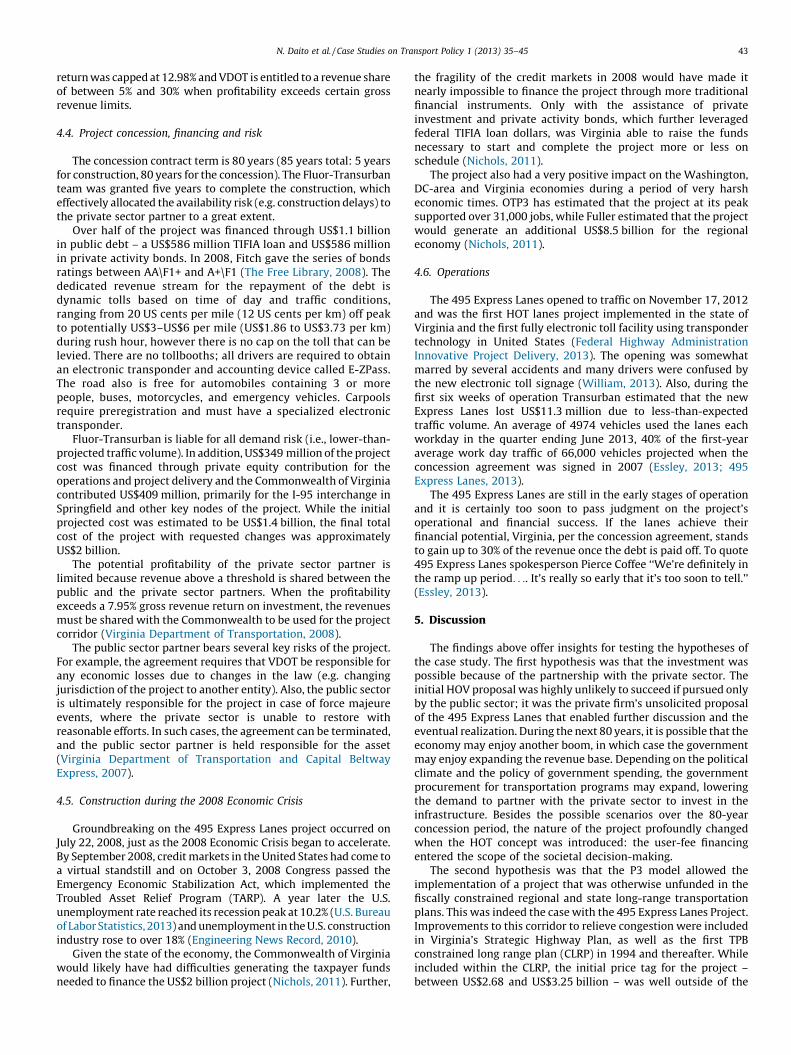
The completed agreement between the public and privatepartners includes a 28-mile (45-km) toll road (14 miles or 22.5-kkm in each direction) between Springfield, Virginia, and the areaof Virginia near the American Legion Bridge, just north of theDulles Toll Road (Fig. 6). Four additional lanes (2 northbound and 2southbound) were to be constructed to provide three-person high
es, 2013).

N. Daito et al. / Case Studies on Transport Policy 1 (2013) 35–4542
occupancy vehicle access (HOV-3) to alleviate traffic in heavilycongested Fairfax while also providing connections to I-95/I-395,the Dulles Toll Road, and I-66.
The agreement had several noteworthy characteristics. Theproject scope included upgrading and reconstructing existingbridges, traffic lanes, interchanges and signs, and an electronic tollpayment system was to be installed. The private sector partner wasresponsible for operation and maintenance of the Express Lanes. TheFluor-Transurban team was obligated to design, build, operate andfinance the project. The construction agreement was a fixed-priceddesign-build contract (Levy, 2011). Furthermore, the agreementrequired the private sector partner to indemnify the public sectorpartner for any legal responsibilities that might arise due to anymisconduct by the private sector partners (Virginia Department ofTransportation and Capital Beltway Express, 2007). Effectively, theconstruction risks were allocated to the private sector partner.
4.3. Project demand
In preparing and presenting its Capital Beltway HOT DetailProposal in October 2003, Flour Daniel relied heavily on surveyedconsumer sentiment, as well as a detailed traffic and revenuedemand forecast conducted by their project partner VollmerAssociates, which was based on 1997 traffic data collected by TPB(Daniel, 2003).
In its Annual Urban Mobility Report, the Texas TransportationInstitute (TTI) has consistently ranked the metropolitan Washing-ton region among the worst large urban regions in annual hours ofdelay per peak hour traveler. In 2005, TTI ranked the Washington,DC, metropolitan area as the second worst in the country with 81%of rush hour mileage occurring in congested conditions, with 60 hof average annual of commuter delay, costing VirginiansUS$2.3 billion annually in delays and wasted fuel (NorthernVirginia Transportation Alliance, 2013). As a result, when surveyed,7-in-10 Northern Virginians supported highway tolls for improve-ments and two-out-of-three northern Virginian’s favored HOTlanes as the proposed solution (Ballantine, 2013). Subsequently, anindependent public opinion survey conducted in September 2003and cited by Fluor Daniel indicated that a proposal to increase thenumber of lanes on the Capital Beltway by adding HOT Laneswould win public acceptance (Daniel, 2003).
The original Vollmer Associates traffic model was based on itsprevious experiences with the SR 91 Express Lanes in California.Tolling revenue was initially estimated to begin in 2005 using a flatrate of US$2.20 per trip or 15.7 US cents per mile (9.8 US cents perkm) (Daniel, 2003). Using the 1997 TPB data (known as TPB Version
Table 1Projected Capital Beltway HOT Lanes toll rates and revenue.
Projected toll transactions, rates and revenues
Year Number toll transactions Percent change Average toll rate Percent cha
2010 14,265,168 $2.58 3.20%
2011 14,444,248 1.26% $2.66 3.10%
2012 14,613,365 1.17% $2.73 2.63%
2013 14,773,327 1.09% $2.81 2.93%
2014 14,924,858 1.03% $2.88 2.49%
2015 15,068,608 0.96% $2.96 2.78%
2016 15,205,161 0.91% $3.04 2.70%
2017 15,335,044 0.85% $3.11 2.30%
2018 15,458,735 0.81% $3.19 2.57%
2019 15,576,665 0.76% $3.26 2.19%
2020 15,689,229 0.72% $3.34 2.45%
2021 15,796,784 0.69% $3.42 2.40%
2022 15,899,657 0.65% $3.49 2.05%
2023 15,998,148 0.62% $3.57 2.29%
2024 16,092,530 0.59% $3.64 1.96%
2025 16,183,056 0.56% $3.72 2.20%
Public Works Financing (Sharn, 2007).
1), Vollmer estimated that the average weekday traffic on theCapital Beltway HOT Lanes would be 283,990 in 2005, of which204,110 would be toll-paying (Daniel, 2003). Vollmer alsoassumed a 5-year ramp up period with capacity reaching 95% in2010 (Daniel, 2003). The numbers were subsequently adjusted toreflect a 2010 opening date, dynamic time-of-day pricing, openingyear tolls ranging from approximately US$1.00 (off-peak) toUS$4.80 (peak hours), and average annual toll rate increases of lessthan 3.3% annually (Daniel, 2003). Based on these adjustednumbers, Vollmer estimated that 2010 revenue would beUS$36.8 million on 14.3 million transactions; rising toUS$60.2 million on 16.2 million transactions in 2025 (seeTable 1). Vollmer then assumed that toll revenue would grow atan annual rate of 2.5% thereafter (Sharn, 2007).
Following release of the Vollmer traffic and revenue forecast,considerable debate ensued regarding the accuracy of the model.Concerns were raised by TPB about the use of the 1997 TPB Version1 traffic data, the length of the average customer trip, the actualconsumer time savings, and the impact of free HOV and changes intraffic patterns resulting from additional network improvementsincluding the opening of the 95 Express Lanes in early 2015 (Kirby,2004). Subsequently, the TPB and Metropolitan WashingtonCouncil of Governments (MWCOG) conducted a new ‘‘sketchlevel’’ traffic and revenue forecast utilizing new TPB data (Version2.1C) that had received federal approval as part of the 2003 updateto the Constrained Long Range Plan. The new TPB/MWCOG sketchanalysis concluded that the proposed Capital Beltway ExpressLanes were a ‘‘complex corridor, with travel demand very largelydriven by regional development patterns’’ including the addition ofnew HOV/HOT connectivity, and that consideration should begiven to amending the framework with Fluor Daniel (andsubsequently Transurban) over time (Kirby, 2004).
A new Vollmer/Stantec traffic study was ultimately finalized inFebruary 2007. It estimated that with opening (now scheduled forlate-2012), the average weekday trips over the first full year ofoperations would be 66,132 vehicles per day with first yearrevenue of US$46.1 million. After four years of operation, volumewas expected to rise to 117,000 weekday trips per day and annualrevenue of US$79 million (Toll Road News, 2013).
Continued concerns about the short- and long-term trafficestimates were ultimately reflected in the concession agreement.For example, no cap was put on toll rates and Fluor-Transurban isentitled to reimbursement of up to 70% of the prevailing toll rate if‘‘free’’ HOV traffic on the Express Lanes exceeds 24% of total traffic forat least 45 min in a single day (Minnesota Department ofTransportation, 2009). However Fluor-Transurban’s annual rate of
nge Toll rate per mile Peak toll rate Annual toll revenue Percent change
$0.184 $4.90 $36,804,133
$0.190 $5.05 $38,363,923 4.24%
$0.195 $5.19 $39,923,712 4.07%
$0.201 $5.34 $41,483,501 3.91%
$0.206 $5.48 $43,043,290 3.76%
$0.211 $5.62 $44,603,079 3.62%
$0.217 $5.77 $46,162,868 3.50%
$0.222 $5.91 $47,722,657 3.38%
$0.228 $6.06 $49,282,446 3.27%
$0.233 $6.20 $50,842,235 3.16%
$0.239 $6.35 $52,402,024 3.07%
$0.244 $6.49 $53,961,813 2.98%
$0.249 $6.63 $55,521,602 2.89%
$0.255 $6.78 $57,081,391 2.81%
$0.260 $6.92 $58,641,180 2.73%
$0.266 $7.07 $60,200,969 2.66%
N. Daito et al. / Case Studies on Transport Policy 1 (2013) 35–45 43
return was capped at 12.98% and VDOT is entitled to a revenue shareof between 5% and 30% when profitability exceeds certain grossrevenue limits.
4.4. Project concession, financing and risk
The concession contract term is 80 years (85 years total: 5 yearsfor construction, 80 years for the concession). The Fluor-Transurbanteam was granted five years to complete the construction, whicheffectively allocated the availability risk (e.g. construction delays) tothe private sector partner to a great extent.
Over half of the project was financed through US$1.1 billionin public debt – a US$586 million TIFIA loan and US$586 millionin private activity bonds. In 2008, Fitch gave the series of bondsratings between AA\F1+ and A+\F1 (The Free Library, 2008). Thededicated revenue stream for the repayment of the debt isdynamic tolls based on time of day and traffic conditions,ranging from 20 US cents per mile (12 US cents per km) off peakto potentially US$3–US$6 per mile (US$1.86 to US$3.73 per km)during rush hour, however there is no cap on the toll that can belevied. There are no tollbooths; all drivers are required to obtainan electronic transponder and accounting device called E-ZPass.The road also is free for automobiles containing 3 or morepeople, buses, motorcycles, and emergency vehicles. Carpoolsrequire preregistration and must have a specialized electronictransponder.
Fluor-Transurban is liable for all demand risk (i.e., lower-than-projected traffic volume). In addition, US$349 million of the projectcost was financed through private equity contribution for theoperations and project delivery and the Commonwealth of Virginiacontributed US$409 million, primarily for the I-95 interchange inSpringfield and other key nodes of the project. While the initialprojected cost was estimated to be US$1.4 billion, the final totalcost of the project with requested changes was approximatelyUS$2 billion.
The potential profitability of the private sector partner islimited because revenue above a threshold is shared between thepublic and the private sector partners. When the profitabilityexceeds a 7.95% gross revenue return on investment, the revenuesmust be shared with the Commonwealth to be used for the projectcorridor (Virginia Department of Transportation, 2008).
The public sector partner bears several key risks of the project.For example, the agreement requires that VDOT be responsible forany economic losses due to changes in the law (e.g. changingjurisdiction of the project to another entity). Also, the public sectoris ultimately responsible for the project in case of force majeureevents, where the private sector is unable to restore withreasonable efforts. In such cases, the agreement can be terminated,and the public sector partner is held responsible for the asset(Virginia Department of Transportation and Capital BeltwayExpress, 2007).
4.5. Construction during the 2008 Economic Crisis
Groundbreaking on the 495 Express Lanes project occurred onJuly 22, 2008, just as the 2008 Economic Crisis began to accelerate.By September 2008, credit markets in the United States had come toa virtual standstill and on October 3, 2008 Congress passed theEmergency Economic Stabilization Act, which implemented theTroubled Asset Relief Program (TARP). A year later the U.S.unemployment rate reached its recession peak at 10.2% (U.S. Bureauof Labor Statistics, 2013) and unemployment in the U.S. constructionindustry rose to over 18% (Engineering News Record, 2010).
Given the state of the economy, the Commonwealth of Virginiawould likely have had difficulties generating the taxpayer fundsneeded to finance the US$2 billion project (Nichols, 2011). Further,
the fragility of the credit markets in 2008 would have made itnearly impossible to finance the project through more traditionalfinancial instruments. Only with the assistance of privateinvestment and private activity bonds, which further leveragedfederal TIFIA loan dollars, was Virginia able to raise the fundsnecessary to start and complete the project more or less onschedule (Nichols, 2011).
The project also had a very positive impact on the Washington,DC-area and Virginia economies during a period of very harsheconomic times. OTP3 has estimated that the project at its peaksupported over 31,000 jobs, while Fuller estimated that the projectwould generate an additional US$8.5 billion for the regionaleconomy (Nichols, 2011).
4.6. Operations
The 495 Express Lanes opened to traffic on November 17, 2012and was the first HOT lanes project implemented in the state ofVirginia and the first fully electronic toll facility using transpondertechnology in United States (Federal Highway AdministrationInnovative Project Delivery, 2013). The opening was somewhatmarred by several accidents and many drivers were confused bythe new electronic toll signage (William, 2013). Also, during thefirst six weeks of operation Transurban estimated that the newExpress Lanes lost US$11.3 million due to less-than-expectedtraffic volume. An average of 4974 vehicles used the lanes eachworkday in the quarter ending June 2013, 40% of the first-yearaverage work day traffic of 66,000 vehicles projected when theconcession agreement was signed in 2007 (Essley, 2013; 495Express Lanes, 2013).
The 495 Express Lanes are still in the early stages of operationand it is certainly too soon to pass judgment on the project’soperational and financial success. If the lanes achieve theirfinancial potential, Virginia, per the concession agreement, standsto gain up to 30% of the revenue once the debt is paid off. To quote495 Express Lanes spokesperson Pierce Coffee ‘‘We’re definitely inthe ramp up period. . .. It’s really so early that it’s too soon to tell.’’(Essley, 2013).
5. Discussion
The findings above offer insights for testing the hypotheses ofthe case study. The first hypothesis was that the investment waspossible because of the partnership with the private sector. Theinitial HOV proposal was highly unlikely to succeed if pursued onlyby the public sector; it was the private firm’s unsolicited proposalof the 495 Express Lanes that enabled further discussion and theeventual realization. During the next 80 years, it is possible that theeconomy may enjoy another boom, in which case the governmentmay enjoy expanding the revenue base. Depending on the politicalclimate and the policy of government spending, the governmentprocurement for transportation programs may expand, loweringthe demand to partner with the private sector to invest in theinfrastructure. Besides the possible scenarios over the 80-yearconcession period, the nature of the project profoundly changedwhen the HOT concept was introduced: the user-fee financingentered the scope of the societal decision-making.
The second hypothesis was that the P3 model allowed theimplementation of a project that was otherwise unfunded in thefiscally constrained regional and state long-range transportationplans. This was indeed the case with the 495 Express Lanes Project.Improvements to this corridor to relieve congestion were includedin Virginia’s Strategic Highway Plan, as well as the first TPBconstrained long range plan (CLRP) in 1994 and thereafter. Whileincluded within the CLRP, the initial price tag for the project –between US$2.68 and US$3.25 billion – was well outside of the

N. Daito et al. / Case Studies on Transport Policy 1 (2013) 35–4544
‘‘reasonable funding’’ that VDOT was likely to receive. Onlythrough the introduction of other funding mechanisms asproposed through Flour Daniel’s unsolicited P3 bid was the projectable to proceed.
The third hypothesis was that employing the P3 procurementled to on-time and on-budget project delivery. Since constructionwas completed in late 2012 and within the five-year windowspecified by the concession agreement, the 495 Express Lanesproject met its schedule. As of August 2013, the project appearsalso to have been completed within the budget specified in thecomprehensive agreement. What remains to be seen is whetherthe highway traffic volume and associated tolls and fees willgenerate sufficient overall revenue to both pay off the project debtand provide the return on investment expected by both the publicand private partners.
Finally, the fourth hypothesis was that employing a P3arrangement enabled a higher project quality and service, openingthe theoretical possibility for lifetime project cost saving attribut-able to P3s. Like the first hypothesis, the jury is still out on whetherthis is truly the case. While the 495 Express Lanes employinnovative technologies (e.g., electronic toll collection and roadimprovements), alternative innovative technology and financingoptions, although possibly more costly, may have had as great asocial benefit. Similar to the first hypothesis, further data on the I-495 safety and financial experience needs to be gathered beforeany conclusion can be made.
Finally, as an instrument implemented during harsh economictimes, the P3 model used for the 495 Express Lanes project appearsto have been a relative success. Financing was secured during aperiod of very tight credit and a project was completed that mightotherwise never have been started. In addition, the projectgenerated both jobs and indirect revenue that help the Virginiaeconomy and the economy of the entire metro Washington, DC,region.
6. Conclusions
Using P3s to design, build, finance, operate, and maintainroads in the Commonwealth of Virginia has had bipartisansupport. In this case, the use of a P3 model appeared to reducethe political risk and offered new ways to finance transportationprojects during challenging economic times. The P3 model alsooffered the opportunity to introduce new ideas and newtechnology to the construction and financing of traditionalhighway infrastructure.
However, P3s within the state of Virginia are not withoutcontroversy. Issues have been raised about the transparency of thebidding and contracting process, that lower priority transportationprojects are being given priority over other public project needs,and that too much authority has been granted to OTP3.
It is too soon to tell how the 495 Express Lanes project will farebut certainly, based on the state’s overall robust P3 activities, it is afinancial model that, at least in the short term, will continue to bepursued. Certainly, future research should be conducted to look atthe operational and maintenance performance of this project toevaluate the life cycle benefits that this P3 financial model mayproduce.
Acknowledgements
The authors would like to extend their gratitude to theCommonwealth of Virginia for its support of the research behindthis paper, and to Public Works Financing for granting access to itsP3 project dataset. Any errors or omissions are the responsibility ofthe authors.
References
Boothe, R. Capital Beltway HOT Lanes Project – SEP 14: Initial Report. FHWANorthern Virginia District, September 2008. http://www.fhwa.dot.gov/progra-madmin/contracts/sep14va2008.cfm (accessed 09.06.13)
Ballantine, W. PPP Case Study: Capital Beltway HOT Lanes. http://www.transporta-tion-finance.org/pdf/events/Wes_Ballantine_Capital_Beltway.pdf (accessed 09.06.13).
Capital Beltway History. http://www.capital-beltway.com/Capital-Beltway-Histor-y.html (accessed 09.06.13).
Capital Beltway HOT Lanes in Virginia: A Partnership to Improve Choice, Mobilityand Safety. Summer 2008. http://www.vamegaprojects.com/tasks/sites/de-fault/assets/File/pdf/HOTLanePresentationCapitalBeltwaySummer2008.pdf(accessed 13.03.13).
F. Daniel. Capital Beltway HOT Lanes Detailed Proposal. October 1, 2003. http://www.vamegaprojects.com/downloads/pdf/FLUOR_Capital_Beltway_HOT_La-nes_Proposal_8MB.pdf (accessed 09.06.13).
Essley, L. New Beltway Express Lanes losing money. The Examiner, February 10,2013. http://washingtonexaminer.com/new-beltway-express-lanes-losing-money/article/2521095 (accessed 13.03.13).
495 Express Lanes. 495 Express Lanes Usage Update – July 2013. http://www.495expresslanes.com (accessed 1.10.13).
Engineering News Record. Construction’s Unemployment Rate Dips Below 2009sLevel. ENR.com November 10, 2010. http://enr.construction.com/business_management/finance/2010/1110-unemploymentdips.asp.
Federal Highway Administration Innovative Project Delivery. Project Profile: I-495Capital Beltway HOT Lanes. http://www.fhwa.dot.gov/ipd/project_profiles/va_capital_beltway.htm (accessed 13.03.13).
Federal Highway Administration Virginia Division. Record of Decision: CapitalBeltway Study. Fairfax County, Virginia. June 29, 2006.
U.S. Federal Highway Administration, 2012. Moving Ahead for Progress in the 21stCentury Act (MAP-21): A Summary of Highway Provisions. Federal HighwayAdministration.
Glazier, K. Virginia Toll Road Goes Back to its Lenders. Bond Buyer (New York, NY)June 25, 2013.
Glazier, K. Controversial Virginia P3 to Be Focus of Conference. Bond Buyer (NewYork, NY) June 26, 2013.
GeoStructures Inc. I-495 HOT Lanes – Washington, DC Capital Beltway. http://www.geostructures.com.
Klancher, W. 2000 Update to the Financially Constrained Long-Range TransportationPlan for the National Capital Region. Metropolitan Washington Council ofGovernments National Capital Region Transportation Planning Board, May 15,2002. http://www.mwcog.org/uploads/pub-documents/C15c20030728141134.pdf (accessed 08.06.13).
Kirby, R. Sketch Level Assessment of Traffic Issues for the Fluor Daniel I-495 HOTLane Proposal. Metropolitan Washington Council of Governments. May 18,2004. http://www.virginiadot.org/projects/resources/I-495_HOTlanesKirby.pdf (accessed 07.06.13).
Kessler, F.W., Mari, R.L., 2012. MAP-21: Treatment of Public–Private PartnershipsUnder Surface Transportation Reauthorization. Nossaman, LLP.
Levy, S.M., 2011. Public–Private Partnerships: Case Studies on Infrastructure De-velopment. ASCE Press, Reston, VA.
Loulakis, M.C., 2003. Design-Build for the Public Sector. Aspen Publishers Online.Lynch, J. Virginia Megaprojects. Presentation November 11, 2010. http://www.va-
megaprojects.com/tasks/sites/default/assets/File/pdf/495hot/presentation/GMU_Presentation_November_11_2010.pdf (accessed 13.03.13).
McDevitt, Betty (November 21, 1944). Express Highway System Plans Revealed forMd. Capital Area. The Washington Post: p. 1.
Minnesota Department of Transportation. Innovative Finance in Action: Virginia I-495 HOT Lanes. October 2009. http://webcache.googleusercontent.com/search?q=cache:ne2kQTwArkQJ:www.dot.state.mn.us/funding/innovative/pdf/casestudies/Toronto407ETR.doc+Innovative+Finance+in+Action+Virginia+I-495+HOT+Lanes&cd=2&hl=en&ct=clnk&gl=us (accessed 07.08.13).
Northern Virginia Transportation Coordinating Council. Northern Virginia (NoVa)2020 Transportation Plan, December 1999. http://www.virginiadot.org/pro-jects/resources/NorthernVirginia/NOVA-20_20Plan_summ_rpt.pdf (accessed09.06.13).
Northern Virginia Transportation Alliance. Only #2 Texas Transportation InstituteReport Ranks Area Second Worse in Annual Hours of Delay. 2007 TTI AnnualUrban Mobility Report. http://www.nvta.org/content.asp?contentid=1589(accessed 10.06.13).
Nichols, C.M. PPP Profiles: I-495 Capital Beltway HOT/HOV lanes. MetropolitanPlanning Council March 10, 2011. http://www.metroplanning.org/news-events/article/6119.
National Council for Public–Private Partnerships, 2003. Critical Choices: The DebateOver public–private Partnerships and What it Means for America’s Future.White Paper, Washington, D.C..
O’Sullivan, M. Transurban Risks Backlash over CEO Pay. The Sydney Morning Herald,August 8, 2012. http://www.smh.com.au/business/transurban-risks-backlash-over-ceo-pay-20120807-23sar.html (accessed 17.11.12).
Virginia Office of Transportation Public–Private Partnerships (OTP3). http://www.vappta.org/ (accessed 13.03.13).
Virginia Office of Transportation Public–Private Partnerships (OTP3) FactSheet. http://www.vappta.org/resources/P3%20Legislative%20Fact%20Sheets%20012513%20Version%204.pdf (accessed 13.03.13).

N. Daito et al. / Case Studies on Transport Policy 1 (2013) 35–45 45
Poole, R., 2012. Reauthorization, Tolling and Public–Private Partnerships. ReasonFoundation July 18.
Pollard, T. Time to overhaul Virginia’s public–private Transportation Act. GreaterWashington, November 28, 2012. http://greatergreaterwashington.org/post/16888/time-to-overhaul-virginias-public-private-transportation-act/ (accessed13.03.13).
Public Works Financing project database.Reese, B. Capital Beltway HOT Lanes PPTA Project In-Principle Business Terms.
http://www.ctb.virginia.gov/resources/Item2_CapBeltway_InPrincipleAgree-ment.pdf (accessed 09.06.13).
Sharn, L. Public Money Launches I-495 HOT Lanes Concession. Public WorksFinancing, December 2007. http://www.pwfinance.net/document/research_re-prints/13%20495%20beltway.pdf (accessed 07.06.13).
Stantec/Volmer. Capital Beltway HOT Lanes Investment Grade Traffic and RevenueStudy. February 2007.
Toll Road News. VA 495 Express Lanes traffic ‘‘below expectations, adjustmentsneeded’’ operator tells shareholders. February 4, 2013. http://www.tollroads-news.com/node/6388 (accessed 07.06.13).
The Free Library. Fitch Rates $589MM Capital Beltway Funding Corp (Virginia) Revs(I-495 Hot Lanes Project) 2008A-D. June 2008. http://www.thefreelibrary.com/Fitch+Rates+%24589MM+Capital+Beltway+Funding+Corp+(Virginia)+Revs..-a0180023247 (accessed 05.09.12).
US Department of Transportation Federal Highway Administration. The GrowingUse of PPPs in the United States. April 6, 2011. http://www.fhwa.dot.gov/reports/pppwave/04.htm (accessed 05.10.12).
U.S. Government Accountability Office, 1999. Public–Private Partnerships: TermsRelated to Building and Facility Partnerships. U.S. Government AccountabilityOffice.
U.S. Bureau of Labor Statistics. http://data.bls.gov/timeseries/LNS14000000(accessed 13.03.13).
U.S. Department of Transportation, 2010. Report to Congress: TransportationInfrastructure Finance and Innovation Act Credit Program. U.S. Departmentof Transportation, Washington, DC.
Valila, Timo, 2005. How Expensive Are Cost Savings? On the Economics of Public–Private Partnerships. EIB Paper. European Investment Bank, Economics Depart-ment.
Virginia Conservation Network (VCN). Public Private Transportation Act Reform.http://www.vcnva.org/index.php/component/content/article/47-our-work/green-communities/transportation/22-public-private-transportation-act-reform (accessed 13.03.13).
Virginia General Assembly Legislative Information System. Public–Private Trans-portation Act of 1995. http://leg1.state.va.us/cgi-bin/legp504.exe?000+cod+TOC56000000022000000000000 (accessed 13.03.13).
Virginia Department of Aviation, Virginia Department of Rail and Public Transpor-tation, Virginia Department of Transportation, and Virginia Port Authority.Virginia Statewide Intermodal Long-Range Transportation Policy Plan,June 1995. http://ntl.bts.gov/lib/23000/23200/23283/multi-appr-95plan3.pdf(accessed 07.06.13).
Virginia Department of Rail and Public Transportation and Virginia Department ofTransportation 2010. Virginia Surface Transportation Plan 2035. November2010. http://www.vtrans.org/resources/VSTP_Entire_Report.pdf. (accessed07.06.13).
Virginia Department of Transportation and Capital Beltway Express, LLC. 2007.Amended and Restated Comprehensive Agreement Relating to the Route 495HOT Lanes in Virginia Project.
Virginia Department of Transportation, 2008. Capital Beltway HOT Lanes in Virgi-nia: A Partnership to Improve Choice, Mobility and Safety.
Virginia Department of Transportation. 2035 State Highway Plan. http://www.virginiadot.org/projects/2035_state_highway_plan.asp (accessed 07.06.13).
William F. Yurasko’s Blog. I-495 Capital Beltway express lanes losing money,saving time for some. http://www.yurasko.net/wfy/2013/02/i-495-capital-beltway-express-lanes-losing-money-saving-time-for-some.html (accessed13.03.13).
Yin, R.K., 2009. Case Study Research: Design and Methods. 4th ed. Applied SocialResearch Methods Series 5. Calif Sage Publications, Los Angeles.
Related Documents