Bank of Canada staff analytical notes are short articles that focus on topical issues relevant to the current economic and financial context, produced independently from the Bank’s Governing Council. This work may support or challenge prevailing policy orthodoxy. Therefore, the views expressed in this note are solely those of the authors and may differ from official Bank of Canada views. No responsibility for them should be attributed to the Bank. www.bank-banque-canada.ca Staff Analytical Note/Note analytique du personnel 2016-5 Implementing Market-Based Indicators to Monitor Vulnerabilities of Financial Institutions by Cameron MacDonald, Maarten van Oordt and Robin Scott

Welcome message from author
This document is posted to help you gain knowledge. Please leave a comment to let me know what you think about it! Share it to your friends and learn new things together.
Transcript

Bank of Canada staff analytical notes are short articles that focus on topical issues relevant to the current economic and financial context, produced independently from the Bank’s Governing Council. This work may support or challenge prevailing policy orthodoxy. Therefore, the views expressed in this note are solely those of the authors and may differ from official Bank of Canada views. No responsibility for them should be attributed to the Bank.
www.bank-banque-canada.ca
Staff Analytical Note/Note analytique du personnel 2016-5
Implementing Market-Based Indicators to Monitor Vulnerabilities of Financial Institutions
by Cameron MacDonald, Maarten van Oordt and Robin Scott
2
Bank of Canada Staff Analytical Note 2016-5
June 2016
Implementing Market-Based Indicators to Monitor Vulnerabilities of Financial Institutions
by
Cameron MacDonald, Maarten van Oordt and Robin Scott
Financial Stability Department Bank of Canada
Ottawa, Ontario, Canada K1A 0G9 [email protected] [email protected]
ISSN 2369-9639 © 2016 Bank of Canada
ii
Acknowledgements
We thank Eric Luo for his excellent research assistance. We are also thankful to Guillaume Bédard-Pagé, Denise Côté, Charles Gaa, Marc-André Gosselin, Ron Morrow, Virginie Traclet, and Isabel Y. Zheng for helpful comments and suggestions. Robin Scott worked on this project during her summer internship in the Financial Stability Department of the Bank of Canada.

iii
Abstract
This note introduces several market-based indicators and examines how they can further inform the Bank of Canada’s vulnerability assessment of Canadian financial institutions. Market-based indicators of leverage suggest that the solvency risk for major Canadian banks has increased since the beginning of the oil-price correction in the second half of 2014. This is in contrast to accounting-based leverage measures, which indicate a stable or improving trend. Similarly, measures of insolvency risk contingent on severe financial stress (i.e., market-based stress tests) indicate that the major banks are currently more vulnerable to a sudden adverse shock than they were in the summer of 2014. Finally, a measure of financial system interconnectedness and common exposures suggests a strong link between the major banks and the rest of the financial system, as expected. In other financial subsectors, the degree of interconnectedness has exhibited an upward trend over the last two decades.
JEL classification: G10; G21 Bank classification: Financial stability; Financial institutions
Résumé
Cette note analytique présente différents indicateurs de marché et examine en quoi ils peuvent contribuer davantage à l’évaluation, par la Banque du Canada, des vulnérabilités des institutions financières canadiennes. D’après les indicateurs de marché mesurant le levier financier, le risque de solvabilité des grandes banques canadiennes s’est accru depuis le repli des prix du pétrole amorcé au second semestre de 2014. Cette observation tranche avec la tendance à la stabilité ou à l’amélioration dont témoignent les indicateurs comptables. Dans le même ordre d’idées, les mesures du risque d’insolvabilité en cas de graves tensions financières (à savoir les tests de résistance appliqués aux marchés) montrent que la vulnérabilité des grandes banques à un choc défavorable inopiné est plus forte aujourd’hui qu’à l’été 2014. Enfin, à en juger par une mesure des interdépendances et des expositions à des facteurs de risque communs dans le système financier, il existe un lien étroit entre les grandes banques et le reste du système financier, comme on pouvait s’y attendre. Dans d’autres segments du système financier, le degré d’interdépendance a eu tendance à augmenter ces vingt dernières années.
Classification JEL : G10; G21 Classification de la Banque : Stabilité financière; Institutions financières

1
Introduction The interpretation of market data in the context of monitoring the stability of financial institutions has become the subject of a rapidly developing academic literature.1 Developments in this field have been further fuelled by the interest of numerous national and international bodies that are con-cerned with financial stability issues.2 This literature has resulted in several new market-based indi-cators that can be used to monitor the vulnerabilities of financial institutions. These indicators are referred to as market-based because they rely to a large extent on market data (i.e., the prices of financial instruments such as stocks and derivative contracts). The Bank of Canada regularly evaluates vulnerabilities in the Canadian financial system using the approach set out by Christensen et al. (2015). The basis of the Bank of Canada’s vulnerability assess-ment incorporates a variety of quantitative and qualitative sources of information across several potential vulnerabilities. While market data and intelligence can inform the assessment in a more qualitative manner, market-based indicators may help to process such information in a structural manner in order to improve the assessment. In particular, market-based indicators can inform the Bank of Canada’s vulnerability assessment in such areas as the solvency of financial institutions, their expected solvency in potential stress scenarios and structural vulnerability from interconnectedness and common exposures.
Pros and Cons An advantage of market-based indicators is that they provide a forward-looking and almost real-time view since market prices are quick to reflect the changing expectations of market participants. In comparison, most accounting-based indicators are backward-looking and released with a significant time lag. The recording of accounting-based data is costly and sometimes requires methodological choices and expert judgment. Moreover, frequent changes in statistical definitions may result in challenges for cross-sectional comparisons or comparisons over time. In contrast, market data are usually easily accessible and relatively inexpensive and can also provide coverage of financial institu-tions for which we may lack comparable accounting-based data. That being said, market-based indicators also have their disadvantages. As a result of random signals in market data and uncertainty inherent in the methodologies used to estimate them, market-based indicators may provide relatively noisy signals, which implies that small differences are often mean-ingless. Market-based indicators may also provide a false sense of safety because potential policy reactions can be incorporated in market prices. For example, low funding costs may not only be the result of creditworthiness but could also be the result of market participants’ expectation of govern-ment support. Moreover, it is almost impossible to infer the direction of shock transmission when relying solely on market data; for example, correlated prices movements may be the result of either
1 For two literature surveys, see De Bandt, Hartmann and Peydró (2012) and Bisias et al. (2012). The indicators discussed in
this note are based on the work of, among others, Merton (1974), Hartmann, Straetmans and De Vries (2007), Acharya, Engle and Richardson (2012), Acharya et al. (forthcoming), Brownlees and Engle (forthcoming), Adrian and Brunnermeier (forthcoming), and Van Oordt and Zhou (2014).
2 Many institutions with responsibilities that involve financial stability monitoring apply some of the market-based indicators discussed in this note; see, for example, Bank of Japan (2015, chart VI-1-7), European Central Bank (2015, chart 1), Interna-tional Monetary Fund (2015, figure 3.16) and the Financial Stability Oversight Committee (2015, figure 7.8.5).
2
common exposures or may stem from interconnectedness. Finally, some accounting-based indicators used in the Bank of Canada’s vulnerability assessment are based on confidential information and may provide a more detailed picture than is available to market participants.3 In summary, accounting- and market-based indicators both have their advantages and disadvantages. The usefulness of information obtained from a given indicator depends on the particular policy ques-tion and the situation at hand. In many situations, accounting- and market-based indicators may provide complementary views.
Scope of Indicators The remainder of this note presents a synopsis of a selection of market-based indicators. These de-scriptions will be supplemented by concrete illustrations of potential applications of these indicators to Canadian financial institutions. The table in Appendix A provides computational details.
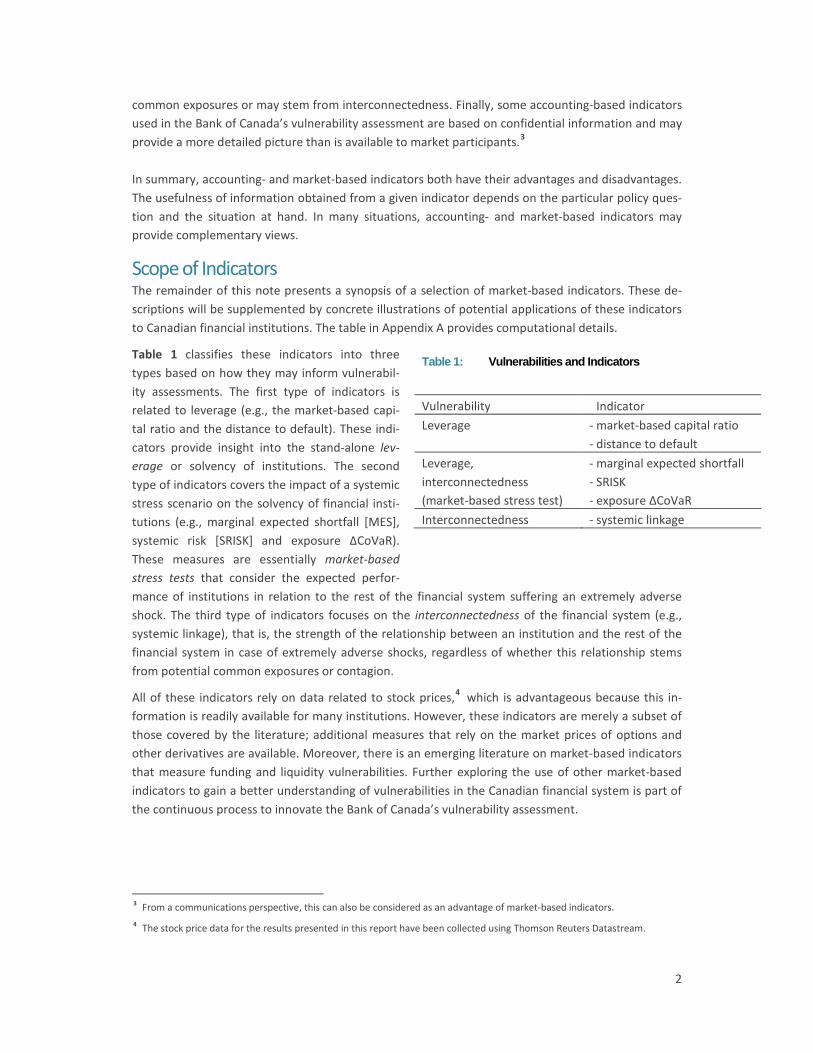
Table 1 classifies these indicators into three types based on how they may inform vulnerabil-ity assessments. The first type of indicators is related to leverage (e.g., the market-based capi-tal ratio and the distance to default). These indi-cators provide insight into the stand-alone lev-erage or solvency of institutions. The second type of indicators covers the impact of a systemic stress scenario on the solvency of financial insti-tutions (e.g., marginal expected shortfall [MES], systemic risk [SRISK] and exposure ∆CoVaR). These measures are essentially market-based stress tests that consider the expected perfor-mance of institutions in relation to the rest of the financial system suffering an extremely adverse shock. The third type of indicators focuses on the interconnectedness of the financial system (e.g., systemic linkage), that is, the strength of the relationship between an institution and the rest of the financial system in case of extremely adverse shocks, regardless of whether this relationship stems from potential common exposures or contagion.
All of these indicators rely on data related to stock prices,4 which is advantageous because this in-formation is readily available for many institutions. However, these indicators are merely a subset of those covered by the literature; additional measures that rely on the market prices of options and other derivatives are available. Moreover, there is an emerging literature on market-based indicators that measure funding and liquidity vulnerabilities. Further exploring the use of other market-based indicators to gain a better understanding of vulnerabilities in the Canadian financial system is part of the continuous process to innovate the Bank of Canada’s vulnerability assessment.
3 From a communications perspective, this can also be considered as an advantage of market-based indicators. 4 The stock price data for the results presented in this report have been collected using Thomson Reuters Datastream.
Table 1: Vulnerabilities and Indicators
Vulnerability Indicator Leverage - market-based capital ratio - distance to default Leverage, interconnectedness (market-based stress test)
- marginal expected shortfall - SRISK - exposure ∆CoVaR
Interconnectedness - systemic linkage

3
Leverage Market-based measures of solvency may simply provide a market equivalent of existing accounting- based measures of leverage (for example, the market-based capital ratio). Additionally, there are market-based solvency measures that do not have an accounting-based counterpart (such as the distance to default) but may nevertheless shed light on the insolvency risk of a given institution, at least from the perspective of market participants.
Market-based capital ratio The market-based capital ratio is a measure of the size of a firm’s capital buffer according to market valuations. A smaller buffer implies greater leverage and a higher degree of insolvency risk. More precisely, the market-based capital ratio is defined as the level of common equity as a percentage of total assets, both in terms of market values. The market value of total assets is calculated as the sum of the market value of common equity and the book value of total debt.
The solid line in Chart 1 shows the average market-based capital ratio across the Big Six banks. The dotted line shows a stressed market-based capital ratio, which serves as an input to the SRISK calcu-lation, as explained in the next section. Over the past decade the market-based capital ratio has been moving steadily within the range from 8 to 11 per cent, with a major exception during the financial crisis. In October 2008, the same month that the Bank of Canada announced exceptional liquidity measures, the ratio dropped from 9.1 to 7.5 per cent, reaching its deepest trough of 5.6 per cent in February 2009. In contrast, the accounting-based capital ratio (dashed line) shows remarkably little of the underlying concerns in this period. Since the start of the recent slide in oil prices in July 2014, the solvency of the Big Six banks has deteriorated somewhat by moving from the top to the lower end of the 8 to 11 per cent range.
Distance to default The distance to default is a proxy for the number of standard deviations in the value of a financial institution’s assets that could erase its capital. A smaller distance to default indicates that a less ex-treme shock could potentially eliminate the institution’s capital, which suggests a higher probability of default. Roughly, the distance to default is calculated as the difference between the market value of assets and the face value of debt, expressed as a ratio of the annualized volatility of the asset val-ue. This measure relies on estimating the Merton model (Merton 1974).
0
2
4
6
8
10
12
14
Jan-2004 Jan-2006 Jan-2008 Jan-2010 Jan-2012 Jan-2014 Jan-2016
%
Market-based averageMarket-based stress test based on long-run marginal expected shortfallAccounting-based average
Chart 1: Leverage: The capital ratio of the Big Six banks
Last observation: April 2016 Sources: Datastream and staff calculations

4
The narrow range in Chart 2 demonstrates that the movements in the distance to default have been very similar for each of the Big Six banks over the past decade. The distance to default confirms some deterioration in the solvency of Canadian banks since the start of the slide in oil prices. With a current average distance to default of 5.5, however, the distance to default is substantially higher than the average of 3.0 in September 2008.5 Therefore, in terms of standard deviations, a shock triggering a potential default must now be more extreme. Judging from the distance to default, there is now less concern about the solvency of the Big Six banks, even though the market-based capital ratios are at similar levels to those in September 2008. (This is because the current level of volatility—the denom-inator of the distance to default—is lower.) Nevertheless, the downward trend in both the market- based capital ratio and the distance to default emphasize the importance of monitoring these devel-opments in the near future.
Market-Based Stress Tests The measures mentioned above provide a market-based assessment of the solvency based on cur-rent market conditions. The question of solvency under alternative scenarios—such as a severe shock to the financial system—can be addressed by the following three measures. These measures can be considered as market-based stress tests.
Marginal expected shortfall The MES is the expected loss of an institution on a day that the financial system6 suffers a sudden adverse shock. The long-run marginal expected shortfall (LRMES) is a measure of an institution’s expected cumulative loss of equity over a prolonged period conditional upon a large shock in the financial system. The higher the MES (or LRMES), the greater the expected loss in a systemic event. The MES can be estimated non-parametrically from daily equity returns (Acharya et al. forthcoming). Estimating the LRMES typically requires modelling the relationship between the institution and the rest of the financial system while allowing for time-varying volatility and correlations. The LRMES can
5 At the end of April, the average distance to default of the Big Six banks in Canada was also relatively high when compared
with the weighted average of a selection of international peers in Australia (4.0), the euro area (2.5), Japan (2.7), the United Kingdom (3.4) and the United States (3.9).
6 In this note, when computing measures for an institution, the financial system is defined as all other listed deposit-taking institutions, life insurers and property and casualty insurers. See Appendix B for more details.
0
2
4
6
8
10
12
14
2004 2006 2008 2010 2012 2014 2016
Range Average
Chart 2: Distance to default of the Big Six banks
Last observation: April 2016 Sources: Datastream and staff calculations

5
subsequently be obtained from simulating future return paths for the institution and the system (Acharya, Engle and Richardson 2012; Brownlees and Engle forthcoming).
The dotted line in Chart 1, which reports the stressed capital ratio of the Big Six banks, is based on LRMES. The stress scenario is calibrated as a 1 per cent worse shock to the Canadian financial system occurring over the next six months. The most recent observation suggests that the scenario is associ-ated with an expected reduction in the market capitalizations of the Big Six banks by roughly 2 per cent of total assets.
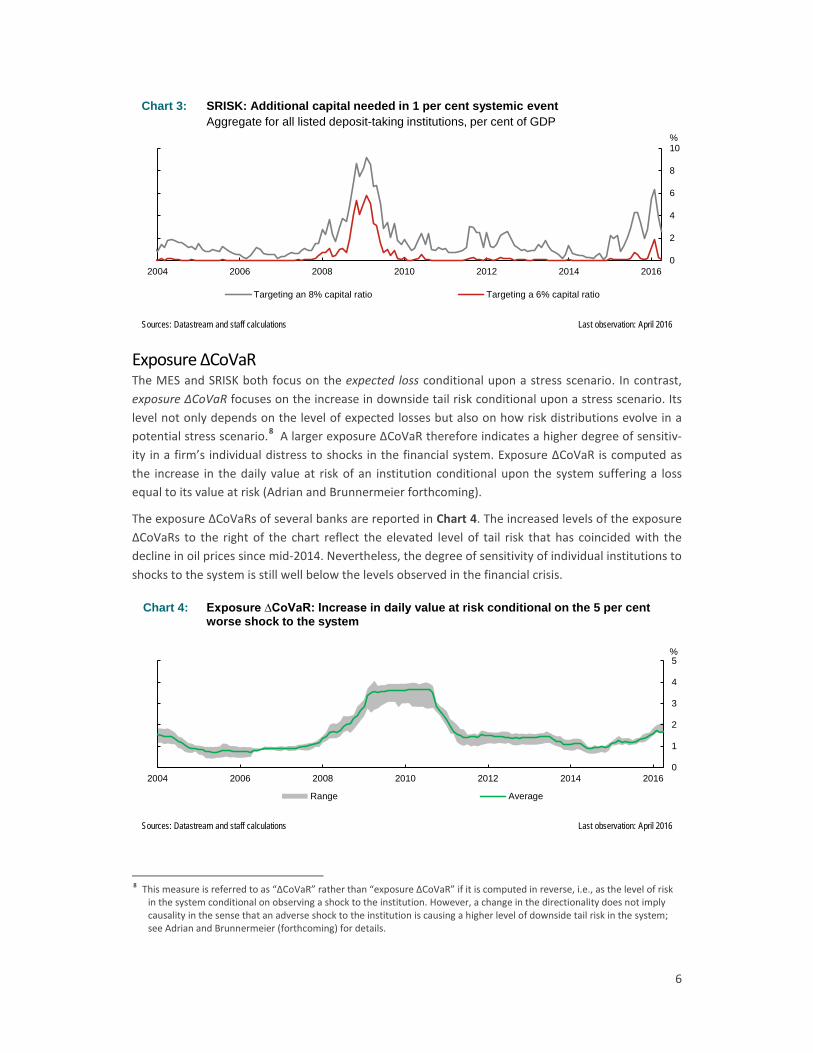
SRISK SRISK is a measure of an institution’s expected capital shortfall relative to a target ratio, conditional upon a market-based stress scenario. In the context of the financial system as a whole, the aggregate SRISK is the total expected sum of money that would be needed to restore the capital ratio of all institutions to the target ratio. Thus, a higher SRISK level implies that a greater capital injection is necessary to restore confidence in financial institutions. The level of SRISK depends on the amount of total assets and the level of the LRMES (described above) (Acharya, Engle and Richardson 2012); Brownlees and Engle forthcoming).
The aggregate SRISK of listed deposit-taking institutions (DTIs) in Canada is shown in Chart 3. The level is interpreted as the expected aggregate amount of capital necessary to restore the market- based capital ratio of all listed DTIs in Canada to a target ratio of both 6 per cent and 8 per cent7 after the stress scenario. The differences between these two lines show the sensitivity of the indica-tor to different levels of the target ratio. The general pattern is that the SRISK has increased since August 2014. This rise reflects the decline in the stressed capital ratio resulting from a decline in the current market-based capital ratio and an increase in the level of volatility (see the dashed line in Chart 1). Moreover, the growth in banking system assets in recent years (60 per cent since 2008) has also contributed to higher levels of SRISK, even when expressed as a percentage of gross domestic product (GDP).
7 Market-based capital ratios are not directly comparable with capital requirements. To account for a higher reported level of
total assets as a consequence of the transition from Canadian generally accepted accounting principles to International Financial Reporting Standard, the target capital ratios have been adjusted downward with a multiplication factor of 0.942 from November 2011 onward. For illustrative purposes we use two target capital ratios: The 8.0 per cent is the standard percentage used in the literature for US institutions, while the 6.0 per cent is in line with the standard percentage of 5.5 per cent used in the literature for European institutions after downward adjustment due to the transition to IFRS (Acharya, Engle and Richardson 2012; Acharya, Engle and Pierret 2014).
6
Exposure ∆CoVaR The MES and SRISK both focus on the expected loss conditional upon a stress scenario. In contrast, exposure ∆CoVaR focuses on the increase in downside tail risk conditional upon a stress scenario. Its level not only depends on the level of expected losses but also on how risk distributions evolve in a potential stress scenario.8 A larger exposure ∆CoVaR therefore indicates a higher degree of sensitiv-ity in a firm’s individual distress to shocks in the financial system. Exposure ∆CoVaR is computed as the increase in the daily value at risk of an institution conditional upon the system suffering a loss equal to its value at risk (Adrian and Brunnermeier forthcoming).
The exposure ∆CoVaRs of several banks are reported in Chart 4. The increased levels of the exposure ∆CoVaRs to the right of the chart reflect the elevated level of tail risk that has coincided with the decline in oil prices since mid-2014. Nevertheless, the degree of sensitivity of individual institutions to shocks to the system is still well below the levels observed in the financial crisis.
8 This measure is referred to as “∆CoVaR” rather than “exposure ∆CoVaR” if it is computed in reverse, i.e., as the level of risk
in the system conditional on observing a shock to the institution. However, a change in the directionality does not imply causality in the sense that an adverse shock to the institution is causing a higher level of downside tail risk in the system; see Adrian and Brunnermeier (forthcoming) for details.
0
2
4
6
8
10
2004 2006 2008 2010 2012 2014 2016
%
Targeting an 8% capital ratio Targeting a 6% capital ratio
Chart 3: SRISK: Additional capital needed in 1 per cent systemic event Aggregate for all listed deposit-taking institutions, per cent of GDP
Last observation: April 2016 Sources: Datastream and staff calculations
0
1
2
3
4
5
2004 2006 2008 2010 2012 2014 2016
%
Range Average
Chart 4: Exposure ∆CoVaR: Increase in daily value at risk conditional on the 5 per cent worse shock to the system
Last observation: April 2016 Sources: Datastream and staff calculations

7
Interconnectedness Any institution interacting with a financial system is capable of either initiating or transmitting a shock. A full understanding of the links within the system is rarely possible to achieve, especially in cases of limited or nonexistent regulatory data. Market-based measures of interconnectedness and common exposures may help to fill in such gaps.
Systemic linkage The systemic linkage of an institution is the proportion of a firm’s overall downside tail risk that is associated with severely adverse shocks to the financial system. The greater the systemic linkage, the stronger the connection between an institution’s extreme losses and systemic events. Computation of the systemic linkage relies on two quantities: the level of tail dependence between the institution and the financial system, which can be estimated by applying extreme value theory approach (Hart-mann, Straetmans and De Vries 2007), and the behaviour of the tail distribution reflecting extremely adverse shocks to the financial system (Van Oordt and Zhou 2014).
The average systemic linkage of various financial subsectors is shown in Chart 5. Compared with other indicators, this measure is fairly stable over time, reflecting the structural nature of intercon-nectedness within the financial system. As expected, the systemic linkage of domestic systemically important banks (D-SIBs) is consistently high, suggesting a strong link with the rest of the financial system during episodes of stress. For life insurers and, to a lesser extent, small banks, we observe an increase in systemic linkage over the previous two decades. This trend could be the result of either rising common exposures or greater interconnectedness within the system.
Conclusion This note introduces several market-based indicators and examines how they can further inform the Bank of Canada’s vulnerability assessment of Canadian financial institutions. Market-based indicators of leverage suggest that the solvency risk for major Canadian banks has increased since the beginning of the oil price correction in the second half of 2014. This is in contrast to accounting-based leverage measures that indicate a stable or improving trend. Similarly, measures of insolvency risk contingent on severe financial stress (i.e., market-based stress tests) indicate that the major banks are currently more vulnerable to a sudden adverse shock than they were in the summer of 2014. Finally, a meas-ure of financial system interconnectedness and common exposures suggests a strong link between
0
20
40
60
80
100
1997 1999 2001 2003 2005 2007 2009 2011 2013 2015
%
Big Six banks (average) Smaller listed deposit-taking institutions (average) Life insurers (average)
Chart 5: Interconnectedness: Fraction of tail risk due to large shocks in the Canadian financial system
Last observation: April 2016 Sources: Datastream and staff calculations

8
the major banks and the rest of the financial system, as expected. In other financial subsectors, the degree of interconnectedness has exhibited an upward trend over the past two decades.
9
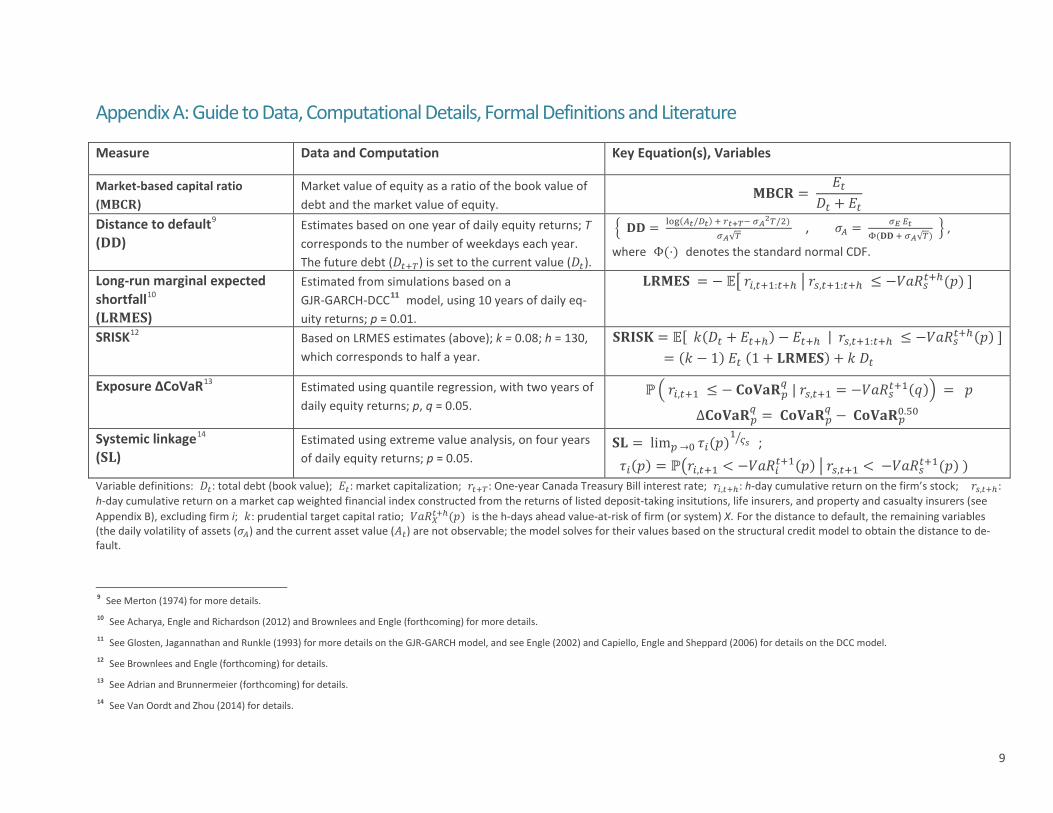
Appendix A: Guide to Data, Computational Details, Formal Definitions and Literature Measure Data and Computation Key Equation(s), Variables
Market-based capital ratio (𝐌𝐌𝐌𝐌)
Market value of equity as a ratio of the book value of debt and the market value of equity.
𝐌𝐌𝐌𝐌 = 𝐸𝑡
𝐷𝑡 + 𝐸𝑡
Distance to default9 (𝐃𝐃)
Estimates based on one year of daily equity returns; T corresponds to the number of weekdays each year. The future debt (𝐷𝑡+𝑇) is set to the current value (𝐷𝑡).
� 𝐃𝐃 = log(𝐴𝑡/𝐷𝑡) + 𝑟𝑡+𝑇− 𝜎𝐴2𝑇/2) 𝜎𝐴√𝑇
, 𝜎𝐴 = 𝜎𝐸 𝐸𝑡Φ(𝐃𝐃 + 𝜎𝐴√𝑇)
� ,
where Φ(⋅) denotes the standard normal CDF.
Long-run marginal expected shortfall10 (𝐋𝐌𝐌𝐋𝐋)
Estimated from simulations based on a GJR-GARCH-DCC11 model, using 10 years of daily eq-uity returns; p = 0.01.
𝐋𝐌𝐌𝐋𝐋 = − 𝔼� 𝑟𝑖,𝑡+1:𝑡+ℎ � 𝑟𝑠,𝑡+1:𝑡+ℎ ≤ −𝑉𝑉𝑉𝑠𝑡+ℎ(𝑝) ]
SRISK12
Based on LRMES estimates (above); k = 0.08; h = 130, which corresponds to half a year.
𝐋𝐌𝐒𝐋𝐒 = 𝔼[ 𝑘(𝐷𝑡 + 𝐸𝑡+ℎ) − 𝐸𝑡+ℎ | 𝑟𝑠,𝑡+1:𝑡+ℎ ≤ −𝑉𝑉𝑉𝑠𝑡+ℎ(𝑝) ] = (𝑘 − 1) 𝐸𝑡 (1 + 𝐋𝐌𝐌𝐋𝐋) + 𝑘 𝐷𝑡
Exposure ∆CoVaR13
Estimated using quantile regression, with two years of daily equity returns; p, q = 0.05.
ℙ� 𝑟𝑖,𝑡+1 ≤ − 𝐌𝐂𝐂𝐂𝐌𝑝𝑞 | 𝑟𝑠,𝑡+1 = −𝑉𝑉𝑉𝑠𝑡+1(𝑞)� = 𝑝
∆𝐌𝐂𝐂𝐂𝐌𝑝𝑞 = 𝐌𝐂𝐂𝐂𝐌𝑝
𝑞 − 𝐌𝐂𝐂𝐂𝐌𝑝0.50
Systemic linkage14 (𝐋𝐋)
Estimated using extreme value analysis, on four years of daily equity returns; p = 0.05.
𝐋𝐋 = lim𝑝 →0 𝜏𝑖(𝑝)1 𝜍𝑠� ;
𝜏𝑖(𝑝) = ℙ�𝑟𝑖,𝑡+1 < −𝑉𝑉𝑉𝑖𝑡+1(𝑝) � 𝑟𝑠,𝑡+1 < −𝑉𝑉𝑉𝑠𝑡+1(𝑝) ) Variable definitions: 𝐷𝑡: total debt (book value); 𝐸𝑡: market capitalization; 𝑟𝑡+𝑇: One-year Canada Treasury Bill interest rate; 𝑟𝑖,𝑡+ℎ: h-day cumulative return on the firm’s stock; 𝑟𝑠,𝑡+ℎ: h-day cumulative return on a market cap weighted financial index constructed from the returns of listed deposit-taking insitutions, life insurers, and property and casualty insurers (see Appendix B), excluding firm i; 𝑘: prudential target capital ratio; 𝑉𝑉𝑉𝑋𝑡+ℎ(𝑝) is the h-days ahead value-at-risk of firm (or system) X. For the distance to default, the remaining variables (the daily volatility of assets (𝜎𝐴) and the current asset value (𝐴𝑡) are not observable; the model solves for their values based on the structural credit model to obtain the distance to de-fault.
9 See Merton (1974) for more details. 10 See Acharya, Engle and Richardson (2012) and Brownlees and Engle (forthcoming) for more details. 11 See Glosten, Jagannathan and Runkle (1993) for more details on the GJR-GARCH model, and see Engle (2002) and Capiello, Engle and Sheppard (2006) for details on the DCC model. 12 See Brownlees and Engle (forthcoming) for details. 13 See Adrian and Brunnermeier (forthcoming) for details. 14 See Van Oordt and Zhou (2014) for details.

10
Appendix B: List of Institutions Included in the Analysis
Name Classification (comment) Bank of Montreal Big Six banks Scotiabank Big Six banks CIBC Big Six banks National Bank Big Six banks Royal Bank Big Six banks TD Bank Big Six banks Laurentian Bank smaller listed DTIs Canadian Western Bank smaller listed DTIs VersaBank smaller listed DTIs Home Capital Group smaller listed DTIs (Holdco for Home Trust) MCAN Mortgage Corporation smaller listed DTIs Equity Financial Holdings smaller listed DTIs (Holdco for EFTC) Equitable Group smaller listed DTIs (Holdco for Equitable Bank) Sun Life Financial life insurance Manulife Financial life insurance Industrial Alliance life insurance Great West Lifeco life insurance E-L Financial life insurance Fairfax Financial Holdings P&C insurance Kingsway Financial Services P&C insurance Intact Financial P&C insurance Echelon Financial Holdings P&C insurance Till Capital P&C insurance Notes: The classification is based on the main activities of the entities listed. DTI means “deposit-taking institu-tion.” P&C insurance means “property and casualty” insurance.

11
References Acharya, V. V., R. F. Engle and M. Richardson. 2012. “Capital Shortfall: A New Approach to Ranking
and Regulating Systemic Risks.” American Economic Review: Papers & Proceedings 102(3): 59–64. Acharya, V. V., R. F. Engle and D. Pierret. 2014. “Testing Macroprudential Stress Tests: The Risk of
Regulatory Risk Weights.” Journal of Monetary Economics 65: 36–53. Acharya, V. V., L. H. Pedersen, T. Philippon, and M. Richardson. (forthcoming). “Measuring Systemic
Risk.” Review of Financial Studies. Adrian, T., and M.K. Brunnermeier. (forthcoming). “CoVaR.” American Economic Review. Bank of Japan. 2015. Financial System Report (October). Bisias, D., M. Flood, A. W. Lo and S. Valavanis. 2012. “A Survey of Systemic Risk Analytics.” Annual
Review of Financial Economics 4: 255–96. Brownlees, C., and R. F. Engle. (forthcoming). “SRISK: A Conditional Capital Shortfall Index for Sys-
temic Risk Measurement.” Review of Financial Studies. Cappiello, L., R. F. Engle and K. Sheppard. 2006. “Asymmetric Dynamics in the Correlations of Global
Equity and Bond Returns.” Journal of Financial Econometrics 4(4): 537–72. Christensen, I., G. Kumar, C. Meh and L. Zorn. 2015. “Assessing Vulnerabilities in the Canadian Finan-
cial System.” Bank of Canada Financial System Review (June) 37–46. De Bandt, O., P. Hartmann and J. L. Peydró. 2012. “Systemic Risk in Banking: An Update.” In A.N. Ber-
ger, P. Molyneux, and J. O. S. Wilson (eds), The Oxford Handbook of Banking, 633–72. Oxford University Press.
Engle, R. F. 2002. ‘‘Dynamic Conditional Correlation: A Simple Class of Multivariate GARCH Models.’’
Journal of Business and Economic Statistics 20: 339–50. European Central Bank. 2015. Financial Stability Review (November). Financial Stability Oversight Council. 2015. Annual Report. Glosten, L. R., R. Jagannathan and D. E. Runkle. 1993. ‘‘On the Relation Between the Expected Value
and the Volatility of the Nominal Excess Return on Stocks.’’ Journal of Finance 48: 1779–1801. Hartmann, P., S. Straetmans and C. G. de Vries. 2007. Banking System Stability: A Cross-Atlantic Per-
spective. In M. Carey and R. M. Stulz (eds.), The Risks of Financial Institutions, 133–192. Universi-ty of Chicago Press.
International Monetary Fund. 2015. Global Financial Stability Report (April). Merton, R. C. 1974. “On the Pricing of Corporate Debt: The Risk Structure of Interest Rates.” Journal
of Finance 29: 449–70. Van Oordt, M. R. C., and C. Zhou (2014). “Systemic Risk and Bank Business Models.” DNB Working
Paper No. 442.
Related Documents