Implementing Grand Lake St. Marys Nutrient TMDL Tom Davenport, USEPA Russ Gibson, Ohio EPA Trinka Mount, Ohio EPA

Welcome message from author
This document is posted to help you gain knowledge. Please leave a comment to let me know what you think about it! Share it to your friends and learn new things together.
Transcript

Implementing Grand Lake p g St. Marys Nutrient TMDL
Tom Davenport, USEPA Russ Gibson, Ohio EPA Trinka Mount, Ohio EPA
Grand ake St. sGrand Lake St. MarysMary
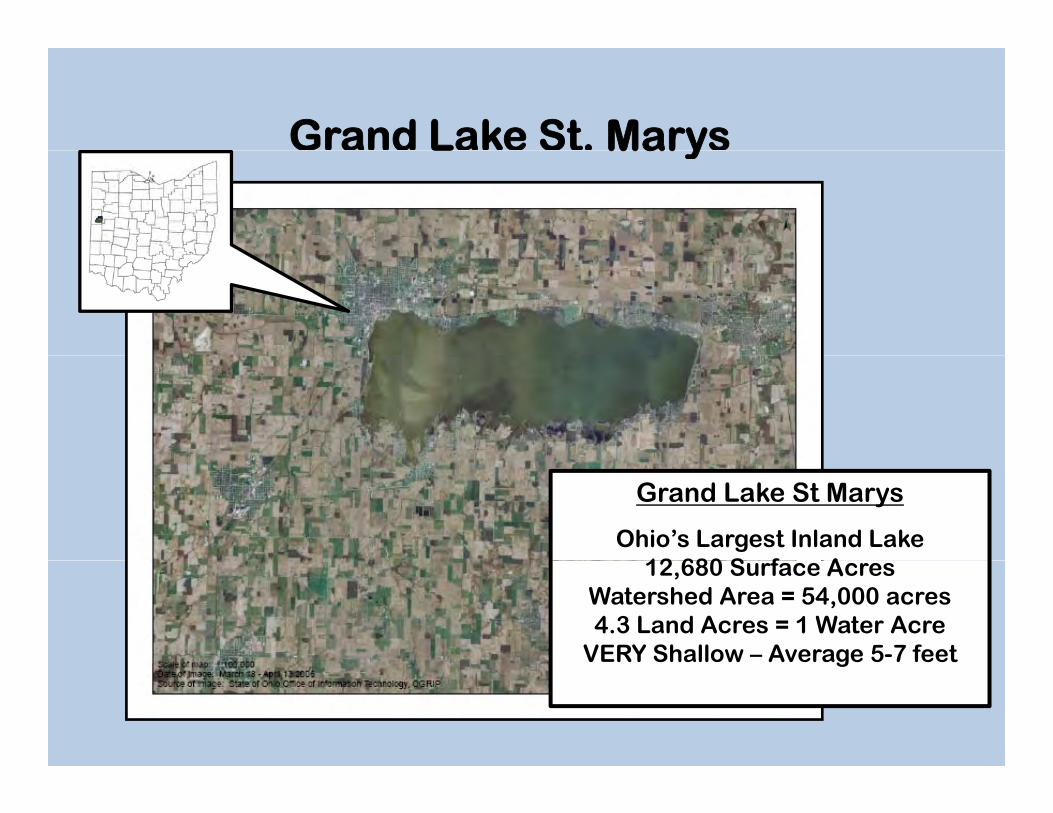
Grand Lake St Marys
Ohio’s Largest Inland Lake 12 680 S f A12,680 Surface Acres
Watershed Area = 54,000 acres 4.3 Land Acres = 1 Water Acre
VERY Shallow – Average 5-7 feetg
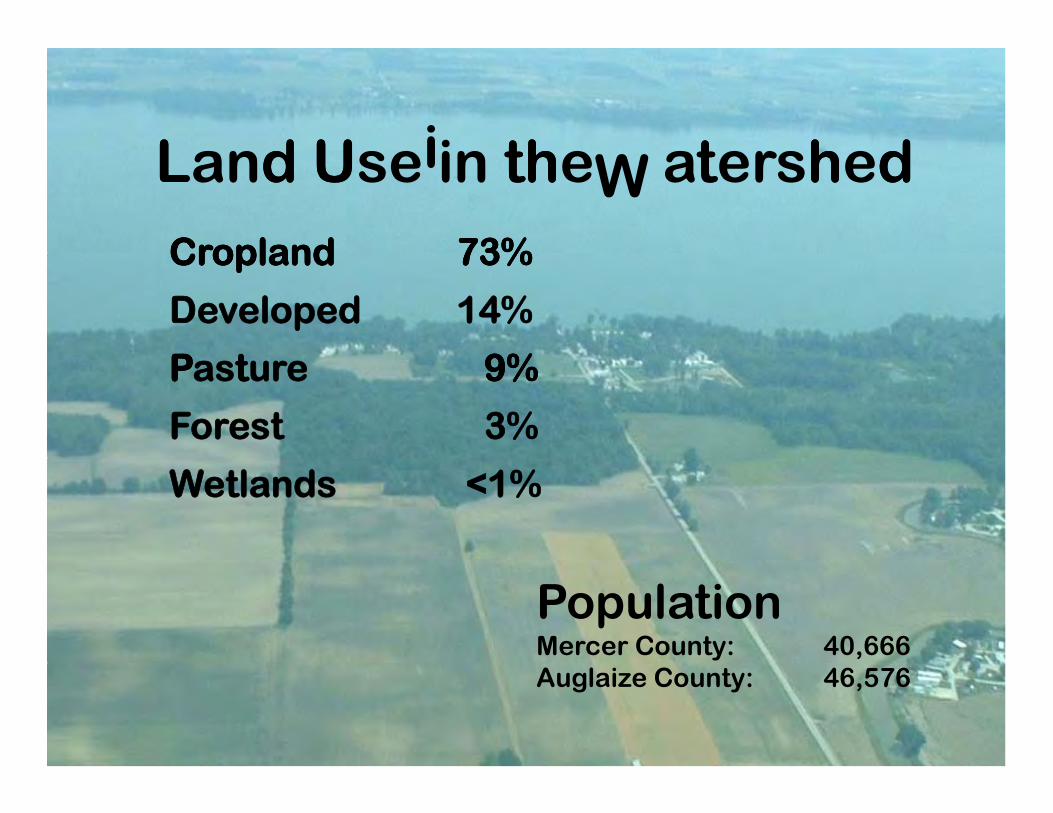
anL d UL d Usei in the th W atert shhedd W
Cropland 73%Cropland 73%
Developed 14%
asP tP ture 9%9%
Forest 3%
Wetlands <1%
Population Mercer County: 40,666 Auglaize County: 46,576
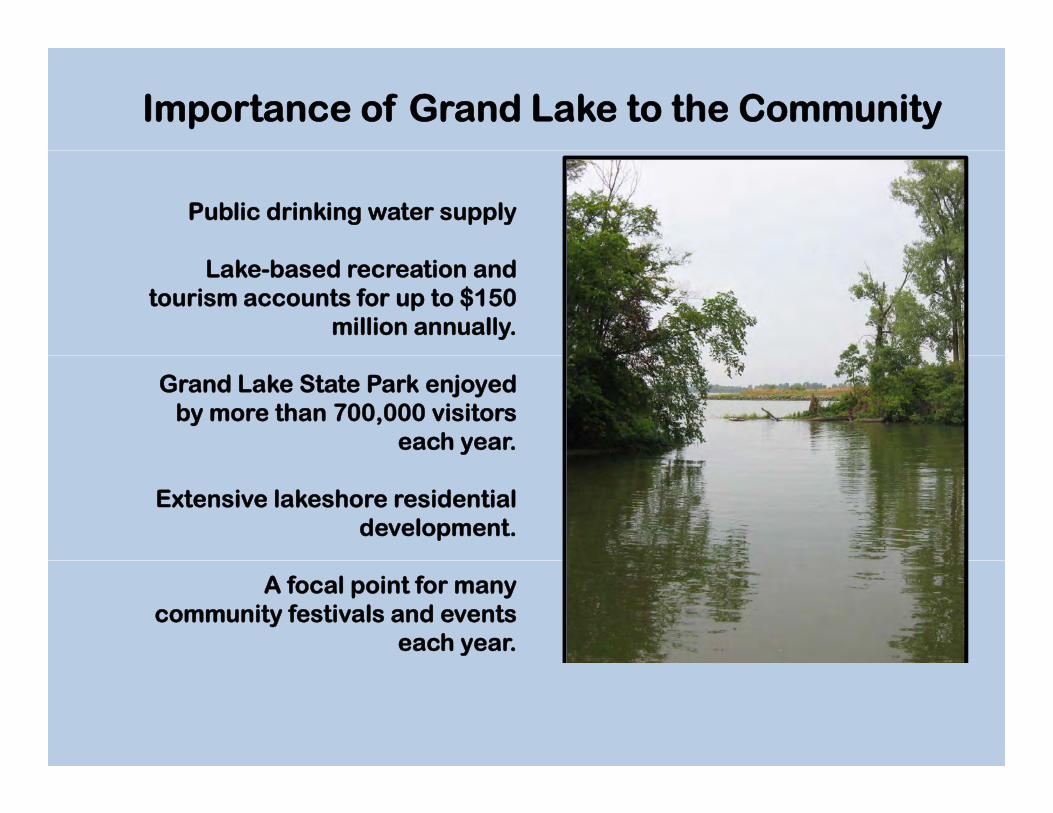
Importance of Grand Lake to the Community
Public drinking water supply
Lake-based recreation and tourism accounts for up to $150
million annually.
Grand Lake State Park enjoyed by more than 700,000 visitors
each year.
Extensive lakeshore residential development.
A focal point for many community festivals and events
each year.
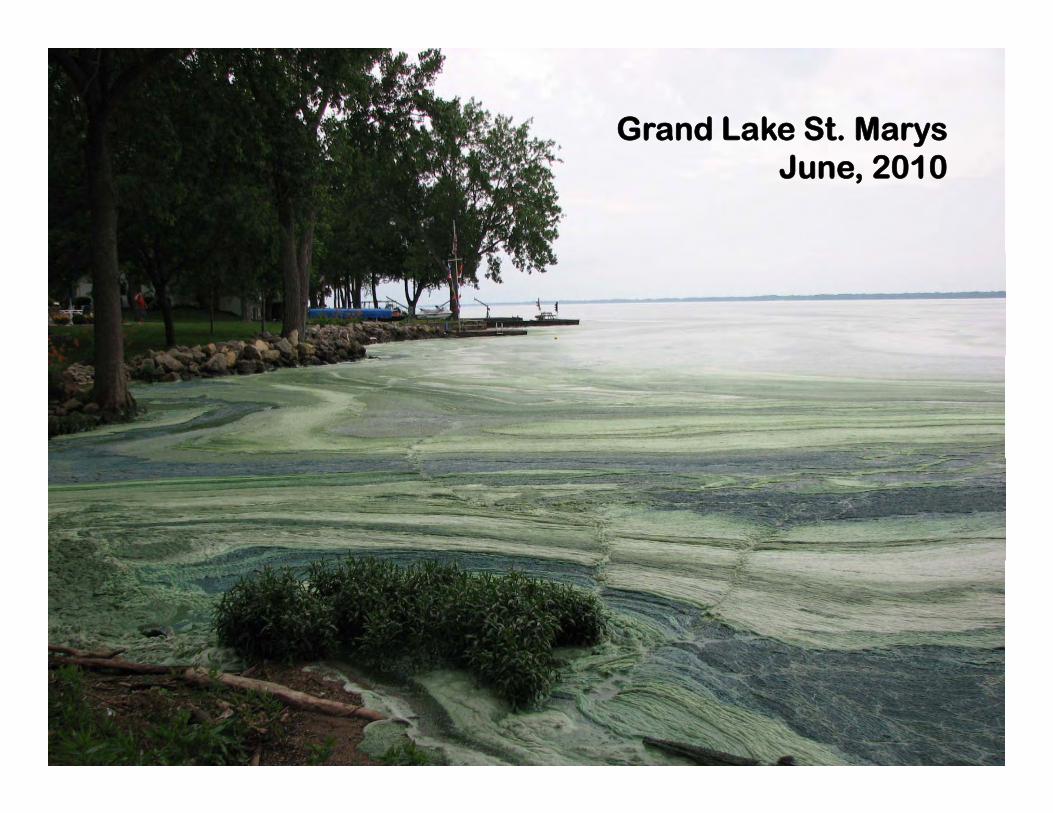
Grand Lake St. Marys June, 2010
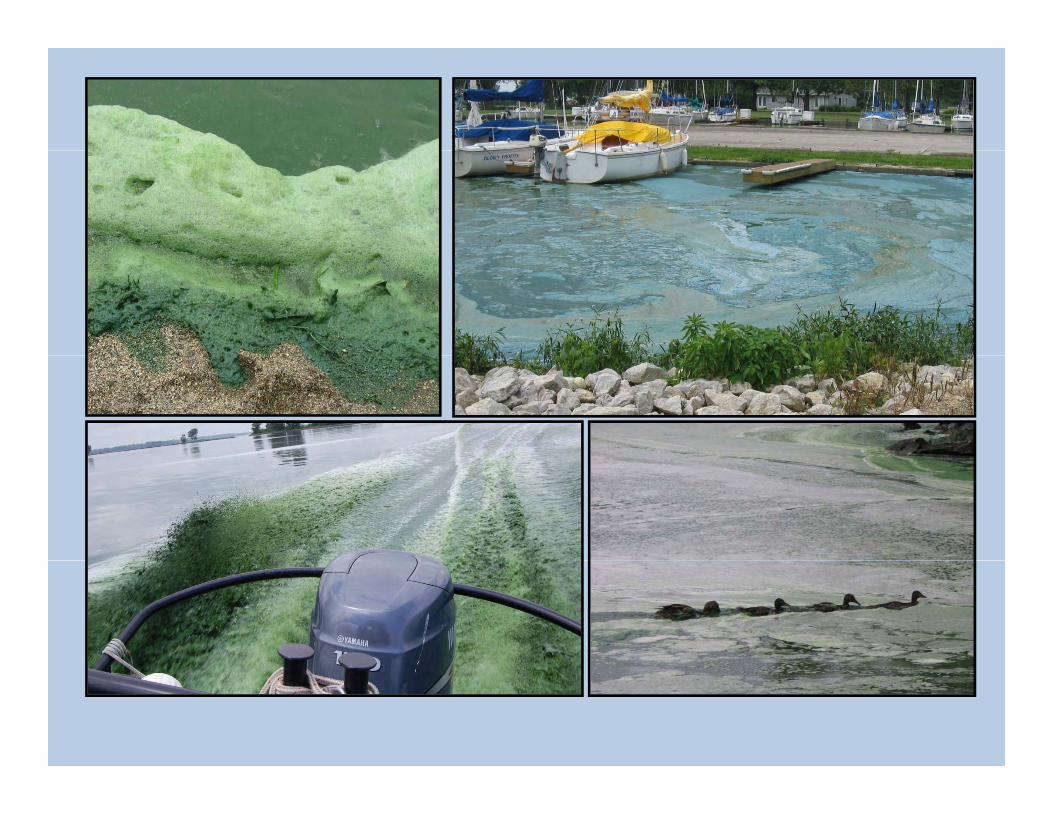
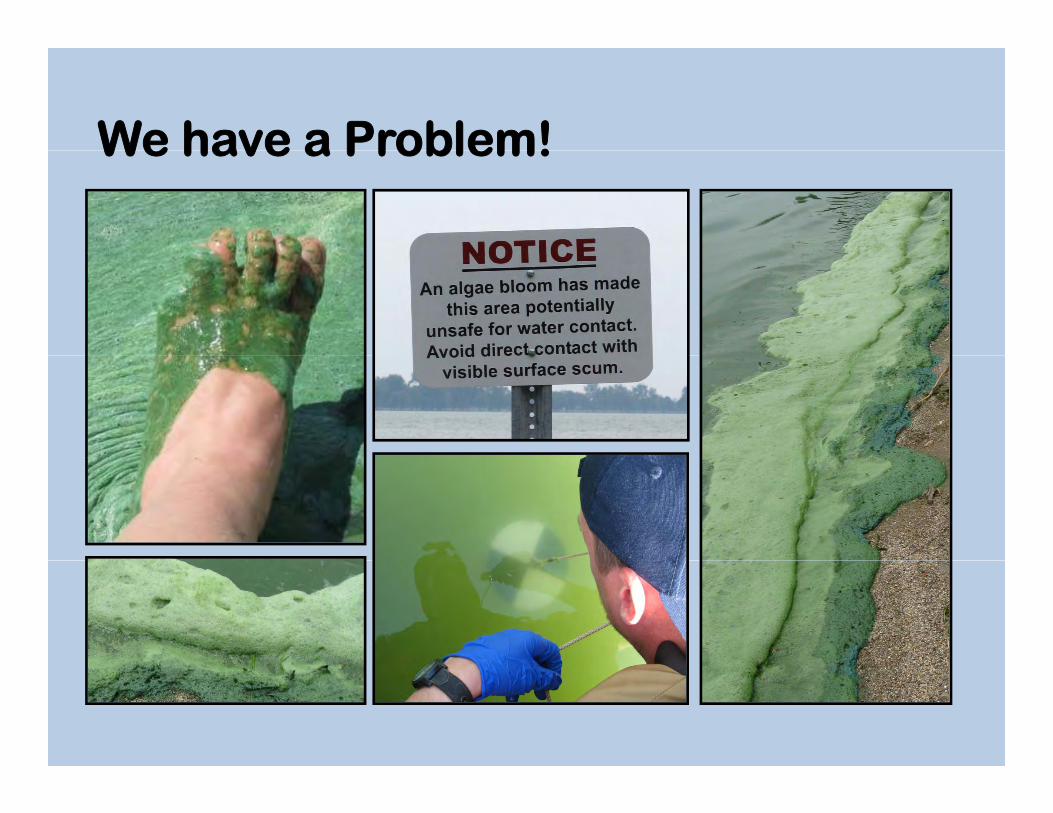
We have a Problem!We have a Problem!
$
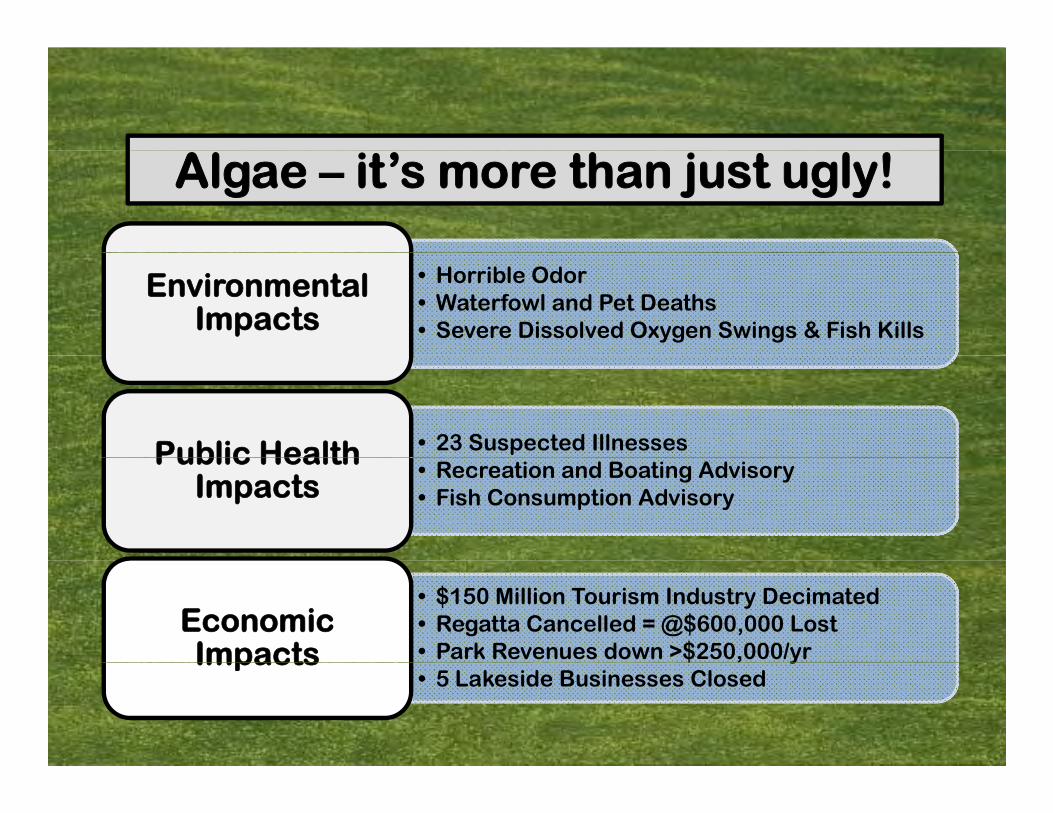
Algae – it’s more than just ugly!
• Horrible Odor Waterfowl and Pet Deaths Severe Dissolved Oxygen Swings & Fish Kills
• •
Environmental Impacts
• 23 Suspected Illnesses Public Health • Recreation and Boating Advisory • Fish Consumption Advisory
Public Health Impacts
• $150 Million Tourism Industry Decimated • Regatta Cancelled = @$600,000 Lost • Park Revenues down >$250,000/yr
Economic Impacts y
• 5 Lakeside Businesses Closed Impacts
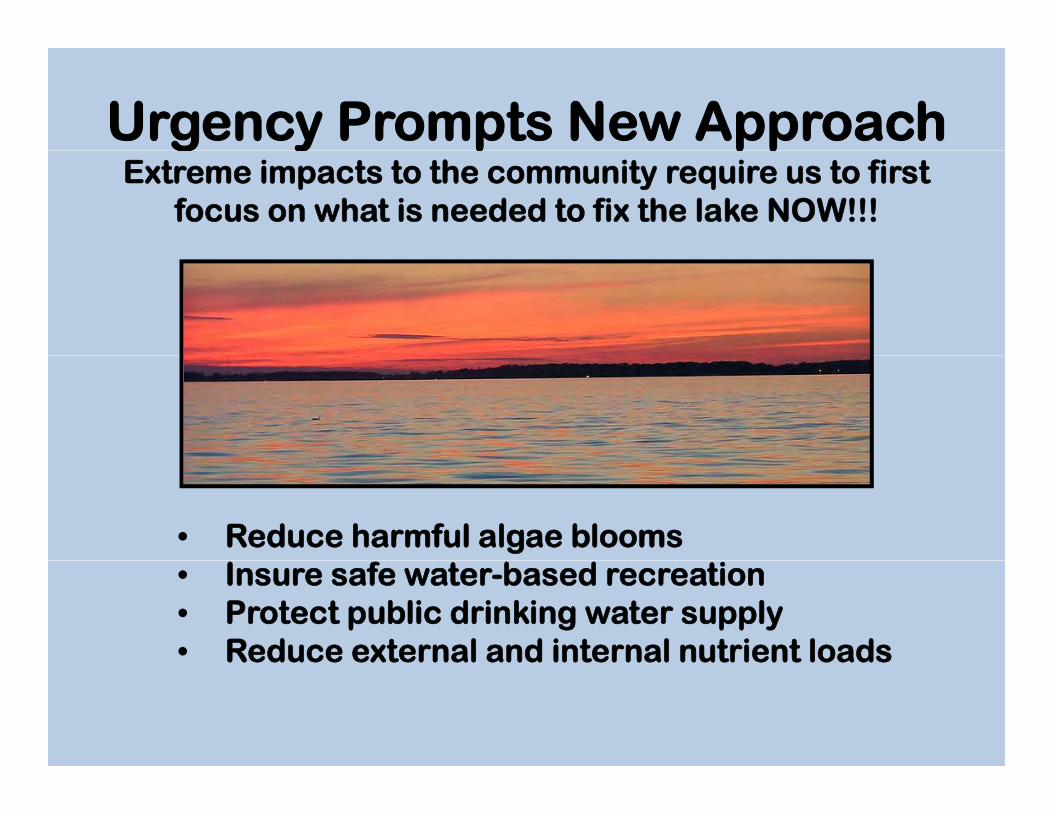
Urggency Promppts New Approach y pp Extreme impacts to the community require us to first
focus on what is needed to fix the lake NOW!!!
• Reduce harmful algae blooms • Insure safe water-based recreation • Protect public drinking water supply • Reduce external and internal nutrient loads

Considerations • Algae blooms are fueled by internal nutrient
cycling as well as external loads.
• In-lake management effectiveness is directly affected by watershed nutrient loads.
• Substantial watershed based nutrient reduction actions will likely require several years.
g
Institutional ChallengesInstitutional Challenges
•Multiple existing plans with impractical timeframes TMDL 9 l t l ODNR l G s p
llan, Locall pllanTMDL, 9-element plan, ODNR plan, Governor’’ L
•Segmented state leadership, authority and missions ODNR – Ohio EPA – Agriculture–Health
•Staggered agency engagement Start & stop syndrome –Tell us what’s going on!!!
•Incomplete data due to USDA 1619 concerns
•Unwillingness to “own the load” Farm lobby and the realities of drainage
Moving forward in Challenging Moving forward in Challenging Circumstances
Established federal, state & local team
Technical assistance through US EPA-R5
Identified REALISTIC Load Reduction Goals
Internal+ External = Total Goal
t W k th
We know th at …
1 INTERNAL 1. INTERNAL P-loads need to be reduced from 200μg/L to between 25-50μg/L.
2. EXTERNAL P-loads need to be reduced by 80% and this will take some time.
3. TRIBUTARY treatment of nutrients will be necessary to reduce loads entering the l klake.
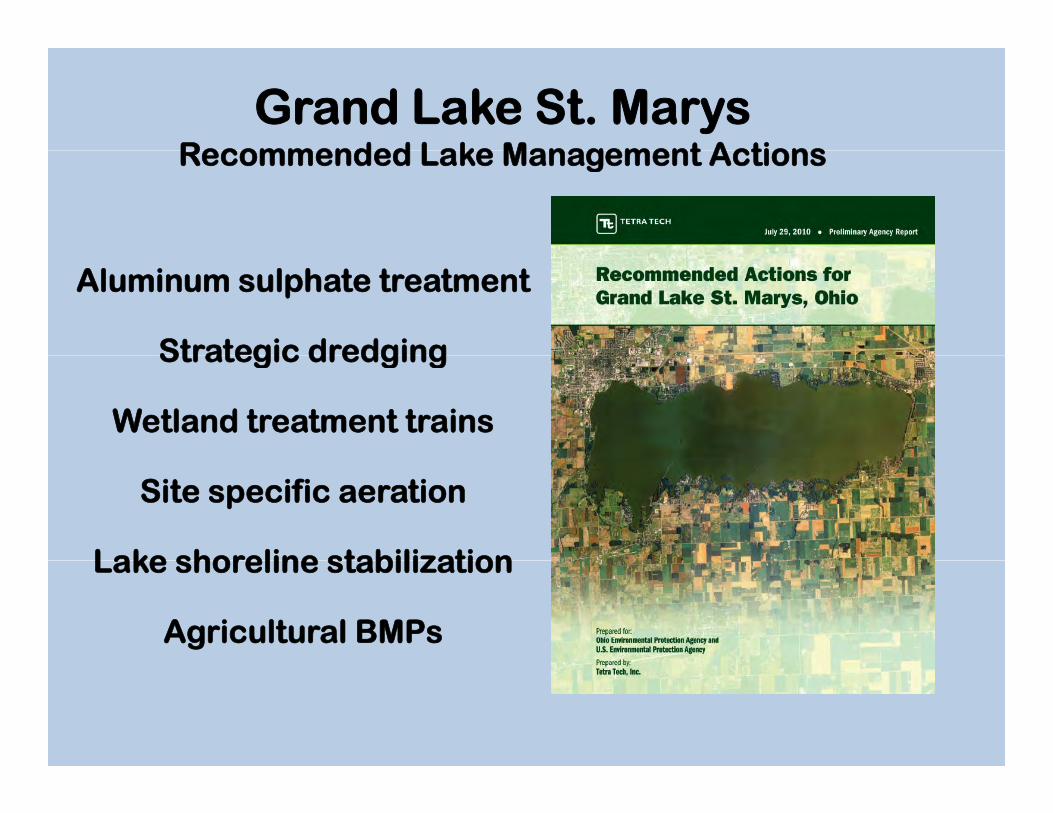
Grand Lake St. Marys Recommended Lake Management ActionsRecommended Lake Management Actions
Aluminum sulphate treatment
Strategic dredgingStrategic dredging
Wetland treatment trains
Site specific aeration
Lake shoreline stabilizationLake shoreline stabilization
Agricultural BMPs
t
ona
I t ll 3 S di
emen on
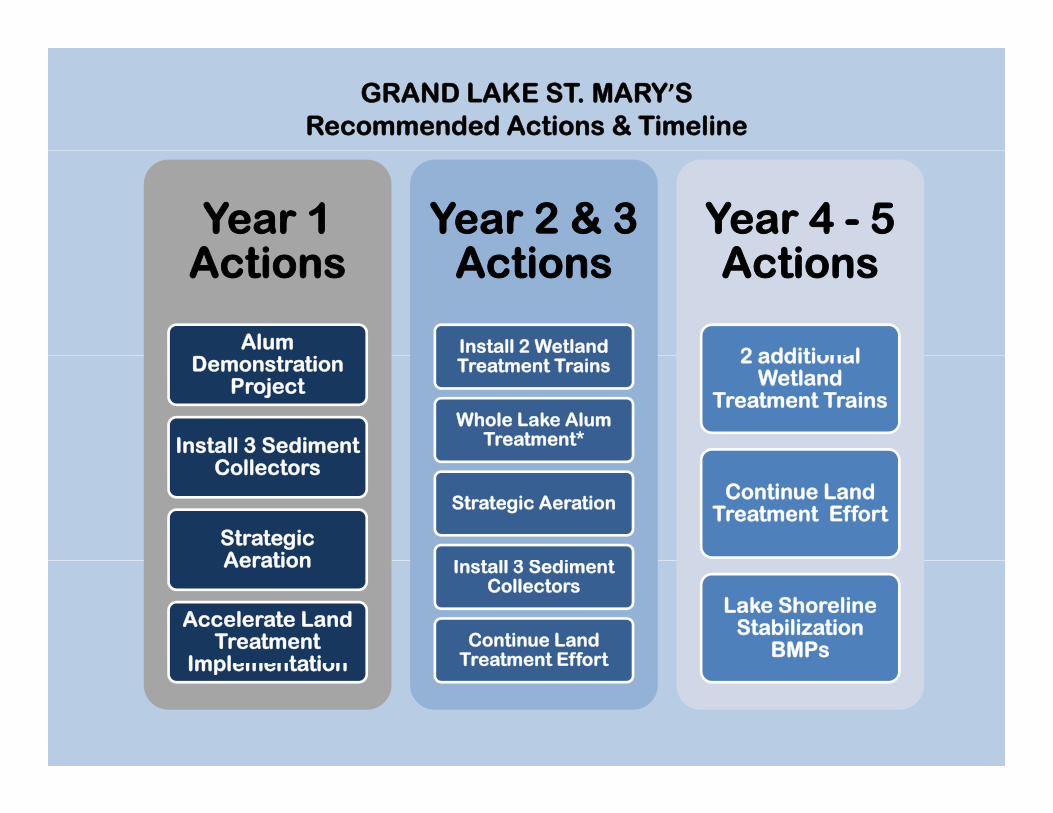
GRAND LAKE ST. MARY’S Recommended Actions & Timeline
Year 1 A ti
Year 2 & 3 A ti
Year 4 - 5 A ti Actions
Alum
Actions
Install 2 Wetland
Actions
2 additi l Demonstration Project
Install 3 Sediment
Treatment Trains
Whole Lake Alum Treatment*
2 additional Wetland
Treatment Trains
Collectors
Strategic Aeration
Strategic Aeration Continue Land Treatment Effort
Aeration
Accelerate Land Treatment
Impl tati
Install 3 Sediment Collectors
Continue Land Treatment Effort
Lake Shoreline Stabilization
BMPs Implementation Treatment Effort
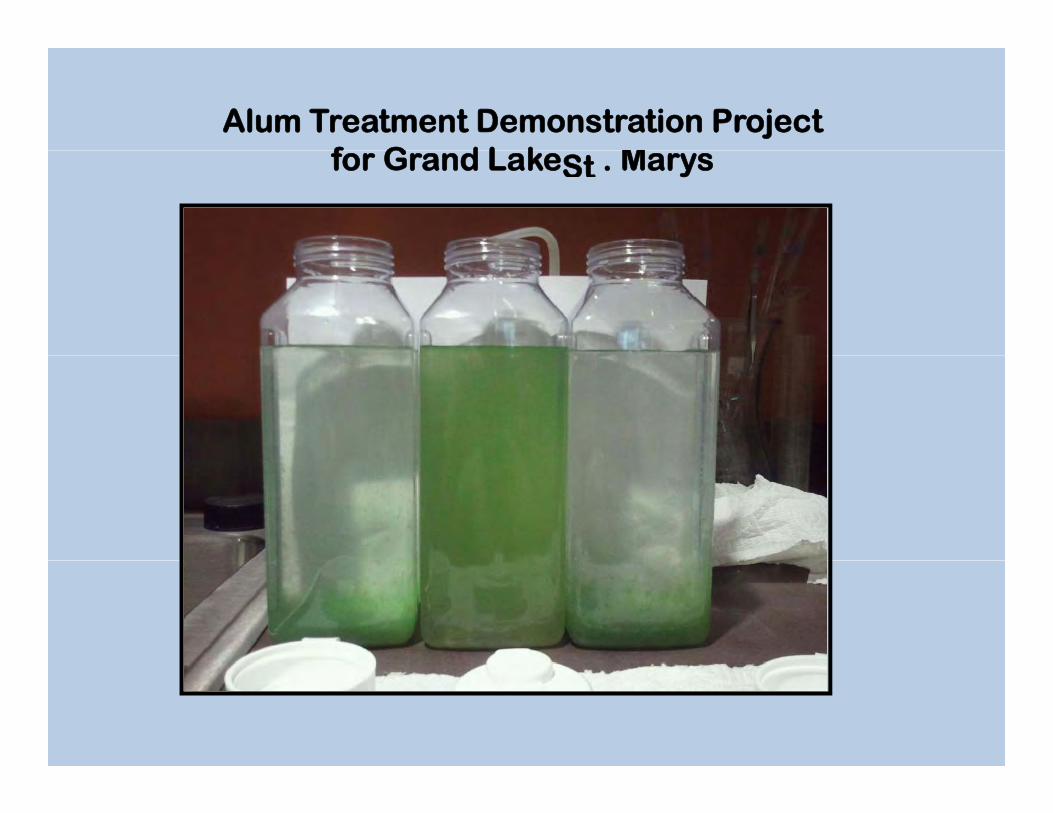
tAlum Treatment Demonstration Project
f Gfor Grand L d Lake SSt . Marys k
M
ar o o at t
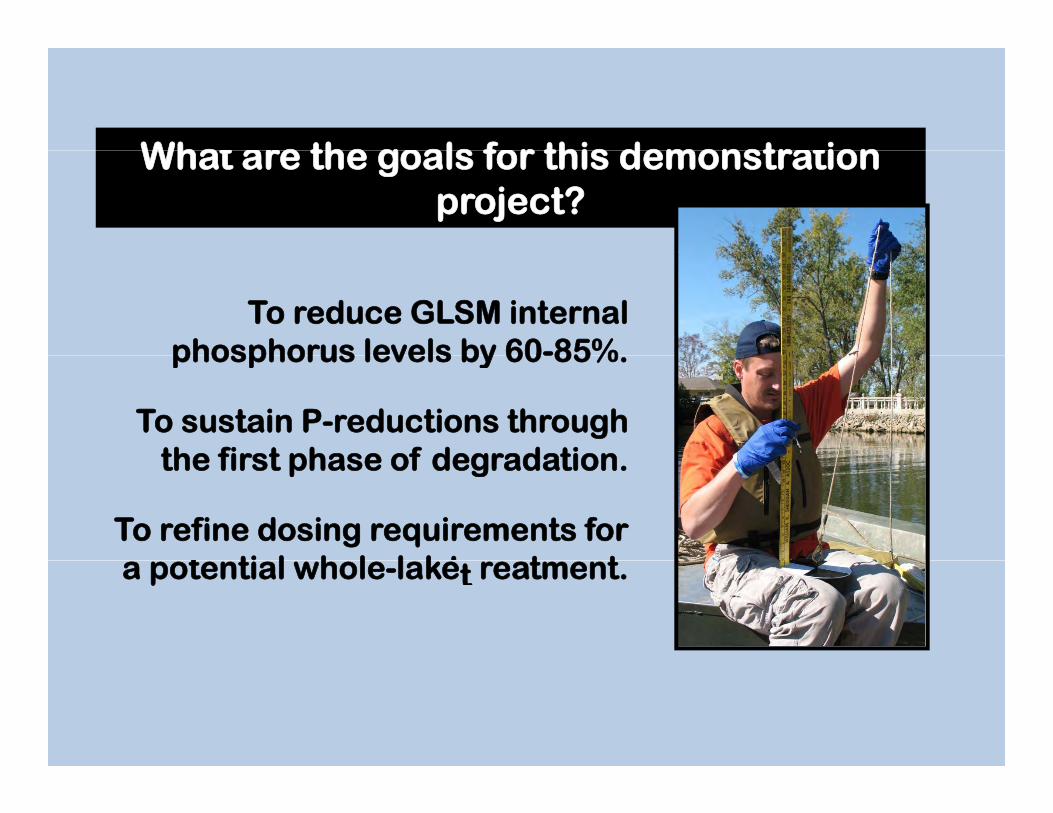
Wha e the g als f r this demonstr ionWhat are the goals for this demonstration project?
To reduce GLSM internal phosphorus levels by 60-85%phosphorus levels by 60 85%.
To sustain P-reductions through the first phase of degradationthe first phase of degradation.
To refine dosing requirements for a po
t
tenti tiall whholle-l klake tt reattmentt.
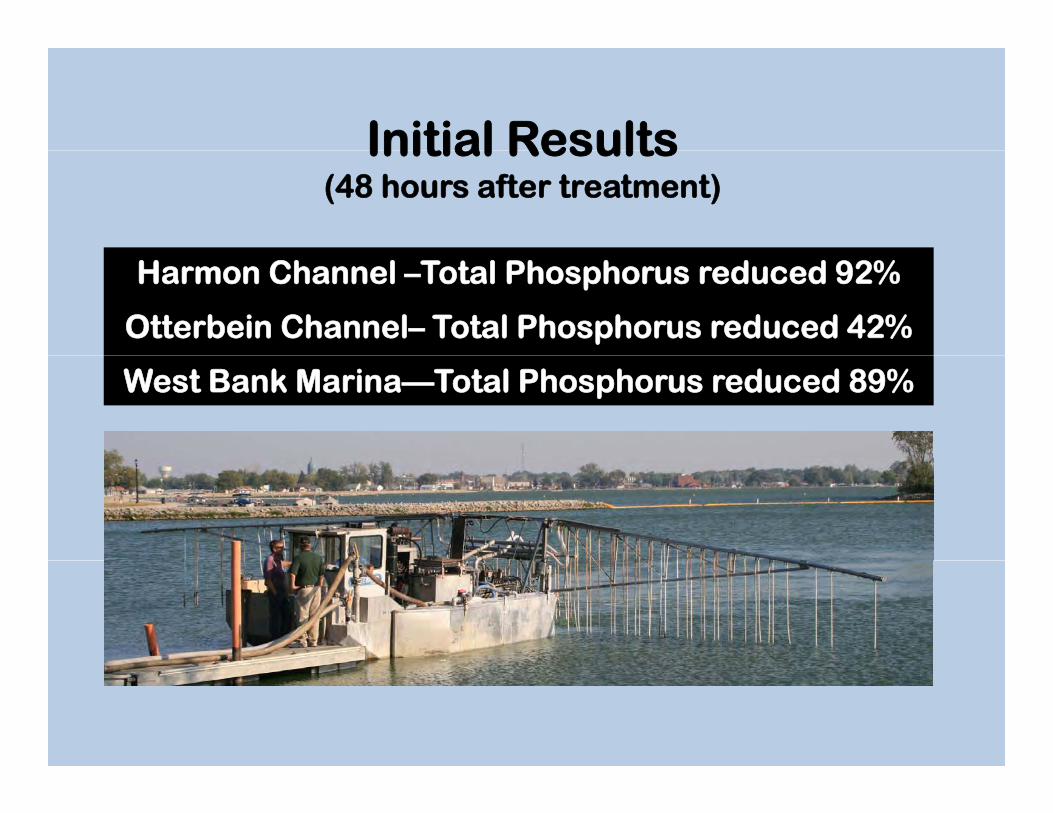
Initial Results Initial Results (48 hours after treatment)
Harmon Channel –Total Phosphorus reduced 92%
Otterbein Channel– Total Phosphorus reduced 42%
West Bank Marina—Total Phosphorus reduced 89%
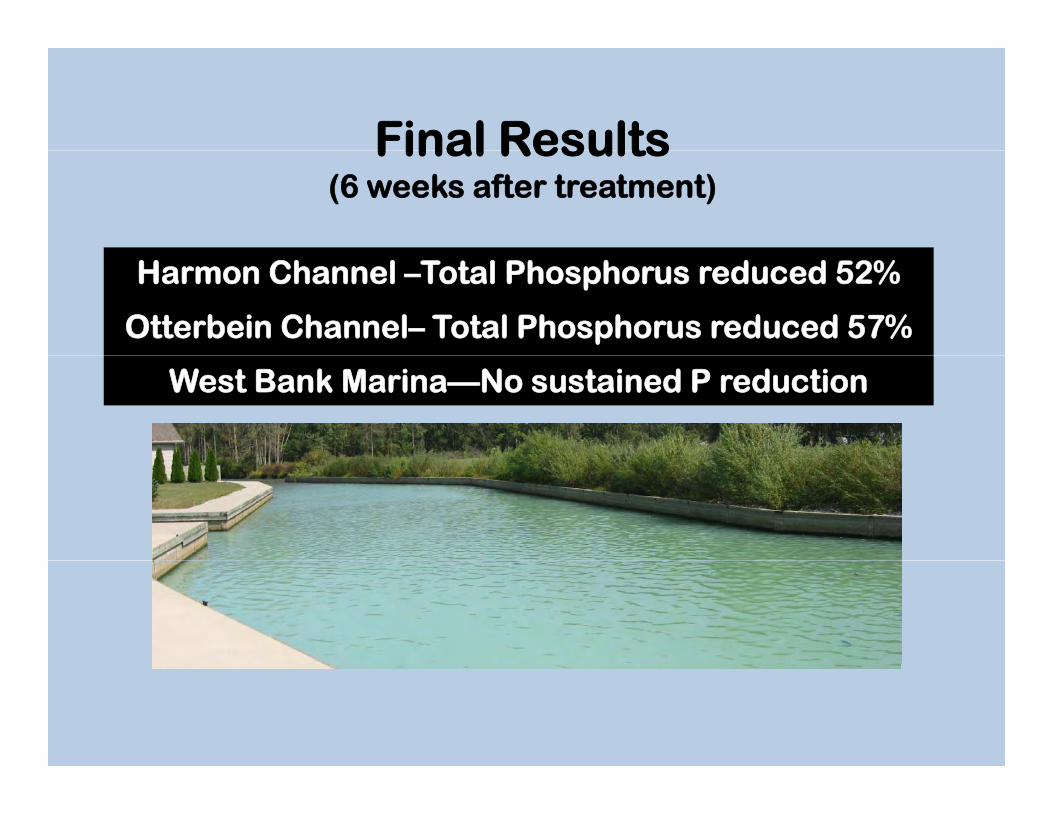
FinalFinal ResultsResults (6 weeks after treatment)
Harmon Channel –Total Phosphorus reduced 52%
Otterbein Channel– Total Phosphorus reduced 57%
West Bank Marina—No sustained P reduction
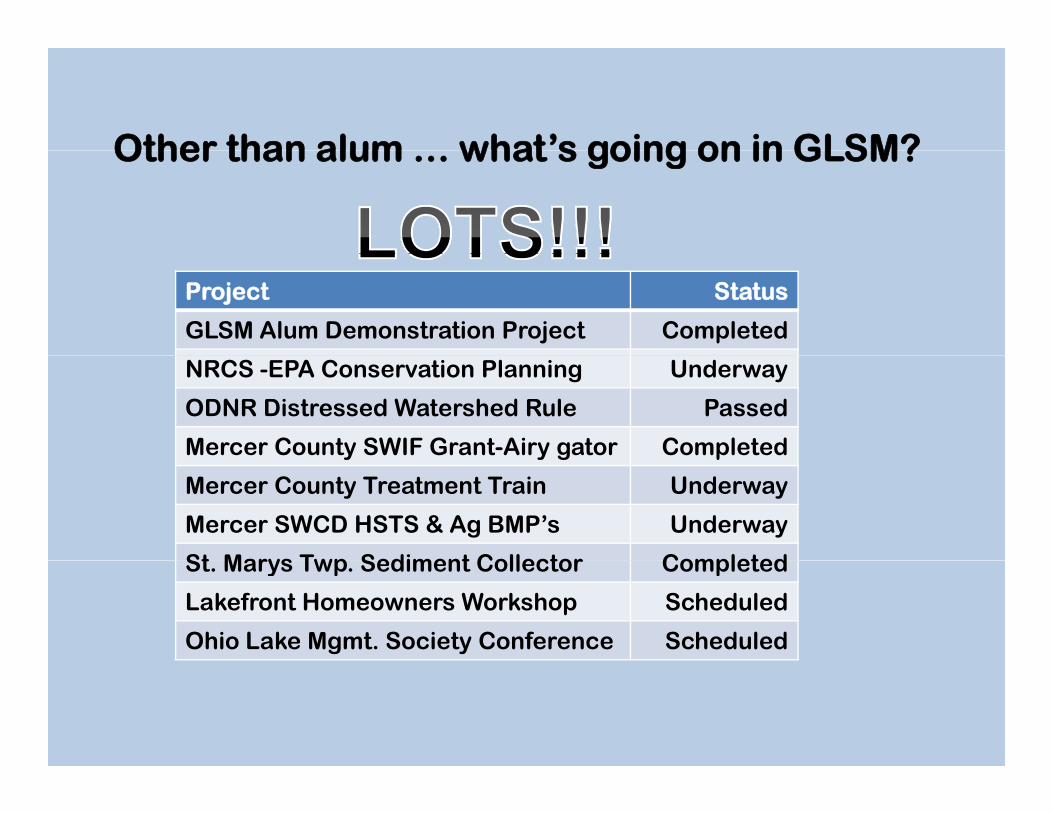
Other than alum what’s going on in GLSM? Other than alum … what s going on in GLSM?
Project Status
GLSM Alum Demonstration Project Completed
NRCS -EPA Conservation Planning Underway
ODNR Distressed Watershed Rule Passed
Mercer County SWIF Grant-Airy gator Completedy y g p
Mercer County Treatment Train Underway
Mercer SWCD HSTS & Ag BMP’s Underway
St Marys Twp Sediment Collector CompletedSt. Marys Twp. Sediment Collector Completed
Lakefront Homeowners Workshop Scheduled
Ohio Lake Mgmt. Society Conference Scheduled
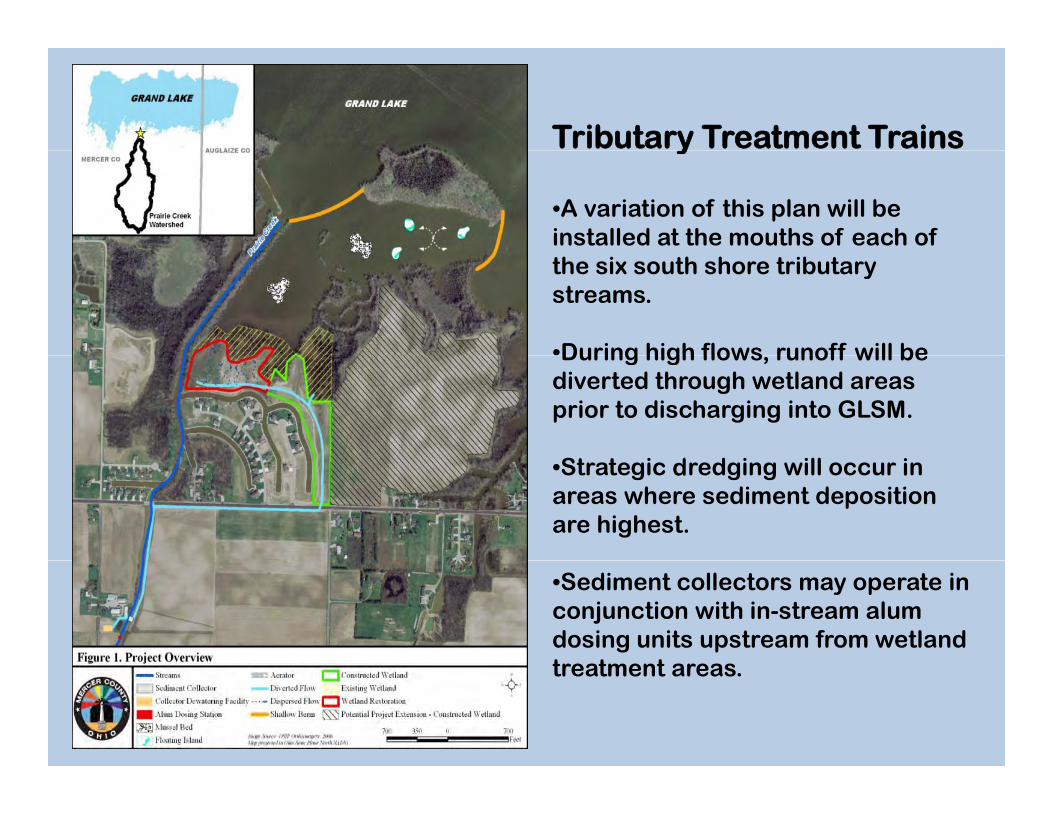
•A variation of this plan will be installed at the mouths of each of
Tributary Treatment Trains y
the six south shore tributary streams.
•During high flows runoff will be During high flows, runoff will be diverted through wetland areas prior to discharging into GLSM.
S i d d i ill i•Strategic dredging will occur in areas where sediment deposition are highest.
•Sediment collectors may operate in conjunction with in-stream alum dosing units upstream from wetland t t ttreatment areas.
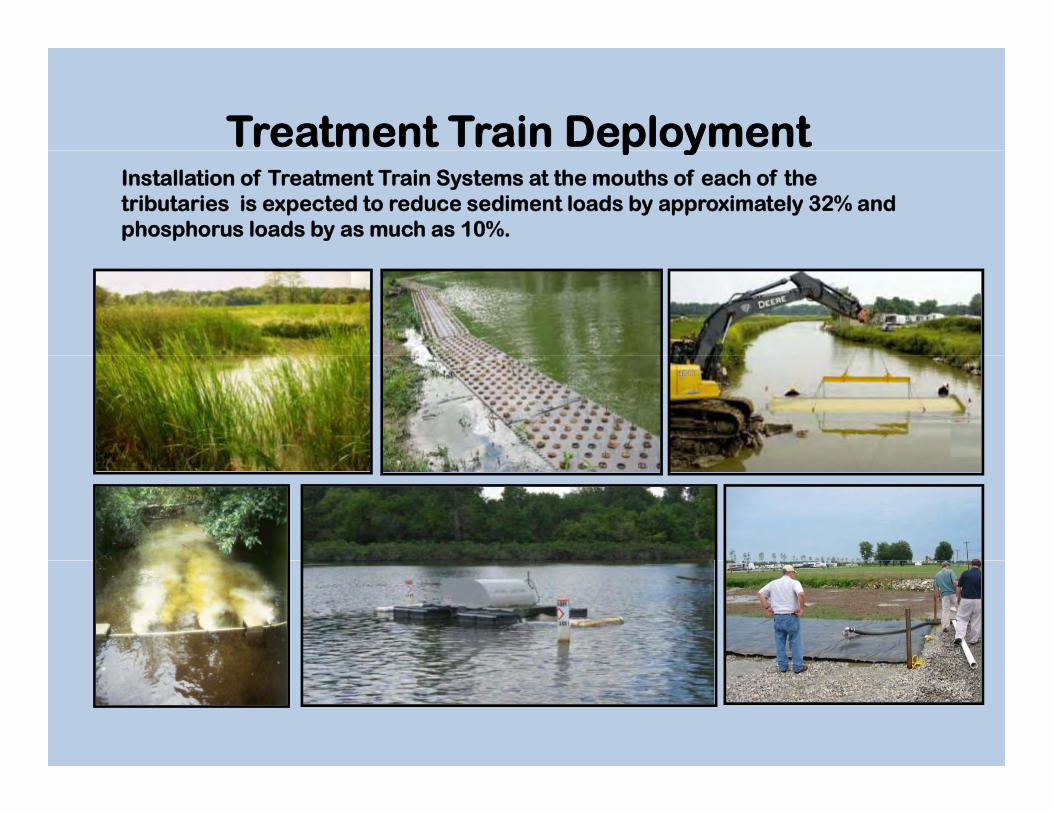
Treatment Train Depp yloyment Installation of Treatment Train Systems at the mouths of each of the tributaries is expected to reduce sediment loads by approximately 32% and phosphorus loads by as much as 10%.
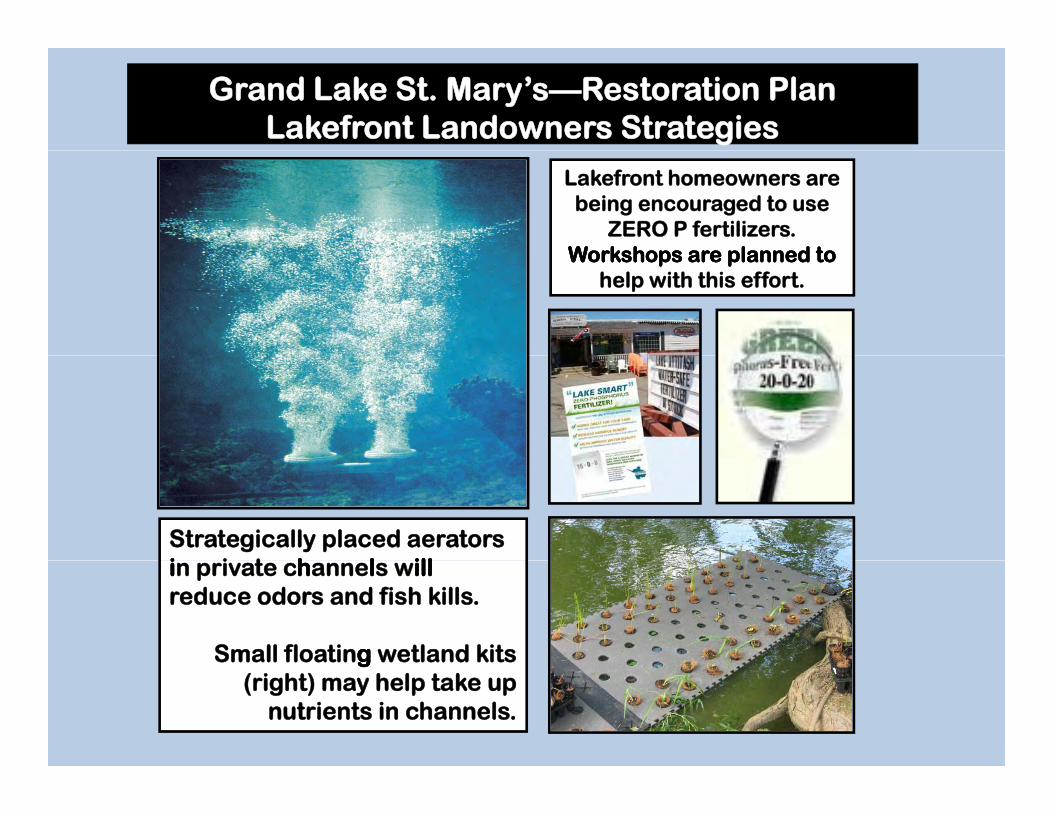
Grand Lake St. Mary’s—Restoration Plan Lakefront Landowners Strategies
Lakefront homeowners are being encouraged to use
ZERO P fertilizers. Workshops are planned to Workshops are planned to
help with this effort.
Strategically placed aerators i t h l ill i n privat e channel s willreduce odors and fish kills.
Small floatingg wetland kits (right) may help tak e up
nutrients in channels.
i
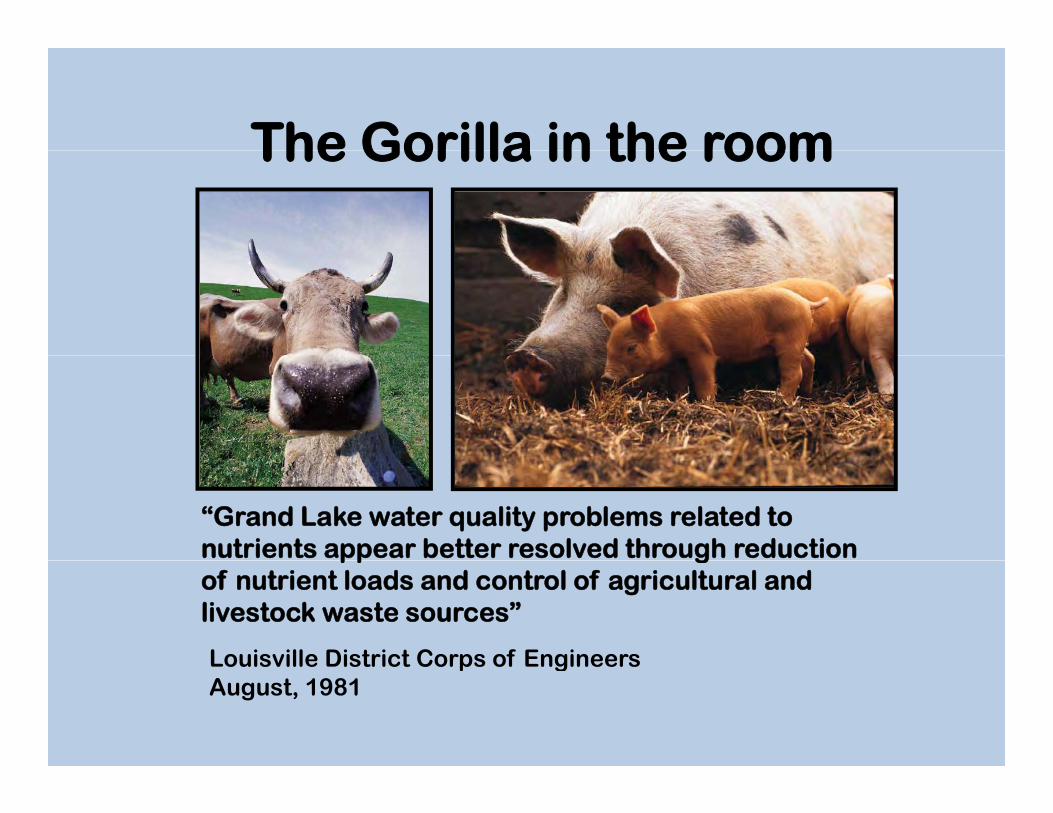
The Gorilla in the room The Gorilla in the room
“Grand Lake water quality problems related to nutrients appear better resolved througgh reduction pp of nutrient loads and control of agricultural and livestock waste sources”
Louisville District Corps of EngineersLouisville District Corps of Engineers August, 1981
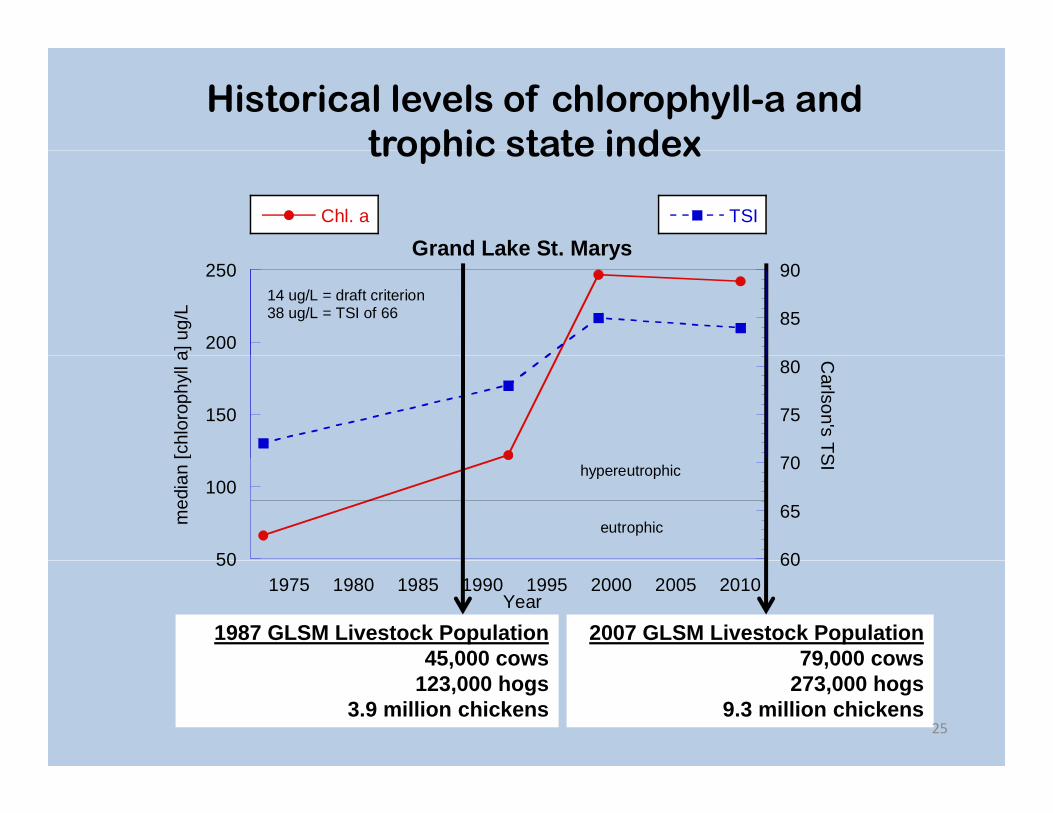
Historical levels of chlorophyll-a and trophic state indextrophic state index
Grand Lake St. Marys Chl. a TSI
Grand Lake St. Marys
1990
200
250
85
90
a] u
g/L
14 ug/L = draft criterion 38 ug/L = TSI of 66
150
70
75
80
[chl
orop
hyll
am
edia
n [
Carlson's TSSI
50
100
60
65
70hypereutrophic
eutrophic
50 60 1975 1980 1985 1995 2000 2005 2010
Year
1987 GLSM Livestock Population 2007 GLSM Livestock Population 45,000 cows 45,000 cows 79,000 cows 79,000 cows
123,000 hogs 273,000 hogs 3.9 million chickens 9.3 million chickens
25
p
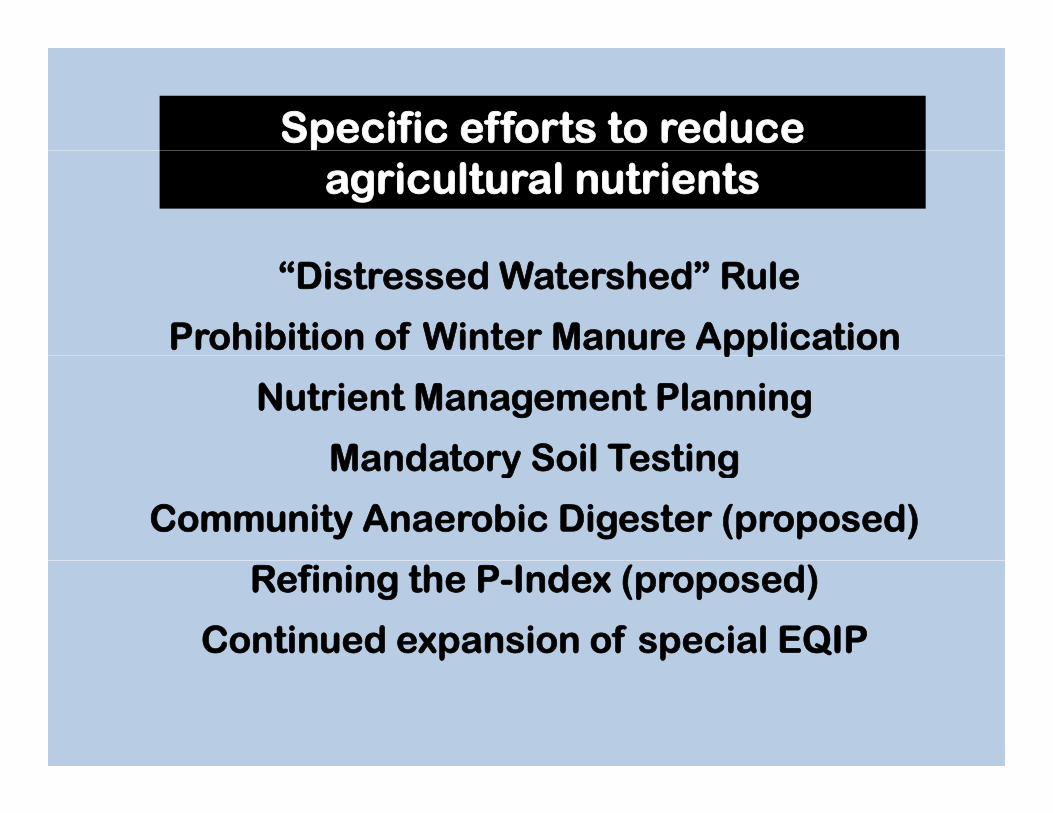
Specific efforts to reduce agricultural nutrients
“Distressed Watershed” Rule
Prohibition of Winter Manure Application pp
Nutrient Management Planning
Mandatory Soil Testing Mandatory Soil Testing
Community Anaerobic Digester (proposed)
Refining the P-Index (proposed)
Continued expansion of special EQIP

Ongoing ChallengesOngoing Challenges
F t f di • Future funding • Agency action & coordination • Community pressure • Timing of in-lake measures Timing of in lake measures • Owning the load issues
Local economic impacts • Local economic impacts
tQ i ?Questions?
Related Documents