Implementation of the Software Performance Engineering Development Process Salvatore Distefano, Antonio Puliafito, Marco Scarpa Department of Mathematics, University of Messina, Contrada di Dio, S. Agata, 98166 Messina, Italy Email: {sdistefano,apuliafito,mscarpa}@unime.it Abstract— Performance related problems play a key role in the Software Development Process (SDP). In order to evaluate the performance of a software architecture we defined and implemented a technique mapping the initial UML model into a performance model afterwards analyzed, implemented into the ArgoPerformance tool. To be inter- preted by a computing system it is necessary to make such technique unambiguous. Therefore, it becomes mandatory to define the software architecture representation by carefully specifying its syntax and semantics. The goal of this paper is to specify the representation guidelines for specifying ArgoPerformance compliant mod- els. With this aim, we firstly specify the design process into the software performance engineering development process (SPEDP), posing particular interest on the software architec- ture representation. Then, by characterizing the SPEDP into the UML domain, we identify and define rules and guidelines for specifying a UML-ArgoPerformance compliant model. To demonstrate the effectiveness of the overall technique an example taken from literature is evaluated through ArgoPerformance. I. I NTRODUCTION Performance is an important but often overlooked as- pect of the software design. Indeed, the consideration on performance issues is in many cases left until late in the software development process (SDP), when problems have already manifested themselves at system test or within the deployed system. The identification of possible bugs or unsatisfactory performance in the design phase allows to contain the costs, also permitting to compare different alternatives. This kind of approach implements the so called software performance engineering (SPE) [1], which is a systematic, quantitative technique to construct software systems that meet performance objectives. In our previous work [2], [3], we elaborated a technique to carry out the evaluation of the required performance pa- rameters of a software architecture, using the UML [4] for modeling and the OMG UML Profile for Schedulability, Performance and Time Specification (SPT) [5] to specify performance requirements into a UML model therefore mapped into a performance model. More specifically, starting from the UML model, all the software archi- tecture specifications are translated into an intermediate model, the Performance Context Model (PCM), that is subsequently mapped into the corresponding performance model. The results obtained from the analysis can be fed back into the original model for further refinements (re-engineering). Such technique has been implemented into the ArgoPerformance tool [6], a performance plug-in integrated in the ArgoUML CASE tool [7]. The automation process puts in evidence the necessity to formalize the description of a software architecture into the UML domain. A modeler that wants to evaluate the design or the implementation of a software architecture, has to represent it through a model compliant to the software performance engineering tool used, mapping the original model into a performance model thus analyzed. To implement and automate such mapping is therefore necessary to specify representation elements, semantics and rules to univocally and unambiguously represent the software architecture. In this perspective, the main contribution of this paper is the implementation of a software development process which takes into account performance specifications and requirements: the software performance engineering de- velopment process (SPEDP). SPEDP includes and synthe- sizes both the aim of modeling and developing a generic software architecture, and the aim of investigating the performance of the overall (hardware/software) elabora- tion system. It can be applied both in early phases, as a software performance engineering technique, and in test phases, as a common software performance evaluation technique. SPEDP fixes steps, rules and guidelines to fol- low in order to achieve the desired results in the software development, satisfying the performance requirements. The main advantage of specifying a software devel- opment process including performance evaluation is to provide an algorithm, a process for implementing high- quality/performance-guaranteed software. Such a process can be automated into specific tools that, having in input the software design and the performance requirements, can automatically provide as output the final software architecture satisfying the requirements. The reminder of the paper is organized as follows: in section II an overview of background concepts is pro- vided; then, section III specifies both the syntax and the semantics of SPEDP. In section IV, the SPEDP technique is applied to the modeling of a web video application, and then, in section V, the characterization of SPEDP to the UML/PCM-SPT domain is specified. Finally, in section VI, we present the results of the analysis performed by ArgoPerformance, and, in section VII, we provide some conclusive remarks. 872 JOURNAL OF SOFTWARE, VOL. 5, NO. 8, AUGUST 2010 © 2010 ACADEMY PUBLISHER doi:10.4304/jsw.5.8.872-882

Welcome message from author
This document is posted to help you gain knowledge. Please leave a comment to let me know what you think about it! Share it to your friends and learn new things together.
Transcript
Implementation of the Software PerformanceEngineering Development Process
Salvatore Distefano, Antonio Puliafito, Marco ScarpaDepartment of Mathematics, University of Messina, Contrada di Dio, S. Agata, 98166 Messina, Italy
Email: {sdistefano,apuliafito,mscarpa}@unime.it
Abstract— Performance related problems play a key rolein the Software Development Process (SDP). In order toevaluate the performance of a software architecture wedefined and implemented a technique mapping the initialUML model into a performance model afterwards analyzed,implemented into the ArgoPerformance tool. To be inter-preted by a computing system it is necessary to make suchtechnique unambiguous. Therefore, it becomes mandatory todefine the software architecture representation by carefullyspecifying its syntax and semantics.
The goal of this paper is to specify the representationguidelines for specifying ArgoPerformance compliant mod-els. With this aim, we firstly specify the design process intothe software performance engineering development process(SPEDP), posing particular interest on the software architec-ture representation. Then, by characterizing the SPEDP intothe UML domain, we identify and define rules and guidelinesfor specifying a UML-ArgoPerformance compliant model.To demonstrate the effectiveness of the overall techniquean example taken from literature is evaluated throughArgoPerformance.
I. INTRODUCTION
Performance is an important but often overlooked as-pect of the software design. Indeed, the consideration onperformance issues is in many cases left until late inthe software development process (SDP), when problemshave already manifested themselves at system test orwithin the deployed system. The identification of possiblebugs or unsatisfactory performance in the design phaseallows to contain the costs, also permitting to comparedifferent alternatives. This kind of approach implementsthe so called software performance engineering (SPE) [1],which is a systematic, quantitative technique to constructsoftware systems that meet performance objectives.
In our previous work [2], [3], we elaborated a techniqueto carry out the evaluation of the required performance pa-rameters of a software architecture, using the UML [4] formodeling and the OMG UML Profile for Schedulability,Performance and Time Specification (SPT) [5] to specifyperformance requirements into a UML model thereforemapped into a performance model. More specifically,starting from the UML model, all the software archi-tecture specifications are translated into an intermediatemodel, the Performance Context Model (PCM), that issubsequently mapped into the corresponding performancemodel. The results obtained from the analysis can befed back into the original model for further refinements(re-engineering). Such technique has been implemented
into the ArgoPerformance tool [6], a performance plug-inintegrated in the ArgoUML CASE tool [7].
The automation process puts in evidence the necessityto formalize the description of a software architecture intothe UML domain. A modeler that wants to evaluate thedesign or the implementation of a software architecture,has to represent it through a model compliant to thesoftware performance engineering tool used, mapping theoriginal model into a performance model thus analyzed.To implement and automate such mapping is thereforenecessary to specify representation elements, semanticsand rules to univocally and unambiguously represent thesoftware architecture.
In this perspective, the main contribution of this paperis the implementation of a software development processwhich takes into account performance specifications andrequirements: the software performance engineering de-velopment process (SPEDP). SPEDP includes and synthe-sizes both the aim of modeling and developing a genericsoftware architecture, and the aim of investigating theperformance of the overall (hardware/software) elabora-tion system. It can be applied both in early phases, as asoftware performance engineering technique, and in testphases, as a common software performance evaluationtechnique. SPEDP fixes steps, rules and guidelines to fol-low in order to achieve the desired results in the softwaredevelopment, satisfying the performance requirements.
The main advantage of specifying a software devel-opment process including performance evaluation is toprovide an algorithm, a process for implementing high-quality/performance-guaranteed software. Such a processcan be automated into specific tools that, having in inputthe software design and the performance requirements,can automatically provide as output the final softwarearchitecture satisfying the requirements.
The reminder of the paper is organized as follows: insection II an overview of background concepts is pro-vided; then, section III specifies both the syntax and thesemantics of SPEDP. In section IV, the SPEDP techniqueis applied to the modeling of a web video application, andthen, in section V, the characterization of SPEDP to theUML/PCM-SPT domain is specified. Finally, in sectionVI, we present the results of the analysis performed byArgoPerformance, and, in section VII, we provide someconclusive remarks.
872 JOURNAL OF SOFTWARE, VOL. 5, NO. 8, AUGUST 2010
© 2010 ACADEMY PUBLISHERdoi:10.4304/jsw.5.8.872-882

II. BACKGROUND AND PRELIMINARIES
Performance estimation is a crucial aspect of softwaredevelopment. Traditionally software performance areevaluated by specific benchmarks applying the “fix-it-later” principle. In the classical approach, system andsoftware specification, implementation, behavioral andperformance validation are disjoint activities, resulting inone model/formalism for each purpose. This may lead toinconsistencies and furthermore is a waste of manpowerand resources. Therefore it is desirable to develop atechnique that integrates specification, implementation,behavioral and performance validation altogether.
This approach has been identified in the softwareperformance engineering (SPE) [1]. The software perfor-mance engineering process begins early in the softwarelife cycle and uses quantitative methods to identify satis-factory designs and to eliminate those that are likely tohave unacceptable performance before developers investsignificant time in implementation. Software performanceevaluation continues through the detailed design, codingand testing phases to predict and manage the performanceof the evolving software as well as monitor and reportactual performance versus specifications and predictions.
The specific literature offers a lot of works propos-ing and implementing software performance engineeringtechniques. Petriu and Woodside, in [8], define a perfor-mance meta-model, named Core Scenario Model (CSM),used as an intermediate model. The software architecturebehavior and the related performance specifications aredetailed through UML behavioral diagrams (Activity Di-agrams and/or Sequence Diagrams), annotated with SPTtags and stereotypes. The CSM is based on the SPT profileand can be mapped into several kinds of performancemodels (simulative models, Petri nets, queueing network,etc).
Marzolla and Balsamo in [9] propose a software perfor-mance engineering technique which uses a representationnotation composed by a set of annotated diagrams (UseCase, Activity and Deployment). The software architec-ture behavioral description is implemented by higher levelUse Case Diagrams, detailed by Activity Diagrams. Thenodes of the Deployment Diagram correspond to softwarearchitecture elaboration system devices. They proposea “UML Performance Simulator” which transforms theUML software architecture model into a discrete-eventsimulation model. Recently, they extended their techniqueto the analytic performance domain by defining a specificmapping into LQN [10].
In [11] the authors establish a correspondence betweenUML models and labeled generalized stochastic Petri nets(LGSPN) in two steps: first each UML State MachineDiagram, composing the software architecture behavioralUML description, is independently converted into thecorresponding LGSPN [11]; then, the PNs thus obtainedare joined according to the information reported in theUML Sequence and Use Case Diagrams that also containthe performance specifications. An extension of suchtechnique is proposed in [12], where UML State Machines
and Activity Diagrams are used.Another software performance engineering technique
using reward models is proposed in [13], in whichthe authors develop an intermediate modeling languagefor component-based systems’ performability evaluationcalled KLAPER. According to such technique, softwarecomponents are represented by Component Diagrams.The behaviors of the components’ services are detailedby Activity Diagrams and/or State Machine Diagramsenriched by UML-SPT [5] and UML-QOS [14] profilesannotations. Finally, a Deployment Diagram describesthe deployment of the components on the elaborationinfrastructure. This UML model is translated into theKLAPER intermediate model, then into a semi-Markovreward model and therefore analyzed.
Smith et al. in [15] and Gu and Petriu in [16] useor specify XML schema meta-models or Document TypeDefinitions for representing performance specificationsinto UML models, the Performance Model InterchangeFormat (PMIF) and the eXtensible Stylesheet Languagefor Transformations (XSLT), respectively. Smith et al. in[17] make use of queuing networks for solving their UMLannotated (Sequence Diagrams) software model previ-ously translated into a PMIF–XML intermediate model.A similar approach is specified in [18] where Gu andPetriu use an XML algebra-based algorithm to transformUML annotated models in XSLT format, and then to thecorresponding layered queuing network.
Some other interesting works related to the softwareperformance engineering topic, updated to 2003, are sum-marized in [19].
In [2], [3], [6] we provided a SPE technique forevaluating the performance of a software architecturemodeled by UML diagrams, based on the PCM inter-mediate model, thus splitting the mapping from UML toperformance model into two phases. Such technique hasbeen automated into the ArgoPerformance tool [6], [20],a performance plug-in integrated in the ArgoUML CASEtool [7] implementing a solution based on non-Markovianstochastic Petri nets (NMSPN). As introduced above, inorder to automate such mappings, the transformation rulesallowing to translate the original UML model into thedestination (intermediate and/or performance) model haveto clearly and unambiguously specified and formalized.Thus, it is necessary to formalize the syntax and thesemantics of the representation notation, so that the sourcemodels (UML and PCM for ArgoPerformance) resultunambiguous to the tool that automatically maps theminto the target model (PCM and NMSPN respectivelyin the ArgoPerformance case). In all the above referredworks remain ambiguous or unspecified how a modelhas to be built, which diagrams are used and what tomodel/specify by them. A modeler knows how to specifythe performance annotations but he/she does not knowhow to represent the software architecture to be evaluatedin order to build a consistent, (automatically) analyzableXSLT, PMIF, CSM, ...-compliant model.
IN this work, instead of only providing the rep-
JOURNAL OF SOFTWARE, VOL. 5, NO. 8, AUGUST 2010 873
© 2010 ACADEMY PUBLISHER
resentation guidelines to be used for implementingArgoPerformance-compliant models, we choose to spec-ify a whole software development process taking intoaccount performance requirements and specifications, thesoftware performance engineering development process.Particular attention is focused on the modeling phase,formalizing rules and guidelines to make unambiguousperformance annotated software models. In this way itwill be possible to evaluate the software architectureperformance by exploiting our SPE technique and itsautomated implementation. Through SPEDP we specifygeneric representation rules and guidelines, that are thencharacterized into the UML-SPT domain.
The idea of specifying a software development processintegrating performance issues is an enhancement, a stepforward, the completion of our original UML-SPT-PCMSPE technique. The main advantage of specifying aperformance driven software development process lies inthe possibility of providing a whole process that, having ininput the software architecture model and the performancerequirements, brings to the implementation of a softwarearchitecture that meets the requirements. In other words,the SPE approach only considers the problem of obtainingperformance indexes from a software model/design, whilea performance driven software development process andin the specific SPEDP, tries to also specify rules andguidelines to follow thoroughly the SDP in order to satisfyspecific performance requirements.
III. THE SOFTWARE PERFORMANCE ENGINEERING
DEVELOPMENT PROCESS
This section details the SPEDP, providing an highlevel description, in subsection III-A, and then specifying(subsection III-B) its syntax and semantics by exploitingthe MDE meta-modeling technique.
A. High Level Point of View
Before entering into the details of the semantics spec-ification, it is useful to describe the approach from anhigher level point of view.
A SPEDP software architecture model is composed oftwo parts: the static part, in which the static organizationof the software, its data structures and the relationshipsamong such data are represented in an object-orientedway; and the dynamic part, which describes the softwarebehavior and its interactions from both the internal andthe external points of view. With regards the static partdescription, since we have no specific and/or particularrequirements, it does not make sense to redefine anexisting formalism. Thus we decided to adopt the UMLspecification and more specifically the Class Diagrams.Class Diagrams allow to represent any type of classes,attributes and relationships among classes and attributes(association, aggregation, composition, generalization, re-alization, dependency, multiplicity, etc.). In this waySPEDP inherits the character of generality of UML inmodeling the static organization of the software.
GVOrganization Diagram (GVOD)1
GV OD x.y….z
S1 Sn
SVOrganization D . i
Si1 Sij SipSV Resource
Diagram (RD) i
Behavioral D. BDi1 BDij BDip
BDip1 BDipt
BDip1.1 BDip1.q
Global View
Detailed View
Specification View
Si
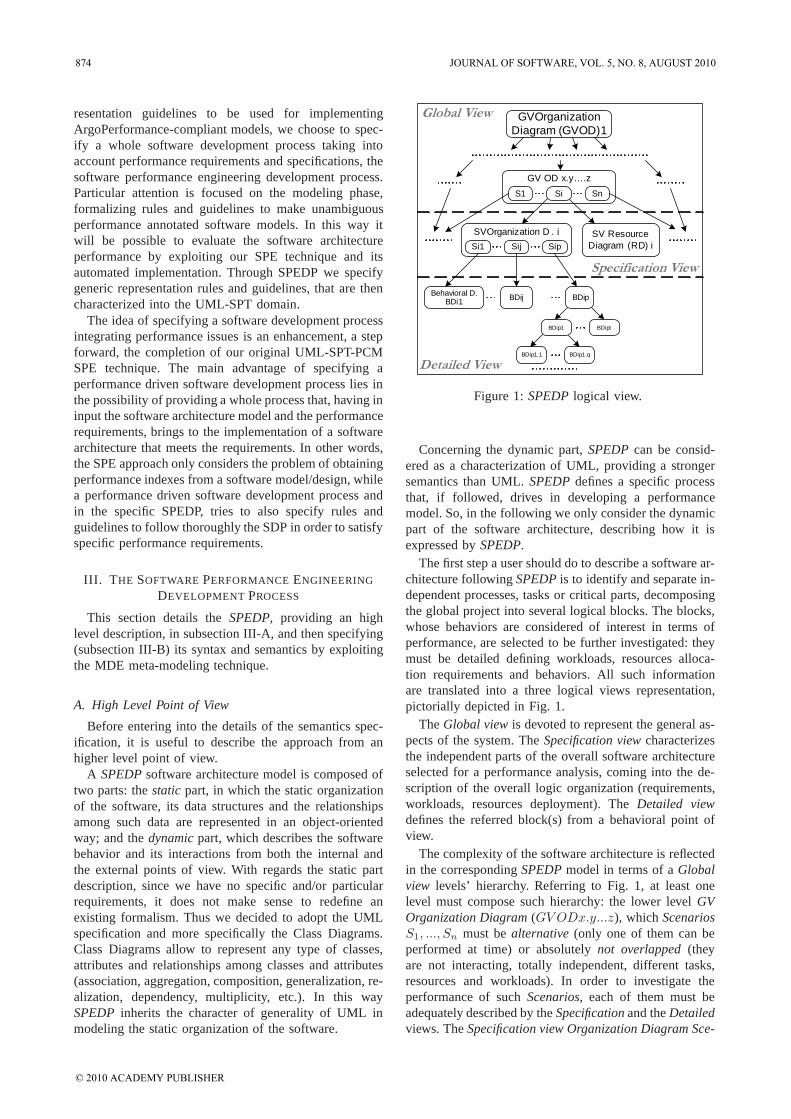
Figure 1: SPEDP logical view.
Concerning the dynamic part, SPEDP can be consid-ered as a characterization of UML, providing a strongersemantics than UML. SPEDP defines a specific processthat, if followed, drives in developing a performancemodel. So, in the following we only consider the dynamicpart of the software architecture, describing how it isexpressed by SPEDP.
The first step a user should do to describe a software ar-chitecture following SPEDP is to identify and separate in-dependent processes, tasks or critical parts, decomposingthe global project into several logical blocks. The blocks,whose behaviors are considered of interest in terms ofperformance, are selected to be further investigated: theymust be detailed defining workloads, resources alloca-tion requirements and behaviors. All such informationare translated into a three logical views representation,pictorially depicted in Fig. 1.
The Global view is devoted to represent the general as-pects of the system. The Specification view characterizesthe independent parts of the overall software architectureselected for a performance analysis, coming into the de-scription of the overall logic organization (requirements,workloads, resources deployment). The Detailed viewdefines the referred block(s) from a behavioral point ofview.
The complexity of the software architecture is reflectedin the corresponding SPEDP model in terms of a Globalview levels’ hierarchy. Referring to Fig. 1, at least onelevel must compose such hierarchy: the lower level GVOrganization Diagram (GVODx.y...z), which ScenariosS1, ..., Sn must be alternative (only one of them can beperformed at time) or absolutely not overlapped (theyare not interacting, totally independent, different tasks,resources and workloads). In order to investigate theperformance of such Scenarios, each of them must beadequately described by the Specification and the Detailedviews. The Specification view Organization Diagram Sce-
874 JOURNAL OF SOFTWARE, VOL. 5, NO. 8, AUGUST 2010
© 2010 ACADEMY PUBLISHER

S P E D P C o r e
S t a t i c s B e h a v i o r
R e s o u r c eO r g a n i z a t i o n
P e r f o r m a n c e
Figure 2: The SPEDP Packages Organization.
narios (Sij) describe interacting parts of the SA. Theycan share workloads and resources. Their behaviors aredetailed by the corresponding Behavior Diagrams.
B. The SPEDP Specification
In this subsection we provide the meta-modeling spec-ification of the SPEDP representation notation, by adopt-ing the MDA-MOF approach.
The packages organization of SPEDP describing itslogical organization is reported in Fig. 2. The SPEDPCore package specifies the relationships between thediagrams and the views according to subsection III-A.The Statics package contains elements to characterizethe SA architecture, such as resources, functionalities,services and workloads. The resource deployment of theSA is modeled through the elements contained in theResource package, while the SA functionality features aredescribed by the Organization package. The SA behavioris modeled by the elements of the Behavior package.Finally, the Performance Requirements package includeselements characterizing the performance domain, suchas probability density functions (PDF) and schedulingpolicies.
In order to describes the approach adopted in theSPEDP specification we only provide in the followingthe meta-model formalization of the SPEDP Core sub-package. Details on the specification of the other sub-packages can be found in [21].
SPEDP Core is the most fundamental sub-packagecomposing the SPEDP package. It defines the basic con-structs needed for the development of SPEDP compliantmodels.
M o d e l
+ N a m e : S t r i n g
G V O r g a n i z a t i o n D i a g r a m
+ N a m e : S t r i n g
O r g a n i z a t i o n D i a g r a m
+ N a m e : S t r i n g
R e s o u r c e D i a g r a m
+ N a m e : S t r i n g
S V O r g a n i z a t i o n D i a g r a m
+ N a m e : S t r i n g
+ p a r e n t
+ o d s + r e s
B e h a v i o r a l D i a g r a m
+ N a m e : S t r i n g
+ g v o d 0..1
+ c h i l d*
+ r d+ s v o d
1..*+ b d
1..*
**+ p a r e n t0..1
+ c h i l d*
Figure 3: The SPEDP Core Abstract Syntax meta-model.
a) Abstract Syntax: The SPEDP Core meta-modelreported in Fig. 3 describes how a SPEDP model has tobe built. A model is represented by the Model class on the
top of the hierarchy, associated to the GVOrganizationDi-agram class by the composition relationship with multi-plicity of 1. The GVOrganizationDiagram class is relatedto itself by parent/child associations with multiplicity of[0..1] and [∗], respectively, in order to implement theSPEDP global view hierarchy. The GVOrganizationDia-gram class is associated to both SVOrganizationDiagramand ResourceDiagram classes implementing the SPEDPspecification view by the composition relationship, bothwith the same ([∗]) multiplicity for the component classes.The association between SVOrganizationDiagram and Re-sourceDiagram is two-way, the ods association end hasmultiplicity [1..∗], while the other end has multiplicity1. The SVOrganizationDiagram and GVOrganizationDi-agram specify the OrganizationDiagram class. Finally,the composition relationship links the SVOrganization-Diagram and the BehavioralDiagram implementing theSPEDP detailed view, with [1..∗] multiplicity at the bdend.
b) Well-formedness Rules: The well-formednessrules (wfrs) regarding the SPEDP Core package arereported in the following, defined and formalized throughOCL constrains.
context GVOrganizationDiagraminv base: self→size()≥ 1
self.svod→ forAll(sv: SVOrganizationDiagram | sv.bd→size()≥ 1)
(a) base wfr
context GVOrganizationDiagraminv gvodsucc:
if(self.child→forAll(s:GVOrganizationDiagram | s→size()== 0) thenself.svod→forAll(sv:SVOrganizationDiagram | sv→size()> 0) andself.rd→forAll(res:ResourceDiagram | res→size()> 0)
elseself.svod→forAll(sv:SVOrganizationDiagram | sv→size()== 0) andself.rd→forAll(res:ResourceDiagram | res→size()== 0)
(b) gvodsucc wfr
Figure 4: SPEDP Core package wfrs.
i) The base rule, reported in Fig. 4a, specifiesthat the Model must be composed of at leastone GVOrganizationDiagram element. More-over, all the SVOrganizationDiagram composinga GVOrganizationDiagram, must be detailed bya set of BehavioralDiagram elements.
ii) The gvodsucc wrf of Fig. 4b specifies thatthe lower level GVOrganizationDiagrams, theleaves of the GVOrganizationDiagrams’ hier-archy of Fig. 1, characterized by attributechild == null, must be composed of SVOr-ganizationDiagram and ResourceDiagram ele-ments.
c) Detailed Semantics.: The SPEDP Model repre-sents the whole SA to be modeled. A Model is composedof GVOrganizationDiagram instances. The GVOrganiza-tionDiagrams identify the main independent/alternativescenarios of the SA, specifying the interactions betweenthe SA and the external environment. According to thegvodsucc wfr of Fig. 4b, the scenarios contained into theleaves of the GVOrganizationDiagrams parent/child hier-archy are selected to be investigated in terms of perfor-
JOURNAL OF SOFTWARE, VOL. 5, NO. 8, AUGUST 2010 875
© 2010 ACADEMY PUBLISHER
mance. SVOrganizationDiagram and ResourceDiagramobjects implement the Specification view, representing theinternal organization and the resource deployment of theselected scenarios, respectively. In the Detailed views,The BehavioralDiagrams implements the Detailed viewof the subsystem under exam, characterizing the dynamicbehavior of each scenario specified in a SVOrganization-Diagram.
IV. USING SPEDP: A WEB-BASED VIDEO
APPLICATION
In this section we describe how the SPEDP is appliedto the development of a web-based video application,extending an example presented in [2], [3], also inves-tigated in [9] and originally taken from the OMG SPTspecification [5]. The videos, uploaded into the systemby the administrator, can be listed by a generic userbelonging to the surfer or the client categories and canalso be requested and downloaded only by registered users(clients). Below, we present the modeling of such applica-tion according to the SPEDP guidelines, by specifying thethree views (Global view, Specification view and Detailedview) following the specifications provided in subsectionIII-A.
A. SPEDP Modeling
WebVideo:Model
Name=WebVideo Applicat ion
gvod:GVOrganizationDiagram
Name=VideoManagement
bd1:BehavioralDiagram
Name=Browsing
bd2:BehavioralDiagram
Name=Request
bd3:BehavioralDiagram
Name=Upload
rd:ResourceDiagram
Name=Resource
svod:SVOrganizationDiagram
Name=Organizat ion
bd4:BehavioralDiagram
Name=ProcRequest
(a) Core
User:Stakeholder
Ass:Association
VideoManagement:Scenario
access.capacity=6access.concurrent=3
(b) GVOrganization-Diagram
Figure 5: Core and Global view organization diagram ofthe web-based video application
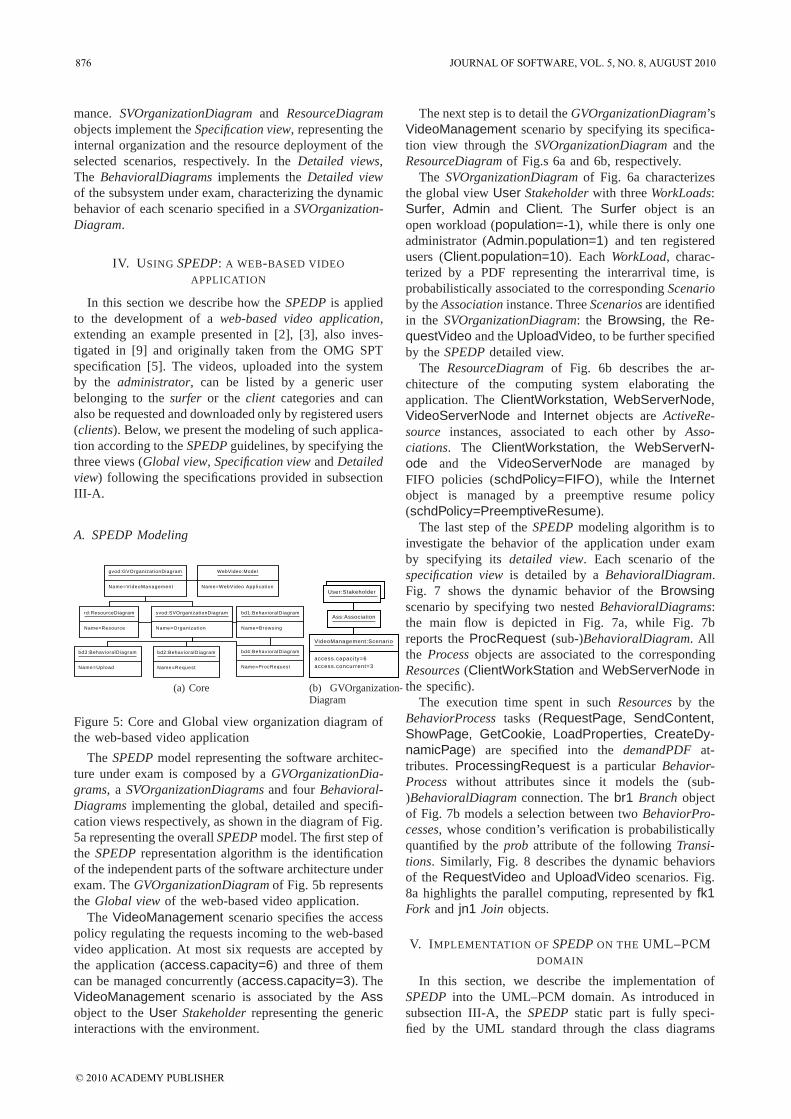
The SPEDP model representing the software architec-ture under exam is composed by a GVOrganizationDia-grams, a SVOrganizationDiagrams and four Behavioral-Diagrams implementing the global, detailed and specifi-cation views respectively, as shown in the diagram of Fig.5a representing the overall SPEDP model. The first step ofthe SPEDP representation algorithm is the identificationof the independent parts of the software architecture underexam. The GVOrganizationDiagram of Fig. 5b representsthe Global view of the web-based video application.
The VideoManagement scenario specifies the accesspolicy regulating the requests incoming to the web-basedvideo application. At most six requests are accepted bythe application (access.capacity=6) and three of themcan be managed concurrently (access.capacity=3). TheVideoManagement scenario is associated by the Assobject to the User Stakeholder representing the genericinteractions with the environment.
The next step is to detail the GVOrganizationDiagram’sVideoManagement scenario by specifying its specifica-tion view through the SVOrganizationDiagram and theResourceDiagram of Fig.s 6a and 6b, respectively.
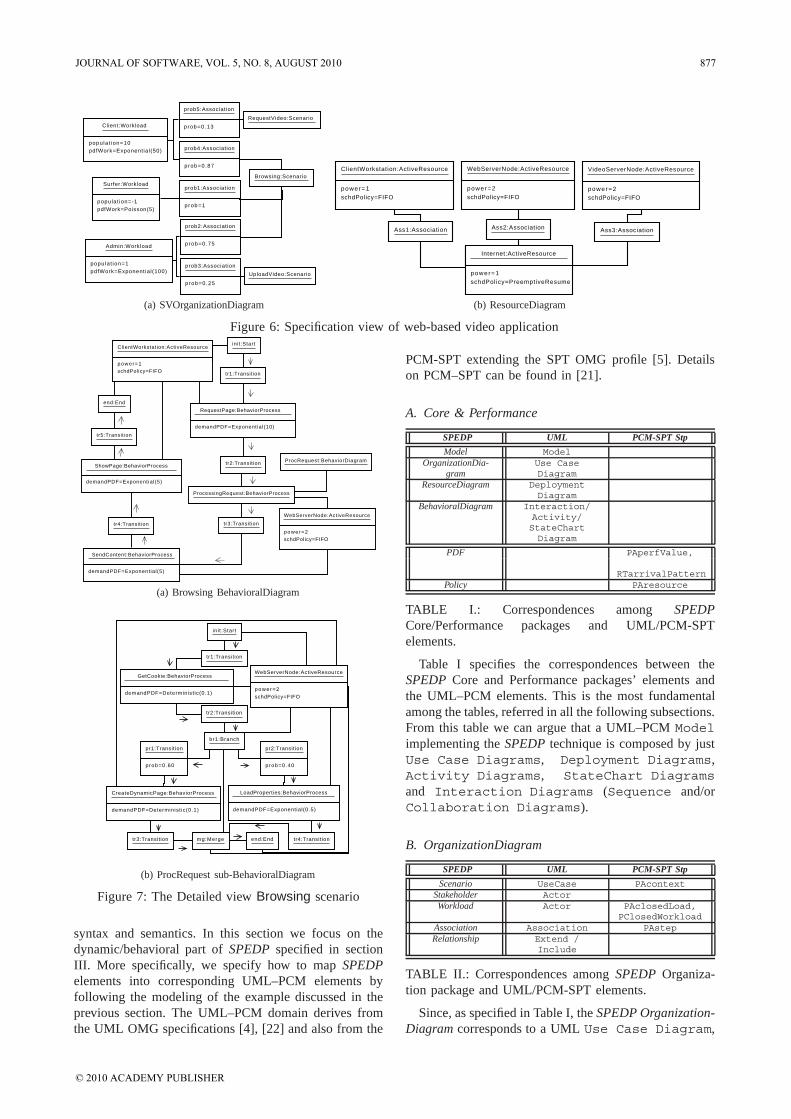
The SVOrganizationDiagram of Fig. 6a characterizesthe global view User Stakeholder with three WorkLoads:Surfer, Admin and Client. The Surfer object is anopen workload (population=-1), while there is only oneadministrator (Admin.population=1) and ten registeredusers (Client.population=10). Each WorkLoad, charac-terized by a PDF representing the interarrival time, isprobabilistically associated to the corresponding Scenarioby the Association instance. Three Scenarios are identifiedin the SVOrganizationDiagram: the Browsing, the Re-questVideo and the UploadVideo, to be further specifiedby the SPEDP detailed view.
The ResourceDiagram of Fig. 6b describes the ar-chitecture of the computing system elaborating theapplication. The ClientWorkstation, WebServerNode,VideoServerNode and Internet objects are ActiveRe-source instances, associated to each other by Asso-ciations. The ClientWorkstation, the WebServerN-ode and the VideoServerNode are managed byFIFO policies (schdPolicy=FIFO), while the Internetobject is managed by a preemptive resume policy(schdPolicy=PreemptiveResume).
The last step of the SPEDP modeling algorithm is toinvestigate the behavior of the application under examby specifying its detailed view. Each scenario of thespecification view is detailed by a BehavioralDiagram.Fig. 7 shows the dynamic behavior of the Browsingscenario by specifying two nested BehavioralDiagrams:the main flow is depicted in Fig. 7a, while Fig. 7breports the ProcRequest (sub-)BehavioralDiagram. Allthe Process objects are associated to the correspondingResources (ClientWorkStation and WebServerNode inthe specific).
The execution time spent in such Resources by theBehaviorProcess tasks (RequestPage, SendContent,ShowPage, GetCookie, LoadProperties, CreateDy-namicPage) are specified into the demandPDF at-tributes. ProcessingRequest is a particular Behavior-Process without attributes since it models the (sub-)BehavioralDiagram connection. The br1 Branch objectof Fig. 7b models a selection between two BehaviorPro-cesses, whose condition’s verification is probabilisticallyquantified by the prob attribute of the following Transi-tions. Similarly, Fig. 8 describes the dynamic behaviorsof the RequestVideo and UploadVideo scenarios. Fig.8a highlights the parallel computing, represented by fk1Fork and jn1 Join objects.
V. IMPLEMENTATION OF SPEDP ON THE UML–PCMDOMAIN
In this section, we describe the implementation ofSPEDP into the UML–PCM domain. As introduced insubsection III-A, the SPEDP static part is fully speci-fied by the UML standard through the class diagrams
876 JOURNAL OF SOFTWARE, VOL. 5, NO. 8, AUGUST 2010
© 2010 ACADEMY PUBLISHER
Client:Workload
populat ion=10pdfWork=Exponential(50) prob4:Association
prob=0.87
Browsing:ScenarioSurfer:Workload
populat ion=-1pdfWork=Poisson(5)
prob1:Association
prob=1
prob2:Association
prob=0.75Admin:Workload
populat ion=1pdfWork=Exponent ial(100)
prob5:Association
prob=0.13
RequestVideo:Scenario
UploadVideo:Scenario
prob3:Association
prob=0.25
(a) SVOrganizationDiagram
ClientWorkstation:ActiveResource
power=1schdPolicy=FIFO
Ass1:Association Ass2:Association Ass3:Association
WebServerNode:ActiveResource
power=2schdPolicy=FIFO
VideoServerNode:ActiveResource
power=2schdPolicy=FIFO
Internet:ActiveResource
power=1schdPolicy=PreemptiveResume
(b) ResourceDiagram
Figure 6: Specification view of web-based video applicationinit :Start
tr1:Transition
ClientWorkstation:ActiveResource
power=1schdPolicy=FIFO
RequestPage:BehaviorProcess
demandPDF=Exponential(10)
tr2:Transition
ProcessingRequest:BehaviorProcess
WebServerNode:ActiveResource
power=2schdPolicy=FIFO
tr3:Transitiontr4:Transition
tr5:Transition
end:End
ProcRequest:BehaviorDiagram
SendContent:BehaviorProcess
demandPDF=Exponential(5)
ShowPage:BehaviorProcess
demandPDF=Exponential(5)
(a) Browsing BehavioralDiagram
init :Start
tr1:Transition
WebServerNode:ActiveResource
power=2schdPolicy=FIFO
GetCookie:BehaviorProcess
demandPDF=Determinist ic(0.1)
br1:Branch
tr2:Transition
pr1:Transition
prob=0.60
pr2:Transition
prob=0.40
mg:Mergetr3:Transition tr4:Transition
LoadProperties:BehaviorProcess
demandPDF=Exponential(0.5)
CreateDynamicPage:BehaviorProcess
demandPDF=Determinist ic(0.1)
end:End
(b) ProcRequest sub-BehavioralDiagram
Figure 7: The Detailed view Browsing scenario
syntax and semantics. In this section we focus on thedynamic/behavioral part of SPEDP specified in sectionIII. More specifically, we specify how to map SPEDPelements into corresponding UML–PCM elements byfollowing the modeling of the example discussed in theprevious section. The UML–PCM domain derives fromthe UML OMG specifications [4], [22] and also from the
PCM-SPT extending the SPT OMG profile [5]. Detailson PCM–SPT can be found in [21].
A. Core & Performance
SPEDP UML PCM-SPT Stp
Model ModelOrganizationDia-
gramUse CaseDiagram
ResourceDiagram DeploymentDiagram
BehavioralDiagram Interaction/Activity/StateChartDiagram
PDF PAperfValue,
RTarrivalPatternPolicy PAresource
TABLE I.: Correspondences among SPEDPCore/Performance packages and UML/PCM-SPTelements.
Table I specifies the correspondences between theSPEDP Core and Performance packages’ elements andthe UML–PCM elements. This is the most fundamentalamong the tables, referred in all the following subsections.From this table we can argue that a UML–PCM Modelimplementing the SPEDP technique is composed by justUse Case Diagrams, Deployment Diagrams,Activity Diagrams, StateChart Diagramsand Interaction Diagrams (Sequence and/orCollaboration Diagrams).
B. OrganizationDiagram
SPEDP UML PCM-SPT Stp
Scenario UseCase PAcontextStakeholder ActorWorkload Actor PAclosedLoad,
PClosedWorkloadAssociation Association PAstepRelationship Extend /
Include
TABLE II.: Correspondences among SPEDP Organiza-tion package and UML/PCM-SPT elements.
Since, as specified in Table I, the SPEDP Organization-Diagram corresponds to a UML Use Case Diagram,
JOURNAL OF SOFTWARE, VOL. 5, NO. 8, AUGUST 2010 877
© 2010 ACADEMY PUBLISHER

init :Start tr1:Transition
ClientWorkstation:ActiveResource
power=1schdPolicy=FIFO
SelectService:BehaviorProcess
demandPDF=Exponential(10)
tr2:TransitionHandleSelection:BehaviorProcess
demandPDF=Determinist ic(2.0)
WebServerNode:ActiveResource
power=2schdPolicy=FIFO
tr3:Transitionfk1:Forktr4:Transition
tr5:Transition
InitiatePlayout:BehaviorProcess
demandPDF=Exponential(5.0)
VideoServerNode:ActiveResource
power=2schdPolicy=FIFO
tr6:Transition
InitializePlayer:BehaviorProcess
demandPDF=Determinist ic(0.5)
Confirm:BehaviorProcess
demandPDF=Exponential(0.5)
tr8:Transition
tr7:Transition
SendVideo:BehaviorProcess
demandPDF=Exponential(10)
Internet:ActiveResource
power=1schdPolicy=PreemptiveResume
tr9:Transition
SendTerminate:BehaviorProcess
demandPDF=Determinist ic(0.5)
TerminatePlayer:BehaviorProcess
demandPDF=Determinist ic(0.5)
tr10:Transition
jn1:Join
tr11:Transition
tr10:Transition
end:End
(a) Request BehavioralDiagram
init :Start tr1:Transition
ClientWorkstation:ActiveResource
power=1schdPolicy=FIFO
RequestLogin:BehaviorProcess
demandPDF=Exponential(10)
VideoServerNode:ActiveResource
power=2schdPolicy=FIFO
tr2:Transitionbr1:Branch
tr5:Transition
prob=0.30
tr4:Transition
prob=0.70
SendGrant:BehaviorProcess
demandPDF=Exponential(1)
ShowErrorPage:BehaviorProcess
demandPDF=Exponential(1)
ChooseVideo:BehaviorProcess
demandPDF=Determinist ic(2)
tr6:Transitiontr7:Transition
tr8:Transition
UploadVideo:BehaviorProcess
demandPDF=Exponential(400)
Internet:ActiveResource
power=1schdPolicy=PreemptiveResume
SendTerminate:BehaviorProcess
demandPDF=Determinist ic(0.5)
tr9:Transition
tr10:Transition
mg:Merge
end:End
(b) Upload BehavioralDiagram
Figure 8: The Detailed view of Request and Uploadscenarios
the elements of the former have a corresponding elementin the latter, as reported in Table II.
SPEDP Scenarios are mapped by UML UseCases,annotated by the PAcontext PCM-SPT stereotype,if they belongs to a leaf of the GVOrganizationDia-gram tree, since they represent independent SA sub-systems to further detail and investigate in terms ofperformance. Stakeholders correspond to Actors, mod-eling Workloads characterized by population=-1 (open)or population>0 (closed) if they are annotated by thePAopenLoad or PAclosedLoad stereotypes, respec-tively. The SPEDP Association is mapped by UMLAssociation characterized by the PAstep annotationin order to model the probabilistic association.
Fig. 9a shows the web-video application UML–PCMglobal view Use Case Diagram corresponding to theSPEDP GVOrganizationDiagram of Fig. 5b. It is obtainedby applying the mapping rules specified in Tables Iand II. The names used in the SPEDP GVOrganiza-tionDiagram corresponds to the ones specified in theUse Case Diagram. So, they both specify a Video-Management SPEDP Scenario/UML–PCM Use Caserepresenting the video management functionalities, and a
User
VideoManagement
<<PAcontext>>
capacity=6
concurrent=3
*
(a) UML–PCM Global View
Surfer
Browsing
<<PAopenLoad>>
PAoccurrence=(’unbounded’,’poisson’,5)
<<PAstep>>
PAprob=1
Admin
<<PAclosedLoad>>
PApopulation=1
PAextDelay=(’assm’,’dist’,’exponential’,100)
<<PAstep>>
PAprob=0.75
Upload Video
<<PAstep>>
PAprob=0.25
Request Video
Client
<<PAstep>>
PAprob=0.87
<<PAstep>>
PAprob=0.13
<<PAclosedLoad>>
PApopulation=10
PAextDelay=(’assm’,’dist’,’exponential’,50)
(b) UML–PCM Specification View
Figure 9: Global and Specification view of the web-basedvideo application in UML–PCM domain
User Stakeholder/Actor to model the generic interac-tions, as reported in Fig. 9a. The PAcontext PCM-SPT annotation associated to the VideoManagementUse Case specifies its access policy, represented by thespecific attributes of the SPEDP Scenario.
In the same way the Use Case Diagram of Fig. 9bmodels what specified by the SVOrganizationDiagram ofFig. 6a in the SPEDP domain. Thus, Surfer, Adminand Client Actors annotated by PAworkloadstereotypes correspond to the Surfer, Admin and ClientWorkload objects of the SVOrganizationDiagram ofFig.6a, respectively. The Admin and Client are closedworkload (population ≥ 1), while the Surfer is anopen workload (population = −1). Consequently, theAdmin and Client Actors are PAclosedloadstereotyped, while the Surfer is associated to thePAopenload stereotype. The PApopulation andPAextDelay Actor tags in Fig. 9b, are deduced by thecorresponding population and pdfWork SPEDP Workloadattributes. The probability of the associations betweenActor and Use Case is modeled by stereotyping theUML Association with PCM-SPT PAsteps, speci-fying in the PAprob tag such probability, in the specificcase drawn from the corresponding prob Associationvalues in Fig.6a.
C. Resource
Table III reports the mapping among the SPEDP Re-sourceDiagram’s elements to the UML/PCM-SPT stereo-typed Deployment Diagram elements.
By applying it to the ResourceDiagram of Fig. 6bdescribing the specification view computing systemarchitecture of the web-based video application, theDeployment Diagram of Fig. 10 is obtained. TheClientWorkstation, ServerNode, VideoServerNode
878 JOURNAL OF SOFTWARE, VOL. 5, NO. 8, AUGUST 2010
© 2010 ACADEMY PUBLISHER

SPEDP UML PCM-SPT Stp
Resource Node, ComponentActiveResource Node PAhostPassiveResource Node, Component
PhysicalPResource Node PAresourceLogicalPResource Component PAresource
LinkResource RelationshipAssociation AssociationDependency Dependency GRMdeploys
TABLE III.: Correspondences among SPEDP Resourcepackage and UML/PCM-SPT elements.
ClientWorkStation
<<PAhost>>
PArate=1.0
PAschdPolicy=’FIFO’
WebServerNode
<<PAhost>>
PArate=2.0
PAschdPolicy=’FIFO’
VideoServerNode
<<PAhost>>
PArate=2.0
PAschdPolicy=’FIFO’
Internet<<PAhost>>
PArate=1.0
PAschdPolicy=’PreemptResume’
Figure 10: Specification view resources of the web-basedvideo application in UML–PCM domain
and Internet ActiveResources are mapped intoClientWorkStation, WebServerNode,VideoServerNode and Internet UML Nodes,respectively. Such Nodes are all associated to PAhoststereotypes, mapping the schdPolicy and power Resourceattributes with the corresponding PAschdPolicy andPArate tags.
D. Behavior
Table IV reports the mapping from SPEDPBehavioralDiagram to UML 2 [22] PCM-SPTannotated Activity Diagram (AD), StateChartDiagram (SCD) and Interaction Diagram(ID) (Sequence, Collaboration andCommunication Diagrams), characterized inthe corresponding columns. The last column of suchtable reports the PCM-SPT stereotypes associatedto the UML diagrams’ elements identified by theacronym (AD, SCD, ID). UML PAstep stereotypedActivity Edge of Activity Diagrams andTransitions of StateChart Diagrams mapSPEDP probabilistic Transitions outgoing fromBranches, while in Interaction Diagramsthese latter correspond to CombinedFragmentswith Interaction-OperatorKind=‘‘opt’’objects, also annotated by PAstep stereotypes.In the specific case where the BehavioralDiagramcontains a Merge followed by the matchingBranch, this construct represents a loop,and it is mapped into UML InteractionDiagrams by specific CombinedFragments(Interaction-OperatorKind=‘‘loop’’).In the same way, a Fork-Join statement hascorresponding elements in both Activity Diagrams(ForkNode, JoinNode) and StateChartDiagrams (PseudoState -Kind=‘‘fork’’and -Kind=‘‘join’’), while the whole statementcorresponds to a specific CombinedFragment
with Interaction-OperatorKind=‘‘par’’in UML 2 Interaction Diagrams. The SPEDPResource objects are mapped into Partitionsswim-lanes of Activity Diagrams intoRegions of StateChart Diagrams andinto Interaction Diagrams’ Lifelines,characterized by the corresponding DeploymentDiagram Components/Nodes’ names.
ClientWorkstation
start
Request Page
WebServer Node
<<PAstep>>
PAdemand=(’assm’,’dist’,’exponential’,10)Processing Request
Send Content
<<PAstep>>
PAdemand=(’assm’,’dist’,’exponential’,5)
Show Page
<<PAstep>>
PAdemand=(’assm’,’dist’,’exponential’,5)
Get Cookie
<<PAstep>>
PAdemand=(’est’,’mean’,0.1)
Load Properties
[has cookie]
<<PAstep>>
PAprob=0.40
<<PAstep>>
PAdemand=(’assm’,’dist’,’exponential’,0.5)
Create Dynamic Page
[wi thout cookie]
<<PAstep>>
PAdemand=(’est’,’mean’,0.1)
<<PAstep>>
PAprob=0.60
<<PAstep>>
PAextOp=(’ProcRequest’,1)
(a) Browsing AD & ProcRequest Sub-AD
GetCookie
<<PAstep>>
PAdemand(’est’,’mean’,0.1)
LoadProperties CreateDynamic Page
<<PAstep>>
PAprob=0.40<<PAstep>>
PAprob=0.60
<<PAstep>>
PAdemand(’assm’,’dist’,’exponential’,0.5)
<<PAstep>>
PAdemand(’est’,’mean’,0.1)
WebServer Node
[has cookie] [without cookie]
(b) ProcRequest Sub-SCD
:WebServerNode
GetCookie
LoadProperties
CreateDynamicPage
alt [has cookie]
[without cookie]
<<PAstep>>
PAprob=0.40
PAdemand=(’assm’,’dist’,’exponential’,0.5)
<<PAstep>>
PAprob=0.60
PAdemand=(’est’,’mean’,0.1)
<<PAstep>>
PAdemand=(’est’,’mean’,0.1)
SendContent
<<PAstep>>
PAdemand=(’assm’,’dist’,’exponential’,5)
sd ProcRequest
(c) ProcRequest Sub-SD
Figure 11: The Detailed view Browsing scenario of theweb-based video application in the UML–PCM domain.
One of the main benefit of the UML/PCM-SPTcharacterization of SPEDP is the possibility to repre-sent the behavior of the SA under exam by exploit-ing several different diagrams, also nesting diagramsand formalisms into hierarchical models. As an exam-ple, in Fig. 11 we represent the dynamic behavior ofthe Browsing scenario by using UML Activity,Statechart and Sequence Diagrams mapping theSPEDP BehavioralDiagram of Fig. 7, as stated by Ta-
JOURNAL OF SOFTWARE, VOL. 5, NO. 8, AUGUST 2010 879
© 2010 ACADEMY PUBLISHER
SPEDP UML AD UML SCD UML ID PCM-SPT Stp
Process ActivityNode VertexBehaviorProcess Action State Message PAstep
Transition ActivityEdge Transition MessageEnd AD/SCD PAstepStatement ControlNode PseudoState
Branch DecisionNode PseudoState CombinedFragment ID PAstep-Kind=‘‘choice’’ Interaction-
Merge MergeNode PseudoState -OperatorKind=‘‘alt’’-Kind=‘‘junction’’
Merge/Branch CombinedFragment(Conditional Interaction- ID PAstep
Loops) -OperatorKind=‘‘loop’’Fork ForkNode PseudoState CombinedFragment
-Kind=‘‘fork’’ Interaction-Join JoinNode PseudoState -OperatorKind=‘‘par’’
-Kind=‘‘join’’Start Initial PseudoState Message
-Kind=‘‘initial’’ MessageKind=‘‘found’’End FinalNode FinalState Message
MessageKind=‘‘lost’’Resource ActivityPartition Region Lifeline
TABLE IV.: Correspondences among SPEDP Behavior package and UML/PCM-SPT elements.
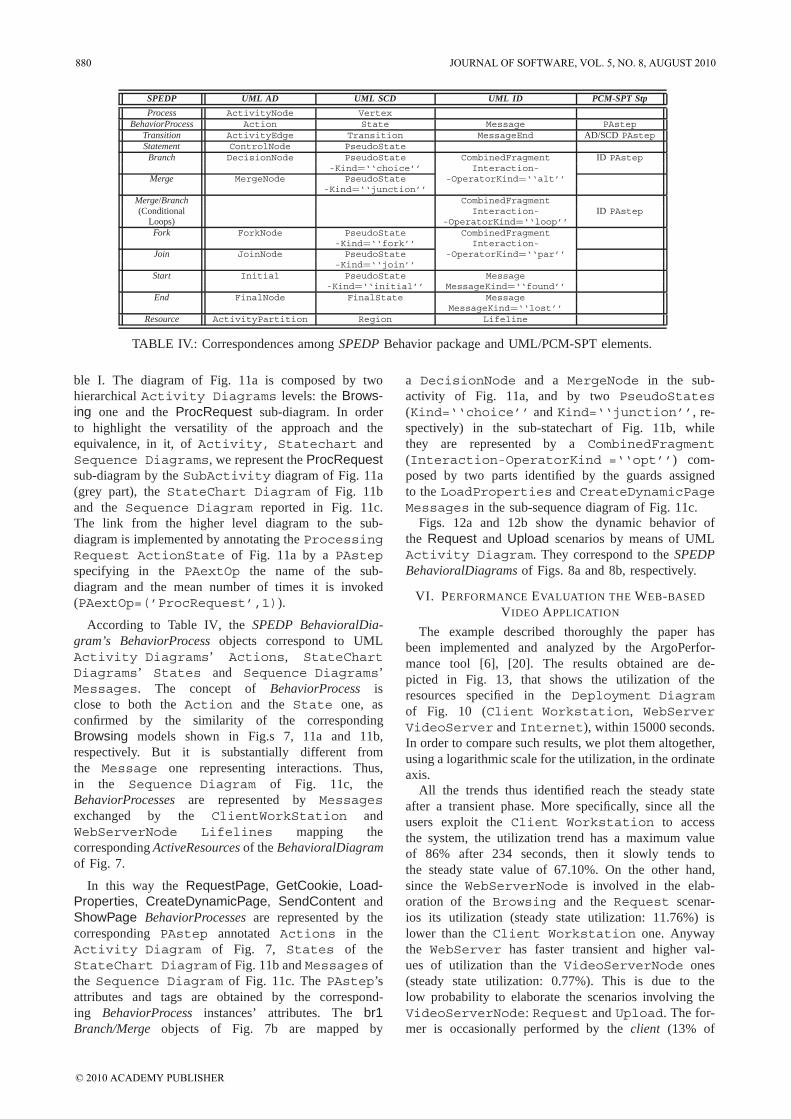
ble I. The diagram of Fig. 11a is composed by twohierarchical Activity Diagrams levels: the Brows-ing one and the ProcRequest sub-diagram. In orderto highlight the versatility of the approach and theequivalence, in it, of Activity, Statechart andSequence Diagrams, we represent the ProcRequestsub-diagram by the SubActivity diagram of Fig. 11a(grey part), the StateChart Diagram of Fig. 11band the Sequence Diagram reported in Fig. 11c.The link from the higher level diagram to the sub-diagram is implemented by annotating the ProcessingRequest ActionState of Fig. 11a by a PAstepspecifying in the PAextOp the name of the sub-diagram and the mean number of times it is invoked(PAextOp=(’ProcRequest’,1)).
According to Table IV, the SPEDP BehavioralDia-gram’s BehaviorProcess objects correspond to UMLActivity Diagrams’ Actions, StateChartDiagrams’ States and Sequence Diagrams’Messages. The concept of BehaviorProcess isclose to both the Action and the State one, asconfirmed by the similarity of the correspondingBrowsing models shown in Fig.s 7, 11a and 11b,respectively. But it is substantially different fromthe Message one representing interactions. Thus,in the Sequence Diagram of Fig. 11c, theBehaviorProcesses are represented by Messagesexchanged by the ClientWorkStation andWebServerNode Lifelines mapping thecorresponding ActiveResources of the BehavioralDiagramof Fig. 7.
In this way the RequestPage, GetCookie, Load-Properties, CreateDynamicPage, SendContent andShowPage BehaviorProcesses are represented by thecorresponding PAstep annotated Actions in theActivity Diagram of Fig. 7, States of theStateChart Diagram of Fig. 11b and Messages ofthe Sequence Diagram of Fig. 11c. The PAstep’sattributes and tags are obtained by the correspond-ing BehaviorProcess instances’ attributes. The br1Branch/Merge objects of Fig. 7b are mapped by
a DecisionNode and a MergeNode in the sub-activity of Fig. 11a, and by two PseudoStates(Kind=‘‘choice’’ and Kind=‘‘junction’’, re-spectively) in the sub-statechart of Fig. 11b, whilethey are represented by a CombinedFragment(Interaction-OperatorKind =‘‘opt’’) com-posed by two parts identified by the guards assignedto the LoadProperties and CreateDynamicPageMessages in the sub-sequence diagram of Fig. 11c.
Figs. 12a and 12b show the dynamic behavior ofthe Request and Upload scenarios by means of UMLActivity Diagram. They correspond to the SPEDPBehavioralDiagrams of Figs. 8a and 8b, respectively.
VI. PERFORMANCE EVALUATION THE WEB-BASED
VIDEO APPLICATION
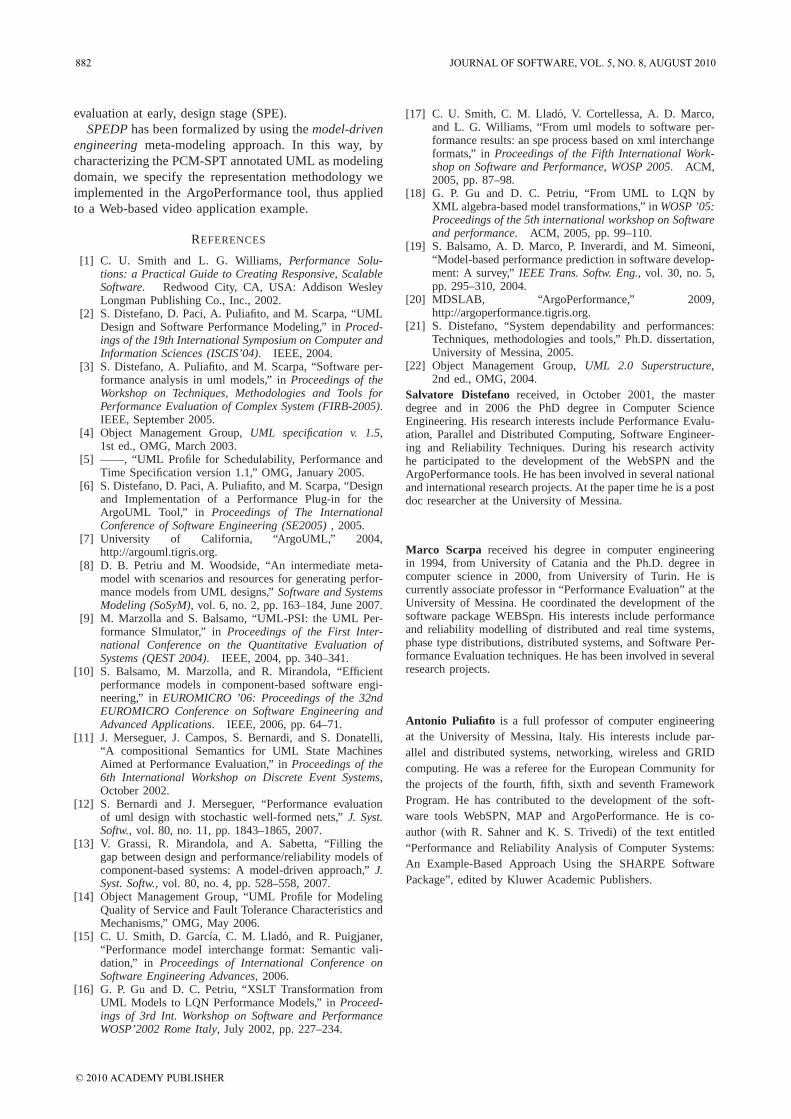
The example described thoroughly the paper hasbeen implemented and analyzed by the ArgoPerfor-mance tool [6], [20]. The results obtained are de-picted in Fig. 13, that shows the utilization of theresources specified in the Deployment Diagramof Fig. 10 (Client Workstation, WebServerVideoServer and Internet), within 15000 seconds.In order to compare such results, we plot them altogether,using a logarithmic scale for the utilization, in the ordinateaxis.
All the trends thus identified reach the steady stateafter a transient phase. More specifically, since all theusers exploit the Client Workstation to accessthe system, the utilization trend has a maximum valueof 86% after 234 seconds, then it slowly tends tothe steady state value of 67.10%. On the other hand,since the WebServerNode is involved in the elab-oration of the Browsing and the Request scenar-ios its utilization (steady state utilization: 11.76%) islower than the Client Workstation one. Anywaythe WebServer has faster transient and higher val-ues of utilization than the VideoServerNode ones(steady state utilization: 0.77%). This is due to thelow probability to elaborate the scenarios involving theVideoServerNode: Request and Upload. The for-mer is occasionally performed by the client (13% of
880 JOURNAL OF SOFTWARE, VOL. 5, NO. 8, AUGUST 2010
© 2010 ACADEMY PUBLISHER

ClientWorkstation
SelectService
WebServer Node
Confirm
<<PAstep>>
PAdemand=(’assm’,’dist’,’exponential’,0.5)
InitializePlayer
<<PAstep>>
PAdemand=(’est’,’means’,0.5)
HandleSelection
VideoServer Node
TerminatePlayer
SendTerminate
Internet
SendVideo
<<PAstep>>
PAdemand=(’assm’,’dist’,’exponential’,10)
PArep=100
InitiatePlayout
<<PAstep>>
PAdemand=(’assm’,’dist’,’exponential’,5)
<<PAstep>>
PAdemand=(’est’,’means’,1.0)
<<PAstep>>
PAdemand=(’est’,’means’,0.5)
<<PAstep>>
PAdemand=(’est’,’means’,2.0)
<<PAstep>>
PAdemand=(’assm’,’dist’,’exponential’,10)
ClientWorkstation VideoServer Node Internet
RequestLogin
<<PAstep>>
PAdemand=(’assm’,’dist’,’exponential’,10)
ShowErrorPage
<<PAstep>>
PAdemand=(’assm’,’dist’,’exponential’,1)
[Login refused]
<<PAstep>>
PAprob=0.30
Send Grant
[Login accepted]
<<PAstep>>
PAprob=0.70
<<PAstep>>
PAdemand=(’assm’,’dist’,’exponential’,1)
ChooseVideo
<<PAstep>>
PAdemand=(’est’,’means’,2)
UploadVideo
<<PAstep>>
PAdemand=(’assm’,’dist’,’exponential’,400)
SendTerminate
<<PAstep>>
PAdemand=(’est’,’means’,0.5)
(a) Request (b) Upload
Figure 12: Detailed view Request and Upload scenario of the web-based video application in the UML–PCM domain.
the total cases), and the latter is invoked by the ad-ministrator, that has the lowest arrival rates among theworkloads. Finally, the Internet is involved in theSendVideo and UploadVideo activities (Fig. 12):their computation implies an utilization (steady stateutilization: 48.16%) higher than WebServerNode andVideoServerNode.
From such results we can argue that the most criticalresource for the system is the Client Workstation.Therefore, in order to improve the performance of theoverall SA, it is necessary to enhance and/or replicate theresources from which a user can access to the computingsystem. Moreover, to improve the system performancefurther Internet resources (bandwidth) are required asshown in Fig. 13a. On the other hand, since both theVideoServer and the Webserver Nodes show lowutilization they can manage higher workloads incomingby increasing Client Workstation and Internetresources.
Fig. 13b, show similar trends for the ClientWorkstation and the Webserver Node through-put, while lower throughput are experienced forthe VideoServer Node and especially for theInternet.
VII. CONCLUSIONS
In previous works we defined an SPE technique basedon the intermediate Performance Context Model (PCM)that automates the translation of the project requirementsfrom the design domain to a performance domain by theArgoPerformance tool. This has highlighted the necessityof formalizing the description of a software architecture.In this paper we address the problem from a wider pointof view, defining a software development process whichtakes into account performance specifications and require-ments, an integrated software performance engineering
0 5000 10000 15000Sec.
0,001
0,01
0,1
1
Util
izat
ion
ClientWorkStationInternetWebServerNodeVideoServerNode
(a) Utilization
0 5000 10000 15000Sec.
0,0001
0,001
0,01
0,1
Thr
ough
put
ClientWorkStationInternetWebServerNodeVideoServerNode
(b) Throughput
Figure 13: The Web Video Application Results
development process (SPEDP). In this way, a wholeprocess starting from the software architecture modeland the performance requirements aiming at implement-ing a software architecture that meets the requirementsthoroughly all the software design phases is specified.It is more powerful than both an SPE technique, sinceit can be applied to existing software architecture asa common performance evaluation methodology, and asoftware performance evaluation technique, since it allows
JOURNAL OF SOFTWARE, VOL. 5, NO. 8, AUGUST 2010 881
© 2010 ACADEMY PUBLISHER
evaluation at early, design stage (SPE).SPEDP has been formalized by using the model-driven
engineering meta-modeling approach. In this way, bycharacterizing the PCM-SPT annotated UML as modelingdomain, we specify the representation methodology weimplemented in the ArgoPerformance tool, thus appliedto a Web-based video application example.
REFERENCES
[1] C. U. Smith and L. G. Williams, Performance Solu-tions: a Practical Guide to Creating Responsive, ScalableSoftware. Redwood City, CA, USA: Addison WesleyLongman Publishing Co., Inc., 2002.
[2] S. Distefano, D. Paci, A. Puliafito, and M. Scarpa, “UMLDesign and Software Performance Modeling,” in Proced-ings of the 19th International Symposium on Computer andInformation Sciences (ISCIS’04). IEEE, 2004.
[3] S. Distefano, A. Puliafito, and M. Scarpa, “Software per-formance analysis in uml models,” in Proceedings of theWorkshop on Techniques, Methodologies and Tools forPerformance Evaluation of Complex System (FIRB-2005).IEEE, September 2005.
[4] Object Management Group, UML specification v. 1.5,1st ed., OMG, March 2003.
[5] ——, “UML Profile for Schedulability, Performance andTime Specification version 1.1,” OMG, January 2005.
[6] S. Distefano, D. Paci, A. Puliafito, and M. Scarpa, “Designand Implementation of a Performance Plug-in for theArgoUML Tool,” in Proceedings of The InternationalConference of Software Engineering (SE2005) , 2005.
[7] University of California, “ArgoUML,” 2004,http://argouml.tigris.org.
[8] D. B. Petriu and M. Woodside, “An intermediate meta-model with scenarios and resources for generating perfor-mance models from UML designs,” Software and SystemsModeling (SoSyM), vol. 6, no. 2, pp. 163–184, June 2007.
[9] M. Marzolla and S. Balsamo, “UML-PSI: the UML Per-formance SImulator,” in Proceedings of the First Inter-national Conference on the Quantitative Evaluation ofSystems (QEST 2004). IEEE, 2004, pp. 340–341.
[10] S. Balsamo, M. Marzolla, and R. Mirandola, “Efficientperformance models in component-based software engi-neering,” in EUROMICRO ’06: Proceedings of the 32ndEUROMICRO Conference on Software Engineering andAdvanced Applications. IEEE, 2006, pp. 64–71.
[11] J. Merseguer, J. Campos, S. Bernardi, and S. Donatelli,“A compositional Semantics for UML State MachinesAimed at Performance Evaluation,” in Proceedings of the6th International Workshop on Discrete Event Systems,October 2002.
[12] S. Bernardi and J. Merseguer, “Performance evaluationof uml design with stochastic well-formed nets,” J. Syst.Softw., vol. 80, no. 11, pp. 1843–1865, 2007.
[13] V. Grassi, R. Mirandola, and A. Sabetta, “Filling thegap between design and performance/reliability models ofcomponent-based systems: A model-driven approach,” J.Syst. Softw., vol. 80, no. 4, pp. 528–558, 2007.
[14] Object Management Group, “UML Profile for ModelingQuality of Service and Fault Tolerance Characteristics andMechanisms,” OMG, May 2006.
[15] C. U. Smith, D. Garcıa, C. M. Llado, and R. Puigjaner,“Performance model interchange format: Semantic vali-dation,” in Proceedings of International Conference onSoftware Engineering Advances, 2006.
[16] G. P. Gu and D. C. Petriu, “XSLT Transformation fromUML Models to LQN Performance Models,” in Proceed-ings of 3rd Int. Workshop on Software and PerformanceWOSP’2002 Rome Italy, July 2002, pp. 227–234.
[17] C. U. Smith, C. M. Llado, V. Cortellessa, A. D. Marco,and L. G. Williams, “From uml models to software per-formance results: an spe process based on xml interchangeformats,” in Proceedings of the Fifth International Work-shop on Software and Performance, WOSP 2005. ACM,2005, pp. 87–98.
[18] G. P. Gu and D. C. Petriu, “From UML to LQN byXML algebra-based model transformations,” in WOSP ’05:Proceedings of the 5th international workshop on Softwareand performance. ACM, 2005, pp. 99–110.
[19] S. Balsamo, A. D. Marco, P. Inverardi, and M. Simeoni,“Model-based performance prediction in software develop-ment: A survey,” IEEE Trans. Softw. Eng., vol. 30, no. 5,pp. 295–310, 2004.
[20] MDSLAB, “ArgoPerformance,” 2009,http://argoperformance.tigris.org.
[21] S. Distefano, “System dependability and performances:Techniques, methodologies and tools,” Ph.D. dissertation,University of Messina, 2005.
[22] Object Management Group, UML 2.0 Superstructure,2nd ed., OMG, 2004.
Salvatore Distefano received, in October 2001, the masterdegree and in 2006 the PhD degree in Computer ScienceEngineering. His research interests include Performance Evalu-ation, Parallel and Distributed Computing, Software Engineer-ing and Reliability Techniques. During his research activityhe participated to the development of the WebSPN and theArgoPerformance tools. He has been involved in several nationaland international research projects. At the paper time he is a postdoc researcher at the University of Messina.
Marco Scarpa received his degree in computer engineeringin 1994, from University of Catania and the Ph.D. degree incomputer science in 2000, from University of Turin. He iscurrently associate professor in “Performance Evaluation” at theUniversity of Messina. He coordinated the development of thesoftware package WEBSpn. His interests include performanceand reliability modelling of distributed and real time systems,phase type distributions, distributed systems, and Software Per-formance Evaluation techniques. He has been involved in severalresearch projects.
Antonio Puliafito is a full professor of computer engineeringat the University of Messina, Italy. His interests include par-allel and distributed systems, networking, wireless and GRIDcomputing. He was a referee for the European Community forthe projects of the fourth, fifth, sixth and seventh FrameworkProgram. He has contributed to the development of the soft-ware tools WebSPN, MAP and ArgoPerformance. He is co-author (with R. Sahner and K. S. Trivedi) of the text entitled“Performance and Reliability Analysis of Computer Systems:An Example-Based Approach Using the SHARPE SoftwarePackage”, edited by Kluwer Academic Publishers.
882 JOURNAL OF SOFTWARE, VOL. 5, NO. 8, AUGUST 2010
© 2010 ACADEMY PUBLISHER
Related Documents