International Journal of Renewable Energy, Vol. 9, No. 2, July - December 2014 Implementation of Photovoltaic water pumping system with optimization controls Najet Rebei, Ali Hmidet, Rabiaa Gammoudi, Othman Hasnaoui Unit of research (ERCO), INSAT, University of Carthage Tunisia North urban center, B.P. N°676, 1080 Tunis Cedex, Tunisia E-mail : [email protected] Abstract To increase the output efficiency of a photovoltaic (PV) generation system, it is important to have an efficient maximum power point tracking (MPPT) technique. This paper describes the analysis, design and implementation of efficient tracking methods for a stand-alone PV generation system, using two approaches: The constant voltage (CV) method is based on the optimum voltage that is considered as a reference value; and the Increment Conductance (Inc-Cond) MPPT control. The output controller can adjust the duty ratio of DC/DC boost converter where its output feeds a set of Moto- pump via a DC/AC inverter. This paper presents a detailed experiment of the two implementation techniques, based on system performance characteristics, and energy utilization for standalone PV pumping systems. Contributions are made in several aspects of the whole system, including converter design, system simulation, controller programming, and experimental setup. The resultant system is capable of tracking MPPs accurately and rapidly without steady-state oscillation, and its dynamic performance is also satisfactory. MATLAB / Simulink and dSpace DS1104 are used to carry out studies and implement algorithms. The two proposed methods have been validated by implementation the performance of the PV pumping systems installed in the reach laboratory in Tunisia. Experimental results indicate the feasibility and the improved functionality of the system. Keywords: Photovoltaic generator (PVG), Maximum power point tracking (MPPT), Boost DC/DC converter, DC/AC inverter, Moto-pump 1. Introduction The sources of oil are becoming increasingly rare, while the energy demands of the world rise continuously. It is estimated that global reserves will be exhausted by 2030 if consumption is not radically amended. Because of this, it is necessary to find another way to take over the constraint and to use a source of economic power and low emissions because the environmental protection has become an important issue, [1]. Many scientific studies have been conducted in the field of unlimited energy, such as the production of electricity through wind and solar energy conversion [2], [3]. So, the economic incentives and huge steps in electronic technology are promoting the use of photovoltaic systems. The solar photovoltaic energy has received great attention and experienced impressive progress in countries all over the world in recent years. Specially, standalone photovoltaic pumping systems have become a favorable solution for water supply, gaining more acceptance and market share, particularly in rural areas that have an important amount of illumination and have no access to an electric grid. The maximization of energy consumption of these systems via maximum power point tracking (MPPT) has not been sufficiently exploited in practice. Directly connected systems, for example, operate at the intersection of current–voltage curves of the PV array and the moto-pump position. This operating point may be far from the maximum power point (MPP) of the generator, wasting a significant proportion of the available solar power. A DC/DC converter controlled by an MPPT algorithm can be used as a pump controller to match the PV generator to the optimum motor- pump position. A number of different MPPT algorithms have been proposed [4], [5]. The simplest, is to operate the PV array at a constant voltage equal to the MPP voltage (ignoring the effects of illumination and temperature variations on the MPP voltage). This value is used as a reference for a feedback control loop that usually employs a PI controller to adjust the duty ratio of the MPPT converter. It is realized by an analog and/or a digital circuit. This approach offers significantly better

Welcome message from author
This document is posted to help you gain knowledge. Please leave a comment to let me know what you think about it! Share it to your friends and learn new things together.
Transcript
International Journal of Renewable Energy, Vol. 9, No. 2, July - December 2014
Implementation of Photovoltaic water pumping system with optimization controls
Najet Rebei, Ali Hmidet, Rabiaa Gammoudi, Othman Hasnaoui
Unit of research (ERCO), INSAT, University of Carthage Tunisia North urban center, B.P. N°676,
1080 Tunis Cedex, Tunisia E-mail : [email protected]
Abstract
To increase the output efficiency of a photovoltaic (PV) generation system, it is important to have an efficient maximum power point tracking (MPPT) technique. This paper describes the analysis, design and implementation of efficient tracking methods for a stand-alone PV generation system, using two approaches: The constant voltage (CV) method is based on the optimum voltage that is considered as a reference value; and the Increment Conductance (Inc-Cond) MPPT control. The output controller can adjust the duty ratio of DC/DC boost converter where its output feeds a set of Moto- pump via a DC/AC inverter. This paper presents a detailed experiment of the two implementation techniques, based on system performance characteristics, and energy utilization for standalone PV pumping systems. Contributions are made in several aspects of the whole system, including converter design, system simulation, controller programming, and experimental setup. The resultant system is capable of tracking MPPs accurately and rapidly without steady-state oscillation, and its dynamic performance is also satisfactory. MATLAB / Simulink and dSpace DS1104 are used to carry out studies and implement algorithms. The two proposed methods have been validated by implementation the performance of the PV pumping systems installed in the reach laboratory in Tunisia. Experimental results indicate the feasibility and the improved functionality of the system. Keywords: Photovoltaic generator (PVG), Maximum power point tracking (MPPT), Boost DC/DC
converter, DC/AC inverter, Moto-pump 1. Introduction The sources of oil are becoming increasingly rare, while the energy demands of the world rise continuously. It is estimated that global reserves will be exhausted by 2030 if consumption is not radically amended. Because of this, it is necessary to find another way to take over the constraint and to use a source of economic power and low emissions because the environmental protection has become an important issue, [1]. Many scientific studies have been conducted in the field of unlimited energy, such as the production of electricity through wind and solar energy conversion [2], [3]. So, the economic incentives and huge steps in electronic technology are promoting the use of photovoltaic systems. The solar photovoltaic energy has received great attention and experienced impressive progress in countries all over the world in recent years. Specially, standalone photovoltaic pumping systems have become a favorable solution for water supply, gaining more acceptance and market share, particularly in rural areas that have an important amount of illumination and have no access to an electric grid. The maximization of energy consumption of these systems via maximum power point tracking (MPPT) has not been sufficiently exploited in practice. Directly connected systems, for example, operate at the intersection of current–voltage curves of the PV array and the moto-pump position. This operating point may be far from the maximum power point (MPP) of the generator, wasting a significant proportion of the available solar power. A DC/DC converter controlled by an MPPT algorithm can be used as a pump controller to match the PV generator to the optimum motor-pump position. A number of different MPPT algorithms have been proposed [4], [5]. The simplest, is to operate the PV array at a constant voltage equal to the MPP voltage (ignoring the effects of illumination and temperature variations on the MPP voltage). This value is used as a reference for a feedback control loop that usually employs a PI controller to adjust the duty ratio of the MPPT converter. It is realized by an analog and/or a digital circuit. This approach offers significantly better

International Journal of Renewable Energy, Vol. 9, No. 2, July - December 2014
8
energy utilization efficiencies. The implementation efficiency is improved by employing the increment conductance MPPT technique. This is a simple algorithm that does not require a previous knowledge of the PV generator characteristics or the measurement of solar intensity and cell temperature. The optimum voltage is instantaneously adjusted under weather conditions. This paper presents experiments studies realized on the solar panel on different days where the behavior of the voltage and current under different climate conditions are recorded. It presents also a detailed theoretical and experimental evaluation of the reference constant voltage and the increment conductance implementation techniques, in terms of overall energy utilization. [6-9].The effects of different climatic perturbation and speed variation of moto-pump are investigated and criteria for the choice of some parameters are presented. 2. System description and experimental methodology
As experimental PV pumping system prototype comprised of ten 500 Wp, TITAN- 12-50/ STP-50-01 solar modules (associated into series connected modules), a boost DC/DC and a DC/AC inverter type SEMIKRON of 20 KVA power. It essentially comprises three power modules (bridge arm SKM50GB123D) each consists of two IGBT switches of rated current 50A, and a Sun-Pumps LOWARA CEA70/3/A; the motor-pump set consists of a centrifugal pump driven by a three-phase induction Motor 3~SM63BG/304. A dSpace DSP1104 interface card; used for acquisition, control and treatment results. A simplified circuit diagram of this setup is illustrated in Fig. 1.
Boostconverter
PWMcontrol
MPPTcontrol
/DC ACinverter IM
PumpPV
Figure 1. Block diagram of the Photovoltaic water pumping system
The PV array was installed facing the maximum possible annual light incidence at a fixed tilt angle respecting horizontal. The PV array current and voltage were measured with sensors: LA25-NP and LV25-P, respectively. For experimental flexibility and ease of programming, a Texas Instruments TMS320F240 DSP based on control kit CP1104 was used for the control and the data acquisition. Meteorological parameters were recorded utilizing a weather sensors cell (temperature and illumination) installed on the same roof on which the PV array is installed as shown in figure 2.
The illumination sensor cell
The temperaturesensor cell
Figure 2. Temperature and illumination sensors cells
A longer experimental test was chosen to study the effects of solar irradiance and cell temperature variations on system behavior and to calculate the energy utilization for different weather conditions. In this test, the parameters were recorded with a low acquisition rate to limit the storage memory required for the acquisition of files. This test was repeated many times at different weather conditions and results are shown to demonstrate the performance of the MPPT algorithm during periods of slow and smooth changes in irradiance conditions as well as faster irradiance changes that occur over a period of a few seconds. Such irradiance changes are conman in Tunisia where these tests were carried out
International Journal of Renewable Energy, Vol. 9, No. 2, July - December 2014
9
3. PVG experimental studies In this section, experimental results are realized with the PVG that is composed of ten series modules, in order to provide the desired values of the output voltage and the current; which are related by the following equation:
(1)
Where ,
, and .
The index used in the above equations indicates that the value corresponds to the standard test condition (STC) regime defined by a solar irradiance and junction temperature .
1. Radiation Influence
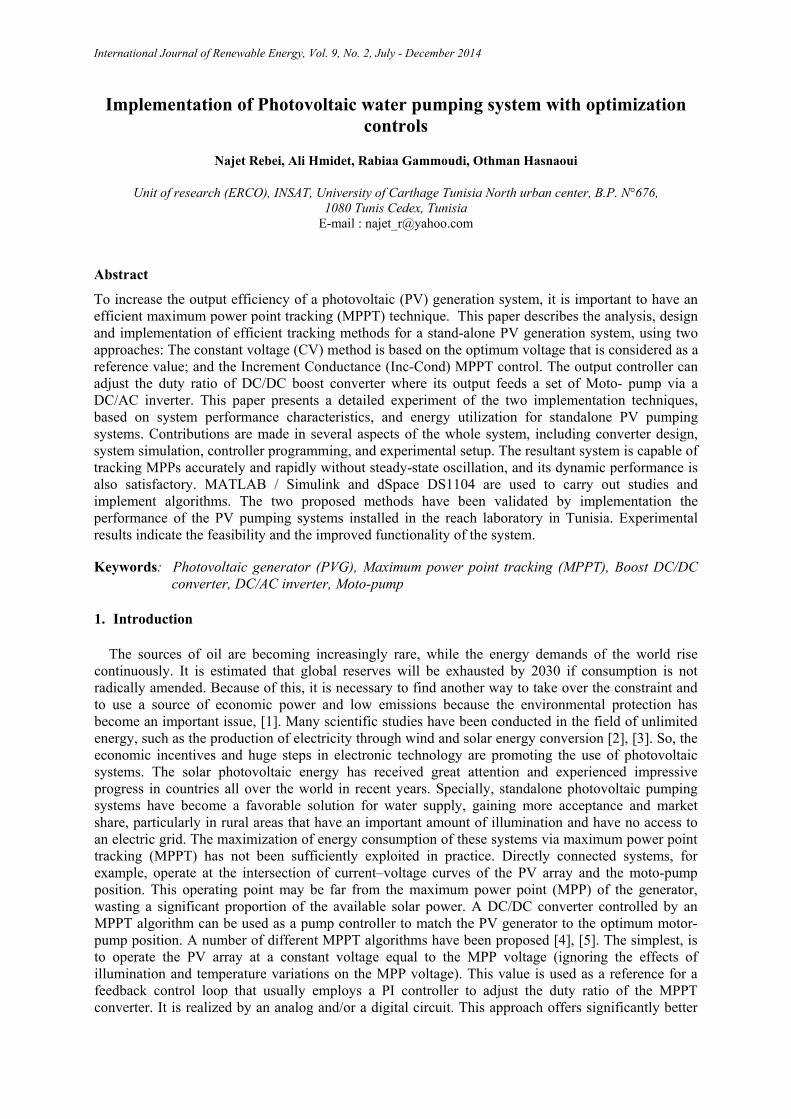
The following results are recorded using illumination sensor; during a few moments ignoring variations in temperature within 1%. So, for a temperature of 26°C, are harvested for different radiation during a few days as shown in Fig.3. The current short-circuit increases linearly with illumination differently to the open circuit voltage which remains practically unvarying.
20 40 60 80 100 120 140 160 180 2000
0.5
1
1.5
2
2.5
3
3.5
900 / ²W m
600 / ²W m
400 / ²W m
300 / ²W m
200 / ²W mV
ccI
Figure 3 . I–V photovoltaic characteristic for different irradiation levels
2. Temperature Influence
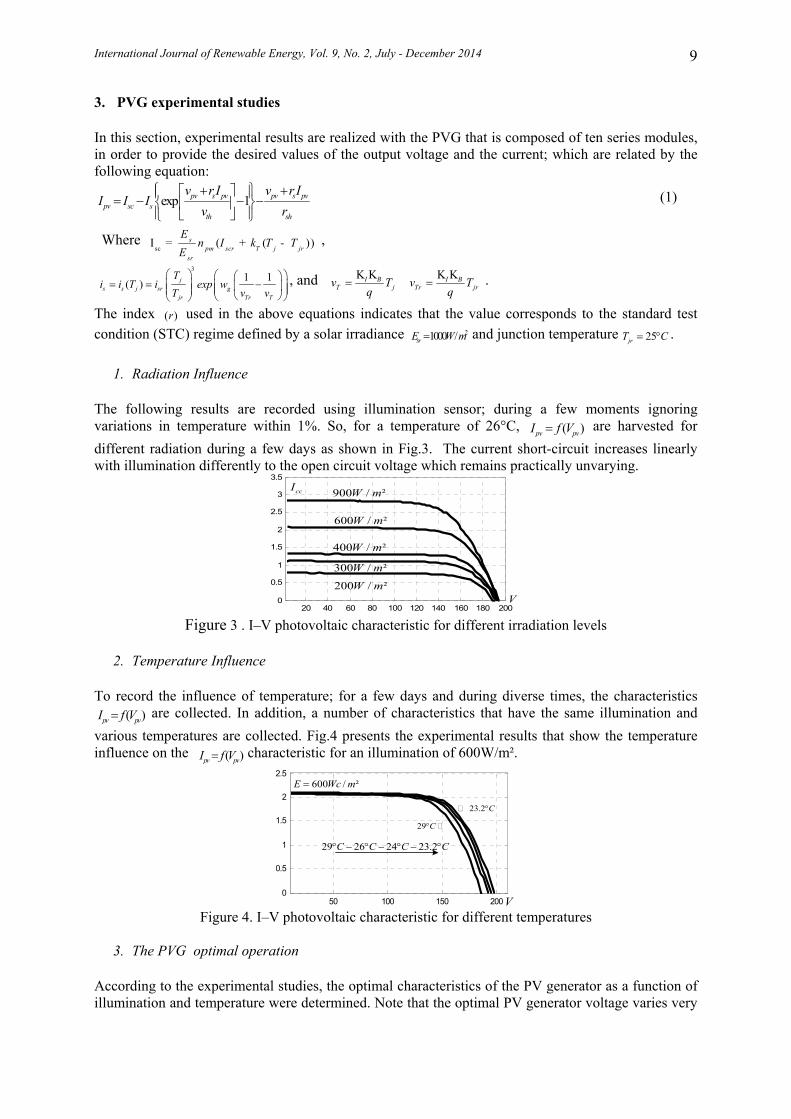
To record the influence of temperature; for a few days and during diverse times, the characteristics are collected. In addition, a number of characteristics that have the same illumination and
various temperatures are collected. Fig.4 presents the experimental results that show the temperature influence on the characteristic for an illumination of 600W/m².
50 100 150 2000
0.5
1
1.5
2
2.5
600 / ²E Wc m=
29 26 24 23.2C C C C° − ° − ° − °
29 C°
23.2 C°
V Figure 4. I–V photovoltaic characteristic for different temperatures
3. The PVG optimal operation
According to the experimental studies, the optimal characteristics of the PV generator as a function of illumination and temperature were determined. Note that the optimal PV generator voltage varies very
exp 1pv s pv pv s pvspv c s
th sh
v r I v r II II
v r⎧ ⎫+ +⎡ ⎤⎪ ⎪− − −⎨ ⎬⎢ ⎥⎪ ⎪⎣ ⎦⎩ ⎭
=
scI ( ( ))spm scr T j jr
sr
En I k T T
E+ -=
31 1( ) j
s s j sr gjr Tr T
Ti i T i exp w
T v v⎛ ⎞ ⎛ ⎞⎛ ⎞
= = −⎜ ⎟ ⎜ ⎟⎜ ⎟⎜ ⎟⎜ ⎟ ⎝ ⎠⎝ ⎠⎝ ⎠
I B I BT j Tr jrv T v T
q q= =
K K K K
( )r21000 /srE W m= 25jrT C= °
( )pv pvI f V=
( )pv pvI f V=
( )pv pvI f V=

International Journal of Renewable Energy, Vol. 9, No. 2, July - December 2014
10
little with the illumination. Figure 5.a represents P-V characteristic for different illuminations at a fixed temperature (26°C). Fig.5.b gives evolution of for
variable temperatures at fixed illumination that equal to 600W/m².
0 50 100 150 200
50
100
150
200
250
300
350
400
T=26°C
V
( / ²)E W m
0 50 100 150 2000
50
100
150
200
250
300
29 C°
23.2 C°
24 C°
V
( )P W
Figure 5-a. P–V characteristic for different Figure 5-b. P–V characteristic for different temperatures irradiation levels
The choice of a reference voltage of 148V is used to extract the maximum power with a precision of 2%. Similarly, the average voltage is 148V for different temperatures with a precision of 1.3%. Maximum power is known to an accuracy of 2.2%. The results of these experiments show that the voltage which allows the operation at the optimal operating point (MPPT) is around to 148V. This voltage is selected as a reference voltage for the MPPT constant voltage control.
4. Energy Control
The electrical current provided by the solar modules as output of solar PV systems depends on solar radiation on its surface and its temperature. Whence irregularities in the energy supply that cannot be compatible with the power requirements. It is often necessary to control the supplied electricity. It is also sometimes necessary to change the nature of power for some applications (converting direct current into alternating current by an inverter). So, the insertion of a static converter is more than necessary. In what follows, we will detail the part of the operation of DC/DC converter and the MPPT algorithms used, to ensure the proper control.
1. DC/DC converter To overcome the undesired effects on the power output of PV and extract its maximum, it is recommended to insert a DC/DC converter between the PV generator and the load, which can control the MPP [9]. The converter consists of a circuit topology and a control, where there will be an algorithm for MPP trackers. The role of MPPT is to ensure the operation of the PV generator at its optimum. The MPP trackers can be designed based on the boost or buck topologies converters. The buck converter is generally used to reduce the output voltage and the boost converter is used to achieve higher output voltages. In our application we need to increase the voltage. So the average value of the output voltage of the boost converter can be expressed in terms of the average value of the voltage input
by the following relation.
Vdc = pvV
α−11
(2)
Idc = (1-α) Ipv is a duty cycle ratio determined by the conceived MPPT algorithm.
2. Constant voltage MPPT algorithm
In what follows, we present the constant voltage control algorithm as shown in Fig.6. The different blocks of the PVG output voltage regulation to its optimum (148V) are presented in Fig. 7 and are described as follow: • An inverter amplifier which changes the sign of the reference voltage.
(200,300,400,600 900 / ²)and W m ( )pv pvP f V=
dcV
pvV
α

International Journal of Renewable Energy, Vol. 9, No. 2, July - December 2014
11
• An adder converter with gain k, which calculates the error between the actual terminal voltage of the solar panel and a reference voltage, and amplifies the error. Indeed, if the voltage across the panel tends to increase, the output of the amplifier operates in the opposite direction to reduce this effect and vice versa. • An integrator RC with time constant τ, which provides at its output a variable slowly voltage; • A comparator that compares the slowly variable voltage (RC integrator) to a triangular signal for generating a modulated pulse width. This signal is supplied to the gate of the MOSFET through a MOS driver.
refV
Triangular generator
Boostconverter
−+
−+ −
+
IntegrtorRC
Driver
Inverter
dc
dc
VI
pv
pv
V
I
Figure 6. Block diagram of the constant voltage Figure 7. Circuit of the MPPT controller MPPT control
The tests results are carried out with the MPPT control realized in the research laboratory for two cases; we present the error ( ), the triangular signal ( ) and the control signal ( ), note that
.• If thus ; as seen in Fig.8 we have to carry , which need to increase consequently increases according to the following relationship:
to
oscillate about the optimum operation. • If , ; as shown in Fig.9; then we have to carry , this allows to decrease and consequently decreases .
tV
cV
ε
cV
tV
ε
3. Inc-Cond MPPT algorithm
The track of the MPP was performed with another technique giving rise to the Incremental Conductance algorithm [11] which is presented by the flowchart in Fig.10. The GPV output voltage was continuously adjusted according to its optimum voltage value. The basic principle of this algorithm is to calculate the derivative of the power extracted of the installation. The main operation done by this algorithm is to compare the ratio and according to the comparison result ,
the reference signal will be adjusted in order to move the output voltage towards the MPP voltage, as it is shown in Fig.11. The derivative is equal to zero at the maximum power point, positive on its left and negative on its right [12]. Since The PVG power is described by , his derivative as function of the voltage is then defined by the following equations:
(3)
(4)
Kε−TV CV
ref pvV Vε = − ref pvV V< 0 – 0and kε ε> < pv refV to V
pvI α1
IdcIpv α=
−
ref pvV V> 0 – 0and kε ε< > pv refV to V
pvI α
/ /pv pv pv pvdI dV to I V
PV pv pvP V I=
( )pv pv pv pvpv pv
pv pv pv
dP d V I dIV I
dV dV dV= = +
0pv pv pv
pv pv pv
dP I dIif then
dV V dV> > -
Figure 8. Constant voltage MPPT control results for negative error
Figure 9. Constant voltage MPPT control results for positive error

International Journal of Renewable Energy, Vol. 9, No. 2, July - December 2014
12
So the operating point is on the left of the maximum power point.
(5)
Then the operating point is at the point of maximum power.
(6)
So the operating point is on the right of the maximum power point.
( ), ( )pv pvLoad V t I t
( ) ( )
( ) ( )pv pv pv
pv pv pv
I I t I t t
V V t V t t
Δ = − −Δ
Δ = − −Δ
0pvVΔ =yes
nopv pv
pv pv
I I
V V
Δ= −
Δ
yes0pvIΔ =
yes
no nopv pv
pv pv
I I
V V
Δ> −
Δ 0pvIΔ >
( ) ( )
( ) ( )pv pv
pv pv
I t t I t
V t t V t
− Δ =
− Δ =
yes yes
no no
Figure 10. Inc-Cond MPPT algorithm flowchart.
50 100 150 200
50
100
150
200
250
300
350
0pv
pv
dPdV
>0pv
pv
dPdV
<
0pv
pv
dPMPP
dV=
V Figure 11. Behavior of INC MPPT algorithm in thee-level operation
5. Moto-pump fed by a GPV The induction motor is fed from a voltage source DC/AC inverter (VSI) supplied by a PV generator with MPP Tracker. The VSI is controlled according to the well known Space Vector Pulse Width Modulation (SVPWM) technique. The magnitude of induction machine voltage is expressed by the equation below where is the voltage ratio and is duty ratio adjusted by the MPPT control.
(7)
Where
The reference voltage modulus must remain inside the circle circumscribed in the hexagon of active voltage vectors of the inverter, which leads to the following condition.
(8)
0pv pv pv
pv pv pv
dP I dIif then
dV V dV= = -
0pv pv pv
pv pv pv
dP I dIif then
dV V dV< < -
r a
1s dc pv pvV V V Vrr da
= = =-
2 ref
dc
VV
ρ =
2dc
refV
V ≤
International Journal of Renewable Energy, Vol. 9, No. 2, July - December 2014
13
The study of the induction motor in a steady state is usually performed in the case when it is powered by a sinusoidal alternating balanced three-phase voltage. The supply voltage is given by the following relationship:
(9) It should be noted here that the law is reduced to a constant flux operation. To keep the flux constant at its nominal value, generally, the stator voltage must be adjusted in proportion to the supply frequency. This is the simplest approach to control the speed of induction motors, called Constant Volts / Hertz method. In addition to the electrical quantities treatment in the selected reference mark, the following mechanical model is taken into account. The variables and are respectively the electromagnetic and the mechanical torques. (10)
Where At the steady state, electromagnetic torque equilibrates the mechanical torque of the load coupled to the shaft of the motor. is linked to rotor speed .For simulation tests, the following polynomial function will be used.
(11) In our case is the hydrodynamic load torque of the centrifugal pump. The centrifugal pump is also described by an H (Q) characteristic given by: (12) In our case the constant coefficients of equations 11 and 12 are determined from experimental tests.
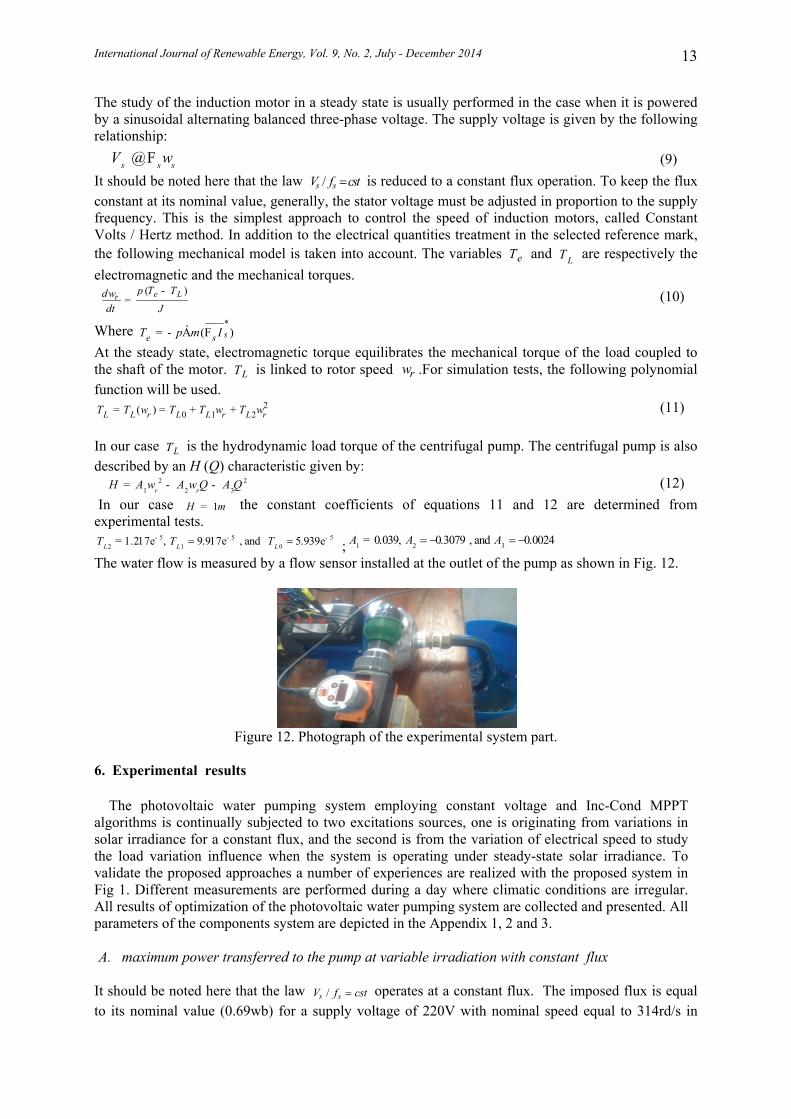
; The water flow is measured by a flow sensor installed at the outlet of the pump as shown in Fig. 12.
Figure 12. Photograph of the experimental system part.
6. Experimental results
The photovoltaic water pumping system employing constant voltage and Inc-Cond MPPT algorithms is continually subjected to two excitations sources, one is originating from variations in solar irradiance for a constant flux, and the second is from the variation of electrical speed to study the load variation influence when the system is operating under steady-state solar irradiance. To validate the proposed approaches a number of experiences are realized with the proposed system in Fig 1. Different measurements are performed during a day where climatic conditions are irregular. All results of optimization of the photovoltaic water pumping system are collected and presented. All parameters of the components system are depicted in the Appendix 1, 2 and 3. A. maximum power transferred to the pump at variable irradiation with constant flux
It should be noted here that the law operates at a constant flux. The imposed flux is equal to its nominal value (0.69wb) for a supply voltage of 220V with nominal speed equal to 314rd/s in
s s sV w@F/s sV f cst=
eT LT
e Lr p T Tddt Jw -
=( )
*( )se sT p m I= - Á F
LT rw
20 1 2( )L L r L L r L rT T T T Tw w w= = + +
LT
r rH A A Q A Qw w2 21 2 3= - -
1H m=
and 1.217 , = 9.917 , = 5.939 5 5 52 1 0e e eL L LT T T- - -= and 0.039, = −0.3079 , = −0.0024 1 2 3A A A=
/s sV f cst=
International Journal of Renewable Energy, Vol. 9, No. 2, July - December 2014
14
order that the moto-pump can operate. To visualize the behavior of the overall system in real conditions, in what follows, the answers with the implementation of both approaches mentioned above will be presented.
1. Constant voltage MPPT control results
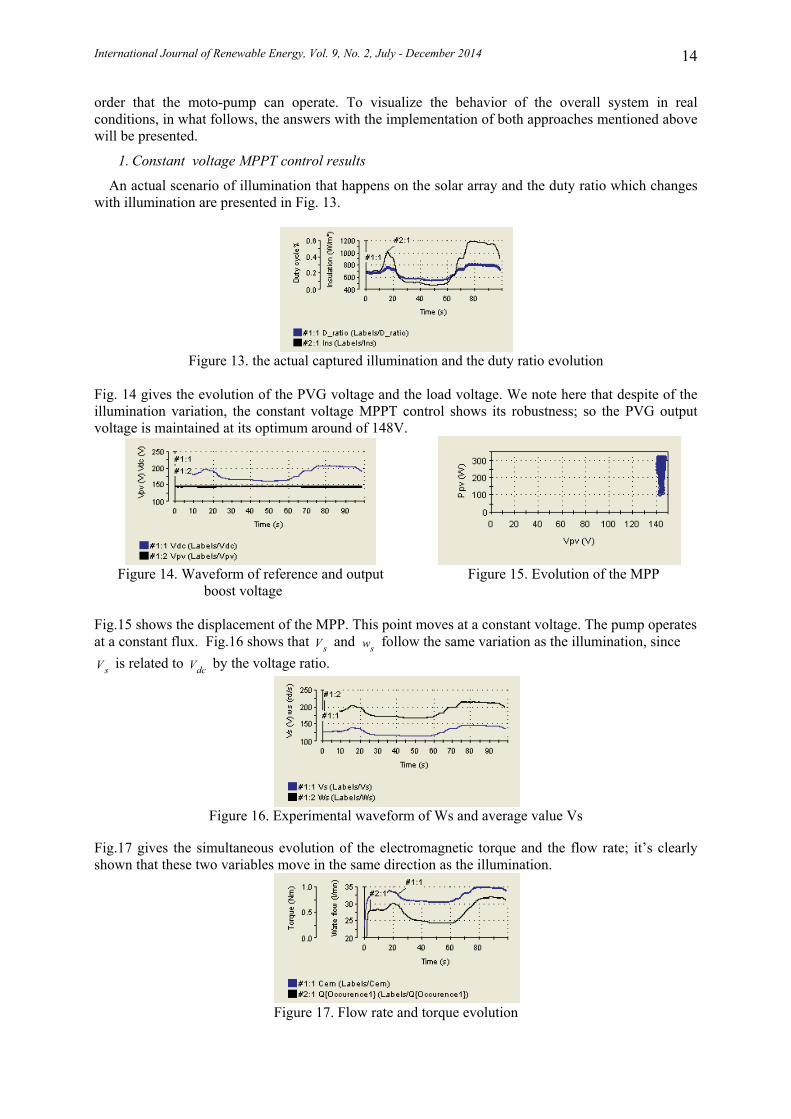
An actual scenario of illumination that happens on the solar array and the duty ratio which changes with illumination are presented in Fig. 13.
Figure 13. the actual captured illumination and the duty ratio evolution
Fig. 14 gives the evolution of the PVG voltage and the load voltage. We note here that despite of the illumination variation, the constant voltage MPPT control shows its robustness; so the PVG output voltage is maintained at its optimum around of 148V.
Figure 14. Waveform of reference and output Figure 15. Evolution of the MPP boost voltage
Fig.15 shows the displacement of the MPP. This point moves at a constant voltage. The pump operates at a constant flux. Fig.16 shows that and follow the same variation as the illumination, since
is related to by the voltage ratio.
Figure 16. Experimental waveform of Ws and average value Vs
Fig.17 gives the simultaneous evolution of the electromagnetic torque and the flow rate; it’s clearly shown that these two variables move in the same direction as the illumination.
Figure 17. Flow rate and torque evolution
sV sw
sV dcV
International Journal of Renewable Energy, Vol. 9, No. 2, July - December 2014
15
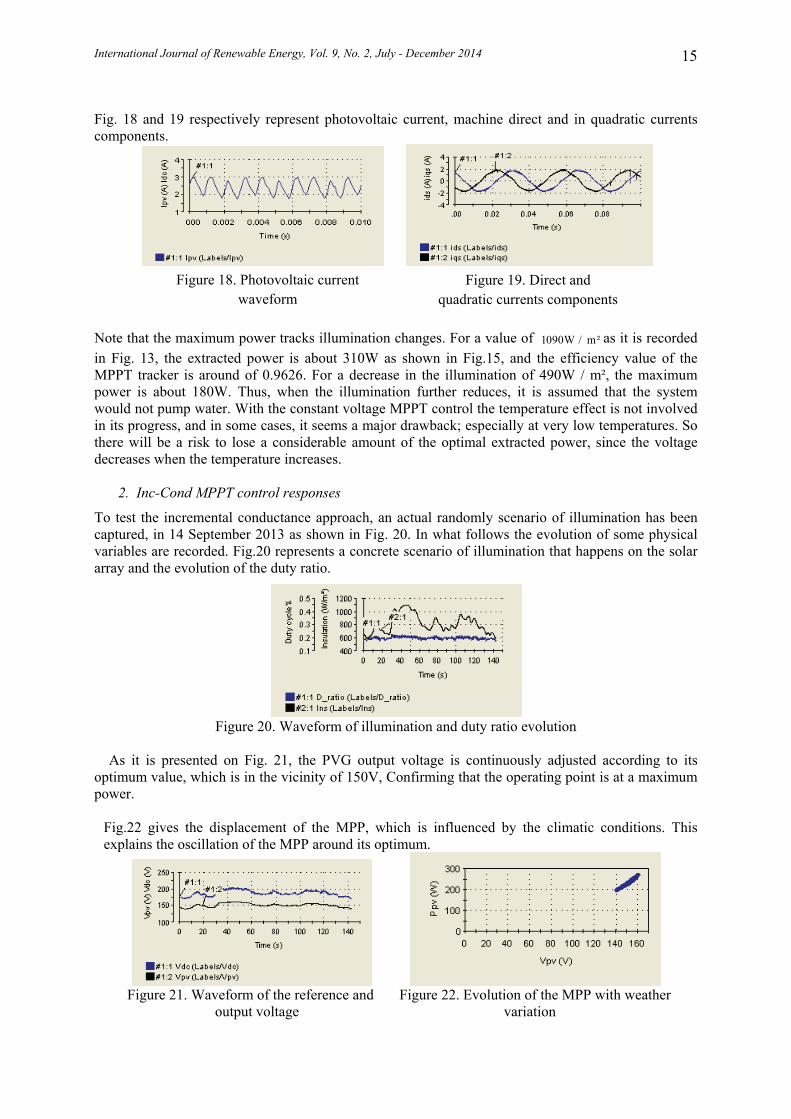
Fig. 18 and 19 respectively represent photovoltaic current, machine direct and in quadratic currents components.
Note that the maximum power tracks illumination changes. For a value of as it is recorded in Fig. 13, the extracted power is about 310W as shown in Fig.15, and the efficiency value of the MPPT tracker is around of 0.9626. For a decrease in the illumination of 490W / m², the maximum power is about 180W. Thus, when the illumination further reduces, it is assumed that the system would not pump water. With the constant voltage MPPT control the temperature effect is not involved in its progress, and in some cases, it seems a major drawback; especially at very low temperatures. So there will be a risk to lose a considerable amount of the optimal extracted power, since the voltage decreases when the temperature increases.
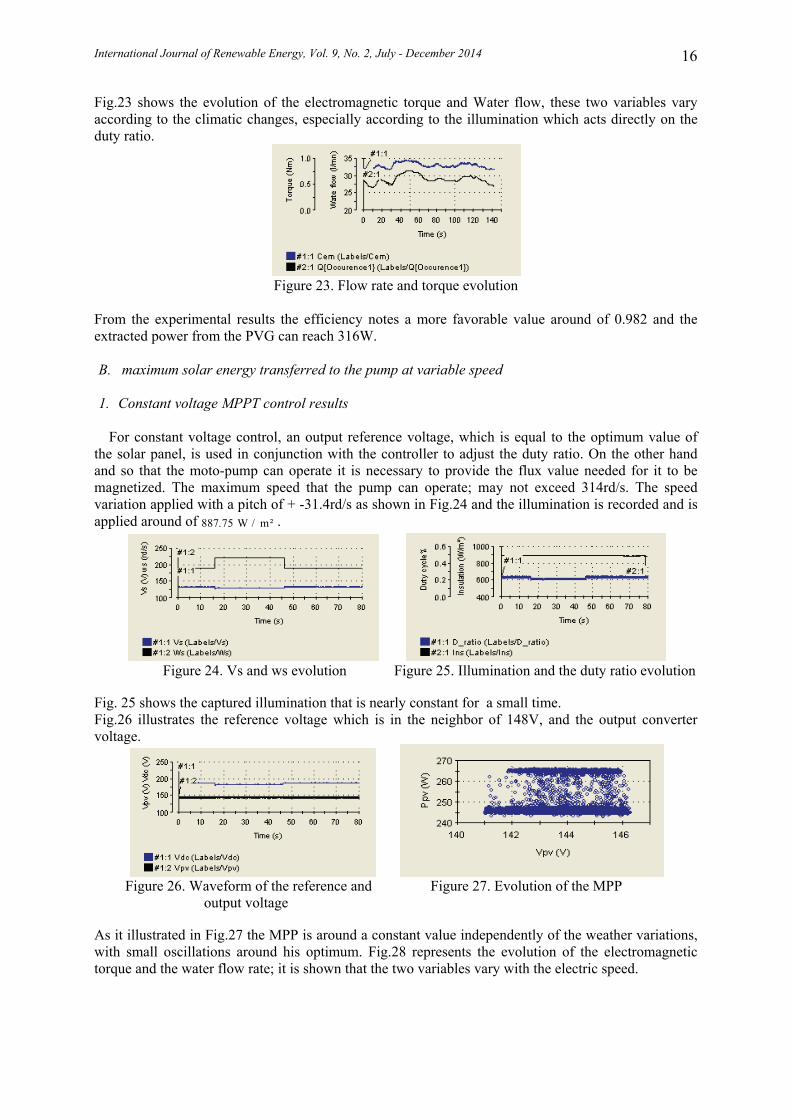
2. Inc-Cond MPPT control responses
To test the incremental conductance approach, an actual randomly scenario of illumination has been captured, in 14 September 2013 as shown in Fig. 20. In what follows the evolution of some physical variables are recorded. Fig.20 represents a concrete scenario of illumination that happens on the solar array and the evolution of the duty ratio.
Figure 20. Waveform of illumination and duty ratio evolution
As it is presented on Fig. 21, the PVG output voltage is continuously adjusted according to its optimum value, which is in the vicinity of 150V, Confirming that the operating point is at a maximum power.
Fig.22 gives the displacement of the MPP, which is influenced by the climatic conditions. This explains the oscillation of the MPP around its optimum.
Figure 21. Waveform of the reference and Figure 22. Evolution of the MPP with weather output voltage variation
1090W / m²
Figure 18. Photovoltaic current waveform
Figure 19. Direct and quadratic currents components
International Journal of Renewable Energy, Vol. 9, No. 2, July - December 2014
16
Fig.23 shows the evolution of the electromagnetic torque and Water flow, these two variables vary according to the climatic changes, especially according to the illumination which acts directly on the duty ratio.
Figure 23. Flow rate and torque evolution
From the experimental results the efficiency notes a more favorable value around of 0.982 and the extracted power from the PVG can reach 316W.
B. maximum solar energy transferred to the pump at variable speed
1. Constant voltage MPPT control results
For constant voltage control, an output reference voltage, which is equal to the optimum value of the solar panel, is used in conjunction with the controller to adjust the duty ratio. On the other hand and so that the moto-pump can operate it is necessary to provide the flux value needed for it to be magnetized. The maximum speed that the pump can operate; may not exceed 314rd/s. The speed variation applied with a pitch of + -31.4rd/s as shown in Fig.24 and the illumination is recorded and is applied around of .
Figure 24. Vs and ws evolution Figure 25. Illumination and the duty ratio evolution Fig. 25 shows the captured illumination that is nearly constant for a small time. Fig.26 illustrates the reference voltage which is in the neighbor of 148V, and the output converter voltage.
Figure 26. Waveform of the reference and Figure 27. Evolution of the MPP output voltage As it illustrated in Fig.27 the MPP is around a constant value independently of the weather variations, with small oscillations around his optimum. Fig.28 represents the evolution of the electromagnetic torque and the water flow rate; it is shown that the two variables vary with the electric speed.
887.75 W / m²

International Journal of Renewable Energy, Vol. 9, No. 2, July - December 2014
17
Figure 28. Flow rate and torque evolution
2. Inc-Cond MPPT control results The illumination is recorded for a brief moment to guarantee that it will be constant, around of
. All quantities are registered in the 50 s. The scenario of the electric speed is chosen
with a step variation of 31.4rd/s as shown in Fig.29.
Figure 29. ws and average stator voltage evolution Figure 30. Illumination and duty ratio evolution
Fig.30 shows the captured constant illumination and the duty ratio evolution which changes with the imposed speed. As shown in Fig.31 the photovoltaic voltage can attain 150V with the Inc-Cond MPPT control. Moreover, the output boost converter voltage evolves with the duty ratio.
Figure 31. PVG and load voltage waveform Figure 32. Maximum power point evolution
Fig.32 shows that the MPP evolves between 140V and 155V. Fig.33 represents the evolution of the electromagnetic torque and the water flow rate, which vary with the speed.
Figure 33. Flow rate and torque evolution
To investigate the robustness of the two algorithms with respect to various random and real environmental conditions, we have defined an original set of tests that are carried out by recording some results from the photovoltaic station during the day independently from the climatic variations and from being connected to the water pumping system. With the both MPPT algorithms presented in this work, we note that the functioning point always follows, also, the performance of the boost
935.724 W/ m²

International Journal of Renewable Energy, Vol. 9, No. 2, July - December 2014
18
converter that can reach a good efficiency nearly 0.98% for Inc-Cond algorithm , and around of 0.96 for constant voltage algorithm. In the second part, the MPPT trackers conceived in an experimental prototype and verified with the photovoltaic system. The Inc-Cond control gives, for lighting captured in the neighbor of 935.724W/m², a constant voltage which attains 154.725V. The Inc-Cond MPPT presents a better efficiency for rapid changes and a better stability when the MPP is achieved. However, the constant voltage MPPT is used in practice due to its simplicity and in fact the temperature variation has no influence on optimum voltage. The originality and the specificity of the presented results obtain during this research reside in the fact that a vital implementation is used, the water pumping, that has become an important and economically viable photovoltaic application. It is a particularly valuable application from an educational perspective due to the challenges associated with designing a system that involves direct interfacing of photovoltaic panels to a load without the inclusion of energy storage. 7. Conclusion
In this paper, a stand-alone PVG system for water pumping application is successfully implemented. Inc-Cond and Constant Voltage Control algorithms have been used for maximum power point tracking. The results validate that MPPT can significantly increase the efficiency of energy production from PVG and the performance of the PV water pumping system. The maximum power point will be reached by any irradiation levels and for any temperatures or variations of them or other variations. The experiment results prove positively that Constant Voltage Control and the Inc-Cond MPPTs reach the intended maximum power point. Nevertheless, the approach and the stability of the MPP are not achieved within the same manner. References [1] Bimal K. Bose: Global Warming Energy: Environmental Pollution and the Impact of Power
Electronics, IEEE Industrial Electronics Magazine, pp.1-17, March 2010. [2] C.Iskander Yousif: Recent Developments of Applying Solar Photovoltaic Technologies in Malta,
Proceedings of the Enemalta 25th Anniversary Conference on Energy Efficiency Mediterranean Conference Centre, 18th-19th October, Valetta, Malta, 2002.
[3] Messaouda AZZOUZI: Comparaison between MPPT P&O and MPPT Fuzzy Controls in Optimizing the Photovoltaic Generator (IJACSA) International Journal of Advanced Computer Science and Applications, Vol. 3, No. 12, 2012
[4] Adedamola Omole: Analysis, Modeling and Simulation of Optimal Power Tracking of Multiple-Modules of Paralleled Solar Cell Systems, Master of Science Thesis, the Florida State University College of Engineering, 2006.
[5] Vaigunda moorthi.M and Ramesh.R, Experimental Investigation of Chaos in Input Regulated Solar PV Powered International Journal of Computer Applications (0975 – 8887) Volume 43– No.10, April 2012.
[6] Christopher A. Otieno, George N. Nyakoe, Cyrus W. Wekesa, A Neural Fuzzy Based Maximum Power Point Tracker for a Photovoltaic System, IEEE AFRICON, September 23-25, pp.1-6, 2009.
[7] H. Knopf: Analysis, Simulation and Evaluation of Maximum Power Point Tracking (MPPT) Methods for a Solar Powered Vehicle, Thesis, Portland State University, 1999.
[8] Rebei Najet, Ben Ghanem Belgacem, Hasnaoui Othman: Modeling and Control of Photovoltaic Energy Conversion Connected to the Grid, Front. Energy Power Eng. China DOI 10.1007/s11708-012-0169-y, Mars 2012.
[9] Z.M. Salameh, F. Dagher and W.A. Lynch: Step-Down Maximum Power Point Tracker for Photovoltaic Systems, Solar Energy, Vol. 46, N° 4, pp. 279 - 282, 1991.
International Journal of Renewable Energy, Vol. 9, No. 2, July - December 2014
19
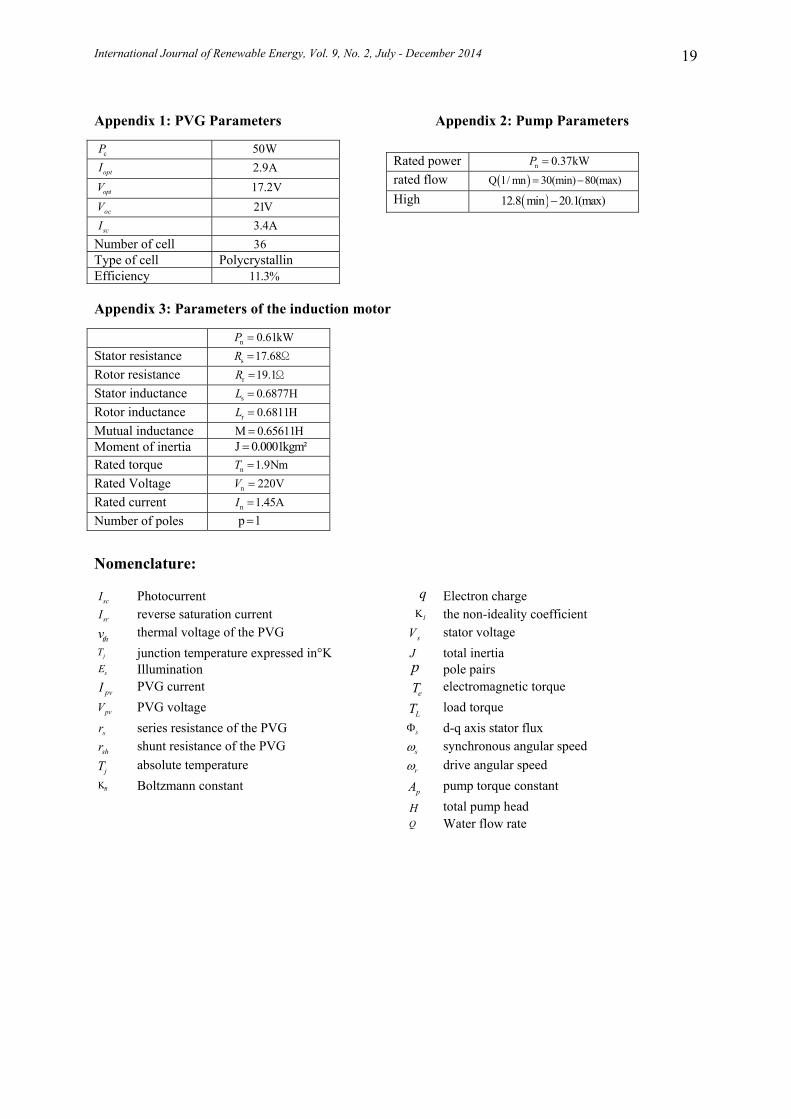
Appendix 1: PVG Parameters Appendix 2: Pump Parameters
Appendix 3: Parameters of the induction motor
Nomenclature:
Photocurrent Electron charge reverse saturation current the non-ideality coefficient thermal voltage of the PVG stator voltage junction temperature expressed in°K total inertia Illumination pole pairs
PVG current electromagnetic torque PVG voltage load torque
series resistance of the PVG d-q axis stator flux shunt resistance of the PVG synchronous angular speed absolute temperature drive angular speed Boltzmann constant pump torque constant
total pump head Water flow rate
scI qsrI IK
thv sV
jT JsE ppvI eTpvV
LTsr sΦ
shr sω
jT rω
BKpA
HQ
Number of cell Type of cell Polycrystallin Efficiency
Rated power rated flow
High
Stator resistance Rotor resistance Stator inductance Rotor inductance Mutual inductance Moment of inertia Rated torque Rated Voltage Rated current Number of poles
cP 50W
optI 2.9A
optV 17.2V
ocV 21V
scI 3.4A 36
11.3%
n 0. kW 37P =
( )Q l / mn 30(min) 80 ) (max= −
( )12.8 min 20.1( max)−
n 0. kW 61P =
s 17 68 .R = Ω
r 19.1R = Ω
s 0.6877HL =
r 0.6811HL =
M 0.65611H=J 0.0001kgm²=
n 1.9NmT =
n 220VV =
n 1.45AI =
p 1=
Related Documents


