1 Implementation of Lean Six Sigma (LSS) Techniques in Small and Medium Enterprises (SMEs) to Enhance Productivity Abdulrakeeb A. Ghaleb Ph.D. student in Mechanical Engineering Department of Mechanical Engineering, Faculty of Engineering Assiut University, Egypt Mahmoud A. El-Sharief Associate Professor in Mechanical Engineering Department of Mechanical Engineering, Faculty of Engineering Assiut University, Egypt Mohamed. G. El-Sebaie Professor in Mechanical Engineering Department of Mechanical Engineering, Faculty of Engineering Assiut University, Egypt Abstract In today’s world, business has become more competitive. All industries and organizations have to perform well in order to survive and be profitable. The lean six sigma (LSS) methodology is being applied extensively to tackle many quality related issues in many processes of today’s industries. Various companies have benefited greatly from the adoption of six sigma and lean engineering concepts since their initiation. A paper cement bags is a packaging sack made of paper high quality and usually craft virgin fiber, which usually consists of several layers to provide strength, with high elasticity and high tear resistance, and are designed for packaging products with high demands for strength and durability. This study is interested in implementing the lean six sigma (LSS) methodology in SMEs. The LSS proposed in this study is not only study LSS framework but also focus of LSS implementation in SMEs. The contribution of this research is using LSS methodologies to reduce waste of time, reduce of defects, and increase the level of sigma. The obtained results after implementation LSS methodology in the application of the cement bags industry indicate that the production rate could be increased about 4.25 % and also could be in save of around $ 8,952 from reduction of waste time and $ 12,730.61 from defects reduction; the total is $ 21,682.61 per year. In addition, the preparation time could be reduced by about 4.57 %, increase the OEE by 20%, and increase the level of sigma from 3.91 to become 4.00. Keywords: Lean, Six sigma, Lean six sigma (LSS), DMAIC, SMEs, OEE, cement bags. 1. Introduction Companies look for ways to improve their production and manufacturing processes in order to remain competitive in the market to reduce production cost, enhance productivity and improve product quality. Therefore, companies must utilize all the available resources efficiently in order to cater their customers with high quality products at a low price. The lean six sigma (LSS) emerging with the combination of lean manufacturing processes in the early 1960s and the six sigma generated by Motorola is the last evolution step in the manufacturing history. Both applications provide to achieve operational effectiveness. This means to apply changes adding value, to process right at the first time and to act quickly and efficiently. Lean manufacturing focuses on eliminating loss in process and reducing the complexity [1][2]. LSS aims to develop solutions by using the minimum amount of resources (human, material and capital) and to make the products reach customers on time. Six sigma provides quality philosophy and is a statistical tool to monitor process performance. It aims to reduce the variability in the process and to

Welcome message from author
This document is posted to help you gain knowledge. Please leave a comment to let me know what you think about it! Share it to your friends and learn new things together.
Transcript
1
Implementation of Lean Six Sigma (LSS) Techniques in Small and
Medium Enterprises (SMEs) to Enhance Productivity
Abdulrakeeb A. Ghaleb Ph.D. student in Mechanical Engineering
Department of Mechanical Engineering, Faculty of
Engineering Assiut University, Egypt
Mahmoud A. El-Sharief Associate Professor in Mechanical Engineering
Department of Mechanical Engineering, Faculty of
Engineering Assiut University, Egypt
Mohamed. G. El-Sebaie Professor in Mechanical Engineering Department of Mechanical Engineering, Faculty of Engineering Assiut
University, Egypt
Abstract
In today’s world, business has become more competitive. All industries and organizations have
to perform well in order to survive and be profitable.
The lean six sigma (LSS) methodology is being applied extensively to tackle many quality
related issues in many processes of today’s industries. Various companies have benefited greatly from
the adoption of six sigma and lean engineering concepts since their initiation.
A paper cement bags is a packaging sack made of paper high quality and usually craft virgin
fiber, which usually consists of several layers to provide strength, with high elasticity and high tear
resistance, and are designed for packaging products with high demands for strength and durability.
This study is interested in implementing the lean six sigma (LSS) methodology in SMEs. The
LSS proposed in this study is not only study LSS framework but also focus of LSS implementation in
SMEs. The contribution of this research is using LSS methodologies to reduce waste of time, reduce of
defects, and increase the level of sigma.
The obtained results after implementation LSS methodology in the application of the cement
bags industry indicate that the production rate could be increased about 4.25 % and also could be in save
of around $ 8,952 from reduction of waste time and $ 12,730.61 from defects reduction; the total is $
21,682.61 per year. In addition, the preparation time could be reduced by about 4.57 %, increase the
OEE by 20%, and increase the level of sigma from 3.91 to become 4.00.
Keywords: Lean, Six sigma, Lean six sigma (LSS), DMAIC, SMEs, OEE, cement bags.
1. Introduction
Companies look for ways to improve their production and manufacturing processes in order to
remain competitive in the market to reduce production cost, enhance productivity and improve product
quality. Therefore, companies must utilize all the available resources efficiently in order to cater their
customers with high quality products at a low price.
The lean six sigma (LSS) emerging with the combination of lean manufacturing processes in the
early 1960s and the six sigma generated by Motorola is the last evolution step in the manufacturing
history. Both applications provide to achieve operational effectiveness. This means to apply changes
adding value, to process right at the first time and to act quickly and efficiently. Lean manufacturing
focuses on eliminating loss in process and reducing the complexity [1][2].
LSS aims to develop solutions by using the minimum amount of resources (human, material and
capital) and to make the products reach customers on time. Six sigma provides quality philosophy and
is a statistical tool to monitor process performance. It aims to reduce the variability in the process and to
2
eliminate defects. Lean manufacturing and Six Sigma work together successfully. While detecting lean
tools, the problems in flow and worthless activities, six sigma increases the proficiency of each step
adding value and forms a second entry in lean manufacturing techniques. Especially in non-production
processes, both merging six sigma with lean tools and correctly differentiating the application, tools and
educational content for the service sector and support processes are critical [3][4].
The integration of both (LSS) technique will facilitate the achievement of zero defect
manufacturing in organizations complemented by the elimination of non-value added activities, which
leads to greater results than either system can achieve alone [3][5].
This study focuses in implementing the lean six sigma (LSS) in SMEs. The LSS proposed in this
study is different from other LSS framework based on other initial studies in terms of the focus of LSS
implementation in SMEs only. This study contributes the application of LSS techniques in SMEs to
reduce time waste, defects and increasing the level of sigma.
2. Lean Six Sigma (LSS)
Lean six sigma (LSS) is an approach focused on improving quality, reducing variation and
eliminating waste in an organization. It is based on the concepts of combining two improvement
programs, six sigma and lean manufacturing, also known as lean enterprise. Six sigma is both a quality
management philosophy and a methodology that focuses on reducing variation, measuring defects and
improving the quality of products, processes, and services[1][6][7]
Table 1 presents the survey of lean six sigma LSS studies and presents the topic and the sector
of each research [8][4].
Table 1: Lean Six Sigma (LSS) studies in sectors and topics[9][10]
References Sector Topic
Furterer 2004 Service- financial Implementation - reduce the cycle time
Stephen 2004 Industry Implementation -reduced the defects
Chen et al. 2005 Industry-Automobile Improvement of manufacturer’s quality
Kumar et al. 2006 Industry- casting Reduce the defect occurring in the final
product
Cronemyr 2007 Industry (service)
Electronic Implemented to problem solving in Siemens
Ramamoorthy 2007 Industry- Aircraft Implementation - reduction the rework time
Koning 2007 Service – investment Implemented - reducing operational cost
Chandler 2007 Industry Improvements both time and money savings
Nuce et al. 2008 Service- pharmacy Implementation -waste reduction
Martell-rojas 2010 Service - Hospital Implementation -to be better services
Kellogg 2010 Service- health care Implemented -investigate the financial benefits
Alyamoor 2010 Industry- wear factory Implementation -reduced the costs of defects
Barnala 2011 Industry- Recycle
Implementation - optimizing process and
remove errors
Hale 2011 Industry-transformation Implementation- reduce waste
Atmaca et al. 2011 Industry- Dishwashers Increase profit
Patel 2011 Industry-Small packaging
Implemented -improve Lean Six Sigma
standards to meet USA
Basavaraj et al. 2011 Industry- steel Reduce variation and improve yield
Sabeeh et al. 2012 Industry- Medical Syringes Increase sigma level, reduce damaged product
Cournoyer et al. 2013 Service-environment Improve make decisions
Abdullah, 2013 Industry- drugs Implementation -reduced the defects
Mandahwi et al. 2012 Industry- printing Application LSS- increase effectiveness
Ren Jie et al. 2014 Industry- printing Implementation -reduced waste and variation

3
3. Lean Six Sigma (LSS) Framework
The LSS framework has five phases as shown in figure 1 with each phase providing a structural
guide towards root-cause identification of a problem, hence proposing and implementing cement bags
to eliminate the root cause through preparation time and reduce defects. It should be noted that this
framework is the technique that can be used in LSS adoption [11][12].
Figure 1: Lean Six Sigma implementation in SMEs
The LSS framework as shown in figure 1 is actually a simplification of the six sigma’s DMAIC
methodology with guided steps on utilizing certain lean tools in each phase. The framework utilizes data
driven and guided standard approach of the six sigma DMAIC methodology while utilizing lean tools in
each phase to determine improvement opportunities and further analyze the problem(s) [13-[14][15].
3.1. Phase 1: Define the problem
In this phase of a lean six sigma (LSS), the outlines of the cement bags industry case study
and its objectives must be clearly identified.
Cement bag manufacturing processes, and particularly the process studied in this paper, are
generally comprised of three stages namely: first stage includes five steps, raw material setup,
printing, glowing, tubing, and cutting. Second Stage includes five setup, feeding, opening, valve
installation, gluing, closing, and collection. Whereas third stage only temporary inventory to
drying the glue. These process steps are illustrated in Figure 2.
The SIPOC (suppliers, inputs, process, outputs, and customers) process map is one of the most
valuable tools. By using a standard SIPOC diagram, to understanding the flow of information,
supplier, input, process, output and costumer requirement of manufacturing system. Fig. 2 shows
the SIPOC diagram of cement bags manufacturing, the supplier craft roll paper, ink, and glue to
identify the flow processes to produce the cement bags.
Define:
data collection
VSM, SIPOC
Measure:Data analysis
process capability
Analyse:
Fish bone diagram
sigma level
Improve:implement solution
calculate (cost, profit)
Control:
control chart
sustainability plan

4
Figure 2: Manufacturing processes of cement bags
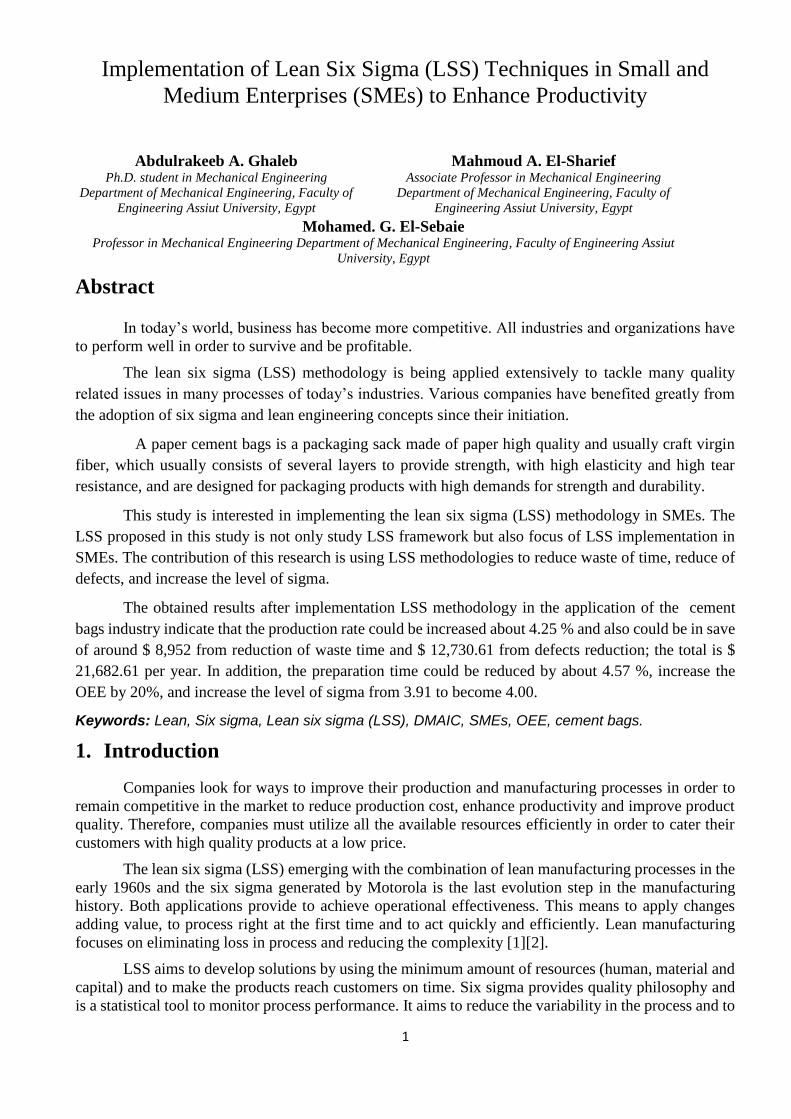
In order to have an insight into the current state of the preparation time, a current Value Stream
Mapping (VSM) is created which gives a closer look at the process so that opportunities for
improvement can be identified. Fig. 3 shows the VSM, which shows the movement of materials
through different manufacturing processes.
In addition, VSM in fig. 3 shows three preparations time before every stages. Preparation one
is 48 sec which include transportation raw craft paper by fork lift, remove cover and set roll in
machine while preparation two is 36 sec which include collect semi-product and handling to second
stage and the last preparation time is 147.8 sec, transportation final product to temporary inventory.
S I P O C Supplier Input Process Output Costumer
Craft
paper Craft paper
Handling raw paper from inventory
to production line and remove cover
of roll
Cement
bags
Cement
factory
Glue Glue First stage of production (printing,
tubing, cutting, separation)
Ink Ink Handling the product from first stage
to second stage
Human
resources
Second stage of production (opening,
valve installation, gluing, closing)
Ropes Collect product in second stage
Transport pallet to temporary
storage area
Inspection the product
The product drying process
Transport final product from
temporary storage area to inventory
Figure 3: SIPOC diagram of cement bags
5
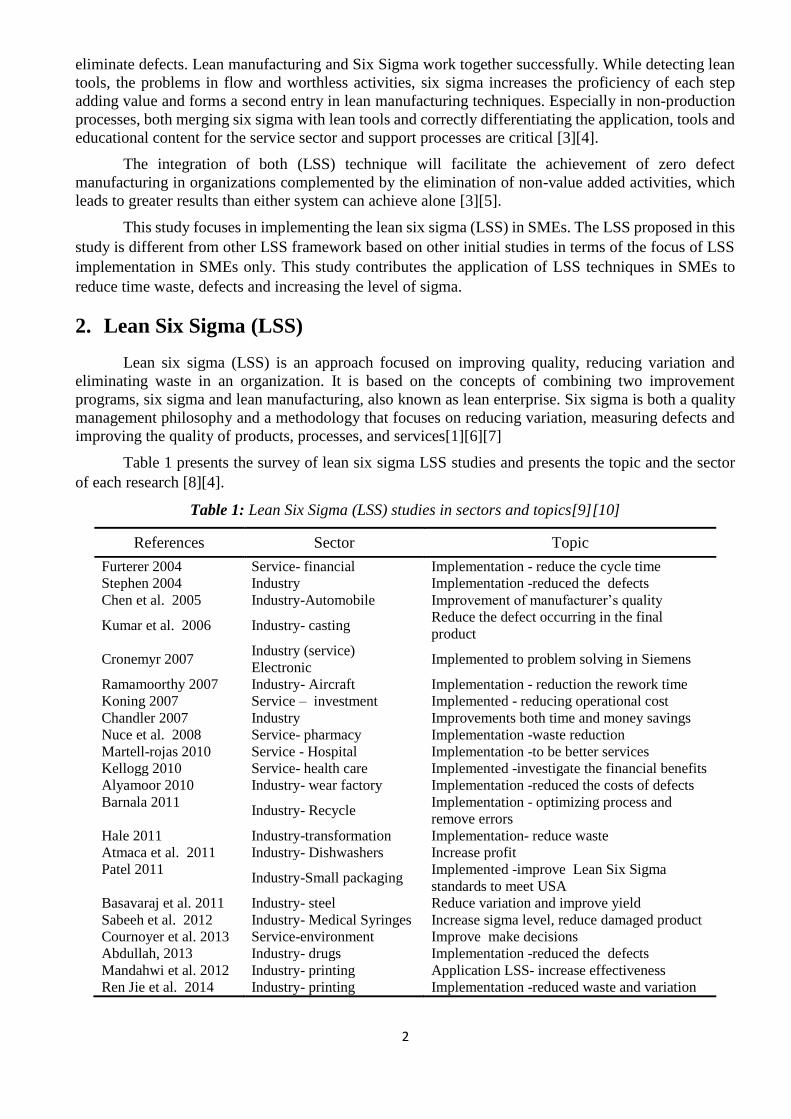
The preparation two between first stage and second stage cause to stop working about 45 min
at start of shift until the product in first stage for 45 min or more to produce two pallets. The
following table 2 shows the number of stops because of this case.
Table 2: Number of stops for second stage
Month No of stops Total shift ratio
January 13 45 28.89 %
February 11 49 22.49 %
Average 12 47 25.69 %
The preparation time before second stage (valve installation) will be analyzed further to
determine the root causes of its high setup time in the analyze phase.
3.2. Phase 2: Measure - Data Analysis
In this phase, the current performance of the process is measured to find the Key Process
Variables and identify the critical points in the cement bag length and width from the measurement
points that are regularly measured by the enterprise.
Target
impression
time time
Figure 4: Value Stream Mapping VSM of cement bags

6
Figure 5: Dimensions of cement bag
The dimensions for cement bag are length × width = 60 × 50 cm, valve width side and
width other side = 9.50 cm. The measurements the dates and evaluate using the statistics software
MINITAB 17. Graphical results of the length and width of cement bag measurement are presented
in figure 4 to figure 6.
As shown in fig. 6, the sample average value of cement bag length (59.997cm) is close to
USL = 60.20cm and LSL= 59.73cm. The total value of PPM in the right confirms with the probably
of 102.40. Since the CPK (1.43) value is quite over the target value (CPK > 1.33).
Figure 6: Process capability of cement bags Length
Fig. 7 shows the process capability of cement bags valve width that sample average value
(9.477cm) is close to USL = 9.70 cm and LSL= 9.30 cm. The total value of expected within PPM
approximately 561.20 out of a million will not meet the specification limits. Since the CPK (1.09) value
is quite lower the target value (CPK > 1.33).

7
Figure 7: Process capability of cement bags valve width
Fig. 8 shows the process capability of width other side, the sample average value (9.507cm) is
close to USL = 9.70cm and LSL= 9.30cm. The CPK (1.93) value is quite over the target value (CPK >
1.33), the total value of expected overall PPM approximately 2.33 out of a million will not meet the
specification limits, this process is fairly capable.
Figure 8: Process capability of cement bags other side width
The operator cannot repair the cement bags outside the control limits. These bags become
scrap after registration, but this problem does not have a classification of these defects and their
causes. Defects of the cement bags are given in table 3.
Table 3: The defects of cement bags
Month Production Defects Defect ratio
January 7792640 62040 0.796 %
February 8005980 64109 0.801 %
Average 7899310 63075 0.799 %
8
Evaluation of sigma level:
DPMO = 63075*106 / 7899310 = 7984.88 defect with defects ratio is 0.799 % and the
level of accuracy in processes is 99.2 % and the sigma level in this case is 3.91.
3.3. Phase 3: Analyze
Based on the observation in the production line of each preparation and setup, preparation
time before second stage, which include collect semi-product and handling to second stage. The
objective of this phase to determine the root causes of waste in preparation time and defects and
identify the significant process parameters causing the defect.
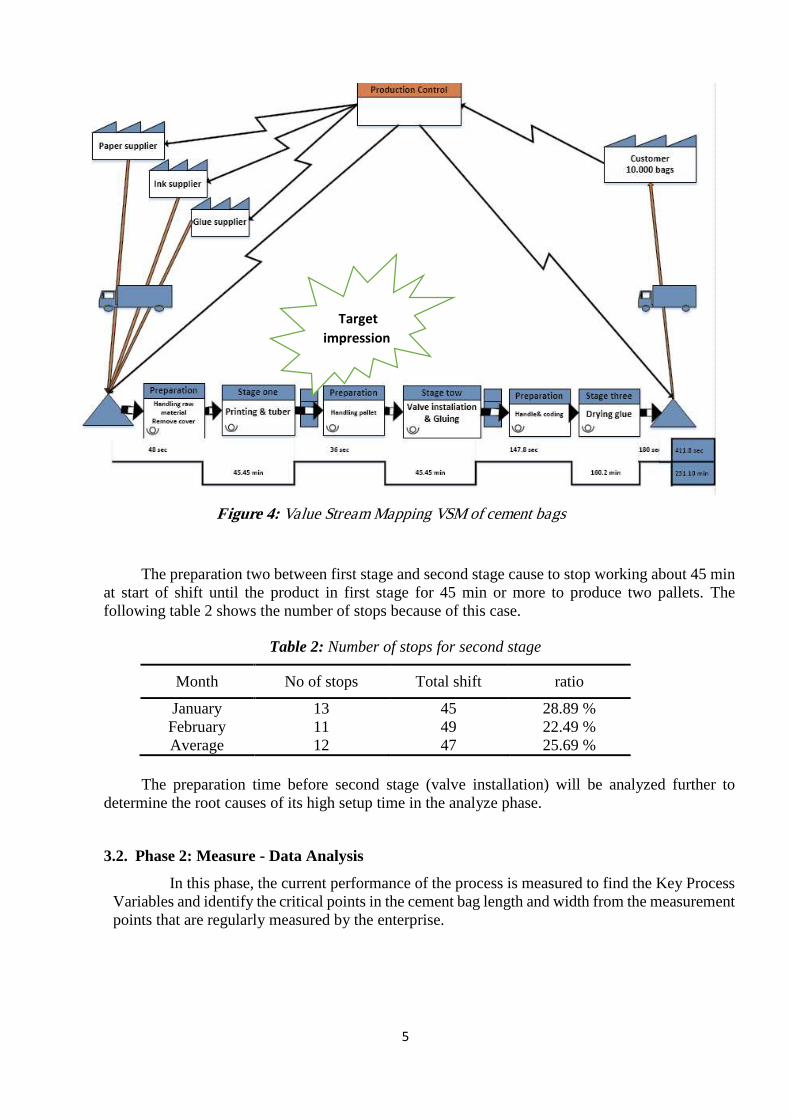
Fig. 9 shows the cause and effect diagram of preparation time problem, the focus of root-
cause analysis will carried out for setup of valve preparation. Fish bone diagram is developed
based on each setup to assist the findings of the cause of this problem. It is developed through
brainstorming and discussion. The main causes are:
1- Handling motion waste by worker
2- Collect the product in the pallet.
3- Insufficient automated system.
4- Majority of worker are semi-skilled.
Figure 9: Cause and effect diagram of preparation time problem
In the cause-effect diagram in fig. 10 defect sources stated are examined below in order
of process. The category of the defect source mentioned (Machine, methods, Man, materials) is
indicated in parentheses. It is developed through brainstorming and discussion. The main causes
are:
1. Only visual inspection followed.
2. No classification of defects and causes.
3. Not inspection after each stage separately.
4. Unsynchronized tuber and bottomar system.

9
Figure 10: Cause and effect diagram of defect in cement bags
Table 4 shows the main type of preparation time in the cement bags factory, the critical
factor in the current process that could be improved to minimize waste. The degree of importance
preparation two is very important because the production in second stage is stop working about 45
min at start of shift until the semi-product in first stage collect on two pallets, this is a problem at
the beginning of each shift.
Table 4: Main type of waste time for preparation time
Type Activities Time
(sec) Degree of
importance Remark
Preparation one Handling raw and remove cover
of roll 48 L By fork lift
Preparation two Collect and handling the semi-
product to second stage 36 V
Stop working stage
two about 45min
Preparation three Collect product and Transport
pallet to temporary storage area 147.8 M By fork lift
The data are collected over period 8 weeks. It has showed that stopped working in second stage
because the semi-product is not available when starting work.
The stopped working about 45 min to collect two pallets and handling by worker. Table 5 below
shows summarized of stopped working and probability of occurs in this situation, the average of
probability of occurs is 25.81%.
This means stopped working the second stage about 11.61 min (696.6 sec) at the beginning of
shift until the semi-product is complete in the first stage, in addition to the preparation time before
second stage of 36 sec in the production line.

10
Table 5: Summarized of stopped working and probability of occurs
Week Workdays Total shift No. of stops Probability
1 6 12 3 25.00
2 5 10 2 20.00
3 6 11 3 27.27
4 6 12 5 41.67
5 6 11 5 45.45
6 6 11 3 27.27
7 6 12 0 0.00
8 7 14 3 21.43
Total 48 93 24 25.81
3.4. Phase 4: Improve
At this stage, the DMAIC team has recognized clearly the main causes for each type of wastes,
expected solutions, required actions, time interval, and others. Corrective actions are started
immediately as requested by management.
The Improve phase is where the proposed action to minimize the probability of reoccurrence for
these problems. In order to improve and reduce the preparation time and the setup time between first
stage and second stage and reducing the potential to stop working the second stage time, the system
or process must be automatic the transporting of product from the end of the first stage to the
beginning of the second stage directly using an industrial conveyor.
It is working without collect time, reduce the time required for transfer, and the eliminate stop
working in shift beginning in the unavailable of semi-product from the previous stage, so the time is
adjusted a transport by 50% or 18 sec the percentage of 4.57 % from NVA, whereas reduces stop
working second stage of 25.81% time (696 sec) to zero.
Table 6 below shows the amount of revenue from this reduce the waste time. The increase annual
production 335,700 bags with percent 4.25 %, whereas the total annual revenue is $ 8952.
Table 6: The annual revenue of reduce waste time
State Time
reduce
(sec)
Ratio
improvement
Production
increase
/day
Annual
production Percentage
Annual
revenue ($)
Preparation time 18 4.57 % 55 16500 0.209 % 440
Stop working in
second stage 696.6 25.81% 1064 319200 4.04% 8,512
In the current situation of the defects can be treated through the application of maintenance
periodic machines and make the screening process take place after each stage of the production stages
and improved to be automated, Thus defects could be reduced about 20-25%.
The following table 7 shows the number of defective products after the application of the
proposed improvements.
Table 7: The defects in cement bags after appication improvement
Month Production
Production after
reduce waste
preparation time
Defects Defect ratio
Before After
improve Before
After
improve
January 7792640 7818377 62040 48081 0.796 % 0.617 %
February 8005980 8033955 64109 49685 0.801 % 0.620 %
Average 7899310 7961666 63075 48883 0.799 % 0.618 %

11
In addition, there is time waste when a defective product passes in the early stages of industrial
process and continue in production line on the following industrial various stages to the sole and final
inspection station.
The saving of around is (13959 def. *12 month * 0.57 cost = 95479.56 L.E) about $ 12,730.61
per year.
Evaluation of sigma level after application the proposal of improvement in the processes, the
defect per million opportunity (DPMO) is 6188.26 defect with defects ratio is 0.618 %. The level of
accuracy in processes is 99.38 % increase about 0.18%. However, the sigma level in this case is 4.00,
the sigma level increase 0.09 with percent 2.31 %.
Table 8 presents the significant improvements in the key performance metrics after
implementation of Lean Six Sigma (LSS) methodology. The key performance used for comparing
the results after implementing the LSS included: Defect Rate, process capability index (Cpk), first
time yield, OEE, and Sigma level.
Table 8: Comparison between before and after improvement
No. Key performance Before
improvement
After
improvement
1 Defect Rate 0.799 0.618
2 Yield 99.20 99.40
3 Process
capability
Cpk (length) 1.41 1.60
Cpk (valve width) 1.09 1.38
Cpk (valve other side width) 1.93 2.07
4 Overall equipment effectiveness (OEE) 0.454 0.543
5 Sigma level 3.91 4.00
3.5 Phase 5: Control
This phase is very important in the Lean Six Sigma implementation, as LSS does not only aim
to reduce waste and defects but also to be able to sustain the improvement that has been made. In
order to sustain the achieved results and to prevent degradation in the process performance. Hence,
the standardization of the optimal process parameters setting is required. From time to time, control
charts for dimension of cement bags, to check that the product is meeting the desired specification.
That to accentuate the following points in order to prevent the occurrence of other defects at different
stages of production and reduction of waste time:
Checking the defects at the first stage so that defects are not passed to after the production
stage.
Use the conveyor between first stage and second stage to reduce the waste time and eliminate
stop working in second stage.
Inspection data and analysis of defects and classification of causes these defects.
Training people on the regarding details of production and quality issues as well as other
activities such as problem solving and team building.
Use of control charts and graphs at each processing stage to keep the employees aware of the
real time performance at the respective stages of production.
Sustainability: The main purpose of the Lean Six Sigma methodology is not only improving the
process performance but also having the improved results sustained in the long run. Hence, the
standardization of the optimal process parameters setting is required. In order to sustain the

12
achieved results and to prevent degradation in the machines' performance, a sustainability plan is
formed including checklists. A sample from the sustain plan for the cutting machine is presented
in Table 9.
Table 9: Sustain plan for the cement bags machine
Operation name : Date: / /
Stage No Description Task Period Checked
by
Fixed
by
Approved
by
Action
plan
One
1 Printing
- Cleaning
- Change bearing
- checked ink color
- Lubrication
- Every day
- Every 2weeks
- Every day
- Monthly
………
………
………
………
………
………
………
………
………
………
………
………
………
………
………
………
2 Glowing - Cleaning
- Change bearing
- Every day
- Every month
………
………
………
………
………
………
………
………
3 Tubing
- Cleaning
- Change bearing
- Checked guide
- Lubrication
- Every day
- Every 2weeks
- Every week
- Monthly
………
………
………
………
………
………
………
………
………
………
………
………
………
………
………
………
4 Cutting
- Cleaning
- Change cutter
- Lubrication
- Every day
- Every week
- Monthly
………
………
………
………
………
………
………
………
………
………
………
………
5 Separation - Cleaning
- Lubrication
- Every day
- Monthly
………
………
………
………
………
………
………
………
Two
1 Feeding
- Cleaning
- Change bearing
- Lubrication
- Every day
- Every 2weeks
- Monthly
………
………
………
………
………
………
………
………
………
………
………
………
2 Opening - -Cleaning
- Change bearing
- Every day
- Every week
………
………
………
………
………
………
………
………
3 Valve
installation
- Cleaning
- Checked guide
- Change part
- Lubrication
- Every day
- Every week
- Every 2weeks
- Monthly
………
………
………
………
………
………
………
………
………
………
………
………
………
………
………
………
4 Gluing - Cleaning
- Checked parts
- Every day
- Every week
………
………
………
………
………
………
………
………
5 Closing - Cleaning
- Lubrication
- Every day
- Monthly
………
………
………
………
………
………
………
………
4. Conclusions
The following conclusions are drawn from this study:
1. Lean Six Sigma (LSS) can be applied in all business areas such as industry, design, sale,
marketing, services and procures quite many advantages.
2. The implementation of Lean Six Sigma (LSS) provided an impetus for establishing best practice
within the company.
3. Reduction of the preparation time by 4.57 %, the increase of annual production is over to
335,700 bags with percent of 4.25 %.
13
4. A significant improvement was observed in the key performance metrics (DPU, process
capability, yield, OEE) after implementation of the lean six sigma (LSS).
5. The implementation of the lean six sigma (LSS) has resulted in savings of around $ 8,952 from
reduction of waste time and $ 12,730.61 from defects reduction; the total is $ 21,682.61 per
year.
6. Increase in the overall equipment effectiveness (OEE) percentage 20% from 0.45 to become
0.54.
7. Increase in the level of sigma level percentage 2.3 % from 3.91 to become 4.00, and increase
in the net profit of the company.
References
[1] Atmaca E., and Girenes S. S., 2011, “Lean Six Sigma methodology and application,” Qual. Quant., 47(4),
pp. 2107–2127.
[2] Fitzmaurice I., 2010, “The effects of implementing a Lean Six Sigma tool , Visual Process Controls , to
improve month-end activities in a finance department – An Empirical Case Study,” National University of
Ireland.
[3] Mandahawi N., Fouad R. H., and Obeidat S., 2012, “An Application of Customized Lean Six Sigma to
Enhance Productivity at a Paper Manufacturing Company,” Jorden J. Mech. Ind. Eng., 6(1), pp. 103–109.
[4] Jie J. C. R., Kamaruddin S., and Azid I. A., 2014, “Implementing the Lean Six Sigma Framework in a Small
Medium Enterprise ( SME ) – A Case Study in a Printing Company,” International Conference on Industrial
Engineering and Operations Management, pp. 387–396.
[5] Patel R., 2011, “Modeling Lean Six Sigma in the small packaging industry in India,” Institute of Technology.
[6] Kumar M., Antony J., Singh R. K., Tiwari M. K., and Perry D., 2006, “Implementing the Lean Sigma
framework in an Indian SME : a case study,” Prod. Plan. Control, 17(4), pp. 407–423.
[7] Sosen A. A. S., Zohir A. H., and Saleh S. A., 2012, “Improvement of Production Quality by using Six Sigma
Technique : Applied Study in the Medical Syringes Factory - Babylon,” Tekreet Eng. Scinces, 02, p. 12.
[8] Ghaleb A. A., El-sharief M. A., and El-sebaie M. G., 2014, “Study of Tools, Techniques and Factors used in
Lean Six Sigma,” Int. J. Sci. Eng. Res., 5(12), pp. 1652–1658.
[9] Hale S. A., 2011, “Lean Transformation and Relocation of Jet Engine Assembly Operations by Libraries,”
Massachusetts Institute of Technology.
[10] Basavaraj Y., Sreenivasa P. K. V., and R. N. N. V., 2011, “Improvement of process capablity through six
sigma and robust design : Case study at an Indian Steel Manufacturing,” Int. J. Ind. Eng., 18(9), pp. 482–
492.
[11] Ramamoorthy S., 2007, “Lean Six-Sigma Applications in Aircraft Assembly,” Wichita State University.
[12] Barnala P., 2011, “Optimization of Operating Parameters of a Material Recovery Facility using Lean Six
Sigma Techniques,” University of Toledo.
[13] Montgomery D. C., 2009, Introduction to Statistical Quality Control, jo.
[14] Taghizadegan S., 2006, Essentials of Lean Six Sigma, Elsevier Inc.
[15] Paul M. Gibbons , Stuart C. Burgess 2010, "Introducing OEE as a measure of lean Six Sigma capability" Int.
J. of Lean Six Sigma, 1 (2), pp. 134-156
Related Documents