IMPLEMENTATION OF LEAN PRACTICES IN SMALL AND MEDIUM ENTERPRISE WAN MUHAMMAD SHUKRI BIN WAN ZAINAL ABIDIN A report submitted in partial fulfilment of the requirements for the award of the degree of Bachelor of Mechanical Engineering Faculty of Mechanical Engineering UNIVERSITI MALAYSIA PAHANG NOVEMBER 2008

Welcome message from author
This document is posted to help you gain knowledge. Please leave a comment to let me know what you think about it! Share it to your friends and learn new things together.
Transcript
IMPLEMENTATION OF LEAN PRACTICES IN
SMALL AND MEDIUM ENTERPRISE
WAN MUHAMMAD SHUKRI BIN WAN ZAINAL ABIDIN
A report submitted in partial fulfilment of the requirements
for the award of the degree of
Bachelor of Mechanical Engineering
Faculty of Mechanical Engineering
UNIVERSITI MALAYSIA PAHANG
NOVEMBER 2008
v
ACKNOWLEDGEMENTS
Alhamdulillah, grateful to Allah S.W.T. as I manage to complete my Final Year
Project. Firstly, thank you very much to my supervisor, Mr. Mohd. Fadzil bin Abd
Rahim for his guidance and advices for me to complete this project. Not forget to my
former supervisor for Final Year Project 1, Mr. Ahmad Naseer bin Mohd Rose and Mr.
Mohd Fadzil Faisae who helped me on the application of Witness Software. I would also
like to thank Pn Norehan Mohd Nor, the Managing Director of PJ Foods Industries Sdn.
Bhd. for allowing me to make research at her company. Without her permission, I will
not be able to complete my project. Not forget to the staffs at PJ Foods Industries Sdn.
Bhd. who were not hesitating to help me during my study at the company. Thank you to
my family and friends who are always support and help me and lastly, thank you to all
people who had help me either directly or indirectly until I manage to complete this
project. Thank you.
vi
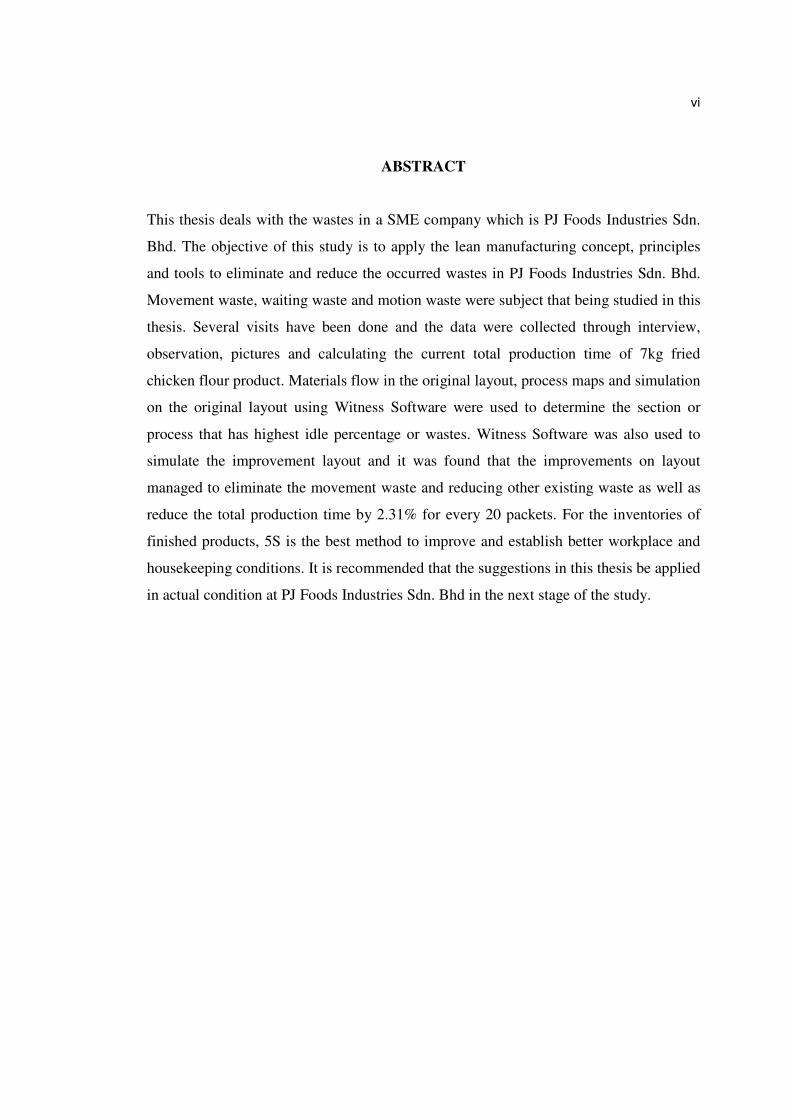
ABSTRACT
This thesis deals with the wastes in a SME company which is PJ Foods Industries Sdn.
Bhd. The objective of this study is to apply the lean manufacturing concept, principles
and tools to eliminate and reduce the occurred wastes in PJ Foods Industries Sdn. Bhd.
Movement waste, waiting waste and motion waste were subject that being studied in this
thesis. Several visits have been done and the data were collected through interview,
observation, pictures and calculating the current total production time of 7kg fried
chicken flour product. Materials flow in the original layout, process maps and simulation
on the original layout using Witness Software were used to determine the section or
process that has highest idle percentage or wastes. Witness Software was also used to
simulate the improvement layout and it was found that the improvements on layout
managed to eliminate the movement waste and reducing other existing waste as well as
reduce the total production time by 2.31% for every 20 packets. For the inventories of
finished products, 5S is the best method to improve and establish better workplace and
housekeeping conditions. It is recommended that the suggestions in this thesis be applied
in actual condition at PJ Foods Industries Sdn. Bhd in the next stage of the study.
vii
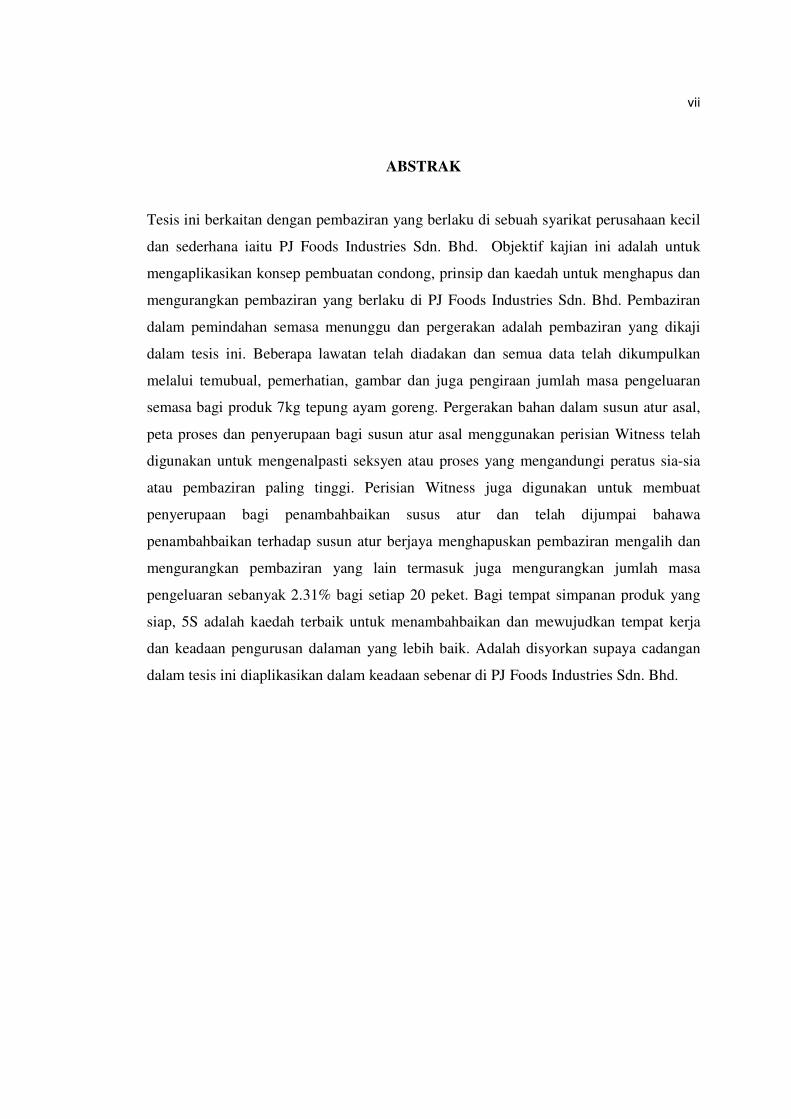
ABSTRAK
Tesis ini berkaitan dengan pembaziran yang berlaku di sebuah syarikat perusahaan kecil
dan sederhana iaitu PJ Foods Industries Sdn. Bhd. Objektif kajian ini adalah untuk
mengaplikasikan konsep pembuatan condong, prinsip dan kaedah untuk menghapus dan
mengurangkan pembaziran yang berlaku di PJ Foods Industries Sdn. Bhd. Pembaziran
dalam pemindahan semasa menunggu dan pergerakan adalah pembaziran yang dikaji
dalam tesis ini. Beberapa lawatan telah diadakan dan semua data telah dikumpulkan
melalui temubual, pemerhatian, gambar dan juga pengiraan jumlah masa pengeluaran
semasa bagi produk 7kg tepung ayam goreng. Pergerakan bahan dalam susun atur asal,
peta proses dan penyerupaan bagi susun atur asal menggunakan perisian Witness telah
digunakan untuk mengenalpasti seksyen atau proses yang mengandungi peratus sia-sia
atau pembaziran paling tinggi. Perisian Witness juga digunakan untuk membuat
penyerupaan bagi penambahbaikan susus atur dan telah dijumpai bahawa
penambahbaikan terhadap susun atur berjaya menghapuskan pembaziran mengalih dan
mengurangkan pembaziran yang lain termasuk juga mengurangkan jumlah masa
pengeluaran sebanyak 2.31% bagi setiap 20 peket. Bagi tempat simpanan produk yang
siap, 5S adalah kaedah terbaik untuk menambahbaikan dan mewujudkan tempat kerja
dan keadaan pengurusan dalaman yang lebih baik. Adalah disyorkan supaya cadangan
dalam tesis ini diaplikasikan dalam keadaan sebenar di PJ Foods Industries Sdn. Bhd.
viii
TABLE OF CONTENTS
Page
SUPERVISOR’S DECLARATION ii
STUDENT’S DECLARATION iii
ACKNOWLEDGEMENTS v
ABSTRACT vi
ABSTRAK vii
TABLE OF CONTENTS viii
LIST OF TABLES xi
LIST OF FIGURES xii
LIST OF ABBREVIATIONS xiii
CHAPTER 1 INTRODUCTION
1.1 Introduction 1
1.2 Background of Study 1
1.2.1 Company’s Background 1
1.3 Problem Statements 2
1.4 Objective 2
1.5 Scopes of the Study 2
CHAPTER 2 LITERATURE REVIEW
2.1 Lean Manufacturing Concept 3
2.2 Type of Wastes in Lean Manufacturing 4
2.3 Lean Manufacturing Tools 5
2.3.1 5S Techniques 5
2.3.2 Layout Improvement 6
2.3.3 Other Tools 6
2.4 Definition of SME in Malaysia 8
ix
2.4.1 Number of Full Time Employees 8
2.4.2 Annual Sales Turnover 9
2.4.3 Gross Domestic Product of SME in 2005 9
CHAPTER 3 METHODOLOGY
3.1 Introduction 11
3.2 Flow Chart for Final Year Project 12
3.3 Data Collections 13
3.4 Method of Analysis 13
3.5 Current Process Maps 13
3.6 Simulation 15
3.7 Layout 16
3.8 Housekeeping 17
3.9 Results 17
CHAPTER 4 RESULTS AND DISCUSSIONS
4.1 Introduction 19
4.2 Simulated Results of Original Case 19
4.3 Simulated Results of Suggestion Case 21
4.4 Comparison of Idle Percentage between Both Cases 24
4.5 Comparison of Busy Percentage between Both Cases 25
4.6 Comparison of the Total Production Time between Both Cases 26
4.7 Comparison of the Layout between Both Cases 27
4.8 Cost Estimation to Make Improvement on Layout 29
4.9 Improvements on Housekeeping at the Inventories of Finished Products 30
4.9.1 Disorganized Finished Products 31
4.9.2 Disorganized Empty Boxes 32
4.9.3 Disorganized Inventories 33
4.9.4 Products Taken From the Packaging 35
4.9.5 Racks Are Not Fully Utilized 36
x
CHAPTER 5 CONCLUSION AND RECOMMENDATIONS
5.1 Conclusion 38
5.2 Recommendation 38
REFERENCES 39
APPENDICES 40
A Gantt Chart for Final Year Project 1 40
B Gantt Chart for Final Year Project 2 41
C Layout of the Factory 42
D Production Flow for Fried Chicken Flour Products 43
E Annual Sales for 2006 44
F Annual Sales for 2007 45
xi
LIST OF TABLES
Table No. Title Page
2.1 Definition of SME Based on Number of Full-Time Employees 3
2.2 Definition of SME Based on Annual Sales Turnover 4
2.3 2005 data estimated based on the Census 2005’s profiles 10
4.1 Result of the Simulation for Original Case 20
4.2 Result of the Simulation for Suggestion Case 22
4.3 Comparison of Daily and Monthly Production for Both Cases 29
xii
LIST OF FIGURES
Figure No. Title Page
2.1 Overall Equipment Effectiveness 7
3.1 Flow Chart for Final Year Project 12
3.2 Current Process Maps for 20 Packets of 7kg Fried Chicken Flour 14
3.3 Original Layout in the Production of Fried Chicken Flour Section 16
3.4 Suggested Improvement Layout for Production of Fried Chicken Flour 17
Section
4.1 Flow of the Processes in Original Case 20
4.2 Flow of the Processes in Suggestion Case 22
4.3 Comparison of Idle Percentage between Original and Suggestion Case 24
4.4 Comparison of Busy Percentage between Original and Suggestion Case 25
4.5 Comparison of the Total Time to Produce 20 Packets of 7kg Fried 26
Chicken Flour
4.6 Comparison of Layout for Original Case and Suggestion Case 27
4.7 Finished Products Were Not Organized Properly 31
4.8 Racks for Empty Boxes Are Not Fully Utilized 32
4.9 Problems Occurred in the Inventories 33
4.10 Products Taken From the Plastic 35
4.11 Unutilized Racks 36
xiii
LIST OF ABBREVIATIONS
SME Small and Medium Enterprise
SMIDEC Small and Medium Industries Development Corporation
BNM Bank Negara Malaysia
GDP Gross Domestic Product
MIT Massachusetts Institute of Technology
TPM Total Productive Maintenance
OEE Overall Equipment Effectiveness
VSM Value Stream Mapping
MRO Maintenance/ Repair/ Operating
RM Ringgit Malaysia
GAA Great American Appetizers
MBU Manufacturing Business Unit
NSDC National SME Development Council
CHAPTER 1
INTRODUCTION
1.1 Introduction
This chapter provides the description of the project background, problem
statements, objective and scopes of study.
1.2 Background of Study
The study was to identify the problems that normally occur at a SME company
which is PJ Foods Industries Sdn. Bhd. based on the lean manufacturing perception and
provide the suitable methods or tools that can be applied with less cost and time to
overcome them. A small and medium enterprise company was chosen as most of them
are generally still use the traditional method of processing due to lack of technical
information, expertise and also finance. So, with the identification of problems and the
solutions that were provided in this study, they will benefit the company to improve their
production system and processing.
1.2.1 Company’s Background
PJ Foods Industries Sdn. Bhd. is a small scale food processing company that
concentrates on the production of fried chicken flour, curry powder and herbs. It has 18
full time employees and the company’s annual sales for year 2006 was RM1,401,132.87
and the best-sellers product was the fried chicken flour which covered 32.12% of the
2
total annual sales. For year 2007, the company’s annual sales was RM1, 186,836.37 and
the fried chicken flour was still the best-sellers product with 29.49% of the total annual
sales.
1.3 Problem Statements
Poor layout in the production of fried chicken flour section had caused wastes
such as movement waste while poor housekeeping in the inventories of finished
products had caused wastes such as motion and inventory waste. There were many
unneeded items and the workers need some time to search for the products. So, these are
the problems that were discussed and need to be improved in this study.
1.4 Objective
To propose improvement step for reducing wastes in PJ Foods Industries Sdn.
Bhd. by using Lean Manufacturing.
1.5 Scopes of the Study
This project will be done at PJ Foods Industries Sdn. Bhd. and the scopes will be
focus on the inventories of the raw materials and finished products at the warehouse and
also on the disorganize layout at the labeling and packaging section. In the labeling and
packaging section, there is a process and packaging for fried chicken flour product.
Other than improvement on the inventories, some methods will be identifying to make
improvements on the productivity of 1 pack of 7kg fried chicken flour product.
CHAPTER 2
LITERATURE REVIEW
2.1 Lean Manufacturing Concept
Lean manufacturing is a manufacturing philosophy that aims is to eliminate and
reduce wastes in every area of production including customer relations, product design,
supplier networks and factory management. It can be implemented by a company to stay
competitive by serving its customers better and continuously reducing costs.
Lean manufacturing concepts can be organized into three levels consist of lean
manufacturing objectives and basic principles, primary management and production
strategies used to achieve the objectives and instill basic principles and the
implementation techniques which are the practices and procedures for implementing and
maintaining the strategies.(ReVelle, 2002)
The systematic elimination of waste will reduce the cost of operating the
extended enterprises and fulfills the customer’s desire for maximum value at the lower
cost. In lean production or process, mistakes always be made but these mistakes are not
usually repeated because this is one of the form of waste that the lean philosophy and its
methods aim to eliminate.
4
2.2 Type of Wastes in Lean Manufacturing
There are eight types of waste that are normally be considered in the lean
manufacturing. There are: (ReVelle, 2002)
a) Overproduction
Overproduction happens when the company produce products more than
demanded or before it is needed.
b) Inventory
Inventory is an accumulation for finished products or raw materials at any stages
of production process. Inventory waste also can affect the other production
process and increases the lead time and response time.
c) Waiting
This happens when equipment, people or material waiting for each other or
waiting for a machine to process before proceed to the next process.
d) Movement
This waste happens when there is any material, information or people movement
which is not value added contribution for the customer.
e) Overprocessing
Process or efforts that add no value to the product or service can lead to
overproceesing waste.
f) Motion
This waste happens when there is any motion of people or machines that does
not add value to the product or service of customer.
5
g) Correction
This waste will add unnecessary costs because additional labor hours and
materials are needed to correct or repair the defects that occur in parts or
materials.
h) Underutilizing workers or people
This waste can be happens when the capabilities of the workers or people were
not fully utilized.
2.3 Lean Manufacturing Tools
2.3.1 5S Techniques
Poor workplace conditions may lead to rising of wastes such as accidents, time
spent in searching for needed items or motion to avoid obstacles. The lean journey can
be started by establishing good workplace and housekeeping conditions. 5S is a system
of workplace organization and it is fundamental to the implementation of other lean
strategies. 5S is a reference to five Japanese words which described standardized clean
up. The 5S are: (ReVelle, 2002)
a) Seiri (Sort)
This is a process where every non essential item is removing from the workplace
and keeping only the essential items. Examples of non essential items that need
to be sorted are extra cabinets, benches, tables, rags and tools. This will lead to
fewer hazards in the workplace.
b) Seiton (Set In Order)
Set in order is a process of organizing the remaining items after the ‘sort’ process
is completed. It focuses on the need for an orderly workplace. There should be a
place for everything and everything should always be in its place unless it is
being used.
6
c) Seiso (Shine)
Seiso or shine is a process of cleaning the work area and any equipment or
machinery in it. It indicates the need to keep the work area always clean. One of
the examples is at the end of each shift, the work area is cleaned up and
everything is restored to its place.
d) Seiketsu (Standardize)
This process allows for control and consistency. Basic housekeeping standards
are applied in the facility and duties are part of the regular work routines.
Everyone should know their responsibilities.
e) Shitsuke (Sustain)
Sustain is a process of sustaining discipline. Standards need to be maintained and
the facility or work area must always be in safe and efficient condition every
time.
2.3.2 Layout Improvement
Several productivity metrics such as production and lead time are affected by
how the materials flow and the location of the production resources in the factories.
Factory layout improvements can be occurring more than one time during a factory’s
life. Some of the reasons that need for a change to the layout are the factory having
problems with the materials flow, location change or purchase of new equipment. The
analysis and improvements on materials flow in a new layout is able to save cost and
time instead of buying new machine or equipment. (Meyers et. all, 2002)
2.3.3 Other Tools
There are other lean manufacturing tools such as pull system, kaizen, value
stream mapping, inventory management and total productive maintenance. Most of these
7
tools are normally applied at the big company or factories that normally have their own
vendors or chain system.
The pull-system strategy aims to provide the flexibility to rapidly respond to
customer demands and eliminate the waste that occurs when upstream processes produce
more than needed by the downstream customers. Kaizen is a constant elimination of
waste through bettering product quality, improving worker safety and reducing costs.
Value Stream Mapping (VSM) enables seeing where the long lead times come from
when the value added time is often a few minutes or hours. (ReVelle, 2002)
Total Productive Maintenance (TPM) is an approach to reduce equipment-related
losses due to speed reduction, downtime or defects by stabilizing and improving
equipment conditions. Overall Equipment Effectiveness (OEE) is a key measure in Total
Productive Maintenance. OEE takes into account downtime due to breakdown and setup,
reduced operating speed, idling, and lost time due to defects or reworks.
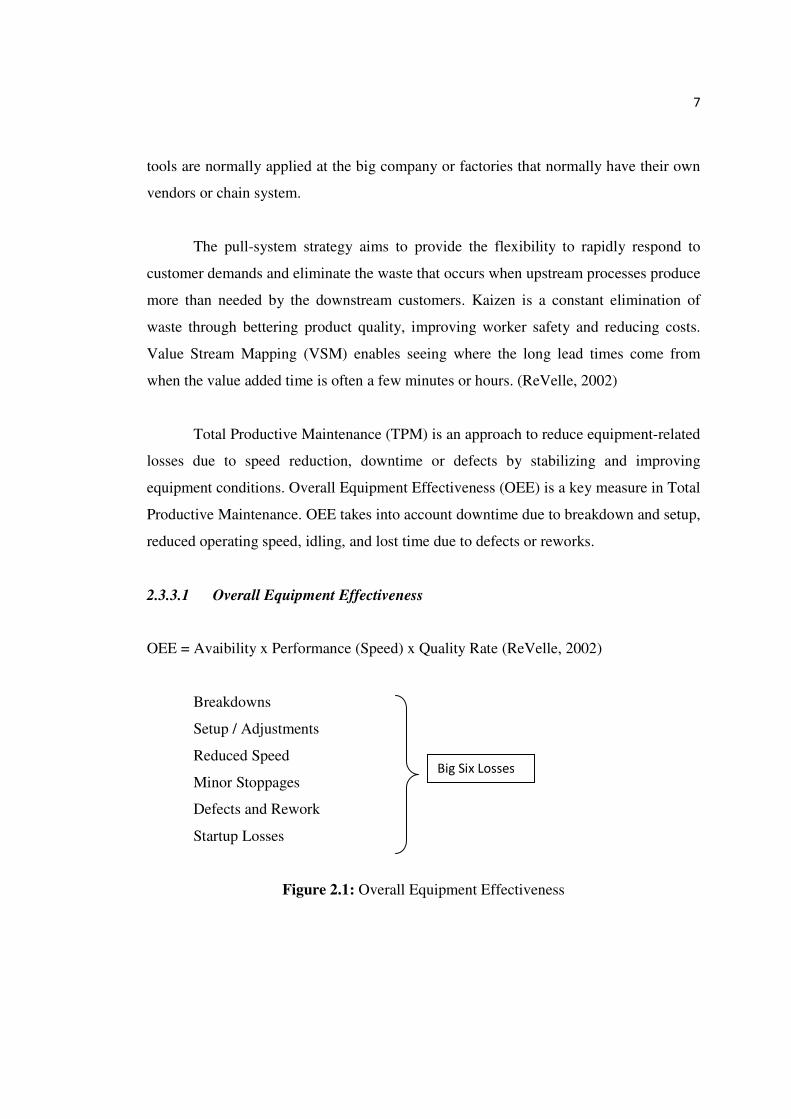
2.3.3.1 Overall Equipment Effectiveness
OEE = Avaibility x Performance (Speed) x Quality Rate (ReVelle, 2002)
Breakdowns
Setup / Adjustments
Reduced Speed
Minor Stoppages
Defects and Rework
Startup Losses
Figure 2.1: Overall Equipment Effectiveness
Big Six Losses
8
2.4 Definition of SME in Malaysia
In Malaysia, an enterprise is considered an SME in each of the respective sectors based
on the Annual Sales Turnover or Number of Full-Time Employees. Malaysian SMEs
can be grouped into three categories which are micro, small and medium.
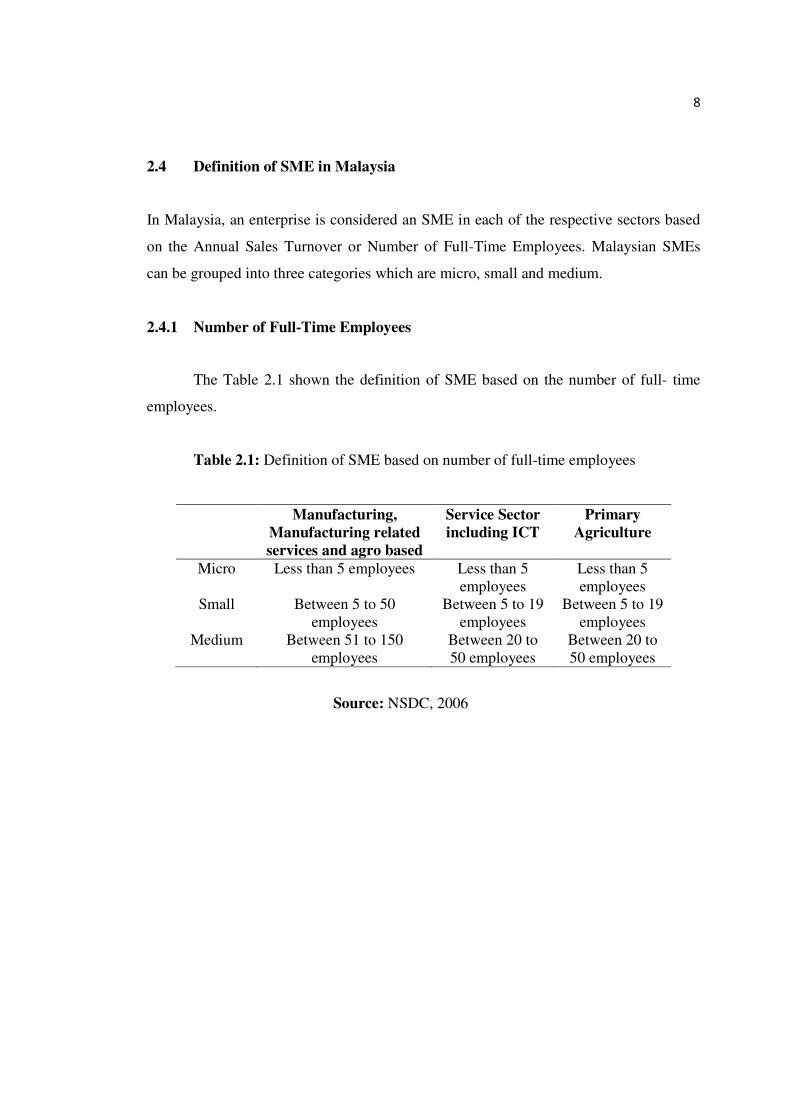
2.4.1 Number of Full-Time Employees
The Table 2.1 shown the definition of SME based on the number of full- time
employees.
Table 2.1: Definition of SME based on number of full-time employees
Manufacturing,
Manufacturing related
services and agro based
Service Sector
including ICT
Primary
Agriculture
Micro Less than 5 employees
Less than 5
employees
Less than 5
employees
Small Between 5 to 50
employees
Between 5 to 19
employees
Between 5 to 19
employees
Medium Between 51 to 150
employees
Between 20 to
50 employees
Between 20 to
50 employees
Source: NSDC, 2006
9
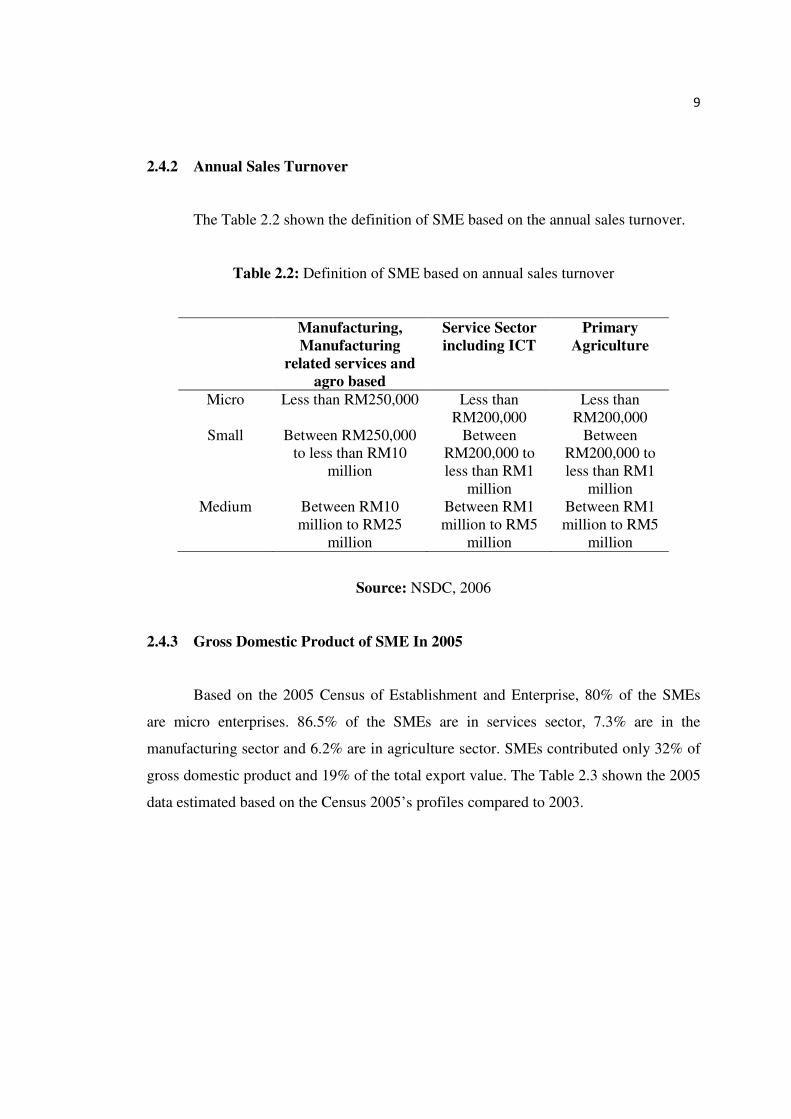
2.4.2 Annual Sales Turnover
The Table 2.2 shown the definition of SME based on the annual sales turnover.
Table 2.2: Definition of SME based on annual sales turnover
Manufacturing,
Manufacturing
related services and
agro based
Service Sector
including ICT
Primary
Agriculture
Micro Less than RM250,000 Less than
RM200,000
Less than
RM200,000
Small Between RM250,000
to less than RM10
million
Between
RM200,000 to
less than RM1
million
Between
RM200,000 to
less than RM1
million
Medium Between RM10
million to RM25
million
Between RM1
million to RM5
million
Between RM1
million to RM5
million
Source: NSDC, 2006
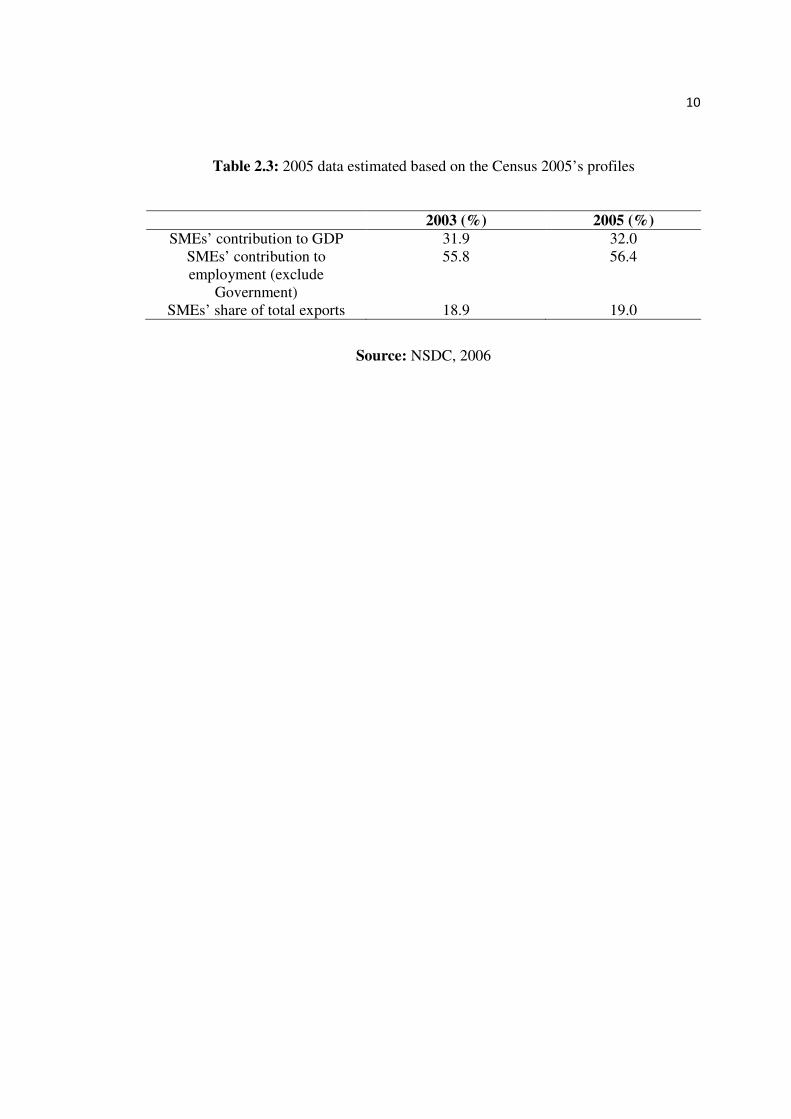
2.4.3 Gross Domestic Product of SME In 2005
Based on the 2005 Census of Establishment and Enterprise, 80% of the SMEs
are micro enterprises. 86.5% of the SMEs are in services sector, 7.3% are in the
manufacturing sector and 6.2% are in agriculture sector. SMEs contributed only 32% of
gross domestic product and 19% of the total export value. The Table 2.3 shown the 2005
data estimated based on the Census 2005’s profiles compared to 2003.
10
Table 2.3: 2005 data estimated based on the Census 2005’s profiles
2003 (%) 2005 (%)
SMEs’ contribution to GDP 31.9 32.0
SMEs’ contribution to
employment (exclude
Government)
55.8 56.4
SMEs’ share of total exports 18.9 19.0
Source: NSDC, 2006
CHAPTER 3
METHODOLOGY
3.1 Introduction
This chapter provides the flow chart for Final Year Project, description about the
data collections, method of analysis, simulation, layout, housekeeping and results
analysis of the project.
12
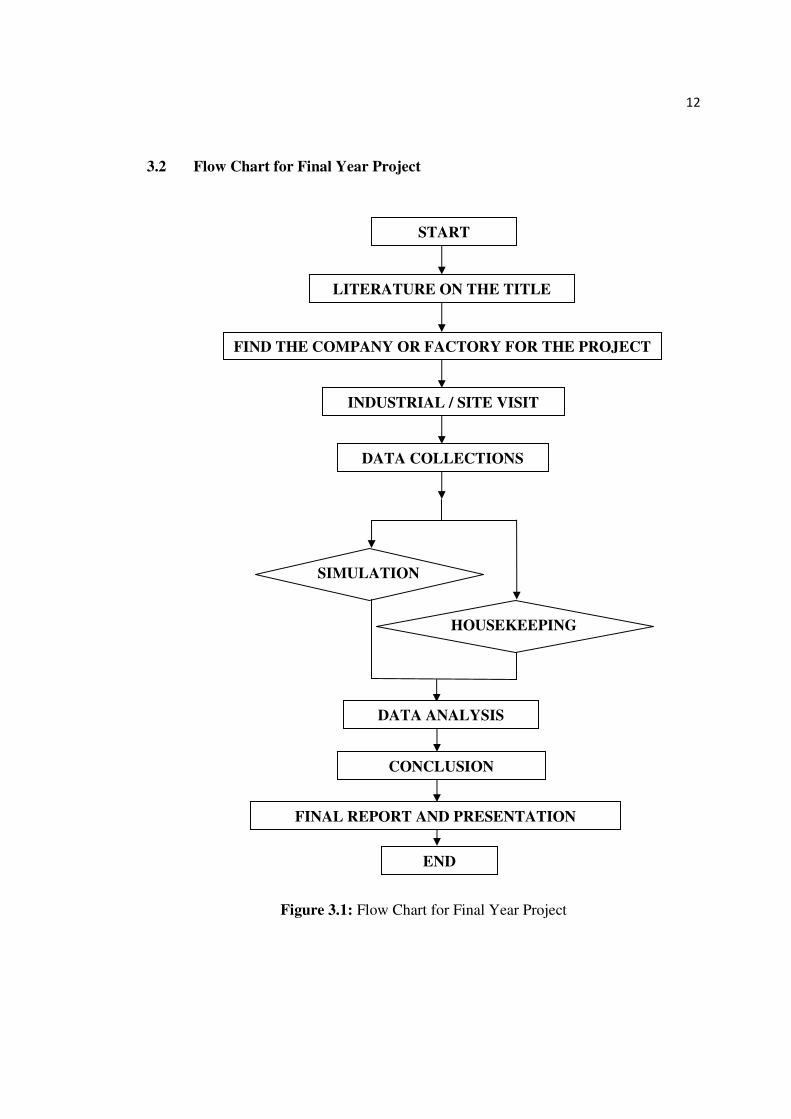
3.2 Flow Chart for Final Year Project
Figure 3.1: Flow Chart for Final Year Project
START
LITERATURE ON THE TITLE
FIND THE COMPANY OR FACTORY FOR THE PROJECT
INDUSTRIAL / SITE VISIT
DATA COLLECTIONS
SIMULATION
CONCLUSION
FINAL REPORT AND PRESENTATION
END
HOUSEKEEPING
DATA ANALYSIS
13
3.3 Data collections
Some visits to the selected company which was PJ Foods Industries Sdn. Bhd.
had been done for the process of data collections. The data collections were made
through observation, interview with the supervisor and workers and pictures that being
taken at the factory.
The data collections that had been made include sales revenue of the company
for 2006 and 2007, background of the company, the number of workers, the layout of
the production of 7kg fried chicken flour section, the total time to produce 20 packets of
7kg fried chicken flour, cycle time for each process involves in the production of fried
chicken flour, pictures of the inventories and the prices of the products.
3.4 Method of Analysis
After the data collections process, the collected data about the process and layout
at production of fried chicken flour section had been used to make a process map and
materials flow. From the process map, the unnecessary process and wastes can be
detected. From the materials flow in the layout, any problems that related to the
materials flow can be detected and improvements on the layout and can be made. In this
task, the suggestions to improve the layout were applied in the simulation using Witness
software.
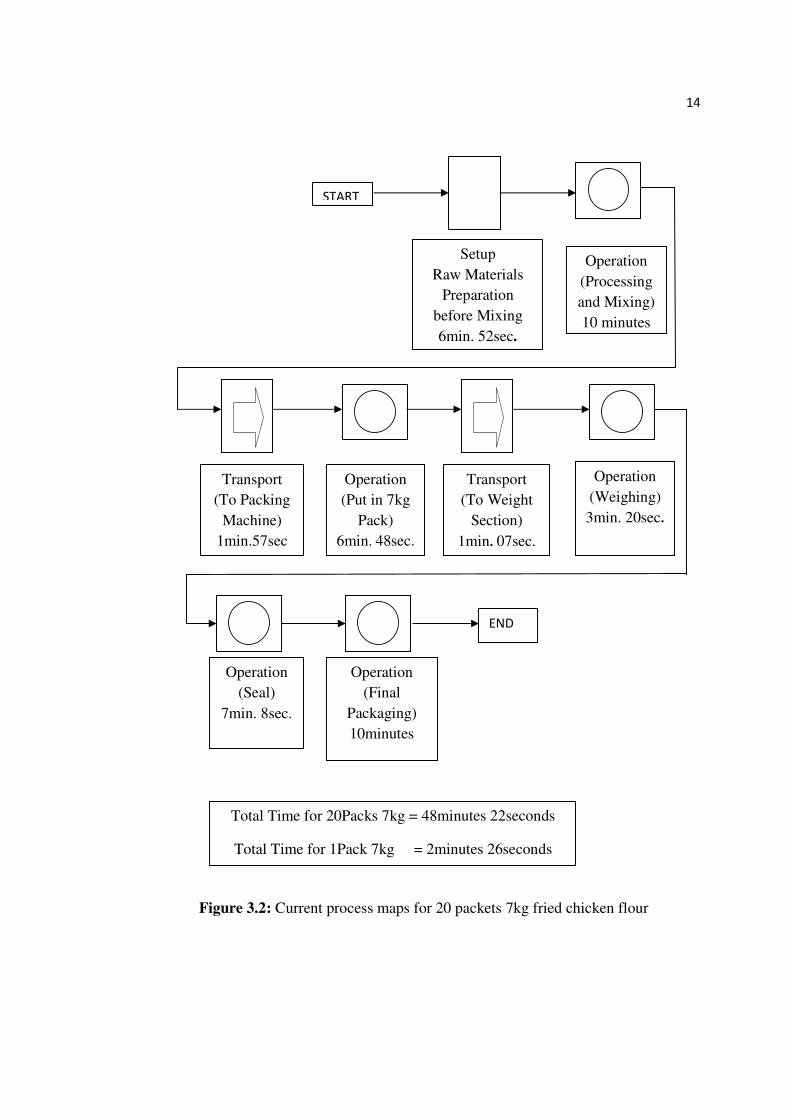
3.5 Current Process Maps
The Figure 3.2 showed the current process maps for 20 packets of 7kg fried
chicken flour.
14
Figure 3.2: Current process maps for 20 packets 7kg fried chicken flour
Setup
Raw Materials
Preparation
before Mixing
6min. 52sec.
Operation
(Processing
and Mixing)
10 minutes
Transport
(To Packing
Machine)
1min.57sec
Operation
(Put in 7kg
Pack)
6min. 48sec.
Transport
(To Weight
Section)
1min. 07sec.
Operation
(Weighing)
3min. 20sec.
Operation
(Seal)
7min. 8sec.
Operation
(Final
Packaging)
10minutes
END
START
Total Time for 20Packs 7kg = 48minutes 22seconds
Total Time for 1Pack 7kg = 2minutes 26seconds
Related Documents