Atmos. Chem. Phys., 12, 10209–10237, 2012 www.atmos-chem-phys.net/12/10209/2012/ doi:10.5194/acp-12-10209-2012 © Author(s) 2012. CC Attribution 3.0 License. Atmospheric Chemistry and Physics Implementation of dust emission and chemistry into the Community Multiscale Air Quality modeling system and initial application to an Asian dust storm episode K. Wang 1 , Y. Zhang 1,2 , A. Nenes 3,4,5 , and C. Fountoukis 5 1 Department of Marine, Earth, and Atmospheric Sciences, North Carolina State University, Campus Box 8208, Raleigh, NC 27695, USA 2 School of Environment, Tsinghua University, Beijing, China 3 School of Earth and Atmospheric Sciences, Georgia Institute of Technology, Atlanta, GA 30332, USA 4 School of Chemical and Biomolecular Engineering, Georgia Institute of Technology, Atlanta, GA 30332, USA 5 Institute of Chemical Engineering and High Temperature Chemical Processes (ICE-HT), Foundation for Research and Technology Hellas (FORTH), Patras, 26504, Greece Correspondence to: Y. Zhang ([email protected]) Received: 19 April 2012 – Published in Atmos. Chem. Phys. Discuss.: 31 May 2012 Revised: 2 October 2012 – Accepted: 5 October 2012 – Published: 6 November 2012 Abstract. The US Environmental Protection Agency’s (EPA) Community Multiscale Air Quality (CMAQ) modeling sys- tem version 4.7 is further developed to enhance its capabil- ity in simulating the photochemical cycles in the presence of dust particles. The new model treatments implemented in CMAQ v4.7 in this work include two online dust emis- sion schemes (i.e., the Zender and Westphal schemes), nine dust-related heterogeneous reactions, an updated aerosol in- organic thermodynamic module ISORROPIA II with an ex- plicit treatment of crustal species, and the interface between ISORROPIA II and the new dust treatments. The result- ing improved CMAQ (referred to as CMAQ-Dust), offline- coupled with the Weather Research and Forecast model (WRF), is applied to the April 2001 dust storm episode over the trans-Pacific domain to examine the impact of new model treatments and understand associated uncertainties. WRF/CMAQ-Dust produces reasonable spatial distribution of dust emissions and captures the dust outbreak events, with the total dust emissions of ∼ 111 and 223 Tg when using the Zender scheme with an erodible fraction of 0.5 and 1.0, re- spectively. The model system can reproduce well observed meteorological and chemical concentrations, with significant improvements for suspended particulate matter (PM), PM with aerodynamic diameter of 10 μm, and aerosol optical depth than the default CMAQ v4.7. The sensitivity studies show that the inclusion of crustal species reduces the concen- tration of PM with aerodynamic diameter of 2.5 μm (PM 2.5 ) over polluted areas. The heterogeneous chemistry occurring on dust particles acts as a sink for some species (e.g., as a lower limit estimate, reducing O 3 by up to 3.8 ppb (∼ 9 %) and SO 2 by up to 0.3 ppb (∼ 27 %)) and as a source for some others (e.g., increasing fine-mode SO 2- 4 by up to 1.1 μg m -3 (∼ 12 %) and PM 2.5 by up to 1.4 μg m -3 (∼ 3 %)) over the domain. The long-range transport of Asian pollutants can en- hance the surface concentrations of gases by up to 3 % and aerosol species by up to 20 % in the Western US. 1 Introduction Natural and anthropogenic aerosols are known to play a sig- nificant role in human health, climate change, atmospheric visibility, stratospheric ozone depletion, acid deposition, and photochemical smog. The role of natural aerosols on air qual- ity and climate is as significant as that of anthropogenic aerosols, not only because of their very high global mass loading (probably 4 to 5 times larger than that of anthro- pogenic aerosols on a global scale according to Satheesh and Moorthy, 2005), but also because of their contribution to the long-range transport as carriers and to atmospheric chemistry Published by Copernicus Publications on behalf of the European Geosciences Union.

Welcome message from author
This document is posted to help you gain knowledge. Please leave a comment to let me know what you think about it! Share it to your friends and learn new things together.
Transcript

Atmos. Chem. Phys., 12, 10209–10237, 2012www.atmos-chem-phys.net/12/10209/2012/doi:10.5194/acp-12-10209-2012© Author(s) 2012. CC Attribution 3.0 License.
AtmosphericChemistry
and Physics
Implementation of dust emission and chemistry into the CommunityMultiscale Air Quality modeling system and initial application to anAsian dust storm episode
K. Wang1, Y. Zhang1,2, A. Nenes3,4,5, and C. Fountoukis5
1Department of Marine, Earth, and Atmospheric Sciences, North Carolina State University, Campus Box 8208, Raleigh,NC 27695, USA2School of Environment, Tsinghua University, Beijing, China3School of Earth and Atmospheric Sciences, Georgia Institute of Technology, Atlanta, GA 30332, USA4School of Chemical and Biomolecular Engineering, Georgia Institute of Technology, Atlanta, GA 30332, USA5Institute of Chemical Engineering and High Temperature Chemical Processes (ICE-HT), Foundation for Research andTechnology Hellas (FORTH), Patras, 26504, Greece
Correspondence to:Y. Zhang ([email protected])
Received: 19 April 2012 – Published in Atmos. Chem. Phys. Discuss.: 31 May 2012Revised: 2 October 2012 – Accepted: 5 October 2012 – Published: 6 November 2012
Abstract. The US Environmental Protection Agency’s (EPA)Community Multiscale Air Quality (CMAQ) modeling sys-tem version 4.7 is further developed to enhance its capabil-ity in simulating the photochemical cycles in the presenceof dust particles. The new model treatments implementedin CMAQ v4.7 in this work include two online dust emis-sion schemes (i.e., the Zender and Westphal schemes), ninedust-related heterogeneous reactions, an updated aerosol in-organic thermodynamic module ISORROPIA II with an ex-plicit treatment of crustal species, and the interface betweenISORROPIA II and the new dust treatments. The result-ing improved CMAQ (referred to as CMAQ-Dust), offline-coupled with the Weather Research and Forecast model(WRF), is applied to the April 2001 dust storm episodeover the trans-Pacific domain to examine the impact of newmodel treatments and understand associated uncertainties.WRF/CMAQ-Dust produces reasonable spatial distributionof dust emissions and captures the dust outbreak events, withthe total dust emissions of∼ 111 and 223 Tg when using theZender scheme with an erodible fraction of 0.5 and 1.0, re-spectively. The model system can reproduce well observedmeteorological and chemical concentrations, with significantimprovements for suspended particulate matter (PM), PMwith aerodynamic diameter of 10 µm, and aerosol opticaldepth than the default CMAQ v4.7. The sensitivity studies
show that the inclusion of crustal species reduces the concen-tration of PM with aerodynamic diameter of 2.5 µm (PM2.5)
over polluted areas. The heterogeneous chemistry occurringon dust particles acts as a sink for some species (e.g., as alower limit estimate, reducing O3 by up to 3.8 ppb (∼ 9 %)and SO2 by up to 0.3 ppb (∼ 27 %)) and as a source for someothers (e.g., increasing fine-mode SO2−
4 by up to 1.1 µg m−3
(∼ 12 %) and PM2.5 by up to 1.4 µg m−3 (∼ 3 %)) over thedomain. The long-range transport of Asian pollutants can en-hance the surface concentrations of gases by up to 3 % andaerosol species by up to 20 % in the Western US.
1 Introduction
Natural and anthropogenic aerosols are known to play a sig-nificant role in human health, climate change, atmosphericvisibility, stratospheric ozone depletion, acid deposition, andphotochemical smog. The role of natural aerosols on air qual-ity and climate is as significant as that of anthropogenicaerosols, not only because of their very high global massloading (probably 4 to 5 times larger than that of anthro-pogenic aerosols on a global scale according to Satheesh andMoorthy, 2005), but also because of their contribution to thelong-range transport as carriers and to atmospheric chemistry
Published by Copernicus Publications on behalf of the European Geosciences Union.
10210 K. Wang et al.: Dust emission and chemistry – the CMAQ modeling system
as reaction sites. Among aerosols, mineral dust or soil dustis one of the major tropospheric aerosol components (IPCC,2007). The uncertainties in direct and indirect atmosphericradiative forcing by mineral dust are considered to be one ofthe largest ones in climate and chemistry transport models.Therefore, an accurate modeling of mineral dust emissions,transport, and chemistry would enhance the understanding ofdust storm episodes and their impacts on air quality and cli-mate.
Dust storms have been simulated in numerous studies inthe past decade. Although these studies were able to re-produce many observations and demonstrate characteristictransport patterns of dust storms (e.g., Westphal et al., 1987;Tegen and Fung, 1994; Marticorena and Bergametti, 1995;Mahowald et al., 1999; Ginoux et al., 2001; Nickovic et al.,2001; Shao, 2001; Uno et al., 2003; Zender et al., 2003; Dar-menova et al., 2009; Shao et al., 2010; Spyrou et al., 2010;Kang et al., 2011; Solomos et al., 2011; Knippertz and Todd,2012), there remain large uncertainties and discrepancies forvarious dust emission and transport models. The uncertain-ties are mainly from different model parameterizations ofdust emission processes, estimated amounts of dust reachingremote areas during dust storm events, and variations in thesize distribution during long-range transport. The discrep-ancies are mainly due to different treatments in dust emis-sion schemes, different atmospheric transport models and re-sultant meteorological predictions (e.g., wind velocity), andland surface conditions (e.g., soil textures, soil wetness, andland use data).
In recent years, increasing research attention has beengiven to chemical composition and processes associated withdust particles. Numerous experimental (e.g., Goodman et al.,2000; Underwood et al., 2001; Li et al., 2006; Song et al.,2007; Ndoru et al., 2008, 2009; Wagner et al., 2008; Mc-Naughton et al., 2009; Crowley et al., 2010; Li et al., 2010;Tang et al., 2010) and modeling studies (Zhang et al., 1994;Dentener et al., 1996; Zhang and Carmichael, 1999; Un-derwood et al., 2001; Bian and Zender, 2003; Bauer et al.,2004; Liao and Seinfeld, 2005; Tie et al., 2005; Pozzoli etal., 2008a, b; Astitha et al., 2010; Manktelow et al., 2010;Zhu et al., 2010; Karydis et al., 2011) have demonstratedthe significance of heterogeneous chemistry on the surfaceof mineral dust particles in altering the concentration of at-mospheric gaseous and aerosol compositions. For example,using a box model, Zhang et al. (1994) reported that the het-erogeneous reaction on the surface of mineral dust can re-duce nitrogen oxides (NOx) levels by up to 50 %, hydroper-oxyl radical (HO2) concentrations by 20 to 80 %, and ozone(O3) production rates by up to 25 % with the dust level of 0to 500 µg m−3. Using a global model, Dentener et al. (1996)found that the interactions of dinitrogen pentoxide (N2O5),O3, and HO2 radicals with dust can affect the photochemicaloxidants cycle and cause O3 decreases by up to 10 % nearthe dust source regions where dust mass concentrations aremore than 300 µg m−3. Using another global model, Pozzoli
et al. (2008a) also found that heterogeneous chemistry sig-nificantly reduced the distributions of a number of key gasessuch as O3 by 18 to 23 % over the trans-Pacific region and ni-tric acid (HNO3) by 15 % globally. Li et al. (2006) showed intheir laboratory study that atmospheric sulfur dioxide (SO2)
loss via the heterogeneous reaction on dust is comparableto loss via the gas-phase oxidation under high dust condi-tions (i.e., when the number concentrations of dust are∼ 8 to56 cm−3).
The US Environmental Protection Agency’s (EPA) Com-munity Multiscale Air Quality (CMAQ) modeling systemversion 4.4 has been previously applied by Wang et al. (2009)over the trans-Pacific domain to study the long-range trans-port of Asian air pollutants and its impact on regional airquality over North America. CMAQ reasonably reproducesobserved mass concentrations of most air pollutants and cap-tures their transport mechanisms. It, however, is incapableof reproducing observed mass concentrations of particulatematter with aerodynamic diameter less than or equal to 10 µm(PM10) and aerosol optical depths (AODs), due to the lack ofmineral dust treatments in CMAQ (Wang et al., 2009; Wangand Zhang, 2010). In this study, this limitation is addressedby implementing an online dust emission and heterogeneouschemistry module into CMAQ version 4.7 in order to inves-tigate the role of dust in affecting chemical predictions ofair pollutants. In addition, the default inorganic thermody-namic equilibrium module ISORROPIA 1.7 (Nenes et al.,1998, 1999) in CMAQ v4.7 is updated to ISORROPIA II(Fountoukis and Nenes, 2007; Fountoukis et al., 2009) to ac-count for the thermodynamic interactions of dust with otherchemical species. The version of CMAQ with the above newtreatments (referred to hereafter as CMAQ-Dust) is then ap-plied to the April 2001 Intercontinental transport and Cli-matic effects of Air Pollutants (ICAP) episode to investigatedust transport, the role of dust in affecting chemical predic-tions of air pollutants, and the impact of the associated crustalspecies (e.g., calcium (Ca), potassium (K), and magnesium(Mg)) on the inorganic gas/particle partitioning through theaerosol thermodynamic equilibrium. The objective of studyis to enhance the capability of CMAQ to simulate PM and itsinteractions with photochemical cycles, as well as long-rangetransport of air pollutants associated with dust storms.
In the next section, a detailed description of the new dustemission and chemistry treatments in CMAQ-Dust is pre-sented. Section 3 presents model configurations and simula-tion setup. Section 4 describes the model performance eval-uation of meteorological and chemical variables. Section 5examines the impacts of dust treatments on model predic-tions. Major findings, limitations, and future improvementsare summarized in Sect. 6.
Atmos. Chem. Phys., 12, 10209–10237, 2012 www.atmos-chem-phys.net/12/10209/2012/
K. Wang et al.: Dust emission and chemistry – the CMAQ modeling system 10211
2 The development of CMAQ-Dust
2.1 Online dust emission module
Dust emissions are favored by strong ground-level winds as-sociated with large-scale disturbances or convective activity.Dust mobilization is often inhibited by surface-covering ele-ments such as vegetation, snow cover, and rocks. It is alsoconstrained by soil conditions such as high soil moistureand high salinity. With these factors, active mineral dust-producing surfaces are normally confined to “bare ground”or “sparsely vegetated ground” in arid and semiarid regionswith strong winds (Tanaka, 2007; Yue et al., 2009). Param-eterizations of dust fluxes often take into consideration theaforementioned factors, though the formulation varies con-siderably among mathematical expressions.
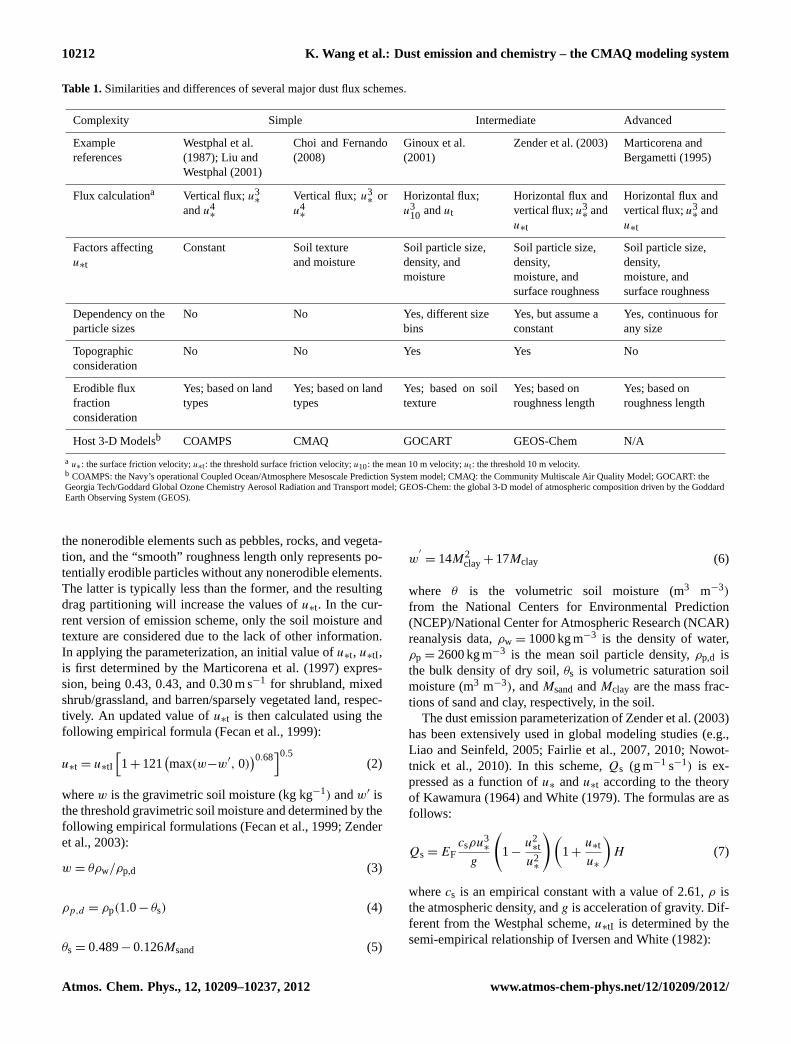
Various dust mobilization/flux schemes used in 3-D atmo-spheric models have been reviewed in several studies (e.g.,Zender et al., 2003; Shao and Dong, 2006; Chervenkov andJakobs, 2011). They can be grouped based on the complexityof schemes. For example, Zender et al. (2003) classified dustschemes in three “complexity” groups. In the “simple” treat-ments, the emission of dust is parameterized in terms of thethird or fourth power of the wind speed or friction speed andthe emitted dust is then redistributed empirically based on anassumption of size distribution (Westphal et al., 1987; Tegenand Fung, 1994; Mahowald et al., 1999). Under this assump-tion, different sizes of particles have the same emission ratesand very detail microphysical information (e.g., the soil par-ticle size distribution over different source regions) is notnecessary. In “complex” dust emission schemes, a completemicrophysical parameterization is used to predict the size-resolved saltation mass flux and resulting sandblasted dustemissions (Marticorena and Bergametti, 1995; Shao, 2001;Shao et al., 2010). In this case, different sizes of dust particleshave different emission rates. Although these schemes pro-vide the most physically based approach for estimating dustemissions, many input parameters/information are not avail-able to constrain them, especially for large-scale simulations.Nevertheless, this class of schemes has shown some promis-ing results in regional simulations (Marticorena and Berga-metti, 1995; Darmenova et al., 2009; Kang et al., 2011). “In-termediate” complexity schemes use microphysical parame-terizations wherever possible, but invoke simplified assump-tions to allow their application in large-scale/global simula-tions (Ginoux et al., 2001; Zender et al., 2003). All the aboveschemes have been favorably evaluated against lab and/orfield experiments. Table 1 summarizes the main character-istics of several major dust flux schemes mentioned above.
In this study, two established and commonly used dust fluxschemes are adapted and incorporated into CMAQ v4.7: theWestphal et al. (1987) scheme with modifications by Choiand Fernando (2008) (hereafter called “Westphal scheme”)and the Zender et al. (2003) scheme (hereafter called “Zen-der scheme”). A major difference between the two schemes
is that the Zender scheme splits the dust flux into two compo-nents, horizontally saltating mass flux of large particles (Qs)
and vertical mass flux of dust (Fd), whereas the Westphal cal-culates vertical fluxes directly. Even if the Zender scheme ismore physically based than the Westphal scheme, incorporat-ing both approaches in CMAQ-Dust permits an assessmentof the sensitivity of dust emissions and impacts on differ-ent dust flux parameterizations. A detailed description aboutthese two schemes is given below.
The Westphal scheme is based on the assumption that thevertical mass fluxes of dust particles with radius less than10 µm can be expressed as a function of surface friction ve-locity (u∗); data to constrain the parameterization are basedon measurements from Sahara, the Southwestern US, and Is-raeli deserts. The associated formulas for the dust verticalflux, Fd (g m−2 s−1), are expressed as
Fd = EF × (1− RF) × C × u3∗ × H (1)
whereH is the Heaviside function that depends onu∗ − u∗t.u∗ is the surface friction velocity, andu∗t is the threshold sur-face friction velocity.H = 1 whenu∗ − u∗t ≥ 0, indicatingthat dust particles can only be emitted from the surface undersuch conditions.H = 0 whenu∗−u∗t <0, indicating no dustemissions.C is 10−13 and 10−14u∗ for predominantly sandyand silt/clay soil, respectively.RF is a reduction factor overdifferent land types based on the 24 US Geophysical Sur-vey (USGS) land use categories; in this study, we considerthree land use category types (Choi and Fernando, 2008):shrubland (RF = 0.7), mixed shrub/grassland (RF = 0.75),and barren/sparsely vegetated land (RF = 0.1). EF is an ad-justable parameter that represents the fraction of erodiblelands capable of emitting dust. AlthoughEF may vary withlocations due to heterogeneity of the erodibility of the lands,Liu and Westphal (2001) suggested a constant value of 0.13,which was based on the land surface conditions in 1950s(Clements et al., 1957). More recent studies (Liu et al., 2003;Yang et al., 2005) suggested higher values should be used forcurrent conditions over arid areas, indicating that this fac-tor should be adjusted based on current land conditions andmay vary with locations and episodes. Three values, 0.3, 0.5,and 1.0, are therefore selected, to test its sensitivity to dustemissions. The results withEF = 0.5 and 1.0 are shown inthe following sections. In the original scheme of Westphalet al. (1987), they assumed a constant value ofu∗t, which issubject to high uncertainties for larger-scale simulation. Re-cently, Choi and Fernando (2008) improved the scheme byconsidering the effects of soil texture (i.e., soil percentage ofsand, silt, and clay) and soil moisture onu∗t, which makesthe scheme more suitable for larger-scale study. In additionto the soil texture and moisture, there are several other fac-tors that may affect the values ofu∗t, such as the particlesize distribution of soils and the drag partitioning betweenthe traditional aerodynamic roughness length and “smooth”roughness length (Marticorena and Bergametti, 1995). Theaerodynamic roughness length of the bare ground includes
www.atmos-chem-phys.net/12/10209/2012/ Atmos. Chem. Phys., 12, 10209–10237, 2012
10212 K. Wang et al.: Dust emission and chemistry – the CMAQ modeling system
Table 1.Similarities and differences of several major dust flux schemes.
Complexity Simple Intermediate Advanced
Examplereferences
Westphal et al.(1987); Liu andWestphal (2001)
Choi and Fernando(2008)
Ginoux et al.(2001)
Zender et al. (2003) Marticorena andBergametti (1995)
Flux calculationa Vertical flux;u3∗
andu4∗
Vertical flux; u3∗ or
u4∗
Horizontal flux;u3
10 andut
Horizontal flux andvertical flux;u3
∗ andu∗t
Horizontal flux andvertical flux;u3
∗ andu∗t
Factors affectingu∗t
Constant Soil textureand moisture
Soil particle size,density, andmoisture
Soil particle size,density,moisture, andsurface roughness
Soil particle size,density,moisture, andsurface roughness
Dependency on theparticle sizes
No No Yes, different sizebins
Yes, but assume aconstant
Yes, continuous forany size
Topographicconsideration
No No Yes Yes No
Erodible fluxfractionconsideration
Yes; based on landtypes
Yes; based on landtypes
Yes; based on soiltexture
Yes; based onroughness length
Yes; based onroughness length
Host 3-D Modelsb COAMPS CMAQ GOCART GEOS-Chem N/A
a u∗: the surface friction velocity;u∗t: the threshold surface friction velocity;u10: the mean 10 m velocity;ut: the threshold 10 m velocity.b COAMPS: the Navy’s operational Coupled Ocean/Atmosphere Mesoscale Prediction System model; CMAQ: the Community Multiscale Air Quality Model; GOCART: theGeorgia Tech/Goddard Global Ozone Chemistry Aerosol Radiation and Transport model; GEOS-Chem: the global 3-D model of atmospheric composition driven by the GoddardEarth Observing System (GEOS).
the nonerodible elements such as pebbles, rocks, and vegeta-tion, and the “smooth” roughness length only represents po-tentially erodible particles without any nonerodible elements.The latter is typically less than the former, and the resultingdrag partitioning will increase the values ofu∗t. In the cur-rent version of emission scheme, only the soil moisture andtexture are considered due to the lack of other information.In applying the parameterization, an initial value ofu∗t, u∗tI ,is first determined by the Marticorena et al. (1997) expres-sion, being 0.43, 0.43, and 0.30 m s−1 for shrubland, mixedshrub/grassland, and barren/sparsely vegetated land, respec-tively. An updated value ofu∗t is then calculated using thefollowing empirical formula (Fecan et al., 1999):
u∗t = u∗tI
[1+ 121
(max(w−w′, 0)
)0.68]0.5
(2)
wherew is the gravimetric soil moisture (kg kg−1) andw′ isthe threshold gravimetric soil moisture and determined by thefollowing empirical formulations (Fecan et al., 1999; Zenderet al., 2003):
w = θρw/ρp,d (3)
ρp,d = ρp(1.0− θs) (4)
θs = 0.489− 0.126Msand (5)
w′
= 14M2clay+ 17Mclay (6)
where θ is the volumetric soil moisture (m3 m−3)
from the National Centers for Environmental Prediction(NCEP)/National Center for Atmospheric Research (NCAR)reanalysis data,ρw = 1000 kg m−3 is the density of water,ρp = 2600 kg m−3 is the mean soil particle density,ρp,d isthe bulk density of dry soil,θs is volumetric saturation soilmoisture (m3 m−3), andMsandandMclay are the mass frac-tions of sand and clay, respectively, in the soil.
The dust emission parameterization of Zender et al. (2003)has been extensively used in global modeling studies (e.g.,Liao and Seinfeld, 2005; Fairlie et al., 2007, 2010; Nowot-tnick et al., 2010). In this scheme,Qs (g m−1 s−1) is ex-pressed as a function ofu∗ andu∗t according to the theoryof Kawamura (1964) and White (1979). The formulas are asfollows:
Qs = EFcsρu3
∗
g
(1−
u2∗t
u2∗
)(1+
u∗t
u∗
)H (7)
wherecs is an empirical constant with a value of 2.61,ρ isthe atmospheric density, andg is acceleration of gravity. Dif-ferent from the Westphal scheme,u∗tI is determined by thesemi-empirical relationship of Iversen and White (1982):
Atmos. Chem. Phys., 12, 10209–10237, 2012 www.atmos-chem-phys.net/12/10209/2012/

K. Wang et al.: Dust emission and chemistry – the CMAQ modeling system 10213
u∗tI(D) =
[0.1666681ρpgD
1.928Re0.0922∗t − 1
(1+
6× 10⁻⁷
ρpgD2.5
)]1/2
ρ−1/2
when 0.03≤ Re∗t ≤ 10 (8)
u∗tI(D) =
[0.0144ρpgD
(1− 0.0858e−0.0617(Re∗t−10)
)(
1+6× 10⁻⁷
ρpgD2.5
)]1/2
ρ−1/2 when Re∗t>10 (9)
whereρp is the mean soil particle density,D is the average di-ameter of saltation particles and is assumed to be the optimalparticle size,D0 ≈ 75 µm, under typical conditions on Earth(Zender et al., 2003).Re∗t is the threshold friction Reynoldsnumber and is estimated using an empirical expression intro-duced by Marticorena and Bergametti (1995):
Re∗t = 1331D1.56+ 0.38 (10)
Following Zender et al. (2003),Re∗t is assumed to be a fixedvalue due to a constant value ofD (i.e., 75 µm) in this study.An updated spatially varied value ofu∗t is calculated basedonu∗tI from Eqs. (8)–(9) and Eqs. (2)–(6) accounting for theeffects of soil moisture. The horizontal saltation mass fluxQs is then converted to a vertical dust mass fluxFd (the finaldust flux in the Zender scheme and in units of g m−2 s−1) by
Fd = T × S × α × Qs (11)
where T is a global tuning factor and is set to beT =
7.0 × 10⁻⁴, following Zender et al. (2003),S is the “sourceerodibility” factor with values from 0 to 1 from the databaseprovided by Ginoux et al. (2001) and confines dust emissionsto topographic depressions in desert and semi-desert areas ofthe world.α is the sandblasting mass efficiency in the unitof m−1 that converts horizontal mass flux to vertical dustflux and empirically parameterized based on Marticorena andBergametti (1995):
α = 100e[(13.4×min(Mclay,0.2)−6.0)×ln10] (12)
whereMclay is the mass fraction of clay particles in parentsoil.
The soil texture data used for both schemes are takenfrom the US State Soil Geographic (STATSGO)/Food andAgriculture Organization of the United Nations (FAO) soildatabase with a 1-km grid resolution.u∗ directly comes froma meteorological model. The land use data used in this studyare the dominant land use category in each grid cell. Thisinformation is taken from the USGS dataset at a 1-km gridresolution and is gridded to the domain in this study usingthe WRF Preprocessing System (WPS) utility. The simulatedsnow cover and precipitation data are used for determiningwhether the dust emissions will be generated over each grid
cell of the simulation domain. Nickovic et al. (2001) haveclassified the particle sizes of mineral dust into four cate-gories based on the contents of clay, small silt, large silt, andsand. Only the first two types, clay and small silt, are con-sidered as PM10. In this way, the dust flux generated fromEqs. (1) and (11) is further multiplied by a fraction, which isbased on the STATSGO soil texture data to approximate thefluxes of dust PM10 in a given grid cell (Choi and Fernando,2008). According to Midwest Research Institute (2005), thePM2.5/PM10 ratio for typical fugitive dust sources is 0.1, sothe fluxes of dust PM2.5 can be obtained by multiplying thefluxes of dust PM10 by 0.1.
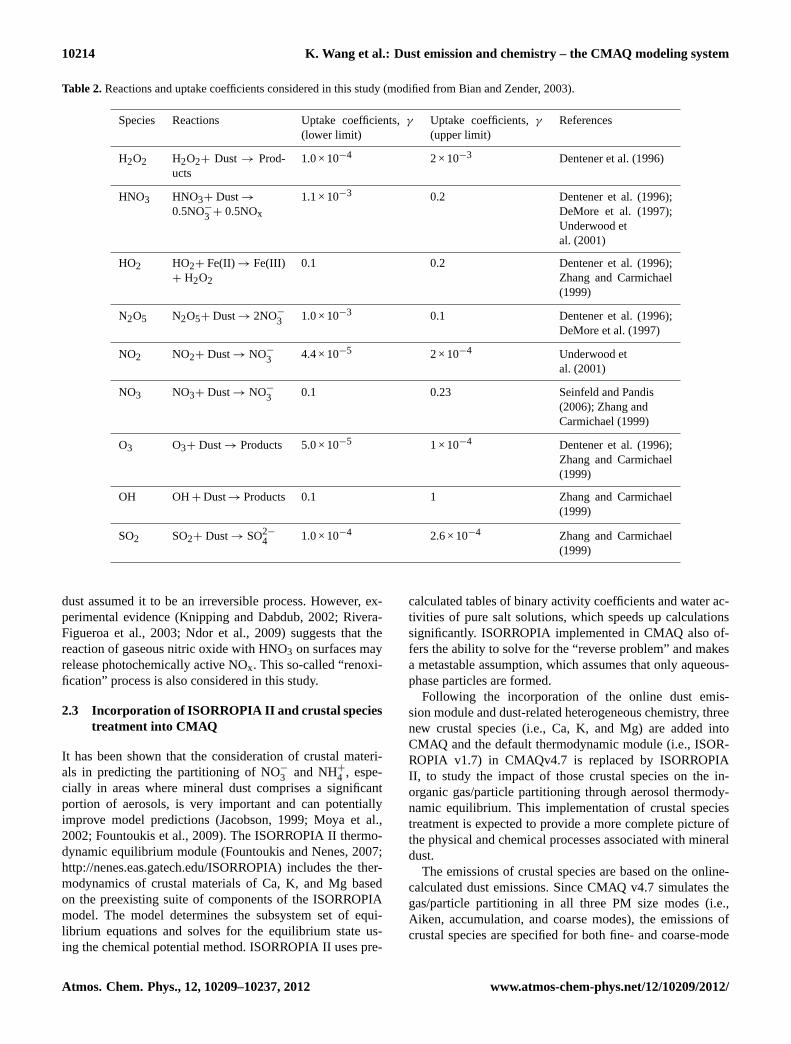
2.2 Heterogeneous chemistry on the surface of dustparticles
Table 2 presents the nine heterogeneous reactions assumedto occur on the surfaces of dust. Absorption and heteroge-neous reactions of gases on the surfaces of dust are assumedto be irreversible (Zhang and Carmichael, 1999). Followingthe method of Schwartz (1986), the uptake of gases onto themineral dust particles is defined by a pseudo-first-order het-erogeneous rate constantKi (s−1) for speciesi as follows:
Ki =
(dp
2Di
+4
νiγi
)−1
Sp (13)
wheredp is the dust particle diameter (m),Di is the gas-phase molecular diffusion coefficient for speciesi (m2 s−1),νi is the mean molecular velocity of speciesi (m s−1), Spis the surface area density of dust particles (m2 m−3) andis determined from CMAQ simulation, andγi is the uptakecoefficient for speciesi. The uptake coefficients are largelybased on the work of Bian and Zender (2003) and summa-rized in Table 2. The uncertainties inγi are very large and canbe more than three orders of magnitude for certain species(Zhang and Carmichael, 1999; Bian and Zender, 2003). Forexample, some studies have reported the values ofγ rang-ing from 2.0 × 10⁻⁶ to 2.5 × 10⁻³ for O3 and from 2.0 × 10⁻⁶
to 1.6 × 10⁻² for HNO3 (Goodman et al., 2000; Underwoodet al., 2001; Michel et al., 2002). Two sets ofγ values rep-resenting the lower and upper limit values, respectively, asshown in Table 2 are therefore tested in this study based onpublished values (Zhang and Carmichael, 1999; Bian andZender, 2003; Zhu et al., 2010). A recent work by Crowlyet al. (2010) also recommended several uptake coefficientsof species on dust particles treated in this study, most ofwhich are smaller than the lower limit (e.g., O3, NO2, NO3,and SO2) or between the lower and upper limits (e.g., H2O2and N2O5) that are tested in this work. Consequently, theuptake coefficients recommended by Crowly et al. (2010)would lead to much less surface uptake and loss for mostgaseous species and thus less production of SO2−
4 and NO−
3 ,as compared to the upper limit values used in this work.Most previous studies considering the uptake of HNO3 onto
www.atmos-chem-phys.net/12/10209/2012/ Atmos. Chem. Phys., 12, 10209–10237, 2012
10214 K. Wang et al.: Dust emission and chemistry – the CMAQ modeling system
Table 2.Reactions and uptake coefficients considered in this study (modified from Bian and Zender, 2003).
Species Reactions Uptake coefficients,γ
(lower limit)Uptake coefficients,γ(upper limit)
References
H2O2 H2O2+ Dust → Prod-ucts
1.0 × 10⁻⁴ 2 × 10⁻³ Dentener et al. (1996)
HNO3 HNO3+ Dust→0.5NO−
3 + 0.5NOx
1.1 × 10−3 0.2 Dentener et al. (1996);DeMore et al. (1997);Underwood etal. (2001)
HO2 HO2+ Fe(II) → Fe(III)+ H2O2
0.1 0.2 Dentener et al. (1996);Zhang and Carmichael(1999)
N2O5 N2O5+ Dust→ 2NO−
3 1.0 × 10⁻³ 0.1 Dentener et al. (1996);DeMore et al. (1997)
NO2 NO2+ Dust→ NO−
3 4.4 × 10⁻⁵ 2 × 10⁻⁴ Underwood etal. (2001)
NO3 NO3+ Dust→ NO−
3 0.1 0.23 Seinfeld and Pandis(2006); Zhang andCarmichael (1999)
O3 O3+ Dust→ Products 5.0 × 10⁻⁵ 1 × 10⁻⁴ Dentener et al. (1996);Zhang and Carmichael(1999)
OH OH+ Dust→ Products 0.1 1 Zhang and Carmichael(1999)
SO2 SO2+ Dust→ SO2−
4 1.0 × 10⁻⁴ 2.6 × 10⁻⁴ Zhang and Carmichael(1999)
dust assumed it to be an irreversible process. However, ex-perimental evidence (Knipping and Dabdub, 2002; Rivera-Figueroa et al., 2003; Ndor et al., 2009) suggests that thereaction of gaseous nitric oxide with HNO3 on surfaces mayrelease photochemically active NOx. This so-called “renoxi-fication” process is also considered in this study.
2.3 Incorporation of ISORROPIA II and crustal speciestreatment into CMAQ
It has been shown that the consideration of crustal materi-als in predicting the partitioning of NO−3 and NH+
4 , espe-cially in areas where mineral dust comprises a significantportion of aerosols, is very important and can potentiallyimprove model predictions (Jacobson, 1999; Moya et al.,2002; Fountoukis et al., 2009). The ISORROPIA II thermo-dynamic equilibrium module (Fountoukis and Nenes, 2007;http://nenes.eas.gatech.edu/ISORROPIA) includes the ther-modynamics of crustal materials of Ca, K, and Mg basedon the preexisting suite of components of the ISORROPIAmodel. The model determines the subsystem set of equi-librium equations and solves for the equilibrium state us-ing the chemical potential method. ISORROPIA II uses pre-
calculated tables of binary activity coefficients and water ac-tivities of pure salt solutions, which speeds up calculationssignificantly. ISORROPIA implemented in CMAQ also of-fers the ability to solve for the “reverse problem” and makesa metastable assumption, which assumes that only aqueous-phase particles are formed.
Following the incorporation of the online dust emis-sion module and dust-related heterogeneous chemistry, threenew crustal species (i.e., Ca, K, and Mg) are added intoCMAQ and the default thermodynamic module (i.e., ISOR-ROPIA v1.7) in CMAQv4.7 is replaced by ISORROPIAII, to study the impact of those crustal species on the in-organic gas/particle partitioning through aerosol thermody-namic equilibrium. This implementation of crustal speciestreatment is expected to provide a more complete picture ofthe physical and chemical processes associated with mineraldust.
The emissions of crustal species are based on the online-calculated dust emissions. Since CMAQ v4.7 simulates thegas/particle partitioning in all three PM size modes (i.e.,Aiken, accumulation, and coarse modes), the emissions ofcrustal species are specified for both fine- and coarse-mode
Atmos. Chem. Phys., 12, 10209–10237, 2012 www.atmos-chem-phys.net/12/10209/2012/

K. Wang et al.: Dust emission and chemistry – the CMAQ modeling system 10215
dust. Ten percent of the emitted crustal species are assumedto be in accumulation mode and 90 % are in coarse mode(Midwest Research Institute, 2005). In the model, crustalspecies are also treated spatially uniformed, which meansall emissions of the crustal species are proportional to thoseof dust because of the lack of information on the chemi-cal composition and mineralogy of dust particles. The emis-sion ratio between crustal species and dust is assumed to be1.022 × 10−3, 1.701 × 10⁻³, and 7.08 × 10⁻⁴ for K, Ca, andMg, respectively, based on Van Pelt and Zobeck (2007).
3 Model configurations and evaluation protocols
CMAQ-Dust is applied to the April 2001 dust episode dur-ing which frequent intercontinental transport and severe duststorms occurred (Jaffe et al., 2003; Wang et al., 2009).CMAQ v4.7 reflects a number of major updates to improvethe underlying science from older versions (e.g., CMAQ v4.4used by the previous ICAP study conducted by Wang etal., 2009). These enhancements include inclusion of coarse-mode aerosol chemistry (Pilinis et al., 2000; Capaldo et al.,2000); addition of the new gas-chemistry mechanism, i.e.,the Carbon Bond Mechanism version 2005 (CB05) and as-sociated Euler backward iterative (EBI) solver; incorporationof online sea salt emission module; update on aerosol dry de-position algorithm; enhancement of SOA module by consid-ering SOA products from isoprene, sesquiterpene, etc.; mod-ification of the calculation of heterogeneous N2O5 reactionprobability to be a function of temperature, relative humid-ity, and aerosol compositions.
The modeling domain is the same as the ICAP domain,which includes Eastern Asia, North America, Northern Pa-cific Ocean, and Western Atlantic Ocean with several ac-tive dust source regions (Western India, Northwest/CentralChina, and the Western US). The horizontal grid resolutionis 108 km, and vertical resolution includes 16 layers fromthe surface to approximately 100 hPa (at∼ 16 km) with afiner spacing within the planetary boundary layer (PBL) and∼ 40 m for the first model layer height. The meteorologicalfield is generated by Weather Research & Forecasting Model(WRF) version 3.2 with the analysis four-dimensional dataassimilation (FDDA). The physical/chemical options usedfor the WRF/CMAQ-Dust simulation include Yonsei Uni-versity (YSU) PBL scheme (Hong et al., 2006), thermal dif-fusion land surface parameterization scheme (Dubia, 1996),Grell 3-D ensemble cumulus cloud scheme (Grell and De-venyi, 2002), WRF Single Moment (WSM) 6-class grau-pel microphysics parameterization scheme (Hong and Lim,2006), the Goddard shortwave radiation scheme (Chou andSuarez, 1994), the Rapid Radiative Transfer Model (RRTM)longwave radiation scheme (Mlawer et al., 1997), CB05 gas-phase chemistry mechanism (Yarwood et al., 2005), andAERO5 aerosol mechanism (Roselle et al., 2008). The ini-tial/boundary conditions (IBC) for WRF simulation are from
the NCEP/NCAR Final Analysis (FNL) dataset. We havealso conducted some sensitivity WRF simulations with otherphysical options or IBC (e.g., Community Climate SystemModel (CCSM) dataset). The above options and the FNLdataset with nudging give the best overall model performanceand thus are used in the final simulations as described inTable 3. The WRF hourly outputs are converted to CMAQcompatible meteorological inputs with the Meteorology-Chemistry Interface Processor (MCIP) version 3.5.
The emissions for anthropogenic sources are obtainedfrom Wang et al. (2009). The emission data for the USare based on the National Emissions Inventory (NEI) 1999version 1. The emission inventory for Mexico is preparedfrom the Big Bend Regional Aerosol and Visibility Obser-vational Study (BRAVO) 1999 database. For Canada, the1995 area and mobile (on-road and non-road) source inven-tory is used. The emission inventory in Asia is generatedfrom the Transport and Chemical Evolution over the Pacific(TRACE-P) and the Aerosol Characterization Experiment-Asia (ACE-Asia) datasets (Streets et al., 2003). The bio-genic emissions are prepared using the Biogenic EmissionsInventory System (BEIS) version 3.9 with Biogenic Emis-sions Land cover Database version 3 (BELD3) data (ICAP,2005). Emissions from continuously emitting volcanoes arealso included based on the Global Emissions Inventory Ac-tivity (GEIA). The sea salt and dust emissions are generatedonline using the method from Zhang et al. (2005) and the onedeveloped by this study, respectively. The IBC for chemicalspecies are taken from GEOS-Chem (Park et al., 2004).
To investigate the impacts of dust, a total of ten 1-month(April 2001) simulations are conducted, as listed in Ta-ble 3 (note that the Zender scheme is used for all sim-ulations except for the simulation DUSTW). These sim-ulations are designed to examine the differences betweentwo dust schemes (i.e., DUST vs. DUSTW), and to un-derstand the individual impacts of crustal species treatmentin ISORROPIA II in the absence and presence of heteroge-neous chemistry (i.e., the simulation CRUSTONLY vs. thesimulation DUSTEMIS ONLY; DUST vs. DUSTISO1.7),heterogeneous chemistry on the surface of dust (i.e., thesimulation DUST vs. the simulation CRUSTONLY), andtheir combined impacts (the simulation DUST vs. the sim-ulation BASELINENO DUST); the uncertainties in ma-jor parameters (e.g., the impact of the fraction of erodi-ble lands for dust emissions by comparing DUSTHIGH EFvs. DUST; the impact of uptake coefficients by compar-ing DUST HIGH UPTAKE vs. DUST); the impact of Asiananthropogenic emissions on the US air quality (DUSTvs. DUSTNO ASIA EMIS); and the impact of improvedaerosol treatments on the model performance (e.g., DUSTvs. DEFAULT CMAQ v4.7).
The model evaluation for meteorological and chemicalvariables is conducted using the same protocols as intro-duced in Wang et al. (2009). The statistical measures usedhere include the mean bias (MB), correlation coefficient (R),
www.atmos-chem-phys.net/12/10209/2012/ Atmos. Chem. Phys., 12, 10209–10237, 2012

10216 K. Wang et al.: Dust emission and chemistry – the CMAQ modeling system
Table 3.Simulation design and purposes.
Run Index Model Configuration Purpose
DEFAULT CMAQ v4.7 WRF v3.2 and default CMAQ v4.7(uses ISORROPIA 1.7) but without anydust treatments
Performance comparison with MM5/CMAQ v4.4 ofWang et al. (2009)
BASELINE NO DUST Same as DEFAULT CMAQ v4.7 butwith ISORROPIA II
Serves as a baseline run for the run DUST
DUST EMIS ONLY Same as BASELINENO DUST butwith dust emissions only
Serves as a baseline run for the run CRUSTONLY
CRUSTONLY Same as BASELINENO DUST butwith dust emission and crustal speciestreatment
Differences between CRUSTONLY andDUST EMIS ONLY indicate the effect of crustalspecies treatment only (see Figs. 4 and 5); serves as abaseline for DUSTHIGH UPTAKE
DUST Same as BASELINENO DUST butwith all dust treatments (emissions,crustal species treatment, and hetero-geneous chemistry using lower limitγ
values)
Performance comparison with BASELINENO DUST;differences between DUST and CRUSTONLY repre-sent a lower bound of the effect of dust heterogeneouschemistry (see Fig. 7); differences between DUST andBASELINE NO DUST represent a lower bound of dusteffect with all dust treatments (see Figs. 8–10)
DUST W Same as DUST but with the Westphaldust scheme
Performance comparison with DUST (see Table 4 andFig. 3)
DUST HIGH UPTAKE Same as DUST but using upper limitγ
valuesDifferences between DUSTHIGH UPTAKE andCRUSTONLY represent an upper bound of the effectof dust heterogeneous chemistry (see Fig. 7)
DUST ISO1.7 Same as DUST but with ISORROPIA1.7
Differences between DUST and DUSTISO1.7 indicatethe effect of crustal species treatment when dust hetero-geneous chemistry is treated (see Fig. 6 )
DUST HIGH EF Same as DUST but withEF = 1.0 Differences between DUSTHIGH EF and BASE-LINE NO DUST represent an upper bound of dust ef-fect with higher dust emissions and all dust treatments(see Figs. 8–10)
DUST NO ASIA EMIS Same as DUST but without Asiananthropogenic emissions
Differences between DUST andDUST NO ASIA EMIS indicate the impact ofAsian anthropogenic emissions on the US air quality(see Fig. 11)
the normalized mean bias (NMB), the normalized mean er-ror (NME), and the root-mean-square error (RMSE) (Zhanget al., 2006). The WRF v3.2 simulation results are eval-uated against the observational data from the Clean AirStatus and Trends Network (CASTNET), the SpeciationTrends Network (STN), and the National Acid DepositionProgram (NADP) over the US and the National ClimateData Center (NCDC) of NOAA over China. Dust emis-sion schemes are evaluated against measurements of dustconcentrations from ten surface sites of Asia compiled byCheng et al. (2008) and also measurements of AOD at foursites from the NASA’s ground-based Aerosol Robotic Net-work (AERONET; http://aeronet.gsfc.nasa.gov/). Chemicalpredictions of CMAQ-Dust are evaluated against the avail-
able ground- and satellite-based measurements. Surface ob-servational data include those from the CASTNET, the Inter-agency Monitoring of Protected Visual Environments (IM-PROVE), STN, the Aerometric Information Retrieval Sys-tem (AIRS)-Air Quality System (AQS), the SoutheasternAerosol Research and Characterization study (SEARCH)over the US; those from the National Environmental Mon-itoring Centre of China (NEMCC) over China, and chemi-cal data from the National Institute for Environmental Stud-ies (NIES) over Japan. Satellite column data include tropo-spheric carbon monoxide (CO) columns from the Measure-ments of Pollution in the Troposphere (MOPITT) (Deeteret al., 2003), tropospheric nitrogen dioxide (NO2) columnfrom the Global Ozone Monitoring Experiment (GOME)
Atmos. Chem. Phys., 12, 10209–10237, 2012 www.atmos-chem-phys.net/12/10209/2012/

K. Wang et al.: Dust emission and chemistry – the CMAQ modeling system 10217
Table 4.The comparison of monthly mean surface dust concentration (mg m−3) between observations and simulations for April 2001. Theobservational data were compiled by Cheng et al. (2008). The simulations DUST, DUSTW, and DUSTHIGH EF are defined in Table 3.
Site Location Latitude Longitude Obs. DUST DUSTW DUST HIGH EF
Lanzhou – China 36.05 103.88 0.305 0.163 0.154 0.313Shapotou – China 37.50 105.00 0.370 0.220 0.215 0.429Changwu – China 35.02 107.68 0.211 0.153 0.116 0.281Zhenbeitai – China 38.29 109.70 0.209 0.203 0.138 0.389Inner Mongolia – China 42.67 115.95 0.447 0.095 0.050 0.178Beijing – China 39.93 116.35 0.206 0.114 0.078 0.188Gosan – South Korea 33.29 126.16 0.052 0.034 0.030 0.049Seoul – South Korea 37.53 127.07 0.093 0.045 0.042 0.057Nagoya – Japan 35.15 136.96 0.038 0.021 0.021 0.027Tsukuba – Japan 36.06 140.14 0.036 0.019 0.019 0.023
Average 0.197 0.107 0.086 0.193
(Burrows et al., 1999), tropospheric O3 residuals (TORs)from the Total Ozone Mapping Spectrometer (TOMS) andthe Solar Backscattered Ultraviolet (SBUV) (Fishman etal., 2003), and AOD from the Moderate Resolution Imag-ing Spectroradiometer (MODIS) (Remer et al., 2005). Moreinformation about observations can be found in Wang etal. (2009).
The AOD calculations follow the method introduced byRoy (2007) using an empirical equation of Malm et al. (1994)and are further improved by considering the contributionsfrom sea salts, dust, and other coarse-mode particles in thisstudy. The scattering coefficientσsp is calculated as follows:
σsp=σSO4sp +σ
NO3sp +σOC
sp +σBCsp +σ
NH4sp +σNa
sp +σClsp+σFS
sp +σCMsp
={[SO4]×αSO4sp +[NO3]×α
NO3sp +[OC]×αOC
sp +[BC]×αBCsp
+[NH4] ×αNH4sp + [Na] ×αNa
sp + [Cl] ×αClsp}
×f (RH)/1.0× 106+ {[FS] ×αFS
sp + [CM] ×αCMsp }/1.0× 106
(14)
where σSO4sp , σ
NO3sp , σOC
sp , σBCsp , σ
NH4sp , σNa
sp , σClsp , σFS
sp ,
and σCMsp are the scattering coefficients for SO2−
4 , NO−
3 ,
OC, BC, NH+
4 , Na+, and Cl− in the PM2.5 size sec-tion, fine-mode soil including dust and other inorganicaerosols, and coarse masses including coarse-mode dust,sea-salt, and other aerosols, respectively, and the brack-ets in the above equation indicate the mass concentrationin µg m−3. The values for specific scattering coefficients(αi
sp) for speciesi areαSO4sp = α
NO3sp = αOC
sp = αNH4sp = αNa
sp =
αClsp = 5.0 m2 g−1, αBC
sp = 3.0 m2 g−1, αFSsp = 1.0 m2 g−1, and
αCMsp = 0.6 m2 g−1 (Malm et al., 1994).f (RH) accounts for
the effect of relative humidity on scattering due to deli-quescence and is assumed to be 2.3 in this study followingChameides et al. (2002).
4 Model evaluation
4.1 Evaluation of meteorological variables
Table 5 summarizes the statistical performance of 2-m tem-perature (T2), 2-m water vapor mixing ratio (Q2) or rela-tive humidity (RH2), precipitation (Precip), 10-m wind speed(WS10) and wind direction (WD10), andU andV compo-nents of WS10 (i.e., U10 and V10) over different networks inChina and the US in April 2001. Figures S-1 and S-2 in theSupplement show the spatial plots of NMBs between obser-vations and MM5/WRF simulations for T2, Q2 or RH2, Pre-cip, and WS10 over China and the US, respectively. WRFgenerally underpredicts T2 over China with domain-wideNMB of −20.6 %, especially over the Northern and West-ern China where NMBs of−40 % to−100 % occur. Someoverpredictions occur in the Southwestern China. The poorT2 predictions over the Western China are likely due to thepoor representation of steep terrains at a coarse grid resolu-tion (Wang et al., 2009). The predictions of T2 over the UShave low domain-wide biases with NMBs of 4.9 % (CAST-NET) and−4.2 % (STN) with small overpredictions overthe Northeastern US and moderate to large underpredictionsover the Western US. The discrepancies arise from severalfactors, including the slow responses of deep soil tempera-tures to synoptic-scale changes in air temperatures, the lim-itations of the PBL and land-surface schemes currently usedin meteorological models in accurately simulating the air-land heat fluxes (Gilliam et al., 2006), the limitation of Dud-hia (1989) radiation scheme in simulating the longwave radi-ation, as well as the inability to resolve subgrid meteorolog-ical phenomena (Wang et al., 2009). The correlation coeffi-cients for T2 are very high over all networks with R-values of0.88 for CASTNET, 0.87 for STN, and 0.87 for NCDC, re-spectively. For Q2 or RH2, the model also performs well interms of both spatial distribution and statistical performance.The domain-wide average NMBs are 8.1 % for Q2 against
www.atmos-chem-phys.net/12/10209/2012/ Atmos. Chem. Phys., 12, 10209–10237, 2012
10218 K. Wang et al.: Dust emission and chemistry – the CMAQ modeling system
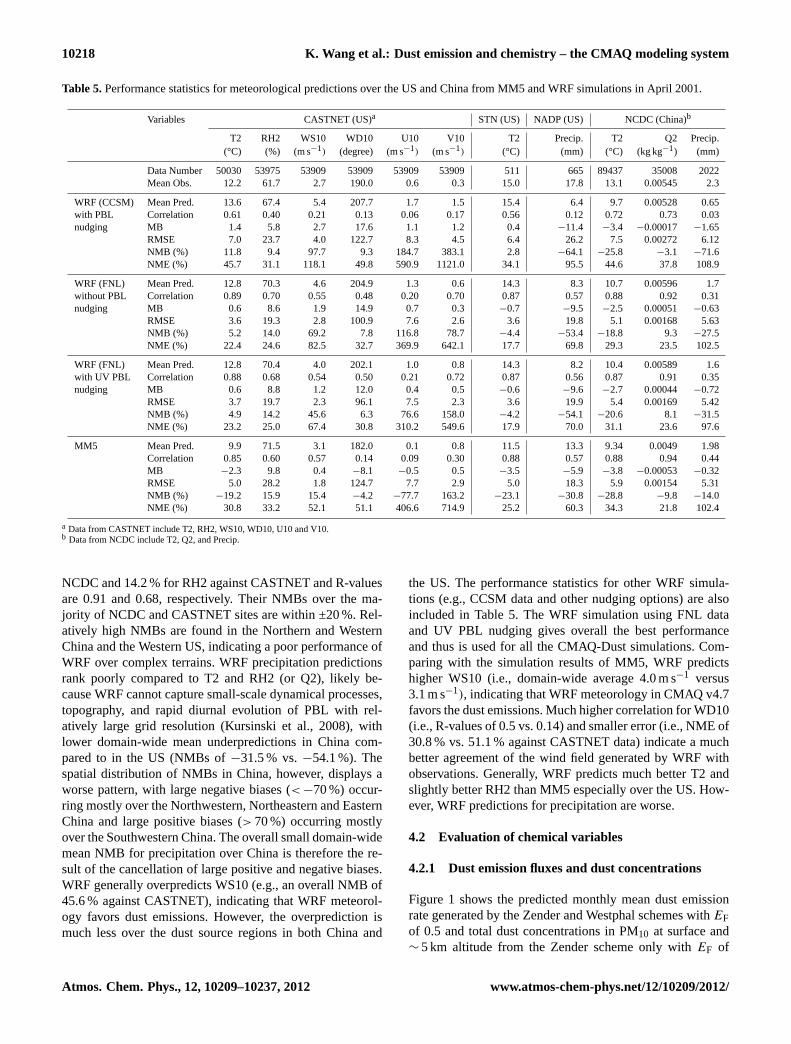
Table 5.Performance statistics for meteorological predictions over the US and China from MM5 and WRF simulations in April 2001.
Variables CASTNET (US)a STN (US) NADP (US) NCDC (China)b
T2 RH2 WS10 WD10 U10 V10 T2 Precip. T2 Q2 Precip.(°C) (%) (m s−1) (degree) (m s−1) (m s−1) (°C) (mm) (°C) (kg kg−1) (mm)
Data Number 50030 53975 53909 53909 53909 53909 511 665 89437 35008 2022Mean Obs. 12.2 61.7 2.7 190.0 0.6 0.3 15.0 17.8 13.1 0.00545 2.3
WRF (CCSM) Mean Pred. 13.6 67.4 5.4 207.7 1.7 1.5 15.4 6.4 9.7 0.00528 0.65with PBL Correlation 0.61 0.40 0.21 0.13 0.06 0.17 0.56 0.12 0.72 0.73 0.03nudging MB 1.4 5.8 2.7 17.6 1.1 1.2 0.4 −11.4 −3.4 −0.00017 −1.65
RMSE 7.0 23.7 4.0 122.7 8.3 4.5 6.4 26.2 7.5 0.00272 6.12NMB (%) 11.8 9.4 97.7 9.3 184.7 383.1 2.8 −64.1 −25.8 −3.1 −71.6NME (%) 45.7 31.1 118.1 49.8 590.9 1121.0 34.1 95.5 44.6 37.8 108.9
WRF (FNL) Mean Pred. 12.8 70.3 4.6 204.9 1.3 0.6 14.3 8.3 10.7 0.00596 1.7without PBL Correlation 0.89 0.70 0.55 0.48 0.20 0.70 0.87 0.57 0.88 0.92 0.31nudging MB 0.6 8.6 1.9 14.9 0.7 0.3 −0.7 −9.5 −2.5 0.00051 −0.63
RMSE 3.6 19.3 2.8 100.9 7.6 2.6 3.6 19.8 5.1 0.00168 5.63NMB (%) 5.2 14.0 69.2 7.8 116.8 78.7 −4.4 −53.4 −18.8 9.3 −27.5NME (%) 22.4 24.6 82.5 32.7 369.9 642.1 17.7 69.8 29.3 23.5 102.5
WRF (FNL) Mean Pred. 12.8 70.4 4.0 202.1 1.0 0.8 14.3 8.2 10.4 0.00589 1.6with UV PBL Correlation 0.88 0.68 0.54 0.50 0.21 0.72 0.87 0.56 0.87 0.91 0.35nudging MB 0.6 8.8 1.2 12.0 0.4 0.5 −0.6 −9.6 −2.7 0.00044 −0.72
RMSE 3.7 19.7 2.3 96.1 7.5 2.3 3.6 19.9 5.4 0.00169 5.42NMB (%) 4.9 14.2 45.6 6.3 76.6 158.0 −4.2 −54.1 −20.6 8.1 −31.5NME (%) 23.2 25.0 67.4 30.8 310.2 549.6 17.9 70.0 31.1 23.6 97.6
MM5 Mean Pred. 9.9 71.5 3.1 182.0 0.1 0.8 11.5 13.3 9.34 0.0049 1.98Correlation 0.85 0.60 0.57 0.14 0.09 0.30 0.88 0.57 0.88 0.94 0.44MB −2.3 9.8 0.4 −8.1 −0.5 0.5 −3.5 −5.9 −3.8 −0.00053 −0.32RMSE 5.0 28.2 1.8 124.7 7.7 2.9 5.0 18.3 5.9 0.00154 5.31NMB (%) −19.2 15.9 15.4 −4.2 −77.7 163.2 −23.1 −30.8 −28.8 −9.8 −14.0NME (%) 30.8 33.2 52.1 51.1 406.6 714.9 25.2 60.3 34.3 21.8 102.4
a Data from CASTNET include T2, RH2, WS10, WD10, U10 and V10.b Data from NCDC include T2, Q2, and Precip.
NCDC and 14.2 % for RH2 against CASTNET and R-valuesare 0.91 and 0.68, respectively. Their NMBs over the ma-jority of NCDC and CASTNET sites are within ±20 %. Rel-atively high NMBs are found in the Northern and WesternChina and the Western US, indicating a poor performance ofWRF over complex terrains. WRF precipitation predictionsrank poorly compared to T2 and RH2 (or Q2), likely be-cause WRF cannot capture small-scale dynamical processes,topography, and rapid diurnal evolution of PBL with rel-atively large grid resolution (Kursinski et al., 2008), withlower domain-wide mean underpredictions in China com-pared to in the US (NMBs of−31.5 % vs.−54.1 %). Thespatial distribution of NMBs in China, however, displays aworse pattern, with large negative biases (< −70 %) occur-ring mostly over the Northwestern, Northeastern and EasternChina and large positive biases (> 70 %) occurring mostlyover the Southwestern China. The overall small domain-widemean NMB for precipitation over China is therefore the re-sult of the cancellation of large positive and negative biases.WRF generally overpredicts WS10 (e.g., an overall NMB of45.6 % against CASTNET), indicating that WRF meteorol-ogy favors dust emissions. However, the overprediction ismuch less over the dust source regions in both China and
the US. The performance statistics for other WRF simula-tions (e.g., CCSM data and other nudging options) are alsoincluded in Table 5. The WRF simulation using FNL dataand UV PBL nudging gives overall the best performanceand thus is used for all the CMAQ-Dust simulations. Com-paring with the simulation results of MM5, WRF predictshigher WS10 (i.e., domain-wide average 4.0 m s−1 versus3.1 m s−1), indicating that WRF meteorology in CMAQ v4.7favors the dust emissions. Much higher correlation for WD10(i.e., R-values of 0.5 vs. 0.14) and smaller error (i.e., NME of30.8 % vs. 51.1 % against CASTNET data) indicate a muchbetter agreement of the wind field generated by WRF withobservations. Generally, WRF predicts much better T2 andslightly better RH2 than MM5 especially over the US. How-ever, WRF predictions for precipitation are worse.
4.2 Evaluation of chemical variables
4.2.1 Dust emission fluxes and dust concentrations
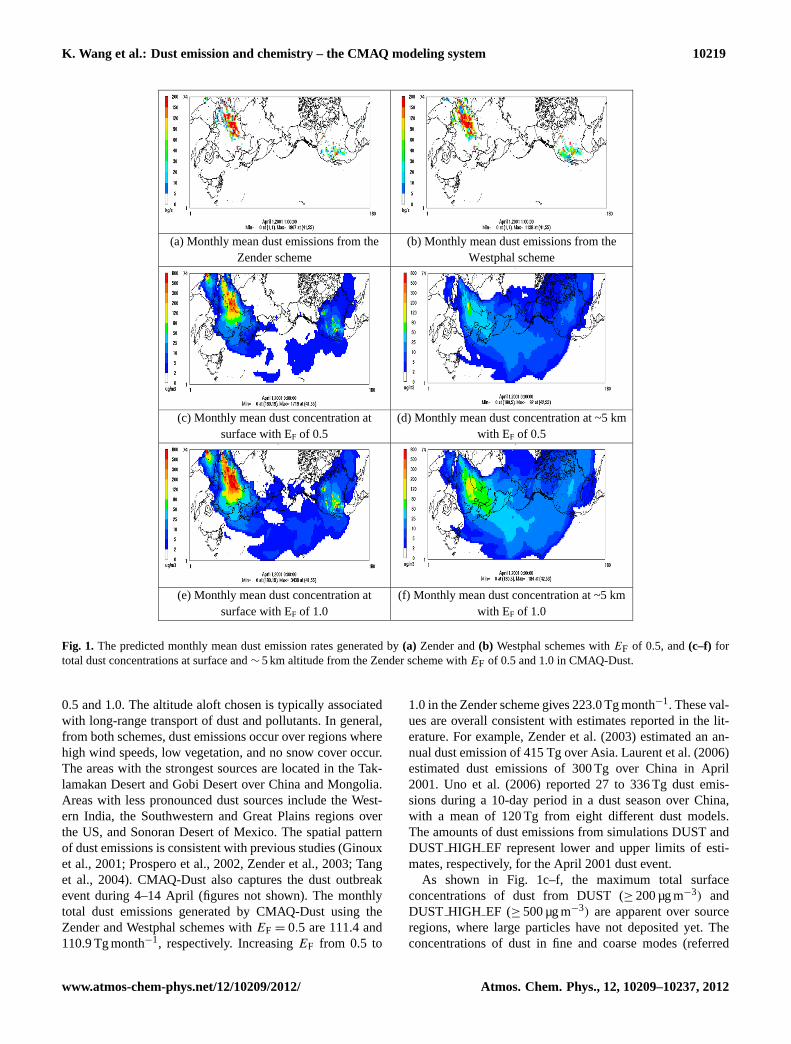
Figure 1 shows the predicted monthly mean dust emissionrate generated by the Zender and Westphal schemes withEFof 0.5 and total dust concentrations in PM10 at surface and∼ 5 km altitude from the Zender scheme only withEF of
Atmos. Chem. Phys., 12, 10209–10237, 2012 www.atmos-chem-phys.net/12/10209/2012/
K. Wang et al.: Dust emission and chemistry – the CMAQ modeling system 10219
(a) Monthly mean dust emissions from the Zender scheme
(b) Monthly mean dust emissions from the Westphal scheme
(c) Monthly mean dust concentration at
surface with EF of 0.5 (d) Monthly mean dust concentration at ~5 km
with EF of 0.5
(e) Monthly mean dust concentration at
surface with EF of 1.0 (f) Monthly mean dust concentration at ~5 km
with EF of 1.0
Fig. 1. The predicted monthly mean dust emission rates generated by(a) Zender and(b) Westphal schemes withEF of 0.5, and(c–f) fortotal dust concentrations at surface and∼ 5 km altitude from the Zender scheme withEF of 0.5 and 1.0 in CMAQ-Dust.
0.5 and 1.0. The altitude aloft chosen is typically associatedwith long-range transport of dust and pollutants. In general,from both schemes, dust emissions occur over regions wherehigh wind speeds, low vegetation, and no snow cover occur.The areas with the strongest sources are located in the Tak-lamakan Desert and Gobi Desert over China and Mongolia.Areas with less pronounced dust sources include the West-ern India, the Southwestern and Great Plains regions overthe US, and Sonoran Desert of Mexico. The spatial patternof dust emissions is consistent with previous studies (Ginouxet al., 2001; Prospero et al., 2002, Zender et al., 2003; Tanget al., 2004). CMAQ-Dust also captures the dust outbreakevent during 4–14 April (figures not shown). The monthlytotal dust emissions generated by CMAQ-Dust using theZender and Westphal schemes withEF = 0.5 are 111.4 and110.9 Tg month−1, respectively. IncreasingEF from 0.5 to
1.0 in the Zender scheme gives 223.0 Tg month−1. These val-ues are overall consistent with estimates reported in the lit-erature. For example, Zender et al. (2003) estimated an an-nual dust emission of 415 Tg over Asia. Laurent et al. (2006)estimated dust emissions of 300 Tg over China in April2001. Uno et al. (2006) reported 27 to 336 Tg dust emis-sions during a 10-day period in a dust season over China,with a mean of 120 Tg from eight different dust models.The amounts of dust emissions from simulations DUST andDUST HIGH EF represent lower and upper limits of esti-mates, respectively, for the April 2001 dust event.
As shown in Fig. 1c–f, the maximum total surfaceconcentrations of dust from DUST (≥ 200 µg m−3) andDUST HIGH EF (≥ 500 µg m−3) are apparent over sourceregions, where large particles have not deposited yet. Theconcentrations of dust in fine and coarse modes (referred
www.atmos-chem-phys.net/12/10209/2012/ Atmos. Chem. Phys., 12, 10209–10237, 2012
10220 K. Wang et al.: Dust emission and chemistry – the CMAQ modeling system
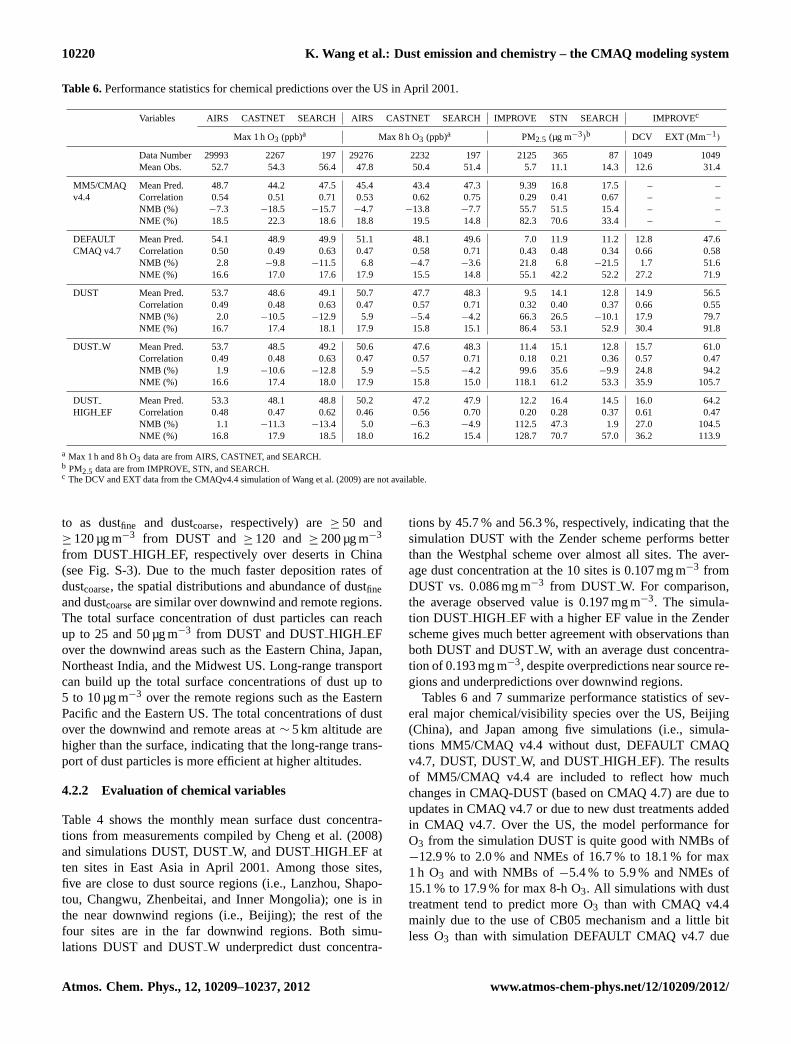
Table 6.Performance statistics for chemical predictions over the US in April 2001.
Variables AIRS CASTNET SEARCH AIRS CASTNET SEARCH IMPROVE STN SEARCH IMPROVEc
Max 1 h O3 (ppb)a Max 8 h O3 (ppb)a PM2.5 (µg m−3)b DCV EXT (Mm−1)
Data Number 29993 2267 197 29276 2232 197 2125 365 87 1049 1049Mean Obs. 52.7 54.3 56.4 47.8 50.4 51.4 5.7 11.1 14.3 12.6 31.4
MM5/CMAQ Mean Pred. 48.7 44.2 47.5 45.4 43.4 47.3 9.39 16.8 17.5 – –v4.4 Correlation 0.54 0.51 0.71 0.53 0.62 0.75 0.29 0.41 0.67 – –
NMB (%) −7.3 −18.5 −15.7 −4.7 −13.8 −7.7 55.7 51.5 15.4 – –NME (%) 18.5 22.3 18.6 18.8 19.5 14.8 82.3 70.6 33.4 – –
DEFAULT Mean Pred. 54.1 48.9 49.9 51.1 48.1 49.6 7.0 11.9 11.2 12.8 47.6CMAQ v4.7 Correlation 0.50 0.49 0.63 0.47 0.58 0.71 0.43 0.48 0.34 0.66 0.58
NMB (%) 2.8 −9.8 −11.5 6.8 −4.7 −3.6 21.8 6.8 −21.5 1.7 51.6NME (%) 16.6 17.0 17.6 17.9 15.5 14.8 55.1 42.2 52.2 27.2 71.9
DUST Mean Pred. 53.7 48.6 49.1 50.7 47.7 48.3 9.5 14.1 12.8 14.9 56.5Correlation 0.49 0.48 0.63 0.47 0.57 0.71 0.32 0.40 0.37 0.66 0.55NMB (%) 2.0 −10.5 −12.9 5.9 −5.4 −4.2 66.3 26.5 −10.1 17.9 79.7NME (%) 16.7 17.4 18.1 17.9 15.8 15.1 86.4 53.1 52.9 30.4 91.8
DUST W Mean Pred. 53.7 48.5 49.2 50.6 47.6 48.3 11.4 15.1 12.8 15.7 61.0Correlation 0.49 0.48 0.63 0.47 0.57 0.71 0.18 0.21 0.36 0.57 0.47NMB (%) 1.9 −10.6 −12.8 5.9 −5.5 −4.2 99.6 35.6 −9.9 24.8 94.2NME (%) 16.6 17.4 18.0 17.9 15.8 15.0 118.1 61.2 53.3 35.9 105.7
DUST Mean Pred. 53.3 48.1 48.8 50.2 47.2 47.9 12.2 16.4 14.5 16.0 64.2HIGH EF Correlation 0.48 0.47 0.62 0.46 0.56 0.70 0.20 0.28 0.37 0.61 0.47
NMB (%) 1.1 −11.3 −13.4 5.0 −6.3 −4.9 112.5 47.3 1.9 27.0 104.5NME (%) 16.8 17.9 18.5 18.0 16.2 15.4 128.7 70.7 57.0 36.2 113.9
a Max 1 h and 8 h O3 data are from AIRS, CASTNET, and SEARCH.b PM2.5 data are from IMPROVE, STN, and SEARCH.c The DCV and EXT data from the CMAQv4.4 simulation of Wang et al. (2009) are not available.
to as dustfine and dustcoarse, respectively) are≥ 50 and≥ 120 µg m−3 from DUST and≥ 120 and≥ 200 µg m−3
from DUST HIGH EF, respectively over deserts in China(see Fig. S-3). Due to the much faster deposition rates ofdustcoarse, the spatial distributions and abundance of dustfineand dustcoarseare similar over downwind and remote regions.The total surface concentration of dust particles can reachup to 25 and 50 µg m−3 from DUST and DUSTHIGH EFover the downwind areas such as the Eastern China, Japan,Northeast India, and the Midwest US. Long-range transportcan build up the total surface concentrations of dust up to5 to 10 µg m−3 over the remote regions such as the EasternPacific and the Eastern US. The total concentrations of dustover the downwind and remote areas at∼ 5 km altitude arehigher than the surface, indicating that the long-range trans-port of dust particles is more efficient at higher altitudes.
4.2.2 Evaluation of chemical variables
Table 4 shows the monthly mean surface dust concentra-tions from measurements compiled by Cheng et al. (2008)and simulations DUST, DUSTW, and DUSTHIGH EF atten sites in East Asia in April 2001. Among those sites,five are close to dust source regions (i.e., Lanzhou, Shapo-tou, Changwu, Zhenbeitai, and Inner Mongolia); one is inthe near downwind regions (i.e., Beijing); the rest of thefour sites are in the far downwind regions. Both simu-lations DUST and DUSTW underpredict dust concentra-
tions by 45.7 % and 56.3 %, respectively, indicating that thesimulation DUST with the Zender scheme performs betterthan the Westphal scheme over almost all sites. The aver-age dust concentration at the 10 sites is 0.107 mg m−3 fromDUST vs. 0.086 mg m−3 from DUST W. For comparison,the average observed value is 0.197 mg m−3. The simula-tion DUST HIGH EF with a higher EF value in the Zenderscheme gives much better agreement with observations thanboth DUST and DUSTW, with an average dust concentra-tion of 0.193 mg m−3, despite overpredictions near source re-gions and underpredictions over downwind regions.
Tables 6 and 7 summarize performance statistics of sev-eral major chemical/visibility species over the US, Beijing(China), and Japan among five simulations (i.e., simula-tions MM5/CMAQ v4.4 without dust, DEFAULT CMAQv4.7, DUST, DUSTW, and DUSTHIGH EF). The resultsof MM5/CMAQ v4.4 are included to reflect how muchchanges in CMAQ-DUST (based on CMAQ 4.7) are due toupdates in CMAQ v4.7 or due to new dust treatments addedin CMAQ v4.7. Over the US, the model performance forO3 from the simulation DUST is quite good with NMBs of−12.9 % to 2.0 % and NMEs of 16.7 % to 18.1 % for max1 h O3 and with NMBs of−5.4 % to 5.9 % and NMEs of15.1 % to 17.9 % for max 8-h O3. All simulations with dusttreatment tend to predict more O3 than with CMAQ v4.4mainly due to the use of CB05 mechanism and a little bitless O3 than with simulation DEFAULT CMAQ v4.7 due
Atmos. Chem. Phys., 12, 10209–10237, 2012 www.atmos-chem-phys.net/12/10209/2012/
K. Wang et al.: Dust emission and chemistry – the CMAQ modeling system 10221
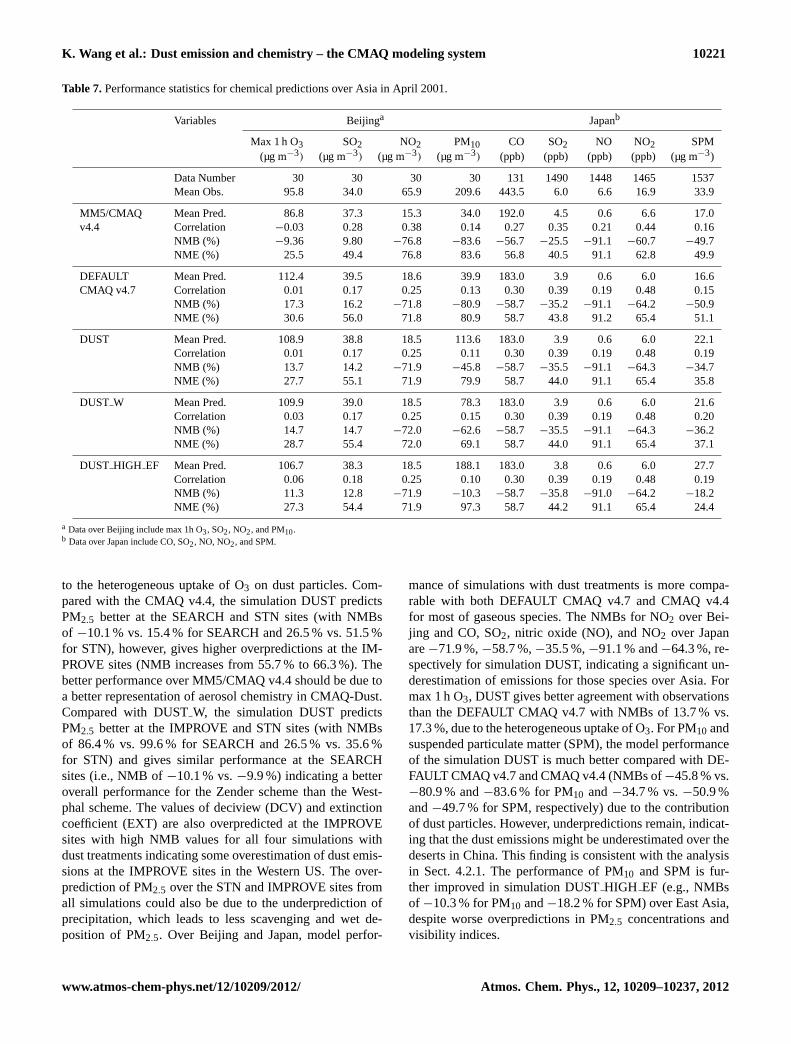
Table 7.Performance statistics for chemical predictions over Asia in April 2001.
Variables Beijinga Japanb
Max 1 h O3 SO2 NO2 PM10 CO SO2 NO NO2 SPM(µg m−3) (µg m−3) (µg m−3) (µg m−3) (ppb) (ppb) (ppb) (ppb) (µg m−3)
Data Number 30 30 30 30 131 1490 1448 1465 1537Mean Obs. 95.8 34.0 65.9 209.6 443.5 6.0 6.6 16.9 33.9
MM5/CMAQ Mean Pred. 86.8 37.3 15.3 34.0 192.0 4.5 0.6 6.6 17.0v4.4 Correlation −0.03 0.28 0.38 0.14 0.27 0.35 0.21 0.44 0.16
NMB (%) −9.36 9.80 −76.8 −83.6 −56.7 −25.5 −91.1 −60.7 −49.7NME (%) 25.5 49.4 76.8 83.6 56.8 40.5 91.1 62.8 49.9
DEFAULT Mean Pred. 112.4 39.5 18.6 39.9 183.0 3.9 0.6 6.0 16.6CMAQ v4.7 Correlation 0.01 0.17 0.25 0.13 0.30 0.39 0.19 0.48 0.15
NMB (%) 17.3 16.2 −71.8 −80.9 −58.7 −35.2 −91.1 −64.2 −50.9NME (%) 30.6 56.0 71.8 80.9 58.7 43.8 91.2 65.4 51.1
DUST Mean Pred. 108.9 38.8 18.5 113.6 183.0 3.9 0.6 6.0 22.1Correlation 0.01 0.17 0.25 0.11 0.30 0.39 0.19 0.48 0.19NMB (%) 13.7 14.2 −71.9 −45.8 −58.7 −35.5 −91.1 −64.3 −34.7NME (%) 27.7 55.1 71.9 79.9 58.7 44.0 91.1 65.4 35.8
DUST W Mean Pred. 109.9 39.0 18.5 78.3 183.0 3.9 0.6 6.0 21.6Correlation 0.03 0.17 0.25 0.15 0.30 0.39 0.19 0.48 0.20NMB (%) 14.7 14.7 −72.0 −62.6 −58.7 −35.5 −91.1 −64.3 −36.2NME (%) 28.7 55.4 72.0 69.1 58.7 44.0 91.1 65.4 37.1
DUST HIGH EF Mean Pred. 106.7 38.3 18.5 188.1 183.0 3.8 0.6 6.0 27.7Correlation 0.06 0.18 0.25 0.10 0.30 0.39 0.19 0.48 0.19NMB (%) 11.3 12.8 −71.9 −10.3 −58.7 −35.8 −91.0 −64.2 −18.2NME (%) 27.3 54.4 71.9 97.3 58.7 44.2 91.1 65.4 24.4
a Data over Beijing include max 1h O3, SO2, NO2, and PM10.b Data over Japan include CO, SO2, NO, NO2, and SPM.
to the heterogeneous uptake of O3 on dust particles. Com-pared with the CMAQ v4.4, the simulation DUST predictsPM2.5 better at the SEARCH and STN sites (with NMBsof −10.1 % vs. 15.4 % for SEARCH and 26.5 % vs. 51.5 %for STN), however, gives higher overpredictions at the IM-PROVE sites (NMB increases from 55.7 % to 66.3 %). Thebetter performance over MM5/CMAQ v4.4 should be due toa better representation of aerosol chemistry in CMAQ-Dust.Compared with DUSTW, the simulation DUST predictsPM2.5 better at the IMPROVE and STN sites (with NMBsof 86.4 % vs. 99.6 % for SEARCH and 26.5 % vs. 35.6 %for STN) and gives similar performance at the SEARCHsites (i.e., NMB of−10.1 % vs.−9.9 %) indicating a betteroverall performance for the Zender scheme than the West-phal scheme. The values of deciview (DCV) and extinctioncoefficient (EXT) are also overpredicted at the IMPROVEsites with high NMB values for all four simulations withdust treatments indicating some overestimation of dust emis-sions at the IMPROVE sites in the Western US. The over-prediction of PM2.5 over the STN and IMPROVE sites fromall simulations could also be due to the underprediction ofprecipitation, which leads to less scavenging and wet de-position of PM2.5. Over Beijing and Japan, model perfor-
mance of simulations with dust treatments is more compa-rable with both DEFAULT CMAQ v4.7 and CMAQ v4.4for most of gaseous species. The NMBs for NO2 over Bei-jing and CO, SO2, nitric oxide (NO), and NO2 over Japanare−71.9 %,−58.7 %,−35.5 %,−91.1 % and−64.3 %, re-spectively for simulation DUST, indicating a significant un-derestimation of emissions for those species over Asia. Formax 1 h O3, DUST gives better agreement with observationsthan the DEFAULT CMAQ v4.7 with NMBs of 13.7 % vs.17.3 %, due to the heterogeneous uptake of O3. For PM10 andsuspended particulate matter (SPM), the model performanceof the simulation DUST is much better compared with DE-FAULT CMAQ v4.7 and CMAQ v4.4 (NMBs of−45.8 % vs.−80.9 % and−83.6 % for PM10 and−34.7 % vs.−50.9 %and−49.7 % for SPM, respectively) due to the contributionof dust particles. However, underpredictions remain, indicat-ing that the dust emissions might be underestimated over thedeserts in China. This finding is consistent with the analysisin Sect. 4.2.1. The performance of PM10 and SPM is fur-ther improved in simulation DUSTHIGH EF (e.g., NMBsof −10.3 % for PM10 and−18.2 % for SPM) over East Asia,despite worse overpredictions in PM2.5 concentrations andvisibility indices.
www.atmos-chem-phys.net/12/10209/2012/ Atmos. Chem. Phys., 12, 10209–10237, 2012
10222 K. Wang et al.: Dust emission and chemistry – the CMAQ modeling system
(a)
(e)
(b)
(c) (d)
(f)
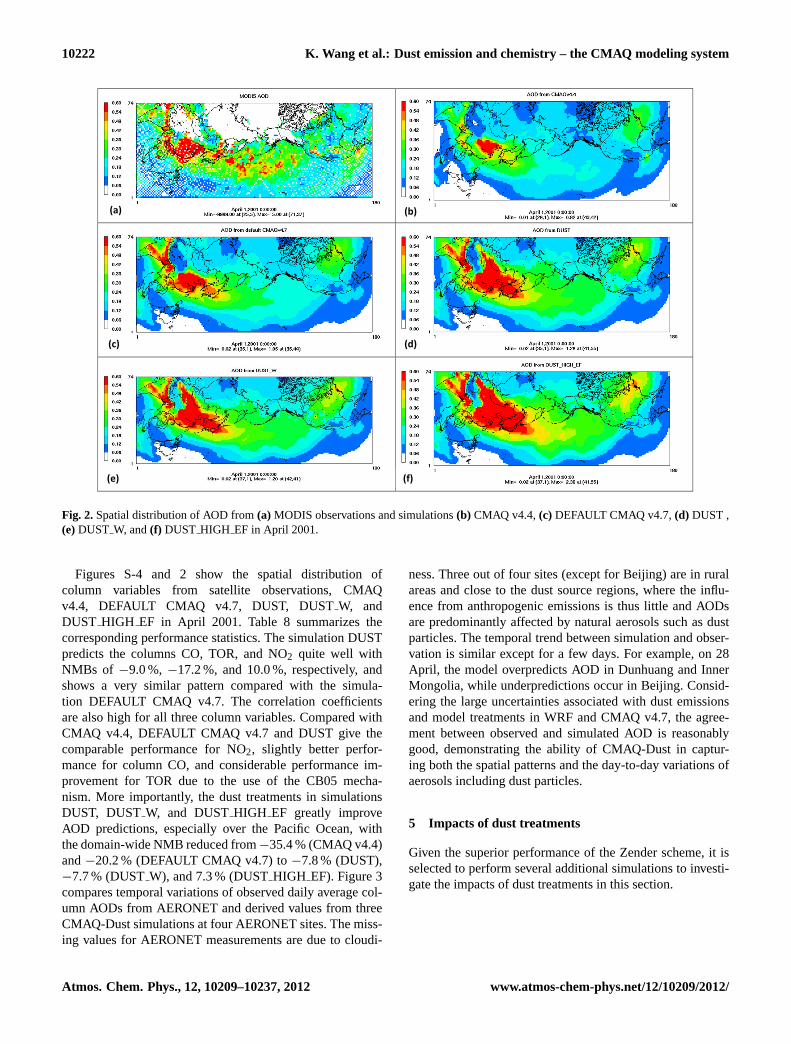
Fig. 2.Spatial distribution of AOD from(a) MODIS observations and simulations(b) CMAQ v4.4,(c) DEFAULT CMAQ v4.7,(d) DUST ,(e)DUST W, and(f) DUST HIGH EF in April 2001.
Figures S-4 and 2 show the spatial distribution ofcolumn variables from satellite observations, CMAQv4.4, DEFAULT CMAQ v4.7, DUST, DUSTW, andDUST HIGH EF in April 2001. Table 8 summarizes thecorresponding performance statistics. The simulation DUSTpredicts the columns CO, TOR, and NO2 quite well withNMBs of −9.0 %, −17.2 %, and 10.0 %, respectively, andshows a very similar pattern compared with the simula-tion DEFAULT CMAQ v4.7. The correlation coefficientsare also high for all three column variables. Compared withCMAQ v4.4, DEFAULT CMAQ v4.7 and DUST give thecomparable performance for NO2, slightly better perfor-mance for column CO, and considerable performance im-provement for TOR due to the use of the CB05 mecha-nism. More importantly, the dust treatments in simulationsDUST, DUSTW, and DUSTHIGH EF greatly improveAOD predictions, especially over the Pacific Ocean, withthe domain-wide NMB reduced from−35.4 % (CMAQ v4.4)and−20.2 % (DEFAULT CMAQ v4.7) to−7.8 % (DUST),−7.7 % (DUSTW), and 7.3 % (DUSTHIGH EF). Figure 3compares temporal variations of observed daily average col-umn AODs from AERONET and derived values from threeCMAQ-Dust simulations at four AERONET sites. The miss-ing values for AERONET measurements are due to cloudi-
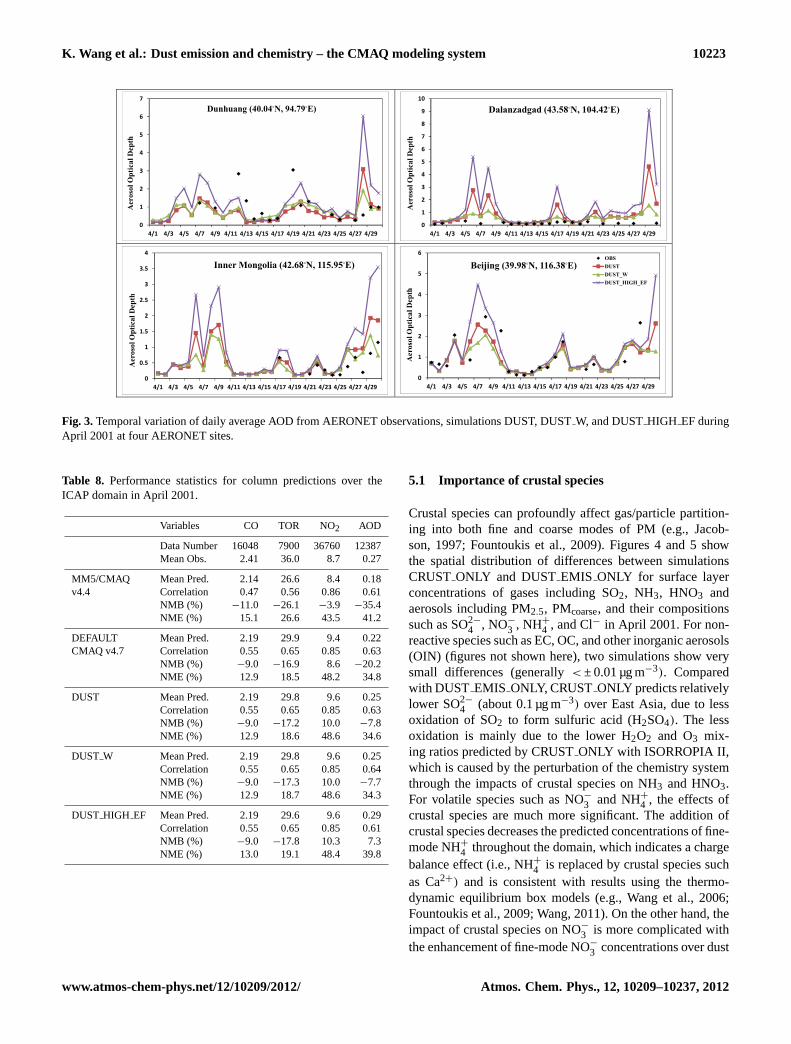
ness. Three out of four sites (except for Beijing) are in ruralareas and close to the dust source regions, where the influ-ence from anthropogenic emissions is thus little and AODsare predominantly affected by natural aerosols such as dustparticles. The temporal trend between simulation and obser-vation is similar except for a few days. For example, on 28April, the model overpredicts AOD in Dunhuang and InnerMongolia, while underpredictions occur in Beijing. Consid-ering the large uncertainties associated with dust emissionsand model treatments in WRF and CMAQ v4.7, the agree-ment between observed and simulated AOD is reasonablygood, demonstrating the ability of CMAQ-Dust in captur-ing both the spatial patterns and the day-to-day variations ofaerosols including dust particles.
5 Impacts of dust treatments
Given the superior performance of the Zender scheme, it isselected to perform several additional simulations to investi-gate the impacts of dust treatments in this section.
Atmos. Chem. Phys., 12, 10209–10237, 2012 www.atmos-chem-phys.net/12/10209/2012/
K. Wang et al.: Dust emission and chemistry – the CMAQ modeling system 10223
0
1
2
3
4
5
6
7
4/1 4/3 4/5 4/7 4/9 4/11 4/13 4/15 4/17 4/19 4/21 4/23 4/25 4/27 4/29
Aer
osol
Opt
ical
Dep
th
Dunhuang (40.04◦N, 94.79◦E)
0
1
2
3
4
5
6
7
8
9
10
4/1 4/3 4/5 4/7 4/9 4/11 4/13 4/15 4/17 4/19 4/21 4/23 4/25 4/27 4/29
Aer
osol
Opt
ical
Dep
th
Dalanzadgad (43.58◦N, 104.42◦E)
0
0.5
1
1.5
2
2.5
3
3.5
4
4/1 4/3 4/5 4/7 4/9 4/11 4/13 4/15 4/17 4/19 4/21 4/23 4/25 4/27 4/29
Aer
osol
Opt
ical
Dep
th
Inner Mongolia (42.68◦N, 115.95◦E)
0
1
2
3
4
5
6
4/1 4/3 4/5 4/7 4/9 4/11 4/13 4/15 4/17 4/19 4/21 4/23 4/25 4/27 4/29
Aer
osol
Opt
ical
Dep
th
Beijing (39.98◦N, 116.38◦E)OBSDUSTDUST_WDUST_HIGH_EF
Fig. 3.Temporal variation of daily average AOD from AERONET observations, simulations DUST, DUSTW, and DUSTHIGH EF duringApril 2001 at four AERONET sites.
Table 8. Performance statistics for column predictions over theICAP domain in April 2001.
Variables CO TOR NO2 AOD
Data Number 16048 7900 36760 12387Mean Obs. 2.41 36.0 8.7 0.27
MM5/CMAQ Mean Pred. 2.14 26.6 8.4 0.18v4.4 Correlation 0.47 0.56 0.86 0.61
NMB (%) −11.0 −26.1 −3.9 −35.4NME (%) 15.1 26.6 43.5 41.2
DEFAULT Mean Pred. 2.19 29.9 9.4 0.22CMAQ v4.7 Correlation 0.55 0.65 0.85 0.63
NMB (%) −9.0 −16.9 8.6 −20.2NME (%) 12.9 18.5 48.2 34.8
DUST Mean Pred. 2.19 29.8 9.6 0.25Correlation 0.55 0.65 0.85 0.63NMB (%) −9.0 −17.2 10.0 −7.8NME (%) 12.9 18.6 48.6 34.6
DUST W Mean Pred. 2.19 29.8 9.6 0.25Correlation 0.55 0.65 0.85 0.64NMB (%) −9.0 −17.3 10.0 −7.7NME (%) 12.9 18.7 48.6 34.3
DUST HIGH EF Mean Pred. 2.19 29.6 9.6 0.29Correlation 0.55 0.65 0.85 0.61NMB (%) −9.0 −17.8 10.3 7.3NME (%) 13.0 19.1 48.4 39.8
5.1 Importance of crustal species
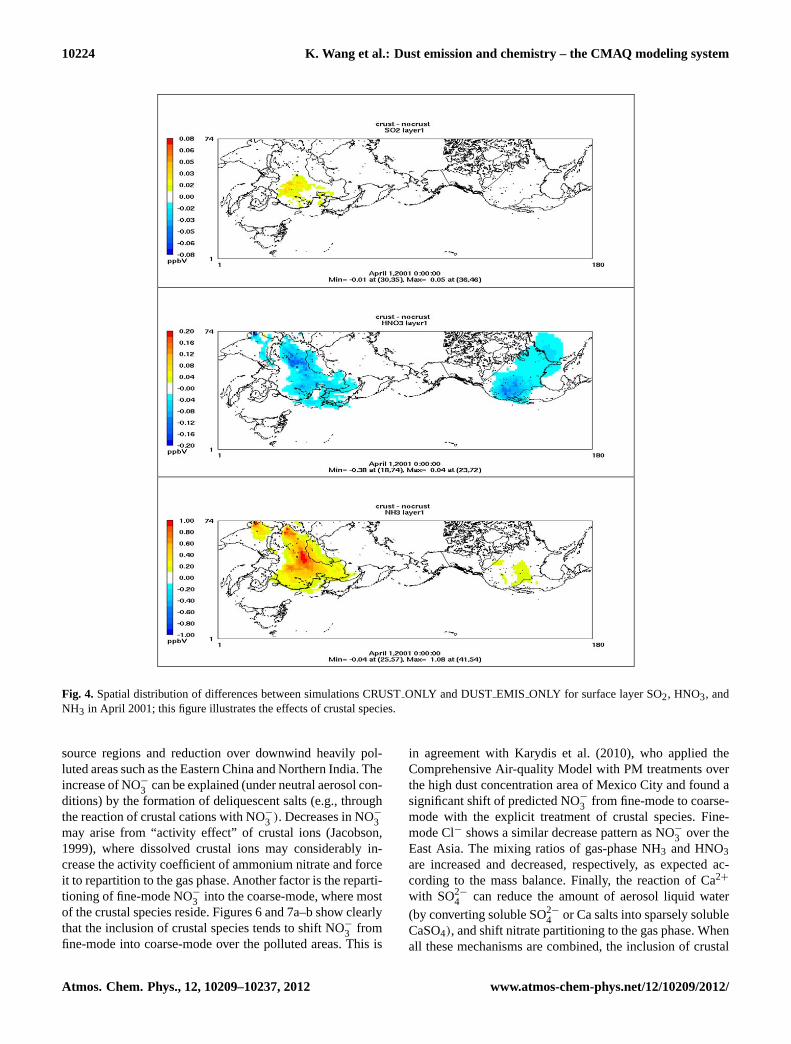
Crustal species can profoundly affect gas/particle partition-ing into both fine and coarse modes of PM (e.g., Jacob-son, 1997; Fountoukis et al., 2009). Figures 4 and 5 showthe spatial distribution of differences between simulationsCRUSTONLY and DUSTEMIS ONLY for surface layerconcentrations of gases including SO2, NH3, HNO3 andaerosols including PM2.5, PMcoarse, and their compositionssuch as SO2−
4 , NO−
3 , NH+
4 , and Cl− in April 2001. For non-reactive species such as EC, OC, and other inorganic aerosols(OIN) (figures not shown here), two simulations show verysmall differences (generally< ± 0.01 µg m−3). Comparedwith DUST EMIS ONLY, CRUST ONLY predicts relativelylower SO2−
4 (about 0.1 µg m−3) over East Asia, due to lessoxidation of SO2 to form sulfuric acid (H2SO4). The lessoxidation is mainly due to the lower H2O2 and O3 mix-ing ratios predicted by CRUSTONLY with ISORROPIA II,which is caused by the perturbation of the chemistry systemthrough the impacts of crustal species on NH3 and HNO3.For volatile species such as NO−
3 and NH+
4 , the effects ofcrustal species are much more significant. The addition ofcrustal species decreases the predicted concentrations of fine-mode NH+
4 throughout the domain, which indicates a chargebalance effect (i.e., NH+4 is replaced by crustal species suchas Ca2+) and is consistent with results using the thermo-dynamic equilibrium box models (e.g., Wang et al., 2006;Fountoukis et al., 2009; Wang, 2011). On the other hand, theimpact of crustal species on NO−
3 is more complicated withthe enhancement of fine-mode NO−
3 concentrations over dust
www.atmos-chem-phys.net/12/10209/2012/ Atmos. Chem. Phys., 12, 10209–10237, 2012
10224 K. Wang et al.: Dust emission and chemistry – the CMAQ modeling system
Fig. 4. Spatial distribution of differences between simulations CRUSTONLY and DUSTEMIS ONLY for surface layer SO2, HNO3, andNH3 in April 2001; this figure illustrates the effects of crustal species.
source regions and reduction over downwind heavily pol-luted areas such as the Eastern China and Northern India. Theincrease of NO−3 can be explained (under neutral aerosol con-ditions) by the formation of deliquescent salts (e.g., throughthe reaction of crustal cations with NO−
3 ). Decreases in NO−3may arise from “activity effect” of crustal ions (Jacobson,1999), where dissolved crustal ions may considerably in-crease the activity coefficient of ammonium nitrate and forceit to repartition to the gas phase. Another factor is the reparti-tioning of fine-mode NO−3 into the coarse-mode, where mostof the crustal species reside. Figures 6 and 7a–b show clearlythat the inclusion of crustal species tends to shift NO−
3 fromfine-mode into coarse-mode over the polluted areas. This is
in agreement with Karydis et al. (2010), who applied theComprehensive Air-quality Model with PM treatments overthe high dust concentration area of Mexico City and found asignificant shift of predicted NO−3 from fine-mode to coarse-mode with the explicit treatment of crustal species. Fine-mode Cl− shows a similar decrease pattern as NO−
3 over theEast Asia. The mixing ratios of gas-phase NH3 and HNO3are increased and decreased, respectively, as expected ac-cording to the mass balance. Finally, the reaction of Ca2+
with SO2−
4 can reduce the amount of aerosol liquid water(by converting soluble SO2−
4 or Ca salts into sparsely solubleCaSO4), and shift nitrate partitioning to the gas phase. Whenall these mechanisms are combined, the inclusion of crustal
Atmos. Chem. Phys., 12, 10209–10237, 2012 www.atmos-chem-phys.net/12/10209/2012/

K. Wang et al.: Dust emission and chemistry – the CMAQ modeling system 10225
Fig. 5. Spatial distribution of differences between simulations CRUSTONLY and DUSTEMIS ONLY for surface layer PM2.5, fine-modeSO2−
4 , NO−
3 , NH+
4 and Cl−, and coarse-mode SO2−
4 , NO−
3 and NH+
4 in April 2001; this figure illustrates the effects of crustal species.
www.atmos-chem-phys.net/12/10209/2012/ Atmos. Chem. Phys., 12, 10209–10237, 2012
10226 K. Wang et al.: Dust emission and chemistry – the CMAQ modeling system
(a) (b)
Fig. 6. Spatial distribution of differences between simulations DUST and DUSTISO1.7 for NO−
3 in (a) fine-mode and(b) coarse-mode inApril 2001; this figure illustrates the effects of crustal species when dust heterogeneous chemistry is also treated.
species tends to reduce aerosol NO−
3 , NH+
4 and PM2.5 overEast Asia.
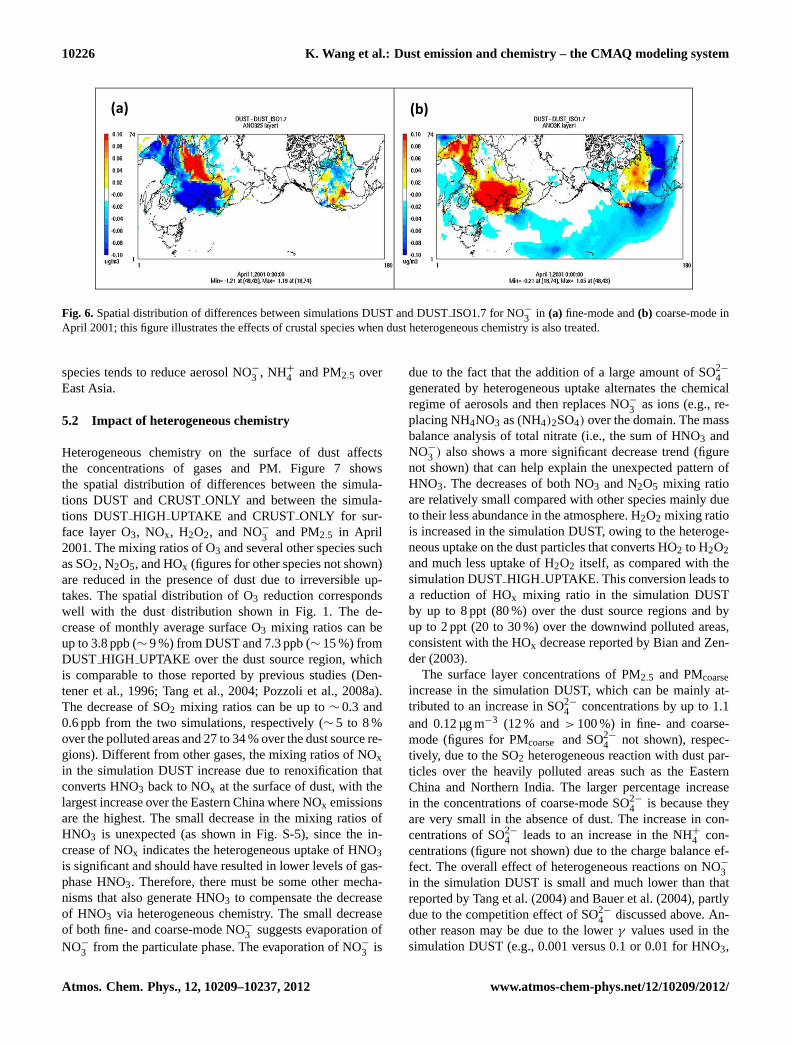
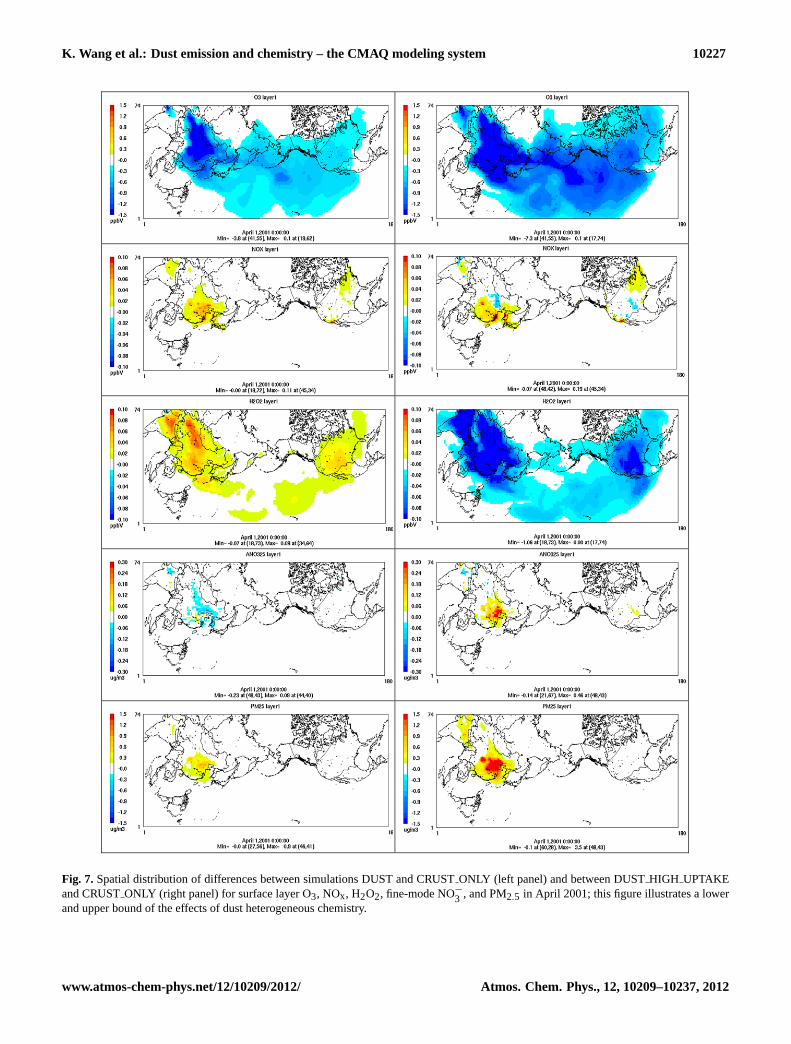
5.2 Impact of heterogeneous chemistry
Heterogeneous chemistry on the surface of dust affectsthe concentrations of gases and PM. Figure 7 showsthe spatial distribution of differences between the simula-tions DUST and CRUSTONLY and between the simula-tions DUSTHIGH UPTAKE and CRUSTONLY for sur-face layer O3, NOx, H2O2, and NO−
3 and PM2.5 in April2001. The mixing ratios of O3 and several other species suchas SO2, N2O5, and HOx (figures for other species not shown)are reduced in the presence of dust due to irreversible up-takes. The spatial distribution of O3 reduction correspondswell with the dust distribution shown in Fig. 1. The de-crease of monthly average surface O3 mixing ratios can beup to 3.8 ppb (∼ 9 %) from DUST and 7.3 ppb (∼ 15 %) fromDUST HIGH UPTAKE over the dust source region, whichis comparable to those reported by previous studies (Den-tener et al., 1996; Tang et al., 2004; Pozzoli et al., 2008a).The decrease of SO2 mixing ratios can be up to∼ 0.3 and0.6 ppb from the two simulations, respectively (∼ 5 to 8 %over the polluted areas and 27 to 34 % over the dust source re-gions). Different from other gases, the mixing ratios of NOxin the simulation DUST increase due to renoxification thatconverts HNO3 back to NOx at the surface of dust, with thelargest increase over the Eastern China where NOx emissionsare the highest. The small decrease in the mixing ratios ofHNO3 is unexpected (as shown in Fig. S-5), since the in-crease of NOx indicates the heterogeneous uptake of HNO3is significant and should have resulted in lower levels of gas-phase HNO3. Therefore, there must be some other mecha-nisms that also generate HNO3 to compensate the decreaseof HNO3 via heterogeneous chemistry. The small decreaseof both fine- and coarse-mode NO−
3 suggests evaporation ofNO−
3 from the particulate phase. The evaporation of NO−
3 is
due to the fact that the addition of a large amount of SO2−
4generated by heterogeneous uptake alternates the chemicalregime of aerosols and then replaces NO−
3 as ions (e.g., re-placing NH4NO3 as (NH4)2SO4) over the domain. The massbalance analysis of total nitrate (i.e., the sum of HNO3 andNO−
3 ) also shows a more significant decrease trend (figurenot shown) that can help explain the unexpected pattern ofHNO3. The decreases of both NO3 and N2O5 mixing ratioare relatively small compared with other species mainly dueto their less abundance in the atmosphere. H2O2 mixing ratiois increased in the simulation DUST, owing to the heteroge-neous uptake on the dust particles that converts HO2 to H2O2and much less uptake of H2O2 itself, as compared with thesimulation DUSTHIGH UPTAKE. This conversion leads toa reduction of HOx mixing ratio in the simulation DUSTby up to 8 ppt (80 %) over the dust source regions and byup to 2 ppt (20 to 30 %) over the downwind polluted areas,consistent with the HOx decrease reported by Bian and Zen-der (2003).
The surface layer concentrations of PM2.5 and PMcoarseincrease in the simulation DUST, which can be mainly at-tributed to an increase in SO2−
4 concentrations by up to 1.1and 0.12 µg m−3 (12 % and> 100 %) in fine- and coarse-mode (figures for PMcoarse and SO2−
4 not shown), respec-tively, due to the SO2 heterogeneous reaction with dust par-ticles over the heavily polluted areas such as the EasternChina and Northern India. The larger percentage increasein the concentrations of coarse-mode SO2−
4 is because theyare very small in the absence of dust. The increase in con-centrations of SO2−
4 leads to an increase in the NH+
4 con-centrations (figure not shown) due to the charge balance ef-fect. The overall effect of heterogeneous reactions on NO−
3in the simulation DUST is small and much lower than thatreported by Tang et al. (2004) and Bauer et al. (2004), partlydue to the competition effect of SO2−
4 discussed above. An-other reason may be due to the lowerγ values used in thesimulation DUST (e.g., 0.001 versus 0.1 or 0.01 for HNO3,
Atmos. Chem. Phys., 12, 10209–10237, 2012 www.atmos-chem-phys.net/12/10209/2012/
K. Wang et al.: Dust emission and chemistry – the CMAQ modeling system 10227
Fig. 7. Spatial distribution of differences between simulations DUST and CRUSTONLY (left panel) and between DUSTHIGH UPTAKEand CRUSTONLY (right panel) for surface layer O3, NOx, H2O2, fine-mode NO−3 , and PM2.5 in April 2001; this figure illustrates a lowerand upper bound of the effects of dust heterogeneous chemistry.
www.atmos-chem-phys.net/12/10209/2012/ Atmos. Chem. Phys., 12, 10209–10237, 2012

10228 K. Wang et al.: Dust emission and chemistry – the CMAQ modeling system
4.4 × 10⁻⁵ versus 1.0 × 10⁻⁴ for NO2, and 0.001 versus 0.02for N2O5), compared to the values used by Tang et al. (2004)and Bauer et al. (2004). As also shown in Fig. 7, the sim-ulation DUSTHIGH UPTAKE with upper limit γ valuescauses much greater changes in most of these species thanthose from DUST (e.g., much higher enhancement of NO−
3concentrations).
5.3 Impact of dust treatment on gas and PM levels
Figures 8 and 9 show the spatial distribution of differencesbetween simulations DUST and BASELINENO DUST andbetween DUSTHIGH EF and BASELINENO DUST forseveral gaseous (i.e., O3, NOx, SO2, HNO3, and H2O2)
and aerosol species (i.e., fine-mode SO2−
4 and NO−
3 , coarse-mode SO2−
4 and NO−
3 , and PM10), respectively, at the surfacelayer in April 2001. Similar plots for PM2.5 and PMcoarseare shown in Fig. S-6. The surface monthly mean mixingratios of O3 and SO2 are reduced and the mixing ratio ofH2O2 is increased with all dust treatments and distributionsfor those species correspond well with those shown in Fig. 7,indicating dominant influences from heterogeneous chem-istry. The increase of NOx over most of the domain is dueto the renoxification process as discussed in Sect. 5.2. Theimpact of dust treatment on the spatial pattern of HNO3is dominated by the effects from HNO3/NO−
3 partitioning.As shown in Fig. 9, the increase of surface concentrationsfor SO2−
4 (both fine- and coarse-mode) over Asia with thedust treatment is mainly due to heterogeneous chemistryand the decrease over Pacific and Atlantic Ocean and theNortheastern US is due to the less production of H2SO4from the gas-phase oxidation as a result of reduced HOxthat dominates over the effect of heterogeneous chemistry.For those volatile species (i.e., NO−
3 and NH+
4 ), the differ-ences between the simulations DUST (or DUSTHIGH EF)and BASELINENO DUST are determined mainly by theeffects of crustal species. The overall impact of dust treat-ments on PM10 is large. For example, DUST predicts theconcentration enhancements of up to∼ 1780 and 5 µg m−3
for PM10 over the dust source regions and the Pacific and At-lantic Ocean, respectively. DUSTHIGH EF predicts muchgreater PM10 concentration enhancements of up to 3560 and10 µg m−3 over the dust source regions and the Pacific andAtlantic Ocean, respectively.
Similar plots for O3, SO2, total SO2−
4 , total NO−
3 , andPM10 are shown at an altitude of 5 km in Fig. 10. Those forPM2.5 and PMcoarseare shown in Fig. S-7. In contrast to thedistribution in the surface layer, the decrease of O3 at 5 kmaltitude is more pronounced in the downwind/remote areasinstead of dust source regions. This finding reflects that suf-ficient amounts of dust particles have been transported ef-ficiently to the remote areas and have become aged to pro-vide larger surface sites than freshly emitted particles forheterogeneous uptake of O3 at higher altitudes. The simi-lar patterns are also found for SO2 and HNO3. By contrast,
the impacts of dust treatments on NOx and HOx (figures notshown) are much smaller at higher altitudes, indicating lessabundance of those species due to their short lifetimes. Forthe PM species, the impacts of dust treatments are also morepronounced at 5 km altitude over many areas far from dustsource regions, indicating more efficient uptake of precursorson aged dust particles (Fairlie et al., 2010). The concentrationenhancement of PM10 due to dust treatments at higher alti-tudes is much larger over the downwind and remote areas (upto ∼ 25 µg m−3 over the Pacific Ocean from DUST and up to∼ 50 µg m−3 from DUST HIGH UPTAKE), indicating moreefficient transport at higher altitudes.
5.4 Impact of Asian pollution on the US air quality withdust treatments
The enhancements of both gaseous and aerosol speciesover the US in the presence of dust are quantifiedby calculating the differences between the DUST andDUST NO ASIA EMIS simulations (Fig. 11). As expected,the Western US receives much higher influx of air pollu-tants from the trans-Pacific transport than the Eastern US.The simulated surface concentrations of O3 and CO increaseby∼ 1.5 ppb (3.6 %) and∼ 2.5 ppb (2.1 %), respectively overthe Western US. The enhancement for SO2 and NOy is muchhigher over the Western US than the Eastern US. Comparedwith other gases, NOx shows a different pattern over the en-tire US with a negative contribution of Asian anthropogenicemissions to the NOx mixing ratios in the US. Wang etal. (2009) found that the direct long-range transport of NOxto the US is negligible. Therefore, the negative change ofNOx as a result of the removal of Asian anthropogenic emis-sions is not due to the transport itself but to the differencesin the rates of chemical destruction between the simulationswith and without Asian anthropogenic emissions (i.e., lessconversion of NOx to its sink such as HNO3, PAN, or N2O5when removing Asian anthropogenic emissions) in the US.The concentration enhancements of SO2−
4 and NH+
4 (bothby ∼ 20 % for the Western US) dominate among the PMspecies, because (NH4)2SO4 (and/or NH4HSO4) is the majoraerosol component of trans-Pacific anthropogenic aerosols.The relative enhancement for OC in both the Western andEastern US is higher than that of Wang et al. (2009) (i.e.,11 to 15 % vs. 2 to 5 %), due to the updated SOA treat-ment in CMAQ v4.7. The relative enhancement for PM2.5in the Western US is lower than that of Wang et al. (2009)(i.e., ∼ 5 % vs.∼ 10 %), which is mainly due to the inclu-sion of dust particles in PM2.5 that increases the baselinePM2.5 concentration significantly. In contrast with other PMspecies and the results of Wang et al. (2009), the NO−
3 con-centration is reduced in both the Eastern and Western US,due to two competitive effects driven by changes in emis-sions and thermodynamics when Asian emissions are re-moved. Removing Asian anthropogenic emissions of NOxand primary NO−3 directly reduces NO−3 concentrations in
Atmos. Chem. Phys., 12, 10209–10237, 2012 www.atmos-chem-phys.net/12/10209/2012/

K. Wang et al.: Dust emission and chemistry – the CMAQ modeling system 10229
Fig. 8.Spatial distribution of differences between simulations DUST and BASELINENO DUST (left panel) and between DUSTHIGH EFand BASELINENO DUST (right panel) at surface layer for O3, NOx, SO2, HNO3, and H2O2 in April 2001; this figure illustrates a lowerand upper bound of overall dust treatments in this study.
www.atmos-chem-phys.net/12/10209/2012/ Atmos. Chem. Phys., 12, 10209–10237, 2012

10230 K. Wang et al.: Dust emission and chemistry – the CMAQ modeling system
Fig. 9.Spatial distribution of differences between simulations DUST and BASELINENO DUST (left panel) and between DUSTHIGH EFand BASELINENO DUST (right panel) at surface layer for fine-mode SO2−
4 and NO−
3 , coarse-mode SO2−
4 and NO−
3 , and PM10in April2001; this figure illustrates a lower and upper bound of overall dust treatments in this study.
Atmos. Chem. Phys., 12, 10209–10237, 2012 www.atmos-chem-phys.net/12/10209/2012/

K. Wang et al.: Dust emission and chemistry – the CMAQ modeling system 10231
Fig. 10.Spatial distribution of differences between simulations DUST and BASELINENO DUST (left panel) and between DUSTHIGH EFand BASELINENO DUST (right panel) at an altitude of∼ 5 km for O3, SO2, total SO2−
4 , total NO−
3 , and PM10; this figure illustrates alower and upper bound of overall dust treatments in this study.
www.atmos-chem-phys.net/12/10209/2012/ Atmos. Chem. Phys., 12, 10209–10237, 2012

10232 K. Wang et al.: Dust emission and chemistry – the CMAQ modeling system
(a)
(b)
-4
0
4
8
12
16
20
24
-0.5
0
0.5
1
1.5
2
2.5
3
O3 CO NOX NOY SO2 FORM PAN
(bas
e-se
ns.)/
base
*100
%
ppb
Gas species
West_absolute
East_absolute
West_relative
East_relative
-10
0
10
20
30
40
50
60
-0.1
0
0.1
0.2
0.3
0.4
0.5
0.6
PM2.5 SO4 NO3 NH4 OC BC Others
(bas
e-se
ns.)/
base
*100
%
g m
-3
PM species
West_absolute
East_absolute
West_relative
East_relative
Fig. 11.Absolute and relative contributions of different(a) gaseousspecies and(b) PM2.5 components over the Western US and theEastern US due to Asian anthropogenic emissions between simula-tions DUST and DUSTNO ASIA EMIS for April 2001.
the US in the simulation DUSTNO ASIA EMIS (referred toas the negative emission effect). Because of a stronger long-range transport of SO2−
4 than NO−
3 , removing Asian anthro-pogenic emissions of SO2 and primary SO2−
4 also leads tomuch lower concentrations of SO2−
4 in the US, which triggersthe changes in the aerosol thermodynamics. Compared withthe simulation DUST, aerosols predicted from the simulationDUST NO ASIA EMIS contain a similar level of crustalspecies but they are less acidic due to lower SO2−
4 concen-trations (and to a lesser extent, lower NO−
3 concentrations).Therefore, thermodynamics requires more HNO3 partition-ing into the particulate phase to neutralize cations, increas-ing NO−
3 concentrations (i.e., the positive thermodynamic ef-fect). The positive thermodynamic effect dominates over thenegative emission effect, leading to a net higher NO−
3 con-centration from the simulation DUSTNO ASIA EMIS thanthe simulation DUST.
6 Conclusion and future work
In this study, two established dust emission flux schemes andnine dust-related heterogeneous reactions are implementedinto the US EPA’s CMAQ v4.7 to enhance CMAQ’s capabil-ity in simulating coarse PM and to examine the role of dustparticles in affecting chemical predictions during the long-
range transport. In addition, the default thermodynamic equi-librium module ISORROPIA v1.7 in CMAQ v4.7 is updatedto ISORROPIA II to account for the impact of crustal speciesassociated with dust particles on gas/particle partitioning.CMAQ with the new dust module is applied to the April2001 dust storm episode over the trans-Pacific domain. Themeteorological fields predicted by WRF 3.2 are first eval-uated against the available observational data. WRF gener-ally predicts well 2-m temperature and relative humidity andmoderately overpredicts wind speed. WRF predicts precip-itation relatively poorly compared to other variables whichaffects chemical predictions, especially PM2.5, via scaveng-ing and wet deposition. CMAQ-Dust can reproduce concen-trations of chemical species well. The model performance ofCMAQ-Dust for PM10 and AOD is greatly improved as com-pared with that of the DEFAULT CMAQ v4.7 in this workand CMAQ v4.4 in Wang et al. (2009) due to the dust treat-ments implemented in this work.
The total simulated dust emissions by CMAQ-Dust are∼ 111.4 and 110.9 Tg from Zender and Westphal schemeswith an erodible fraction of 0.5 and can increase up to∼ 223 Tg with a higher fraction of 1.0 in the Zender schemefor April 2001, which is in line with other previous re-search over Asia. Using different erodible fractions,EF, of0.5 and 1.0, the monthly mean surface total concentrationsof dust particles predicted by CMAQ are generally> 200and> 500 µg m−3, respectively, over source regions in Chinaand can reach up to 25 and 50 µg m−3, respectively, overthe downwind areas such as the Eastern China, Japan, theNortheastern India, and the Midwest US. Long-range trans-port can increase surface total concentrations of dust by 5 to10 µg m−3 over the remote regions such as the Eastern Pa-cific and the Eastern US. Both schemes predict similar totaldust emissions with a similar spatial pattern and have similarCPU costs. However, the Zender scheme is more physicallybased and gives a better model performance than the West-phal scheme; it is therefore recommended for applicationsover regions with significant dust emissions.
A number of sensitivity simulations using the Zenderscheme are conducted to investigate the effect of dust onthe spatial distribution of various gaseous and PM species.The results show that the inclusion of crustal species tendsto affect the volatile species (e.g., NH3, NH+
4 , HNO3, andNO−
3 ) to a greater extent than other non-volatile species (e.g.,SO2−
4 ). The effects include decreasing the fine-mode NH+
4throughout the domain, increasing the fine-mode NO−
3 overdust source regions but decreasing it over downwind heavilypolluted areas, as well as shifting NO−
3 from the fine-mode tothe coarse-mode. The concentration of PM2.5 over the East-ern Asia is reduced due to the combined effect of crustalspecies on reducing NO−3 and NH+
4 . Heterogeneous chem-istry on dust particles tends to decrease the mixing ratio of O3by up to 3.8 ppb (∼ 9 %) withEF of 0.5 and 7.3 ppb (∼ 15 %)with EF of 1.0 over the dust source regions, and to reduce
Atmos. Chem. Phys., 12, 10209–10237, 2012 www.atmos-chem-phys.net/12/10209/2012/
K. Wang et al.: Dust emission and chemistry – the CMAQ modeling system 10233
SO2 mixing ratio by up to 0.3 ppb (∼ 5 %) withEF of 0.5 and0.6 ppb (∼ 8 %) with EF of 1.0 over the polluted areas andup to 0.05 ppb (∼ 27 %) withEF of 0.5 and 0.1 ppb (∼ 34 %)with EF of 1.0 over the dust source regions. Different fromother species, the mixing ratio of NOx increases throughoutthe domain due to the renoxification effect considered in themodel. The decrease of HNO3 is not evident, indicating acompensation effect of the decrease of HNO3 by heteroge-neous chemistry and the increase of HNO3 by evaporationof NO−
3 particles caused by the increase of SO2−
4 concen-trations. The heterogeneous uptakes play a more importantrole in SO2−
4 formation than other PM species. The concen-trations of dust and their impacts at a higher altitude indicatethe efficient long-range transport of dust and its active inter-actions with photochemical cycle and PM formation in uppertroposphere and the remote areas. Such long-range transportcontributes to the enhancement of the surface concentrationsof various gaseous pollutants (e.g., O3 and CO) by up to sev-eral ppb (up to∼ 6 %) and PM species (e.g., SO2−
4 , NH+
4 ,OC, and PM2.5) by up to 0.6 µg m−3 (up to 20 %) whenEFis assumed to be 0.5.
Several uncertainties and limitations in the dust treatmentsexist in this study. For example, the parameterEF is as-sumed to be constant everywhere. It mainly serves as a tun-ing factor without considering the spatial variability of theerodibility of the land. The crustal species are prescribeduniformly throughout the modeling domain. Their spatial-variability should be considered once such information be-comes available, and predicted crustal materials should beevaluated against measurements over the source regions inChina and from networks such as IMPROVE and STN inthe downwind regions. The seasonal variations of vegeta-tion coverage are not considered for dust emission calcula-tion in this study, which could be important over some semi-arid areas. As discussed in Sect. 2, the uptake coefficient ofchemical species on the surface of dust has high uncertain-ties and may depend on the ambient conditions (e.g., temper-ature and relative humidity). Additional simulations may beperformed using different sets of uptake coefficients such asthose recommended by Crowly et al. (2010). Nevertheless,this work extends CMAQ’s capability in simulating emis-sions and chemistry of mineral dust, which is a very im-portant PM component in arid and semiarid areas. Its ap-plication to the April 2001 Asian dust event demonstratesthe promising ability of CMAQ-Dust in capturing dust emis-sions, its concentrations and spatial variability, as well as thephysical/chemical processes associated with dust particles.The dust treatments implemented in this work can be read-ily transferred into the latest version of CMAQ (i.e., CMAQversion 5).
Supplementary material related to this article isavailable online at:http://www.atmos-chem-phys.net/12/10209/2012/acp-12-10209-2012-supplement.pdf.
Acknowledgements.This work was supported by the NationalResearch Initiative Competitive Grant No. 2008-35112-18758 fromthe USDA Cooperative State Research, Education, and ExtensionService Air Quality Program and the China’s National BasicResearch Program (2010CB951803). AN and CF acknowledge thesupport from the National Oceanic and Atmospheric Administra-tion (NOAA) under contract NMRAC000-5-04017. Thanks are dueto Carey Jang and Sharon Phillips, the US EPA, for providing theinput files for the April 2001 ICAP testbed with MM5/CMAQv4.4;to Jack Fishman and his colleagues, NASA Langley ResearchCenter, the US, for providing the TOMS/SBUV and MOPITTsatellite data; to Ji-Ming Hao and Ke-Bin He, Tsinghua University,China, for providing the observational data in Beijing, China;to Takigawa Masayuki, the Frontier Research Center for GlobalChange, Japan, for providing the codes for the extraction ofJapan data; to Shao-Cai Yu, the NOAA/US EPA, for providingFortran codes for statistical calculations; NASA MODIS AdaptiveProcessing System, for providing MODIS AOD data; TEMIS ofthe European Space Agency for providing GOME NO2 data.
Edited by: G. Kallos
References
Astitha, M., Kallos, G., Spyrou, C., O’Hirok, W., Lelieveld, J.,and Denier van der Gon, H. A. C.: Modelling the chemi-cally aged and mixed aerosols over the eastern central AtlanticOcean – potential impacts, Atmos. Chem. Phys., 10, 5797–5822,doi:10.5194/acp-10-5797-2010, 2010.
Bauer, S. E., Balkanski, Y., Schulz, M., Hauglustaine, D. A., andDentener, F.: Global modeling of heterogeneous chemistry onmineral aerosol surfaces: Influence on tropospheric ozone chem-istry and comparison to observations, J. Geophys. Res., 109,D02304,doi:10.1029/2003JD003868, 2004.
Bian, H. and Zender, C. S.: Mineral dust and global troposphericchemistry: Relative roles of photolysis and heterogeneous up-take, J. Geophys. Res., 108, 4672,doi:10.1029/2002JD003143,2003.
Burrows, J. P., Weber, M., Buchwitz, M., Rozanov, V., Ladstatter-Weibenmayer, A., Richter, A., DeBeek, R., Hoogen, R., Bramst-edt, K., Eichmann, K.-U., and Eisinger, M.: The Global OzoneMonitoring Experiment (GOME): Mission concept and first sci-entific results, J. Atmos. Sci., 56, 151–175, 1999.
Capaldo, K. P., Pilinis, C., and Pandis, S. N.: A computationallyefficient hybrid approach for dynamic gas/aerosol transfer in airquality models, Atmos. Environ., 34, 3617–3627, 2000.
Chameides, W. L., Luo, C., Salor, R., Streets, D., Huang, Y., Bergin,M., and Giorgi, F.: Correlation between model-calculated an-thropogenic aerosols and satellite-derived cloud optical depths:Indication of indirect effect?, J. Geophys. Res., 107, 4085,doi:10.1029/2000JD000208, 2002.
Cheng, T., Peng, Y., Feichter, J., and Tegen, I.: An improve-ment on the dust emission scheme in the global aerosol-climatemodel ECHAM5-HAM, Atmos. Chem. Phys., 8, 1105–1117,doi:10.5194/acp-8-1105-2008, 2008.
Chervenkov, H. and Jakobs, H.: Dust storm simulation with regionalair quality-Problems and results, Atmos. Environ., 45, 3965–3976, 2011.
www.atmos-chem-phys.net/12/10209/2012/ Atmos. Chem. Phys., 12, 10209–10237, 2012
10234 K. Wang et al.: Dust emission and chemistry – the CMAQ modeling system
Choi, Y.-J. and Fernando, H. J. S.: Implementation of a windblowndust parameterization into MODELS-3/CMAQ: Application toepisodic PM events in the US/Mexico border, Atmos. Environ.,42, 6039–6046, 2008.
Chou, M.-D. and Suarez, M. J.: An efficient thermal infrared ra-diation parameterization for use in general circulation models,NASA Tech. Memo NASA/TM-104606, 84 pp., 1994.
Clements, T., Merriam, T. H., Stone, R. O., Eimann, J. L., andReade, H. L.: A study of desert surface conditions, Tech. Rep.EP-53, 130 pp., US Army, Natick Lab., Natick, Mass., 1957.
Crowley, J. N., Ammann, M., Cox, R. A., Hynes, R. G., Jenkin,M. E., Mellouki, A., Rossi, M. J., Troe, J., and Wallington, T. J.:Evaluated kinetic and photochemical data for atmospheric chem-istry: Volume V – heterogeneous reactions on solid substrates,Atmos. Chem. Phys., 10, 9059–9223,doi:10.5194/acp-10-9059-2010, 2010.
Darmenova, K., Sokolik, I. N., Shao, Y., Marticorena, B., andBergametti, G.: Development of a physically based dust emissionmodule within the Weather Research and Forecasting (WRF)model: Assessment of dust emission parameterizations and inputparameters for source regions in Central and East Asia, J. Geo-phys. Res., 114, D14201,doi:10.1029/2008JD011236, 2009.
Deeter, M. N., Emmons, L. K., Francis, G. L., Edwards, D. P., Gille,J. C., Warner, J. X., Khattatov, B., Ziskin, D., Lamarque, J.-F.,Ho, S.-P., Yuding, V., Attie, J.-L., Packman, D., Chen, J., Mao,D., and Drummond, J. R.: Operational carbon monoxide retrievalalgorithm and selected results for the MOPITT instrument, J.Geophys. Res., 108, 4399,doi:10.1029/2002JD003186, 2003.
Dentener, F. J., Carmichael, G. R., Zhang, Y., Lelieveld, J., andCrutzen, P. J.: Role of mineral aerosol as a reactive surface in theglobal troposphere, J. Geophys. Res., 101, 22869–22889, 1996.
Dudhia, J.: A multi-layer soil temperature model for MM5, the 6thAnnual MM5 Users Workshop, Boulder, CO, USA, 22–24 July,1996.
Fairlie, T. D., Jacob, D. J., and Park, R. J.: The impact of transpacifictransport of mineral dust in the United States, Atmos. Environ.,41, 1251–1266, 2007.
Fairlie, T. D., Jacob, D. J., Dibb, J. E., Alexander, B., Avery, M.A., van Donkelaar, A., and Zhang, L.: Impact of mineral dust onnitrate, sulfate, and ozone in transpacific Asian pollution plumes,Atmos. Chem. Phys., 10, 3999–4012,doi:10.5194/acp-10-3999-2010, 2010.
Fecan, F., Marticorena, B., and Bergametti, G.: Parametrization ofthe increase of the aeolian erosion threshold wind friction veloc-ity due to soil moisture for arid and semi-arid areas, Ann. Geo-phys., 17, 149–157,doi:10.1007/s00585-999-0149-7, 1999.
Fishman, J., Wozniak, A. E., and Creilson, J. K.: Global distributionof tropospheric ozone from satellite measurements using the em-pirically corrected tropospheric ozone residual technique: Iden-tification of the regional aspects of air pollution, Atmos. Chem.Phys., 3, 893–907,doi:10.5194/acp-3-893-2003, 2003.
Fountoukis, C. and Nenes, A.: ISORROPIA II: a computation-ally efficient thermodynamic equilibrium model for K+-Ca2+-Mg2+-NH+
4 -SO2−
4 -NO−
3 -Cl−-H2O aerosols, Atmos. Chem.Phys., 7, 4639–4659,doi:10.5194/acp-7-4639-2007, 2007.
Fountoukis, C., Nenes, A., Sullivan, A., Weber, R., Van Reken,T., Fischer, M., Matıas, E., Moya, M., Farmer, D., and Cohen,R. C.: Thermodynamic characterization of Mexico City aerosolduring MILAGRO 2006, Atmos. Chem. Phys., 9, 2141–2156,
doi:10.5194/acp-9-2141-2009, 2009.Ginox, P., Chin, M., Tegen, I., Prospero, J. M., Holben, B., Dubovik,
O., and Lin, S.: Sources and distributions of dust aerosols simu-lated with the GOCART model, J. Geophys. Res., 106, 22055–22074, 2001.
Goodman, A. L., Underwood, G. M., and Grassian, V. H.: A labora-tory study of the heterogeneous reaction of nitric acid on calciumcarbonate particles, J. Geophys. Res., 105, 29053–29064, 2000.
Grell, G. A. and Devenyi, D.: A generalized approach toparameterizing convection combining ensemble and dataassimilation techniques, Geophys. Res. Lett., 29, 1693,doi:10.1029/2002GL015311, 2002.
Hong, S. Y. and Lim, J.: The WRF Single Moment 6-class micro-physics scheme (WSM6), Journal of the Korean MeteorologicalSociety, 42, 129–151, 2006.
Hong, S. Y., Noh, Y., and Dudhia, J.: A new vertical diffusionpackage with explicit treatment of entrainment processes, Mon.Weather Rev., 134, 2318–2341, 2006.
IPCC: Climate Change 2007: The Physical Science Basis, Con-tribution of Working Group I to the Fourth Assessment Reportof the Intergovernmental Panel on Climate Change, edited by:Solomon, S., Qin, D., Manning, M., Chen, Z., Marquis, M., Av-eryt, K. B., Tignor, M., and Miller, H. L., Cambridge UniversityPress, Cambridge, United Kingdom and New York, NY, USA,2007.
Jacobson, M. Z.: Studying the effects of calcium and magnesiumon size-distributed nitrate and ammonium with EQUISOLV II,Atmos. Environ., 33, 3635–3649, 1999.
Jaffe, D. A., Snow, J., and Cooper, O.: The 2001 Asian dust events:Transport and impact on surface aerosol concentrations in theU.S., Eos, 84, 501–516, 2003.
Kang, J.-Y., Yoon, S.-C., Shao, Y., and Kim, S.-W.: Compar-ison of vertical dust flux by implementing three dust emis-sion schemes in WRF/Chem, J. Geophys. Res., 116, D09202,doi:10.1029/2010JD014649, 2011.
Karydis, V. A., Tsimpidi, A. P., Fountoukis, C., Nenes, A., Zavala,M., Lei, W., Molina, L. T., and Pandis, S. N.: Simulating thefine and coarse inorganic particulate matter concentrations in apolluted megacity, Atmos. Environ., 44, 608–620, 2010.
Karydis, V. A., Kumar, P., Barahona, D., Sokolik, I. N., andNenes, A.: On the effect of insoluble dust particles on globalCCN and droplet number, J. Geoph. Res., 116, D23204,doi:10.1029/2011JD016283, 2011.
Kawamura, R.: Study of sand movement by wind, Hydraul. Eng.Lab. Tech. Rep., HEL-2-8, Univ. of Calif., Berkeley, USA, 99–108, 1964.
Knippertz, P. and Todd, M. C.: Mineral dust aerosols over theSahara: Meteorological controls on emission and transportand implications for modeling, Rev. Geophys., 50, RG1007,doi:10.1029/2011RG000362, 2012.
Knipping, E. M. and Dabdub, D.: Modeling surface-mediatedrenoxification of the atmosphere via reaction of gaseous nitricoxide with deposited nitric acid, Atmos. Environ., 36, 5741–5748, 2002.
Kursinski, E. R., Bennett, R. A., Gochis, D., Gutman, S. I., Holub,K. L., Mastaler, R., Minjarez Sosa, C., Minjarez Sosa, I., andvan Hove, T.: Water vapor and surface observations in northwest-ern Mexico during the 2004 NAME Enhanced Observing Period,Geophys. Res. Lett., 35, L03815,doi:10.1029/2007GL031404,
Atmos. Chem. Phys., 12, 10209–10237, 2012 www.atmos-chem-phys.net/12/10209/2012/

K. Wang et al.: Dust emission and chemistry – the CMAQ modeling system 10235
2008.Laurent, B., Marticorena, B., Bergametti, G., and Mei, F.: Model-
ing mineral dust emissions from Chinese and Mongolian deserts,Global Planet. Change, 52, 121–141, 2006.
Li, L., Chen, Z. M., Zhang, Y. H., Zhu, T., Li, J. L., and Ding, J.: Ki-netics and mechanism of heterogeneous oxidation of sulfur diox-ide by ozone on surface of calcium carbonate, Atmos. Chem.Phys., 6, 2453–2464,doi:10.5194/acp-6-2453-2006, 2006.
Li, H. J., Zhu, T., Zhao, D. F., Zhang, Z. F., and Chen, Z. M.: Ki-netics and mechanisms of heterogeneous reaction of NO2 onCaCO3 surfaces under dry and wet conditions, Atmos. Chem.Phys., 10, 463–474,doi:10.5194/acp-10-463-2010, 2010.
Liao, H. and Seinfeld, J. H.: Global impacts of gas-phase chemistry-aerosol interactions on direct radiative forcing by anthro-pogenic aerosols and ozone, J. Geophys. Res., 110, D18208,doi:10.1029/2005JD005907, 2005.
Liu, M. and Westphal, D. L.: A study of the sensitivity of simulatedmineral dust production to model resolution, J. Geophys. Res.,106, 18099–18112, 2001.
Liu, M., Westphal, D. L., Wang, S., Shimizu, A., Sugimoto, N.,Zhou, J., and Chen, Y.: A high-resolution numerical study of theAsian dust storms of April 2001, J. Geophys. Res., 108, 8653,doi:10.1029/2002JD003178, 2003.
Mahowald, N., Kohfeld, K., Hansson, M., Balkanski, Y., Harrison,S. P., Printice, I. C., Schulz, M., and Rodhe, H.: Dust sources anddeposition during the last glacial maximum and current climate:A comparison of model results with paleodata from ice cores andmarine sediments, J. Geophys. Res., 104, 15895–15916, 1999.
Manktelow, P. T., Carslaw, K. S., Mann, G. W., and Spracklen, D.V.: The impact of dust on sulfate aerosol, CN and CCN duringan East Asian dust storm, Atmos. Chem. Phys., 10, 365–382,doi:10.5194/acp-10-365-2010, 2010.
Marticorena, B. and Bergametti, G.: Modeling the atmospheric dustcycle: 1. Design of a soil-derived dust emission scheme, J. Geo-phys. Res., 100, 16415–16430, 1995.
Marticorena, B., Bergamettie, G., Aumont, B., Callot, Y.,N’Doume, C., and Legrand, M.: Modeling the atmospheric dustcycle: 2. Simulation of Saharan dust sources, J. Geophys. Res.,102, 4387–4404, 1997.
McNaughton, C. S., Clarke, A. D., Kapustin, V., Shinozuka, Y.,Howell, S. G., Anderson, B. E., Winstead, E., Dibb, J., Scheuer,E., Cohen, R. C., Wooldridge, P., Perring, A., Huey, L. G., Kim,S., Jimenez, J. L., Dunlea, E. J., DeCarlo, P. F., Wennberg, P.O., Crounse, J. D., Weinheimer, A. J., and Flocke, F.: Obser-vations of heterogeneous reactions between Asian pollution andmineral dust over the Eastern North Pacific during INTEX-B, At-mos. Chem. Phys., 9, 8283–8308,doi:10.5194/acp-9-8283-2009,2009.
Michel, A. E., Usher, C. R., and Grassian, V. H.: Heterogeneousand catalytic uptake of ozone on mineral oxides and dusts:A Knudsen cell investigation, Geophys. Res. Lett., 29, 1665,doi:10.1029/2002GL014896, 2002.
Mlawer, E. J., Taubman, S. J., Brown, P. D., Iacono, M. J., andClough, S. A.: Radiative transfer for inhomogeneous atmo-spheres: RRTM, a validated correlated-k model for the longwave,J. Geophys. Res., 102, 16663–16682, 1997.
Moya, M., Pandis, S. N., and Jacobson, M. Z.: Is the size distri-bution of urban aerosols determined by thermodynamic equilib-rium?: An application to Southern California, Atmos. Environ.,
36, 2349–2365, 2002.Midwest Research Institute: Analysis of fine fraction of particulate
matter in fugitive dust, Report to the WRAP by Midwest Re-search Institut, Project No. 110397, 2005.
Ndour, M., D’Anna, B., George, C., Ka, O., Balkanski, Y.,Kleffmann, J., Stemmler, K., and Ammann, M.: Photoen-hanced uptake of NO2 on mineral dust: Laboratory experi-ments and model simulations, Geophys. Res. Lett., 35, L05812,doi:10.1029/2007GL032006, 2008.
Ndour, M., Conchon, P., D’Anna, B., Ka, O., and George, C.:Photochemistry of mineral dust surface as a potential atmo-spheric renoxification process, Geophys. Res. Lett., 36, L05816,doi:10.1029/2008GL036662, 2009.
Nenes, A., Pilinis, C., and Pandis S. N.: ISORROPIA: a new ther-modynamic equilibrium model for multiphase multicomponentmarine aerosols, Aquatic Geochemistry, 4, 123–152, 1998.
Nenes, A., Pilinis, C., and Pandis, S. N.: Continued developmentand testing of a new thermodynamic aerosol module for urbanand regional air quality models. Atmos. Environ., 33, 1553–1560, 1999.
Nickovic, S., Kallos, G., Papadopoulos, A., and Kakaliagou, O.: Amodel for prediction of desert dust cycle in the atmosphere, J.Geophys. Res., 106, 18113–18129,doi:10.1029/2000JD900794,2001.
Nowottnick, E., Colarco, P., Ferrare, R., Chen, G., Ismail, S., An-derson, B., and Browell, E.: Online simulations of mineral dustaerosol distributions: Comparisons to NAMMA observations andsensitivity to dust emission parameterization, J. Geophys. Res.,115, D03202,doi:10.1029/2009JD012692, 2010.
Park, R. J., Jacob, D. J., Field, B. D., Yantosca, R. M.,and Chin, M.: Natural and trans-boundary pollution influ-ences on sulfate-nitrate-ammonium aerosols in the UnitedStates: implications for policy, J. Geophys. Res., 109, D15204,doi:10.1029/2003JD004473, 2004.
Pilinis, C., Capaldo, K. P., Nenes, A., and Pandis, S. N.: MADM-Anew multicomponent aerosol dynamic model, Aerosol Sci. Tech.,32, 482–502, 2000.
Pozzoli, L., Bey, I., Rast, S., Schultz, M. G., Stier, P.,and Feichter, J.: Trace gas and aerosol interactions in thefully coupled model of aerosol-chemistry-climate ECHAM5-HAMMOZ: 1. Model description and insights from the spring2001 TRACE-P experiment, J. Geophys. Res., 113, D07308,doi:10.1029/2007JD009007, 2008a.
Pozzoli, L., Bey, I., Rast, S., Schultz, M. G., Stier, P., and Feichter,J.: Trace gas and aerosol interactions in the fully coupled modelof aerosol-chemistry-climate ECHAM5-HAMMOZ: 2. Impactof heterogeneous chemistry on the global aerosol distributions,J. Geophys. Res., 113, D07309,doi:10.1029/2007JD009008,2008b.
Prospero, J. M., Ginoux, P., Torres, O., Nicholson, S. E., and Gill,T. E.: Environmental characterization of global sources of atmo-spheric soil dust identified with the nimbus 7 total ozone map-ping spectrometer (TOMS) absorbing aerosol product, Rev. Geo-phys., 40, 1002,doi:10.1029/2000RG000095, 2002.
Remer, L. A., Kaufman, Y. J., Tanre, D., Mattoo, S., Chu, D. A.,Martins, J. V., Li, R.-R., Ichoku, C., Levy, R. C., Kleidman, R. G.,Eck, T. F., Vermote, E., and Holben, B. N.: The MODIS aerosolalgorithm, products, and validation, J. Atmos., Sci., 62, 947–973,2005.
www.atmos-chem-phys.net/12/10209/2012/ Atmos. Chem. Phys., 12, 10209–10237, 2012
10236 K. Wang et al.: Dust emission and chemistry – the CMAQ modeling system
Rivera-Figueroa, A. M., Sumner, A. L., and Finlayson-Pitts, B. J.:Laboratory studies of potential mechanisms of renoxification oftropospheric nitric acid, Environ. Sci. Technol., 37, 548–554,2003.
Roselle, S. J., Appel, K. W., Foley, K. M., Bhave, P. V., Pleim, J.E., Mathur, R., Otte, T. L., Gilliam, R. C., Sarwar, G., Nolte, C.G., Gililand, A. B., Pinder, R. W., and Swall, J. L.: Incremen-tal testing of updates to the Community Multiscale Air Quality(CMAQ) modeling system version 4.7, the 7th Annual CMASconference, Chapel Hill, NC, USA, 6–8 October, 2008.
Roy, B., Mathur, R., Gilliland, A. B., and Howard, S. C.: A com-parison of CMAQ-based aerosol properties with IMPROVE,MODIS, and AERONET data, J. Geophys. Res., 112, D14301,doi:10.1029/2006JD008085, 2007.
Satheesh, S. K. and Moorthy, K. K.: Radiative effects of naturalaerosols: A review, Atmos. Environ., 39, 2089–2110, 2005.
Schwartz, S. E.: Mass-transport considerations pertinent to aqueousphase reactions of gases in liquid-water clouds, in: Chemistry ofMultiphase Atmospheric System, NATO ASI Ser., Ser. G: Ecol.Sci., vol. 6, edited by: Jaeschke, W., Springer-Verlag, New York,USA, 415–471, 1986.
Seinfeld, J. H. and Pandis, S. N.: Atmospheric Chemistry andPhysics: From Air Pollution to Climate Change, 2nd ed., Wiley,New York, USA, 2006.
Shao, Y.: A model for mineral dust emission, J. Geophys. Res., 106,20239–20254, 2001.
Shao, Y. and Dong, C. H.: A review on East Asian dust storm cli-mate, modelling and monitoring, Global Planet. Change 52, 1–22,doi:10.1016/j.gloplacha.2006.02.011, 2006.
Shao, Y., Fink, A. H., and Klose, M.: Numerical simulation ofa continental-scale Saharan dust event, J. Geophys. Res., 115,D13205,doi:10.1029/2009JD012678, 2010.
Solomos, S., Kallos, G., Kushta, J., Astitha, M., Tremback, C.,Nenes, A., and Levin, Z.: An integrated modeling study on theeffects of mineral dust and sea salt particles on clouds and pre-cipitation, Atmos. Chem. Phys., 11, 873–892,doi:10.5194/acp-11-873-2011, 2011.
Song, C. H., Kim, C. M., Lee, Y. J., Carmichael, G. R., Lee, B. K.,and Lee, D. S.: An evaluation of reaction probabilities of sulfateand nitrate precursors onto East Asian dust particles, J. Geophys.Res., 112, D18206,doi:10.1029/2006JD008092, 2007.
Spyrou, C., Mitsakou, C., Kallos, G., Louka, P., and Vlastou,G.: An improved limited area model for describing the dustcycle in the atmosphere, J. Geophys. Res., 115, D17211,doi:10.1029/2009JD013682, 2010.
Streets, D. G., Bond, T. C., and Carmichael, G. R.: An inventory ofgaseous and primary aerosol emissions in Asia in the year 2000,J. Geophys. Res., 108, 8809,doi:10.1029/2002JD003093, 2003.
Tanaka, T.: Global dust budget, in: Encyclopedia of Earth, editedby: Hanson, H., Environmental Information Coalition, NationalCouncil for Science and the Environment, Washington DC, USA,2007.
Tang, Y., Carmichael, G. R., Kurata, G., Uno, I., Weber, R. J., Song,C.-H., Guttikunda, S. K., Woo, J.-H., Streets, D. G., Wei, C.,Clarke, A. D., Huebert, B., and Anderson, T. L.: Impacts of duston regional tropospheric chemistry during the ACE-Asia exper-iment: A model study with observations, J. Geophys. Res., 109,D19S21,doi:10.1029/2003JD003806, 2004.
Tang, M. J., Thieser, J., Schuster, G., and Crowley, J. N.: Uptakeof NO3 and N2O5 to Saharan dust, ambient urban aerosol andsoot: a relative rate study, Atmos. Chem. Phys., 10, 2965–2974,doi:10.5194/acp-10-2965-2010, 2010.
Tegen, I. and Fung, I.: Modeling of mineral dust in the atmosphere:Source, transport, and optical thickness, J. Geophys. Res., 99,22897–22914, 1994.
Tie, X., Madronich, S., Walters, S., Edwards, D. P., Ginoux, P., Ma-howald, N., Zhang, R., Lou, C., and Brasseur, G.: Assessment ofthe global impact of aerosols on tropospheric oxidants, J. Geo-phys. Res., 110, D03204,doi:10.1029/2004JD005359, 2005.
Underwood, G. M., Song, C. H., Phadnis, M., Carmichael, G. R.,and Grassian, V. H.: Heterogeneous reactions of NO2 and HNO3on oxides and mineral dust: A combined laboratory and model-ing study, J. Geophys. Res., 106, 18055–18066, 2001.
Uno, I., Carmichael, G. R., Streets, D. G., Tang Y., Yienger, J. J.,Satake, S., Wang, Z., Woo, J.-H., Guttikunda, S., Uematsu, M.,Matsumoto, K., Tanimoto, H., Yoshioka, K., and Iida, T.: Re-gional chemical weather forecasting system CFORS: Model de-scriptions and analysis of surface observations at Japanese islandstations during the ACE-Asia experiment, J. Geophys. Res., 108,8668,doi:10.1029/2002JD002845, 2003.
Uno, I., Wang, Z., Chiba, M., Chun, Y. S., Gong, S. L., Hara,Y., Jung, E., Lee, S.-S., Liu, M., Mikami, M., Music, S., Nick-ovic, S., Satake, S., Shao, Y., Song, Z., Sugimoto, N., Tanaka,T., and Westphal, D. L.: Dust model intercomparison (DMIP)study over Asia: Overview, J. Geophys. Res., 111, D12213,doi:10.1029/2005JD006575, 2006.
Van Pelt, R. S. and Zobeck, T. M.: Chemical constituents of fugitivedust, Environ. Monit. Assess., 130, 3–16,doi:10.1007/s10661-006-9446-8, 2007.
Wagner, C., Hanisch, F., Holmes, N., de Coninck, H., Schuster, G.,and Crowley, J. N.: The interaction of N2O5 with mineral dust:aerosol flow tube and Knudsen reactor studies, Atmos. Chem.Phys., 8, 91–109,doi:10.5194/acp-8-91-2008, 2008.
Wang, K.: Multiscale multi-pollutant air quality modeling: Incorpo-ration of dust treatments into CMAQ and application for criteriaand hazardous air pollutants, Ph.D. thesis, North Carolina StateUniversity, Raleigh, NC, USA, 342 pp., 2011.
Wang, K. and Zhang, Y.: Development of an online dust mod-ule in CMAQ and its application to simulate the trans-Pacifictransport of Asian dust, the International Symposium on AsianDust/Aerosol and its Impact on Global Climate Change, Shang-hai, China, 8–10 August, 2010.
Wang, K., Zhang, Y., Jacobson, M. Z., Liang, J.-Y., and Magliano,K.: A Study of gas/particle partitioning using inorganic thermo-dynamic equilibrium modules and data from the California Re-gional PM10/PM2.5 Air Quality Study, the Workshop on Agri-cultural Air Quality: State of the Science, Potomac, MD, USA,5–8 June, 2006.
Wang, K., Zhang, Y., Jang, C., Phillips, S., and Wang, B.: Mod-eling intercontinental air pollution transport over the trans-Pacific Region in 2001 using Community Multiscale AirQuality modeling system, J. Geophys. Res., 114, D04307,doi:10.1029/2008JD010807, 2009.
Westphal, D. L., Toon, O. B., and Carlson, T. N.: A two-dimensionalnumerical investigation of the dynamics and microphysics of Sa-haran dust storms, J. Geophys. Res., 92, 3027–3049, 1987.
Atmos. Chem. Phys., 12, 10209–10237, 2012 www.atmos-chem-phys.net/12/10209/2012/
K. Wang et al.: Dust emission and chemistry – the CMAQ modeling system 10237
White, B. R.: Soil transport by winds on Mars, J. Geophys. Res.,84, 4643–4651, 1979.
Yang, X., Zhang, K., Jia, B., and Ci, L.: Desertification assessmentin China: An overview, J. Arid Environ., 63, 517–531, 2005.
Yarwood, G., Rao, S., Yocke, M., and Whitten, G. Z.: Updates tothe carbon bond mechanism: CB05, Report to the U.S. Environ-mental Protection Agency, RT-04-00675, 2005.
Yue, X., Wang, H., Wang, Z., and Fan, K.: Simulation of dustaerosol radiative feedback using the Global Transport Modelof Dust: 1. Dust cycle and validation, J. Geophys. Res., 114,D10202,doi:10.1029/2008JD010995, 2009.
Zender, C. S., Bian, H., and Newman, D.: Mineral DustEntrainment and Deposition (DEAD) model: Descriptionand 1990s dust climatology, J. Geophys. Res., 108, 4416,doi:10.1029/2002JD002775, 2003.
Zhang, K. M., Knipping, E. M., Wexler, A. S., Bhave, P. V., and Ton-nesen, G. S.: Size distribution of sea-salt emissions as a functionof relative humidity, Atmos. Environ., 39, 3373–3379, 2005.
Zhang, Y. and Carmichael, G. R.: The role of mineral aerosol intropospheric chemistry in East Asia - a model study, J. Appl.Meteor., 38, 353–366, 1999.
Zhang, Y., Sunwoo, Y., Kotamarthi, V., and Carmichael, G. R.: Pho-tochemical oxidant processes in the presence of dust: An evalua-tion of the impact of dust on particulate nitrate and ozone forma-tion, J. Appl. Meteor., 33, 813–824, 1994.
Zhang, Y., Liu, P., Pun, B., and Seigneur, C.: A comprehensiveperformance evaluation of MM5-CMAQ for the summer 1999Southern Oxidants Study episode-Part I: Evaluation protocols,databases, and meteorological predictions, Atmos. Environ., 40,4825–4838, 2006.
Zhang, Y., Vijayaraghavan, K., Wen, X.-Y., Snell, H. E., and Ja-cobson, M. Z.: Probing into regional O3 and PM pollution inthe U.S., Part I: A 1-year CMAQ simulation and evaluation us-ing surface and satellite data, J. Geophys. Res., 114, D22304,doi:10.1029/2009JD011898, 2009.
Zhang, Y., Cheng, S.-H., Chen, Y.-S., and Wang, W.-X.: Applica-tion of MM5 in China: Model evaluation, seasonal variations,and sensitivity to horizontal grid resolutions, Atmos. Environ.,45, 3454–3465, 2011.
Zhu, S., Butler, T., Sander, R., Ma, J., and Lawrence, M. G.: Impactof dust on tropospheric chemistry over polluted regions: a casestudy of the Beijing megacity, Atmos. Chem. Phys., 10, 3855–3873,doi:10.5194/acp-10-3855-2010, 2010.
www.atmos-chem-phys.net/12/10209/2012/ Atmos. Chem. Phys., 12, 10209–10237, 2012
Related Documents


![I. Origin of the dust emission from Tycho’s SNR II. Mapping observations of [Fe II] lines and dust emission of IC443 by IRSF & AKARI III. Summary AKARI.](https://static.cupdf.com/doc/110x72/56649eaa5503460f94bae7c8/i-origin-of-the-dust-emission-from-tychos-snr-ii-mapping-observations.jpg)


