Degree Project Javier de Muga 2010-01-29 Subject: computer science Level: master Course code: DA4014 Implementation of a 2D Graph Viewer

Welcome message from author
This document is posted to help you gain knowledge. Please leave a comment to let me know what you think about it! Share it to your friends and learn new things together.
Transcript

Degree Project
Javier de Muga
2010-01-29
Subject: computer science
Level: master
Course code: DA4014
Implementation of a 2D Graph Viewer

i
Abstract
The VizzAnalyzer tool is a program analysis tool with a 3D visualization component called
Vizz3D. It is used for visualizing the graphs created in the VizzAnalyzer using different
metaphors and layout algorithms. This tool is rather heavy weight and not well integrated
into Eclipse.
In order to view small graphs created by the VizzAnalyzer directly in Eclipse we
implemented a 2D graph viewer as an Eclipse View Plug-in which is able to view, layout
and manipulate graphs stored as Grail graphs with a nice interface.
The master thesis describes the background and architecture of Eclipse and third party
tools used, mainly Grail, Zest, Draw2D and SWT. It also documents how the Graph 2D
Viewer has been developed and implemented besides a brief guide for the GUI.

ii
Table of Content
1 Introduction .................................................................................................................... 1 1.1 Problem Description ............................................................................................... 1
1.2 Goals and Criteria ................................................................................................... 1 1.3 Context and Motivation .......................................................................................... 2 1.4 Outline .................................................................................................................... 2 2 Technical Background .................................................................................................... 3 2.1 Eclipse .................................................................................................................... 3
2.2 SWT ........................................................................................................................ 4 2.2.1 JFace ............................................................................................................... 4 2.3 GEF ......................................................................................................................... 5
2.3.1 Draw2D .......................................................................................................... 5 2.4 Zest ......................................................................................................................... 6 2.5 Grail ........................................................................................................................ 6
2.6 VizzAnalyzer .......................................................................................................... 6 3 Requirements .................................................................................................................. 8 3.1 Users ....................................................................................................................... 8
3.2 Features ................................................................................................................... 8 3.3 Use Cases ................................................................................................................ 9
3.4 Functional Requirements ...................................................................................... 13 3.5 Non Functional Requirements .............................................................................. 15 3.5.1 Look and feel ................................................................................................ 15
3.5.2 Usability ....................................................................................................... 15
3.5.3 Portability ..................................................................................................... 15 3.5.4 Extendibility ................................................................................................. 15 3.5.5 Performance .................................................................................................. 16
3.5.6 Constraints .................................................................................................... 16 4 Architecture .................................................................................................................. 17
4.1 Overview .............................................................................................................. 17 4.2 Zest ....................................................................................................................... 18 4.3 Grail ...................................................................................................................... 19
4.4 Plug-in architecture............................................................................................... 20 5 Design and Implementation .......................................................................................... 23
5.1 Overview .............................................................................................................. 23 5.2 Main Classes ......................................................................................................... 24
5.2.1 Graph2DView ............................................................................................... 24 5.2.2 GraphViewer ................................................................................................ 26 5.2.3 MyContentProvider ...................................................................................... 26 5.2.4 MyLabelProvider .......................................................................................... 27 5.2.5 MyViewerFilter ............................................................................................ 27
5.2.6 MyZoomManager ......................................................................................... 27 5.3 Actions .................................................................................................................. 28 5.4 Plug-in requirements ............................................................................................ 28 6 Conclusions and Future work ....................................................................................... 29
6.1 Conclusions .......................................................................................................... 29 6.2 Future work .......................................................................................................... 31

iii
References ....................................................................................................................... 32 Appendix A ..................................................................................................................... 33
A.1 Installation...........................................................................................................33
A.2 Operation of Graph 2D Viewer...........................................................................33
A.2.1 Open/close views.......................................................................................34
A.2.2 Interaction with views................................................................................37

iv
List of Figures
Figure 2.1: Eclipse overview………………………...………………………………………3
Figure 2.2: Draw2D structure……………………………………………………………….5
Figure 2.3: VizzAnalyzer……………………………………………………………………7
Figure 4.1: Architecture overview ………………………………………………………...17
Figure 4.2: Zest architecture……………………………………………………………….18
Figure 4.3: Inheritance structure of Grail ………………………………………………….19
Figure 4.4: Inheritance structure of Grail II………………………………………………..19
Figure 4.5: Model-View-Controller pattern………………………………………………..20
Figure 4.6: Graph 2D Viewer plugin.xml………………………………………………….22
Figure 5.1: Graph 2D Viewer Class Diagram……………………………………………...23
Figure 5.2: createPartControl() method of Graph2DView………………………………..24
Figure 5.3: Example of method makeActions () …………………………………………...25
Figure 6.1: Graph 2D Viewer GUI…………………………………………..…………….30
Figure 6.2: Graph 2D Viewer GUI II………………………………………………………31
Figure A.1: Open view button……………………………………………………………...34
Figure A.2: Open view selection…………………………………………………………...35
Figure A.3: Views related to plug-in……………………………………………………….36
Figure A.4: 2DGraphViewer view display………………………………………………...38
Figure A.5: Properties view General tab with 2DGraph Viewer view display……………41
Figure A.6: Properties view, Element Properties Selection tab display…………………...42
Figure A.7: Properties view, Graph Properties Selection tab display…………………….42
Figure A.8: Filter view with 2DGraph Viewer view display……………………………...43
List of Tables
Table 3.1: Features…………………………………………………………………..........8, 9
Table 3.2: Use Cases………………………………………………………………......…9-12
Table 3.3: Requirements……………………………………………………………..…13-15
Table A.1: Mouse and keyboard interactions with 2DGraph Viewer view…………....38, 39

v
Glossary
GML – Graph Modeling Language
SWT – Standard Widget Toolkit
GEF – Graphical Editor Framework
PDE – Plug-in Development Environment
API – Application Programming Interface
GUI – Graphical User Interface
UI – User Interface
RCP – Rich Client Platform
JDT – Java Development Tools
SDK – Software Development Kit
JDK – Java Development Kit
IDE – Integrated Development Environment
UML – Unified Modeling Language
MVC – Model View Controller
AWT – Abstract Window Toolkit
XML – Extensible Markup Language
OS – Operating System
MSI – Matematiska och Systemtekniska Institutionen (School of Mathematics and Systems
Engineering)

1
1 Introduction
This chapter describes which the context is where the thesis has been developed, what was
the problem to solve, which objectives should be achieved and what are the principles to
judge the solution as well as the motivation and a brief summary of the thesis.
1.1 Problem Description
Develop a tool for viewing, manipulating and layouting small graphs in different ways by
loading a graph stored in a GML file, this tool has to be well integrated with Eclipse.
This task is difficult to solve since tools and packages to visualize graphs are complex
frameworks. It is necessary a deep knowledge of each framework to make a proper use of
them. Furthermore graphs are stored in complex structures that should be understood well.
One time achieved the basic knowledge over frameworks we have to build an Eclipse plug-
in with a set of views and sections and a nice looking GUI, this task means to have a good
understanding of the Eclipse Platform API that is complex too.
1.2 Goals and Criteria
This section describes which are the goals pursued by this thesis in order to solve the
problem and the criteria used to validating these goals:
The first goal is to get an overview of available tools and select the suitable
technology to be used. This goal is met when the technology selected integrates well
with Eclipse, allows a lot of features apart from the main requirements, provides
high reusability and serves for drawing small graphs.
The main goal is the implementation of a viewer that allows showing a graph in 2D
by loading a GML file. The criteria for the visualization of a graph are that all the
elements, nodes and edges, contained in the file can be visualized in 2D.
Another goal is that the graphs in the visualization can be navigated. Navigation
means, zooming capabilities, moving of elements in the 2D space, visually select
the elements and display information of the selected elements. The zooming
capabilities are achieved when we can zoom in and out in the 2D space. Moving of
elements is successful when the elements of the visualization can be picked and
moved to a different position consistently with all the connected elements. Visually
select the elements is achieved when the element changes appearance when it is
selected and changes it back to its previous appearance when it is deselected.
Display the information of each element selected is reached when the information of
all the properties of the element are showed on the properties view.
Furthermore the manipulation of the view shall be possible. Manipulation includes
layout in different ways the graph and filtering and highlighting of the elements due
to different types of selections. Criterion for this goal is being able to change the
layout algorithm that determines the position of each element on the visualization.
For the filtering, the elements that fulfill the properties selected with the GUI shall
not be shown on the view. Highlighting changes the appearance of the elements that
accomplish the properties selected with the GUI.

2
Besides these goals, the integration of the viewer in Eclipse is another goal. This
criterion is met by using the Eclipse plug-in views architecture.
1.3 Context and Motivation
The VizzAnalyzer[1] is a tool for analyzing large software systems, it has a 3D
visualization component called Vizz3D. It is used for visualizing the graphs created in the
VizzAnalyzer using different metaphors and layout algorithms. This tool is rather heavy
weight and currently not well integrated into Eclipse. To view small graphs created by the
VizzAnalyzer directly in Eclipse, we would need some better integration allowing viewing
and layouting of graphs in various ways.
The thesis is based on the development of the VizzAnalyzer framework; the 2D Graph
Viewer adds a new feature expanding the development by solving the requirement of a light
graph viewer integrated in Eclipse with a Graphical User Interface based on SWT that
provides a user friendly environment completely integrated due to the use of the Eclipse
Plug-in feature.
1.4 Outline
The thesis is structured as follows. Chapter 2 provides an overview of the technology used
on the development of the thesis and what are the reasons for using each technology, this
chapter builds the basic knowledge about the technology used. Chapter 3 builds the
foundations of the development by describing the functional requirements and features of
the thesis represented by use cases. Chapter 4 describes the Eclipse architecture used as a
base for the solution and analyzes the architecture of the third party tools used. Chapter 5
covers the design and implementation of the plug-in with an explanation of every view,
GUI and feature involved. Chapter 6 concludes the thesis and describes the future work to
do.

3
2 Technical Background
This section gives a brief description of the technologies which are referenced through this
thesis, Eclipse platform, SWT, GEF, Zest and Grail frameworks besides the VizzAnalyzer
tool.
2.1 Eclipse
Eclipse is a multi-language software development platform comprising an IDE with a built-
in incremental Java compiler and a full model of the Java source files. This allows for
advanced refactoring techniques and code analysis. It is written primarily in Java and is
used to develop applications in this language and, by means of plug-ins, in other languages.
With the exception of a small run-time kernel, all the functionalities provided by Eclipse
are plug-ins in contrast with other applications where the funtionality is hard coded. This
means that every plug-in developed integrates with Eclipse in the same way as other plug-
ins, all features are created equal. The plug-ins are the smallest function unit of the Eclipse
Platform. Each plug-in is described by an XML file called manifest, which stores the
information needed by Eclipse to active the plug-in.
Figure 2.1 shows the major components, and APIs, of the Eclipse Platform such as the
Workbench plug-in, the graphical environment in which all of the work will be done,
formed by the JFace and SWT plug-ins, the Platform Runtime kernel and the Workspace
plug-in that maintains everything needed by the developer for building and testing a
project.
Figure 2.1: Eclipse overview [11]

4
The widgets for Eclipse are implemented by the widget toolkit for Java SWT. Eclipse’s
user interface uses an intermediate GUI layer called JFace which simplifies the construction
of applications based on SWT.
Widgets are elements of a GUI that displays an information arrangement changeable by
the user. The defining characteristic of a widget is to provide a single interaction point for
the direct manipulation of a given kind of data. Widgets are basic visual building blocks
which, combined in an application, hold all the data processed by the application and the
available interactions on this data. [9]
Eclipse provides the Eclipse RCP for developing general purpose applications. It is
composed by the following components:
Equinox OSGi : A standard bundling framework
Core platform: Boots eclipse and runs the plug-ins
SWT: A portable widget toolkit
JFace: Provides viewer classes to bring MVC to SWT
Eclipse Workbench: Provides views, editors, perspectives and wizards. [10]
The thesis has been developed with the PDE subproject that provides tools to create,
develop, test, debug, build and deploy RCP Eclipse Plug-ins.
PDE is built at top of the Eclipse Platform and JDT, and is a part of the Eclipse SDK.
2.2 SWT
SWT is an open source widget toolkit for Java. Its main feature is that provides efficient
native widget functionality for the Eclipse platform in an operating system independent
manner. It has a common API for accessing native widgets across diferent platforms.
The differences between SWT and Swing widget toolkit is that SWT features a clean
design and is relatively simpler than Swing but with less extraneous functionality for the
average developer, Swing is designed to allow a highly customizable look and feel that is
common across all platforms in contrast to SWT that has native look and feel.
Although SWT does not implement the popular Model-View-Controller architecture
used in Swing and many other high level GUI toolkits, the JFace library, which is
developed as part of the same Eclipse project, does provide a platform-independent, higher-
level Model-View-Controller abstraction on top of SWT. Developers choose to use JFace
to provide more flexible and abstract data models for complex SWT controls such as trees,
tables, lists and graphs, or access those controls directly as needed. [2] [14]
2.2.1 JFace
JFace is a UI toolkit for developing features that can be tedious to implement. It is a toolkit
designed to work with SWT without hiding it and brings MVC programming to it.
The main features that JFace provides are :
Viewer classes: A viewer is an adapter for a SWT widget that performs the more
common widget-manipulation tasks as populating, sorting, filtering, and updating.
JFace viewers allow to create a MVC architecture

5
Actions: The actions allow users to define their own behaviour and to assign that
behaviour to specific components, e.g. menu items, tool items, push buttons, etc.
JFace is completely dependent on SWT but SWT is independent from JFace.
Furthermore, the Eclipse Workbench is built on both JFace and SWT but in some instances
it bypasses JFace and accesses SWT directly. [3] [7] [14]
2.3 GEF
The Graphical Editing Framework is an open source framework that provides a rich and
consistent graphical editing environment for the Eclipse Platform applications. GEF is
composed of two plugins, Draw2D and GEF. Draw2D is a painting and layout plug-in that
provides figures and layout managers which form the graphical layer of a GEF application.
GEF is an interactive MVC framework built on top of Draw2D. [15]
2.3.1 Draw2D
Draw2d is a lightweight toolkit of graphical components called figures. Figures can be
composed by a parent-child relationship Figures can be composed via a parent-child
relationship. Every figure has rectangular bounds inside which it, and its children, paints. A
layout manager can be used to place children based on their index and/or constraint.
Figure 2.2: Draw2D structure [8]

6
A LightweightSystem associates a figure composition with an SWT Canvas. The
lightweight system hooks listeners for most SWT events, and forwards most of them to an
EventDispatcher, which translates them into events on the appropriate figure. Paint events,
however, are forwarded to the UpdateManager, which coordinates painting and layout.
Figures can be updated in ways which affect their appearance or size, and the update
manager ensures that only one layout occurs, followed by a repaint of only the region
which was updated. In Figure 2.2 we can observe the schema of the association between
Figures and Canvas.
Any type of diagram, document, or drawing can be easily constructed and efficiently
updated by combining the provided figure and layout implementations along with the use
of custom figures or layouts when needed.
2.4 Zest
Zest is a set of visualization components built for Eclipse. The primary goal of Zest is to
make graph based programming easy and this is one of the main features of it. The library
has been developed in SWT and integrates seamlessly within Eclipse.
Zest has been modeled after JFace, and all the Zest views conform to the same standards
and conventions as existing Eclipse views. Another feature offered by Zest is that graphs
are considered SWT Components because are wrapped using standard JFace viewers. Zest
also contains a graph layout package which offers a set of different layout algorithms to use
as Spring, Tree, Grid or Radial Layout Algorithm that provide layout locations for a set of
entities and relationships
2.5 Grail
Grail is an open source Java library for creating, capturing and manipulating graphs.
It has been developed at the MSI of Växjö University. The main features of this library is
that it is a quite fast and flexible implementation for small to medium sized graphs,
considered lightweight graphs. It describes basically attributed entities and their relations.
Tools like the VizzAnalyzer use Grail for representing their internal structures. This thesis
uses Grail library to manipulate the graph structures and values.
2.6 VizzAnalyzer
The VizzAnalyzer is a stand-alone tool for analyzing and visualizing structure and internal
quality of large software systems. It extracts information from a system’s source code,
performs further analyses and applies quality metrics. Finally it visualizes the results, e.g.
with Vizz3D, yEd, Graph 2D Viewer. Further programming languages, analyses/metrics
and visualization tools can be integrated using the VizzAnalyzer Framework. The
VizzAnalyzer is easily adaptable to the quality needs of a certain company or project and
can be harmoniously integrated in existing development processes.
7
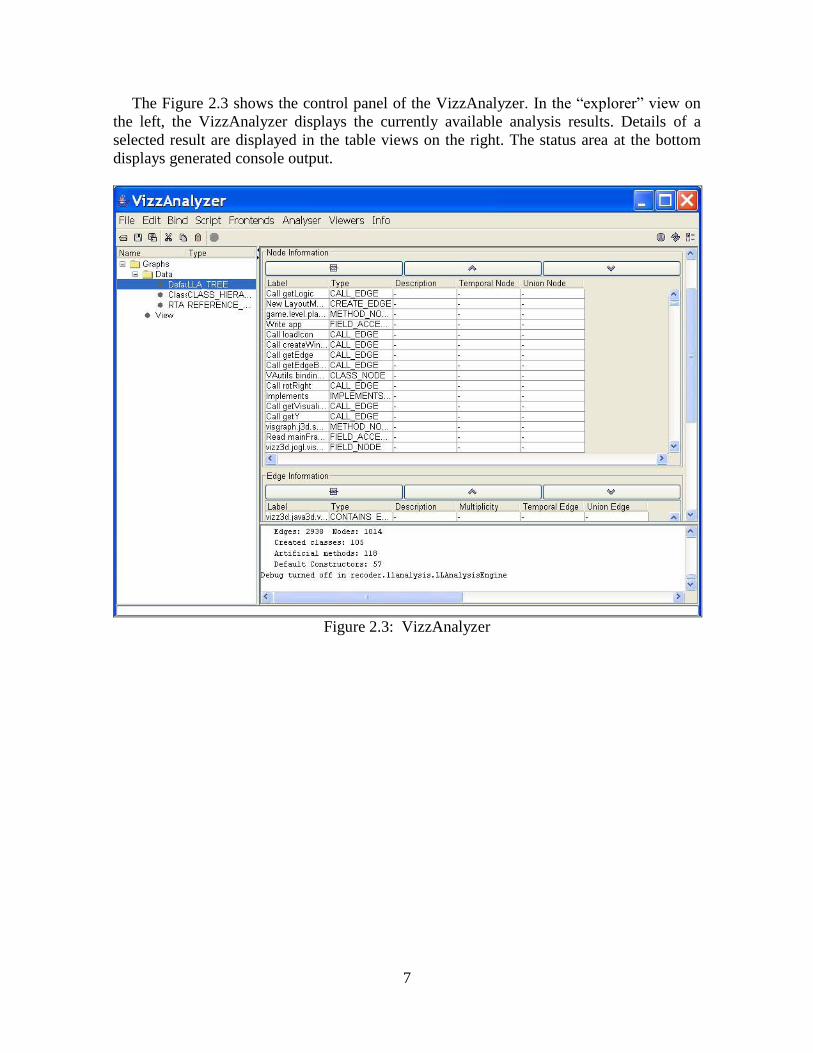
The Figure 2.3 shows the control panel of the VizzAnalyzer. In the “explorer” view on
the left, the VizzAnalyzer displays the currently available analysis results. Details of a
selected result are displayed in the table views on the right. The status area at the bottom
displays generated console output.
Figure 2.3: VizzAnalyzer

8
3 Requirements
We provide in this chapter an overview about the requirements specification for the Graph
2D Viewer.
First comes a brief description of the main features the viewer shall provide. Then we
describe the system’s behavior through uses cases related with the features required. Finally
there will be an explanation of the non functional requirements.
3.1 Users
The users expected for the Graph 2D Viewer are developers and consultants.
The end-users control the Graph 2D Viewer by loading a graph file and interacting with
the GUI and the graph values and properties. It is assumed that the users are people with
knowledge about VizzAnalyzer, familiar with Java programming and UML to understand
the graph properties showned by the Graph 2D Viewer. They use it for study or
investigation purposes and have the required skill to handle it properly.
3.2 Features
Feature 01 Select the graph file to display Description: The software allows to select any GML file stored on the hard
drive to open it and display the graph.
Feature 02 Visualization of graphs Description: The developed software is capable of creating a visualization of
the graph held in the graph data file and display it on the screen. The display contains the elements of the graph and if exist, some visualization properties as colors or labels.
Feature 03 Use of different layouts Description: It is possible to change the visualization after the graph has
been displayed by selecting different layout algorithms that determine the position of single elements in the 2D space.
Feature 04 Navigation of the graph view Description: The layouts can not eliminate all the overlaps. In order to solve
this problem drag and zoom actions are added. It is possible for the user to navigate through the visualization by zooming in and out on the view, it is possible to zoom off returning to the primary visualization scale of all the graph. It is possible to zoom to a region of the graph view using a rectangle marquee tool. It is possible to zoom to a selected set of nodes. When mouse is over an element of the view the label of the element, if exists, is showed. When doubleclick on a node the label is showed in a browser, if label is html it is rendered on the browser.
Feature 05 Selection of graph elements

9
Description: Elements in the graph can be picked and selected, the selection is made visible through a highlighting of the node, it is possible to make multiple selections. It is possible to select elements with a selection marquee tool. The selected elements can be dragged to another position keeping the connections integrity.
Feature 06 Display information of selected elements Description: The software displays in a properties view all the information of
the element selected, it is possible to change the value of the properties.
Feature 07 Manipulation of the graph view Description: It is possible to select sets of elements according to different
properties dialogs and then filter or highlight these elements. Filtering means hiding the elements selected from the view and highlighting means changing the color of the node.
Feature 08 Eclipse plug-in Description: The developed software is a plug-in for Eclipse open source
platform that integrates seamlessly with other tools. Feature 09 Native OS GUI Description: The implemented GUI for the plugin is fully realized with SWT
that provides a native OS look and feel allowing platform compatibility.
Table 3.1: Features
3.3 Use Cases
The use cases describe the scenarios of how the user has to interact with the system to
achieve the specific goal, each use case is related to one or more feature. Every use case has
a title, a brief description, which actors are involved, the conditions of the system before
and after the use-case and the steps of each task in the basic and alternative flows.
Use Case UC1 Create new graph view Feature#: F01, F02, F08, F09
Description: This use case describes how the user creates a new graph view from a
file.
Actors: User
Preconditions: Application has to be started and ready to answer to some action.
Post conditions: The graph viewer view is displayed and is ready to receive actions or
interactions. The GUI is loaded too.
Basic flow: Open graph view
1. The User selects “Show view Graph 2D Viewer”
2. The System displays a load File dialog
3. The User selects a GML File from the hard drive.
a. If the User selects “Cancel” the System returns to
precondition.
4. The User selects “Open” button from the dialog

10
5. The System reads the data from the file parses it and displays a
new graph view with the properties of the specified file.
Alternate flow: View already opened
1. The User selects the icon action “Open a new graph file”
2. The System displays a load File dialog
3. The User selects a GML File from the hard drive.
a. If the User selects “Cancel” the dialog is closed and the
view stays
4. The User selects “Open” button form the dialog
5. The System reads the data from the file parses it and displays the
new graph view with the properties of the specified file.
Use Case UC2 Set of Actions Feature#: F01, F02, F03, F04
Description: This use case describes the possible user action interactions of the GUI
involving navigation, selection and changing algorithm layout.
Actors: User
Preconditions: The graph view has to be loaded; the System has to be ready to answer
actions.
Post conditions: The action has been executed without errors and the System is ready to
answer for more actions.
Basic flow: Change layout algorithm of the graph view
1. The User selects the action “Change Layout Algorithm”
2. The User selects an algorithm from the list showed by the
dialog.
a. If the user selects “Cancel” the System returns to
precondition.
3. The User selects “Apply”
4. The System displays the graph elements with the new layout
algorithm, the elements change their position.
Alternate flow: Select a set of elements of the graph view
1. The User selects the action “Selection marquee”
2. The User drags the mouse from one position to another. The
System draws at the same time a dynamical rectangle between
the positions where the user clicked and released the mouse.
3. The System selects all the elements of the graph view that are
inside the marquee selection.
Alternate flow: Zooming actions
1. The User selects one of the zooming actions.
a. Basic zooms, zoom in, zoom out and zoom off
i. The System updates the display according to the
action.
b. Zoom selection marquee.
i. The User drags the mouse from one position to

11
another. The System draws a dynamical rectangle
between the positions where the user clicked and
released the mouse and selects the area.
ii. The System updates the display zooming to the
selected area.
c. Zoom to selection
i. The System updates the display zooming to the
set of elements selected.
Use Case UC3 Interact with the display Feature#: F04, F05, F06
Description: This use case describes the interactions that the user can do directly
with the drawn graph elements on the view.
Actors: User
Preconditions: The graph view has to be loaded and ready to answer for interaction.
Post conditions: The display has been updated according to the interaction done.
Basic flow: Select the elements
1. The User selects any element by clicking on their figure on the
display.
2. The System highlights the elements selected
3. The User can select sets of elements by selecting figures with
the “Control” key pressed.
4. The User deselects all by clicking on an area without figures in
the display.
5. The System unhighlight the previously selected nodes.
Alternate flow: Move the elements
1. The User drags a node or a set of nodes to another point of the
display.
2. The System updates the display of the nodes dragged and also
the relations of the nodes.
Alternate flow: Show the label of an element
1. The User puts the mouse over an element of the display.
2. The System shows the label
Alternate flow: Show the html of an element
1. The User double-clicks an element of the display.
2. The System shows the label rendered as html on a browser.
Use Case UC4 Views and perspectives Feature#: F06, F07
Description: This use case describes the properties view and filter view that the user
might use to have more functionality.
Actors: User
Preconditions: No preconditions to see the views. For making actions on the views it is
a precondition the loading of a graph in the graph view and a selection
for the properties view. For the filter view it is a precondition a dialog
selection of elements.
Post conditions: Graph properties, node and edge information is showed by the
properties view; dialogs for selecting elements are showed. Filter view

12
has executed
Basic flow: Properties view
1. The User selects an element/elements
2. The System updates the properties view with the information of
the element selected. Selecting dialogs become active.
a. Selecting dialogs
i. The User can select elements with the selecting
dialogs.
ii. The System stores the element selected for
filtering
b. Change properties
i. The User can change the values of the properties
ii. The System stores the new value on the graph
structure.
Alternate flow: Filtering view
1. The User selects/deselects the filtering or highlighting option
2. The System updates the display filtering or highlighting
elements.
Use Case UC5 Install / Uninstall plug-in Feature#: F08
Description: This use case describes how the user has to install and uninstall the
plug-in.
Actors: User
Preconditions: The Eclipse Platform installed, it has been tested for v3.4 but should
work for future versions and previous versions since v3.2. It is also
needed the .jar file of these software.
Post conditions: The plug-in has been installed or removed from the Eclipse platform
Basic flow: Install the plug-in
1. The User copies the .jar archive to the eclipse main folder,
subfolder plugins.
2. The User restarts Eclipse platform with the “-clean” argument
Alternate flow: Uninstall the plug-in
1. The User deletes the .jar archive of the plug-in from the eclipse
main folder, subfolder plugins.
2. The User restarts Eclipse platform with the “-clean” argument.
Table 3.2: Use Cases

13
3.4 Functional Requirements
This section describes the important functions and tasks that the Graph 2D Viewer is
required to provide and perform well, the requirements are result of the features and use-
cases described above.
Requirement R01 Draw Graph Event/use case#: UC1
Description: The System shall provide the capability of creating a visualization of a
graph on the display from a GML file according to a layout algorithm.
Rationale: It is necessary to display the visualization at the screen because is the
easiest way of having an overall perspective of a graph structure and
properties.
Criterion: The System is able to display in 2D all the graph elements stored in the
file.
Requirement R02 Select layout algorithms Event/use case#: UC2
Description: The System shall provide the possibility of select and change the layout
algorithm to be used.
Rationale: Different visualizations provide more information of the structure and
properties of the graph.
Criterion: The User is able to select between different algorithms and the System
applies the algorithm and updates the display
Requirement R03 Elements labeled Event/use case#: UC1, UC3
Description: The product has to display the elements on the screen with their label;
the size of the nodes should fit the text of the label.
Rationale: It is necessary to show the label information at a glance because it is the
main property of each node that differentiates the elements.
Criterion: The user is able to see the nodes as figures with the label inside. The
edges show the label too.
Requirement R04 Colors of elements Event/use case#: UC1
Description: The software shall paint each element of the display with color if they
have a color value in the color property.
Rationale: Colored graphs provide more structural information than non colored
graphs, they have also better look and feel.
Criterion: The user sees the nodes or edges colored with their own color property
Requirement R05 Zooming capabilities Event/use case#: UC2
Description: The product shall provide the capability of zooming in and out of the
view.
Rationale: Some graphs have a big amount of elements, with the layout algorithms
we cannot assure that there is not going to be some elements overlapped
or too much elements in the same area. To solve this problem we can
use the zooming capabilities to show small parts in the display with
more details
Criterion: The User can zoom in to the viewpoint, to the selected elements or to an
area; the User can zoom out and zoom off.
Requirement R06 Select elements Event/use case#: UC3
Description: The System has to allow the User to select an element or a set of

14
elements.
Rationale: It is necessary for the User to interact with the visualization to see
properties of each element; the way to interact is by selecting elements
of the view.
Criterion: The User is able to select elements from the view and the elements are
highlighted to differentiate them.
Requirement R07 Move elements Event/use case#: UC3
Description: The software shall provide the ability to move the selected elements
from one point to another of the display.
Rationale: Capability of moving elements is necessary for the User in order to sort
the graph elements to the desired position and obtain a thinner structure.
Criterion: The User is able to move the elements selected through the display.
Requirement R08 Show properties Event/use case#: UC4
Description: The software shall provide the ability of showing all the properties of
each element selected.
Rationale: Show the properties is one of the main ways for the user to interact with
the view, it is the main source of information.
Criterion: The User is able to display all the different properties information of
each node selected.
Requirement R09 Change properties Event/use case#: UC4
Description: The software shall provide the capability of changing the showed
properties.
Rationale: It is necessary for the User to be able of changing the property values of
each element for having more control of the graph and facilitating the
investigation or study purposes of the graph viewer.
Criterion: The User is able to change the properties of each element
Requirement R10 Select elements by properties Event/use case#: UC4
Description: The product shall provide selection of elements by their properties.
Rationale: It is necessary for the User to be able of selecting a set of elements due
to some characteristic of a property for filtering purposes and it makes
easier to analyze the graph properties.
Criterion: The User can select a set of elements by defining in a dialog which
property or value wants to match.
Requirement R11 Select elements by dialogs Event/use case#: UC4
Description: The software shall provide selection of elements by global properties of
the graph not specifically showed on the elements properties.
Rationale: Graphs have some global properties that it is necessary for the User to
use for filtering and analyzing graphs purposes.
Criterion: The User can select a set of elements by the neighbours level of the
outgoing or ingoing edges.
Requirement R12 Filtering Event/use case#: UC4
Description: The product shall provide with a filtering tool to hide/unhide the
elements already selected by dialogs.
Rationale: It is necessary to reduce the amount of elements in the visualization to
focus in the desired set of elements that fulfill certain conditions.
Criterion: The User has the option of hiding a set of elements or unhiding a

15
previously hided set.
Requirement R13 Highlighting Event/use case#: UC4
Description: The product shall provide with a highlighting tool to observe which are
the elements already selected by dialogs.
Rationale: It is necessary to have a tool to highlight a determined set of elements to
observe clearly which the elements of the set are.
Criterion: The User is able to highlight or unhighlight a set of elements previously
selected with a dialog.
Requirement R14 Views Event/use case#: UC4
Description: The software shall provide a graph viewer view and some views
associated that show the properties and for filtering.
Rationale: The views provide a better integration with Eclipse and an easier user
interface.
Criterion: The User is able to navigate through the views, position and resize
them.
Table 3.3: Requirements
3.5 Non Functional Requirements
Non functional requirements are the qualities of the system in contrast with the functional
requirements that define specific behaviors.
3.5.1 Look and feel
The product shall use SWT user interface, the software will adapt to the look and feel of
each SO where it is executed.
3.5.2 Usability
The software shall be a plug-in for Eclipse with all the characteristics of usability involved.
The product shall have a friendly GUI.
3.5.3 Portability
The product shall be portable to any platform that supports Eclipse Platform.
3.5.4 Extendibility
The product shall be extensible with new layout algorithms and new filters for the elements
on the view.

16
3.5.5 Performance
The execution of the product shall be performed in reasonable time; the layout algorithms
take the highest demand of resources. Because it is software for lightweight graphs the
performance requirement is not mandatory.
3.5.6 Constraints
The constraints determine the used language for implementation, the choice of the APIs for
graphics and structures and the structure to be used.
Eclipse plug-in: The description of the thesis force the constraint of using the
Eclipse plug-in architecture.
Use of Java: The requirement of being an Eclipse plug-in and a part of the
VizzAnalyzer framework already implemented in Java determines that the language
that shall be used is Java.
Use of Grail: The use of Grail is a constraint described by the thesis description as
the VizzAnalyzer framework uses Grail structures to store the graph.
Zest: It is not a constraint by means but it was encouraged by the thesis description.
It is a high level Graph API allowing fast development of graph viewers because
there are many features implemented.

17
4 Architecture
This chapter describes the architecture used for the development of a system that fulfills the
requirements described in the previous Chapter 3. Firstly there is a brief overview of the
architecture of the thesis with the components involved in it, secondly the components Zest
and Grail respective architectures and finally the conceptual architecture of the plug-in.
4.1 Overview
The architecture of the product is composed by four main components that will be
described in the next subchapters.
The Eclipse Platform contains the core frameworks and services upon which all plug-in
extensions are created. The product of the thesis is the component Graph 2D Viewer, this
component is an Eclipse plug-in
As we can see on Figure 4.1, the Graph 2D Viewer uses the visualization component
Zest which provides a viewer and algorithms to render the graph. The viewer is filled with
the data of the graph extracted by the Grail library. The Graph 2D Viewer uses the viewer
to display the algorithm and the MVC design pattern to make actions over the graph view
and other views related.
Figure 4.1: Architecture overview

18
4.2 Zest
The architecture of Zest is divided in two main components, Zest core and Zest layouts.
The layouts package is a device independent library of algorithms. It can be used with a
variety of rendering engines. Each algorithm assigns size and location information to nodes
and edges in a graph. Some of the layout algorithms that are supported are: tree, vertical,
horizontal tree, spring, radial and grid.
Zest core is an SWT based rendering engine for nodes, edges and containers. It is built
on top of Draw2D; Zest provides a number of optimizations for graphs and integrates
smoothly with other SWT / Draw2D interfaces.
Zest core wraps JFace viewers, Chapter 2.2, adding more features as allowing
developers to create graphs by specifying the datamodel through a content provider.
Because the graphs are often specified in different forms (edge lists, nodes with
connections, or combinations of the two), Zest offers 3 different content provider
interfaces: IgraphContentProvider, IgraphEntityContentProvider and
IGraphEntityRelationshipContentProvider from which the IgraphContentProvider is the
more useful if the data is structured as a list of edges as in Grail.
Figure 4.2 shows an overview of the Zest architecture. This layered architecture implies
that components are dependent on those components below them. Zest requires the layouts,
Draw2D and JFace, while JFace and Draw2D require SWT. [4]
Figure 4.2: Zest architecture [4]

19
4.3 Grail
This open source Java library describes graphs as attributed entities with their relations; it is
a fast and flexible implementation for lightweight graphs.
As we can see in Figure 4.3, all the elements stored in the graph descends from the
interface Element, which is one of the more useful classes when using this library because
it can describe any element, node, edge or graph container of the view.
We can obtain the nodes or edges stored in a Grail structure by using iterators for each
type of element as we can see on Figure 4.4.
Properties of the elements on the graph can be converted from any type to String, see
Figure 4.4, this makes easier to represent the properties as text.
Grail also offers a GML parser that is able to read from a GML file and store it in a Grail
graph structure or to write to a GML file a Grail graph.
Figure 4.3: Inheritance structure of Grail [6]
Figure 4.4: Inheritance structure of Grail II [6]

20
The inheritance structure of Grail. Nodes are classes (boxes) and interfaces (diamonds).
The color scheme of nodes encodes the top-level packages of classes and interfaces. The
color scheme of edges distinguishes implements (green) and extends (blue) relations. [6]
4.4 Plug-in architecture
The plug-in architecture of the thesis is based in the Model-view-controller (MVC)
architectural pattern. This pattern isolates business logic from user interface considerations;
an application with this pattern is able to modify the visual appearance or the business rules
without affecting the other. The model represents the data of the application, the view
corresponds to the elements of the GUI and the controller manages the communication of
data, the business rules used to manipulate the data to and from the model. In Figure 4.5 we
can see the MVC architectural pattern diagram with an explanation of which interactions,
changes or updates that can be done with the different entities. [12].
Figure 4.5: Model-View-Controller pattern

21
In the thesis architecture, the Controller is a Zest viewer that acts as a widget container that
retrieves the data from a ContentProvider that fetches the data in a structured manner and
the LabelProvider that obtains the labels respectivly. The Zest viewer is able of layouting,
selecting, filtering and sorting. The Model is the data parsed from the graph file to a Grail
structure that is stored in the viewer. The View is all the GUI which involves the data
displayed as a graph through the layout algorithm the actions and all the different views and
widgets.
The lifecycle of the plug-in view begins when the view is added to a workbench page.
This occur when the User invokes Perspective > Show View. The following lifecycle is
performed .
1. An instance of the view class is instantiated.
2. The context of the view is initialized.
3. The main method of the view called. The SWT controls are created in this method
within a parent Composite.
When the view is closed the lifecycle is completed.
1. The parent Composite passed to the main method is disposed. This children are
also implicitly disposed.
2. The view disposal method is called to terminate the part lifecycle.
The plug-in views architecture is defined by the plugin.xml which contains the
extensions that allow the plug-in itself to be extended. In figure 4.6 we can observe that we
have the main view called Graph2DView and a second view FilterView.

22
Figure 4.6: Graph 2D Viewer plugin.xml

23
5 Design and Implementation
This chapter describes the thesis design and implementation, based on the requirements,
Chapter 3 and the architecture of the system, Chapter 4. The first subchapter is an
overview of the design, it continues with the description of the main classes, the actions
implemented and the requirements associated is the next point and finally the plug-in
requirements.
5.1 Overview
In this section we will make an overview of the class diagram design of the plug-in
solution. Not all the classes and methods are represented, just the most important.
The main part of the Graph 2D Viewer is the Zest viewer graph layout on the main view.
On the Figure 5.1: Graph 2D Viewer Class Diagram shows the class of the main view
called Graph2DView and the class of the Zest viewer, GraphViewer. The main view has an
instance of the viewer that serves for the purpose of populating the viewer, maintaining the
MVC model and defining the layout and the styles of the connections and nodes.
The green classes are provided by JFace and the Eclipse Platform Framework while the
orange classes are implemented by the Zest visualization toolkit, the white classes are the
implementation of the Graph 2D Viewer plug-in.
Figure 5.1: Graph 2D Viewer Class Diagram

24
5.2 Main Classes
This section describes the most important classes of the design with their main methods.
5.2.1 Graph2DView
This class creates the main view with the display of the graph using a Zest viewer. It
extends the UI default view class ViewPart to achieve all the Eclipse view properties. The
class also populates the toolbar and menus with the actions GUI and implementation.
We will describe the most important methods of this class already seen on Figure 5.1:
Void createPartControl (Composite parent): The main method of the view, this
method is called when the view is opened. Within this method the view can create
any number of SWT controls within a parent Composite. In this method the Zest
viewer is instantiated as a SWT control. The getFile() method is called to obtain the
graph file and it is parsed to a Grail GraphInterface structure with the GML parser.
This method initializes the values of the Zest viewer setting the Grail structure as
input data, setting the nodes and connections styles, setting the content and label
providers and the initial layout algorithm to be used.
To show the properties of the graph viewer in a different view, it is necessary to
inform the Workbench that the selection provider will be the graph viewer.
The method initializes a zoom manager for the Zest widget.
The view has to be populated with the GUI and actions and that is done through the
call of the next methods, makeActions (), hookContextMenu(),
hookMouseClickAction() and ContributToActionBars() in this order. The methods
are described next. Figure 5.2 shows the basic code of the method.
Figure 5.2: createPartControl() method of Graph2DView

25
Void makeActions (): In this method we instantiate the JFace actions setting the
icons, the label and the implementation of the run method of each action. There is
an example in Figure 5.3.
Figure 5.3: Example of method makeActions ()
Void hookContextMenu (): The method creates a right button popup menu filled
with the actions already implemented and registers it as a menu for the Zest graph
viewer.
Void hookMouseClickAction (): The method hooks the actions that the user
performs with the mouse with the actions implemented for each movement, this is
done through a mouse listener.
Void contributetoActionBars (): This method fills the toolbars and the local
pulldown UI with the actions and updates the state of the actions added to the action
bars.
ArrayList getProperties(): This method obtains the common properties of the
selected elements on the Zest viewer.
String getFile(): This method opens a SWT file dialog to select the graph file to
load, it restricts the file types to GML.

26
5.2.2 GraphViewer
This class is already implemented by Zest and it is a JFace viewer extended with more
functionality for graph management and layouting. This class provides the view with the
MVC model. We can see in Figure 5.1 the relations of the GraphViewer and some of its
methods. We will explain the main methods because is the basic class for the development
of the thesis.
Void setInput (Object): This method sets the data that the viewer is going to use.
Void setContentProvider(IContentProvider): The method sets the content provider
class to be used to read the data.
Void setLabelProvider(ILabelProvider): The method sets the label provider.
Void setLayoutAlgorithm (LayoutAlgorithm): The method sets the layout algorithm
going to be used when applying the layout.
Void applyLayout(): Renders the current layout to the view.
Void addFilter(ViewerFilter): The method adds a filter to the viewer and executes
the filter rendering the layout with the elements that pass the filter, the filters are
added on top of the other filters, the new filter only filters elements that already
passed the primary filters.
ISelection getSelection(): Obtains the elements visually selected by the user.
Void setSelection(ISelection): Sets a selection of elements.
Object getAdapter(Class): If the class to be checked implements the interface of the
properties view then we return an instance of the properties view, this method
allows the properties view to be showed.
5.2.3 MyContentProvider
This class obtains the elements stored in the viewer input data in a structured manner by
extending the Zest interface IGraphContentProvider. The class casts the raw elements to
Grail classes and uses Grail iterators to obtain all the elements. The data in Grail is
structured as a list of edges, to obtain the nodes we have to search the source and
destination of each edge. Main methods are:
Object[] getElements(Object data): This method obtains all the edges from a graph
Object getSource(Object rel): The method obtains all the nodes from which is
source the edge passed as parameter.
Object getDestination (Object rel): The method obtains all the nodes where the
directed edge points to.
ArrayList getDepthNodes(EdgeInterface[] edges, int depth, NodeInterface[],
Boolean in, Boolean out): This recursive method returns all the nodes that are at
integer depth from another node. This method serves the purpose of filtering nodes
at “n” level of deepness.

27
5.2.4 MyLabelProvider
The label provider class obtains the labels and colors of the elements from the data stored in
the viewer. This class extends the LabelProvider class and implements the interface
IColorProvider. The methods of this class are:
Image getImage (Object): This method returns null, should be
String getText(Object): The method returns the property label of each Object, the
object has to be casted to Grail Element to do that.
Color getBrackground (Object): This method checks if there is a color property on
each element and if it exists it returns the Color stored in the property. This returned
color will change the background color of the Figure associated to the Element.
Color getForeground (Object): This method checks if there is a color property on
each element and if it exists it returns the Color stored in the property. This returned
color will change the foreground color of the Figure associated to the Element.
5.2.5 MyViewerFilter
The viewer filter class implemented extends the JFace ViewerFilter class by implementing
the methods required to filter a viewer, this methods are:
Boolean select(Viewer viewer, Object parent, Object element): The method returns
true if the element passes the filter, false if the element has to be filtered. The
method calls to isFilterProperty or to isNodeDepthLevel methods to check if the
element fulfills the requirements to pass the filter.
Boolean isFilterProperty (Object element, String value, String property): The
method returns true if the property of the element exists and the value entered by the
User is empty or if the property exists and parsed with the value it returns a Boolean
true. This method uses a Javascript parser to evaluate the concatenation of the
property with the value.
Boolean isNodeDepthLevel(ArrayList nodes, Object element): This method returns
a Boolean true if the element is contained in the nodes ArrayList which stores the
nodes that should pass the filter because of being at the adequate deepness level that
we want to filter, else it returns false.
5.2.6 MyZoomManager
The zoom manager class implemented extends the GEF ZoomManager class providing
more features. The GEF ZoomManager is already able to zoom in, zoom out and zoom to a
determined level of zooming, being the level 1 the zoom off action. The class has these new
methods:
zoomTo(Rectangle): This method receives a Rectangle which has been selected by
the User with a selection marquee tool and sets the view location to this rectangle,
in other words, the rectangle selected is amplified occupying all the viewer display.

28
zoomToSelection(IStructuredSelection): This method receives a structured
selection, the elements returned by the Zest viewer method getSelection() and sets
the view location to the rectangle that contains all the elements Figure of the
selection. Amplifies the viewer display to a rectangle in which all the Figures of the
selected elements are showed.
selectionMarquee(Rectangle): This method sets the Zest viewer selection,
setSelection() method, with all the elements which its Figures are contained by a
Rectangle. This Rectangle has been selected by the User with a selection marquee
tool. With this method, the user is able to select sets of elements by drawing a
Rectangle on the display that contains their Figures.
5.3 Actions
In this section we are going to describe the implementation of the actions in the UI and the
requirements fulfilled by each one, the requirements are described on Chapter 3.
Zooms: The zooms actions are addressed by the Requirement R05. The zoom
actions are “Zoom in” , “Zoom out” , “Zoom off” which execution consists
on just selecting the icon button of each one. The “Zoom Selection Marquee”
execution consists on selecting the icon and dragging the mouse from one place of
the display to another drawing a rectangle which will be the area amplified. The
“Zoom to Selection” action execution consists of selecting the icon button and
having some previously selected elements on the graph viewer.
Visual selections: The “Selection marquee” fulfills the Requirement R06, to be
able of selecting sets of elements. The execution of the action consists of selecting
the icon and dragging the mouse creating a selection rectangle, all elements which
Figures are inside the rectangle will be selected.
Layout algorithm: The “Change Layout Algorithm” action is executed when the
User selects the icon, a Dialog selection is opened from which the User should
select an algorithm to use, when the algorithm is selected and the User press the
“Apply” button the graph view is displayed with the new algorithm. The
requirement fulfilled with this action is the Requirement R02.
5.4 Plug-in requirements
The plug-in software of the thesis has been implemented using Eclipse 3.4.2. Framework
but should work with older and new versions, this point has not been tested.
The 3rd
party tools required are the next plug-ins:
GEF plug-in: org.eclipse.gef.3.4.x
Tabbed properties view plug-in: org.eclipse.ui.views.properties.tabbed_3.4.x
Zest toolkit: org.eclipse.zest.core.1.0.0 and org.eclipse.zest.layouts.1.0.0
Grail library: se.vxu.msi.grail
VizzAnalyzer: se.vxu.msi.vizzanalyzer

29
6 Conclusions and Future work
This last chapter reflects the results of the thesis by showing the extent to which the
problem described in the introduction has been solved and if the goals have been met. It
also points out the next steps to take in the development and improvement of the solution.
6.1 Conclusions
Over the past’s chapters of the thesis we described the background, architecture and
implementation of a complex software problem addressed by the introduction, it was:
“Develop a tool for viewing, manipulating and layouting small graphs in different ways
by loading a graph stored in a GML file, this tool has to be well integrated with Eclipse.”
The concrete description of the problem is pointed out in Chapter 1.2 through the goals
and criteria section. These goals are the base for specifying the requirements in Chapter 3
and the requirements are transformed into the different components of the solution in
Chapter 4 architecture. Chapter 5 describes the implementation of the solutions
architecture.
To show the extent to which the problem has been solved we should check the
achievement of the criteria of the goals described in Chapter 1.2.
The first goal was to select the suitable technology; this goal is met with Zest as we can
see in Chapter 2.3 with the background of this technology and in Chapter 4.2 which offers
details of the architecture of Zest and how is integrated seamlessly in Eclipse. As can be
seen on Figure 6.1 and Figure 6.2 the toolkit is able to draw graphs.
The goal of implementing a viewer that allows showing graphs in 2D by loading a GML
file is met due to the use of a Grail GML file parser and graph structure which is flexible
and can hold any graph by describing the relations between nodes and edges, Chapter 4.3.
Once the graph stored, it is possible to show the graph in 2D with the Zest Graphviewer
class (Chapter 5.2.1) and a layout algorithm associated.
Navigation of the visualization goal was achieved. The selection and moving of
elements is provided by the Zest Graphviewer class that wraps JFace viewers (Chapter
5.2.1 and Chapter 2.2). The Graphviewer allows visual selection of elements, highlighting
when selected and moving the selected nodes of the view to different positions around the
2D space and connecting edges move with the node. The zooming capabilities such as
zoom in and zoom out are available, Chapter 5.2.5, and described together with the rest of
actions at Chapter 5.3. The properties view displays the information of the selected
elements and updates the information when selection changes, the Figure 6.1shows a
screenshot of the properties view.
The goal of manipulation is met by allowing the User to change the layout algorithm of
the view through the GUI. In Figure 6.2 we can see the changing layout selection box and
the matrix layout view of the graph.
The filtering and highlighting capabilities are achieved through a ViewerFilter class
described at Chapter 5.2.4 together with the GUI from which we can select the elements
with the property we want and also select which action to take if filter/defilter or
highlight/unhighlight.

30
The last goal is the integration of the viewer in Eclipse that was achieved by using the
plug-in views architecture. Chapter 4.1 shows an overview of the architecture and Chapter
4.4 explains the plug-in view internal architecture and external coupling with Eclipse
Taking in consideration the positive results of the goals stated in the beginning of the
thesis described on the previous paragraphs, it can be concluded that the problem
concerning this thesis has been solved.
Figure 6.1: Graph 2D Viewer GUI

31
Figure 6.2: Graph 2D Viewer GUI II
6.2 Future work
The Graph 2D Viewer plug-in is a tool which serves to its purpose but should be refined to
serve to a commercial purpose. There are several improvement branches for future work:
The plug-in has a considerable amount of features and the possibility of some bugs
in non tested combinations is high, thereby a more accurate software testing should
be done.
The plug-in was developed with version 1.0.0 of Zest visualization toolkit, but this
toolkit is still being developed and new versions are actually available that offer
newer features as optimal zoom and marquee, possibility of changing the nodes
figure (e.g. UML figures) or more layout algorithms. Update the visualization
toolkit is one of the main improvements that could be done.
Test compatibility with other versions of Eclipse.
The GUI could be improved creating more user friendly views and a perspective.
New filters depending on the user requirements could be implemented to achieve a
concrete functionality.

32
References
[1] VizzAnalyzer homepage (May 2009) http://www.arisa.se/vizz_analyzer.php
[2] Standard Widget Toolkit description and references ( June 2009)
http://en.wikipedia.org/wiki/Standard_Widget_Toolkit
[3] JFace description and references (June 2009) http://en.wikipedia.org/wiki/JFace
[4] “Model Driven Visualization: Towards a Model Driven Engineering Approach for
Information Visualization” by Robert Ian Bull. 2008
[5] Zest homepage (June 2009) http://wiki.eclipse.org/Mylyn_Zest_Visualization
[6] ”The VizzAnalyzer Handbook” by Thomas Panas, Rüdiger Lincke, Welf Löwe.
Technical Report. October 2005.Växjö University.
[7] Eclipse FAQ (April 2009) http://wiki.eclipse.org/The_Official_Eclipse_FAQs#JFace
[8] Draw2D Guide (June 2009)
http://help.eclipse.org/ganymede/index.jsp?topic=/org.eclipse.draw2d.doc.isv/guide/guide.h
tml
[9] GUI Widget (June 2009) http://en.wikipedia.org/wiki/GUI_widget
[10] Eclipse (April 2009) http://en.wikipedia.org/wiki/Eclipse_(software)
[11] Eclipse Plug-in Architecture (June 2009) http://www.eclipse.org/articles/Article-Plug-
in-architecture/plugin_architecture.html
[12] Model View Controller (June 2009) http://en.wikipedia.org/wiki/Model-view-
controller
[13] Creating and Eclipse View (May 2009)
http://www.eclipse.org/articles/viewArticle/ViewArticle2.html
[14] ”SWT/Jface in Action” by Matthew Scarpinos, Stephen Holder, Stanford NG and
Laurent Mihalkovic. 2005
[15] ”GEF In Depth” by Randy Hudson and Pratik Shah, IBM Rational Software Research
Triangle Park, NC. EclipseCon 2005

33
Appendix A User Manual
This chapter contains the instructions for the end-user about installation and operation of
the Graph 2D Viewer, the first subchapter describes how to install the plug-in while the
second subchapter describes how to use the features of the application.
A.1 Installation
There is not an automated process to install the Graph 2D Viewer plug-in in Eclipse. In the
following the manual installation is described.
As a standard of Java applications, our plug-in and necessary dependencies are stored in
jar files. When running Eclipse, it searches for all the plug-ins to be loaded in the plug-ins
directory. To install our plug-in we have to copy all the jar files required by Graph 2D
Viewer in the plug-ins directory. For instance, if we create a new directory for our plug-in
this could be: C:\eclipse\plugins\Graph2DViewer. Once installed the plug-in it is necessary
to restart Eclipse for the plug-in to be recognized. In case the plug-in has not been loaded,
use the argument -clean to flush Eclipse cache when running it.
The required files and their description follow:
se.arisa.vizz2d_1.0.0.jar – This jar file contains the source code and binaries of the
plug-in developed in this thesis. In addition, the plug-in requires the other jars to
work properly.
se.vxu.msi.vizzanalyzer.cmm_1.0.5.200910262016.jar – This jar file contains the
source code and binaries of VizzAnalyzer
se.vxu.msi.grail_1.9.53.200910262016.jar – The Grail library described in Chapter
2.5 is contained in this jar file.
org.eclipse.zest.layouts_1.0.0.v20080226.jar – The Zest layouts available are stored
in this jar file.
org.eclipse.zest.core_1.0.0.v20080115.jar – This jar file contains the binaries of the
Zest visualization toolkit described in Chapter 2.4.
org.eclipse.gef_3.4.1.v20080806.jar – The GEF described in Chapter 2.3 is stored
in this jar file.
org.eclipse.draw2d_3.4.2.v20090114-1330.jar – This jar file contains the draw2D
toolkit described in Chapter 2.3.1.
A.2 Operation of Graph 2D Viewer
The Graph 2D Viewer plug-in consists of a group of Eclipse views that share all the
properties and capacities inherited from the views. The main view related to the Graph 2D
Viewer which shows the visualization of the graph is called 2DGraph Viewer, other two
views used by the plug-in are the default view Properties and a view to filter the graph
called Filter View.

34
A.2.1 Open/close views
There are two ways of opening the views, Figures A.1 and A.2 show which buttons press to
open the views dialog where to select the required views. In Figure A.3 the view dialog is
shown and the required views for the plug-in are selected in blue color.
Figure A.1: Open view button

35
Figure A.2: Open view selection

36
Figure A.3: Views related to plug-in
When opening the 2DGraph Viewer view an Open dialog is shown. In this dialog the
graph file with extension .gml that contains the specification of the graph can be located
and loaded. By pressing the button Open while having the graph already selected the plug-
in will display the graph on the view with its characteristics and the default layout.
In order to close a view just press the close button on the top right part of each view .

37
A.2.2 Interaction with views
This subchapter shows the different possible interactions with the views and describes how
to do each one of them. There are three views related to the Graph 2D Viewer: Properties
view, Filter view and 2DGraph Viewer view, which is the most important and where the
main interactions occur.
2DGraph Viewer view interactions
The 2DGraph Viewer is a navigable view where the user can perform actions on the
window display to modify the graph; we can see an example of the 2dGraph Viewer view
at Figure A.4, the icons for extra actions are on the top right part. Table A.1: Mouse and
keyboard interactions, describes how to achieve the different possible actions.
There are two types of interactions, directly over the display of the graph on the view or
through the pressing of the icons that activate other action possibilities. When describing
the mouse/keyboard action, we will consider the shortcut Icon as a Mouse button 1 pressing
while cursor is over the referred icon on the table.
The icons menu could also be seen by pressing mouse button 2 if the cursor is inside the
view window display. It is also available in a drop down menu on the right corner of the
view.

38
Figure A.4: 2DGraphViewer view display
Icon Action Mouse/Keyboard action
Explanation
- Simple selection Mouse button 1 Point with the mouse cursor to an element and press mouse button 1, the element now is selected and highlighted.
- Deselection Mouse button 1 Point with the mouse cursor to a space without elements in the windows display then press mouse button 1.
- Multiple
selection/deselectio
n
Mouse button 1 + Ctrl key
Holding key Ctrl point with the mouse cursor and press mouse button 1 over every element to be selected and highlighted. To deselect repeat the process holding Ctrl key.
- Move selection Mouse button 1 + move
Point with the mouse cursor to an element of the highlighted selection, press mouse button 1 and move the

39
mouse while holding button. The selection moves with the cursor, release button to accept actual position.
Selection marquee Icon + Mouse button 1 + move
Point with the mouse cursor to an empty region situated top left from the nodes we want to select. Hold mouse button 1 and move mouse to the right and down, a rectangle selection zone will be drawn where the nodes contained will be selected when releasing mouse button 1. Works as a multiple selection of node elements.
Zoom in Icon Moves the viewpoint closer to the center of the graph.
Zoom out Icon Moves the viewpoint away to the center of the graph.
Zoom marquee Icon + Mouse button 1 + move
Point with the mouse cursor to an empty region situated top left from the region we want to zoom on. Hold mouse button 1 and move mouse to the right and down, a rectangle selection zone will be drawn, when releasing the button the viewpoint will be the enclosure of the rectangle selected.
Zoom to selection Icon Moves the viewpoint to the selected selection enclosure, if no selection selected no action is done.
Zoom off Icon Moves the viewpoint to the original position.
Change layout Icon + Mouse button 1 twice
A selection dialog is opened when clicking icon, select algorithm positioning the cursor over its name and pressing mouse button 1, then press mouse button 1 on apply button.
- Show label Mouse button 1 doubleclick
Point with the cursor to an element, double-click with mouse button 1 and a window will pop up containing the full label, if this label is of Html type it will be drawed on the window.
Table A.1: Mouse and keyboard interactions with 2DGraph Viewer view

40
Properties view interactions
The tabbed Properties view implemented, which is an extension of the default properties
view integrated in Eclipse, has three different tabs, each one with different possible
interactions. The General tab is the basic tab where the properties of the elements selected
is shown, the Element Properties Selection tab allows the user to preselect elements
depending on the existence of properties and optionally with a matching condition on a
property. Lastly, in the Graph Properties Selection tab the user can preselect a set of nodes
neighbors of the actually selected node at deepness level 1-5, with ingoing, outgoing or
both type of edges.
Both Element Properties Selection and Graph Properties Selection tabs are much related
to the Filter view because the elements preselected with both tabs have to be hided or
highlighted to be viewable as a selection by the viewer.
The General tab part is basically a static element that shows the properties of each
element, differentiating between nodes and edges. The only interaction the user is able to
do is change the value of the integer, boolean and string type properties by pointing the
mouse cursor in the value box of a property and double-click with mouse button 1, and this
will allow editing the value deleting the previous. This interaction, however, is useless in
this version because the properties of the graph are not saved when closing the plug-in.
In Figure A.5 there is a demonstration on how the Properties view General tab shows
the information of an element selected and how it can be integrated with the 2DGraph
Viewer view.

41
A.5: Properties view General tab with 2DGraph Viewer view display
The Element Properties Selection tab of the Properties view, as we can see in Figure
A.6, is formed by a drop-down list box with the names of the properties of the selected
element, if no element is selected the list box is empty. Furthermore, there is a text box to
introduce selection conditions to the property selected, only elements with the property
selected and matching the condition entered by the user will be preselected. In the case
there is no condition, the preselected elements will be the ones that have the property
selected. The selection condition is based in a JavaScript parser; consequently its
comparison operators must be used.
The plug-in does not support error handling on the selection condition; any user error
introducing a comparison will involve a probable malfunction on the plug-in.
JavaScript comparison operators:
== test for equality
!= test for inequaltiy
> test greater than
>= test greater than or equal

42
< test less than
<= test less than or equal
The user interaction consists of selecting a property from the drop-down menu by
pointing with the mouse cursor at the facing down triangle of the drop down menu and then
pressing mouse button 1, the drop-down menu will be opened and then moving the cursor
mouse to the property name to be selected and pressing mouse button 1, the property will
remain selected. Once selected a property the user might press the button Select to preselect
all the elements that have this property or fill the text box with a condition to restrict the set
and afterwards press the button Select.
Example condition: considering Boolean property isDeprecated, the user could define a
selection condition to preselect only the elements that are not deprecated. Selection
condition text box would be filled with “!=true”.
A.6: Properties view, Element Properties Selection tab display
The Graph Properties Selection tab of the Properties view is formed by a text box with
the selected element name, a drop-down menu where the user selects the deepness level
where the neighbors have to be searched and finally two radio buttons where the user
selects which nodes will be preselected depending on the type of edges they have, the
possibilities are Outgoing nodes, Ingoing nodes or both. Figure A.7 shows a screenshot of
the Graph Properties Selection tab with an element selected which name is Files.
A.7: Properties view, Graph Properties Selection tab display

43
Filter view interactions
The Filter view is a simple view with two buttons which purpose is to show the preselected
items selected with the properties view advanced tabs. There are two buttons, Highlight and
Hide buttons which interact with the Graph2DView; highlighting the preselected elements
and hiding the not preselected elements while re-layouting the view respectively. Both
buttons stay hold when pressed; releasing them will undo the changes at the Graph2DView.
Figure A.8 shows a screenshot of the Filter view integrated with the Properties view and
the Graph2DView
A.8: Filter view with 2DGraph Viewer view display

Related Documents