0 IMPERIAL COUNTY AIR POLLUTION CONTROL DISTRICT [Insert Image] August 20, 2018 Exceptional Event Documentation For the Imperial County PM 10 Nonattainment Area An exceedance of the National Ambient Air Quality Standard (NAAQS) for PM10 at the El Centro monitor in Imperial County, California on August 20, 2018

Welcome message from author
This document is posted to help you gain knowledge. Please leave a comment to let me know what you think about it! Share it to your friends and learn new things together.
Transcript
0
IMPERIAL COUNTY AIR POLLUTION CONTROL DISTRICT
[Insert Image]
August 20, 2018
Exceptional Event Documentation For the Imperial County PM10 Nonattainment Area
An exceedance of the National Ambient Air Quality Standard (NAAQS) for PM10 at the El Centro monitor in Imperial County, California on August 20, 2018
August 20, 2018 Exceptional Event, Imperial County Table of Contents
i
TABLE OF CONTENTS SECTION PAGE I Introduction .................................................................................................................................. 1
I.1 Public Notification [40 CFR §50.14(c)(1)] .............................................................. 3 I.2 Initial Notification of Potential Exceptional Event (INPEE)
(40 CFR §50.14 (c)(2)) ................................................................................................... 3 I.3 Public Comment Process [40 CFR §50.14(c)(3)(v)(A-C)] .................................. 4 I.4 Mitigation of Exceptional Events [40 CFR §51.930] .......................................... 4
II Conceptual Model – A narrative that describes the event causing the exceedance and a discussion of how emissions from the event led to the exceedance at the affected monitor .................................................................................... 9 II.1 Description of the event causing the exceedance ............................................ 9 II.2 How emissions from the event led to an exceedance .................................... 10
III Clear Causal Relationship – A demonstration that the event affected
air quality illustrating the relationship between the event and the monitored exceedance .................................................................................................................................. 18 III.1 Summary of Forecasts and Warnings ................................................................... 25 III.2 Summary of Wind Observations ............................................................................ 26
IV Concentration to Concentration Analysis – An analyses comparing the event-influenced concentrations to concentrations at the same monitoring site at other times .............................................................................................................................. 27
V Both Not Reasonably Controllable and Not Reasonably Preventable – A demonstration that the event was both not reasonably controllable and not reasonably preventable ........................................................................................................... 30 V.1 Other PM10 Control Measures ................................................................................. 31 V.2 Wind Observations ...................................................................................................... 33 V.3 Review of Source Permitted Inspections and Public Complaints ............... 34
VI A Natural Event – A demonstration that the event was a human activity that is unlikely to recur at a particular location or was a natural event .............................. 37 VI.1 Affects Air Quality ........................................................................................................ 37 VI.2 Not Reasonably Controllable or Preventable .................................................... 37 VI.3 Natural Event ................................................................................................................. 38

August 20, 2018 Exceptional Event, Imperial County Table of Contents
ii
VI.4 Clear Causal Relationship .......................................................................................... 38 VI.5 Concentration to Concentration Analysis ........................................................... 38 VI.6 Conclusion ...................................................................................................................... 38
Appendix A: National Weather Service Notices ......................................................................... 40
Appendix B: Wind Data ....................................................................................................................... 85
Appendix C: Public Information and other Notices ................................................................. 119

August 20, 2018 Exceptional Event, Imperial County Table of Contents
iii
LIST OF FIGURES FIGURE PAGE Figure 1-1 Imperial County ............................................................................................................. 6
Figure 1-2 Monitoring Sites in And Around Imperial County ............................................ 8
Figure 2-1 Monitoring and Meteorological Sites .................................................................. 10
Figure 2-2 Concentrations for All Sites Listed in Table 2-1 ................................................ 12
Figure 2-3 Local and Vicinity Airport Wind Speeds and Gust ........................................... 13
Figure 2-4 Wind Speeds and Gust Upstream Sites ............................................................... 14
Figure 2-5 HYSPLIT Model All Sites August 20, 2018 1500 PST ....................................... 15
Figure 2-6 HYSPLIT Model Imperial County Sites August 20, 2018 1800 PST ............ 16
Figure 3-1 Wall of Dust Moving Across Imperial County ................................................... 19
Figure 3-2 Visual Ramp-Up Analysis as Discussed for August 20, 2018 ....................... 20
Figure 3-3 72-Hour Time Series PM10 Concentrations and Visibility .............................. 21
Figure 3-4 Imperial Valley Air Quality Index for El Centro August 20, 2018 ................ 25
Figure 4-1 El Centro Historical Comparison FRM and FEM PM10 24-Hr Avg
Concentrations January 1, 2010 To August 20, 2018 ...................................... 28
Figure 4-2 El Centro Seasonal Comparison FRM and FEM PM10 24-Hr Avg Concentrations July 1, 2010 To August 20, 2018 ............................................. 29
Figure 5-1 Regulation VIII Graphic Timeline Development ................................................ 31
Figure 5-2 Permitted Sources ....................................................................................................... 35
Figure 5-3 Non-Permitted Sources ............................................................................................. 36
August 20, 2018 Exceptional Event, Imperial County Table of Contents
iv
LIST OF TABLES TABLE PAGE Table 1-1 Title 40 CFR §50.14(c)(3)(iv) Checklist .................................................................... 1
Table 1-2 Procedural Checklist .................................................................................................... 2 Table 2-1 Hourly Concentrations of Particulate Matter ..................................................... 11
Table 3-1 Wind Speeds and PM10 Concentrations August 20, 2018............................. 22
Table 3-2 Wind Speeds and PM10 Concentrations August 20, 2018............................. 23
Table 3-3 Wind Speeds and PM10 Concentrations August 20, 2018............................. 24
Table 5-1 San Diego Air Pollution Control District Rules .................................................. 32
Table 5-2 Mojave Desert Air Quality Management District Rules ................................. 32
Table 5-3 South Coast Air Quality Management District Rules ...................................... 33

August 20, 2018 Exceptional Event, Imperial County Table of Contents
v
ACRONYM DESCRIPTIONS AOD Aerosol Optical Depth AQI Air Quality Index AQS Air Quality System BACM Best Available Control Measures BAM 1020 Beta Attenuation Monitor Model 1020 BLM United States Bureau of Land Management BP United States Border Patrol CAA Clean Air Act CARB California Air Resources Board CMP Conservation Management Practice DCP Dust Control Plan DPR California Department of Parks and Recreation EER Exceptional Events Rule EPA Environmental Protection Agency FEM Federal Equivalent Method FRM Federal Reference Method GOES-W/E Geostationary Operational Environmental Satellite (West/East) HC Historical Concentrations HYSPLIT Hybrid Single Particle Lagrangian Integrated Trajectory Model ICAPCD Imperial County Air Pollution Control District INPEE Initial Notification of a Potential Exceptional Event ITCZ Inter Tropical Convergence Zone KBLH Blythe Airport KCZZ Campo Airport KIPL Imperial County Airport KNJK El Centro Naval Air Station KNYL/MCAS Yuma Marine Corps Air Station KPSP Palm Springs International Airport KTRM Jacqueline Cochran Regional Airport (aka Desert Resorts Rgnl Airport) PST Local Standard Time MMML/MXL Mexicali, Mexico Airport MODIS Moderate Resolution Imaging Spectroradiometer MPH Miles Per Hour MST Mountain Standard Time NAAQS National Ambient Air Quality Standard NCAR National Center for Atmospheric Research NCEI National Centers for Environmental Information NEAP Natural Events Action Plan NEXRAD Next-Generation Radar

August 20, 2018 Exceptional Event, Imperial County Table of Contents
vi
NOAA National Oceanic and Atmospheric Administration nRCP Not Reasonably Controllable or Preventable NWS National Weather Service PDT Pacific Daylight Time PM10 Particulate Matter less than 10 microns PM2.5 Particulate Matter less than 2.5 microns PST Pacific Standard Time QA/QC Quality Assured and Quality Controlled QCLCD Quality Controlled Local Climatology Data RACM Reasonable Available Control Measure RAWS Remote Automated Weather Station SIP State Implementation Plan SLAMS State Local Ambient Air Monitoring Station SMP Smoke Management Plan SSI Size-Selective Inlet USEPA United States Environmental Protection Agency USGS United States Geological Survey UTC Coordinated Universal Time WRCC Western Regional Climate Center
August 20, 2018 Exceptional Event, Imperial County Introduction
1
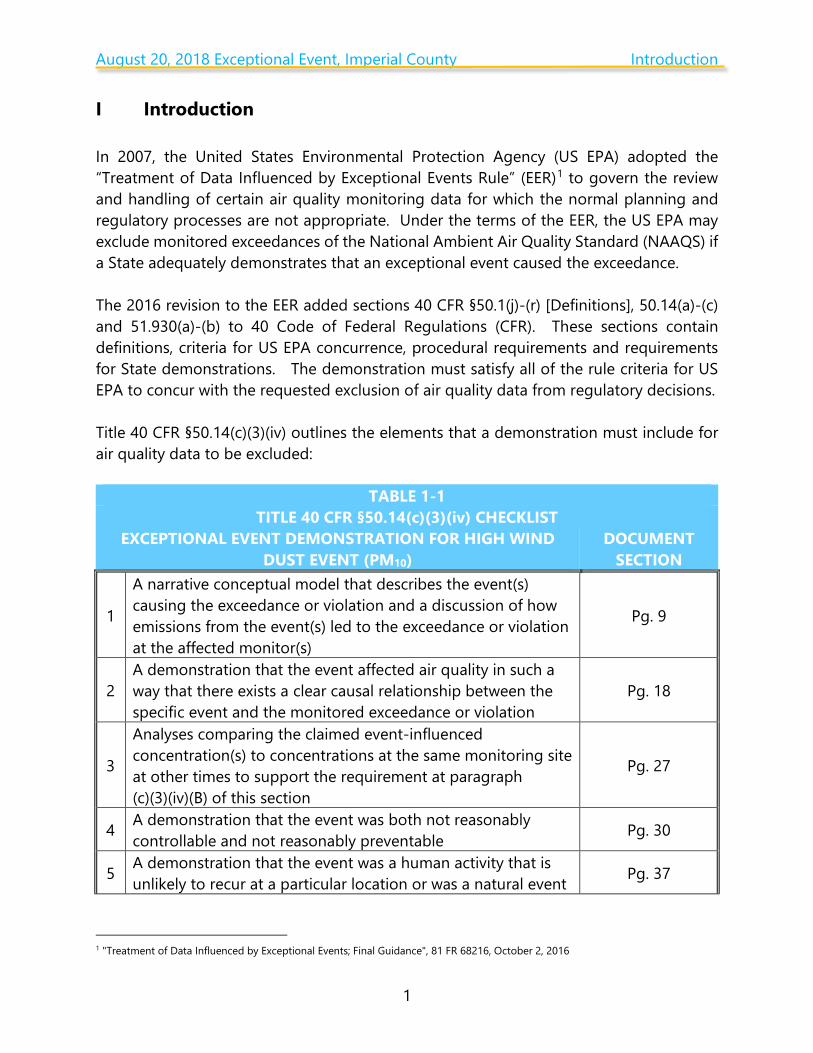
I Introduction In 2007, the United States Environmental Protection Agency (US EPA) adopted the “Treatment of Data Influenced by Exceptional Events Rule” (EER)1 to govern the review and handling of certain air quality monitoring data for which the normal planning and regulatory processes are not appropriate. Under the terms of the EER, the US EPA may exclude monitored exceedances of the National Ambient Air Quality Standard (NAAQS) if a State adequately demonstrates that an exceptional event caused the exceedance. The 2016 revision to the EER added sections 40 CFR §50.1(j)-(r) [Definitions], 50.14(a)-(c) and 51.930(a)-(b) to 40 Code of Federal Regulations (CFR). These sections contain definitions, criteria for US EPA concurrence, procedural requirements and requirements for State demonstrations. The demonstration must satisfy all of the rule criteria for US EPA to concur with the requested exclusion of air quality data from regulatory decisions. Title 40 CFR §50.14(c)(3)(iv) outlines the elements that a demonstration must include for air quality data to be excluded:
TABLE 1-1 TITLE 40 CFR §50.14(c)(3)(iv) CHECKLIST
EXCEPTIONAL EVENT DEMONSTRATION FOR HIGH WIND DUST EVENT (PM10)
DOCUMENT SECTION
1
A narrative conceptual model that describes the event(s) causing the exceedance or violation and a discussion of how emissions from the event(s) led to the exceedance or violation at the affected monitor(s)
Pg. 9
2 A demonstration that the event affected air quality in such a way that there exists a clear causal relationship between the specific event and the monitored exceedance or violation
Pg. 18
3
Analyses comparing the claimed event-influenced concentration(s) to concentrations at the same monitoring site at other times to support the requirement at paragraph (c)(3)(iv)(B) of this section
Pg. 27
4 A demonstration that the event was both not reasonably controllable and not reasonably preventable Pg. 30
5 A demonstration that the event was a human activity that is unlikely to recur at a particular location or was a natural event Pg. 37
1 "Treatment of Data Influenced by Exceptional Events; Final Guidance", 81 FR 68216, October 2, 2016
August 20, 2018 Exceptional Event, Imperial County Introduction
2
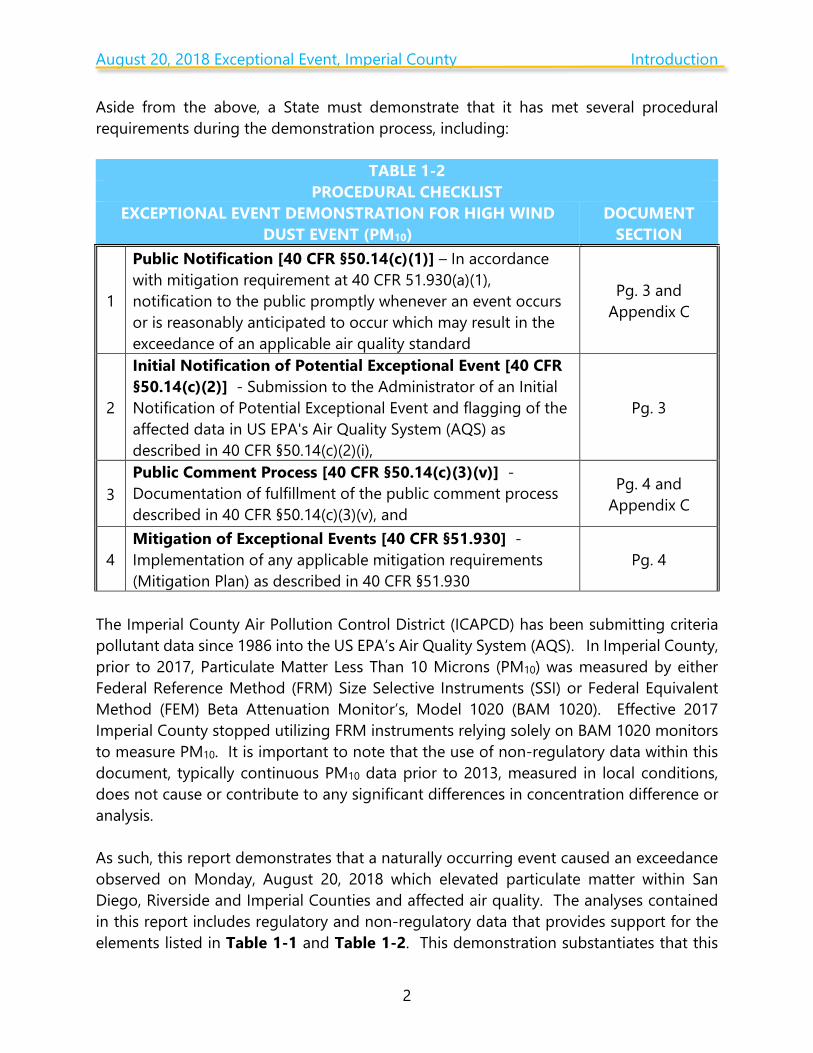
Aside from the above, a State must demonstrate that it has met several procedural requirements during the demonstration process, including:
TABLE 1-2 PROCEDURAL CHECKLIST
EXCEPTIONAL EVENT DEMONSTRATION FOR HIGH WIND DUST EVENT (PM10)
DOCUMENT SECTION
1
Public Notification [40 CFR §50.14(c)(1)] – In accordance with mitigation requirement at 40 CFR 51.930(a)(1), notification to the public promptly whenever an event occurs or is reasonably anticipated to occur which may result in the exceedance of an applicable air quality standard
Pg. 3 and Appendix C
2
Initial Notification of Potential Exceptional Event [40 CFR §50.14(c)(2)] - Submission to the Administrator of an Initial Notification of Potential Exceptional Event and flagging of the affected data in US EPA's Air Quality System (AQS) as described in 40 CFR §50.14(c)(2)(i),
Pg. 3
3 Public Comment Process [40 CFR §50.14(c)(3)(v)] - Documentation of fulfillment of the public comment process described in 40 CFR §50.14(c)(3)(v), and
Pg. 4 and Appendix C
4 Mitigation of Exceptional Events [40 CFR §51.930] - Implementation of any applicable mitigation requirements (Mitigation Plan) as described in 40 CFR §51.930
Pg. 4
The Imperial County Air Pollution Control District (ICAPCD) has been submitting criteria pollutant data since 1986 into the US EPA’s Air Quality System (AQS). In Imperial County, prior to 2017, Particulate Matter Less Than 10 Microns (PM10) was measured by either Federal Reference Method (FRM) Size Selective Instruments (SSI) or Federal Equivalent Method (FEM) Beta Attenuation Monitor’s, Model 1020 (BAM 1020). Effective 2017 Imperial County stopped utilizing FRM instruments relying solely on BAM 1020 monitors to measure PM10. It is important to note that the use of non-regulatory data within this document, typically continuous PM10 data prior to 2013, measured in local conditions, does not cause or contribute to any significant differences in concentration difference or analysis. As such, this report demonstrates that a naturally occurring event caused an exceedance observed on Monday, August 20, 2018 which elevated particulate matter within San Diego, Riverside and Imperial Counties and affected air quality. The analyses contained in this report includes regulatory and non-regulatory data that provides support for the elements listed in Table 1-1 and Table 1-2. This demonstration substantiates that this

August 20, 2018 Exceptional Event, Imperial County Introduction
3
event meets the definition of the US EPA Regulation for the Treatment of Data Influenced by Exceptional Events (EER)2. I.1 Public Notification [40 CFR §50.14(c)(1)] The ICAPCD utilizes a web-based public notification process to alert the public of forecasted weather conditions and potential changes in ambient air concentrations that may affect the public. The ICAPCD identifies these public notifications as Advisory Events. On Monday, August 20, 2018, the ICAPCD published advisories concerning the potential for elevated concentrations of particulate matter caused by gusty southerly winds. Later in the day, the ICAPCD updated the advisory in response to changing meteorological circumstances that potentially could affect air quality. The updated notice included changing monsoonal conditions that could create thunderstorms in Imperial Valley. The ICAPCD routinely monitors notices issued by the NWS Phoenix and San Diego offices for weather updates during wind events. Appendix C contains copies of notices pertinent to the August 20, 2018 event. I.2 Initial Notification of Potential Exceptional Event (INPEE) [40 CFR
§50.14(c)(2)] When States intend to request the exclusion of one or more exceedances of a NAAQS as an exceptional event a notification to the Administrator is required. The notification process identified within the EER as the Initial Notification of Potential Exceptional Event (INPEE) is twofold: to determine whether identified data may affect a regulatory decision and whether a State should develop/submit an EE Demonstration. On Monday, August 20, 2018, a naturally occurring event elevated particulate matter within San Diego, Riverside and Imperial Counties, causing an exceedance at the El Centro (06-025-1003) air quality monitoring station. Subsequently, the ICAPCD made a formal written request to the California Air Resources Board (CARB) to place preliminary flags on SLAMS measured PM10 hourly concentrations from the El Centro monitor on August 20, 2018. After review, CARB submitted the INPEE, for the August 20, 2018 event in July of 2019. The submitted request included a brief description of the meteorological conditions for August 20, 2018 indicating that a potential natural event occurred. The ICAPCD has engaged in discussions with US EPA Region IX regarding the demonstration prior to formal submittal.
2 "Treatment of Data Influenced by Exceptional Events; Final Guidance", 81 FR 68216, October 2, 2016

August 20, 2018 Exceptional Event, Imperial County Introduction
4
I.3 Public Comment Process [40 CFR §50.14(c)(3)(v)(A-C)] (A) The CARB and USEPA have reviewed and commented on the draft version of the
August 20, 2018 exceptional event prepared by the ICAPCD. After addressing all substantive and non-substantive comments by both CARB and USEPA the ICAPCD has published a notice of availability in the Imperial Valley Press announcing a 30-day public review process. The published notice invites comments by the public regarding the request, by the ICAPCD, to exclude the measured concentrations of 162 µg/m3 measured by the El Centro monitor on August 20, 2018.
(B) Concurrently with the Public Review period for the August 20, 2018 exceptional event, the ICAPCD is formally submitting to CARB for remittance to USEPA the Final August 20, 2018 exceptional event.
(C) Upon the ending of the review period the ICAPCD will remit to CARB and USEPA
all comments received during the Public Review period along with a formal letter addressing any comments that dispute or contradict factual evidence in the demonstration.
The ICAPCD acknowledges that with the submittal to US EPA of the 2018 exceptional events, there is supporting evidence of documented recurring seasonal events that affect air quality in Imperial County. I.4 Mitigation of Exceptional Events [40 CFR §51.930] According to 40 CFR §51.930(b) all States having areas with historically documented or known seasonal events, three events or event seasons of the same type and pollutant that recur in a 3-year period, are required to develop and submit a mitigation plan to the US EPA. The ICAPCD received notice from US EPA September 15, 2016 identifying Imperial County as an area required to develop and submit a mitigation plan within two years of the effective date, September 30, 2016, of the final published notification to states with areas subject to mitigation requirements. On September 21, 2018, after notice and opportunity for public comment the ICAPCD submitted the High Wind Exceptional Event Fugitive Dust Mitigation Plan (Mitigation Plan) for review and verification. Subsequently, on November 28, 2018 CARB received verification from US EPA of its review and approval of the Mitigation Plan. For a copy of the Mitigation Plan visit the Imperial County Air Pollution Control District website at https://www.co.imperial.ca.us/AirPollution/otherpdfs/MitigationPlan.pdf

August 20, 2018 Exceptional Event, Imperial County Introduction
5
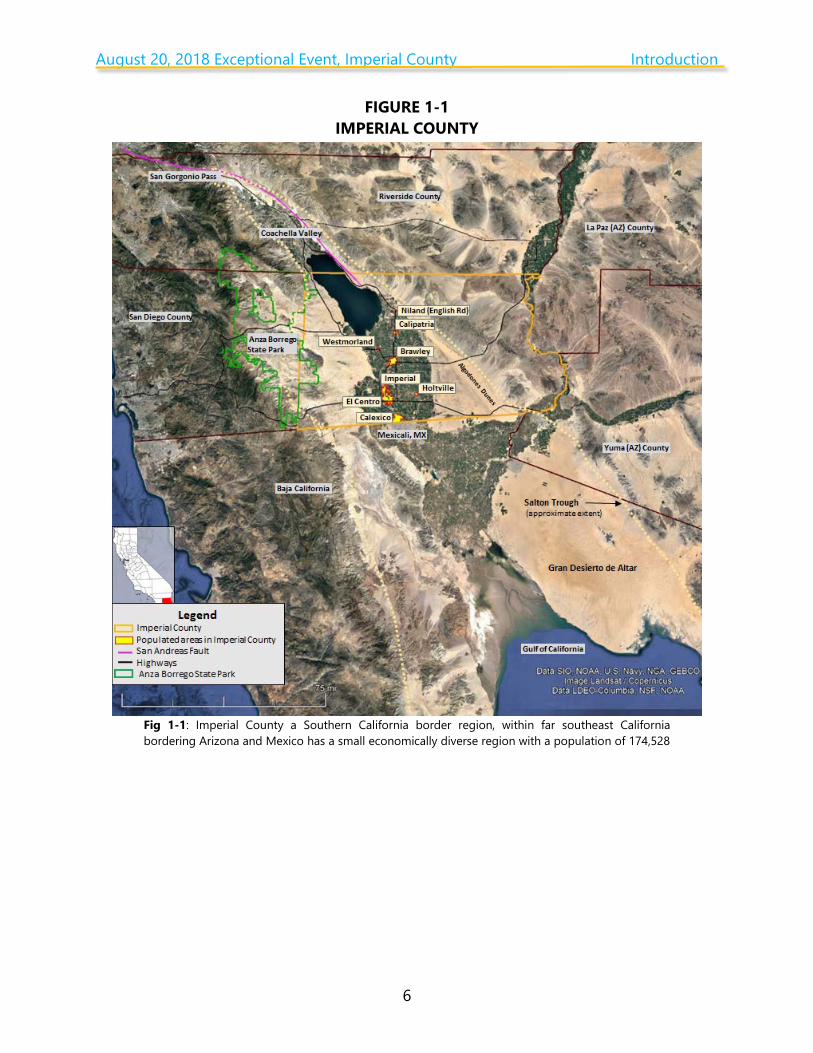
The Imperial County Mitigation Plan contains important geographical and meteorological descriptions, pages 3 through 6, of the areas within Imperial County and the surrounding areas that are sources of transported fugitive dust. Figure 1-1 helps depict the geological aspects that are within Imperial County and outside of Imperial County that affect air quality. Essentially, the Anza-Borrego Desert State Park, which lies in a unique geologic setting along the western margin of the Salton Trough, extends north from the Gulf of California (Baja California) to the San Gorgonio Pass and from the eastern rim of the Peninsular Ranges eastward to the San Andreas Fault zone along the far side of the Coachella Valley. These areas are sources of transported fugitive dust emissions into Imperial County when westerly winds funnel through the unique landforms causing in some cases wind tunnels that cause increase in wind speeds. During the monsoonal season, natural open desert areas to the east, southeast, and south of Imperial County are sources of transported fugitive dust emissions when thunderstorms cause outflows to blow winds across natural opens desert areas within Arizona and Mexico.
August 20, 2018 Exceptional Event, Imperial County Introduction
6
FIGURE 1-1 IMPERIAL COUNTY
Fig 1-1: Imperial County a Southern California border region, within far southeast California bordering Arizona and Mexico has a small economically diverse region with a population of 174,528
August 20, 2018 Exceptional Event, Imperial County Introduction
7
Likewise, the Mitigation Plan contains a high wind event meteorological analysis broken down into four types of seasonal natural occurrences that cause elevated particulate matter that affects Imperial, San Diego, Riverside and Yuma Counties. The historical analysis has defined the meteorological events that lead to high winds and elevated PM10 events in Imperial County, page 7, as follows: Type 1: Pacific storms and frontal passages; Type 2: Strong pressure and surface pressure gradients; Type 3: Monsoonal Gulf Surges from Mexico; thunderstorm downburst, outflow
winds and gust fronts from thunderstorms Type 4: Santa Ana wind events
A complete description of these events begins on page 8 of the Mitigation Plan. While there is some overlap in discussed components between the Mitigation Plan and this demonstration such as the public notification process and the warning process, the Mitigation Plan does elaborate a little further. The Mitigation Plan discusses in detail the educational component, the notification component, the warning component and the implementation of existing mitigation measures, such as Regulation VIII. Finally, the Mitigation Plan contains a complete description of the methods, processes and mechanisms used to minimize the public exposure, page 14, retain historical and real-time data, page 15, and the consultation process with other air quality managers to abate and minimize air impacts within Imperial County, page 16. In all, the Mitigation Plan helps explain the recurring events, by type and influence upon Imperial County and provides supporting justification of a natural event.3
3 Title 40 Code of Federal Regulations §50.1 (k) defines a Natural Event as meaning an event and its resulting emissions, which may recur at the same location, in which human activity plays little or no direct causal role. For purposes of the definition of a natural event, anthropogenic sources that are reasonably controlled shall be considered to not play a direct role in causing emissions.

August 20, 2018 Exceptional Event, Imperial County Introduction
8
FIGURE 1-2 MONITORING SITES IN AND AROUND IMPERIAL COUNTY
Fig 1-2: Depicts a select group of PM10 monitoring sites in Imperial County, eastern Riverside County, and southwestern Arizona (Yuma County). Generated through Google Earth
August 20, 2018 Exceptional Event, Imperial County Conceptual Model
9
II Conceptual Model – A narrative that describes the event causing the exceedance and a discussion of how emissions from the event led to the exceedance at the affected monitors
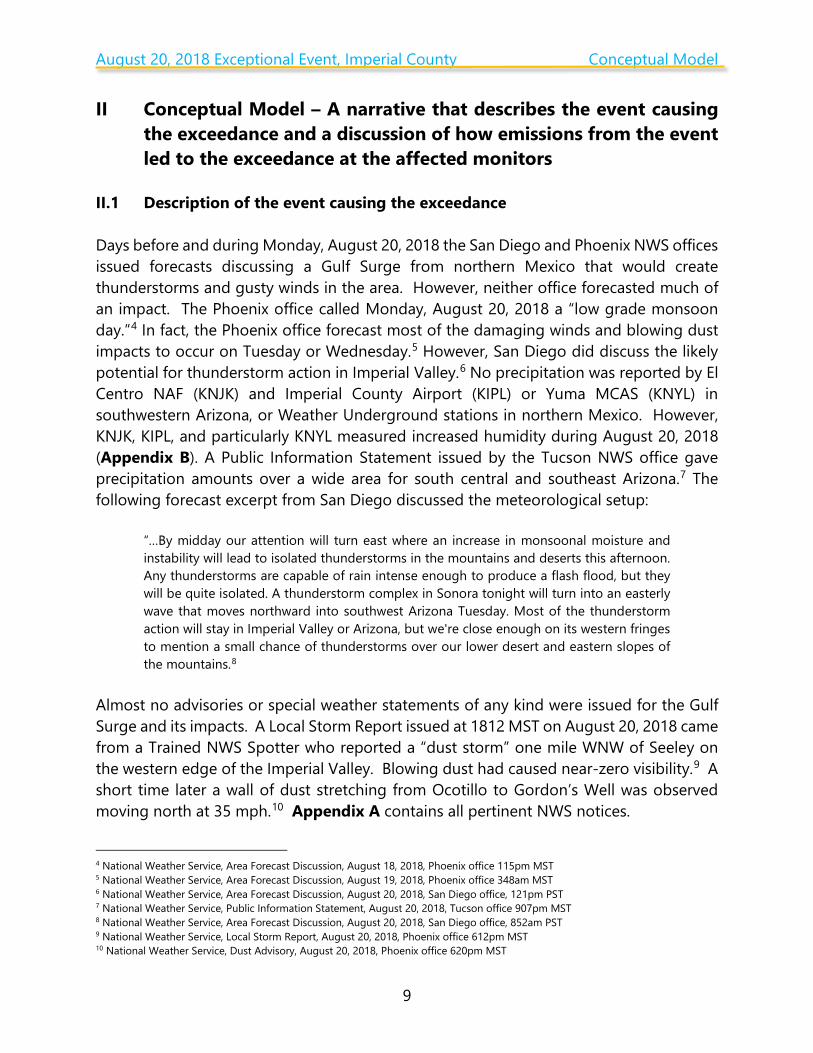
II.1 Description of the event causing the exceedance Days before and during Monday, August 20, 2018 the San Diego and Phoenix NWS offices issued forecasts discussing a Gulf Surge from northern Mexico that would create thunderstorms and gusty winds in the area. However, neither office forecasted much of an impact. The Phoenix office called Monday, August 20, 2018 a “low grade monsoon day.”4 In fact, the Phoenix office forecast most of the damaging winds and blowing dust impacts to occur on Tuesday or Wednesday.5 However, San Diego did discuss the likely potential for thunderstorm action in Imperial Valley.6 No precipitation was reported by El Centro NAF (KNJK) and Imperial County Airport (KIPL) or Yuma MCAS (KNYL) in southwestern Arizona, or Weather Underground stations in northern Mexico. However, KNJK, KIPL, and particularly KNYL measured increased humidity during August 20, 2018 (Appendix B). A Public Information Statement issued by the Tucson NWS office gave precipitation amounts over a wide area for south central and southeast Arizona.7 The following forecast excerpt from San Diego discussed the meteorological setup:
“…By midday our attention will turn east where an increase in monsoonal moisture and instability will lead to isolated thunderstorms in the mountains and deserts this afternoon. Any thunderstorms are capable of rain intense enough to produce a flash flood, but they will be quite isolated. A thunderstorm complex in Sonora tonight will turn into an easterly wave that moves northward into southwest Arizona Tuesday. Most of the thunderstorm action will stay in Imperial Valley or Arizona, but we're close enough on its western fringes to mention a small chance of thunderstorms over our lower desert and eastern slopes of the mountains.8
Almost no advisories or special weather statements of any kind were issued for the Gulf Surge and its impacts. A Local Storm Report issued at 1812 MST on August 20, 2018 came from a Trained NWS Spotter who reported a “dust storm” one mile WNW of Seeley on the western edge of the Imperial Valley. Blowing dust had caused near-zero visibility.9 A short time later a wall of dust stretching from Ocotillo to Gordon’s Well was observed moving north at 35 mph.10 Appendix A contains all pertinent NWS notices.
4 National Weather Service, Area Forecast Discussion, August 18, 2018, Phoenix office 115pm MST 5 National Weather Service, Area Forecast Discussion, August 19, 2018, Phoenix office 348am MST 6 National Weather Service, Area Forecast Discussion, August 20, 2018, San Diego office, 121pm PST 7 National Weather Service, Public Information Statement, August 20, 2018, Tucson office 907pm MST 8 National Weather Service, Area Forecast Discussion, August 20, 2018, San Diego office, 852am PST 9 National Weather Service, Local Storm Report, August 20, 2018, Phoenix office 612pm MST 10 National Weather Service, Dust Advisory, August 20, 2018, Phoenix office 620pm MST
August 20, 2018 Exceptional Event, Imperial County Conceptual Model
10
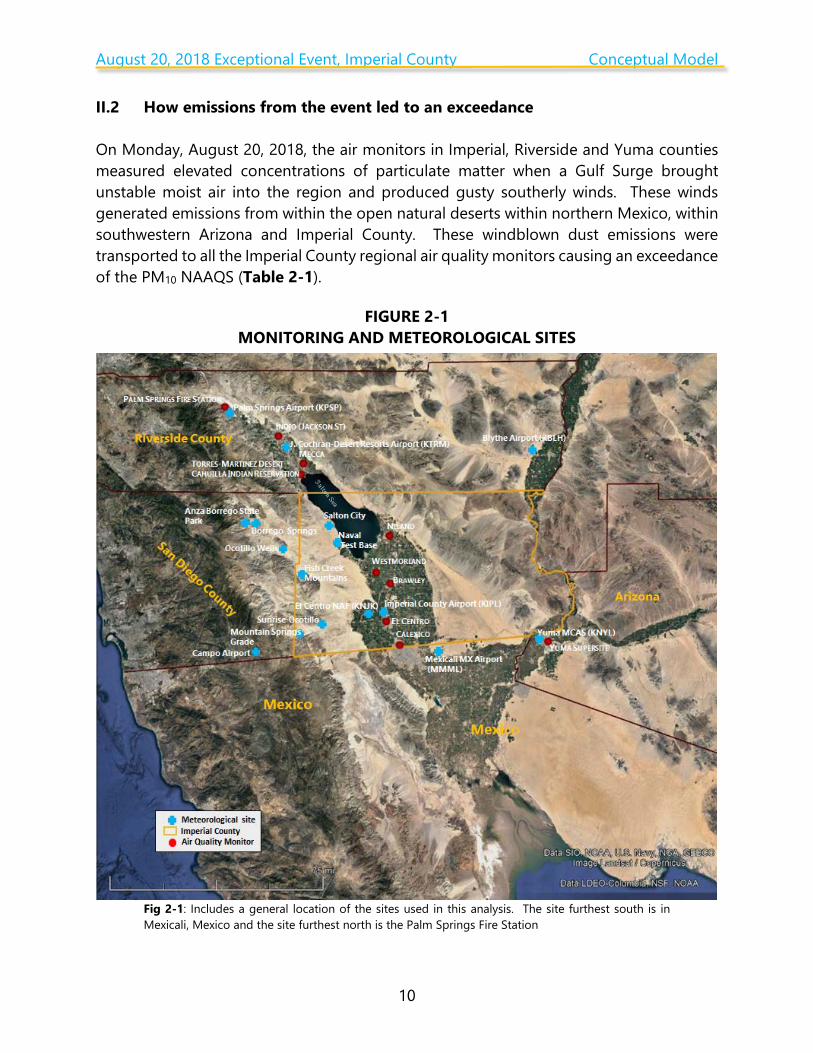
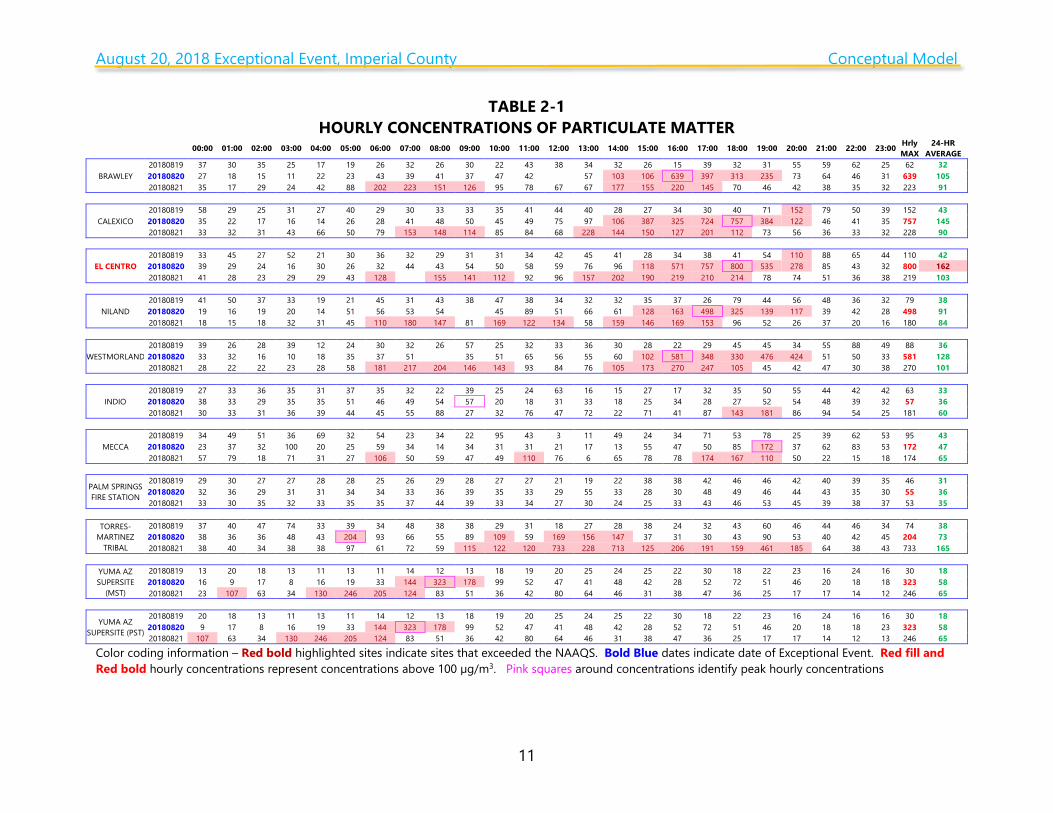
II.2 How emissions from the event led to an exceedance On Monday, August 20, 2018, the air monitors in Imperial, Riverside and Yuma counties measured elevated concentrations of particulate matter when a Gulf Surge brought unstable moist air into the region and produced gusty southerly winds. These winds generated emissions from within the open natural deserts within northern Mexico, within southwestern Arizona and Imperial County. These windblown dust emissions were transported to all the Imperial County regional air quality monitors causing an exceedance of the PM10 NAAQS (Table 2-1).
FIGURE 2-1 MONITORING AND METEOROLOGICAL SITES
Fig 2-1: Includes a general location of the sites used in this analysis. The site furthest south is in Mexicali, Mexico and the site furthest north is the Palm Springs Fire Station
August 20, 2018 Exceptional Event, Imperial County Conceptual Model
11
TABLE 2-1 HOURLY CONCENTRATIONS OF PARTICULATE MATTER
00:00 01:00 02:00 03:00 04:00 05:00 06:00 07:00 08:00 09:00 10:00 11:00 12:00 13:00 14:00 15:00 16:00 17:00 18:00 19:00 20:00 21:00 22:00 23:00 Hrly MAX
24-HR AVERAGE
BRAWLEY 20180819 37 30 35 25 17 19 26 32 26 30 22 43 38 34 32 26 15 39 32 31 55 59 62 25 62 32 20180820 27 18 15 11 22 23 43 39 41 37 47 42 57 103 106 639 397 313 235 73 64 46 31 639 105 20180821 35 17 29 24 42 88 202 223 151 126 95 78 67 67 177 155 220 145 70 46 42 38 35 32 223 91
CALEXICO 20180819 58 29 25 31 27 40 29 30 33 33 35 41 44 40 28 27 34 30 40 71 152 79 50 39 152 43 20180820 35 22 17 16 14 26 28 41 48 50 45 49 75 97 106 387 325 724 757 384 122 46 41 35 757 145 20180821 33 32 31 43 66 50 79 153 148 114 85 84 68 228 144 150 127 201 112 73 56 36 33 32 228 90
EL CENTRO 20180819 33 45 27 52 21 30 36 32 29 31 31 34 42 45 41 28 34 38 41 54 110 88 65 44 110 42 20180820 39 29 24 16 30 26 32 44 43 54 50 58 59 76 96 118 571 757 800 535 278 85 43 32 800 162 20180821 41 28 23 29 29 43 128 155 141 112 92 96 157 202 190 219 210 214 78 74 51 36 38 219 103
NILAND 20180819 41 50 37 33 19 21 45 31 43 38 47 38 34 32 32 35 37 26 79 44 56 48 36 32 79 38 20180820 19 16 19 20 14 51 56 53 54 45 89 51 66 61 128 163 498 325 139 117 39 42 28 498 91 20180821 18 15 18 32 31 45 110 180 147 81 169 122 134 58 159 146 169 153 96 52 26 37 20 16 180 84
WESTMORLAND 20180819 39 26 28 39 12 24 30 32 26 57 25 32 33 36 30 28 22 29 45 45 34 55 88 49 88 36 20180820 33 32 16 10 18 35 37 51 35 51 65 56 55 60 102 581 348 330 476 424 51 50 33 581 128 20180821 28 22 22 23 28 58 181 217 204 146 143 93 84 76 105 173 270 247 105 45 42 47 30 38 270 101
INDIO 20180819 27 33 36 35 31 37 35 32 22 39 25 24 63 16 15 27 17 32 35 50 55 44 42 42 63 33 20180820 38 33 29 35 35 51 46 49 54 57 20 18 31 33 18 25 34 28 27 52 54 48 39 32 57 36 20180821 30 33 31 36 39 44 45 55 88 27 32 76 47 72 22 71 41 87 143 181 86 94 54 25 181 60
MECCA 20180819 34 49 51 36 69 32 54 23 34 22 95 43 3 11 49 24 34 71 53 78 25 39 62 53 95 43 20180820 23 37 32 100 20 25 59 34 14 34 31 31 21 17 13 55 47 50 85 172 37 62 83 53 172 47 20180821 57 79 18 71 31 27 106 50 59 47 49 110 76 6 65 78 78 174 167 110 50 22 15 18 174 65
PALM SPRINGS FIRE STATION
20180819 29 30 27 27 28 28 25 26 29 28 27 27 21 19 22 38 38 42 46 46 42 40 39 35 46 31 20180820 32 36 29 31 31 34 34 33 36 39 35 33 29 55 33 28 30 48 49 46 44 43 35 30 55 36 20180821 33 30 35 32 33 35 35 37 44 39 33 34 27 30 24 25 33 43 46 53 45 39 38 37 53 35
TORRES-
MARTINEZ TRIBAL
20180819 37 40 47 74 33 39 34 48 38 38 29 31 18 27 28 38 24 32 43 60 46 44 46 34 74 38 20180820 38 36 36 48 43 204 93 66 55 89 109 59 169 156 147 37 31 30 43 90 53 40 42 45 204 73 20180821 38 40 34 38 38 97 61 72 59 115 122 120 733 228 713 125 206 191 159 461 185 64 38 43 733 165
YUMA AZ SUPERSITE
(MST)
20180819 13 20 18 13 11 13 11 14 12 13 18 19 20 25 24 25 22 30 18 22 23 16 24 16 30 18 20180820 16 9 17 8 16 19 33 144 323 178 99 52 47 41 48 42 28 52 72 51 46 20 18 18 323 58 20180821 23 107 63 34 130 246 205 124 83 51 36 42 80 64 46 31 38 47 36 25 17 17 14 12 246 65
YUMA AZ SUPERSITE (PST)
20180819 20 18 13 11 13 11 14 12 13 18 19 20 25 24 25 22 30 18 22 23 16 24 16 16 30 18 20180820 9 17 8 16 19 33 144 323 178 99 52 47 41 48 42 28 52 72 51 46 20 18 18 23 323 58 20180821 107 63 34 130 246 205 124 83 51 36 42 80 64 46 31 38 47 36 25 17 17 14 12 13 246 65
Color coding information – Red bold highlighted sites indicate sites that exceeded the NAAQS. Bold Blue dates indicate date of Exceptional Event. Red fill and Red bold hourly concentrations represent concentrations above 100 µg/m3. Pink squares around concentrations identify peak hourly concentrations
August 20, 2018 Exceptional Event, Imperial County Conceptual Model
12
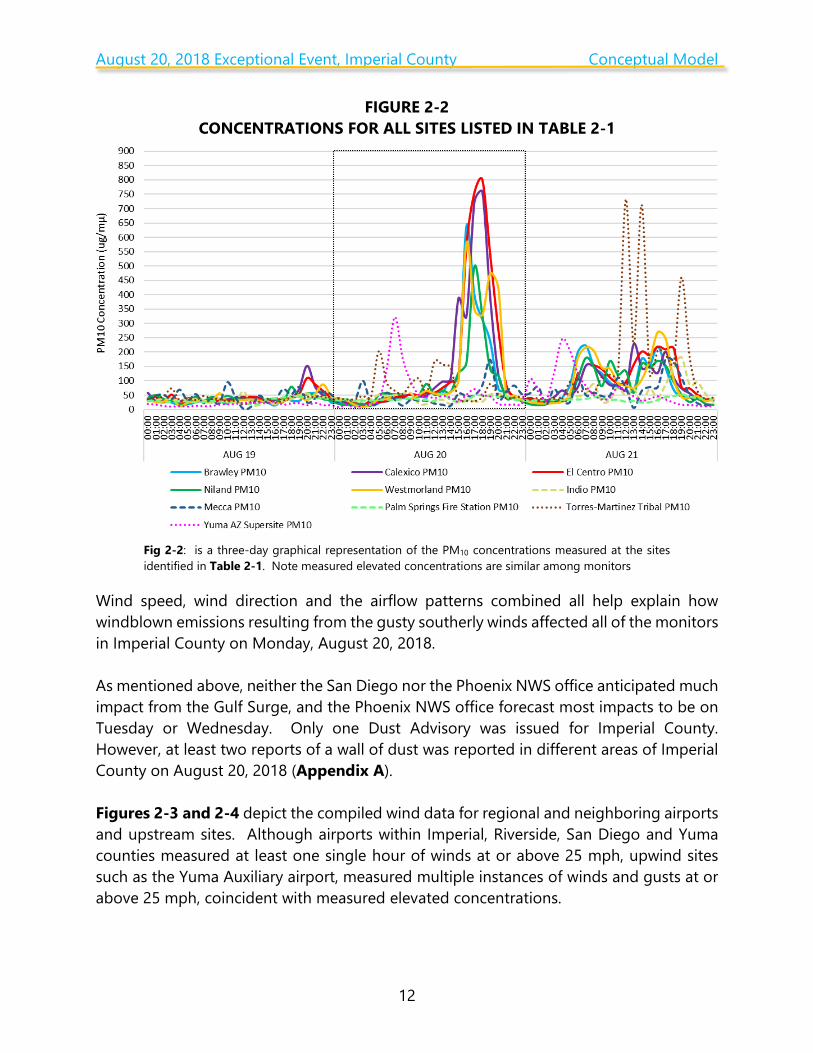
FIGURE 2-2 CONCENTRATIONS FOR ALL SITES LISTED IN TABLE 2-1
Fig 2-2: is a three-day graphical representation of the PM10 concentrations measured at the sites identified in Table 2-1. Note measured elevated concentrations are similar among monitors
Wind speed, wind direction and the airflow patterns combined all help explain how windblown emissions resulting from the gusty southerly winds affected all of the monitors in Imperial County on Monday, August 20, 2018. As mentioned above, neither the San Diego nor the Phoenix NWS office anticipated much impact from the Gulf Surge, and the Phoenix NWS office forecast most impacts to be on Tuesday or Wednesday. Only one Dust Advisory was issued for Imperial County. However, at least two reports of a wall of dust was reported in different areas of Imperial County on August 20, 2018 (Appendix A). Figures 2-3 and 2-4 depict the compiled wind data for regional and neighboring airports and upstream sites. Although airports within Imperial, Riverside, San Diego and Yuma counties measured at least one single hour of winds at or above 25 mph, upwind sites such as the Yuma Auxiliary airport, measured multiple instances of winds and gusts at or above 25 mph, coincident with measured elevated concentrations.
August 20, 2018 Exceptional Event, Imperial County Conceptual Model
13
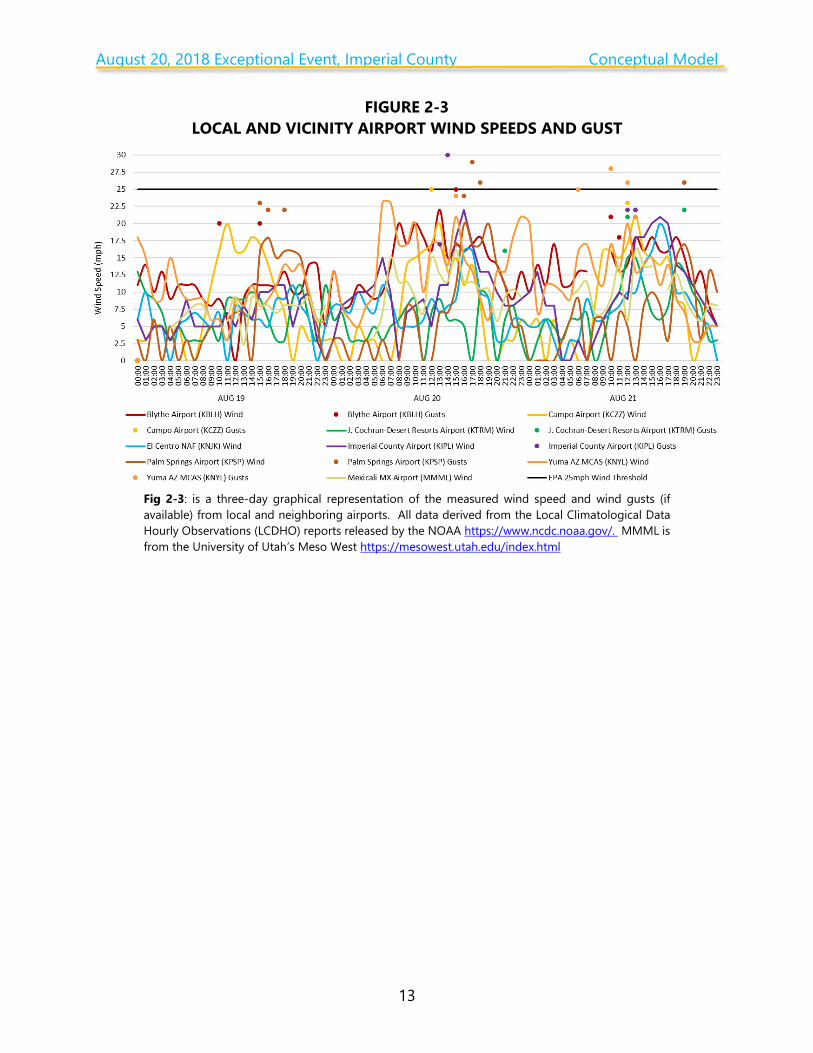
FIGURE 2-3 LOCAL AND VICINITY AIRPORT WIND SPEEDS AND GUST
Fig 2-3: is a three-day graphical representation of the measured wind speed and wind gusts (if available) from local and neighboring airports. All data derived from the Local Climatological Data Hourly Observations (LCDHO) reports released by the NOAA https://www.ncdc.noaa.gov/. MMML is from the University of Utah’s Meso West https://mesowest.utah.edu/index.html

August 20, 2018 Exceptional Event, Imperial County Conceptual Model
14
FIGURE 2-4 WIND SPEEDS AND GUST UPSTREAM SITES
Fig 2-4: is a three-day graphical representation of the measured wind speed and wind gust (if available) from sites located upwind from the Imperial County monitors. The sites depicted represent locations in Imperial County and southwestern Arizona and northern Mexico. All data derived from the University of Utah’s Meso West https://mesowest.utah.edu/index.html
The National Oceanic and Atmospheric Administration (NOAA) Laboratory HYSPLIT back-trajectory models11 provide supporting evidence of the southerly airflow within Imperial County on August 20, 2018. The HYSPLIT back-trajectory models in Figures 2-5 and 2-6 depict the airflow during the late afternoon (1500 PST) and evening (1800 PST) to help illustrate the southerly airflow. Figure 2-5 depicts the southerly airflow coincident with elevated concentrations above 100 µg/m3 at the El Centro monitor. Figure 2-6 depicts the southerly airflow during the evening coincident with the peak hourly measured concentration at the El Centro monitor.
11 The Hybrid Single Particle Lagrangian Integrated Trajectory Model (HYSPLIT) is a computer model that is a complete system for computing simple air parcel trajectories to complex dispersion and deposition simulations. It is currently used to compute air parcel trajectories and dispersion or deposition of atmospheric pollutants. One popular use of HYSPLIT is to establish whether high levels of air pollution at one location are caused by transport of air contaminants from another location. HYSPLIT's back trajectories, combined with satellite images (for example, from NASA's MODIS satellites), can provide insight into whether high air pollution levels are caused by local air pollution sources or whether an air pollution problem was blown in on the wind The initial development was a result of a joint effort between NOAA and Australia's Bureau of Meteorology. Source: NOAA/Air Resources Laboratory, 2011.

August 20, 2018 Exceptional Event, Imperial County Conceptual Model
15
FIGURE 2-5 HYSPLIT MODEL All SITES AUGUST 20, 2018 1500 PST
Fig 2-5: A 12-hour HYSPLIT back-trajectory ending at 1500 PST for all sites identified in Table 2-1. Red trajectory indicates airflow at 10 meters AGL (above ground level); blue indicates airflow at 100m; green indicates airflow at 500m. Yellow line indicates the international border. Dynamically generated through NOAA’s Air Resources Laboratory HYSPLIT model. Base map from Google Earth
August 20, 2018 Exceptional Event, Imperial County Conceptual Model
16
FIGURE 2-6 HYSPLIT MODEL All SITES AUGUST 20, 2018 1800 PST
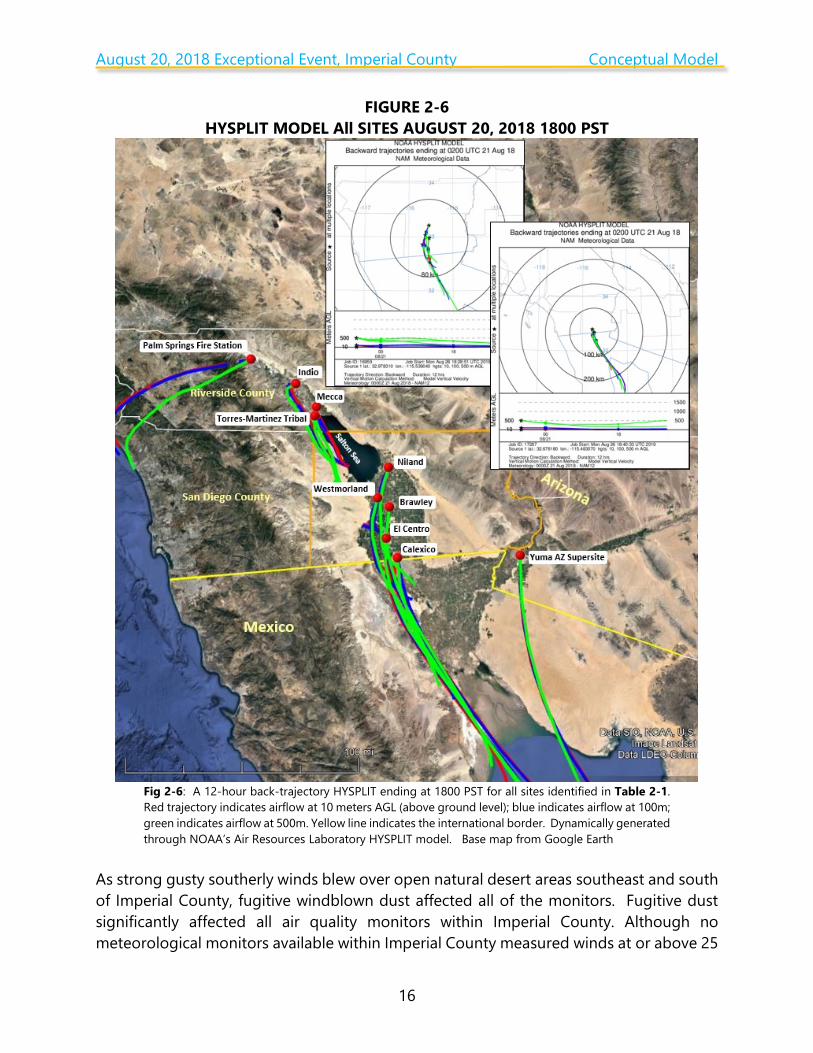
Fig 2-6: A 12-hour back-trajectory HYSPLIT ending at 1800 PST for all sites identified in Table 2-1. Red trajectory indicates airflow at 10 meters AGL (above ground level); blue indicates airflow at 100m; green indicates airflow at 500m. Yellow line indicates the international border. Dynamically generated through NOAA’s Air Resources Laboratory HYSPLIT model. Base map from Google Earth
As strong gusty southerly winds blew over open natural desert areas southeast and south of Imperial County, fugitive windblown dust affected all of the monitors. Fugitive dust significantly affected all air quality monitors within Imperial County. Although no meteorological monitors available within Imperial County measured winds at or above 25
August 20, 2018 Exceptional Event, Imperial County Conceptual Model
17
mph the Yuma Auxiliary Airport (KNOZ) measured several hours of winds at or above 25 mph during the morning of August 20, 2018 coincidently before the measured peak concentration at the El Centro monitor. However, gusty winds at El Pinacate, San Luis Rio Colorado, and Mexicali, Mexico, kept aiding the entrainment and the transportation of windblown dust northward into Imperial County. This particular event was extremely erratic in nature, producing short lived but impactful burst of thunderstorm activity with resulting outflow boundary winds.

August 20, 2018 Exceptional Event, Imperial County Clear Causal Relationship
18
III Clear Causal Relationship – A demonstration that the event affected air quality illustrating the relationship between the event and the monitored exceedance
As mentioned above, a Gulf Surge of moisture caused unstable monsoonal air to reach the region creating thunderstorms that produced erratic southerly outflow boundary winds that transported emissions from northern Mexico into Imperial County. Neither the Phoenix nor San Diego NWS offices devoted much discussion to the Gulf Surge and its associated dust impacts. The Phoenix office termed Monday a “low grade monsoon day”12 and anticipated that the main surge of moisture from the Gulf of California would push in Monday night and that the surge on Tuesday and Wednesday would be capable of producing damaging winds and blowing dust impacts.13 However, by Monday Phoenix said that models were in excellent agreement that deep convection would begin over southern Arizona and northern Sonora, Mexico that afternoon, and generate subsequent outflows, although toward Phoenix.14 San Diego forecast that the tropical moisture would clip southeast California along with moderate instability which would bring the potential for heavy rain with any thunderstorms that developed.15 The Tucson NWS office forecast considerably more monsoonal activity, although mostly south of Interstate 10, but that the storms would move west or northwest into the evening.16 Almost no advisories or special weather statement of any kind were issued for the Gulf Surge and its impacts. A Trained NWS Spotter reported a “dust storm” one mile WNW of Seeley on the western edge of the Imperial Valley that was causing near-zero visibility.17 A short time later a wall of dust stretching from Ocotillo to Gordon’s Well was observed moving north at 35 mph.18 El Centro was the only monitor to exceed due to the increased moisture of the monsoonal air which tamped down dust and prevented an exceedance at Calexico and other monitors. Although no precipitation was reported by El Centro NAF (KNJK) and Imperial County Airport (KIPL) or Yuma MCAS (KNYL), humidity was measured during the morning and evening hours of August 20, 2018. While elevated wind speeds play a significant and important role in the transportation of dust, gusts play an equally significant role in deposition of particulates onto a monitor and the overall affect onto ambient air.19 As winds and gusts increased on August 20, 12 National Weather Service, Area Forecast Discussion, August 18, 2018, Phoenix office, 115pm MST 13 National Weather Service, Area Forecast Discussion, August 19, 2018, Phoenix office, 348am MST 14 National Weather Service, Area Forecast Discussion, August 20, 2018, Phoenix office, 151pm MST 15 National Weather Service, Area Forecast Discussion, August 19, 2018, San Diego office, 930pm PST 16 National Weather Service, Area Forecast Discussion, August 20, 2018, Tucson office, 144pm MST 17 National Weather Service, Local Storm Report, August 20, 2018, Phoenix office 612pm MST 18 National Weather Service, Dust Advisory, August 20, 2018, Phoenix office 620pm MST 19 Gust is a rapid fluctuation of wind speed with variations of 10 knots or more between peaks and lulls; National Weather Service Glossary https://w1.weather.gov/glossary/index.php?letter=g

August 20, 2018 Exceptional Event, Imperial County Clear Causal Relationship
19
2018 and transported windblown dust from open natural deserts into Imperial County air quality degraded. As mentioned in Section I.1 above, the ICAPCD issued an advisory of the potential for elevated particulate matter and the potential of degradation of air quality to a moderate or unhealthy level. Figures 3-1 and 3-2 below provide illustrations of meteorological conditions, as described above and demonstrated in the HYSPLITs, for August 20, 2018, which affected air quality in Imperial County causing an exceedance at the El Centro monitor.
FIGURE 3-1 WALL OF DUST MOVING ACROSS IMPERIAL COUNTY
Fig 3-1: A visualized depiction of dust reported in Imperial County on August 20, 2018. An NWS Trained Spotter reported a “dust storm” near Seeley, while the NWS issued a Dust Advisory for Imperial County warning of a “wall of dust” along a line from Ocotillo to Gordon’s Well moving northwest at 35 mph. Sources from the NWS (Appendix A). Google Earth base map

August 20, 2018 Exceptional Event, Imperial County Clear Causal Relationship
20
FIGURE 3-2 VISUAL RAMP-UP ANALYSIS AS DISCUSSED FOR AUGUST 20, 2018
Fig 3-2: On August 20, 2018, a Gulf Surge from Mexico brought unstable air into the region which produced thunderstorms. The gusty southerly outflow winds transported dust into Imperial County. Google Earth base map
An indicator of the affect to air quality can be discerned from the level of visibility at any given time and day. While the ICAPCD air monitoring stations do not measure levels of visibility the local and surrounding airports do.20 The Imperial County Airport (KIPL) and 20 According to the NWS there is a difference between human visibility and the visibility measured by an Automated Surface Observing System (ASOS) or an Automated Weather Observing System (AWOS). The automated sensors measure clarity of the air vs. how far one can “see”. The more moisture, dust, snow, rain, or particles in the light beam the more light scattered. The sensor measures the return every 30 seconds. The visibility value transmitted is the average 1-minute value from the past 10 minutes. The sensor samples
August 20, 2018 Exceptional Event, Imperial County Clear Causal Relationship
21
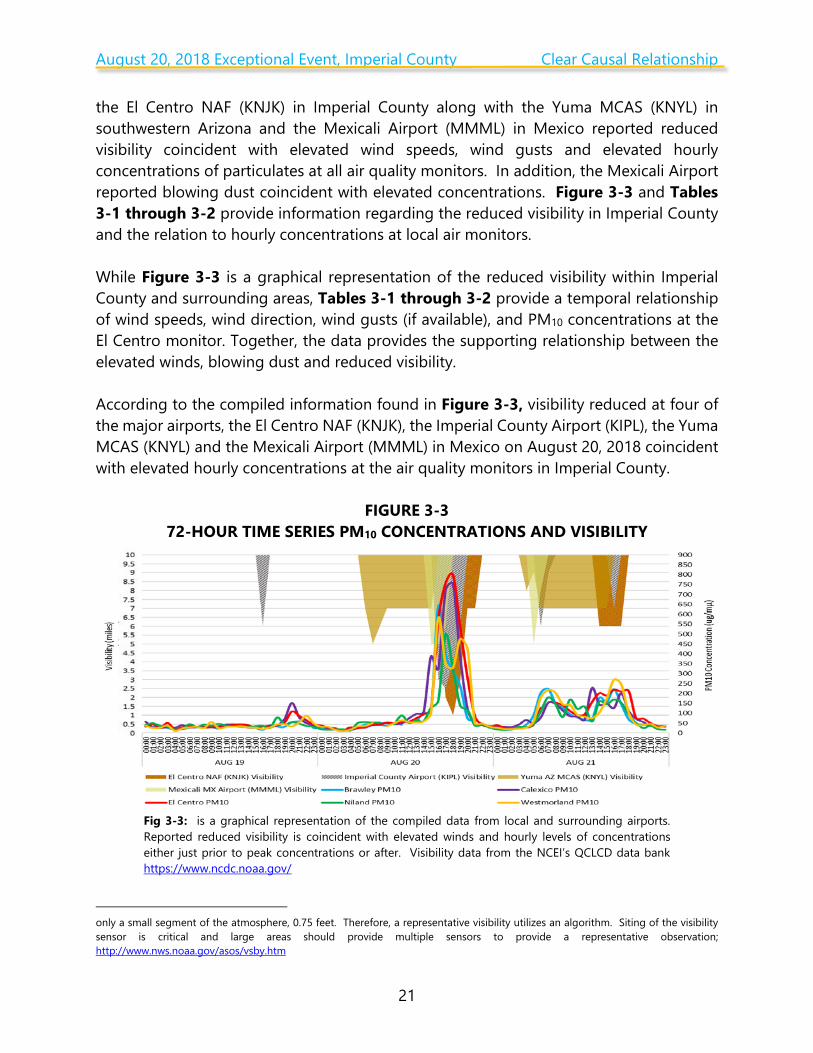
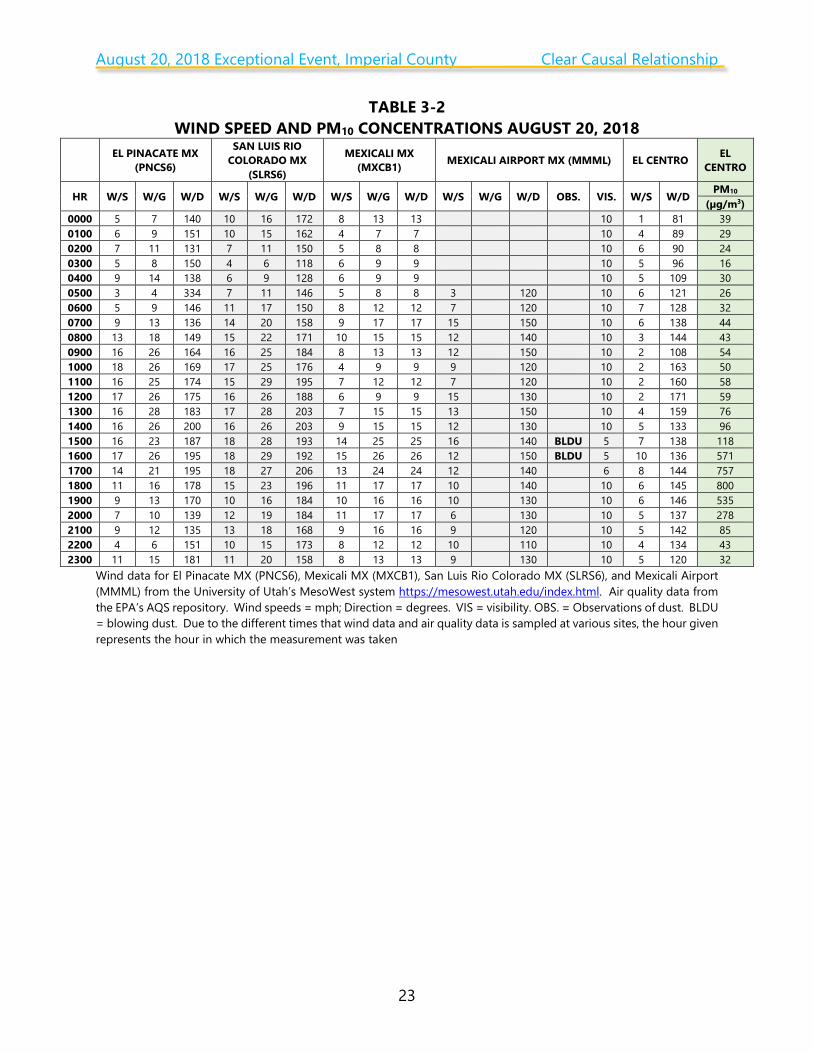
the El Centro NAF (KNJK) in Imperial County along with the Yuma MCAS (KNYL) in southwestern Arizona and the Mexicali Airport (MMML) in Mexico reported reduced visibility coincident with elevated wind speeds, wind gusts and elevated hourly concentrations of particulates at all air quality monitors. In addition, the Mexicali Airport reported blowing dust coincident with elevated concentrations. Figure 3-3 and Tables 3-1 through 3-2 provide information regarding the reduced visibility in Imperial County and the relation to hourly concentrations at local air monitors. While Figure 3-3 is a graphical representation of the reduced visibility within Imperial County and surrounding areas, Tables 3-1 through 3-2 provide a temporal relationship of wind speeds, wind direction, wind gusts (if available), and PM10 concentrations at the El Centro monitor. Together, the data provides the supporting relationship between the elevated winds, blowing dust and reduced visibility. According to the compiled information found in Figure 3-3, visibility reduced at four of the major airports, the El Centro NAF (KNJK), the Imperial County Airport (KIPL), the Yuma MCAS (KNYL) and the Mexicali Airport (MMML) in Mexico on August 20, 2018 coincident with elevated hourly concentrations at the air quality monitors in Imperial County.
FIGURE 3-3
72-HOUR TIME SERIES PM10 CONCENTRATIONS AND VISIBILITY
Fig 3-3: is a graphical representation of the compiled data from local and surrounding airports. Reported reduced visibility is coincident with elevated winds and hourly levels of concentrations either just prior to peak concentrations or after. Visibility data from the NCEI’s QCLCD data bank https://www.ncdc.noaa.gov/
only a small segment of the atmosphere, 0.75 feet. Therefore, a representative visibility utilizes an algorithm. Siting of the visibility sensor is critical and large areas should provide multiple sensors to provide a representative observation; http://www.nws.noaa.gov/asos/vsby.htm
August 20, 2018 Exceptional Event, Imperial County Clear Causal Relationship
22
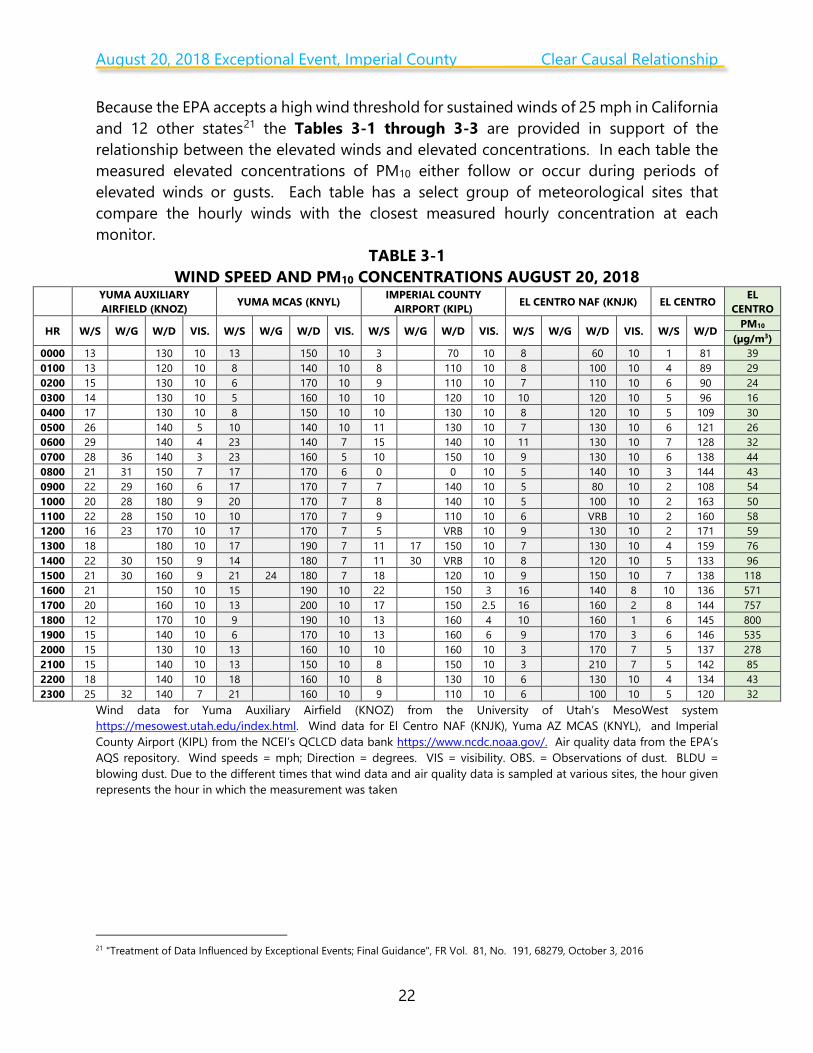
Because the EPA accepts a high wind threshold for sustained winds of 25 mph in California and 12 other states21 the Tables 3-1 through 3-3 are provided in support of the relationship between the elevated winds and elevated concentrations. In each table the measured elevated concentrations of PM10 either follow or occur during periods of elevated winds or gusts. Each table has a select group of meteorological sites that compare the hourly winds with the closest measured hourly concentration at each monitor.
TABLE 3-1 WIND SPEED AND PM10 CONCENTRATIONS AUGUST 20, 2018
YUMA AUXILIARY AIRFIELD (KNOZ) YUMA MCAS (KNYL) IMPERIAL COUNTY
AIRPORT (KIPL) EL CENTRO NAF (KNJK) EL CENTRO EL CENTRO
HR W/S W/G W/D VIS. W/S W/G W/D VIS. W/S W/G W/D VIS. W/S W/G W/D VIS. W/S W/D PM10 (µg/m3)
0000 13 130 10 13 150 10 3 70 10 8 60 10 1 81 39 0100 13 120 10 8 140 10 8 110 10 8 100 10 4 89 29 0200 15 130 10 6 170 10 9 110 10 7 110 10 6 90 24 0300 14 130 10 5 160 10 10 120 10 10 120 10 5 96 16 0400 17 130 10 8 150 10 10 130 10 8 120 10 5 109 30 0500 26 140 5 10 140 10 11 130 10 7 130 10 6 121 26 0600 29 140 4 23 140 7 15 140 10 11 130 10 7 128 32 0700 28 36 140 3 23 160 5 10 150 10 9 130 10 6 138 44 0800 21 31 150 7 17 170 6 0 0 10 5 140 10 3 144 43 0900 22 29 160 6 17 170 7 7 140 10 5 80 10 2 108 54 1000 20 28 180 9 20 170 7 8 140 10 5 100 10 2 163 50 1100 22 28 150 10 10 170 7 9 110 10 6 VRB 10 2 160 58 1200 16 23 170 10 17 170 7 5 VRB 10 9 130 10 2 171 59 1300 18 180 10 17 190 7 11 17 150 10 7 130 10 4 159 76 1400 22 30 150 9 14 180 7 11 30 VRB 10 8 120 10 5 133 96 1500 21 30 160 9 21 24 180 7 18 120 10 9 150 10 7 138 118 1600 21 150 10 15 190 10 22 150 3 16 140 8 10 136 571 1700 20 160 10 13 200 10 17 150 2.5 16 160 2 8 144 757 1800 12 170 10 9 190 10 13 160 4 10 160 1 6 145 800 1900 15 140 10 6 170 10 13 160 6 9 170 3 6 146 535 2000 15 130 10 13 160 10 10 160 10 3 170 7 5 137 278 2100 15 140 10 13 150 10 8 150 10 3 210 7 5 142 85 2200 18 140 10 18 160 10 8 130 10 6 130 10 4 134 43 2300 25 32 140 7 21 160 10 9 110 10 6 100 10 5 120 32
Wind data for Yuma Auxiliary Airfield (KNOZ) from the University of Utah’s MesoWest system https://mesowest.utah.edu/index.html. Wind data for El Centro NAF (KNJK), Yuma AZ MCAS (KNYL), and Imperial County Airport (KIPL) from the NCEI’s QCLCD data bank https://www.ncdc.noaa.gov/. Air quality data from the EPA’s AQS repository. Wind speeds = mph; Direction = degrees. VIS = visibility. OBS. = Observations of dust. BLDU = blowing dust. Due to the different times that wind data and air quality data is sampled at various sites, the hour given represents the hour in which the measurement was taken
21 "Treatment of Data Influenced by Exceptional Events; Final Guidance", FR Vol. 81, No. 191, 68279, October 3, 2016
August 20, 2018 Exceptional Event, Imperial County Clear Causal Relationship
23
TABLE 3-2 WIND SPEED AND PM10 CONCENTRATIONS AUGUST 20, 2018
EL PINACATE MX (PNCS6)
SAN LUIS RIO COLORADO MX
(SLRS6)
MEXICALI MX (MXCB1) MEXICALI AIRPORT MX (MMML) EL CENTRO EL
CENTRO
HR W/S W/G W/D W/S W/G W/D W/S W/G W/D W/S W/G W/D OBS. VIS. W/S W/D PM10
(µg/m3) 0000 5 7 140 10 16 172 8 13 13 10 1 81 39 0100 6 9 151 10 15 162 4 7 7 10 4 89 29 0200 7 11 131 7 11 150 5 8 8 10 6 90 24 0300 5 8 150 4 6 118 6 9 9 10 5 96 16 0400 9 14 138 6 9 128 6 9 9 10 5 109 30 0500 3 4 334 7 11 146 5 8 8 3 120 10 6 121 26 0600 5 9 146 11 17 150 8 12 12 7 120 10 7 128 32 0700 9 13 136 14 20 158 9 17 17 15 150 10 6 138 44 0800 13 18 149 15 22 171 10 15 15 12 140 10 3 144 43 0900 16 26 164 16 25 184 8 13 13 12 150 10 2 108 54 1000 18 26 169 17 25 176 4 9 9 9 120 10 2 163 50 1100 16 25 174 15 29 195 7 12 12 7 120 10 2 160 58 1200 17 26 175 16 26 188 6 9 9 15 130 10 2 171 59 1300 16 28 183 17 28 203 7 15 15 13 150 10 4 159 76 1400 16 26 200 16 26 203 9 15 15 12 130 10 5 133 96 1500 16 23 187 18 28 193 14 25 25 16 140 BLDU 5 7 138 118 1600 17 26 195 18 29 192 15 26 26 12 150 BLDU 5 10 136 571 1700 14 21 195 18 27 206 13 24 24 12 140 6 8 144 757 1800 11 16 178 15 23 196 11 17 17 10 140 10 6 145 800 1900 9 13 170 10 16 184 10 16 16 10 130 10 6 146 535 2000 7 10 139 12 19 184 11 17 17 6 130 10 5 137 278 2100 9 12 135 13 18 168 9 16 16 9 120 10 5 142 85 2200 4 6 151 10 15 173 8 12 12 10 110 10 4 134 43 2300 11 15 181 11 20 158 8 13 13 9 130 10 5 120 32
Wind data for El Pinacate MX (PNCS6), Mexicali MX (MXCB1), San Luis Rio Colorado MX (SLRS6), and Mexicali Airport (MMML) from the University of Utah’s MesoWest system https://mesowest.utah.edu/index.html. Air quality data from the EPA’s AQS repository. Wind speeds = mph; Direction = degrees. VIS = visibility. OBS. = Observations of dust. BLDU = blowing dust. Due to the different times that wind data and air quality data is sampled at various sites, the hour given represents the hour in which the measurement was taken

August 20, 2018 Exceptional Event, Imperial County Clear Causal Relationship
24
TABLE 3-3 WIND SPEED AND PM10 CONCENTRATIONS AUGUST 20, 2018
YUMA AUXILIARY AIRFIELD (KNOZ) YUMA MCAS (KNYL) IMPERIAL COUNTY
AIRPORT (KIPL) MEXICALI AIRPORT MX (MMML) EL CENTRO CALEXICO
HR W/S W/G W/D VIS. W/S W/G W/D VIS. W/S W/G W/D VIS. W/S W/G W/D OBS. VIS. PM10 PM10 (µg/m3) (µg/m3)
0000 13 130 10 13 150 10 3 70 10 10 39 35 0100 13 120 10 8 140 10 8 110 10 10 29 22 0200 15 130 10 6 170 10 9 110 10 10 24 17 0300 14 130 10 5 160 10 10 120 10 10 16 16 0400 17 130 10 8 150 10 10 130 10 10 30 14 0500 26 140 5 10 140 10 11 130 10 3 120 10 26 26 0600 29 140 4 23 140 7 15 140 10 7 120 10 32 28 0700 28 36 140 3 23 160 5 10 150 10 15 150 10 44 41 0800 21 31 150 7 17 170 6 0 0 10 12 140 10 43 48 0900 22 29 160 6 17 170 7 7 140 10 12 150 10 54 50 1000 20 28 180 9 20 170 7 8 140 10 9 120 10 50 45 1100 22 28 150 10 10 170 7 9 110 10 7 120 10 58 49 1200 16 23 170 10 17 170 7 5 VRB 10 15 130 10 59 75 1300 18 180 10 17 190 7 11 17 150 10 13 150 10 76 97 1400 22 30 150 9 14 180 7 11 30 VRB 10 12 130 10 96 106 1500 21 30 160 9 21 24 180 7 18 120 10 16 140 BLDU 5 118 387 1600 21 150 10 15 190 10 22 150 3 12 150 BLDU 5 571 325 1700 20 160 10 13 200 10 17 150 2.5 12 140 6 757 724 1800 12 170 10 9 190 10 13 160 4 10 140 10 800 757 1900 15 140 10 6 170 10 13 160 6 10 130 10 535 384 2000 15 130 10 13 160 10 10 160 10 6 130 10 278 122 2100 15 140 10 13 150 10 8 150 10 9 120 10 85 46 2200 18 140 10 18 160 10 8 130 10 10 110 10 43 41 2300 25 32 140 7 21 160 10 9 110 10 9 130 10 32 35 Wind data for Yuma (KNOZ) and Mexicali Airport (MMML) from the University of Utah’s MesoWest system https://mesowest.utah.edu/index.html. Wind data for El Centro NAF (KNJK), Yuma AZ MCAS (KNYL), and Imperial County Airport (KIPL) from the NCEI’s QCLCD data bank https://www.ncdc.noaa.gov/. Air quality data from the EPA’s AQS repository. Wind speeds = mph; Direction = degrees. VIS = visibility. OBS. = Observations of dust. BLDU = blowing dust. Due to the different times that wind data and air quality data is sampled at various sites, the hour given represents the hour in which the measurement was taken
August 20, 2018 Exceptional Event, Imperial County Clear Causal Relationship
25
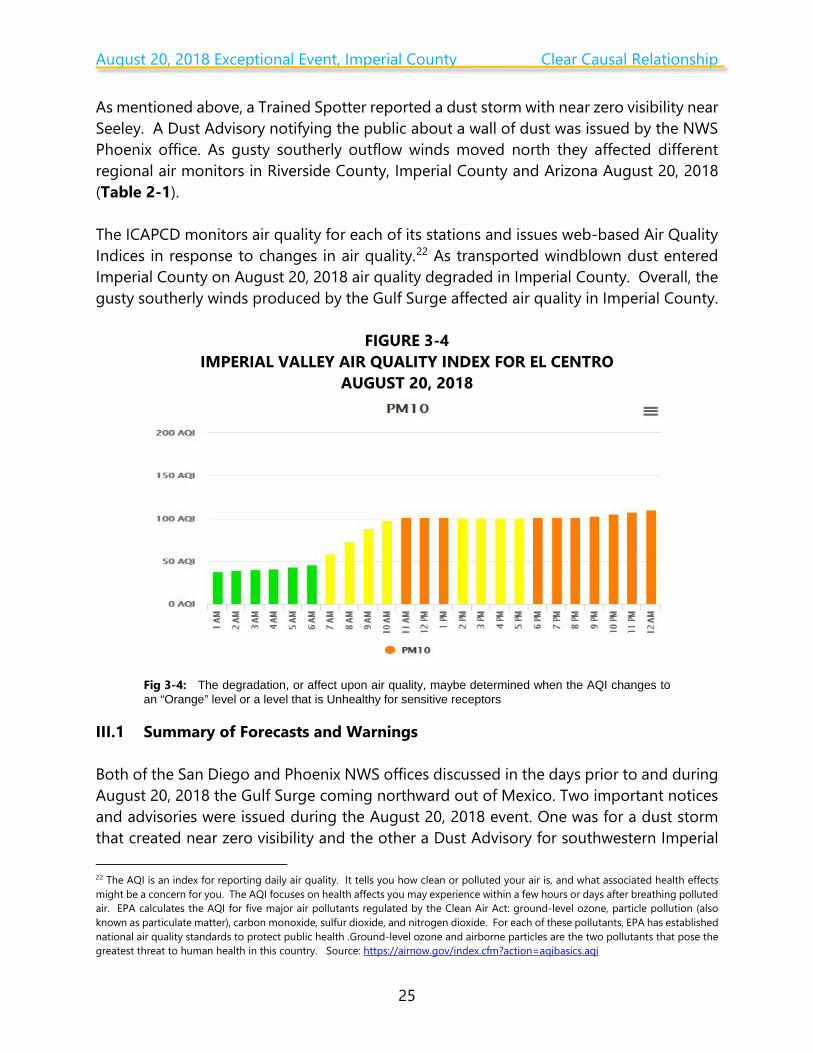
As mentioned above, a Trained Spotter reported a dust storm with near zero visibility near Seeley. A Dust Advisory notifying the public about a wall of dust was issued by the NWS Phoenix office. As gusty southerly outflow winds moved north they affected different regional air monitors in Riverside County, Imperial County and Arizona August 20, 2018 (Table 2-1). The ICAPCD monitors air quality for each of its stations and issues web-based Air Quality Indices in response to changes in air quality.22 As transported windblown dust entered Imperial County on August 20, 2018 air quality degraded in Imperial County. Overall, the gusty southerly winds produced by the Gulf Surge affected air quality in Imperial County.
FIGURE 3-4 IMPERIAL VALLEY AIR QUALITY INDEX FOR EL CENTRO
AUGUST 20, 2018
Fig 3-4: The degradation, or affect upon air quality, maybe determined when the AQI changes to an “Orange” level or a level that is Unhealthy for sensitive receptors
III.1 Summary of Forecasts and Warnings Both of the San Diego and Phoenix NWS offices discussed in the days prior to and during August 20, 2018 the Gulf Surge coming northward out of Mexico. Two important notices and advisories were issued during the August 20, 2018 event. One was for a dust storm that created near zero visibility and the other a Dust Advisory for southwestern Imperial 22 The AQI is an index for reporting daily air quality. It tells you how clean or polluted your air is, and what associated health effects might be a concern for you. The AQI focuses on health affects you may experience within a few hours or days after breathing polluted air. EPA calculates the AQI for five major air pollutants regulated by the Clean Air Act: ground-level ozone, particle pollution (also known as particulate matter), carbon monoxide, sulfur dioxide, and nitrogen dioxide. For each of these pollutants, EPA has established national air quality standards to protect public health .Ground-level ozone and airborne particles are the two pollutants that pose the greatest threat to human health in this country. Source: https://airnow.gov/index.cfm?action=aqibasics.aqi

August 20, 2018 Exceptional Event, Imperial County Clear Causal Relationship
26
County. Appendix A contains all pertinent NWS notices. III.2 Summary of Wind Observations As demonstrated above wind data during the event were available from airports in eastern Riverside County, southeastern San Diego County, southwestern Yuma County (Arizona), northern Mexico, and Imperial County as well as from other automated meteorological instruments upwind from the monitors. Data analysis indicates that on August 20, 2018 one site in southwestern Arizona measured winds at or above 25 mph and different sites measured wind gusts at or above 25 mph.

Concentration to August 20, 2018 Exceptional Event, Imperial County Concentration Analysis
27
IV Concentration to Concentration Analysis – An analyses comparing the event-influenced concentrations to concentrations at the same monitoring site at other times
While naturally occurring high wind events may recur seasonally and at times frequently and qualify for exclusion under the EER, historical comparisons of the particulate concentrations and associated winds provide insight into the frequency of events within an identified area. Figures 4-1 and 4-2 show the time series of available FRM and BAM 24-hr PM10 concentrations at the El Centro air quality monitor for the period of January 1, 2010 through August 20, 2018. The compiled data set below includes non-regulatory data prior to 2013. As a consequence, continuous monitoring data (hourly concentrations) prior to 2013 were not reported into the US EPA Air Quality System (AQS).23 The difference between the standard and local condition concentrations is not significant enough to change the outcome of the analysis. Compiled and plotted 24-hour averaged PM10 concentrations, between January 1, 2010 and August 20, 2018, as measured by the El Centro monitors, were used to establish the historical and seasonal variability over time.24 All figures illustrate that the exceedance, which occurred on August 20, 2018, was outside the normal historical concentrations when compared to event and non-event days. Air quality data for all graphs obtained through the EPA’s AQS data bank.
23 Pollutant concentration data contained in EPA's Air Quality System (AQS) are required to be reported in units corrected to standard temperature and pressure (25 C, 760 mm Hg). Because the PM10 concentrations prior to 2013 were not reported into the AQS database all BAM (FEM) data prior to 2013 within this report are expressed as micrograms per cubic meter (mg/m3) at local temperature and pressure (LTP) as opposed to standard temperature and pressure (STP 760torr and 25C). The difference in concentration measurements between standard conditions and local conditions is insignificant and does not alter or cause any significant changes in conclusions to comparisons of PM10 concentrations to PM10 concentrations with in this demonstration. 24 FRM sampling ended December 2016.

Concentration to August 20, 2018 Exceptional Event, Imperial County Concentration Analysis
28
FIGURE 4-1 EL CENTRO HISTORICAL COMPARISON
FRM AND FEM PM10 24-HR AVG CONCENTRATIONS JANUARY 1, 2010 TO AUGUST 20, 2018
Fig 4-2: A comparison of PM10 historical concentrations demonstrates that the measured concentration of 162µg/m3 on August 20, 2018 by the El Centro monitor was outside the normal historical concentrations when compared to similar event days and non-event days
The time series, Figure 4-1, for El Centro includes 1,491 sampling days (January 1, 2010 through August 20, 2018). During the January 1, 2010 through August 20, 2018 period, the El Centro monitor measured 21 exceedance days out of 1,491 sampling days which translates into an occurrence rate less than 1.5%. Historically, there were two (2) exceedance days during the first quarter; five (5) exceedance days were measured during the second quarter; eleven (11) exceedance days during the third quarter; and three (3) exceedance days during the fourth quarter.
Concentration to August 20, 2018 Exceptional Event, Imperial County Concentration Analysis
29
FIGURE 4-2 EL CENTRO SEASONAL COMPARISON
FRM AND FEM PM10 24-HR AVG CONCENTRATIONS *JULY 1, 2010 TO AUGUST 20, 2018
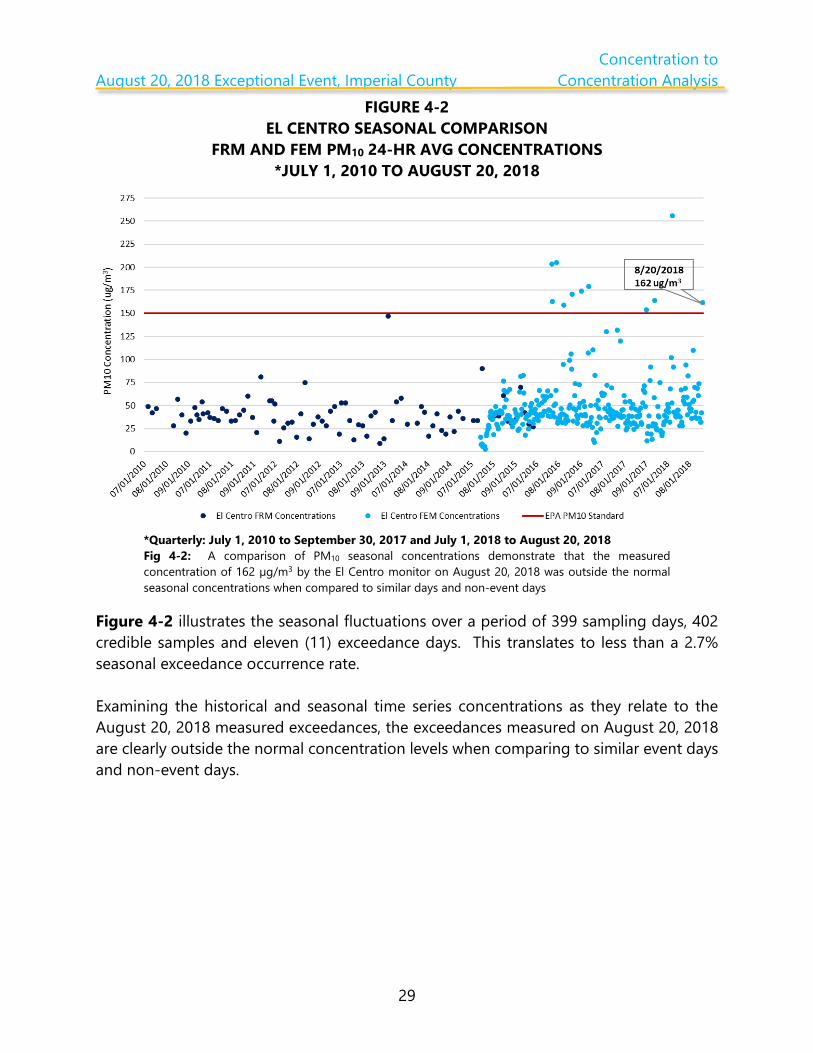
*Quarterly: July 1, 2010 to September 30, 2017 and July 1, 2018 to August 20, 2018 Fig 4-2: A comparison of PM10 seasonal concentrations demonstrate that the measured concentration of 162 µg/m3 by the El Centro monitor on August 20, 2018 was outside the normal seasonal concentrations when compared to similar days and non-event days
Figure 4-2 illustrates the seasonal fluctuations over a period of 399 sampling days, 402 credible samples and eleven (11) exceedance days. This translates to less than a 2.7% seasonal exceedance occurrence rate. Examining the historical and seasonal time series concentrations as they relate to the August 20, 2018 measured exceedances, the exceedances measured on August 20, 2018 are clearly outside the normal concentration levels when comparing to similar event days and non-event days.
Not Reasonably Controllable and August 20, 2018 Exceptional Event, Imperial County Not Reasonably Preventable
30
V Both Not Reasonably Controllable and Not Reasonably Preventable – A demonstration that the event was both not reasonably controllable and not reasonably preventable
The analysis above, under the Clear Causal Relationship, indicates that the primary sources affecting air quality in Imperial County originated within the natural open deserts of Baja California and southwestern Arizona. The origination of these emissions from these areas affected all the air quality monitors on August 20, 2018. Since Imperial County does not have jurisdiction over emissions emanating from Arizona or Mexico it is not reasonably controllable or preventable by Imperial County. For a brief description of the controls implemented by sources beyond the control of Imperial County see section V.1 below. As mentioned above in section I.4, Mitigation of Exceptional Events contains significant information regarding the application of Best Available Control Measures that are used as measures to abate or minimize contributing controllable sources of identified pollutants (Page 12, sub-section II.2 of the High Wind Mitigation Plan). In addition, the mitigation plan explains the methods utilized to minimize public exposure to high concentrations of identified pollutants, the process utilized to collect and maintain data pertinent to any identified event, and the mechanisms utilized to consult with other air quality managers within the affected area regarding the appropriate responses to abate and minimize affects. Inhalable particulate matter (PM10) contributes to effects that are harmful to human health and the environment, including premature mortality, aggravation of respiratory and cardiovascular disease, decreased lung function, visibility impairment, and damage to vegetation and ecosystems. Upon enactment of the 1990 Clean Air Act (CAA) amendments, Imperial County was classified as moderate nonattainment for the PM10 NAAQS under CAA sections 107(d)(4)(B) and 188(a). By November 15, 1991, such areas were required to develop and submit State Implementation Plan (SIP) revisions providing for, among other things, implementation of reasonably available control measures (RACM). Partly to address the RACM requirement, ICAPCD adopted local Regulation VIII rules to control PM10 from sources of fugitive dust on October 10, 1994, and revised them on November 25, 1996. USEPA did not act on these versions of the rules with respect to the federally enforceable SIP. On August 11, 2004, USEPA reclassified Imperial County as a serious nonattainment area for PM10. As a result, CAA section 189(b)(1)(B) required all BACM to be implemented in
Not Reasonably Controllable and August 20, 2018 Exceptional Event, Imperial County Not Reasonably Preventable
31
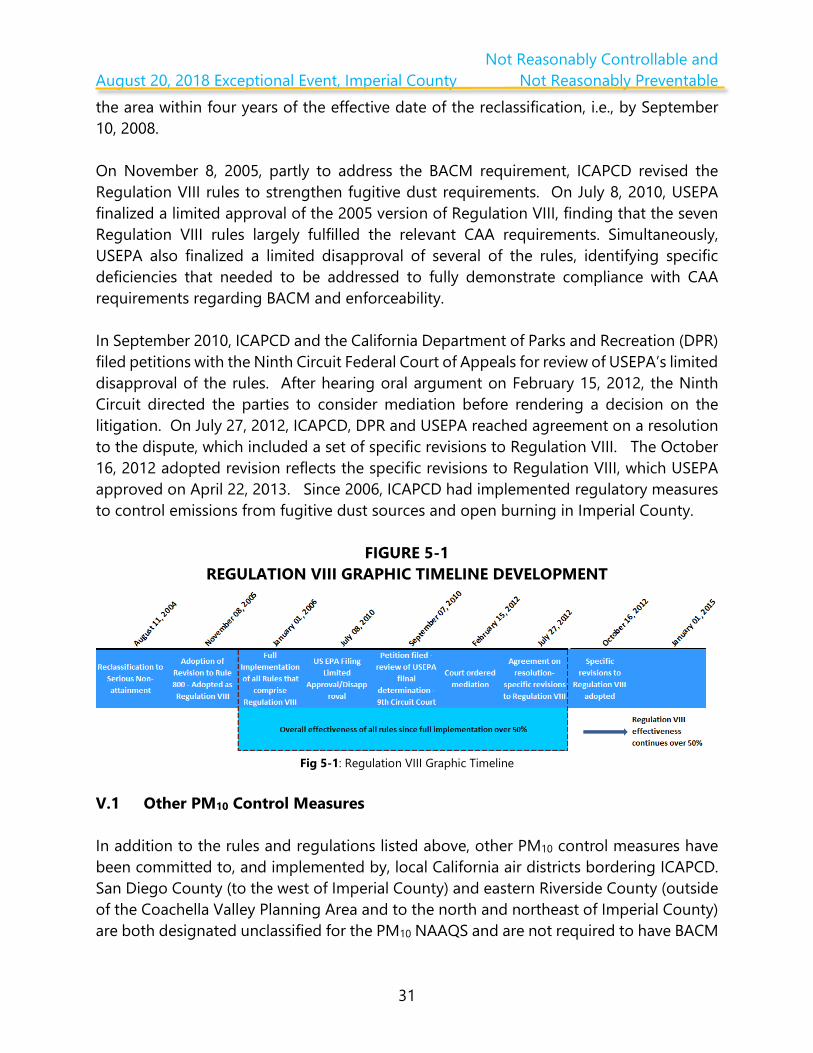
the area within four years of the effective date of the reclassification, i.e., by September 10, 2008. On November 8, 2005, partly to address the BACM requirement, ICAPCD revised the Regulation VIII rules to strengthen fugitive dust requirements. On July 8, 2010, USEPA finalized a limited approval of the 2005 version of Regulation VIII, finding that the seven Regulation VIII rules largely fulfilled the relevant CAA requirements. Simultaneously, USEPA also finalized a limited disapproval of several of the rules, identifying specific deficiencies that needed to be addressed to fully demonstrate compliance with CAA requirements regarding BACM and enforceability. In September 2010, ICAPCD and the California Department of Parks and Recreation (DPR) filed petitions with the Ninth Circuit Federal Court of Appeals for review of USEPA’s limited disapproval of the rules. After hearing oral argument on February 15, 2012, the Ninth Circuit directed the parties to consider mediation before rendering a decision on the litigation. On July 27, 2012, ICAPCD, DPR and USEPA reached agreement on a resolution to the dispute, which included a set of specific revisions to Regulation VIII. The October 16, 2012 adopted revision reflects the specific revisions to Regulation VIII, which USEPA approved on April 22, 2013. Since 2006, ICAPCD had implemented regulatory measures to control emissions from fugitive dust sources and open burning in Imperial County.
FIGURE 5-1 REGULATION VIII GRAPHIC TIMELINE DEVELOPMENT
Fig 5-1: Regulation VIII Graphic Timeline V.1 Other PM10 Control Measures
In addition to the rules and regulations listed above, other PM10 control measures have been committed to, and implemented by, local California air districts bordering ICAPCD. San Diego County (to the west of Imperial County) and eastern Riverside County (outside of the Coachella Valley Planning Area and to the north and northeast of Imperial County) are both designated unclassified for the PM10 NAAQS and are not required to have BACM

Not Reasonably Controllable and August 20, 2018 Exceptional Event, Imperial County Not Reasonably Preventable
32
controls for PM10. The Coachella Valley Planning Area in Riverside County, to the north and northwest of Imperial County, is designated a PM10 nonattainment area, and a redesignation request and maintenance plan were submitted to USEPA in 2010. These three areas and their relevant PM10 rules are indicated in Tables 5-1 to 5-3.
TABLE 5-1 SAN DIEGO AIR POLLUTION CONTROL DISTRICT (SDAPCD)
RULES REGULATING EXISTING AND NEW NON-POINT SOURCES IN SAN DIEGO COUNTY
RULE NUMBER AND TITLE DESCRIPTION Rule 52 – Particulate Matter Limits the amount of particulate matter that may be
discharged from any source. Rule 52.1 – NSPS and NESHAPS Particulate Matter Requirements
Ensures that sources subject to NSPS or NESHAPS also conform to Regulation X and XI, respectively.
Rule 54 – Dust and Fumes Minimizes the amount of dust that can be discharged in a specified time period.
Rule 55 – Fugitive Dust Control Provides a mechanism to regulate operations that may cause fugitive dust emissions.
Rule 101 – Burning Control Establishes conditions, including high winds, under which burning would be curtailed or prohibited.
TABLE 5-2
MOJAVE DESERT AIR QUALITY MANAGEMENT DISTRICT (AQMD) RULES REGULATING
EXISTING AND NEW NON-POINT SOURCES IN EASTERN RIVERSIDE COUNTY OUTSIDE OF THE COACHELLA VALLEY PLANNING AREA
RULE NUMBER AND TITLE DESCRIPTION Rule 403 – Fugitive Dust Limits the amount of particulate matter that may
be discharged from specific sources, not including unpaved public roads or farm roads, or industrial or commercial facilities.
Rule 404 – Particulate Matter Concentration
Limits the concentration of PM10 allowed in discharged gas.
Rule 405 – Solid Particulate Matter Weight
Limits the amount of PM10 that can be discharged on an hourly basis.

Not Reasonably Controllable and August 20, 2018 Exceptional Event, Imperial County Not Reasonably Preventable
33
TABLE 5-3 SOUTH COAST AIR QUALITY MANAGEMENT DISTRICT (SCAQMD)
RULES REGULATING EXISTING AND NEW NON-POINT SOURCES IN RIVERSIDE COUNTY
AND THE COACHELLA VALLEY, INSIDE OF THE COACHELLA VALLEY PLANNING AREA RULE NUMBER AND TITLE DESCRIPTION
Rule 403– Fugitive Dust Requires implementation of control measures to prevent, reduce, or mitigate fugitive dust emissions.
Rule 403.1 – Supplemental Fugitive Dust Control Requirements for Coachella Valley Sources
Establishes special requirements for Coachella Valley dust sources under high-wind conditions and requires SCAPCD approval of dust control plans for sources not subject to local government ordinances.
Rule 1156 – Further Reductions of Particulate Emissions from Cement Manufacturing Facilities
Establishes requirements to reduce particulate matter emissions from cement manufacturing operations and properties.
Rule 1157 – PM10 Emission Reductions from Aggregate and Related Operations
Establishes additional source specific performance standards and specifies operational PM10 controls specific to aggregate and related operations.
Rule 1186 – PM10 Emissions from Paved and Unpaved Roads and Livestock Operation
Limits the amount of particulate matter entrained as a result of vehicular travel on paved and unpaved public roads, and at livestock operations.
Rule 1466 – Control of Particulate Emissions from Soils with Toxic Air Contaminants
Establishes a PM10 ambient dust concentration limit, dust control measures, and notification requirements prior to earth-moving activities or when PM10 dust concentrations are exceeded.
V.2 Wind Observations As previously discussed, wind data analysis indicates that on August 20, 2018 at least one site measured wind speeds at or above 25 mph. Wind speeds of 25 mph are normally sufficient to overcome most PM10 control measures. During the August 20, 2018 event, wind speeds were above the 25 mph threshold, overcoming reasonable controls in place.
Not Reasonably Controllable and August 20, 2018 Exceptional Event, Imperial County Not Reasonably Preventable
34
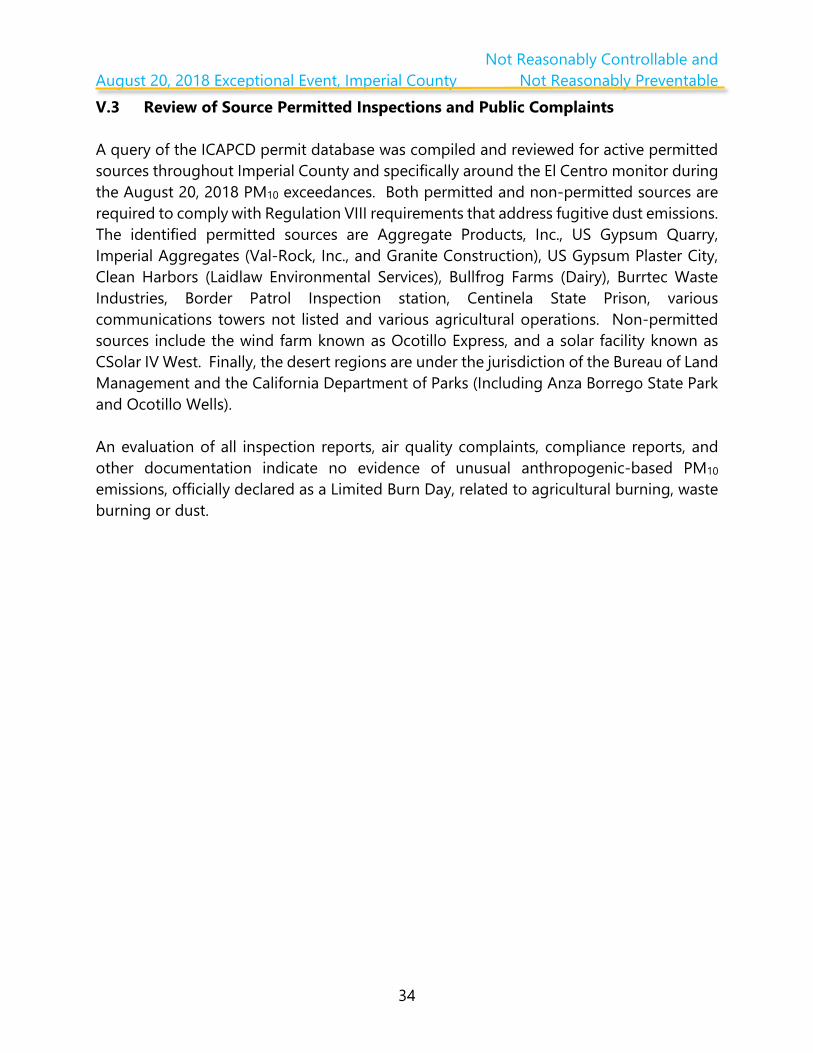
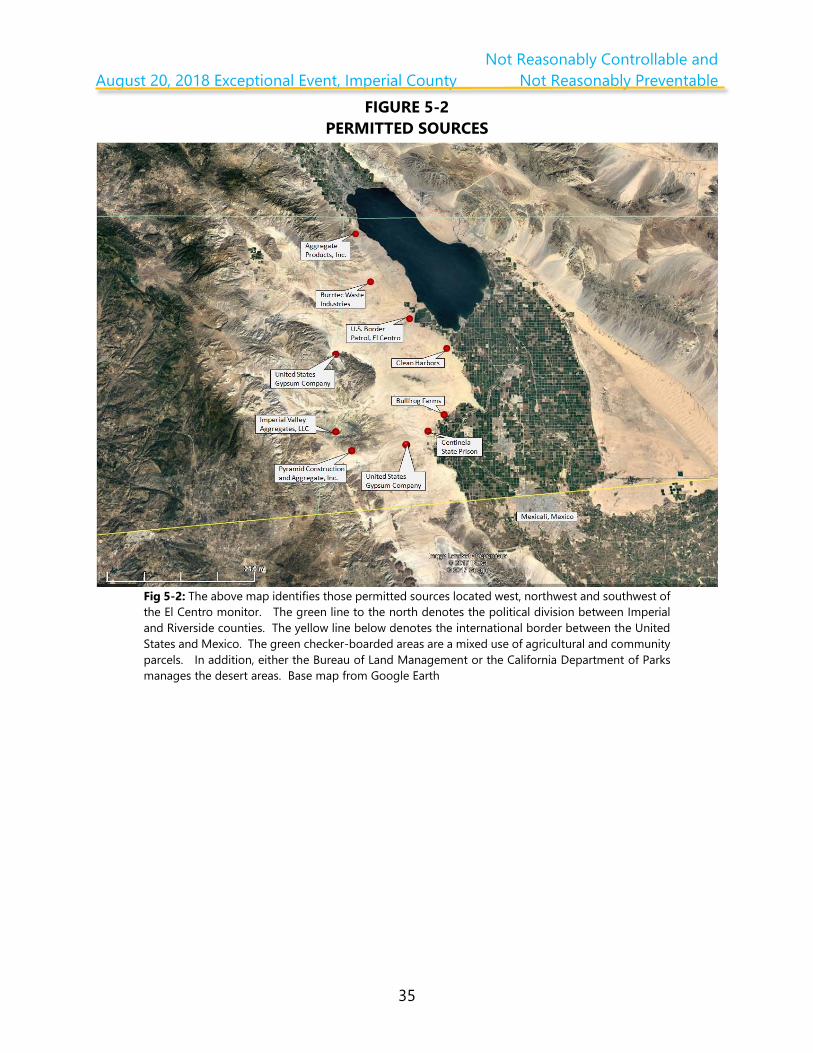
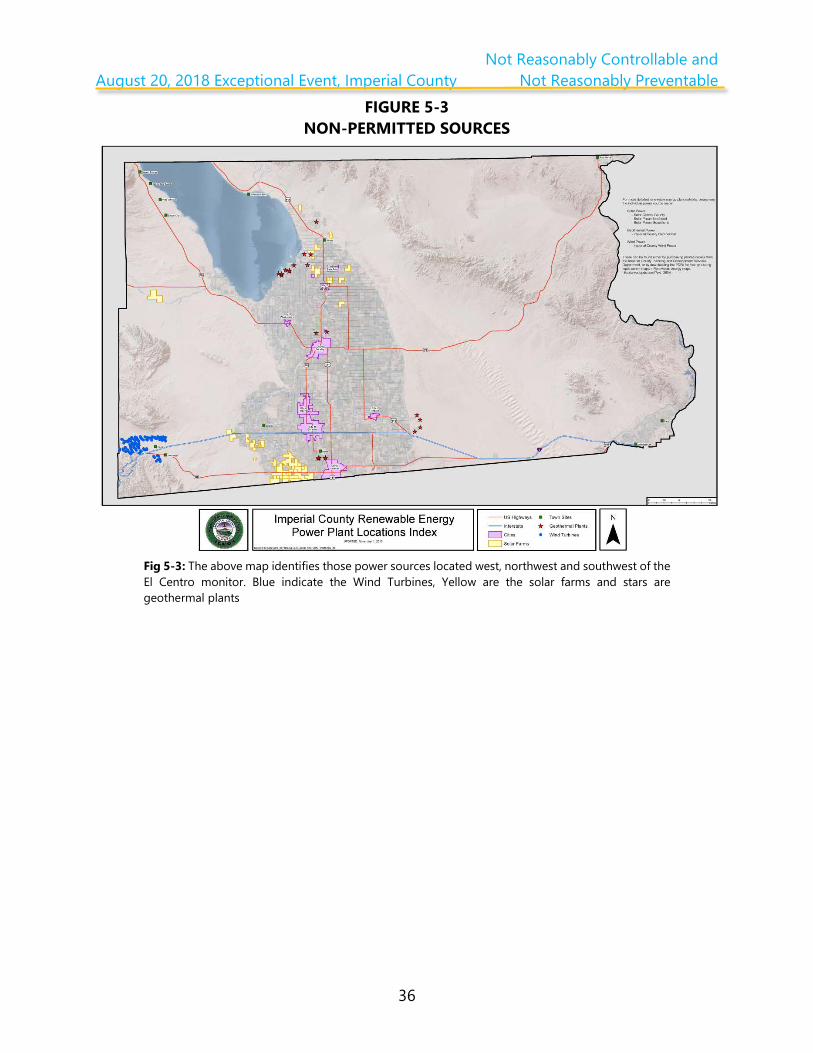
V.3 Review of Source Permitted Inspections and Public Complaints A query of the ICAPCD permit database was compiled and reviewed for active permitted sources throughout Imperial County and specifically around the El Centro monitor during the August 20, 2018 PM10 exceedances. Both permitted and non-permitted sources are required to comply with Regulation VIII requirements that address fugitive dust emissions. The identified permitted sources are Aggregate Products, Inc., US Gypsum Quarry, Imperial Aggregates (Val-Rock, Inc., and Granite Construction), US Gypsum Plaster City, Clean Harbors (Laidlaw Environmental Services), Bullfrog Farms (Dairy), Burrtec Waste Industries, Border Patrol Inspection station, Centinela State Prison, various communications towers not listed and various agricultural operations. Non-permitted sources include the wind farm known as Ocotillo Express, and a solar facility known as CSolar IV West. Finally, the desert regions are under the jurisdiction of the Bureau of Land Management and the California Department of Parks (Including Anza Borrego State Park and Ocotillo Wells).
An evaluation of all inspection reports, air quality complaints, compliance reports, and other documentation indicate no evidence of unusual anthropogenic-based PM10 emissions, officially declared as a Limited Burn Day, related to agricultural burning, waste burning or dust.
Not Reasonably Controllable and August 20, 2018 Exceptional Event, Imperial County Not Reasonably Preventable
35
FIGURE 5-2 PERMITTED SOURCES
Fig 5-2: The above map identifies those permitted sources located west, northwest and southwest of the El Centro monitor. The green line to the north denotes the political division between Imperial and Riverside counties. The yellow line below denotes the international border between the United States and Mexico. The green checker-boarded areas are a mixed use of agricultural and community parcels. In addition, either the Bureau of Land Management or the California Department of Parks manages the desert areas. Base map from Google Earth
Not Reasonably Controllable and August 20, 2018 Exceptional Event, Imperial County Not Reasonably Preventable
36
FIGURE 5-3 NON-PERMITTED SOURCES
Fig 5-3: The above map identifies those power sources located west, northwest and southwest of the El Centro monitor. Blue indicate the Wind Turbines, Yellow are the solar farms and stars are geothermal plants
August 20, 2018 Exceptional Event, Imperial County Natural Event
37
VI A Natural Event – A demonstration that the event was a human activity that is unlikely to recur at a particular location or was a natural event.
Typically, Monsoonal Gulf Surges from Mexico cause thunderstorm downburst, outflow winds and gust fronts from thunderstorms that affect the region. The Gulf Surge from northern Mexico that created thunderstorms produced strong and gusty southerly outflow winds that generated and transported emissions from northern Mexico and southwestern Arizona into Imperial County. While actual reportable winds speeds may be lacking in the source area, there are equally substantiated reports of a dust storm and of a wall of dust, both reported in Imperial County near the vicinity of the El Centro monitor on August 20, 2018. Strong gusty southerly outflow winds from thunderstorms blew over the open natural deserts within northern Mexico and Arizona during August 20, 2018 and onto the air quality monitors in Imperial County. VI.1 Affects Air Quality The preamble to the revised EER states that an event is considered to have affected air quality if it can be demonstrated that the event affected air quality in such a way that there exists a clear causal relationship between the specific event and the monitored exceedance or violation. Given the information presented in this demonstration, particularly Section III, we can reasonably conclude that there exists a clear causal relationship between the monitored exceedance and the August 20, 2018 event, which changed or affected air quality in Imperial County. VI.2 Not Reasonably Controllable or Preventable In order for an event to be defined as an exceptional event under section 50.1(j) of 40 CFR Part 50 an event must be “not reasonably controllable or preventable.” The revised preamble explains that the nRCP has two prongs, not reasonably preventable and not reasonably controllable. The nRCP is met for natural events where high wind events entrain dust from desert areas, whose sources are reasonably controlled, where human activity played little or no direct causal role. This demonstration provides evidence that the primary source areas of windblown dust transported into Imperial County came from Mexico and Arizona where Imperial County has no jurisdiction. In any event, despite reasonable controls in place within Imperial County, high winds overwhelmed all reasonable controls where human activity played little to no direct causal role. The PM10 exceedance measured at the El Centro monitor was caused by naturally occurring gusty
August 20, 2018 Exceptional Event, Imperial County Natural Event
38
southerly winds that transported windblown dust into Imperial County and other parts of southern California from areas located within the Sonoran Desert regions to the south and southeast of Imperial County. These facts provide strong evidence that the PM10 exceedance at the El Centro monitor on August 20, 2018, was not reasonably controllable or preventable. VI.3 Natural Event The revised preamble to the EER clarifies that a “Natural Event” (50.1(k) of 40 CFR Part 50) is an event with its resulting emissions, which may recur at the same location, in which human activity plays little or no direct causal role. Anthropogenic sources that are reasonably controlled are considered not to play a direct role in causing emissions. As discussed within this demonstration, the PM10 exceedance that occurred at the El Centro, monitor on August 20, 2018, was caused by the transport of windblown dust into Imperial County by strong southerly winds associated with a Gulf Surge that entered the region. At the time of the event, anthropogenic sources, within Imperial County were reasonably controlled. The event therefore qualifies as a natural event. VI.4 Clear Causal Relationship The comparative analysis of different meteorological sites to PM10 concentrations measured at the El Centro monitor in Imperial County demonstrates a consistency of elevated southerly winds with elevated concentrations of PM10 on August 20, 2018. In addition, temporal analysis indicates that the elevated PM10 concentrations and the southerly winds were an event that was widespread, regional and not preventable. Days before the high wind event PM10 concentrations were well below the NAAQS. Overall, the demonstration provides evidence of the strong correlation between the natural event and the transported windblown dust to the exceedance on August 20, 2018. VI.5 Concentration to Concentration Analysis The historical annual and seasonal 24-hr average PM10 measured concentrations at the El Centro monitor were outside the normal historical concentrations when compared to event and non-event days. VI.6 Conclusion The preceding discussion, graphs, figures, and tables provide wind direction, speed and concentration data illustrating the spatial and temporal effects of the southerly outflow winds that resulted from the intrusion of a Gulf surge into the region. The information
August 20, 2018 Exceptional Event, Imperial County Natural Event
39
provides a clear causal relationship between the entrained windblown dust and the PM10 exceedance measured at the El Centro air quality monitor in Imperial County on August 20, 2018. In particular, the clear causal relationship and not reasonably controllable or preventable sections provide evidence that southerly outflow winds transported fugitive emissions from open natural desert areas, located within northern Mexico and southwestern Arizona (all part of the Sonoran Desert). In addition, because anthropogenic sources in upwind areas were reasonably controlled at the time of the event, this event meets the definition of a Natural Event.25
25 Title 40 Code of Federal Regulations part 50: §50.1(k) Natural event means an event and its resulting emissions, which may recur at the same location, in which human activity plays little or no direct causal role. For purposes of the definition of a natural event, anthropogenic sources that are reasonably controlled shall be considered to not play a direct role in causing emissions.
Related Documents