http://hfs.sagepub.com/ Ergonomics Society of the Human Factors and Human Factors: The Journal http://hfs.sagepub.com/content/41/1/118 The online version of this article can be found at: DOI: 10.1518/001872099779577336 1999 41: 118 Human Factors: The Journal of the Human Factors and Ergonomics Society Stephen H. Fairclough and Robert Graham Comparative Study Impairment of Driving Performance Caused by Sleep Deprivation or Alcohol: A Published by: http://www.sagepublications.com On behalf of: Human Factors and Ergonomics Society can be found at: Society Human Factors: The Journal of the Human Factors and Ergonomics Additional services and information for http://hfs.sagepub.com/cgi/alerts Email Alerts: http://hfs.sagepub.com/subscriptions Subscriptions: http://www.sagepub.com/journalsReprints.nav Reprints: http://www.sagepub.com/journalsPermissions.nav Permissions: http://hfs.sagepub.com/content/41/1/118.refs.html Citations: What is This? - Mar 1, 1999 Version of Record >> at Liverpool John Moores University on October 28, 2014 hfs.sagepub.com Downloaded from at Liverpool John Moores University on October 28, 2014 hfs.sagepub.com Downloaded from

Welcome message from author
This document is posted to help you gain knowledge. Please leave a comment to let me know what you think about it! Share it to your friends and learn new things together.
Transcript
http://hfs.sagepub.com/Ergonomics Society
of the Human Factors and Human Factors: The Journal
http://hfs.sagepub.com/content/41/1/118The online version of this article can be found at:
DOI: 10.1518/001872099779577336
1999 41: 118Human Factors: The Journal of the Human Factors and Ergonomics SocietyStephen H. Fairclough and Robert Graham
Comparative StudyImpairment of Driving Performance Caused by Sleep Deprivation or Alcohol: A
Published by:
http://www.sagepublications.com
On behalf of:
Human Factors and Ergonomics Society
can be found at:SocietyHuman Factors: The Journal of the Human Factors and ErgonomicsAdditional services and information for
http://hfs.sagepub.com/cgi/alertsEmail Alerts:
http://hfs.sagepub.com/subscriptionsSubscriptions:
http://www.sagepub.com/journalsReprints.navReprints:
http://www.sagepub.com/journalsPermissions.navPermissions:
http://hfs.sagepub.com/content/41/1/118.refs.htmlCitations:
What is This?
- Mar 1, 1999Version of Record >> at Liverpool John Moores University on October 28, 2014hfs.sagepub.comDownloaded from at Liverpool John Moores University on October 28, 2014hfs.sagepub.comDownloaded from
INTRODUCTION
Driver impairment is defined as a change indriving performance caused by the deleteriouseffects of alcohol, fatigue, drugs, or sudden ill-ness (Fairclough, 1997a). In 1995, approxi-mately 24% of traffic casualties in the UnitedKingdom were driving under the influence ofan illegal level of alcohol – that is, > 0.08%blood alcohol content (BAC; Clayton, 1997).A recent survey of UK drivers indicated thatdriver fatigue was a contributory factor in 9%to 10% of accidents (Maycock, 1995).
The development of transport telematics systems has been proposed as a potential coun-termeasure to accidents induced by driver im-pairment. These systems encompass real-timemonitoring, diagnosis, and feedback of drivingimpairment (e.g., Brookhuis, De Waard, &Bekiaris, 1997; Haworth & Vulcan, 1991; Mackie& Wylie, 1990; Wierwille, 1994). The goal of
this technology is to provide predictive feed-back concerning early symptoms of impaireddriving. It is predicted that warning feedbackmay persuade the driver to break from the jour-ney and, therefore, avoid those safety-criticalepisodes of impairment that increase the risk ofaccidents. Driver impairment monitoring tech-nology relies on the sensitivity and validity ofsensor apparatus in order to function effective-ly. The suitability of various sensor technologiesmay be assessed with reference to a number ofmeasurement criteria (O’Donnell & Eggemeier,1986): (a) that measures should be sufficientlysensitive to the earliest symptoms of impair-ment; (b) that measures are diagnostic – that is,capable of discriminating the influence offatigue from other categories of impairment,such as alcoholic intoxication; and (c) thatmeasures are selective and therefore able to dis-tinguish the impairment “signal” against adynamic and highly variable “noise” from the
Impairment of Driving Performance Caused by SleepDeprivation or Alcohol: A Comparative Study
Stephen H. Fairclough and Robert Graham, HUSAT Research Institute, LoughboroughUniversity, Loughborough, Leicestershire, United Kingdom
A study was conducted to assess the relative impact of partial sleep deprivation(restriction to 4 h sleep before testing) and full sleep deprivation (no sleep onthe night before testing) on 2 h of simulated driving, compared with an alcoholtreatment (mean blood alcohol content = 0.07%). Data were collected from the64 male participants on the primary driving task, psychophysiology (0.1 Hzheart rate variability), and subjective self-assessment. The results revealed thatthe full sleep deprivation and alcohol group exhibited a safety-critical decline inlane-keeping performance. The partial sleep deprivation group exhibited onlynoncritical alterations in primary task performance. Both sleep-deprived groupswere characterized by subjective discomfort and an awareness of reduced per-formance capability. These subjective symptoms were not perceived by the alco-hol group. The findings are discussed with reference to the development ofsystems for the online diagnosis of driver fatigue. Potential applications of thisresearch include the formulation of performance criteria to be encompassedwithin a driver impairment monitoring system.
Address correspondence to Stephen H. Fairclough, HUSAT Research Institute, Loughborough University, The Elms, ElmsGrove, Loughborough, Leicestershire, LE11 1RG, United Kingdom; [email protected]. HUMAN FACTORS,Vol. 41, No. 1, March 1999, pp. 118–128. Copyright © 1999, Human Factors and Ergonomics Society. All rights reserved.
at Liverpool John Moores University on October 28, 2014hfs.sagepub.comDownloaded from
DRIVER IMPAIRMENT 119
driving environment. It is argued that a combi-nation of these criteria should be used to indexthe global accuracy of an impairment monitor-ing system.
Psychophysiological measures may be collect-ed on a remote basis (i.e., there is no require-ment to attach electrodes to participants);for instance, machine vision apparatus may beused to monitor eyelid activity (Tock & Craw,1992). Although psychophysiology appears to besufficiently sensitive, problems of selectivityare anticipated because of the inherently“noisy” environment inside the vehicle cockpit(e.g., fluctuations in temperature and lightingconditions). Behavioral measures are alsopotentially useful. However, it is postulated thatcertain symptoms, such as head-nodding whenfatigued, occur at a relatively late stage ofimpairment and therefore may lack sufficientsensitivity. (Evidence for this view was providedby Haworth & Vulcan, 1991.)
The measurement of driving performancerepresents a valid strategy to index impair-ment (i.e., impairment is inferred directly onthe basis of primary task performance ratherthan via a proxy measure). However, a num-ber of problems are associated with the use ofdriving performance as a predictive and diag-nostic source of impairment (Fairclough,1997b). Specifically, primary task measuresare deemed to be insufficiently sensitive to thepresence of impairment; that is, task perfor-mance is protected from the influence ofimpairment by compensatory strategies (DeWaard, 1996; Hockey, 1997). In addition,there is evidence of selectivity problems forperformance measures. For example, in astudy of simulated driving, Desmond andMatthews (1997) demonstrated that the pres-ence of road curves was sufficient to suppressimpaired vehicular control. Studies encom-passing driver impairment caused by alcoholand fatigue have revealed a significant degreeof overlap, with both showing effects of areduction in the fidelity of responses to speedchanges of a lead vehicle and an increase inthe variability of lateral control (De Waard &Brookhuis, 1991). Therefore, it may be arguedthat driving measures are not sufficiently diag-nostic to differentiate one category of impair-ment from the other.
Despite these problems, primary task mea-sures occupy a pivotal role in the developmentof driver impairment monitoring systems.These measures form the main source of datafor those telematic systems that employ multi-dimensional assessment (Brookhuis et al.,1997). In addition, the standard means of esti-mating the validity of indirect measures suchas psychophysiology is to utilize changes inprimary driving performance as a referencevariable (Wierwille, 1994).
The aim of the current study was to assesschanges in driver performance caused by theinfluence of two sources of impairment (sleepdeprivation and alcoholic intoxication) withina simulated environment. The study includedmultidimensional measurement in order toassess the sensitivity of the primary task tochanges in subjective self-assessment and psy-chophysiology. The inclusion of two differentimpairment manipulations within the studywas intended to reveal the diagnosticity of pri-mary measures. In addition, the simulatedenvironment contained a number of drivingscenarios (i.e., interactions with other vehi-cles) in order to allow us to index the selectiv-ity of driving performance measures.
METHOD
Design
The study involved four between-subjectstreatment groups, as follows: a control group(participants had a full night of sleep beforethe trial and did not receive alcohol), a partialsleep deprivation group (PartSD; participantswere instructed to sleep for 4 h between mid-night and 4:00 a.m. on the night before thetrial and did not receive alcohol), a full sleepdeprivation group (FullSD; participants wereinstructed to remain awake throughout thenight before the trial and did not receive alco-hol), and an alcohol group (participants had afull night of sleep on the night before the trialand received an alcoholic drink – a mixture ofvodka and lemonade – before the experimentalsession). The amount of alcohol administeredwas calculated according to the Widmarkequation as described by Walls and Brownlie(1985). Participants received an amount toapproximate a peak level of BAC in the range
at Liverpool John Moores University on October 28, 2014hfs.sagepub.comDownloaded from
120 March 1999 – Human Factors
of 0.08% to 0.1%. The trial consisted of threecumulative 40-min periods of simulated driv-ing. The manipulation of driving scenarioformed a second within-subjects factor andwas designed to induce differing degrees oftask demand.
This experimental design contained a de-gree of deception – that is, participants in thealcohol group were not briefed regarding thepresence and volume of alcohol received.Therefore, the full procedure for the proposedexperimental design was submitted, reviewed,and approved on ethical grounds by theEthical Advisory Committee at LoughboroughUniversity. This committee raised a number ofconcerns. They recommended gathering moredetailed information on participant health aswell as highlighting and reminding partici-pants of their right to withdraw from thestudy at any point without incurring a finan-cial penalty.
Participants
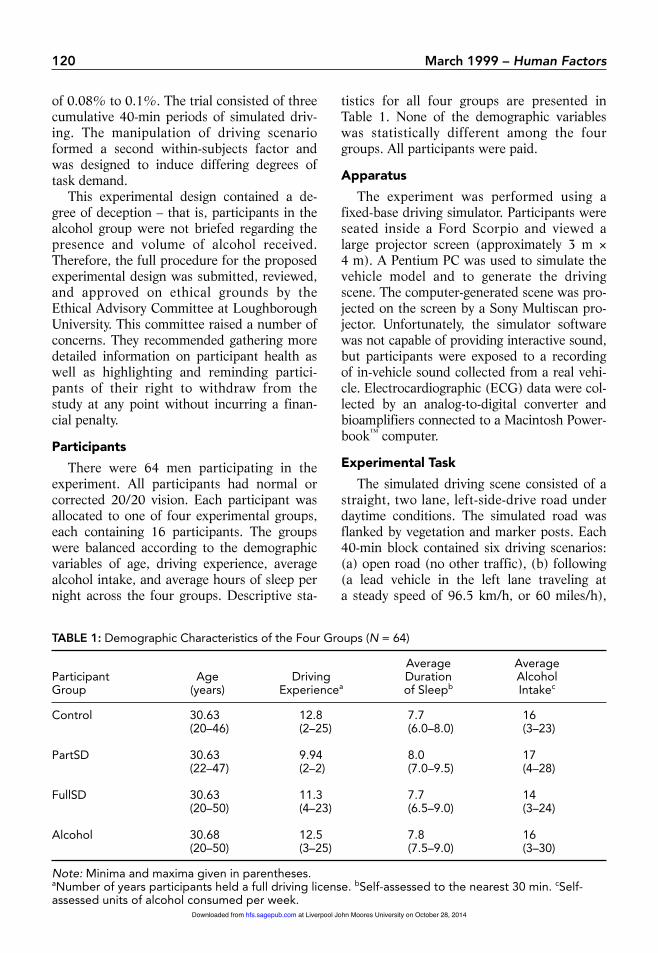
There were 64 men participating in theexperiment. All participants had normal orcorrected 20/20 vision. Each participant wasallocated to one of four experimental groups,each containing 16 participants. The groupswere balanced according to the demographicvariables of age, driving experience, averagealcohol intake, and average hours of sleep pernight across the four groups. Descriptive sta-
tistics for all four groups are presented inTable 1. None of the demographic variableswas statistically different among the fourgroups. All participants were paid.
Apparatus
The experiment was performed using afixed-base driving simulator. Participants wereseated inside a Ford Scorpio and viewed alarge projector screen (approximately 3 m ×4 m). A Pentium PC was used to simulate thevehicle model and to generate the drivingscene. The computer-generated scene was pro-jected on the screen by a Sony Multiscan pro-jector. Unfortunately, the simulator softwarewas not capable of providing interactive sound,but participants were exposed to a recordingof in-vehicle sound collected from a real vehi-cle. Electrocardiographic (ECG) data were col-lected by an analog-to-digital converter andbioamplifiers connected to a Macintosh Power-book™ computer.
Experimental Task
The simulated driving scene consisted of astraight, two lane, left-side-drive road underdaytime conditions. The simulated road wasflanked by vegetation and marker posts. Each40-min block contained six driving scenarios:(a) open road (no other traffic), (b) following(a lead vehicle in the left lane traveling at a steady speed of 96.5 km/h, or 60 miles/h),
TABLE 1: Demographic Characteristics of the Four Groups (N = 64)
Average AverageParticipant Age Driving Duration AlcoholGroup (years) Experiencea of Sleepb Intakec
Control 30.63 12.8 7.7 16(20–46) (2–25) (6.0–8.0) (3–23)
PartSD 30.63 9.94 8.0 17(22–47) (2–2) (7.0–9.5) (4–28)
FullSD 30.63 11.3 7.7 14(20–50) (4–23) (6.5–9.0) (3–24)
Alcohol 30.68 12.5 7.8 16(20–50) (3–25) (7.5–9.0) (3–30)
Note: Minima and maxima given in parentheses.aNumber of years participants held a full driving license. bSelf-assessed to the nearest 30 min. cSelf-assessed units of alcohol consumed per week.
at Liverpool John Moores University on October 28, 2014hfs.sagepub.comDownloaded from
DRIVER IMPAIRMENT 121
(c) passing (vehicles overtaking in the right laneat a rate of one every 50 s, (d) following/pass-ing (a combination of Scenarios b and c), (e)low sinusoidal following (a lead vehicle in theleft lane varying its speed sinusoidally between88.5 and 104.6 km/h, or 55 and 65 miles/h,with a cycle time of 30 s; see Brookhuis, DeWaard, & Mulder, 1994), and (f) high sinu-soidal following (the lead vehicle varying itsspeed sinusoidally between 80.5 and 112.6km/h, or 50 and 70 miles/h, with a 30-s cycletime). The presentation order of the scenarioswas fixed within each 40-min block but wasdifferent among the three blocks. Each 40-minblock began with a 10-min open-road scenarioin which no data were collected.
Experimental Measures
Measurement of the driving task was dividedinto lateral control, longitudinal control, andspeed control. Lateral control was measured atthree levels of criticality: (a) frequency of “acci-dents,” defined as those occasions when thevehicle left the road edge or when the partici-pant collided with another vehicle; (b) frequen-cy of lane crossings (when two vehicle wheelsmade contact with the left lane edge or theright lane boundary); and (c) frequency of near-crossing incidents when the minimum time toline crossing (TLC; Van Winsum, Brookhuis, &De Waard, 1998) fell below 2 s. In order toindex participants’ steering input, the frequencyof steering wheel reversals was measured (thenumber of zero-crossings of the steering wheel,as defined by McLean & Hoffman, 1975).Longitudinal control was indexed via meantime headway (intervehicle distance divided byspeed), and speed variability was calculated. Allmeasures of primary driving performance wereoriginally sampled at 10 Hz.
ECG data were collected via three dispos-able electrodes attached to the participant’schest. R-peaks of the ECG trace were detectedand corrected for artifacts. The interbeat inter-val (IBI) variable was subjected to spectralanalysis and decomposed into three bandwidths(Mulder, 1979) to extract the midfrequencyband (0.07–0.14 Hz). This frequency band isrelated to short-term blood pressure regulationand has been successfully employed to indexdriver mental workload (De Waard, 1996).
The study employed a battery of subjectivemeasurement questionnaires. Participants com-pleted multiple administrations of (a) theUniversity of Wales Mood Adjective Checklist(Matthews, Jones, & Chamberlain, 1990), (b)the NASA-Task Load Index calculated on thebasis of raw ratings (RTLX; Byers, Bittner, &Hill, 1989; Hart & Staveland, 1988), (c) theKarolinska Sleepiness scale (Kecklund &Akerstedt, 1993), (d) a cognitive interferencescale (Sarason, Sarason, Keefe, Hayes, &Shearin, 1986), and (e) an eight-point sobrietyscale devised for the study.
Experimental Procedure
The participants came to our institute ontwo occasions: a practice session, then a testsession on the following day. The practice ses-sion involved a supervised training journey inthe simulator that lasted for 20 min, followedby a 20-min baseline journey, during whichpsychophysiology and driving data were col-lected.
All participants were provided with trans-portation to and from the institute on the dayof their test session. This arrangement wasmade to ensure the integrity of the alcoholplacebo. On arrival, participants were provid-ed with a drink. The control group and thetwo sleep-deprived groups received a placebocontaining lemonade with a tablespoon ofvodka floated on the surface to provide thesmell of alcohol. Once the drink had beenconsumed, participants completed a 10-minfamiliarization journey. Following familiariza-tion, all participants completed a pretest set ofsubjective questionnaires, and their breathwas analyzed using an alcohol meter (LionLaboratories Alcometer S-D2, Barry, Wales,UK). Participants then drove the first 40-minblock of the simulated journey. On comple-tion, participants filled out a second set ofsubjective questionnaires and their breath wasanalyzed once more. Both the subjective ques-tionnaires and Alcometer tests were adminis-tered following completion of the second andthird 40-min blocks. The recess after eachjourney block was restricted to 5 min. Oncompletion of the test session, participantswere debriefed, paid, and transported back totheir homes.
at Liverpool John Moores University on October 28, 2014hfs.sagepub.comDownloaded from
122 March 1999 – Human Factors
RESULTS
Alcohol Manipulation
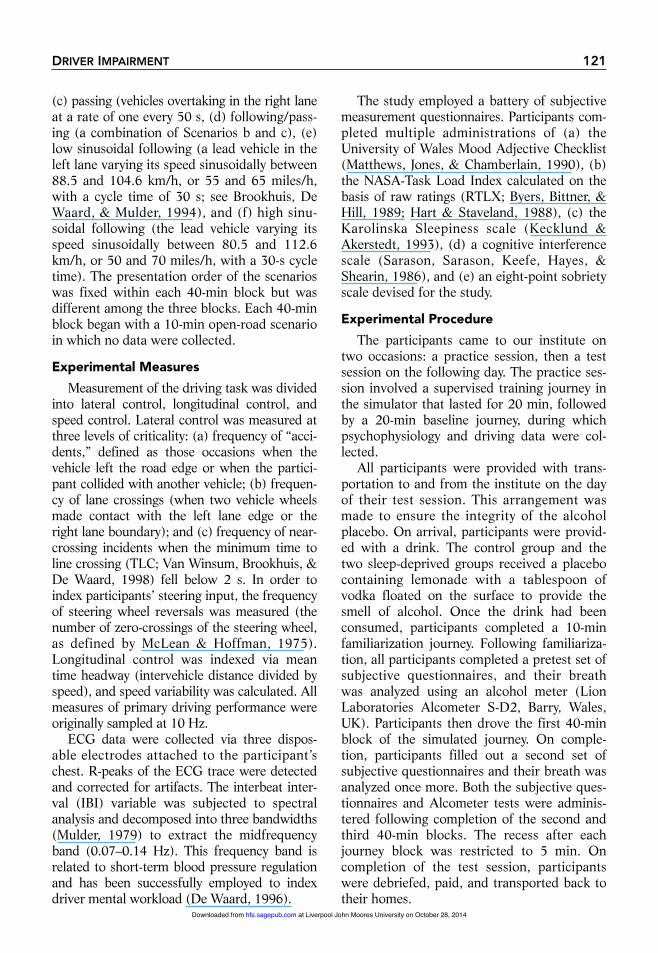
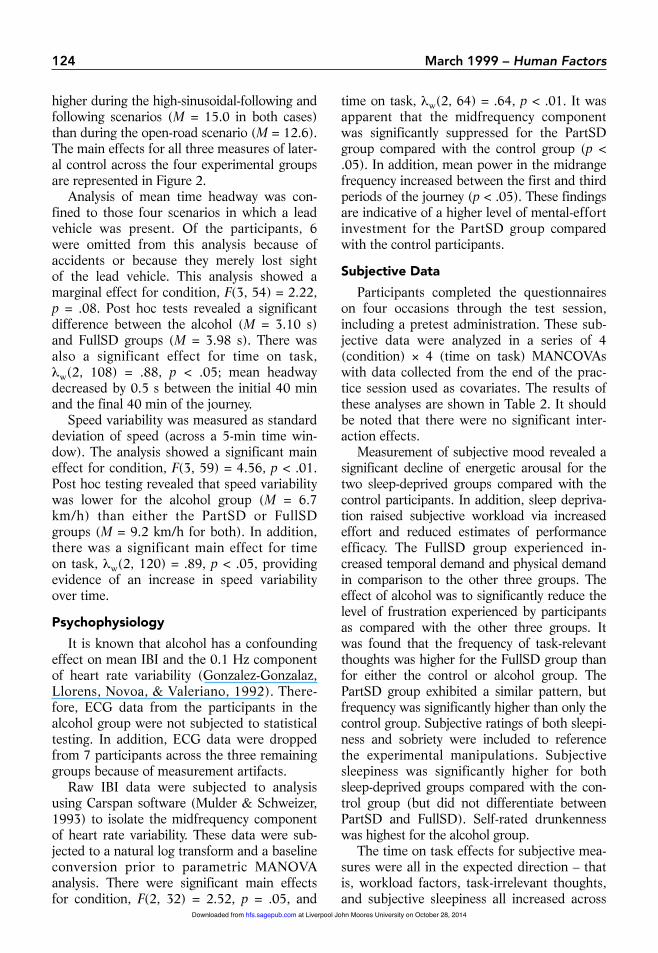
Administration of alcohol using the Wid-mark equation is an inexact procedure; themeans, standard errors, and standard devia-tions of actual BAC figures obtained duringthe study are shown in Figure 1. These dataillustrate that the participants in the alcoholgroup were on a descending BAC curvethrough the experimental session, droppingfrom a mean of 0.08% to 0.05% across the 2-h journey.
Primary Task Performance
The raw vehicle data were averaged acrossa 5-min time window for each driving scenario,and data were analyzed using multivariateanalysis of variance (MANOVA) techniques.When appropriate data were available fromthe baseline session and when the test con-tained a maximum of three main effects, mul-tivariate analyses of covariance (MANCOVAs)were employed (i.e., using baseline data ascovariates). If the test contained more thanthree factors, this caused a substantial prob-lem of interpretation; therefore the covariatewas not included. Within-subject significancewas reported using the Wilks’s lambda statis-tic, λw, to overcome problems of sphericity(Vasey & Thayer, 1987). All data were testedfor the existence of outliers, defined as raw
values further than 2.5 standard deviationsaway from the mean. All post hoc testing wasperformed via the Tukey HSD test.
In the course of the study, 51 accidentsoccurred. However, the distribution of acci-dent frequency rendered data unsuitable foranalysis – that is, 10 participants accountedfor all of the accidents, and of these, 2 wereresponsible for 24 accidents. The distributionof these participants across the four experi-mental groups was as follows: 5 from theFullSD group, 1 from the control group, and 4from the alcohol group.
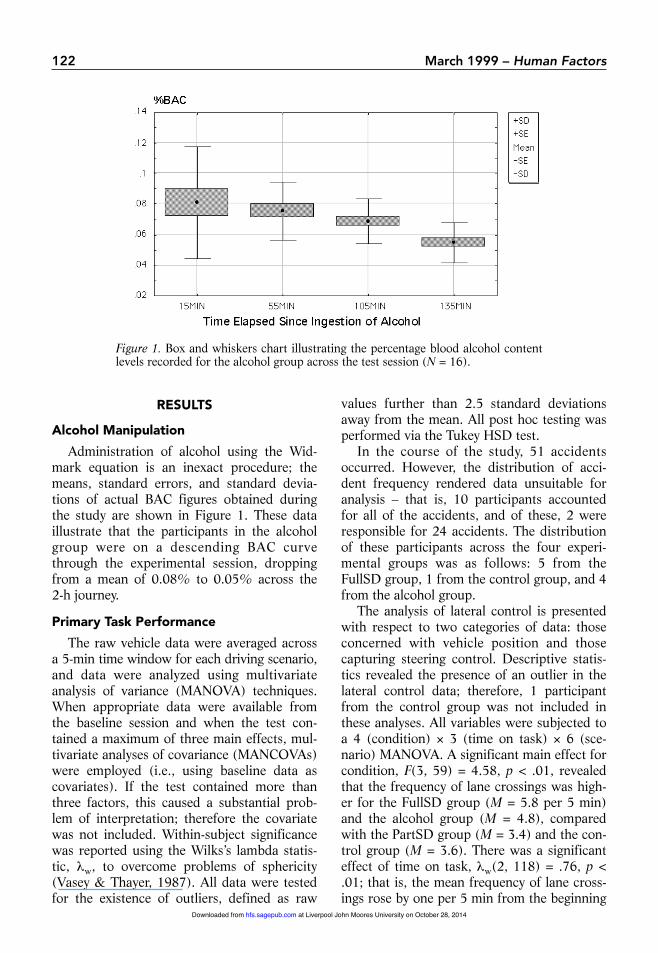
The analysis of lateral control is presentedwith respect to two categories of data: thoseconcerned with vehicle position and thosecapturing steering control. Descriptive statis-tics revealed the presence of an outlier in thelateral control data; therefore, 1 participantfrom the control group was not included inthese analyses. All variables were subjected toa 4 (condition) × 3 (time on task) × 6 (sce-nario) MANOVA. A significant main effect forcondition, F(3, 59) = 4.58, p < .01, revealedthat the frequency of lane crossings was high-er for the FullSD group (M = 5.8 per 5 min)and the alcohol group (M = 4.8), comparedwith the PartSD group (M = 3.4) and the con-trol group (M = 3.6). There was a significanteffect of time on task, λw(2, 118) = .76, p <.01; that is, the mean frequency of lane cross-ings rose by one per 5 min from the beginning
Figure 1. Box and whiskers chart illustrating the percentage blood alcohol contentlevels recorded for the alcohol group across the test session (N = 16).
at Liverpool John Moores University on October 28, 2014hfs.sagepub.comDownloaded from
DRIVER IMPAIRMENT 123
to the end of the journey. The main effect ofscenario revealed that the highest frequency oflane crossings occurred during the open-roadand passing scenarios, λw(5, 295) = .44, p <.01. A significant interaction of Condition ×Time on Task showed that the frequency oflane crossings was significantly lower in thealcohol group than in the FullSD group duringthe final 40 min of the journey, λw(6, 118) =.79, p < .01.
The frequency of near-lane-crossings wasindexed by those occasions when TLC fellbelow 2 s – that is, when the lateral velocity ofthe vehicle meant that it was 2 s away from alane crossing. These data revealed a marginal
effect of condition, F(3, 59) = 2.60, p < .06,which indicated a higher frequency of near-lane-crossings for the PartSD group (M = 4.6per 5 min) than for the other three groups.
Steering control was analyzed as the steer-ing wheel reversal rate per minute. Multi-variate analysis revealed a significant maineffect for condition, F(3, 59) = 26.6, p < .05,indicating that mean steering wheel reversalrate was higher for the control and alcoholgroups (M = 15.6 and 14.3, respectively) com-pared with the PartSD and FullSD groups (M =11.2 and 10.9, respectively). A significant maineffect for scenario, λw(5, 295) = .56, p < .01,revealed that levels of steering activity were
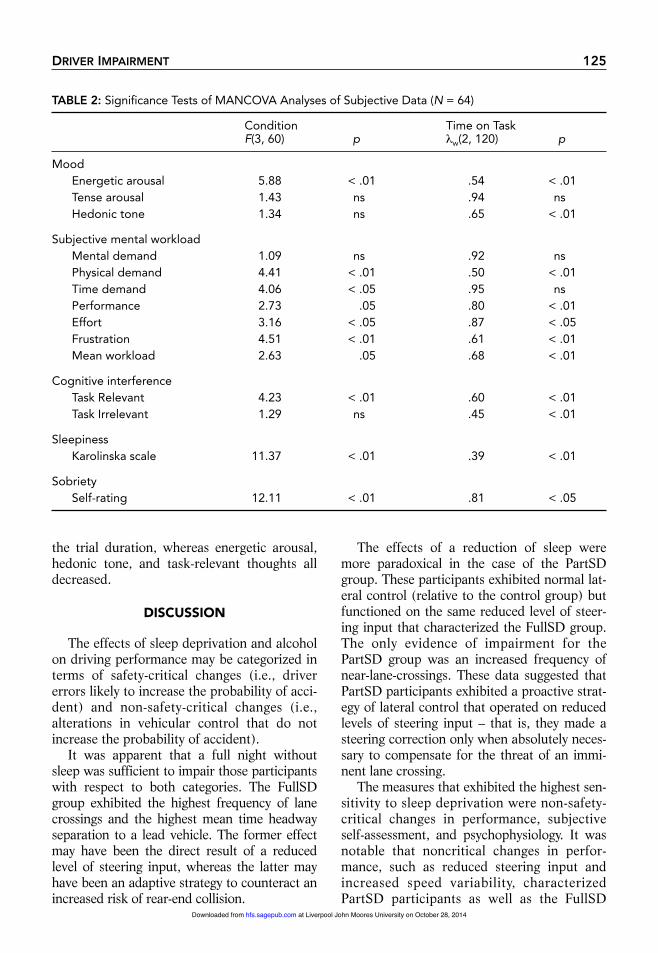
Figure 2. Lateral vehicle control as represented by mean frequency of lane crossings, mean frequency ofnear-lane-crossings, and steering wheel reversal rate across the four treatment groups (N = 63).
at Liverpool John Moores University on October 28, 2014hfs.sagepub.comDownloaded from
124 March 1999 – Human Factors
higher during the high-sinusoidal-following andfollowing scenarios (M = 15.0 in both cases)than during the open-road scenario (M = 12.6).The main effects for all three measures of later-al control across the four experimental groupsare represented in Figure 2.
Analysis of mean time headway was con-fined to those four scenarios in which a leadvehicle was present. Of the participants, 6were omitted from this analysis because ofaccidents or because they merely lost sight of the lead vehicle. This analysis showed amarginal effect for condition, F(3, 54) = 2.22,p = .08. Post hoc tests revealed a significantdifference between the alcohol (M = 3.10 s)and FullSD groups (M = 3.98 s). There wasalso a significant effect for time on task, λw(2, 108) = .88, p < .05; mean headwaydecreased by 0.5 s between the initial 40 minand the final 40 min of the journey.
Speed variability was measured as standarddeviation of speed (across a 5-min time win-dow). The analysis showed a significant maineffect for condition, F(3, 59) = 4.56, p < .01.Post hoc testing revealed that speed variabilitywas lower for the alcohol group (M = 6.7km/h) than either the PartSD or FullSDgroups (M = 9.2 km/h for both). In addition,there was a significant main effect for time on task, λw(2, 120) = .89, p < .05, providingevidence of an increase in speed variabilityover time.
Psychophysiology
It is known that alcohol has a confoundingeffect on mean IBI and the 0.1 Hz componentof heart rate variability (Gonzalez-Gonzalaz,Llorens, Novoa, & Valeriano, 1992). There-fore, ECG data from the participants in thealcohol group were not subjected to statisticaltesting. In addition, ECG data were droppedfrom 7 participants across the three remaininggroups because of measurement artifacts.
Raw IBI data were subjected to analysisusing Carspan software (Mulder & Schweizer,1993) to isolate the midfrequency componentof heart rate variability. These data were sub-jected to a natural log transform and a baselineconversion prior to parametric MANOVAanalysis. There were significant main effectsfor condition, F(2, 32) = 2.52, p = .05, and
time on task, λw(2, 64) = .64, p < .01. It wasapparent that the midfrequency componentwas significantly suppressed for the PartSDgroup compared with the control group (p <.05). In addition, mean power in the midrangefrequency increased between the first and thirdperiods of the journey (p < .05). These findingsare indicative of a higher level of mental-effortinvestment for the PartSD group comparedwith the control participants.
Subjective Data
Participants completed the questionnaireson four occasions through the test session,including a pretest administration. These sub-jective data were analyzed in a series of 4(condition) × 4 (time on task) MANCOVAswith data collected from the end of the prac-tice session used as covariates. The results ofthese analyses are shown in Table 2. It shouldbe noted that there were no significant inter-action effects.
Measurement of subjective mood revealed asignificant decline of energetic arousal for thetwo sleep-deprived groups compared with thecontrol participants. In addition, sleep depriva-tion raised subjective workload via increasedeffort and reduced estimates of performanceefficacy. The FullSD group experienced in-creased temporal demand and physical demandin comparison to the other three groups. Theeffect of alcohol was to significantly reduce thelevel of frustration experienced by participantsas compared with the other three groups. Itwas found that the frequency of task-relevantthoughts was higher for the FullSD group thanfor either the control or alcohol group. ThePartSD group exhibited a similar pattern, butfrequency was significantly higher than only thecontrol group. Subjective ratings of both sleepi-ness and sobriety were included to referencethe experimental manipulations. Subjectivesleepiness was significantly higher for bothsleep-deprived groups compared with the con-trol group (but did not differentiate betweenPartSD and FullSD). Self-rated drunkennesswas highest for the alcohol group.
The time on task effects for subjective mea-sures were all in the expected direction – thatis, workload factors, task-irrelevant thoughts,and subjective sleepiness all increased across
at Liverpool John Moores University on October 28, 2014hfs.sagepub.comDownloaded from
DRIVER IMPAIRMENT 125
the trial duration, whereas energetic arousal,hedonic tone, and task-relevant thoughts alldecreased.
DISCUSSION
The effects of sleep deprivation and alcoholon driving performance may be categorized interms of safety-critical changes (i.e., drivererrors likely to increase the probability of acci-dent) and non-safety-critical changes (i.e.,alterations in vehicular control that do notincrease the probability of accident).
It was apparent that a full night withoutsleep was sufficient to impair those participantswith respect to both categories. The FullSDgroup exhibited the highest frequency of lanecrossings and the highest mean time headwayseparation to a lead vehicle. The former effectmay have been the direct result of a reducedlevel of steering input, whereas the latter mayhave been an adaptive strategy to counteract anincreased risk of rear-end collision.
The effects of a reduction of sleep weremore paradoxical in the case of the PartSDgroup. These participants exhibited normal lat-eral control (relative to the control group) butfunctioned on the same reduced level of steer-ing input that characterized the FullSD group.The only evidence of impairment for thePartSD group was an increased frequency ofnear-lane-crossings. These data suggested thatPartSD participants exhibited a proactive strat-egy of lateral control that operated on reducedlevels of steering input – that is, they made asteering correction only when absolutely neces-sary to compensate for the threat of an immi-nent lane crossing.
The measures that exhibited the highest sen-sitivity to sleep deprivation were non-safety-critical changes in performance, subjectiveself-assessment, and psychophysiology. It wasnotable that noncritical changes in perfor-mance, such as reduced steering input andincreased speed variability, characterizedPartSD participants as well as the FullSD
TABLE 2: Significance Tests of MANCOVA Analyses of Subjective Data (N = 64)
Condition Time on TaskF(3, 60) p λw(2, 120) p
MoodEnergetic arousal 5.88 < .01 .54 < .01Tense arousal 1.43 ns .94 nsHedonic tone 1.34 ns .65 < .01
Subjective mental workloadMental demand 1.09 ns .92 nsPhysical demand 4.41 < .01 .50 < .01Time demand 4.06 < .05 .95 nsPerformance 2.73 .05 .80 < .01Effort 3.16 < .05 .87 < .05Frustration 4.51 < .01 .61 < .01Mean workload 2.63 .05 .68 < .01
Cognitive interferenceTask Relevant 4.23 < .01 .60 < .01Task Irrelevant 1.29 ns .45 < .01
SleepinessKarolinska scale 11.37 < .01 .39 < .01
SobrietySelf-rating 12.11 < .01 .81 < .05
at Liverpool John Moores University on October 28, 2014hfs.sagepub.comDownloaded from
126 March 1999 – Human Factors
group. If both groups are considered represen-tative of a continuum of rising impairment,sleep deprivation makes an impact on non-safety-critical behaviors at a moderate level(represented by the PartSD manipulation) andextends its influence to safety-critical perfor-mance at higher levels (represented by theFullSD manipulation). That is, the compensa-tory response of the driver to rising impairmentmay protect safety-critical task components atthe expense of those that are less safety critical(Hockey, 1997).
It is postulated that a compensatory re-sponse to sleep deprivation was triggered byincreased subjective discomfort and an aware-ness of reduced performance efficacy, whichaccompanied operational fatigue (Table 2).These participants responded by mobilizingmental effort to counteract the influence ofsleep deprivation. This response was demon-strated by the analyses of subjective workloadratings (i.e., increased effort and increased fre-quency of task-relevant thoughts) and the sup-pression of the midfrequency component ofheart rate variability that characterized thePartSD participants. These findings suggest aneffective compensatory strategy on behalf of thePartSD group, with an adequate level of safety-critical performance sustained throughout thetrial. However, the deterioration of lateral con-trol, combined with heightened mental work-load and a moderate suppression of heart ratevariability, indicates ineffective compensationfrom the FullSD participants.
A differential awareness of subjective dis-comfort was one feature that distinguished thesleep-deprived participants from the alcoholgroup. Aside from decreased sobriety, thealcohol group exhibited reduced frustrationcompared with the other treatment groups.There was no evidence for any subjectiveawareness of impairment. In contrast to theirsleep-deprived counterparts, the impairmentof performance exhibited by the alcohol par-ticipants was limited to safety-critical changessuch as more-frequent lane crossings (relativeto control and PartSD participants) and areduction of mean time headway (relative tothe FullSD group). A second feature that dis-tinguished the FullSD and alcohol participantswas an interaction with time on task. The
results revealed that impairment caused bysleep deprivation tended to increase with timeon task; that is, lane crossing frequencypeaked for the FullSD group during the final40 min. By contrast, the impaired lateral con-trol caused by alcohol was stable across thejourney, despite a descending alcohol absorp-tion curve (Figure 1).
The six driving scenarios were included toinduce a variable level of mental workloadthroughout the simulated journey. The pres-ence of a lead vehicle was the crucial featurethat differentiated the level of lateral controlacross all groups. The absence of a lead vehi-cle during open-road and passing scenarioscaused an increased frequency of lane cross-ings. The improvement of lateral control asso-ciated with a lead vehicle may have beenattributable to (a) a perceptual effect (i.e., thepresence of the lead vehicle on the simulatedview functioning as a perceptual cue), (b) aworkload effect (i.e., the lead vehicle function-ing as a potential hazard and demanding ahigher level of attention and control), or (c) a combination of both effects. The analysis ofpsychophysiology provided no evidence of in-creased mental effort when a lead vehicle waspresent. However, steering wheel reversal ratewas elevated for scenarios that included a leadvehicle (e.g., following and high sinusoidalfollowing) compared with the open-road sce-nario. Therefore, the presence of the leadvehicle appeared sufficient to stimulate steer-ing activity, if not to raise mental effort.
CONCLUSIONS
The analyses of experimental data carry anumber of implications for those measure-ment criteria necessary for the development ofdriver impairment monitoring systems. Theresults indicated that range of driving vari-ables should be included in a monitoring sys-tem and that variables should be identifiedeither as early or late indicators of impairment(i.e., non-safety-critical vs. safety-critical indi-cators). In addition, the level of association ordissociation between multiple measures maybe indicative of the compensatory response ofthe driver to impairment, and this pattern maybe used to differentiate between fatigued and
at Liverpool John Moores University on October 28, 2014hfs.sagepub.comDownloaded from
DRIVER IMPAIRMENT 127
intoxicated drivers. These results suggested thata reliance on safety-critical indices of perfor-mance has fostered the misleading view thatmeasures of primary performance are relative-ly insensitive and undiagnostic with respect toimpairment.
The study did not reveal any problems ofselectivity for primary task measures – that is,none of the driving scenarios exerted sufficientinfluence to mask the influence of impairmenton performance. However, this conclusionmust be treated with caution because themanipulation of driving scenario was limitedto the presence of other vehicles on the simu-lated roadway. It is anticipated that more pow-erful environmental manipulations (e.g., roadgeometry, traffic density, and reduced visibili-ty) may reveal selectivity problems of the typedescribed by Desmond and Matthews (1997).
The methodology employed during the studyraises a number of points that can inform futureresearch. First, the declining alcohol absorp-tion curve may not have represented a validcomparison with rising fatigue caused by timeon task. An alternative approach may be tocontrast the influence of ascending alcoholabsorption with sleep deprivation or to intro-duce additional administrations of alcoholthroughout the session to induce a stable levelof BAC. Although the inclusion of a placebocondition is the standard means of testingalcohol and other drugs, this protocol intro-duced a possible source of confounding in thisstudy. Whereas the sleep-deprived participantsknew exactly how much sleep they had lostand, therefore, may have formulated particu-lar expectations regarding their anticipatedlevel of impairment, the alcohol participantsperformed “blind.” All participants in thealcohol group were aware of the presence ofalcohol but were unable to gauge the quantitythey had consumed and, therefore, wereunable to devise expectations regarding antici-pated impairment.
Finally, from an ethical standpoint, the ex-perimental design demanded that testing occurwithin a simulated environment rather than onthe real road. Although we hope that the quali-tative contrast between impairment manipula-tions has ecological validity, it is difficult togeneralize this comparison quantitatively from
a fixed-base simulator to the real road. In prac-tical terms, the methodology satisfied therequirement to assess relative change attribut-able to impairment within a specific testingenvironment. Such specificity is double-edged,however, and generalization of data outsidethis particular environment may be limited. Itis suggested that one step toward answeringthis question would be a replication employinga closed-circuit test track.
ACKNOWLEDGMENTS
This work was funded by the Commissionof the European Communities as part ofresearch conducted on the System for effectiveAssessment of the driver state and Vehicle con-trol in Emergency situations (SAVE) project(TR 1047) under the Transport Telematicsprogram. The authors wish to acknowledge theassistance received from Jayshree Lakha, PeterMarsh, and Dick De Waard.
REFERENCES
Brookhuis, K. A., De Waard, D., & Bekiaris, E. (1997). Develop-ment of a system for the detection of driver impairment. In C. Mercier-Guyon (Ed.), Proceedings of the 14th InternationalConference on Alcohol, Drugs and Traffic Safety (Vol. 2, pp.581–586). Annecy, France: Centre d’Etudes et de RecherchesEn Medecine Du Traffic.
Brookhuis, K. A., De Waard, D., & Mulder, B. (1994). Measuringdriving performance by car-following in traffic. Ergonomics,37, 427–434.
Byers, J. C., Bittner, A. C., & Hill, S. G. (1989). Traditional andraw task load index (TLX) correlations: Are paired compar-isons necessary? In A. Mital (Ed.), Advances in industrialergonomics and safety (Vol. 1, pp. 481–488). London: Taylor& Francis.
Clayton, A. (1997). The end of the decline in drink driving inBritain? In C. Mercier-Guyon (Ed.), Proceedings of the 14thInternational Conference on Alcohol, Drugs and Traffic Safety(Vol. 3, pp. 1227–1231). Annecy, France: Centre d’Etudes etde Recherches En Medecine Du Traffic.
Desmond, P. A., & Matthews, G. (1997). Implications of task-induced fatigue effects for in-vehicle countermeasures to driv-er fatigue. Accident Analysis and Prevention, 29, 515–524.
De Waard, D. (1996). The measurement of driver mental work-load. Groningen, Netherlands: Rijksuniversiteit Groningen.
De Waard, D., & Brookhuis, K. A. (1991). Assessing driver sta-tus: A demonstration experiment on the road. AccidentAnalysis and Prevention, 23, 297–301.
Fairclough, S. H. (1997a). Methods and criteria for the detec-tion of impaired driving (Report D5.1/SAVE TR1047).Athens, Greece: Transport Research and Development Inter-national.
Fairclough, S. H. (1997b). Monitoring driver fatigue via driverperformance. In Y. I. Noy (Ed.), Ergonomics and safety ofintelligent driver interfaces (pp. 363–380). Mahwah, NJ:Erlbaum.
Gonzalez-Gonzalaz, J., Llorens, A. M., Novoa, A. M., &Valeriano, J. J. C. (1992). Effect of acute alcohol ingestion onshort-term heart rate fluctuations. Journal of Studies onAlcohol, 53(1), 86–90.
at Liverpool John Moores University on October 28, 2014hfs.sagepub.comDownloaded from
128 March 1999 – Human Factors
Hart, S. G., & Staveland, L. E. (1988). Development of theNASA-TLX (Task Load Index): Results of empirical and theo-retical research. In P. A. Hancock & N. Meshkati (Eds.),Human mental workload (pp. 139–183). Amsterdam: North-Holland.
Haworth, N. L., & Vulcan, P. (1991). Testing of commerciallyavailable fatigue monitors (Report 15). Victoria, Australia:Monash University, Accident Research Centre.
Hockey, G. R. J. (1997). Compensatory control in the regulation ofhuman performance under stress and high workload: A cogni-tive-energetical framework. Biological Psychology, 45, 73–93.
Kecklund, G., & Akerstedt, T. (1993). Sleepiness in long distancetruck driving: An ambulatory EEG study of night driving.Ergonomics, 36, 1007–1018.
Mackie, R. R., & Wylie, C. D. (1990). Countermeasures to loss ofalertness in truck drivers: Theoretical and practical conse-quences. In M. Vallet (Ed.), Le maintien de la vigilance dansles transport [Maintaining vigilance during transport] (pp.113–141). Bron, France: Paradigme.
Matthews, G., Jones, D. M., & Chamberlain, A. G. (1990).Refining the measurement of mood: The UWIST MoodAdjective checklist. British Journal of Psychology, 81, 17–42.
Maycock, G. (1995). Driver sleepiness as a factor in car and HGVaccidents (Report 169). Crowthorne, UK: Transport ResearchLaboratory.
McLean, J. R., & Hoffman, E. R. (1975). Steering reversals as ameasure of driving performance and steering task difficulty.Human Factors, 17, 248–256.
Mulder, G. (1979). Mental load, mental effort and attention. In N. Moray (Ed.), Mental workload: Its theory and measure-ment (pp. 327–343). New York: Plenum.
Mulder, L. J. M., & Schweizer, D. A. (1993). Carspan: Cardio-vascular experiments analysis environment. Groningen,Netherlands: iec ProGamma.
O’Donnell, R. D., & Eggemeier, F. T. (1986). Workload assess-ment methodology. In K. Boff, L. Kaufman, & J. P. Thomas(Eds.), Handbook of human perception and performance(Vol. 2, pp. 42.41–42.49). New York: Wiley.
Sarason, I. G., Sarason, B. R., Keefe, D. E., Hayes, B. E., &Shearin, E. N. (1986). Cognitive interference: Situational deter-minants and traitlike characteristics. Journal of Personality andSocial Psychology, 57, 691–706.
Tock, D., & Craw, I. (1992, September). Blink rate monitoring for adriver awareness monitoring system. Paper presented at the BritishMachine Vision Conference, University of Leeds, United Kingdom.
Van Winsum, W., Brookhuis, K. A., & De Waard, D. (1998).Approximations of time-to-line crossing (TLC) for real timemeasurement during car driving (Report TM-98-B008).Soesterburg, Netherlands: TNO Human Factors Institute.
Vasey, M. W., & Thayer, J. F. (1987). The continuing problem offalse positives in repeated measures ANOVA in psychophysiol-ogy: A multivariate solution. Psychophysiology, 24, 479–486.
Walls, H. J., & Brownlie, A. R. (1985). Drink, drugs & driving.London: Sweet & Maxwell.
Wierwille, W. W. (1994, May). Overview of research on driverdrowsiness definition and driver drowsiness detection. Paperpresented at the 14th International Conference on EnhancedSafety of Vehicles, Munich, Germany.
Stephen H. Fairclough received a B.Sc.(Hons.) inpsychology from Lancashire Polytechnic in theUnited Kingdom in 1986. He has worked at theHUSAT Research Institute since 1987 and is asenior research fellow at Loughborough Universityin the United Kingdom.Robert Graham received a M.Sc. in work design &ergonomics from the University of Birmingham,England in 1992. He has worked as a human fac-tors researcher and consultant at the HUSATResearch Institute since 1992.
Date received: February 18, 1998Date accepted: August 4, 1998
at Liverpool John Moores University on October 28, 2014hfs.sagepub.comDownloaded from
Related Documents