IMPACTS OF RIDESOURCING – LYFT AND UBER – ON TRANSPORTATION INCLUDING VMT, MODE REPLACEMENT, PARKING, AND TRAVEL BEHAVIOR by ALEJANDRO HENAO B.S., University of Colorado Boulder, 2006 M.S., University of Colorado Denver, 2013 A thesis submitted to the Faculty of the Graduate School of the University of Colorado in partial fulfillment of the requirements for the degree of Doctor of Philosophy Civil Engineering Program 2017

Welcome message from author
This document is posted to help you gain knowledge. Please leave a comment to let me know what you think about it! Share it to your friends and learn new things together.
Transcript

IMPACTS OF RIDESOURCING – LYFT AND UBER – ON TRANSPORTATION
INCLUDING VMT, MODE REPLACEMENT, PARKING, AND TRAVEL BEHAVIOR
by
ALEJANDRO HENAO
B.S., University of Colorado Boulder, 2006
M.S., University of Colorado Denver, 2013
A thesis submitted to the
Faculty of the Graduate School of the
University of Colorado in partial fulfillment
of the requirements for the degree of
Doctor of Philosophy
Civil Engineering Program
2017

ii
This thesis for the Doctor of Philosophy degree by
Alejandro Henao
has been approved for the
Civil Engineering Program
by
Bruce Janson, Chair
Wesley E. Marshall, Advisor
JoAnn Silverstein
Carolyn McAndrews
Debbi Main
Kevin Krizek
Date: May 13, 2017

iii
Henao, Alejandro (Ph.D., Civil Engineering Program)
Impacts of Ridesourcing – Lyft and Uber – on Transportation including VMT, Mode
Replacement, Parking, and Travel Behavior
Thesis directed by Associate Professor Wesley E. Marshall.
ABSTRACT
The transportation sector is currently experiencing a disruption with the introduction
and evolution of technology and transportation services such as bikesharing, carsharing, on-
demand ridesourcing (e.g. Lyft, Uber), and microtransit (e.g. Bridj, Chariot). As these new
layers of technology-based transportation options begin to flourish, it is important to
understand how they affect our transportation systems and society. This doctoral dissertation
analyzes the impacts of ridesourcing on several areas of transportation including: efficiency
in terms of distance – Vehicles Miles Traveled (VMT) versus Passenger Miles Traveled
(PMT) – and travel times, mode replacement, VMT increase, parking, transportation equity,
and travel behavior. Realizing the difficulty in obtaining data directly from Lyft and Uber,
this research employs an innovative approach by the author becoming an independent
contractor to drive for both companies; this allowed the author to gain access to exclusive
data and real-time passenger feedback. The datasets include actual travel attributes – such as
times, distances, and earnings – from 416 rides (Lyft, UberX, LyftLine, and UberPool), and
travel behavior and socio-demographics from 311 passenger interviews. This dissertation
estimates a low ridesourcing efficiency rate compared to other modes, mix of modes
replacement, overall increase in VMT, decrease in parking demand, low wages (i.e. net
earnings) for drivers, travel behavior changes for users, as well as relationships between

iv
modality style, trip purpose, and stated reasons for mode replacement. These results give us
insights into the impacts of ridesourcing on several key aspects of transportation. This, in
turn, will help cities and transportation organizations better account for ridesourcing in their
planning and engineering processes (e.g. travel demand models) as well as policy decisions.
The form and content of this abstract are approved. I recommend its publication.
Approved: Wesley E. Marshall

v
DEDICATION
I dedicate this work to my wife Gusty. She has been a constant supporter, contributor,
and has carried a lot of weight in our lives. Without her, this project would not have been
possible.
To my boys, Tomás and Andrés, who are my everyday inspiration.
To my parents, who instilled in me the unmeasurable value of education and have
supported me unconditionally in all aspects of my life.

vi
ACKNOWLEDGMENTS
I would like to thank Dr. Wesley Marshall for mentoring me and providing extensive
support and advice by sharing his time, knowledge, and funding for this doctoral dissertation.
I thank Dr. Bruce Janson, Dr. Joann Silverstein, Dr. Carey McAndrews, Dr. Debbi Main, and
Dr. Kevin Krizek for contributing to my education, for providing feedback and mentorship,
and for serving on my Thesis Committee.
I would like to thank all members of the Active Communities Transportation (ACT)
Research Group and the Integrative Graduate Education and Research Traineeship (IGERT)
Program for their contributions to my research work.
I also thank the transportation organizations (e.g. the Institute of Transportation
Engineers CO/WY Section) and local professionals for their advice and financial support; as
well as the Mountain-Plains Consortium, the Eisenhower Fellowship Program, and the
National Science Foundation – through their IGERT Award and the Bridge to the Doctorate
Program – for providing funding for this work.
Finally, I am grateful to all the Lyft and Uber passengers. Without their patience,
time, and willingness to share, this project would not have been feasible.

vii
TABLE OF CONTENTS
CHAPTER
I. INTRODUCTION ........................................................................................................... 1
Specific Aims ........................................................................................................... 4
Study Organization................................................................................................... 5
II. BACKGROUND ............................................................................................................. 6
III. LITERATURE REVIEW .............................................................................................. 10
IV. RESEARCH METHODS .............................................................................................. 19
Driving for Lyft/Uber and Driver Dataset ............................................................. 20
Driving Strategy and Passenger Survey ................................................................. 23
Study Area .............................................................................................................. 25
V. DATA ............................................................................................................................ 27
Driver Dataset ........................................................................................................ 27
Passenger Dataset ................................................................................................... 28
VI. DRIVER PERSPECTIVE: TRAVEL TIMES, DISTANCES, AND EARNINGS ...... 31
Chapter Related Literature ..................................................................................... 32
Chapter Data and Analysis ..................................................................................... 34
Travel Distances and Times ............................................................................ 36
Ridesourcing Efficiency Rate ......................................................................... 37
Ridesourcing Earnings .................................................................................... 38
Chapter Results ...................................................................................................... 39
Ridesourcing Efficiency Rate ......................................................................... 41
Ridesourcing Earnings .................................................................................... 42
Chapter Conclusions .............................................................................................. 48
VII. VMT IMPACTS ............................................................................................................ 53
viii
Chapter Related Literature ..................................................................................... 56
Chapter Data and Analysis ..................................................................................... 57
Chapter Results ...................................................................................................... 62
PMT/VMT Efficiency ..................................................................................... 62
VMT/PMT Ratio ............................................................................................. 63
VMT before and after ..................................................................................... 63
Chapter Conclusions .............................................................................................. 66
VIII. PARKING IMPACTS ................................................................................................... 68
Chapter Data and Analysis ..................................................................................... 69
Chapter Results ...................................................................................................... 69
Parking Demand.............................................................................................. 69
Locations, Trip Purpose, and Connectivity to Transit Stations ...................... 72
Parking as a stated reason to choose Ridesourcing ......................................... 75
Chapter Conclusions .............................................................................................. 78
IX. TRAVEL BEHAVIOR CHANGES .............................................................................. 80
Chapter Literature Review ..................................................................................... 81
Chapter Data and Analysis ..................................................................................... 83
Chapter Results ...................................................................................................... 87
Mode Frequency and Travel Behavior Changes ............................................. 87
Relationships between Drive Frequency and Other Variables ....................... 90
Modality Styles ............................................................................................... 92
Chapter Conclusions .............................................................................................. 94
X. OVERALL RESULTS .................................................................................................. 96
Driver Dataset ........................................................................................................ 96
Ridesourcing Times and Distances ................................................................. 96

ix
Ridesourcing Earnings .................................................................................... 96
VMT ....................................................................................................................... 97
Parking ................................................................................................................... 97
Travel Behavior ...................................................................................................... 97
XI. SUMMARY CONCLUSIONS AND FUTURE WORK .............................................. 99
REFERENCES ..................................................................................................................... 103

x
LIST OF TABLES
Table V-I. Origin - Destination (O-D) Matrix ........................................................................ 28
Table V-II. Demographics of Ridesourcing Passengers ......................................................... 30
Table VI-I. Travel Times and Distances Summary Statistics ................................................. 40
Table VI-II. Time and Distance Efficiency ............................................................................ 41
Table VI-III. Lyft/Uber Fares and Driver Commission .......................................................... 42
Table VI-IV. Passenger Cost, Driver Earnings, and Actual Commission .............................. 43
Table VI-V. Gross Earnings ................................................................................................... 44
Table VI-VI. Gross Earnings – Lyft compared to Uber ......................................................... 44
Table VI-VII. Ridesourcing Expenses .................................................................................... 46
Table VI-VIII. Net Earnings (Gross Earnings minus Expenses) ............................................ 47
Table VI-IX. Net Earnings – Lyft compared to Uber ............................................................. 48
Table VII-I. PMT, VMT Replaced, and Ridesourcing VMT ................................................. 62
Table VII-II. PMT/VMT, before and after ............................................................................. 64
Table VII-III. VMT by Mode Replacement, before and after ................................................ 65
Table VII-IV. Extra VMT per year in the U.S. due to Lyft/Uber ........................................... 67
Table VIII-I. O-D Matrix (Driving Trips Replaced) .............................................................. 73
Table VIII-II. Connectivity to Transit Stations....................................................................... 75
Table IX-I. Bi-modality Style Classification .......................................................................... 94
xi
LIST OF FIGURES
Figure II.I. Lyft and Uber Timeline .......................................................................................... 7
Figure II.II. LyftLine serving cities .......................................................................................... 7
Figure IV.I. Lyft and Uber Driver Profiles ............................................................................. 21
Figure IV.II. Smartphone Apps .............................................................................................. 21
Figure IV.III. Driver Data Collection Form............................................................................ 22
Figure IV.IV. Car Sign for Passenger Survey......................................................................... 24
Figure V.I. Ridesourcing Data ................................................................................................ 27
Figure VI.I. Travel Distances and Times of a Lyft/Uber Driver ............................................ 35
Figure VI.II. GPS Tracking of a Lyft/Uber Ride .................................................................... 36
Figure VII.I. Taxis in Cali, Colombia (Source: ElPais.com.co) ............................................. 54
Figure VII.II. Taxi Tracks in Cali, Colombia (Source: ElPais.com.co) ................................. 55
Figure VII.III. Mode Replacement (Q5) ................................................................................. 59
Figure VIII.I. Ridesourcing Replacing Driving Trips (Parking) ............................................ 71
Figure VIII.II. Travel Behavior Change (Driving today compared to the past) ..................... 72
Figure VIII.III. Ridesourcing Trip Purpose (All respondents and those “Driving less”) ....... 74
Figure VIII.IV. Main reason for choosing Lyft/Uber for Actual Ride ................................... 76
Figure VIII.V. Driving Frequency and Trip Purpose ............................................................. 77
Figure IX.I. Travel Demand Framework to Study Ridesourcing ........................................... 83
Figure IX.II. Mode Frequency ................................................................................................ 88
Figure IX.III. Travel Behavior Changes, Driving & Public Transportation ........................... 89
Figure IX.IV. Driving Frequency and Trip Purpose ............................................................... 90
Figure IX.V. Driving Frequency and Stated Reasons............................................................. 91
Figure IX.VI. Modality Style Classification ........................................................................... 93

xii
LIST OF ABBREVIATIONS
DTT Drive to Transit
ETA Estimated Time of Arrival
HOV High Occupancy Vehicles
Hr Hour
IRB Institutional Review Board
MAX. Maximum
MIN. Minimum
MINS Minutes
MPH Miles per Hour
O-D Origin-Destination
PMT Passenger Miles Traveled
Q# Question Number
SOV Single Occupancy Vehicle
St. Dev. Standard Deviation
TDM Transportation Demand Management
TNC Transportation Network Company
U.S. United States of America
VMT Vehicle Miles Traveled
WP With-Passenger
WPMT With-Passenger Miles Traveled
WTT Walk to Transit

1
INTRODUCTION
Evolving transportation services such as bikesharing, carsharing, ridesharing, on-
demand ridesourcing (e.g. Lyft, Uber), and microtransit (e.g. Bridj) are becoming
increasingly popular all over the world. Many factors – including social networks, real-time
information, and mobile technology – allow passengers and drivers to connect through
mobile smartphone applications (i.e. apps). In turn, this has led to the creation and
popularization of technology companies offering app-based on-demand transportation
platforms. As these new layers of technology-based transportation options begin to flourish,
it is important to understand how they compete and interact with more traditional modes.
Beyond travel behavior, these tools and evolving transportation services can also
significantly impact our transportation systems, society, and the environment; yet, very little
data is known and the academic research is minimum to understand and measure the impacts
of these services regarding outcomes such as vehicle miles traveled (VMT), mode
replacement, parking, equity, and travel behavior.
Providing a more diverse array of travel options should theoretically reduce car
dependence and lower parking demand; however, there remain unresolved questions about
what cities actually gain (or lose) in terms of sustainability-related outcomes including
efficiency, congestion, carbon emissions, and transportation equity issues. Even when
replacing single occupancy vehicle (SOV) trips, there are negative effects. For example with
VMT, there are additional miles traveled by the ridesourcing driver – before passenger pick-
up or after passenger drop-off – over and above the actual trip the passenger would have
driven in the first place (Cramer & Krueger, 2016; Henao & Marshall, in press). There is also

2
a theoretical saturation point where higher ridesourcing supply than demand leaves many
drivers circulating without riders, which can cause unnecessary VMT, congestion,
environmental issues, and other problems that are not yet documented with these new
technology-based modal options.
While there is widespread information online regarding companies such as Uber and
Lyft, the academic literature on ridesourcing is extremely limited due to the lack of open data
on these services. Obtaining data for independent academic research from Lyft and Uber is
extremely difficult (Bialick, 2015a; Levitt, 2016) and even when these companies agree to
share data, the data is often not adequate for research purposes (Vaccaro, 2016). These
private companies cite customers’ privacy protection and business competitiveness for their
lack of data sharing, but perhaps they do to avoid showing the potential negative impacts in
our transportation system. City officials and transit advocates have expressed concerns about
the lack of open data and potential problems with ridesourcing such as congestion,
competition with public transportation, and equity issues (Flegenheimer & Fitzsimmons,
2015; Grabar, 2016; Rodriguez, 2016)
Without appropriate data, measuring impacts is not possible; and even when such
data is available, investigating short-term and long-term impacts of ridesourcing on travel
behavior – such as the travel modes replaced by ridesourcing and why people shifted from a
previous mode – remains extremely difficult. There are still limitations with regard to
measuring new trips that may not have occurred before (i.e. induced travel), modality
resources (e.g. car ownership), and modality style (e.g. car-oriented) of users as well as
multimodality (i.e. availability of several modes) and intermodality (i.e. combination of
various modes for a single trip or mixed-modes). This combination of problems makes

3
analyzing the impact of these services on the overall transportation system exceedingly
difficult.
Due to the complexity of this topic, this dissertation first proposes a comprehensive
framework aimed at starting the conversation on the type of data that needs to be collected,
the questions that researchers need to be asking, and pointing out issues that might arise with
conventional research methods. For example, if we ask someone that does not own a car
what they would have done without Lyft/Uber for a specific trip, they might answer transit.
In theory, the ridesourcing trip is classified as a negative environmental impact. However, a
more comprehensive research framework might reveal that the decision not to own a car in
the first place was made in part due to the availability of Lyft/Uber. Considering such long-
term car ownership decisions would now expose the ridesourcing trip as a positive
environmental benefit.
Beyond looking at the travel modes replaced by ridesourcing, the framework also
includes insights from individuals on the process of why a specific mode was selected over
the alternatives. For example, what is the role of travel time, travel cost, parking, and other
factors in the decision making process? Such insight would help provide researchers with the
ability to investigate the impact of ridesourcing on a region or city in terms of VMT and
parking demand. It may also facilitate studies across different geographical areas (e.g. urban
vs. suburban, city size, density, etc.) where we could find differing impacts in different
contexts. In other words, could ridesourcing have, for example, positive impacts in more
suburban areas and negative impacts in more urban areas? Or could the contrary be true? The
intent is to provide a framework that will allow such questions to be explored, and then to
carry out the research.

4
The overall goal of this dissertation is to start filling the gap in the academic literature
and help researchers study the effects of evolving services such as ridesourcing and start
measuring these impacts on transportation. This, in turn, will help cities and transportation
organizations better account for the impacts of evolving transportation services in their
policies, transportation planning, and engineering processes.
Specific Aims
The specific aims and key contributions of this research are that I will build upon the
existing literature on evolving transportation services by:
1. Developing a comprehensive research framework to study ridesourcing
2. Collecting unique and interrelated datasets of ridesourcing drivers and passengers
3. Developing a ridesourcing survey for passengers seeking Institutional Review
Board (IRB) approval
4. Measuring travel distances, times, earnings, and its efficiencies from the driver
perspective
5. Measuring the VMT and parking demand impacts of ridesourcing services
6. Investigating travel behavior changes by assessing what travel modes are replaced
by these evolving transportation services; and evaluating the factors associated
with why people shifted from their previous travel modes and for what trip
purposes.
7. Developing a framework for a mode choice model that would allow for
integrating ridesourcing services into regional travel models.
5
Study Organization
This dissertation is organized into eleven chapters. Chapter II provides a background
for ridesourcing including a history and overview of Lyft and Uber. Chapter III (Literature
Review) overviews the topic of evolving transportation services and covers the limited
research in this area. In order to better understand how to do research on ridesourcing
services, the first step is to develop a comprehensive research framework. Thus, Chapter IV
is devoted to this, and includes research methods, city choice, and data collected for its
application in this dissertation. Chapter V presents the data. The first three objectives are
addressed in Chapter IV and V. Objective four is addressed in Chapter VI (Driver
Perspective: Travel Times, Distances, and Earnings), the fifth objective in Chapters VII
(VMT Impacts) and VIII (Parking Impacts), and the sixth in Chapter IX (Travel Behavior
Changes). Chapter IX is a summary of results and Chapter X1 finalizes this dissertation with
overall conclusions, recommendations, and future research. Assisting the reader and for
better organization, each of the four paper chapters (Chapters VI through IX) includes its
own detail section on literature review, specific data and analysis, chapter results, and chapter
conclusions for each detail topic.
6
BACKGROUND
While Lyft and Uber in their current form are mostly known for their regular Lyft and
UberX services, and carpool options: LyftLine and UberPool, they offer other options and
have evolved from a variety of services in their history (Figure II.I). For example, Uber
started as a black-car limousine service called UberCab, launched in San Francisco in 2010
(McAlone, 2015), while Lyft co-founders Logan Green and John Zimmer previously co-
founded Zimride, a true rideshare platform created to connect drivers and passengers through
social networking. Green and Zimmer started Zimride in 2007 and sold it to Enterprise
Holding in July 2013 (Lawler, 2014). While Lyft was launched in June 2012 with its original
regular Lyft service, Uber did not unveil its regular UberX service until July 2012, a couple
of years after it started with UberCab. LyftLine and UberPool services started in 2014 but are
only available in certain metropolitan cities (Lyft Blog, 2016; Uber Newsroom, 2014, 2016).
For example, Figure II.II shows the cities where LyftLine was in service or about to launch
as of April 2016 (including Denver).
As of the summer 2016, Uber was already in 450 cities globally, and completed two
billion trips in its life span. One billion rides were completed in six years, while the same
number of rides were completed in six months (Somerville, 2016). Uber’s estimated
valuation continues to grow and currently is at $62.6 billion, making it the most valuable
transportation company in the world; and currently, without owning any vehicle,
infrastructure, or having to hire drivers as employees. Lyft operates exclusively in the U.S.
and is valued at approximately $5.5. billion dollars (B. Salomon, 2016).

7
Figure II.I. Lyft and Uber Timeline
Figure II.II. LyftLine serving cities
(Source: Lyft Blog, “Five Days. Six Cities. A Lyft Line First”, April 5, 2016)
8
One of the latest news releases shows that Lyft is giving rides at a rate of 17 million
U.S. rides per month. It is estimated that Lyft has around 20% of the market share, making
Uber the ridesourcing company with the highest volume in the U.S. These numbers show the
magnitude of Lyft and Uber and their influence on the way people get around. Uber and Lyft
path has not been worry free. They have to constantly deal with different situations such as
regulations, protests, and lawsuits from taxi companies, city officials, and drivers claiming
employment rights. They also have taken advantages of the terminology in their marketing
strategies.
The terminology of new and evolving transportation services can be confusing and
sometimes ill defined by the transportation sector. Intentionally or unintentionally, many
accredited people and companies use the terminology incorrectly, which can mislead public
perception and general use of the services. A recent example is the misused word
‘ridesharing’ when referring to ridesourcing companies in their original form (Goddin, 2014).
The Associated Press Stylebook in January 2015 presented an update on the topic: “Ride-
hailing services such as Uber or Lyft let people use smartphone apps to book and pay for a
private car service or in some cases, a taxi. They may also be called ride-booking services.
Do not use ride-sharing” (Warzel, 2015). While there seems to be a consensus that these
services are not ridesharing, there is still no clearly a defined term. Some of the names
include: “Transportation Network Companies (TNCs)”, “ride-hailing”, “ride-booking”, “ride-
matching”, “on-demand-rides”, “app-based rides”. In an attempt to be consistent with
previous academic research (Rayle, Dai, Chan, Cervero, & Shaheen, 2016) and to allow for
possible future variations of such schemes to be housed under the same header, this study

9
uses the term “ridesourcing”. The definition of ridesourcing is the sourcing of rides from a
for-fare driver pool accessible through an app-based platform.

10
LITERATURE REVIEW
Lyft and Uber are disrupting urban transportation systems and competing with more
traditional modes (i.e. car, taxi, transit, walk, and bike), but a minimal number of U.S. cities
has been able to account the impacts of ridesourcing (DuPuis, Martin, & Rainwater, 2015).
The introduction of these services has implications for travel behavior and mode shift, as
well as impacts on the overall transportation system.
Other services such as bikesharing and carsharing are continuously evolving and
increasing users in cities across the globe (S. Shaheen & Cohen, 2012; S. Shaheen, Guzman,
& Zhang, 2010). In addition, while the academic literature on carsharing and bikesharing
systems has provided insights about these systems’ user characteristics (e.g. socio-economic
demographics, preferences, etc.) and transportation impacts (e.g. car ownership, car use,
VMT, reductions of cars on the network, and mode share), the literature on ridesourcing
remains very limited.
While there is abundant information online regarding companies such as Lyft and
Uber, the academic literature on ridesourcing is very limited, in part due to their novelty and
lack of open data on these services. Due to the ridesourcing history, evolution, and similarity
to other services, the few academic studies on this topic compared ridesourcing mostly to the
taxi industry and ridesharing services (Anderson, 2014; Cramer & Krueger, 2016; Rayle et
al., 2016).
Rayle et al. (2016) did a research study comparing ridesourcing and traditional taxis
in San Francisco using an intercept survey in spring 2014. The findings from this study
indicated that compared to the overall San Francisco population, ridesourcing users tend to
11
be a lot younger, have higher incomes, have lower car ownership, and frequently travel with
companions. This study also shows that compared to taxis, ridesourcing customers
experienced shorter waiting times. Participants in this study said that ridesourcing both
substitute and complement public transit, walking, and biking; and 8% of survey respondents
stated that they would not have traveled (i.e. induced travel effect) if ridesourcing services
were not available.
More recently, the Shared-Use Mobility Center investigated the relationship between
public transportation and shared modes, including bikesharing, carsharing, and ridesourcing
in seven U.S. cities. This report found that the higher the use of shared modes, the more
likely people use public transportation, own fewer cars, and spent less on transportation. It
also shows that shared modes complement public transportation (Murphy, 2016).
Regarding literature not currently published in academia, the website FiveThirtyEight
has published a few articles regarding ridesourcing companies using data acquired via a
Freedom of Information Act request. The articles show that in New York, Uber is taking
rides away from taxis and generally covers a larger area (Bialik, Flowers, Fischer-Baum, &
Mehta, 2015; Fischer-Baum & Bialik, 2015). In another article, FiveThirtyEight argues that
for Uber to be worth its $50 billion valuation, it has to complement and attract customers that
normally use public transportation. This last article also used data on median income levels
by census tract and residential pick up rates showing that lower incomes experienced fewer
pickups (Silver & Fischer-Baum, 2015). The article compared general travel cost (using basic
assumptions) of public transit, Uber, and the cost to own a car; arguing that Uber in
combination with high use (around 65% to 85%) of public transportation can be significantly
12
cheaper than car ownership. Overall, the articles suggested that Uber is affecting mode
choice, intermodality, and travel costs (that could in turn affect mode choice).
Since the literature in ridesourcing is extremely limited, is important to review the
literature on a similar service that has evolved over the last few years and contains more in-
depth studies. This is useful in helping understand ridesourcing and for helping design this
newer strand of transportation research.
Carsharing systems provide a fleet of shared vehicles for short-term use where
members pay in time increments of minutes or hours. Currently, there are several carsharing
models including the following variations: round-trip or one-way (i.e. point-to-point),
station-based or free-floating, and peer-to-peer.
Round-trip station-based carsharing is the oldest and most established system, where
users need to return the vehicle at the same fixed station it was checked out. Round-trip
carsharing started in Europe as early as the 1940s, but more successful programs did not
began operating until the mid-1990s (S. Shaheen & Cohen, 2007). While most carsharing
research is based on the traditional station-based round-trip carsharing system, the last few
years have seen a surge in one-way carsharing research. The first services without any fixed
vehicle stations – Car2go by Daimler and DriveNow by BMW – started in 2009 and 2011,
respectively (Firnkorn, 2012). As of October of 2014, approximately 4.8 million individuals
are members of carsharing programs worldwide with a total fleet of 104,000 vehicles
(Shaheen and Cohen, 2014).
There have been a number of studies aiming to evaluate carsharing impacts, but the
results are not clear with respect to the effects resulting from changes in the launch of a
carsharing system. This is probably due to difficulties with respect to data availability,

13
timelines, confounding effects, as well as research design and methodologies (Firnkorn,
2012; Graham-Rowe, Skippon, Gardner, & Abraham, 2011; J Kopp, Gerike, & Axhausen,
2013; Johanna Kopp, Gerike, & Axhausen, 2015; Le Vine, Adamou, & Polak, 2014; Stopher
& Greaves, 2007). Numerous carsharing studies focus on determining impacts on
transportation, land use, environmental, and social benefits with some mixed results in
certain areas and clear evidence on others. As regards to this dissertation, carsharing research
on travel behavior can be classified and quantified in the following areas:
Socio-demographics for carsharing users and non-users: Studies suggest that
carsharing users do not usually represent the overall population with regard to socio-
economics, demographics, and travel behavior characteristics. Carsharing users tend to be
younger, with higher levels of education and income, and live in denser areas with better
access to public transportation. Carsharing users also tend to have higher public transit,
walking, and biking mode shares and lower car usage compared to the general population
(Cervero & Tsai, 2004; J Kopp et al., 2013; Johanna Kopp et al., 2015; Martin, Shaheen, &
Lidicker, 2010; Sioui, Morency, & Trépanier, 2012).
Car ownership: Studies revealed that car ownership for carsharing members is lower
than the general population and non-members. Empirical evidence has also shown a
reduction in private vehicle ownership after joining a carsharing program by getting rid of a
vehicle owned or foregoing vehicle purchase (Cervero & Tsai, 2004; Meijkamp, 1998; S. A.
Shaheen, Cohen, & Chung, 2009; Steininger, Vogl, & Zettl, 1996). For example, a study on
City Carshare in San Francisco indicated that a higher share of members reduced car
ownership as compared to a control group of non-members, approximately 29% versus 8%.
Two-thirds of members also said they refrain from purchasing a vehicle as compared to 39%

14
of non-members (Cervero & Tsai, 2004). Another study based on a survey in 2010 of
members of Communauto, a Montreal carsharing company, concluded that members of the
carsharing service have approximately 30% lower car usage compared to the level of those
that own a vehicle (Sioui et al., 2012). Another study showed that the average number of
vehicles per household dropped from 0.47 to 0.24 (Martin et al., 2010).
Car use and vehicle miles traveled (VMT): A large study across North America on
round-trip car share subscribers revealed that while most members drive more with
carsharing, the minority that drive less are driving less by a higher order of magnitude, which
leads to less driving overall. In this study, VMT declined by 27%, and when including those
that decided not purchase a vehicle in the first place, it was a 43% reduction (Martin et al.,
2010; S. A. Shaheen et al., 2009). The first year of City Carshare operation in San Francisco
suggested an increase in motorized travel for members (Cervero, 2003); however, in the
second year of operation, the daily VMT reduced slightly for members and increased for
non-members (Cervero & Tsai, 2004).
Reduction of cars on the transportation network: Based on several carsharing reports
in the U.S., carsharing helps remove an aggregate of 9 to 23 vehicles from the road
(including both shed autos and foregone car purchases) per shared-use vehicle from the
transportation network (Lane, 2005; S. A. Shaheen et al., 2009). For example, Cervero and
Tsai (2004) estimated that a carsharing fleet of 74 in San Francisco removed approximately
500 vehicles from the streets, equivalent to 6.8 private vehicle per carsharing vehicle.
Similarly, a study from Philadelphia found that each PhillyCarShare vehicle replaced an
average of 23 private vehicles, 11 vehicles from members giving up a car and 12 vehicles
from not acquiring one in the first place (Lane, 2005).

15
Mode share: Studies on station-based carsharing suggest that some of its members
change travel behavior towards public transportation and non-motorized modes, while others
do the opposite by reducing transit, walking and biking usage; overall, however, most people
tend to increase public transit and non-motorized modal use (E. Martin & S. Shaheen, 2011).
A study of Ulm, Germany using two different methods reported that after the introduction of
a point-to-point carsharing service, members shift modes and reduce the usage of all other
modes of transportation including private cars, public transportation, and non-motorized
travel (Firnkorn, 2012). Carsharing research on both round-trip and point-to-point carsharing
concluded that point-to-point is a substitute for public transport while round-trip carsharing is
a complement (Le Vine, Lee-Gosselin, Sivakumar, & Polak, 2014).
Many of the studies on carsharing research rely on sample surveys to gather
information on members demographics, current usage of the carsharing service, and prior-to-
joining carsharing travel behavior information (Lane, 2005; E. Martin & S. Shaheen, 2011;
Martin et al., 2010; E. W. Martin & S. A. Shaheen, 2011). While these studies provide a
basic idea on socio-economic demographics and travel behavior patterns at the aggregate
level, they are inconclusive on the effects of carsharing because they fail to control for
several factors that could affect the results (such as predisposition characteristics of people
joining a carsharing system) or by not comparing the study population with a control group.
From all the carsharing studies, only a few include a statistical control group in their
methodology. Control groups, either on longitudinal or cross-sectional research, allow to
correct for some confounding effects that otherwise would be difficult to distinguish from
effect results. The best example of the use of control groups is the study over time by
Cervero, Golub, and Nee (2007) on City Carshare in San Francisco. After two years of

16
service, VMT for carsharing members decreased, but it decreased even further for non-
members; so relative to the control group, VMT for members increased. Another example is
the research study by Johanna Kopp et al. (2015), where they used a reference group of non-
carsharing users using an online and app based travel dairy, MyMobility, to collect individual
trips over a 7-day period. This was a relatively well-designed study (with respect to survey
instruments, methodology, and clearly stated limitations) of a free-floating carsharing
service. The study also implemented a multimodal index by analyzing the distribution of
transportation modes of carsharing for users and non-users, and stating future research needs
to disentangle the effects of joining a carsharing service on mobility behavior, which this
dissertation aims to find.
Although studies that use control groups are considered to have a better statistical
methodological research design, there are still some problems to overcome such as
confounding biases resulting from carsharing members’ self-selection and arbitrary choice of
non-member sampling that could potentially misrepresent the population. Concerning this
dissertation, using latent classes will help understand the modality style of individuals using
carsharing in relation to the same classes from the general population. Per the literature
review, carsharing members tend to have a more sustainable modality style as compared to
the general population, including higher use of non-motorized transportation and lower
frequency of private car use. In this case, the fair comparison would be to calculate the
difference against non-members that have a multimodal travel behavior.
Another way to compare, track, and measure the impacts of carsharing is using the
research design implemented by Firnkorn (2012) using Car2go data. Firnkorn used the
following two approaches to triangulate toward the impact of carsharing on travel behavior:

17
i) hypothetical travel behavior at present without Car2go; and ii) past mobility travel
behavior on top of current behavior with Car2go. Details on the survey methods and
methodology from this study are applicable to this dissertation. However, the author states
that the two measurement techniques should theoretically have produced the exact same
results if they were completely independent. In reality, a person’s behavior pre-carsharing
could easily be different to what that person would do today without carsharing.
The results from the few ridesourcing studies were similar to carsharing studies
suggesting that carsharing users do not usually represent the overall population with regard to
socio-economics, demographics, and travel behavior characteristics and users tend to be
younger, with higher levels of education and income, and live in denser areas with better
access to public transportation. Members also have different mobility resources with fewer
cars per households, higher levels of bike ownership and public transportation passes, as well
as higher transit, walking, and biking mode shares compared to the general population.
The current carsharing, and ridesourcing literature offers a general idea of the socio-
economic demographics and insights into travel behavior impacts at the aggregate level, but
there is no clear understanding at the individual level on the actual motivations why a user
chooses a mode over the alternatives. For example from the previous studies, there is no
investigation on the role of travel time, travel cost, or convenience (e.g. parking) on the
utility and mode choice of travel demand models. There is also no implementation of
modality style on the effects of carsharing on travel behavior. The changes cannot clearly be
attributed to carsharing or ridesourcing without knowing the members behavior prior to
joining a new service (e.g. car-oriented or multimodal) and controlling for the factors that
influence travel behavior over time such as individual and household characteristics, location

18
choice, or transportation resources. This dissertation aims to address these problems by
implementing a methodology that focuses on a more comprehensive examination of
ridesourcing effects on individual travel behavior and overall impacts on the transportation
system.
As seen in this overall literature review section, independent research on ridesourcing
remains very limited. Each chapter covering specific topics (Chapter VI through Chapter IX)
includes a more detail review and related literature to each theme.
19
RESEARCH METHODS
The first step in understanding the impacts of ridesourcing is to develop a framework
to guide the research and fill the important gaps in the literature. With Dr. Wesley Marshall,
we co-authored the book chapter – “A Framework for Understanding the Impacts of
Transportation” – recently published in the book “Disrupting Mobility: Impacts of Sharing
Economy and Innovative Transportation on Cities” (Henao & Marshall, 2017). This study
lays-out the research framework needed to investigate ridesourcing impacts in transportation,
emphasizing the need to employ a combination of travel attributes (e.g. travel times),
revealed-behavior data, and stated-response data structures.
Many transportation planners and engineers dream of having ridesourcing data to
analyze and make transportation decisions. While it would be nice to have access to this data,
we still have not seen any examples of data sharing from these companies for independent
academic research. Realizing the difficulty obtaining data directly from Lyft and Uber, I
decided to become an independent contractor and drive for both companies; this allowed me
to gain access to exclusive data and real-time passenger feedback.
I signed-up to drive for both companies in early 2015, initially doing exploratory
analysis to determine how viable this methodology would be for collecting data. After the
initial test rides, I decided to continue in this direction by developing the research framework
and the passenger survey. I then sought IRB approval and applied for research funding.
There are two interconnected datasets on the data collection: “driver dataset” and
“passenger dataset”. The first is the exclusive data that Lyft/Uber drivers can obtain by
giving rides to passengers. This “driver dataset” contains information about travel attributes

20
from actual trips including date, time of the day, origin and destination (O-D) locations,
travel times, travel distances, passenger cost, and driver earnings. The second dataset is the
information gathered by surveying passengers during the actual rides (i.e. “passenger
dataset”). Since I would be surveying passengers, I needed to obtain IRB approval to conduct
this research. In the spring of 2016, I submitted a research proposal to the Colorado Multiple
Institutional Review Board (COMIRB), obtaining IRB approval to interview passengers
(COMIRB Protocol 16-0773, Exception APP001-3).
Driving for Lyft/Uber and Driver Dataset
I conducted my data collection using a sedan vehicle – 2015 Honda Civic – and a
smartphone – iPhone 5s – to drive as an independent-contract for both Lyft and Uber (Figure
IV.I). The main apps in the smartphone used for this research were “Lyft”, “Uber-driver
Partner”, “GoogleMaps”, and “My Tracks” (Figure IV.II). GoogleMaps and MyTracks
helped me to track and record ridesourcing travel data. Passengers completed the online
survey using their own smartphone or via a tablet device, Samsung Galaxy Tab A, that I
provided.

21
Figure IV.I. Lyft and Uber Driver Profiles
Figure IV.II. Smartphone Apps
I used the data collection form presented in Figure IV.III to help guide the travel
attributes data collection process for the “driver dataset”. The ridesourcing driver data
includes information for each ride such as date and time of the day, weather, pick-up and
drop-off locations, driver earnings, and times and distances broken down by
“waiting/cruising for a ride”, “en-route to passenger”, “waiting for passenger”, and “actual
ride”. When I was done with driving for the day, I then recorded the “end of shift” travel time

22
and distance, as shown in Figure IV.III. Additionally, I collected information about parking;
including “cruising to park” time and cost to determine parking difficulty at destination.
Chapter VI includes a more detail description of each segment for the driving travel times
and distances.
For the origin and destination locations, I collected the closest cross-streets, rather
than the address, to maintain confidentiality. As mentioned previously, I used “Google
Maps” and “myTracks” GPS apps to track times, distances, and locations, which allowed me
to double-check the data recorded.
Figure IV.III. Driver Data Collection Form
23
Driving Strategy and Passenger Survey
On a typical driving day, I turned on both Lyft and Uber apps and waited until a
passenger requested a ride. To be conservative, I generally minimized unnecessary driving;
thus, I accepted most of the requests unless there were problems with the app or the pick-up
location was more than 15 miles away from the driver location (again, this is to minimize
driving without a passenger). Once the ride was accepted, I turned off the driving mode for
the other service. For example, if it was a Lyft request, the Uber driver mode was turned-off;
or vice versa. Then, I traveled to the pick-up passenger location and waited until the
passenger got into the car to travel to the desired destination.
I, as a driver, invited passengers to participate in a short survey about ridesourcing
both verbally and with signs in the car (Figure IV.IV). The car sign reads: “Hi rider, I am a
grad student doing research on transportation. Would you help me by doing a short survey
(~6 minutes) about this ride? You can use my tablet or go to this link www.ride-survey.com.
Thank you!” As the sign indicates, passengers had the option to take the survey on a tablet
provided by me, the driver, or use their own device by going to a pre-defined website. In
some cases, I conducted a verbal interview with the passenger that covered all the questions
included in the survey. I waited until the ride was over to take notes and record the interview.
Once the ride ended at the destination location, I turned on the other app and waited for a
new passenger request. Once the passenger got out of the car, I tried to find the closest
parking space available with the intent to record parking data, and again, to minimize
cruising distance without a passenger in the car. Driving for both Lyft and Uber helped
minimize the waiting times and cruising distance. For example, there were occasions where
new requests came in even before I finished parking. I did all of the data collection by myself

24
to eliminate bias between drivers, to control travel without a passenger (i.e. deadheading
minimization), to reduce surveyor errors, and to ensure data quality.
Figure IV.IV. Car Sign for Passenger Survey
The passenger survey included three groups of questions:
Specific Trip Questions (Q1 – Q10): The first section asks passengers questions
regarding the specific Lyft/Uber ride and includes questions such as trip purpose, travel mode
replacement, and reasons to shift from a previous mode.
General Use Questions (Q11 – Q25): The second part of the survey covers broader
questions about travel behavior in general such as modality resources (e.g. car ownership,
transit pass, etc.), general ridesourcing use, frequency of use for different modes, travel
behavior changes, and more general trip purposes and reasons.

25
Demographic Questions (Q26 – Q37): The third section of the survey includes
questions regarding characteristics of the individual and household (i.e. socio-economic
demographics).
All survey questions are included in Appendix A. Chapter V, about data, as well as
Chapters VII, VIII, and IX include a more detailed description of the survey questions in this
dissertation.
Study Area
While Lyft and Uber originated in what they considered an unregulated space,
Colorado was the first state in the U.S. to legislatively authorize Lyft and Uber services to
operate with a bill signed by Governor John Hickenlooper in June 2014 (Vuong, 2014). This
helped make Denver and the surrounding cities an innovative and welcoming location for
these evolving transportation services. The Denver metropolitan region comprises a variety
of places, covering both urban and suburban areas. For example, it contains very urban
places like Union Station in downtown Denver, as well as low-density areas such as those
surrounding the Denver International Airport (DIA), located about 24 miles north-east of
Union Station. This metropolitan area also includes a college town like Boulder and suburban
cities like Westminster or Broomfield in between Denver and Boulder. This diversity of
characteristics (e.g. density, race diversity, income levels) makes the Denver region an ideal
place to study ridesourcing.
Another positive factor in the research design was the randomness of the passenger
destinations. As the driver, I did not know where each ride would end up; thus, I drove all
over the study area and visited many of the places previously described. The only location

26
that I had control over is where I turned on the app at the beginning of the shift. Thus, I
varied my starting location.

27
DATA
Since I signed-up for Lyft and Uber in 2015 – including the rides in exploratory
analysis – I gave around 500 rides, transporting over 650 passengers. This dissertation
includes 416 rides for the “driver dataset” and 311 surveys for the “passenger dataset”
collected over a period of 14 weeks mostly during the fall 2016. The flowchart in Figure V.I
shows the datasets’ description to help guide the two types of interconnected datasets.
Figure V.I. Ridesourcing Data
Driver Dataset
The distribution of the 416 rides for the different services was:
198 regular Lyft rides
164 UberX rides
39 LyftLine rides
15 UberPool rides
For this dissertation, I drove a total of 4,950.7 miles, spent a total of 15,529 minutes
(or 258 hours and 49 minutes) working as a driver, and earned a total of $4,062.08, including
28
tips. More details on the summary statistics for travel times, travel distances, and earnings
can be found in Chapter VI (Table VI-I & Table VI-IV).
Passenger Dataset
As stated before, the passenger dataset from 311 surveys include three types of
questions. I analyzed responses to specific trip questions and general ridesourcing usage in
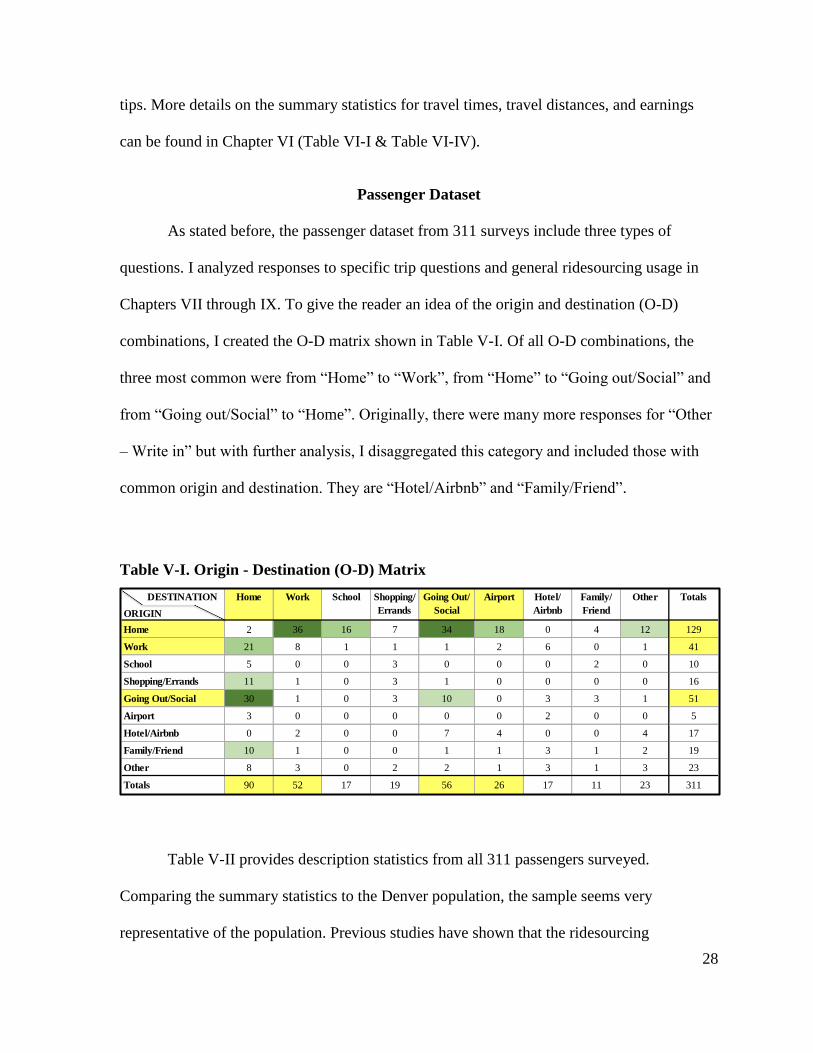
Chapters VII through IX. To give the reader an idea of the origin and destination (O-D)
combinations, I created the O-D matrix shown in Table V-I. Of all O-D combinations, the
three most common were from “Home” to “Work”, from “Home” to “Going out/Social” and
from “Going out/Social” to “Home”. Originally, there were many more responses for “Other
– Write in” but with further analysis, I disaggregated this category and included those with
common origin and destination. They are “Hotel/Airbnb” and “Family/Friend”.
Table V-I. Origin - Destination (O-D) Matrix
Table V-II provides description statistics from all 311 passengers surveyed.
Comparing the summary statistics to the Denver population, the sample seems very
representative of the population. Previous studies have shown that the ridesourcing
DESTINATION
ORIGIN
Home 2 36 16 7 34 18 0 4 12 129
Work 21 8 1 1 1 2 6 0 1 41
School 5 0 0 3 0 0 0 2 0 10
Shopping/Errands 11 1 0 3 1 0 0 0 0 16
Going Out/Social 30 1 0 3 10 0 3 3 1 51
Airport 3 0 0 0 0 0 2 0 0 5
Hotel/Airbnb 0 2 0 0 7 4 0 0 4 17
Family/Friend 10 1 0 0 1 1 3 1 2 19
Other 8 3 0 2 2 1 3 1 3 23
Totals 90 52 17 19 56 26 17 11 23 311
Other TotalsShopping/
Errands
Going Out/
Social
Hotel/
Airbnb
Family/
Friend
Home Work School Airport

29
population (and carsharing) does not usually replicate the area they represent with higher
incomes, low minority representation, and younger users (Murphy, 2016; Rayle et al., 2016).
The authors from these research papers suggest that these services mostly serve certain
populations but I believe is mostly due to the location of the intercept surveys. My research
has the advantage of being random by design since I did not know the passengers’
destination location. Thus, allowing this study to cover a larger area and include populations
that are usually not represented in this type of studies. The sample has a very close split of
male-female population. Passengers were mostly younger adults but compared to other
studies, I had higher participation from persons of ages 55 to 64, and 65+ years old people.
While two thirds of the sample stated being of white race, I obtained representation from
different races and ethnicities. In contrast to previous studies, income is better distributed
between different ranges, and not very far from the Denver population.

30
Table V-II. Demographics of Ridesourcing Passengers
Denver
Populationa
Denver
Populationa
Responses (%) (%) Responses (%) (%)
Gender Marital Status
Female 145 46.9% 50.0% Single or never married 185 62.7% 41.7%
Male 162 52.4% 50.0% Married or in a family relationship 80 27.1% 39.2%
Prefer not to answer 2 0.6% Separated, divorced, or widow 28 9.5% 19.1%
n 309 Other 2 0.7%
n 295
Residency
Local Resident 254 82.2% -- Household sizeb
Visitor 55 17.8% -- 1 65 22.3% --
n 309 2 129 44.2% --
3 56 19.2% --
Age 4 30 10.3% --
18-24b
78 25.2% 10.0% 5+ 12 4.1% --
25-34 132 42.7% 21.8% n 292
35-44 56 18.1% 15.4%
45-54 30 9.7% 11.7% Children in household
55-64 7 2.3% 10.5% Yes 47 20.5% 25.1%
65+ 6 1.9% 10.7% No 182 79.5% 74.9%
n 309 n 229
Race/Etchnicity Education
Asian 24 7.8% 3.5% Less than High School 9 3.0% 13.9%
Black/African American 16 5.2% 9.4% Graduated high school or equiv. 49 16.5% 17.7%
Hispanic or Latino 39 12.7% 30.9% Some college, no degree 58 19.5% 18.3%
White 206 66.9% 53.1% Associate or Bachelor's degree 124 41.8% 32.5%
Other 16 5.2% 3.1% Advanced degree (Master's, PhD) 57 19.2% 17.6%
Prefer not to answer 7 2.3% n 297
n 308
Employment Status
Household Incomec
Working (Full-time or Part-Time) 246 81.7% 70.9%
$30K or less 34 11.5% 28.3% Volunteer 1 0.3% --
$31K - $45K 56 18.9% 14.0% Unemployed 15 5.0% 6.3%
$46K - $60K 58 19.6% 11.1% Retired 8 2.7% --
$61K - $75K 30 10.1% 10.0% N/A 31 10.3% --
$76 - $100K 40 13.5% 11.9% n 301
Over $100K 50 16.9% 24.9%
Prefer not to answer 28 9.5% -- Student Status
n 296 Student (Full-time or Part-time) 70 23.3% 34.2%
Not currently a student 230 76.7% 65.8%
n 300
a 2011-2015 ACS 5-Year Estimates, Denver County
b Age 1st Range is 15 - 24 for ACS
c Income Range for ACS slighly different
RidesourcingRidesourcing
31
DRIVER PERSPECTIVE: TRAVEL TIMES, DISTANCES, AND EARNINGS
This chapter focuses on three very important aspects of ridesourcing from the driver
perspective: travel times, distances, and earnings. For this study, I used the driver dataset
including 416 rides from Lyft, UberX, LyftLine, and UberPool. When driving for Lyft and
Uber, travel times were measured in minutes and travel distances in miles starting with the
length from “app log-in” to “ride request/acceptance”, from “ride request/acceptance” to
pick-up”, waiting for passenger (time only), and from passenger “pick-up” to “drop-off”. The
length from “pick-up” to “drop-off” will be referred as “with-a-passenger (WP) ride” for the
rest of the study. These four measurements were recorded for each new ride, and at the end
of the shift, lengths from “drop-off” to “app log-out” and/or “end destination” were
measured. This involves the commute at the end of the shift. Note that during the period that
data was gathered, Uber and Lyft introduced an option to set a destination filter. This option
allows the driver to set a destination filtering the ride requests that go along the same route.
I estimated ridesourcing efficiency rates based on WP rides versus total times and
distances. Based on the distance efficiency, I also calculated total VMT per 100 with-
passenger miles traveled (WPMT), which helps to determine the additional VMT or
deadheading experienced in our transportation system due to ridesourcing. Total ridesourcing
travel time and distances also allow me to calculate the gross earnings per hour and per mile.
Finally, I estimated ridesourcing driving expenses and net earnings per hour and per mile.
This study starts to fill a gap in the literature by studying the effects of ridesourcing
on transportation from the driver perspective. My aim is to help cities and regional
transportation organizations better account for the impact of technology and evolving

32
transportation services such as Lyft and Uber in their transportation planning and engineering
processes and have a clearer picture of the actual gross earnings, expenses, and net earnings
for ridesourcing drivers. In this chapter’s concluding section, I consider improvements to the
current ridesourcing services in terms of increasing efficiency to reduce VMT, due to
deadheading and wasted time, and provide higher earnings for ridesourcing drivers.
Chapter Related Literature
While most of the studies mentioned on Chapter III (Murphy, 2016; Rayle et al.,
2016) focus mainly on the ridesourcing passengers, there are only a few articles that focus on
the driver side.
Ridesourcing has been mainly compared with taxis. There has been a lot of resistance
and controversy with the introduction of ridesourcing since they disrupted the industry,
competing and taking away many customers from taxis. Both services are similar in the fact
that drivers transport passengers for a fee, but there are many differences including
technology innovation, labor market differences, and government regulations. In terms of
driving and time efficiency of ridesourcing and taxi services, Cramer and Krueger (2016)
compared the capacity utilization rate of UberX drivers against taxi drivers in a few U.S.
cities. Using the aggregated data across all drivers available for both cities, the findings show
that the percent of work hours with a passenger ranges from 32.0% to 49.5% for taxis, and
46.1% to 54.3% for UberX. The mileage-based capacity utilization measure (i.e. percent of
miles driven with a passenger) from the same study was calculated at 39.1% to 40.7% for
taxis, and 55.2% to 64.2% for UberX. The main limitation of Cramer and Krueger’s study
was the exclusion of mileage and times drivers have to travel from the point of log-out to the
end location (i.e. commute home), which overestimates their capacity utilization rate.

33
The media has put a lot of attention in the income for Lyft and Uber drivers. A Wall
Street Journal article in 2013 stated that a typical Uber driver takes in more than $100,000 a
year in gross sales (MacMillan, 2013). After this income estimation was questioned, Uber
reduced this income characterization and more recently advertise that its drivers earn up to
$35 an hour (same as Lyft advertisement). Based on data from October 2014, a study
commissioned by Uber found that UberX drivers were grossing around $17.40 an hour for 20
market cities as a whole (Hall & Krueger, 2015). They also reported taxi drivers and
chauffeurs wages of around $12.90 an hour based on the Occupational Employment Statistics
survey. The main difference is that Uber’s driver-partners, who are independent contractors,
are not reimbursed for driving expenses, in contrast to taxi drivers, who are usually
employees. The Uber hourly wage calculated in the Hall & Krueger’s study was based in
2014, when rates were higher than in 2015 or 2016, and did not include the time drivers have
to travel from the point of log-out to the end location, same as previously described for the
article by Cramer and Krueger (2016).
A recent online article published by BuzzFeed News based on leaked internal data
from Uber reported that Uber drivers earn $12.70 an hour in Detroit, $14.18 an hour in
Houston, and $16.89 an hour in Denver before expenses (O'Donovan & Singer-Vine, 2016).
The article also estimates driver’s expenses, but I find the assumptions and methodology very
poor since it underestimates the depreciation cost by using a $16,000 car value, overestimates
the lifetime expectancy of an average automobile to 250,000 miles, and uses a low gas cost
of $1.75 per gallon. It is also not clear about the insurance, maintenance, and miscellaneous
costs associated with driving. It is important to note again that these calculations also do not
include the commute time and distance for drivers (from the point of log-out to the end

34
location). By not including this additional time and expenses, the reported earnings per hour
could be severely overestimated.
This study is the first research that independently analyzes data from the driver
perspective using both Lyft and Uber trips, including all the additional travel distances,
additional times, and actual gross, expenses, and net earnings per hour and per mile incurred
by Lyft/Uber drivers.
Chapter Data and Analysis
I used a total of 416 rides – 108 rides pre-IRB and 308 with IRB approval – for this
study. For each ride, the information of interest includes: the service the ride was requested
from (Lyft, LyftLine, UberX, or UberPool), travel times, travel distances, and earnings
including tips. The data analysis process began by calculating the breakdown of travel times
and travel distances for each ride (Figure VI.I & Figure VI.II):
t1 = time a driver has to wait until a new ride request
d1 = travel distance cruising for a ride (if the driver decides to park and wait until
a new request, this distance is zero or close to zero)
t2 = travel time from “ride request/acceptance” to “passenger pick-up” (i.e. en-
route to passenger) or estimated time of arrival (ETA)
d2 = travel distance from “ride request/acceptance” to “passenger pick-up” (i.e.
en-route to passenger)
t3 = waiting for passenger time once at pick-up location
t4 = travel time from passenger “pick-up” to “drop-off”, or WP time
d3 = travel distance from passenger “pick-up” to “drop-off”, or WPMT

35
Fig
ure
VI.
I. T
rav
el D
ista
nce
s an
d T
imes
of
a L
yft
/Ub
er D
river

36
Figure VI.II. GPS Tracking of a Lyft/Uber Ride
In addition to the previous travel times and distances, drivers have to travel to their
end locations and commute home once they drop-off the last passenger and are finished with
the shift. The commute at end is also illustrated in Figure VI.I and includes:
t5 = travel time from “drop-off” to “app log-out” plus travel time from “app log-
out” to driver “end location”
d4 = travel distance from “drop-off” to “app log-out” plus travel distance from
“app log-out” to driver “end location”
Travel Distances and Times
The ridesourcing driving time and distance per shift are calculated by the following
equations:
𝑡𝑠ℎ𝑖𝑓𝑡 = [∑(𝑡1 + 𝑡2 + 𝑡3 + 𝑡4)] + 𝑡5

37
𝑑𝑠ℎ𝑖𝑓𝑡 = [∑(𝑑1 + 𝑑2 + 𝑑3)] + 𝑑4
For this study, the total ridesourcing driving time is:
𝑡𝑇 =∑𝑡𝑠ℎ𝑖𝑓𝑡 = ∑𝑡1 +∑𝑡2 +∑𝑡3 +∑𝑡4 +∑𝑡5
And the total ridesourcing driving distance is:
𝑑𝑇 =∑𝑑𝑠ℎ𝑖𝑓𝑡 = ∑𝑑1 +∑𝑑2 +∑𝑑3 +∑𝑑4
In terms of VMT and WPMT, the total ridesourcing driving distance can be expressed
as follows:
𝑉𝑀𝑇𝑇 = ∑𝑑1 +∑𝑑2 +𝑊𝑃𝑀𝑇𝑇 +∑𝑑4
𝑉𝑀𝑇𝑇 = 𝑊𝑃𝑀𝑇𝑇 + [∑𝑑1 +∑𝑑2 +∑𝑑4]
𝑉𝑀𝑇𝑇 = 𝑊𝑃𝑀𝑇𝑇 + 𝐴𝑑𝑑𝑖𝑡𝑖𝑜𝑛𝑎𝑙 𝑉𝑀𝑇
Ridesourcing Efficiency Rate
To determine the time efficiency rate, I compared the sum of WP times (∑ 𝑡4) against
total times (𝑡𝑇):
𝑇𝑖𝑚𝑒 𝑅𝑖𝑑𝑒𝑠𝑜𝑢𝑟𝑐𝑖𝑛𝑔 𝐸𝑓𝑓𝑖𝑐𝑖𝑒𝑛𝑐𝑦 =∑ 𝑡4𝑡𝑇
And the sum of WPMT travel distances (∑𝑑3) against total travel distances (𝑑𝑇) for
the mileage efficiency rate:
𝑀𝑖𝑙𝑒𝑎𝑔𝑒 𝑅𝑖𝑑𝑒𝑠𝑜𝑢𝑟𝑐𝑖𝑛𝑔 𝐸𝑓𝑓𝑖𝑐𝑖𝑒𝑛𝑐𝑦 =∑𝑑3𝑑𝑇
=𝑊𝑃𝑀𝑇𝑇𝑉𝑀𝑇𝑇

38
Based on the total VMT equation: 𝑉𝑀𝑇𝑇 = 𝑊𝑃𝑀𝑇𝑇 + 𝐴𝑑𝑑𝑖𝑡𝑖𝑜𝑛𝑎𝑙 𝑉𝑀𝑇, the
additional percent of WPMT is:
𝐴𝑑𝑑𝑖𝑡𝑖𝑜𝑛𝑎𝑙 𝑉𝑀𝑇
𝑊𝑃𝑀𝑇𝑇=
𝑉𝑀𝑇𝑇𝑊𝑃𝑀𝑇𝑇
− 1
Finally, I calculated the total driving miles for every 100 miles transporting
passengers (100 WPMT), as follows:
𝑇𝑜𝑡𝑎𝑙 𝑀𝑖𝑙𝑒𝑠 𝑝𝑒𝑟 100 WPMT =100 ∗ 𝑉𝑀𝑇𝑇𝑊𝑃𝑀𝑇𝑇
Ridesourcing Earnings
I calculated driver gross earnings per hour and per mile using total earnings divided
by the corresponding travel time or travel distance. For example, the gross earnings for all
416 rides was calculated by adding all driver earnings and divided by total time and total
mileage, as per the following equations:
𝐺𝑟𝑜𝑠𝑠 𝐸𝑎𝑟𝑛𝑖𝑛𝑔𝑠 ($ ℎ𝑟⁄ ) =∑𝐷𝑟𝑖𝑣𝑒𝑟 𝐸𝑎𝑟𝑛𝑖𝑛𝑔𝑠 (𝑖𝑛𝑐𝑙. 𝑡𝑖𝑝)
𝑡𝑇
𝐺𝑟𝑜𝑠𝑠 𝐸𝑎𝑟𝑛𝑖𝑛𝑔𝑠 ($ 𝑚𝑖𝑙𝑒⁄ ) =∑𝐷𝑟𝑖𝑣𝑒𝑟 𝐸𝑎𝑟𝑛𝑖𝑛𝑔𝑠 (𝑖𝑛𝑐𝑙. 𝑡𝑖𝑝)
𝑑𝑇
I also calculated three different scenarios to account for the broad range of expenses
drivers might incur. The expense rate and calculations are explained in more detail on the
results section. After discounting expenses, I estimated the net earnings per hour for all rides,
for Lyft-only rides, for Uber-only rides, including before and after tips.

39
Chapter Results
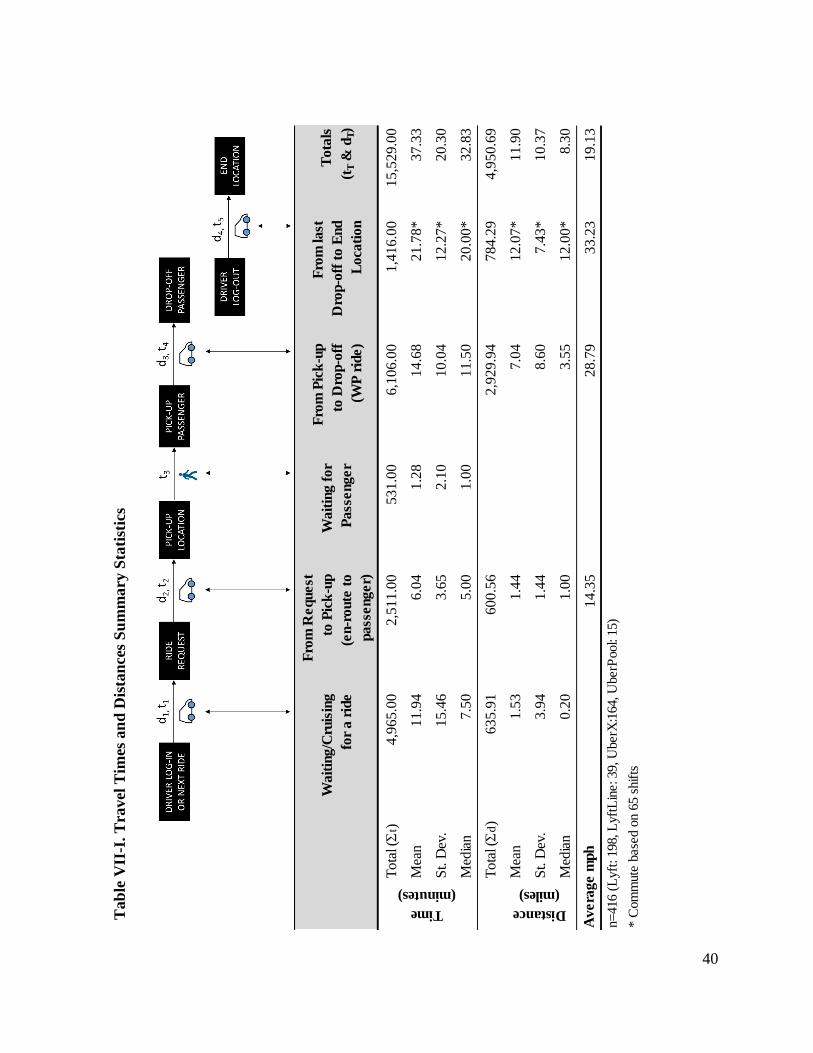
Using the median travel times and distances summary statistics (Table VI-I) from the
dataset, a representative day for a ridesourcing driver would be as the following description.
The Lyft/Uber driver logs-on both apps; he/she tries to minimize the cruising distance (0.2
miles) but has to wait 7.5 minutes (mins) until he/she gets a request. Once the driver accepts
the request, he/she spends approximately 5.0 minutes traveling 1.0 miles to the passenger
pick-up location. Then, the driver has to wait 1.0 minutes for the passenger to board the car
and start the actual ride. The median time and distance of the actual WP ride is 11.5 mins and
3.6 miles, traveling at an average speed of 28.8 miles per hour (based on a total of 6,106
minutes and 2929.9 miles). After the passenger is drop-off, the driver starts the process again
waiting for a new ride request but minimizing unnecessary driving. When the driver is done
for the day, he/she travels to the desired end location, commuting around 12.0 miles in 20.0
minutes (based on median values of 65 commuting trips or shifts). When the sum of all
commuting times and distances are equally distributed to all rides, the median total driving
time per ride is 32.8 minutes (average of 37.3 mins) and the median total driving distance per
ride is 8.3 miles (average of 11.9 miles).
Following this dataset summary statistics, I divided the chapter results section into
two subsections covering ridesourcing efficiency rates (time and distance) and earnings
(gross and net earnings after expenses).
40
Tab
le V
II-I
. T
ravel
Tim
es a
nd
Dis
tan
ces
Su
mm
ary
Sta
tist
ics
Wa
itin
g/C
ruis
ing
for
a r
ide
Fro
m R
equest
to P
ick
-up
(en-r
oute
to
pa
sseng
er)
Wa
itin
g f
or
Pa
sseng
er
Fro
m P
ick
-up
to D
rop-o
ff
(WP
rid
e)
Fro
m la
st
Dro
p-o
ff t
o E
nd
Lo
cati
on
To
tals
(tT &
dT)
To
tal (S
t) 4,9
65.0
0
2,5
11.0
0
531.0
0
6,1
06.0
0
1
,416.0
0
1
5,5
29.0
0
Mea
n 1
1.9
4
6
.04
1.2
8
1
4.6
8
21.7
8*
37.3
3
St. D
ev.
1
5.4
6
3
.65
2.1
0
1
0.0
4
12.2
7*
20.3
0
Med
ian
7
.50
5
.00
1.0
0
1
1.5
0
20.0
0*
32.8
3
To
tal (S
d)
6
35.9
1
6
00.5
6
2,9
29.9
4
784.2
9
4
,950.6
9
Mea
n 1
.53
1
.44
7
.04
12.0
7*
11.9
0
St. D
ev.
3
.94
1
.44
8
.60
7.4
3*
10.3
7
Med
ian
0
.20
1
.00
3
.55
12.0
0*
8.3
0
1
4.3
5
2
8.7
9
33.2
3
19.1
3
n=
416 (
Lyft
: 198, L
yft
Lin
e: 39, U
berX
:164, U
berP
ool:
15)
* C
om
mute
base
d o
n 6
5 s
hif
ts
Time
(minutes)
Distance
(miles)
Av
era
ge m
ph

41
Ridesourcing Efficiency Rate
The time efficiency rate of a ridesourcing driver based on the time a passenger is in
the car and total time from driver log-in to log-out (not accounting for the commute at the
end of the shift) is 41.3%, meaning that I, as a driver, during my shift hours spent more time
without a passenger than with one in the car. For example, if in a shift, I was working for five
hours, I only spent just over two hours with passengers in the car, due to all the time spent
waiting for a ride, going to pick-up the passenger, and waiting for the passengers once I was
at the pick-up locations. When accounting for commuting time at end of shift, the time
efficiency rate drops to 39.3% of total time (tT) (Table VI-II). Based on distance, the
ridesourcing mileage efficiency rate – without and with commute at end – is 65.4% and
59.2%, respectively. The total ridesourcing driving mileage per every 100 WPMT is 169.0.
In other words, Lyft and Uber drivers travel an additional 69.0 miles in deadheading for
every 100 miles they are with passengers.
Table VI-II. Time and Distance Efficiency
Time
(minutes) 6,106.0 14,767.0 41.3% 15,529.0 39.3%
Distance
(miles)2,929.9 4,482.9 65.4% 4,950.7 59.2% 69.0% 169.0
Additional
Percent of
WPMT
Efficiency:
WP/(Total minus
Commute at End)
Overall
Efficiency
(WP/Total)
VMT per
100-WPMT
WP Ride
(Sd3 & St4)
Total minus
Commute
at End
Totals
(tT & dT)

42
Ridesourcing Earnings
The rates that passengers pay for Lyft and Uber fluctuates, but traditionally, they have
been lowered over time. The percent that Lyft and Uber pay their drivers has also lowered
over time going from paying 80% initially (20% commission to Lyft/Uber) to 75% nowadays
(25% commission to Lyft/Uber). Table VI-III presents the Lyft/Uber fares and commission
rates applicable to this study. Table VI-IV shows the total amount paid by passengers, driver
earnings, and the actual Lyft and Uber commission, before and after tips. Earnings include
prime and guarantee bonus per hour but does not include initial sign-up bonuses. All
monetary values are in 2016 U.S. dollars.
Table VI-III. Lyft/Uber Fares and Driver Commission
Lyft/Uber
Service
Fee
Base
Fare
Cost per
Minute
Fare
Cost per
Mile
Fare
Minimum
Paid by
Passenger
(Fee + Fare)
Lyft $2.10 $0.50 $0.12 $1.01 $7.10
UberX $1.95 $0.75 $0.13 $1.00 $6.95
* Rates as of Fall 2016 in U.S. dollars. Rates varied and have been lowered over time
** 20% Commision when first signed-up in 2014. Newer drivers pay a higher commision (25% or more)
To Driver**
100% Service Fee
+ 20% Fare
80% Fare
+ 100% Tips
Passenger Cost*
Lyft/Uber
Commision**

43
Table VI-IV. Passenger Cost, Driver Earnings, and Actual Commission
Gross Earnings
The dataset shows that if only the time and distance drivers spent with a passenger
(WP) is taken into account; Lyft/Uber drivers would be making around $40 per hour or $1.39
per mile. However, there is more to account for within the overall work shift. After including
all times and travel distances, gross earnings turn out to be $15.69 per hour or $0.82 per mile
(Table VI-V).
Total Paid
(before tip)
Total Cost per
WP Mile
(before tip)
Total Earned
(before tips)Tips
Total Earned
(with tips)
Actual
Commision
(before tip)
Actual
Comission
(after tip)
Lyft
(n=237)$2,934.58 $1.87 $2,059.25 $276.00 $2,335.25 29.8% 27.3%
Uber
(n=179)$2,505.62 $1.84 $1,687.83 $39.00 $1,726.83 32.6% 32.1%
All Trips
(n=416)$5,440.20 $1.86 $3,747.08 $315.00 $4,062.08 31.1% 29.4%
* Earnings include prime and guarantee bonus per hour but does not include initial sign-up bonus.
** Earnings in Year 2016 U.S. dollars
To Lyft/UberPassenger Cost To Driver

44
Table VI-V. Gross Earnings
Disaggregating by ridesourcing company, I found differences between Uber and Lyft
earnings (Table VI-VI), with tips playing an important role in the differences. The small
amount of Uber tips was from a few passengers giving tips in cash since Uber does not
facilitate tipping on its app.
Table VI-VI. Gross Earnings – Lyft compared to Uber
Gross Earnings
based on WP
Gross Earnings
based in Total
minus Commute
Gross Earnings
based in Totals
(tT & dT)
$/hr $39.92 $16.50 $15.69
$/mile $1.39 $0.91 $0.82
n=416. Earnings include tips (Year 2016 U.S. dollars)
Gross Earnings
(before tip)
($/hr)
Gross Earnings
(with tip)
($/hr)
Gross Earnings
(before tip)
($/mile)
Gross Earnings
(with tip)
($/mile)
Lyft
(n=237)$14.38 $16.31 $0.77 $0.87
Uber
(n=179)$14.60 $14.93 $0.75 $0.76
All Trips
(n=416)$14.48 $15.69 $0.76 $0.82
* Earnings based in Totals (tT & dT)
** Earnings in Year 2016 U.S. dollars

45
Expenses
There many variables and rates that go into calculating personal car expenses such as
ownership costs (e.g. depreciation, finance charges, license, insurance, registration & taxes)
and operating costs (e.g. gas, maintenance, miscellaneous upkeep such as car washes and
cleaning, mobile device and data fees, parking and traffic violations, and the risk of crash or
injury). The expenses also depend on the value of your car, driving mileage, and whether or
not you own a car already and/or have already paid for some of these expenses. To account
for the broad range of possibilities, I characterize three different expense scenarios (Table
VI-VII.) covering all types of drivers, from occasionally part-time drivers to full-time
drivers. In the basic added cost, I assume a range of driving hours of 1-15 hrs/week and
around 11,000 miles per year. The next scenario included most of the drivers with 16-
49hrs/week and around 33,000 miles per year, and the last scenario is based on the U.S.
Federal Standard Mileage Rate.
The first cost scenario assumes that a driver already owns a car and has paid off basic
ownership expenditures. Ridesourcing drivers are supposed to upgrade their car insurance to
be properly insured with ridesourcing but a few drivers probably do, risking that an insurance
company would not pay a claim if a person was driving for Lyft/Uber. For this first scenario,
I assumed most ownership cost – such as insurance – as a sunk cost that drivers pay
regardless of whether a person drives for a ridesourcing company or not; in other words, it is
not considered an additional expense. This scenario also includes conservative values for
depreciation, maintenance, and other miscellaneous expenses. The cost expense for this
scenario is $0.28 per mile.

46
The next scenario represents the majority of ridesourcing drivers (51% of drivers)
based on Uber data published by Hall and Krueger (2015). Since drivers in this scenario
experience higher timing and mileage, I included costs associated with owning a car and
increased the other values according to the mileage per year. I used assumptions based on
AAA rates (AAA, 2015) and other sources but still trend toward the conservative end of the
expense spectrum. In this scenario, expenses equal to $0.40 per mile.
In the third scenario, I used the 2016 U.S. standard mileage rate determined by the
federal government of 54.0 cents per mile. The average mileage rate based on the previous
three scenarios is calculated at $0.41 per mile. The corresponded cost per hour is based on
the average of 19.1 mph from Table VI-I.
Table VI-VII. Ridesourcing Expenses
Basic Added Cost Most Drivers U.S. Federal
1-15hr/week, 16-49hr/week,
~11k miles/year ~33K miles/year
Ownership
Depreciation $1,320.00 $3,960.00
Finance Charge - $500.00
License, Registration & Tax - $350.00
Insurance - $1,500.00
Operating
Gas $1,015.38 $3,046.15
Maintenance $589.60 $1,768.80
Miscellaneous $150.00 $2,000.00
Total $3,074.98 $13,124.95
$/mile $0.28 $0.40 0.54* $0.41
$/hr $5.34 $7.60 $10.31 $7.75
* 2016 U.S. Federal Standard Mileage Rate
Item
Average
Mileage
Rate
Standard Mileage
Rate (2016)
Assumptions: Car value: $18,000; Lifetime mileage: 150,000; Work: 50 weeks/year; Gas price: $2.40/galon
(Average in 2015); Gas efficiency: 26 MPG; Maintenance: 5.36 cents/mile; Miscellaneous include car wash &
cleaning, mobile device & data fees, parking & traffic violations, risk of crash or injury

47
Net Earnings
Ridesourcing drivers are probably excited to think they are making $40 per hour, or
even $16/hr but would be disappointed to learn that, after accounting for expenses, the
average hourly rate, including tips, is $7.94 (not even minimum wage in Colorado) as shown
in Table VI-VIII. This net earning wage could be even lower because of the higher
commission rate of 80% – versus 75% of newer driver – and relatively conservative expense
estimates.
The net earning rate per mileage is between $0.28 and $0.54, with an average of
$0.41; meaning drivers’ gross earnings are cut in half after expenses. With these numbers, if
a driver work full-time (40 hours a week, 50 weeks a year) driving over 40,000 miles a year,
the annual net income would be around $16,000. These net numbers are all pre-tax earnings.
Table VI-VIII. Net Earnings (Gross Earnings minus Expenses)
When disaggregating by ridesourcing company and including tips, the Uber net
earning rate is $7.18 per hour, and Lyft is $8.56/hr (Table VI-IX). Tips makes a significant
difference on living wages for Lyft drivers with around $1.93/hr and accounting for a 29.1%
increase of net earnings, while is only $0.33/hr (4.9%) for Uber.
Average
$/hr $7.94
$/mile $0.41
n=416. Earnings include tips (Year 2016 U.S. dollars)
Net Earnings
Range (Low to High)
$5.38 - $10.36
$0.28 - $0.54

48
Table VI-IX. Net Earnings – Lyft compared to Uber
Chapter Conclusions
The time efficiency rate without taking into account commuting at the end of the shift
is 41.3%. This time efficiency rate is lower than the capacity utilization rate of 46-54% in a
previous study (Cramer & Krueger, 2016). Accounting for the commute at the end, the
overall time efficiency rate drops to 39.3%, meaning that drivers spent more time without a
passenger than with one in their car. The main implication for this result is the reduction on
earnings per time ($/hour) since ridesourcing drivers have to spend time waiting for a
passenger request, traveling to a pick-up destination, waiting for the passenger once at the
pick-up location, and commuting time at the end of the shift.
The efficiency rate in terms of WPMT versus total mileage without including
commute distance is 65.4%. The mileage efficiency rate for this study is higher than the
61.0% utilization rate calculated by Cramer and Krueger (2016). I attribute this difference to
the research design; which minimized the cruising for a ride request, did not accepting rides
when the distance to pick-up a passenger was too long, and used conservative commute
Net Earnings
(before tip)
($/hr)
Net Earnings
(with tip)
($/hr)
Tip
Percent
Lyft
(n=237)$6.63 $8.56 29.1%
Uber
(n=179)$6.85 $7.18 4.9%
All Trips
(n=416)$6.73 $7.94 18.1%
* Earnings based in Totals (tT & dT)
** Earnings in Year 2016 U.S. dollars

49
distances at end of shifts. When including all distances, the mileage efficiency rate drops to
59.2%, but I believe the real mileage efficiency rate is even lower. Even with this
conservative calculation, drivers have to travel 69 extra miles in deadheading for every 100
miles originally from WPMT.
There has been a lot of uncertainty regarding how much money a Lyft/Uber driver
makes. What is widely known is the difference between what passenger pay and what
Lyft/Uber drivers are paid. The Lyft/Uber fare per mile is around $1, but when we take into
account all fees and divided by the WP time, passengers pay around $1.86 per mile (Table
VI-3 & Table VI-4). When I became a Lyft and Uber driver, I signed-up with a commission
rate of 80-20 (80% of fare for driver and 20% for Lyft/Uber), which is used for this study
(newer drivers get even lower rates at 75% of fares). When the booking fee is taking into
account, the commission rate before tips for all rides is 31.1%. When tips are taking into
account and separated by company, the Uber commission is higher (32.1%) than the Lyft
commission (27.3%), suggesting that drivers earn better driving for Lyft.
This is the first study to incorporate commute times and distances into earning
calculations, but even without accounting for the commute time of the driver to or from their
home, the gross earnings drops to less than $16.50/hour. This is a conservative high number
since the commission rate received was at the high-end, I was driving for both Lyft and Uber
minimizing waiting for a ride times, and I minimized unnecessary driving whenever possible.
As a comparison, a recent Buzzfeed article reported that an Uber driver in Denver makes
$16.89/hour (O'Donovan & Singer-Vine, 2016), but they overestimated this hourly earning
with some of the assumptions used in calculating driver expenses.
50
Using all the data from the 416 rides and including all times and distances, the gross
earnings for this study equals to $15.69/hour, which might seems like a good hourly rate, but
many drivers do not realize the expenses incurred by driving. The expenses varied from our
conservative calculations using very basic added cost of $0.28 per mile to the standard 2016
mileage rate of $0.54 per mile, so in reality ridesourcing drivers make between $5.38 and
$10.36 per hour, with an average of $7.94/hr before taxes.
Uber net earnings before tips ($6.85/hr) is slightly higher that Lyft earnings ($6.63/hr)
but completely change when tips are taken into account. Net earnings with tips included are
$8.56/hr for Lyft versus $7.18/hr for Uber. Lyft tips in net earnings equals to a 29.1%
increase and plays a critical component in the ridesourcing driving economy. Uber could
easily add a tipping option in their app to allow passengers add a tip in their credit card bill if
they wish. This choice would help increase drivers’ earnings, but Uber has thus far refused to
implement this option.
Uber and Lyft depend on the driver-partners labor market. They incentivize new
drivers with bonuses and referrals, but their retention rate is not very good. According to Hall
and Krueger (2015), 89% of Uber driver-partners stay active after one month, 70% after six
months, and around 50% after a year. One of the reasons for this may be the realization of
driving expenses and costs incurred by driving. For example, a taxi driver who makes
$12/hour might think that they can make a lot more driving for Uber ($40/hr or $16/hr).
However, they may soon realize that, after accounting for expenses, it is not nearly as
profitable as expected and are actually not even making minimum wage at about less than
$8/hour.

51
Based on the results from this study, I have several recommendations to create more
efficiency by reducing the amount of time and distances ridesourcing drivers have to travel
and earn wages that are more decent. Cities authorizing ridesourcing services and companies
such as Lyft and Uber should:
Suggest drivers to minimize the amount of miles they drive without a passenger
Balance the driver network better by directing certain drivers to their closest
prime rate zones instead of generalizing without specific guidance
Balance the supply of drivers better, especially when passenger demand is not
high. This would minimize VMT from drivers circulating around.
Allow drivers to create ride zones so they do not end up far away from their
desired location. Also, expand the destination filter option so rides can be
matched along certain routes or destinations and not just at the end of the shift
(during the study period, Lyft and Uber started an option for drivers to put a
destination filter but the option has not been very effective). Lyft and Uber have
stated that they want to reduce the inefficiency of empty seats as one of their
desired goals so ridesourcing could function like a carpooling app where all
drivers set their destination and find passengers along the way.
Not match drivers when the passengers pick-up location is far from the driver
location or compensate drivers for these scenarios (I, as a driver, have seen
requests from locations more than 30 minutes or 20 miles away).
Concerning earnings, Lyft and Uber could always pay their independent-
contractors better by paying drivers on the service fee (which goes 100% to
Lyft/Uber), increasing passenger fees, increasing the driver commission fee,

52
providing better incentives, or covering some of the expenses. Thus far, these
companies seem to be moving in the other direction by increasing the Lyft/Uber
cut from 20% to 25% or higher, lowering passenger rates (mileage and time), and
increasing the service fee (which is not shared with the drivers). Uber also has not
shown any desire to allow an option to tip in their app, which is the number one
request from drivers.
The main limitation to this study is the trip sample size and diversification of drivers.
Drivers might have different work strategies such as searching for prime areas, have a
desired location in mind, cruising unlimitedly until they get a ride request, or limiting driving
without a passenger as much as possible by parking right after a passenger is dropped off. I
minimized the distance traveled without a passenger for the results to be conservative. The
study is also limited to the Denver metropolitan area so the Lyft/Uber costs and earnings are
based on this area.
This is the first independent study to use Lyft and Uber data exclusively to drivers.
The results provide insight into the impacts of ridesourcing into travel times, travel distances,
and the labor economy of Lyft/Uber independent contractors. This research starts to fill a gap
in the academic literature by identifying, measuring, and disentangling the impacts of
ridesourcing on very important aspects of transportation. I hope this study helps cities and
regional organizations better account for the impacts of ridesourcing on travel time and
mileage efficiency, as well as inform the ridesourcing labor market on the complicated issues
of earnings and expenses.
53
VMT IMPACTS
Most of my life I have lived in two cities: Cali in Colombia and Denver in the U.S.
These cities differ quite dramatically in their economies, demographics, employment, culture,
etc. Regarding transportation, they are also very different in terms of land use, transportation
services offered, mode share, car ownership, work force, etc. For example, the mode share of
private vehicles in Cali is 10% (Cali Cómo Vamos, 2015) versus around 79% in Denver
(U.S. Census Bureau, 2015)
Growing up in Colombia, I lived a completely different transportation experience
than my current one. My parents owned one car to be shared by the five members of my
family. My travel behavior was truly multimodal; I would take public transportation, carpool,
walk, or bike. Occasionally, I would take a taxi to get around the city. Thinking back, one of
the things that influenced me the most was the large amount of taxis and their effect in
congestion. Still nowadays, Cali experiences many impacts from taxis circulating around
(Figure VII.I) and getting in line outside the airport, hospitals, malls, bus terminals, and other
public places (Figure VII.II). The taxi impact experienced is very clear since in Cali taxis are
yellow and represent 7% of total mode share (Cali Cómo Vamos, 2015). This suggests a 0.7
(around 7 to 10) relationship when taxi mode share is compared to private vehicles mode
share. The estimate of mode share for taxis in Denver (combined with motorcycle or other
non-traditional means) is only 1% (U.S. Census Bureau, 2015), representing a 0.01 (around 1
to 79) ratio of taxi versus private vehicles.
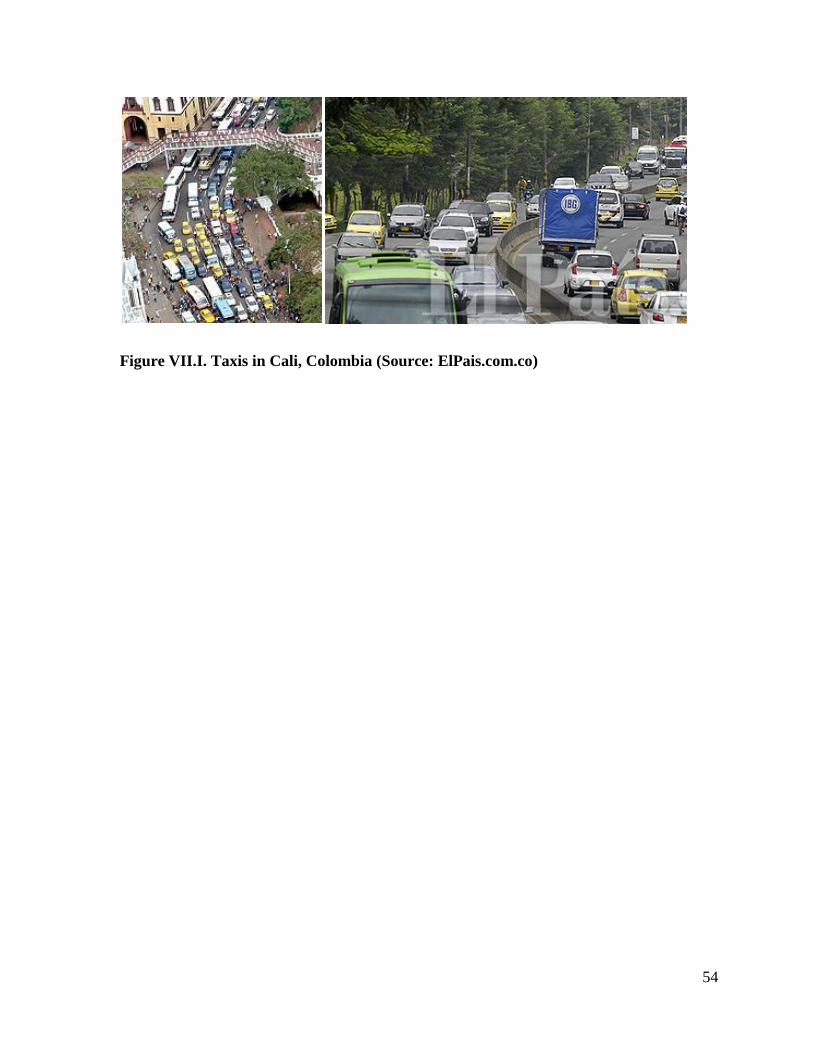
54
Figure VII.I. Taxis in Cali, Colombia (Source: ElPais.com.co)

55
Figure VII.II. Taxi Tracks in Cali, Colombia (Source: ElPais.com.co)
56
This experience is relevant to ridesourcing since very little is known about the
contribution that Lyft and Uber provides to the efficiency and impacts of our transportation
systems. When people use private vehicles to operate for Lyft and Uber, we might not realize
the impacts in city streets since most only carry a barely visible logo sticker.
Cities, regions, and transportation organizations usually set up goals to reduce
congestion, environmental impacts, and equity issues. A general term used for housing
strategies to aim for more efficient use of transportation resources is Transportation Demand
Management (TDM). Some of these goals are in terms of measuring and tracking mode
share, passenger miles traveled (PMT), and VMT.
In an effort to contribute to the conversation, this study chapter aims to analyze the
mode share replacement occurring with ridesourcing, measure the efficiency ratio of
PMT/VMT and VMT/PMT, compare VMT before and after ridesourcing, and estimate the
extra VMT generated in the U.S. from Lyft and Uber.
Chapter Related Literature
Transportation organizations across the globe are trying to solve transportation
problems by setting strategic goals to reduce SOV or increase the mode share of sustainable
modes of transportation including transit, walking, and biking. A few reports and studies
have shown that cities have successfully met some of these goals through a variety of
strategies, including TDM efforts – such as congestion fees, tollways, high occupancy
vehicle (HOV) lanes to carpool/increase vehicle occupancy, parking management, transit
passes – as well as infrastructure investments and policy changes (Bialick, 2015b; Henao et
al., 2015; Kaffashi et al., 2016; Steele, 2010).

57
The problem with ridesourcing is that when organizations are trying to set up goals in
regards to mode shift and prioritizing certain modes, they do not know the real impacts and
efficiency of services like Uber and Lyft. Shall organizations support ridesourcing and
encourage its services to a higher use? What modes are they replacing? What is the
PMT/VMT or PMT/VMT ratios compared to other modes? How would the transportation
system benefit if ridesourcing was replacing modes that are more efficient? For example, we
know that it will never be better than biking, walking, or transit since VMT for theses modes
is zero or close to zero, but how does it compare to the SOV PMT/VMT ratio of 1.0, or taxis
being around 0.40 (Cramer & Krueger, 2016)?
The few studies that look into mode share changes and VMT impacts analyze the data
at the aggregate level and do not make a distinction about the magnitude and directional
shifts occurring within all modes. This study chapter aims to start filling this gap in the
literature by looking in more detail the mode replacement, as well as PMT and VMT
changes, and find out the place where ridesourcing stands in terms of efficiency compared to
other modes of transportation.
Chapter Data and Analysis
For this research, I used the information containing both the information collected by
driving and the corresponding passenger survey information, for a total of 311 passenger
surveys during 308 rides. The information gathered by driving is the same as the data
collected in chapter VI, except the focus on this chapter is on distance and does not include
times nor earnings. I also include information on the number of passenger for each ride. The
question of interest from the passenger survey is Q5: “For this trip, how would you have
58
traveled if Lyft/Uber wasn’t an option?” (Figure VII.III). The survey response options to the
multiple choice question were:
Wouldn’t have traveled
Drive Alone
Carpool (drive)
Carpool (ride)
Public transportation
Bike or Walk
Taxi
Other
After reviewing the “other” responses, I created three new categories; including two
categories for “get a ride” and “car rental”. Seventeen passengers responded either “Lyft”
during the Uber ride or “Uber” during the Lyft ride. These passengers probably did not read
the question carefully, or they use Lyft/Uber as their main mode of transportation and did not
think of other replacement mode. For these passengers, I created the “other ridesourcing”
category.

59
Figure VII.III. Mode Replacement (Q5)
If the passenger response to question Q5 was carpool, the survey was designed to ask
the number of people that the passenger would have carpooled with, with the intent to make a
fair comparison (Q6). For this study, I also included the question on whether or not the
passenger was using Lyft/Uber for the entire length of the trip (origin to final destination), or
he/she was making a connection to another mode of transportation (Q9), and which mode of
transportation (Q10). Finally, I included the survey question about car ownership/access
(Q19).
In summary, the information of interest for each ride includes:
Date of ride
Time at request
The service the ride was requested from: Lyft, LyftLine, UberX, or UberPool

60
Travel distances
Number of passengers
Trip Mode replaced (Q5)
Number of people carpooling if passenger would have carpooled (Q6)
Connection with another mode of transportation (Q9 & Q10)
Own or have access to a personal car (Q19).
For the twenty-nine passengers that would have carpooled, the number of people that
would have carpooled together is between two and four people with an average of 2.59
people per trip (Q6). Regarding connection with another mode of transportation, 94.50% of
the passengers stated that they were using Lyft/Uber for the entire trip, and only 5.50% were
using another mode of transportation in connection with Lyft/Uber (Q9). Moreover, 187
people out of 291, or 64.3%, responded to question Q19 by stating that they own or have
access to a personal car.
Based on the data previously described and the VMT for each mode replaced, I
proceeded to calculate the Replaced VMT (or VMTBEFORE) and passenger miles traveled
(PMT) based on travel behavior prior to Lyft and Uber were in place, as follows:
VMT Replaced for “wouldn’t have traveled” is 0
VMT Replaced for “bike or walk” is 0
VMT Replaced for “car rental” is the same as WPMT
VMT Replaced for “carpool (drive)” is the same as WPMT
VMT Replaced for “carpool (ride)” is given by the following formula:
𝑉𝑀𝑇 = 𝑊𝑃𝑀𝑇 × (# 𝑃𝑎𝑠𝑠𝑒𝑛𝑔𝑒𝑟𝑠 𝑓𝑜𝑟 𝑅𝑖𝑑𝑒
# 𝑃𝑒𝑜𝑝𝑙𝑒 𝑤ℎ𝑎𝑡 𝑤𝑜𝑢𝑙𝑑 ℎ𝑎𝑣𝑒 𝐶𝑎𝑟𝑝𝑜𝑜𝑙𝑒𝑑), which is the same as
WPMT for most rides

61
VMT Replaced for “driving” is the same as WPMT
VMT Replaced for “get a ride” is equal to two times (2x) WPMT. This is the case
when someone else (e.g. parent or spouse) would have driven the passenger from
origin to destination (O-D) and go back to origin incurring in a round-trip
doubling the miles of the original O-D trip.
VMT Replaced for “other ridesourcing” is the same as ridesourcing VMT
VMT Replaced for “public transportation” is zero for walk to transit (WTT) and
3.4 miles for drive to transit (DTT). The selection of WTT and DTT rides were
based on ride distance, answer to connection mode (Q9 & Q10), answer to car
access (Q19), percentage of WTT and DTT based on data from a previous study
in the Denver area (Marshall & Henao, 2015), and DTT distance based on another
paper in the study area (Truong & Marshall, 2014).
VMT Replaced for “taxi” is equal to 2.5 times (2.5x) WPMT based on the taxi
distance efficiency of around 40% (Cramer & Krueger, 2016). I used the same
ridesourcing VMT for trips to the airport.
If the ride included a connection, the previous distance replaced is based on total
VMT & PMT. For example, if a passenger was dropped-off at a transit station to
ride a train to the airport, and the mode replaced was “get a ride”, the VMT
Replaced is equal to two times (2x) the total distance (WPMT plus the train
distance) because the person taking the passenger would have travel all the way to
the airport and back.
The Ridesourcing VMT (or VMTAFTER) was calculated using the same methodology as
Chapter VI, where all distances – with and without a passenger – are taken into account.
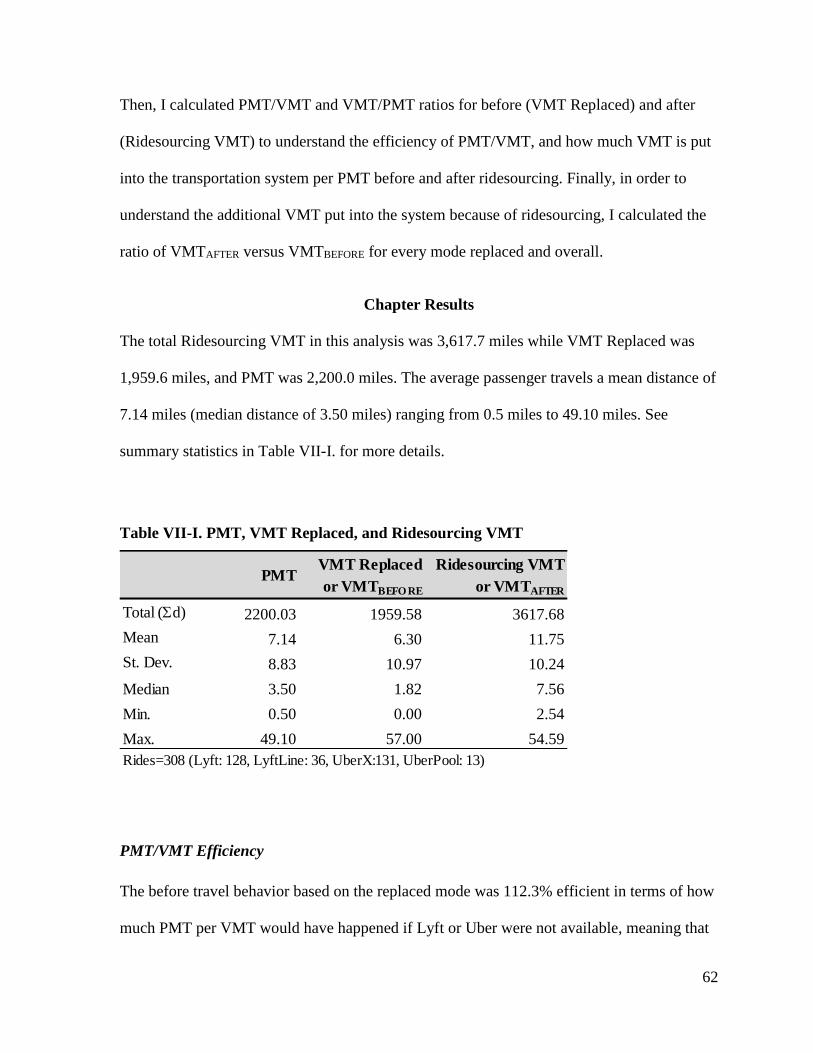
62
Then, I calculated PMT/VMT and VMT/PMT ratios for before (VMT Replaced) and after
(Ridesourcing VMT) to understand the efficiency of PMT/VMT, and how much VMT is put
into the transportation system per PMT before and after ridesourcing. Finally, in order to
understand the additional VMT put into the system because of ridesourcing, I calculated the
ratio of VMTAFTER versus VMTBEFORE for every mode replaced and overall.
Chapter Results
The total Ridesourcing VMT in this analysis was 3,617.7 miles while VMT Replaced was
1,959.6 miles, and PMT was 2,200.0 miles. The average passenger travels a mean distance of
7.14 miles (median distance of 3.50 miles) ranging from 0.5 miles to 49.10 miles. See
summary statistics in Table VII-I. for more details.
Table VII-I. PMT, VMT Replaced, and Ridesourcing VMT
PMT/VMT Efficiency
The before travel behavior based on the replaced mode was 112.3% efficient in terms of how
much PMT per VMT would have happened if Lyft or Uber were not available, meaning that
PMTVMT Replaced
or VMTBEFO RE
Ridesourcing VMT
or VMTAFTER
Total (Sd) 2200.03 1959.58 3617.68
Mean 7.14 6.30 11.75
St. Dev. 8.83 10.97 10.24
Median 3.50 1.82 7.56
Min. 0.50 0.00 2.54
Max. 49.10 57.00 54.59
Rides=308 (Lyft: 128, LyftLine: 36, UberX:131, UberPool: 13)

63
all the modes replaced were transporting passengers at a rate of 112.3 miles for every 100
VMT. With the introduction of ridesourcing, the PMT/VMT efficiency dropped to 60.8%,
meaning that the miles passengers travel is less than the vehicles miles at a rate of only 60.8
PMT for every 100 VMT from Lyft and Uber. This equates to a -51.5% net change or 45.8%
percent reduction (Table VII-II.).
VMT/PMT Ratio
Using the same numbers but inverting the numerator and dominator, I calculated the before
and after VMT/PMT ratios. If Lyft/Uber were not available, the before travel behavior
scenario would have been 0.89 VMT per every 1.0 PMT (Table VII-III), meaning that all the
modes replaced were transporting more passengers miles than vehicles miles. With the
introduction of ridesourcing, the VMTAFTER/PMT ratio went up to a value of 1.64 meaning
that now with Lyft and Uber the VMT is 1.64 miles for every 1.0 PMT (Table VII-III). This
value is very similar to the calculation of 1.69 from chapter VI.
VMT before and after
The total (Sd) and median distances of PMT, VMT Replaced, and Ridesourcing VMT for
each mode replaced and total are presented in Table VII-III. The last column of this table
shows the VMTAFTER / VMTBEFORE ratio for every mode and total, with an overall ratio of
184.6%, meaning an overall increase of 84.6% in VMT.
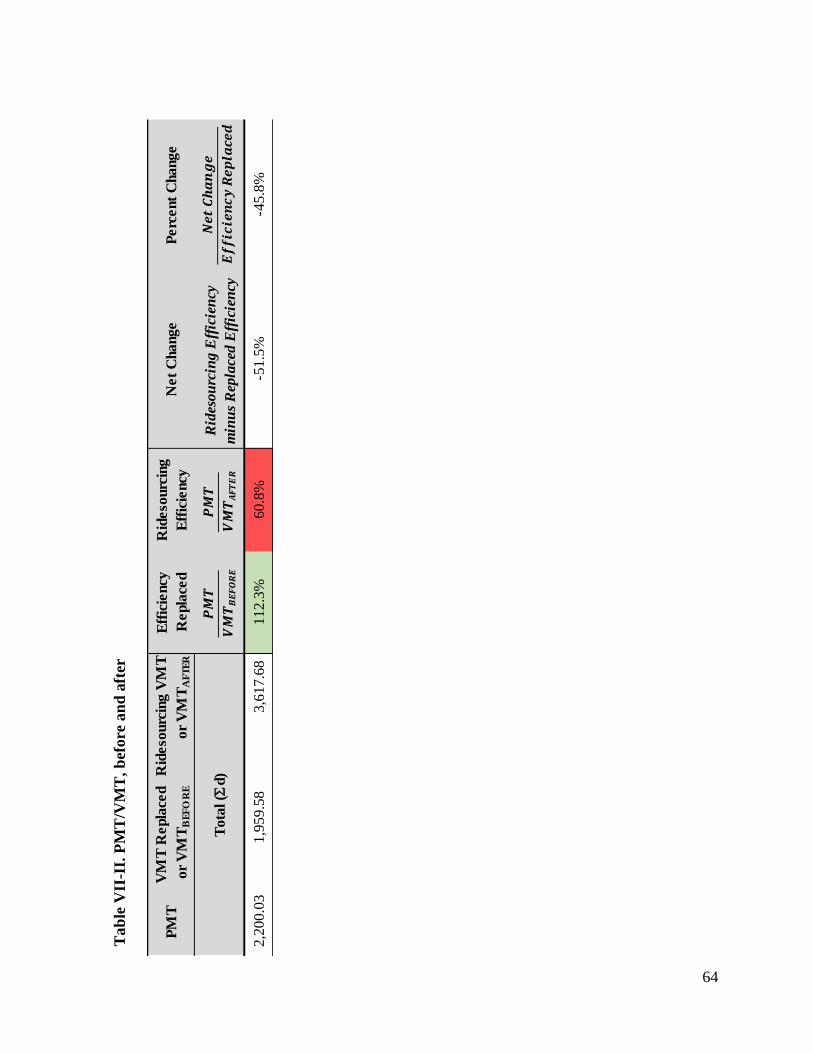
64
Tab
le V
II-I
I. P
MT
/VM
T, b
efore
an
d a
fter
PM
TV
MT
Repla
ced
or
VM
TB
EF
OR
E
Rid
eso
urc
ing V
MT
or
VM
TA
FT
ER
Eff
icie
ncy
Repla
ced
Rid
eso
urc
ing
Eff
icie
ncy
Net
Change
Perc
ent
Change
Rid
esou
rcin
g E
ffic
ien
cy
min
us
Rep
lace
d E
ffic
ien
cy
2,2
00.0
3
1,9
59.5
8
3,6
17.6
8
112.3
%60.8
%-5
1.5
%-4
5.8
%
Tota
l (S
d)

65
Tab
le V
II-I
II. V
MT
by M
od
e R
epla
cem
ent,
bef
ore
an
d a
fter
To
tal (S
d)
Media
nT
ota
l (S
d)
Media
nT
ota
l (S
d)
Media
n
Pub
lic tra
nsp
ort
atio
n69
419.6
3.5
027.2
0.0
0768.9
7.5
40.0
65
1.8
32
2826.7
%
Drive
alo
ne59
661.3
5.1
7661.2
5.1
7935.5
10.9
71.0
00
1.4
15
141.5
%
Wo
uld
n't ha
ve tra
vele
d38
194.0
3.6
70.0
0.0
0370.2
8.0
00.0
00
1.9
08
Bik
e o
r W
alk
37
74.3
1.6
50.0
0.0
0195.9
4.9
50.0
00
2.6
38
Tax
i30
364.2
5.7
7639.5
14.4
1568.3
10.7
41.7
56
1.5
60
88.9
%
Car
po
ol (
rid
e)19
132.1
3.8
782.2
1.8
2227.7
7.6
40.6
22
1.7
24
277.1
%
Oth
er r
ides
our
cing
17
52.8
3.0
0143.3
7.5
8143.3
7.5
82.7
13
2.7
13
100.0
%
Get
a r
ide
14
132.6
5.6
7265.3
11.3
3140.5
9.7
52.0
01
1.0
60
53.0
%
Car
ren
tal
13
54.6
3.7
154.6
3.5
0119.7
6.5
21.0
00
2.1
91
219.1
%
Car
po
ol (
drive
)10
77.1
2.7
477.1
2.7
493.6
5.5
11.0
00
1.2
15
121.5
%
Oth
er5
37.5
2.5
59.2
2.2
854.1
6.0
90.2
44
1.4
41
589.8
%
To
tal
311
2200.0
3.5
01959.6
1.8
23617.7
7.5
60.8
91
1.6
44
184.6
%
Legend:
Wors
t V
MT
Bett
er
VM
T
Overa
ll
nM
ode R
epla
ced
PM
TV
MT
Repla
ced o
r
VM
TB
EF
OR
E
Rid
eso
urc
ing
VM
T
or
VM
TA
FT
ER

66
Chapter Conclusions
This study chapter shows that, overall, ridesourcing VMT is approximately 184.6% of
what would have been without Lyft/Uber, which has significant implications for our cities in
terms of congestion and environmental concerns. Ridesourcing provides more mobility –
12.2% of passengers stated that they “wouldn’t have traveled” – but affects the efficiency of
transporting passengers versus vehicles going from a PMT/VMT efficiency of 112.3% to
60.8% (VMT/PMT ratio of 0.89 to 1.64). The worst VMT changes come from passengers
that would have used public transportation or active transportation. The problem is that for
these modes, the transportation system was previously experiencing zero or close-to-zero
VMT, but now with ridesourcing we end up with some of the worst VMTAFTER/PMT ratios.
The main explanatory reason is that these are short distance trips and ridesourcing is less
efficient with these trips. For example – as shown in Table VII-III – the median distance for
“bike or walk” is 1.65 miles and the ridesourcing VMT median is 4.95, which equates to 2.6
times the PMT. The transportation system experiences better VMT efficiency when the
replacing mode is “taxi” or “get a ride”, since the efficiency rate of ridesourcing is better than
taxis or people chauffeuring family or friends. In addition, one of the things to notice on the
data is that many of the Lyft/Uber trips that were replacing “get a ride” were actually
connection trips to transit so the VMTAFTER is minimal compared to the total VMTBEFORE that
a person would have done. For example, if a person rides a Lyft/Uber for 4 miles to a transit
station and then, rides the train for 20 miles; the replaced VMT is 48 miles (48 = 2 ×
[4 + 24]).
In an attempt to have a more general idea of the impacts of Lyft and Uber, I look at
some published data on the rides that Lyft and Uber have given so far. This summer, Uber

67
reported that its second billion rides were completed during six months (the first billion was
reached in six years) (Somerville, 2016). While Uber operates globally, Lyft is only in the
U.S., so I looked at numbers exclusively for the U.S. According to several news articles and
based on a statement from Lyft co-founder and president John Zimmer, Lyft does around 17
million rides per month in the U.S., and compared to Uber, their market share of total is
around 20% (Buhr, 2016; Kokalitcheva, 2016). Using these numbers, Lyft and Uber gives
around 1 billion rides per year in the U.S. If the results for this dissertation held true for the
entire country, the impacts of ridesourcing on VMT would be around 5.5 billion extra miles
per year in the U.S.; since the VMTBEFORE (or replaced) would have been 6.4 billion per year,
and VMTAFTER (or Ridesourcing) would be close to 12 billion miles per year from total
Lyft/Uber VMT. See Table VII-IV for calculations and more details.
Lyft and Uber have changed travel behavior for many people and they are becoming
more popular, but cities and transportation professionals that have expressed concerns over
the potential negative implications of ridesourcing have valid points. There should be better
policies and regulations in place for ridesourcing companies to operate in a way that would
allow our transportation system to function in a more efficient way, but it seems that the
opposite is occurring as shown in this chapter study.
Table VII-IV. Extra VMT per year in the U.S. due to Lyft/Uber
Lyft and Uber rides per year in the U.S. 1,000,000,000.00
tT mean= (Sd)/ride (Table IV.1) 11.90
VMTAFTER = Rides per year * 11.90 11,900,707,268.24
VMTAFTER/VMTBEFORE (Table V.3) 1.85
VMTBEFORE = VMTAFTER / 1.85 6,446,228,741.23
VMTEXTRA = VMTAFTER - VMTBEFORE 5,454,478,527.02

68
PARKING IMPACTS
This parking study is one component of a broader research strand that analyzes the
impacts of ridesourcing on transportation. As seen in previous chapters, there are negative
impacts as it relates to VMT since a ridesourcing driver travels additional miles well above
the actual passenger O-D trip. This becomes worse if the passenger is shifting from a mode
other than SOV, such as carpooling, transit, biking, or walking. Ridesourcing could also have
positive impacts such as parking as more people can access destinations without requiring an
accompanying parking space. In turn, this could facilitate reduced parking supply and help
alleviate congestion problems that might come from vehicles cruising around searching for
parking. On the other hand, parking difficulty and cost is an important TDM strategy that
transportation professionals use to deter driving, which might influence people’s decisions to
use Lyft/Uber when parking supply is limited and/or expensive. In terms of travel behavior,
ridesourcing could also serve as a transition in travel behavior change, car ownership, and
long-term modality styles as people shift from an auto-oriented lifestyle towards becoming
more of a multimodal traveler. However, this has not yet been adequately studied. Therefore,
this research aims to evaluate the impacts of ridesourcing on parking by looking at the trips
that otherwise would have needed parking (e.g. if passengers would have driven their own
car, renting a vehicle, or carpooling) and investigate specific origins and destinations (e.g.
airport, sporting events, special events, bars/night-life, park and ride locations). This study
also seek to shed light on understanding parking – in terms of issues such as supply and price
– as a reason of someone using Lyft/Uber instead of driving.

69
Chapter Data and Analysis
For this study, I used the dataset of 311 samples containing both the information
collected by driving and the corresponding passenger surveys. The information of interest for
this section is on the origins and destinations, trip purposes, and parking-related questions
including driving mode replacement and parking as a stated reason to use ridesourcing
instead of another mode. I analyzed the dataset for both the specific trip and for general
travel behavior questions.
Chapter Results
I divided the results section in three subsections to explore:
Parking demand by exploring the trips where ridesourcing replaced driving
Locations – origin & destination (O-D Matrix) – with trip purpose, and
connection with other modes (e.g. park and rides)
Parking difficulty as a reason to choose ridesourcing over other modes.
Each subsection includes results from the specific Lyft/Uber ride as well as answers
from the general travel behavior survey questions.
Parking Demand
Specific Trip
Since parking, theoretically, is only needed for driving trips; I decided to look in more
detail at the mode replacement distribution and pay closer attention to the trips that would
have involved driving – such as drive alone, carpool (drive), car rental, and carsharing – to
start understanding potential changes in parking demand.
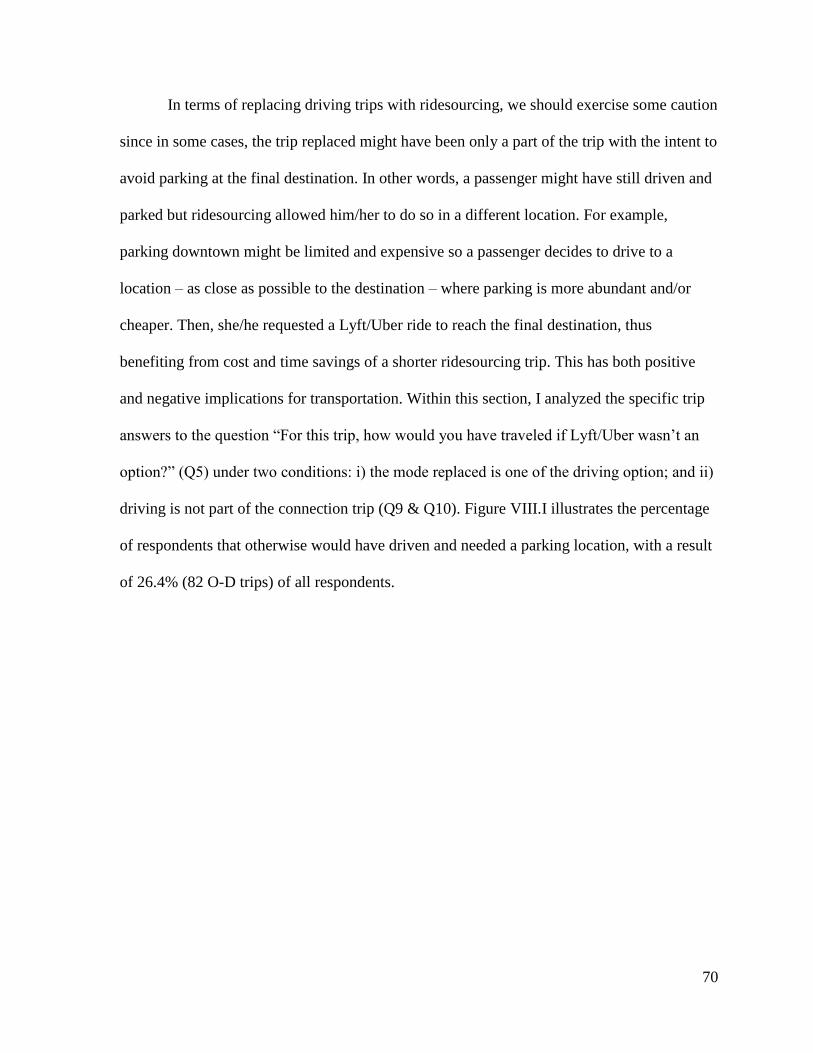
70
In terms of replacing driving trips with ridesourcing, we should exercise some caution
since in some cases, the trip replaced might have been only a part of the trip with the intent to
avoid parking at the final destination. In other words, a passenger might have still driven and
parked but ridesourcing allowed him/her to do so in a different location. For example,
parking downtown might be limited and expensive so a passenger decides to drive to a
location – as close as possible to the destination – where parking is more abundant and/or
cheaper. Then, she/he requested a Lyft/Uber ride to reach the final destination, thus
benefiting from cost and time savings of a shorter ridesourcing trip. This has both positive
and negative implications for transportation. Within this section, I analyzed the specific trip
answers to the question “For this trip, how would you have traveled if Lyft/Uber wasn’t an
option?” (Q5) under two conditions: i) the mode replaced is one of the driving option; and ii)
driving is not part of the connection trip (Q9 & Q10). Figure VIII.I illustrates the percentage
of respondents that otherwise would have driven and needed a parking location, with a result
of 26.4% (82 O-D trips) of all respondents.

71
Figure VIII.I. Ridesourcing Replacing Driving Trips (Parking)
General Use
In the general questions section of the survey, I asked passengers about travel
behavior changes for different modes (Q25), “For the next few questions, complete the
sentence based on your travel today compared to the past”. The question of interest about
parking is “Because of ridesourcing, I drive…” with the option to respond “a lot less”, “a bit
less”, “about same”, “a bit more”, or “a lot more”. Figure VIII.II provides the results with a
third of participants – 14.3% plus 19.9% – stating that they drive a lot less, which has
implications for reduction in parking demand and slightly higher than the percentage of
respondents to the specific trip replacement question. It was not expected that passengers
would increase their driving, but seven passengers (2.4%) responded to this question with “a
bit more” and a “lot more”. Based on my experience and interactions with the passengers,
this might be explained under two scenarios. The first one is that passengers share a vehicle
with others in their household; the other household drivers begin relying more on

72
ridesourcing, which facilitates greater vehicle availability and more driving for the
respondent. The second explanation is that passengers are also ridesourcing drivers, which
turned out to be the case for three of the survey respondents.
Figure VIII.II. Travel Behavior Change (Driving today compared to the past)
Locations, Trip Purpose, and Connectivity to Transit Stations
Specific Trip
Data in Chapter V includes the O-D matrix (Table V-I) for all the rides in the study
that contains both the driver and passenger datasets. In order to understand the trips that
influence parking – those that otherwise would have driven as described in the previous
subsection – I created an O-D matrix (Table VIII-I) exclusively for the Lyft/Uber rides that
replaced driving showing the locations that could potentially reduce parking supply. The
most common origin and destination locations were “home” and places that people “go out
for social trips”. The third common location was work trips with an even number of origins
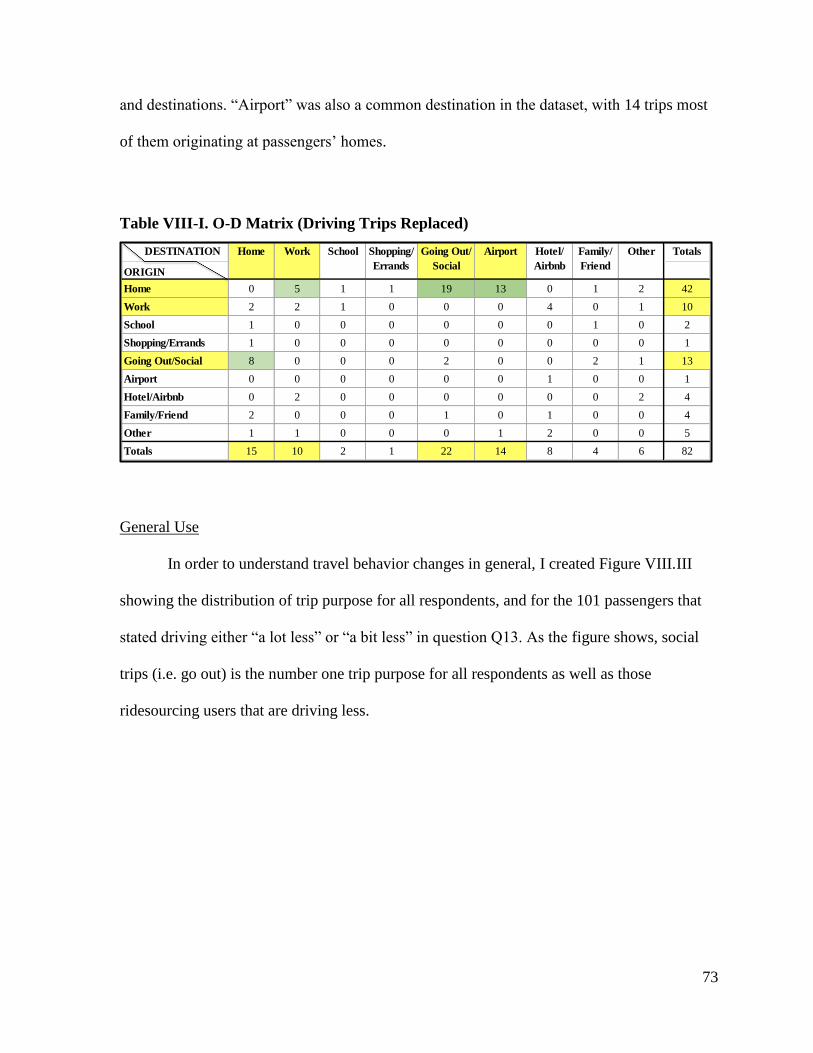
73
and destinations. “Airport” was also a common destination in the dataset, with 14 trips most
of them originating at passengers’ homes.
Table VIII-I. O-D Matrix (Driving Trips Replaced)
General Use
In order to understand travel behavior changes in general, I created Figure VIII.III
showing the distribution of trip purpose for all respondents, and for the 101 passengers that
stated driving either “a lot less” or “a bit less” in question Q13. As the figure shows, social
trips (i.e. go out) is the number one trip purpose for all respondents as well as those
ridesourcing users that are driving less.
DESTINATION Totals
ORIGIN
Home 0 5 1 1 19 13 0 1 2 42
Work 2 2 1 0 0 0 4 0 1 10
School 1 0 0 0 0 0 0 1 0 2
Shopping/Errands 1 0 0 0 0 0 0 0 0 1
Going Out/Social 8 0 0 0 2 0 0 2 1 13
Airport 0 0 0 0 0 0 1 0 0 1
Hotel/Airbnb 0 2 0 0 0 0 0 0 2 4
Family/Friend 2 0 0 0 1 0 1 0 0 4
Other 1 1 0 0 0 1 2 0 0 5
Totals 15 10 2 1 22 14 8 4 6 82
Shopping/
Errands
Going Out/
Social
Airport Hotel/
Airbnb
Family/
Friend
OtherHome Work School

74
Figure VIII.III. Ridesourcing Trip Purpose (All respondents and those “Driving less”)
Connectivity to Transit Stations
Ridesourcing advocates state that these services are solving many of the issues with
connecting to public transportation (i.e. the last mile). In order to explore this topic further, I
recorded trips with transit stop locations as the origin or destination. The passenger survey
also included questions in regards to connectivity – Q9 & Q10 as described in Chapter VII
for the specific trip, and for general use with Q22: “Have you ever used another mode of
transportation in addition to Lyft/Uber for a single trip? For example, using Lyft/Uber
to/from a bus station”, Q23 asks: “How often have you used other modes of transportation in
addition to Lyft/Uber for a single trip?” and Q24: “Please write all the modes of
transportation you have used in addition to Lyft/Uber for a single trip:” Table VIII-II
includes the results for the specific trip and general use whenever passengers were replacing
driving modes or were connecting to bus or rail at a transit station.

75
Table VIII-II. Connectivity to Transit Stations
Parking as a stated reason to choose Ridesourcing
This subsection analyzes parking as a reason for someone to use ridesourcing over
other modes, both for the specific trips and for general use.
Specific Trip
Passengers stated the main reason that led them to choose Lyft/Uber over other
options (Q8) for the actual O-D ride. Figure VIII.IV includes the percentage for each reason
including for all passengers, as well as those that “would have driven if ridesourcing was not
available”. “Parking is difficult/expensive” is highlighted in the responses as one of the
reasons to choose ridesourcing.
Q9. Ride connecting with other mode (n=311)
No 294 94.5%
Yes 17 5.5%
If yes, number of rides replacing driving and
connecting to transit3 1.0%
Q22. Have you ever connected with other mode? (n=293)
No 233 79.5%
Yes 60 20.5%
If yes, number of passenger that stated driving less and
public transportation (e.g. bus, rail) as the connection mode 21 7.2%
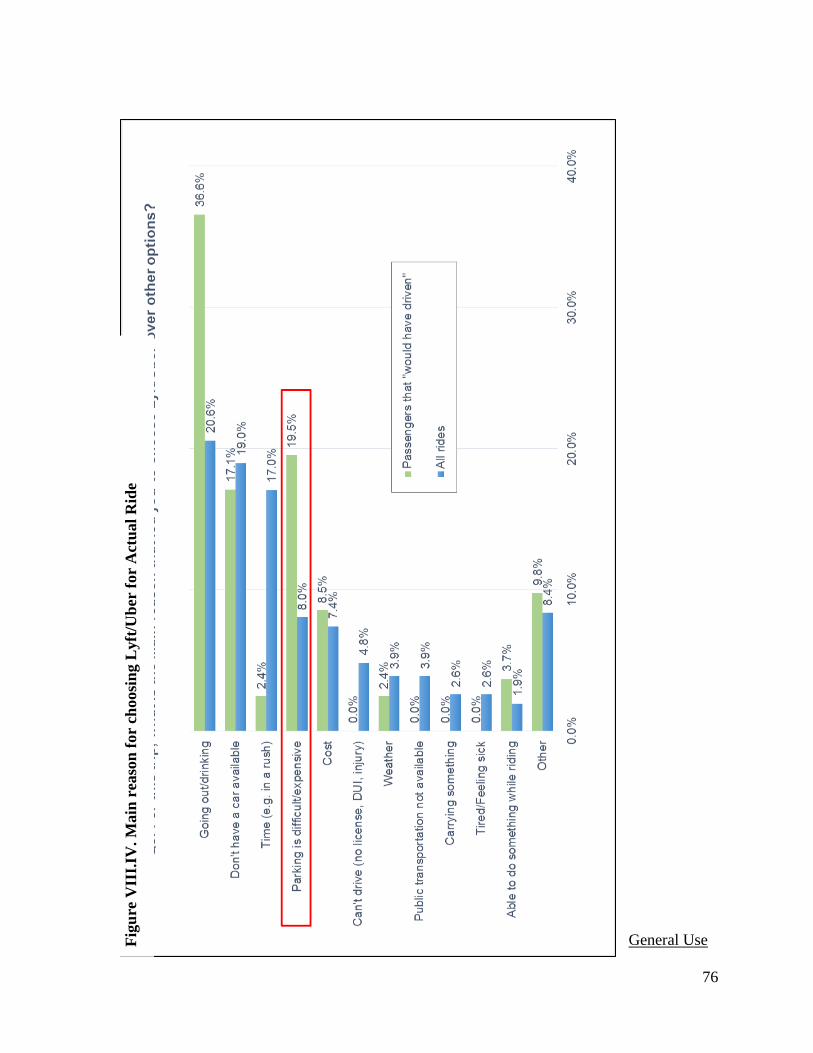
76
General Use Fig
ure
VII
I.IV
. M
ain
rea
son
for
choosi
ng L
yft
/Ub
er f
or
Act
ual
Rid
e

77
Similar to the previous subsection, question Q17 ask the main reasons to choose
ridesourcing over other modes, allowing respondents to check up to three reasons. In addition
to this question, I used the driving frequency question Q21 to create Figure VIII.V. I selected
the top five reasons from the dataset per driving frequency. In this graph, I highlighted
parking again to show the clear relationship between high frequency of driving and parking.
Parking is the second most important reason for frequent drivers to choose ridesourcing.
Figure VIII.V. Driving Frequency and Trip Purpose
78
Chapter Conclusions
With evolving transportation services and the promise of autonomous vehicles,
changes in the transportation industry are creating a window of opportunity to help dissolve
the car-dependency and automobile focus of transportation infrastructure in the U.S. and
around the globe. Thus, this study aims at investigating the reciprocal influence of an
evolving transportation service – ridesourcing – in terms of a very important transportation
infrastructure – parking – so we can model, design, and build future transportation
infrastructure.
I conducted a cross analysis to compare specific Lyft/Uber rides and general travel
behavior for three inter-related parking topics. First, I looked at mode replacement finding
that a third of all Lyft/Uber rides were replacing trips that would have needed parking.
Then, I looked in more detail at the origin and destination locations, travel behavior
changes, trip purpose, and connectivity to the transit system. The results show that
passengers that usually drive (“always drive” and “regularly”) are using ridesourcing mostly
to go to the “airport”, ”when out of town”, and for “going out/social trips”. Thus, parking
capacity could be reduced at these types of locations (e.g. airport, bars, and stadiums). With
respect to connection to the transit system, very few Lyft/Uber rides were used with this
purpose in mind.
Finally, I analyzed parking as a stated reason for using ridesourcing, showing that for
the specific trip, parking difficulty/cost is the fourth most cited reason for all trips, and the
second most cited reason for trips replacing driving. For general use, the passengers that
drive the most (“always drive” and “regularly”) stated that “parking is difficult/expensive” as
the second most cited reason why they chose ridesourcing over other modes.

79
The results from this chapter suggest that thanks to ridesourcing, we could easily
decrease the parking supply because of two reasons: ridesourcing is replacing driving trips
and parking is one of the main reasons people choose not to drive in the first place. Thus,
parking can be used as a TDM tool to influence travel behavior. The less parking provided,
the less driving desired, especially when people have choices to shift to other modes of
transportation.
Continuation of this positive cycle would facilitate decreasing car dependency. In the
future, autonomous ridesourcing vehicles would enable us to continue this trend more
rapidly. In preparation for this drastic change, we should adapt the current transportation
infrastructure to reduce parking stock and make room for more desirable land uses, especially
in urban areas where land is costly. For example, we could eliminate parking minimums in
the generation rate manual so developers build less parking spaces and more building
amenities. They should offer residents different transportation options and plan to re-
accommodate parking spaces for future use. Similarly, common destinations such as the
airport or hot spot areas for social activity (e.g. restaurants, bars, stadiums, and nightlife)
shall remove parking spaces or design future buildings with less parking capacity. In turn,
this could facilitate more livable and desirable places to walk, bike, and take public
transportation.

80
TRAVEL BEHAVIOR CHANGES
Ideally, mode choice models are run and tested with robust data containing
information regarding travel activities (e.g. mode of transportation, frequency, time of days,
etc.) and specific individual characteristics (e.g. socio-demographics, transportation
resources, land use, travel behavior style, etc.) from a random population sample. While I do
not have the necessary data for a traditional mode choice model, I can investigate the most
probable mode replacement for each individual, and explore the variables and reasons
influencing travel behavior change from previous modes of transportation after the
introduction and evolution of ridesourcing. Thus, this study chapter has three main
objectives:
1. Collect the data necessary for integrating ridesourcing services into a research
framework to help current travel models move past their simplistic focus on
traditional modes of transportation (i.e. car, transit, walk, and bike);
2. Use ridesourcing as a shock into the system to evaluate changes in travel behavior
as well as relationships between travel behavior, trip purpose, and stated reasons
for mode replacement; and
3. Identify and analyze components from the framework such as modality styles.
The term “modality style” is defined as “a certain travel mode or set of travel modes
that an individual habitually uses” by Vij, Carrel, and Walker (2013). The concept is derived
from empirical studies on higher-level orientations, lifestyles or “mobility style”, both in
short-term decisions and long-term choices, which counters the conventional assumption that
people choose a mode independently for every trip.

81
Conceptually, this dissertation builds upon the existing body of literature on the
influence of ridesourcing on modality style, mode replacement, and travel behavior.
Methodologically, this work contributes to the understanding of modality styles, changes to
modality styles with the introduction of additional transportation options – ridesourcing in
this case – and the influence of modality styles on travel behavior. More generally, this
dissertation contributes to the body of knowledge considering transportation planning and
future travel demand models. Ultimately, this dissertation sheds light on the travel behavior
impacts of ridesourcing with the current trends we are experiencing in our transportation
systems to better inform urban planners, policy makers, and transportation engineers.
Chapter Literature Review
Understanding travel behavior and the related decision-making is a very complex area
of study. One of the most common ways to rationalize and forecast travel behavior and
decisions is through travel demand models. One of the issues with travel demand models is
that the outcomes are dependent on the assumptions used in the model, and traditionally,
travel demand models assume that an individual is fully aware of the range of transportation
options so that the choice is based on utility maximization theory. Utility maximization
derived from economic theory assigns a utility value for each transportation alternative and
assumes that the mode with the highest utility value will be chosen. While this theory is well
established in economics, it contains some limitations. Calculating the actual utility of any
good is very complex and typically contains several attributes that are not realistic to measure
in many scenarios such as inhibited values, attitudes, perception, and beliefs that could relate
to ingrained lifestyles and deeply established habits for certain modes. Individuals adopt
different patterns of consumption behavior, not only based on utilitarian needs, but also
82
because they express self-identity, leading to a person making a choice as a result of how to
act and who to be (Giddens, 1991).
Transportation researchers have studied links between lifestyles and travel behavior
since early 1980s by classifying groups that depend on the time spent at different activities,
weekly travel patterns, or travel expenditures (Kitamura, 2009; Pas, 1988; I. Salomon & Ben-
Akiva, 1983). More recently, the literature evaluated the effects on transportation choice by
the influence of a person’s mobility decisions including land use (Handy, Cao, &
Mokhtarian, 2005; Kitamura, Mokhtarian, & Laidet, 1997; Krizek & Waddell, 2002) and
mobility resources (e.g. automobile ownership, bicycle ownership, public transportation
pass) (Choo & Mokhtarian, 2004; Vredin Johansson, Heldt, & Johansson, 2006). Specific to
carsharing, recent studies suggest that carsharing members have different mobility resources
compared to the representative population, with fewer cars per households and higher levels
of bike ownership and public transportation passes. In general, carsharing seems to broaden
the mix of transportation modes and increase the distribution of transportation modes,
including intermodality (mixed-modes) and multimodality (Johanna Kopp et al., 2015; Le
Vine, Lee-Gosselin, et al., 2014).
In an attempt to capture modality styles and their influence on mode choice decisions,
Vij et al. (2013) developed a model framework within the context of travel demand models
using the Latent Class Choice Model (LCCMs). LCCM models were first developed in the
field of marketing sciences (Kamakura & Russell, 1989) and include two components: a class
membership model; and a class-specific choice model. LCCM is seen as a solution to the
black box of correlation structure from the continuous mixture distribution in most widely
known travel demand models (Walker & Ben-Akiva, 2011).
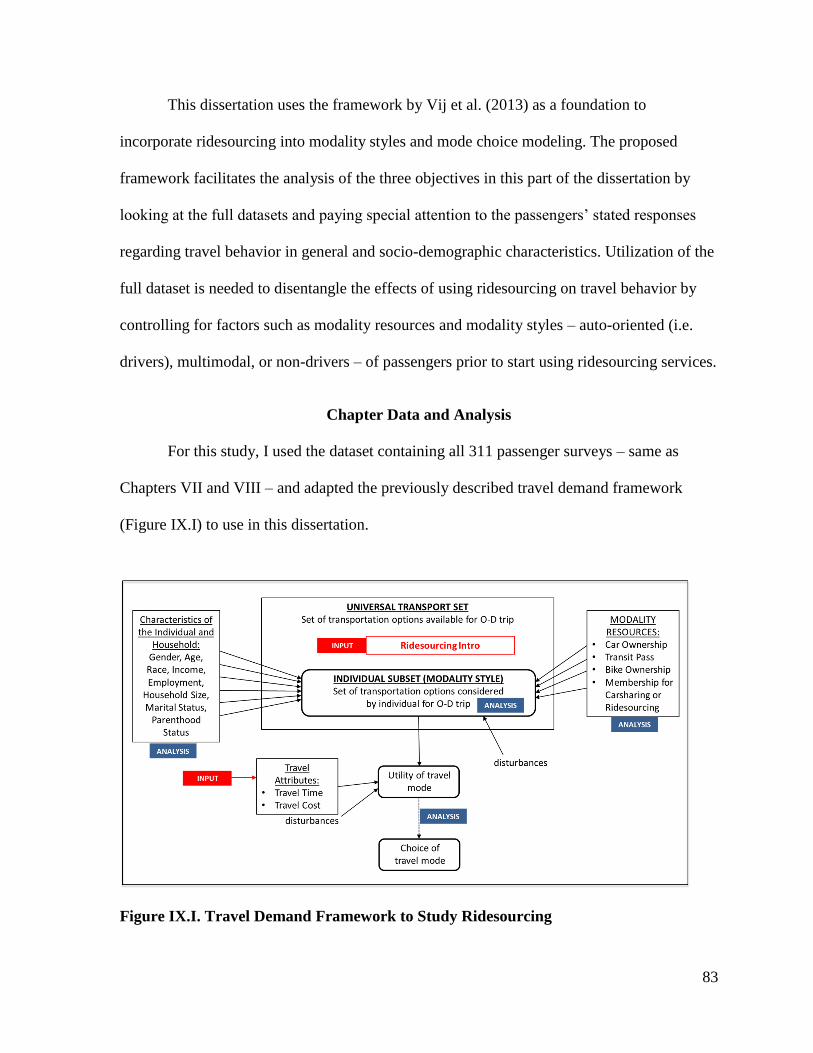
83
This dissertation uses the framework by Vij et al. (2013) as a foundation to
incorporate ridesourcing into modality styles and mode choice modeling. The proposed
framework facilitates the analysis of the three objectives in this part of the dissertation by
looking at the full datasets and paying special attention to the passengers’ stated responses
regarding travel behavior in general and socio-demographic characteristics. Utilization of the
full dataset is needed to disentangle the effects of using ridesourcing on travel behavior by
controlling for factors such as modality resources and modality styles – auto-oriented (i.e.
drivers), multimodal, or non-drivers – of passengers prior to start using ridesourcing services.
Chapter Data and Analysis
For this study, I used the dataset containing all 311 passenger surveys – same as
Chapters VII and VIII – and adapted the previously described travel demand framework
(Figure IX.I) to use in this dissertation.
Figure IX.I. Travel Demand Framework to Study Ridesourcing
84
The framework shows that for a given origin-destination pair and time, there is a
“universal transportation set” of mode options available. From this universal set, there is an
“individual subset” comprised of the transportation options from the universal set minus the
discarded options by the individual. Individuals discard certain transportation options due to
perceptions, values, habits, preferences, experience, or because they might not be aware of
the existence of a transportation service. Below the individual subset, there is the “utility of
travel mode,” which is the evaluation of each travel mode contained in the subset. The person
then chooses a travel mode from the subset based on the utility evaluation. This is done for
every given origin-destination pair and time; so every person has a group of individual
subsets given the situation.
The group of individual subsets is analogous to what Vij et al. (2013) define as
modality style in their model framework. In this dissertation, I identified four different
classes of modality styles:
Driver or car-oriented: if the individual stated driving as the main mode of
transportation
Multimodal: if individuals use several modes of transportation
Non-driver or multimodal without car: if the individual rarely, if ever, drives
Bi-style: if the individual assumes a combination of any of the three previous
modality styles.
To my knowledge, this dissertation is the first study to introduce a bi-style modality
classification, which hypothesizes that an individual may adopt two completely different
modality styles according to several factors and attributes of travel. For example, a person
could normally act as a multimodal traveler, but for trips transporting a child, the person

85
would only consider the car. In this case, the person is bi-style (first: multimodal; then: car-
oriented). Similarly, a person that normally only considers the car as the mode of
transportation might behave differently for leisure trips (e.g. going out to eat or drink). This
person’s classification is bi-style (first: car-oriented; then: multimodal without car). Previous
studies on carsharing systems provide indirect insights into the bi-modality style topic, with
the distribution of journey purposes per mode showing that individuals use personal cars,
taxi, and carsharing differently depending on the type of journey (Le Vine, Lee-Gosselin, et
al., 2014). Another insight is the potential effect of ridesourcing on drunk driving crash
reduction (Jones, 2015), which implies that people may be using these services more often
for leisure trips but not necessarily for other purposes. The bi-modality style classification is
an important distinction because it allows travel demand modes to explain travel behavior
better. Accordingly, we could create better policies and more effective planning to influence
modal shifts away from SOV.
The modality style classification is sensitive to the group of individual subsets;
therefore, I established time limits to determine modality style classifications for a specific
time period. Once a period is determined, I measured changes in modality style due to
specific inputs. An individual could potentially change modality style with the introduction
of several factors: i) changes in characteristics of the individual and households (e.g. income
or expenditures, employment status, marital status, parenthood status); ii) changes in location
(e.g. home, work, or school); iii) changes in infrastructure or services (e.g. improvement on
certain mode infrastructure, evolving transportation services); or iv) changes in mobility
resources (e.g. personal cars, bicycles, public transportation pass, carsharing membership, or
ridesourcing membership). For this dissertation, I surveyed passengers once but the survey

86
included questions specific to the current trip as well as more general questions regarding
travel behavior changes due to the introduction of ridesourcing. Establishing travel behavior
prior to the introduction of Lyft/Uber and controlling for explanatory factors (e.g. the person
recently moved from out of town, the passenger cannot drive anymore due to DUI or illness)
is key to understanding travel behavior.
The key questions for data analysis in this chapter are:
Mode frequency (Q21), where passengers stated how often they use each mode of
transportation. The multiple choice options were never, rarely (special occasions,
monthly), sometimes (~ 1-2 times per week), regularly (at least 3 times per week),
and always.
Travel Behavior, based on question Q25: “For the next few questions, complete
the sentence based on your travel today compared to the past”, and followed by
the following subsections sentences:
o Because of ridesourcing, I go to places…
o Because of ridesourcing, I drive…
o Because of ridesourcing, I use public transportation…
o Because of ridesourcing, I bike or walk…
o Because of ridesourcing, I take taxis
With the options to answer: “A lot less”, “A bit less”, “About same”, “A bit
more”, or “A lot more”.
Change in resources (Q19): “Do you (or your household) own fewer cars because
of ridesourcing?” with “Yes” or “No” answer options.
87
Besides questions on mode frequency and travel behavior changes, I reevaluated
several other questions such as trip purpose (Q13) and stated reasons (Q17) from
the previous chapters.
In the last question, I recorded passenger’s emails for a possible follow-up study,
Q38: “In the future, we would like to do a follow-up study on ridesourcing travel changes. If
it’s OK for us to contact you about a future study, please share your email address”.
Chapter Results
I organized this chapter result section in three sub-sections. The first one presents
mode frequency and travel behavior changes. The second part investigates relationships
between frequency of use, trip purpose, and stated reasons. The last subsection analyzes
modality styles.
Mode Frequency and Travel Behavior Changes
Figure IX.II presents frequency of use per mode of transportation. About half of
ridesourcing users stated that they “always” or “regularly” drive alone. In contrast, only 0.7%
of passengers use taxi always or regularly. Carpool, public transportation, and bike/walk
modes have a more evenly frequency of use distribution.

88
Figure IX.II. Mode Frequency
I collected information on travel behavior changes for five different categories – new
trips, drive, public transportation, bike/walk, and taxis – which allow me to measure and
compare the magnitude of change for each mode. For example, Figure IX.III shows driving
change versus public transportation change.
Drive alone 92 26 32 45 97
31.5% 8.9% 11.0% 15.4% 33.2%
Carpool 84 90 98 18 2
28.8% 30.8% 33.6% 6.2% 0.7%
Use public transportation 102 73 78 33 6
34.9% 25.0% 26.7% 11.3% 2.1%
Bike or Walk 75 96 77 26 18
25.7% 32.9% 26.4% 8.9% 6.2%
Taxi 248 33 9 2 0
84.9% 11.3% 3.1% 0.7% 0.0%
AlwaysMode Frequency (n=292) Never Rarely Sometimes Regularly

89
Figure IX.III. Travel Behavior Changes, Driving & Public Transportation
The three yellow circles in Figure IX.III have the same magnitude of change for
driving and public transportation. The triangle covering the area in quadrant IV is labeled as
“less sustainable” (red zone) since the magnitude of change for public transportation is worse
than the magnitude of change for driving, and triangle around quadrant I is label as “more
sustainable” since the opposite occurs (blue zone). For example, a positive change occurred
when public transportation use increased and driving use decreased due to ridesourcing. The
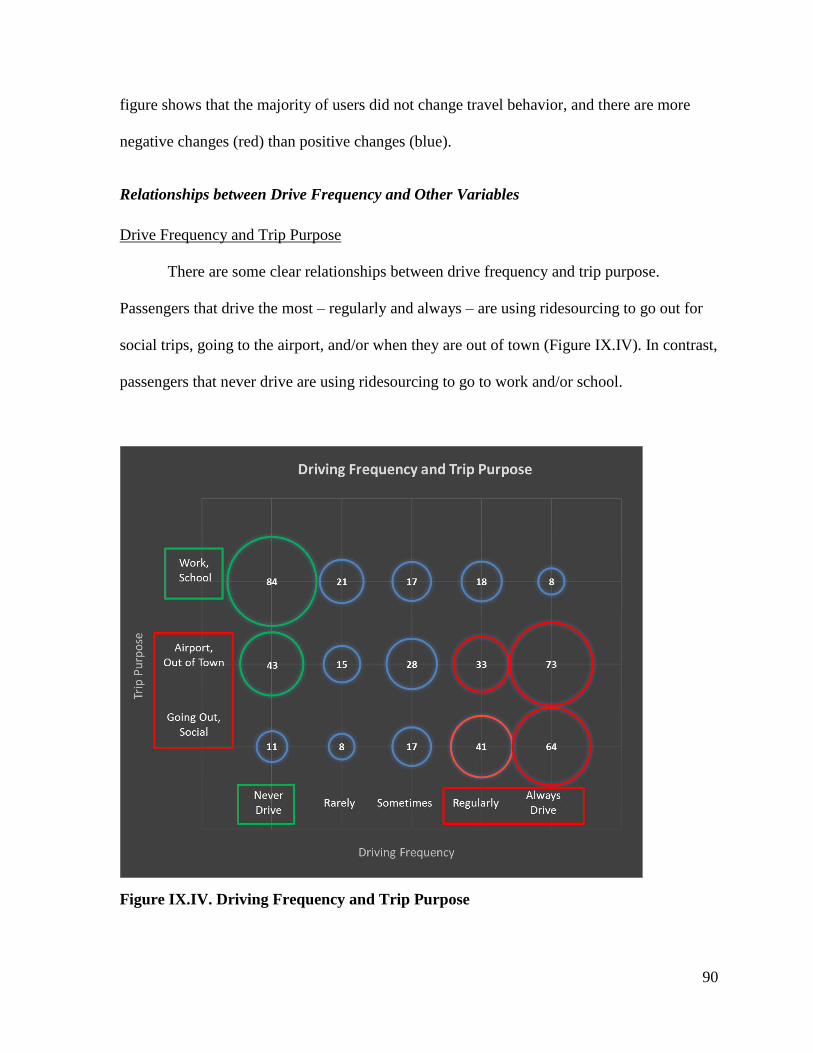
90
figure shows that the majority of users did not change travel behavior, and there are more
negative changes (red) than positive changes (blue).
Relationships between Drive Frequency and Other Variables
Drive Frequency and Trip Purpose
There are some clear relationships between drive frequency and trip purpose.
Passengers that drive the most – regularly and always – are using ridesourcing to go out for
social trips, going to the airport, and/or when they are out of town (Figure IX.IV). In contrast,
passengers that never drive are using ridesourcing to go to work and/or school.
Figure IX.IV. Driving Frequency and Trip Purpose

91
Driving Frequency and Stated Reasons
I first explored stated reason on why passengers use ridesourcing in chapter VIII on
parking. Further analysis on the topic shows that car-dependents are replacing driving trips
mainly because they are consuming alcohol and/or because they find parking difficult and/or
expensive. On the other hand, non-drivers use ridesourcing because they do not have a car
available, public transportation is not great, and/or time constraints (e.g. passengers are in a
rush to get somewhere), as shown in Figure IX.V.
Figure IX.V. Driving Frequency and Stated Reasons

92
Modality Styles
Based on use frequency for different transportation modes (Q21), I was able to
identify three modality style classes – 111 drivers, 64 multimodal passengers, and 117 non-
drivers – as the research methodology suggested (Figure IX.VI). Then, I explored the
“drivers” group in more detail based on the introduction of ridesourcing (Q11), frequency of
ridesourcing use (Q14), and travel behavior change due to ridesourcing (Q15). I was able to
identify a fourth modality style classification – bi-style – comprised of typical drivers that
use ridesourcing only for rarely or special occasions such as going out to eat or drink and/or
when out of town. Table IX.I presents summary results for questions Q11, Q14, and Q15,
showing the bi-modality group comprised of 49 passengers.

93
Figure IX.VI. Modality Style Classification
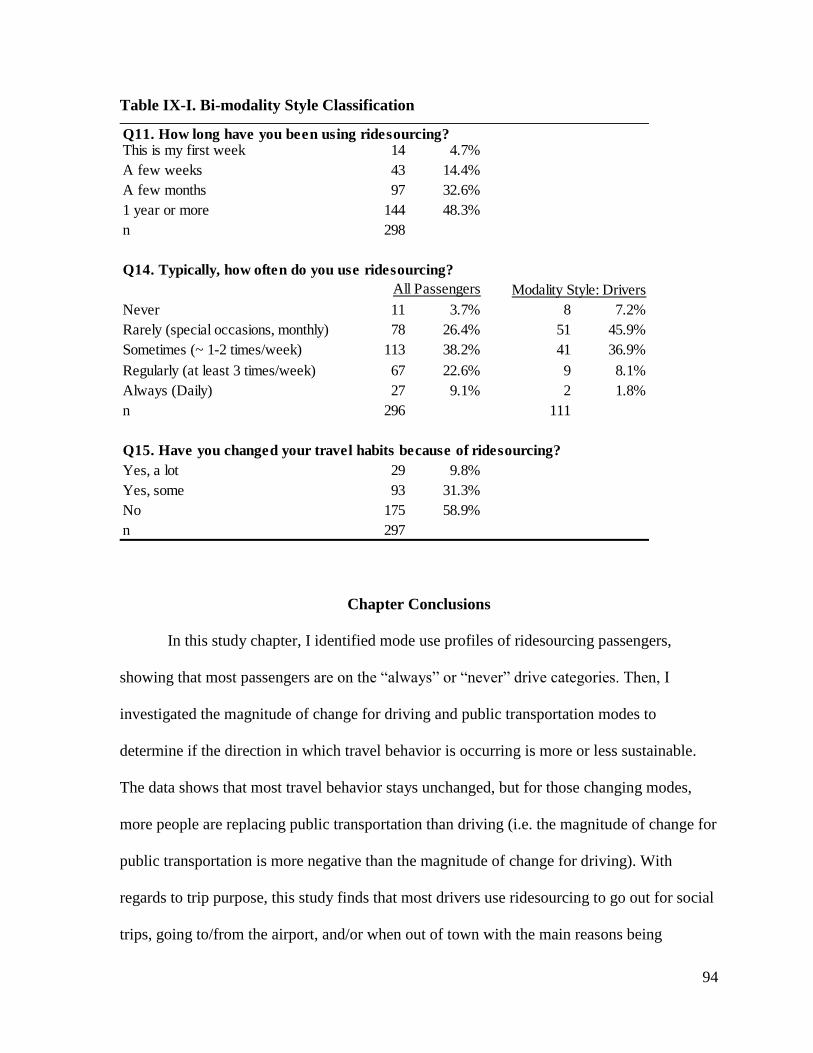
94
Table IX-I. Bi-modality Style Classification
Chapter Conclusions
In this study chapter, I identified mode use profiles of ridesourcing passengers,
showing that most passengers are on the “always” or “never” drive categories. Then, I
investigated the magnitude of change for driving and public transportation modes to
determine if the direction in which travel behavior is occurring is more or less sustainable.
The data shows that most travel behavior stays unchanged, but for those changing modes,
more people are replacing public transportation than driving (i.e. the magnitude of change for
public transportation is more negative than the magnitude of change for driving). With
regards to trip purpose, this study finds that most drivers use ridesourcing to go out for social
trips, going to/from the airport, and/or when out of town with the main reasons being
Q11. How long have you been using ridesourcing?This is my first week 14 4.7%
A few weeks 43 14.4%
A few months 97 32.6%
1 year or more 144 48.3%
n 298
Q14. Typically, how often do you use ridesourcing?
Never 11 3.7% 8 7.2%
Rarely (special occasions, monthly) 78 26.4% 51 45.9%
Sometimes (~ 1-2 times/week) 113 38.2% 41 36.9%
Regularly (at least 3 times/week) 67 22.6% 9 8.1%
Always (Daily) 27 9.1% 2 1.8%
n 296 111
Q15. Have you changed your travel habits because of ridesourcing?
Yes, a lot 29 9.8%
Yes, some 93 31.3%
No 175 58.9%
n 297
All Passengers Modality Style: Drivers
95
“drinking alcohol” and/or “finding parking difficult”. Non-drivers are using ridesourcing
mostly to commute to work or go to school with the main reasons being “not having a car
available”, “public transportation not being available or poor service”, and “time” (e.g. in a
rush).
Finally, I conclude this chapter study identifying four modality style groups. The
existing literature identified three classifications of ridesourcing passengers: drivers,
multimodals, and non-drivers. With further analysis, I identified a fourth class, the bi-
modality style, including those that vary between two or more different modality systems
depending on the type of trip.
96
OVERALL RESULTS
The overall result section for this dissertation is divided in four main parts: results
from the driver dataset, VMT, parking, and travel behavior.
Driver Dataset
Ridesourcing Times and Distances
The overall time efficiency rate for this study, accounting for commute time at the
end of the shift, is 39.3%.
The efficiency rate in terms of WPMT versus total mileage is 59.2%. The overall
efficiency rate could be even lower since, by research design, I minimized the cruising for a
ride request, did not accept rides required long travel distances for passenger pick-up, and
used conservative commute distances at the end of shifts.
Even with this conservative rate, drivers have to travel 69 extra miles in deadheading
for every 100 miles originally from WPMT.
Ridesourcing Earnings
Including all times and distances, the gross earnings for this study equals to
$15.69/hour, which might seems like a good hourly rate, but this does not include expenses. I
estimated expenses to be between $0.28 per mile to the U.S. Federal Standard 2016 mileage
rate of $0.54 per mile, so in reality, ridesourcing drivers make between $5.38 and $10.36 per
hour, with an average of $7.94/hr (including tips).
Uber net earnings is slightly higher that Lyft earnings but completely change when
tips are taking into account. Lyft tips in net earning equates to a 29.1% increase. Uber could
97
easily add a tipping option on their app to allow passengers add a tip in their credit card bill if
they wish; this choice would increase drivers’ earnings, but Uber has thus far refused to
implement this option.
VMT
Ridesourcing provides more mobility (12.2% of passengers stated that they “wouldn’t
have traveled”) but affects the efficiency of transporting passenger versus vehicles going
from a PMT/VMT efficiency of 112.3% to 60.8%.
Overall, ridesourcing increases VMT by 185%, which has significant implications for
our cities in terms of congestion and environmental concerns.
If the results for this dissertation held true for the entire country, the VMT impact of
ridesourcing would be around 5.5 billion extra miles per year in the U.S. We need more
empirical studies that would help understand the magnitude of VMT impact.
Parking
Ridesourcing allows parking supply to decrease. At the same time, many passengers
stated that parking is one of the main reasons for passengers with high drive frequency to use
ridesourcing instead of driving. Continuing with this cycle of reducing parking supply will
help decrease car dependency.
Travel Behavior
Based on modality style, I identified four groups of modality styles for ridesourcing
users: drivers, multimodals, non-drivers, and bi-modal style based on trip purpose.
For typical drivers, ridesourcing is mostly replacing social trips (e.g. go out), to/from
airport, and when out of town. Drivers stated drinking/avoid driving and parking as the main

98
reasons not to drive. For typical non-drivers, ridesourcing is replacing work and school trips
with the main reason being that public transportation is not available.

99
SUMMARY CONCLUSIONS AND FUTURE WORK
Ridesourcing has quickly become a very popular service that is successfully
competing and interacting with other modes of transportation. This dissertation had several
objectives in mind. First, this dissertation established a data collection methodology and
gathered ridesourcing data to investigate ridesourcing impacts. Then, the dissertation
measured ridesourcing efficiency in terms of times and distances (VMT and PMT), and
evaluated VMT impacts of ridesourcing by analyzing before-and-after scenarios. After
investigating the labor market economy for ridesourcing drivers, I investigated parking
impacts and opportunities to calibrate parking generation rates and reduce car dependency.
Finally, this dissertation explored travel behavior and its implications on future travel
demand models.
I hope this research helps cities and transportation organizations better understand the
impacts of ridesourcing on several aspects of transportation. For example, transit agencies
that are contemplating removal of bus services in certain areas can use these results – in
terms of ridership and PMT/VMT efficiency – to help them look at the issue in more detail.
This will help inform them as to what they gain or lose in terms of replacing or connecting
transit with ridesourcing. As this dissertation shows, transportation officials also need to be
cautious regarding the positive and negative outcomes of ridesourcing. One of the most
important results from this dissertation is the realization that ridesourcing in the current form
is only more efficient in terms of transportation passengers with VMT than two other modes,
taxis and if getting a ride. We might think that shifting all drivers to ridesourcing would be a
positive change, but in reality, that might not be the case. For example, a driver needing to go

100
five miles to his/her destination would put in the transportation system five miles (5 VMT); if
that same person is taking a Lyft or Uber instead, he/she would be still move five miles, but
the ridesourcing driver would be adding approximately nine miles (9 VMT) to the
transportation system. This is even worse if walking or bicycling are the replaced modes
since such modes do not add VMT to the transportation system. Ridesourcing efficiency is
even worse with shorter trips since a driver might be circulating and driving a few miles – for
example 3 or 4 miles – only to be transporting a passenger for a shorter distance – for
example 1 or 2 miles –. The same occurs with public transportation and carpooling, modes
that are more efficient than ridesourcing.
Looking at the positive aspects, ridesourcing provides a positive utility to many
costumers by increasing their mobility and/or ease of mind when it comes to avoid drinking
and driving and resolving parking. Concerning parking, ridesourcing decreases the need for
parking supply. At the same time, many passengers stated that parking is one of the main
reasons to use ridesourcing instead of driving. Continuing this positive cycle would help
decrease car dependency.
Potential positive effects into reducing VMT and increasing ridesourcing efficiency
may come with newer services such as LyftLine and UberPool, which are true ridesharing
platforms; thus far, these services has not been proven to be effective. Passengers that use
these services are usually less car-dependent and multimodal compared to the general
population. New members willing to try these service might be only doing so for two
reasons; one, that the ride is way below the regular cost; and two, that the probability of
finding a match during the ride is low. Academic research has mathematically proven using
algorithms that on-demand high-capacity ride-sharing is doable and provides positive effects

101
in terms of efficiency (Alonso-Mora, Samaranayake, Wallar, Frazzoli, & Rus, 2017), but we
need more research on travel behavior and social sciences to determine the willingness to
share in our cities. This conversation will become more relevant with autonomous vehicles
coming in the near future. The other issue with LyftLine and UberPool is that drivers make
even lower wages with these services since they spent more time picking up and dropping off
several customers.
This study does not come without limitations. The main limitation is the trip sample
size relative to the overall number of rides these companies provide. Doing the data
collection by myself is also both a limitation and an advantage. It is a limitation because I am
not taking into account different driver strategies but an advantage since I was able to control
the amount of driving and design the research with conservative estimations. However, we
need more empirical studies like this one to gather independent datasets and help narrow
down the numbers calculated in this dissertation. At the same time, the transportation sector
should demand that ridesourcing companies share data in order to operate in our cities.
I plan to continue doing ridesourcing research as it relates to travel demand models.
Modelers need these types of data to include newer services in their travel demand plans, as
well as calibrate better inputs for newer services such as autonomous vehicles.
This research starts to fill several gaps in the literature regarding ridesourcing
services. My ultimate goal is to help cities and transportation organizations better account for
the impacts of technology and evolving transportation services in their policies, planning, and
engineering processes. I would also hope to contribute to the conversation on how
ridesourcing companies can help better achieve sustainable transportation goals including

102
more VMT efficiency, better interconnectivity and integration with active modes of
transportation, equity, and safety for both users and drivers.

103
REFERENCES
AAA. (2015). Your Driving Costs: How much are you really paying to drive?
http://exchange.aaa.com/wp-content/uploads/2015/04/Your-Driving-Costs-
2015.pdf
Alonso-Mora, J., Samaranayake, S., Wallar, A., Frazzoli, E., & Rus, D. (2017). On-demand
high-capacity ride-sharing via dynamic trip-vehicle assignment. Proceedings
of the National Academy of Sciences. doi: 10.1073/pnas.1611675114
Anderson, D. N. (2014). “Not just a taxi”? For-profit ridesharing, driver strategies, and VMT.
Transportation, 41(5), 1099-1117. doi: 10.1007/s11116-014-9531-8
Bialick, A. (2015a). Lyft and Uber Won’t Release Data to Shed Light on How They Affect
Traffic. StreetsBlogSF.
Bialick, A. (2015b). New Data Shows Most Trips in SF Are Made Without a Private
Automobile. StreetsBlobSF. Retrieved from
http://sf.streetsblog.org/2015/02/03/new-data-shows-most-trips-in-sf-are-
made-without-a-private-automobile/
Bialik, C., Flowers, A., Fischer-Baum, R., & Mehta, D. (2015). Uber Is Serving New York’s
Outer Boroughs More Than Taxis Are. FiveThirtyEight. Retrieved from
FiveThirtyEight website: https://fivethirtyeight.com/features/uber-is-serving-
new-yorks-outer-boroughs-more-than-taxis-are/
Buhr, S. (2016). Lyft picked up 17 million rides in October, up more than twice that amount
from last year. Techcrunch.
Cali Cómo Vamos. (2015). Encuesta de Percepción Ciudadana - Movilidad.
Cervero, R. (2003). City CarShare: First-Year Travel Demand Impacts. Transportation
Research Record: Journal of the Transportation Research Board, 1839, 159-
166. doi: doi:10.3141/1839-18
Cervero, R., Golub, A., & Nee, B. (2007). City CarShare: Longer-Term Travel Demand and
Car Ownership Impacts. Transportation Research Record: Journal of the
Transportation Research Board, 1992, 70-80. doi: doi:10.3141/1992-09
Cervero, R., & Tsai, Y. (2004). City CarShare in San Francisco, California: Second-Year
Travel Demand and Car Ownership Impacts. Transportation Research
Record: Journal of the Transportation Research Board, 1887, 117-127. doi:
doi:10.3141/1887-14

104
Choo, S., & Mokhtarian, P. L. (2004). What type of vehicle do people drive? The role of
attitude and lifestyle in influencing vehicle type choice. Transportation
Research Part A: Policy and Practice, 38(3), 201-222. doi:
http://dx.doi.org/10.1016/j.tra.2003.10.005
Cramer, J., & Krueger, A. B. (2016). Disruptive change in the taxi business: The case of
Uber. The American Economic Review, 106(5), 177-182.
DuPuis, N., Martin, C., & Rainwater, B. (2015). City of the Future: Technology & Mobility:
National League of Cities.
Firnkorn, J. (2012). Triangulation of two methods measuring the impacts of a free-floating
carsharing system in Germany. Transportation Research Part A: Policy and
Practice, 46(10), 1654-1672. doi: http://dx.doi.org/10.1016/j.tra.2012.08.003
Fischer-Baum, R., & Bialik, C. (2015). Uber Is Taking Millions Of Manhattan Rides Away
From Taxis. FiveThirtyEight. Retrieved from FiveThirtyEight website:
http://fivethirtyeight.com/features/uber-is-taking-millions-of-manhattan-rides-
away-from-taxis/
Flegenheimer, M., & Fitzsimmons, E. (2015). City Hall and Uber Clash in Struggle Over
New York Streets. The New York Times. Retrieved from
http://www.nytimes.com/2015/07/17/nyregion/city-hall-and-uber-clash-in-
struggle-over-new-york-streets.html
Giddens, A. (1991). Modernity and self-identity: Self and society in the late modern age:
Stanford University Press.
Goddin, P. (2014). Redefining Uber: Why the Term Rideshare Doesn’t Fit. Retrieved from
Mobility Lab website: http://mobilitylab.org/2014/04/17/redefining-uber-why-
the-term-rideshare-doesnt-fit/
Grabar, H. (2016). "They Can Just Take an Uber". Slate.
Graham-Rowe, E., Skippon, S., Gardner, B., & Abraham, C. (2011). Can we reduce car use
and, if so, how? A review of available evidence. Transportation Research
Part A: Policy and Practice, 45(5), 401-418. doi:
http://dx.doi.org/10.1016/j.tra.2011.02.001
Hall, J. V., & Krueger, A. B. (2015). An Analysis of the Labor Market for Uber’s Driver-
Partners in the United States. Princeton University Industrial Relations
Section Working Paper, 587.
Handy, S., Cao, X., & Mokhtarian, P. (2005). Correlation or causality between the built
environment and travel behavior? Evidence from Northern California.
Transportation Research Part D: Transport and Environment, 10(6), 427-
444. doi: http://dx.doi.org/10.1016/j.trd.2005.05.002

105
Henao, A., & Marshall, W. (2017). A Framework for Understanding the Impacts of
Ridesourcing on Transportation. In G. Meyer & S. Shaheen (Eds.), Disrupting
Mobility: Impacts of Sharing Economy and Innovative Transportation on
Cities (pp. 197-209). Cham: Springer International Publishing.
Henao, A., & Marshall, W. E. (in press). Lyft/Uber Driver Perspective: Travel Distances,
Times, and Earnings Transportation Research Board, 2016.
Henao, A., Piatkowski, D., Luckey, K. S., Nordback, K., Marshall, W. E., & Krizek, K. J.
(2015). Sustainable transportation infrastructure investments and mode share
changes: A 20-year background of Boulder, Colorado. Transport Policy, 37,
64-71. doi: http://dx.doi.org/10.1016/j.tranpol.2014.09.012
Jones, R. G. (2015). Uber Can't Really Prove That It's Caused A Reduction In Drunk Driving
Accidents. Huffington Post. Retrieved from Huffington Post website:
http://www.huffingtonpost.com/2015/02/04/uber-drunk-driving-
study_n_6612106.html
Kaffashi, S., Shamsudin, M. N., Clark, M. S., Sidique, S. F., Bazrbachi, A., Radam, A., . . .
Rahim, K. A. (2016). Are Malaysians eager to use their cars less? Forecasting
mode choice behaviors under new policies. Land Use Policy, 56, 274-290.
doi: http://dx.doi.org/10.1016/j.landusepol.2016.05.005
Kamakura, W. A., & Russell, G. J. (1989). A Probabilistic Choice Model for Market
Segmentation and Elasticity Structure. Journal of Marketing Research, 26(4),
379-390. doi: 10.2307/3172759
Kitamura, R. (2009). Life-style and travel demand. Transportation, 36(6), 679-710. doi:
10.1007/s11116-009-9244-6
Kitamura, R., Mokhtarian, P., & Laidet, L. (1997). A micro-analysis of land use and travel in
five neighborhoods in the San Francisco Bay Area. Transportation, 24(2),
125-158. doi: 10.1023/A:1017959825565
Kokalitcheva, K. (2016). Lyft Will Complete 17 Million U.S. Rides This Month. Fortune.
Retrieved from http://fortune.com/2016/10/25/lyft-17-million-rides/
Kopp, J., Gerike, R., & Axhausen, K. (2013). Status quo and perspectives for car-sharing
systems: the example of DriveNow. Strategies for Sustainable Mobilities:
Opportunities and Challenges, 207-226.
Kopp, J., Gerike, R., & Axhausen, K. (2015). Do sharing people behave differently? An
empirical evaluation of the distinctive mobility patterns of free-floating car-
sharing members. Transportation, 42(3), 449-469. doi: 10.1007/s11116-015-
9606-1
106
Krizek, K., & Waddell, P. (2002). Analysis of Lifestyle Choices: Neighborhood Type, Travel
Patterns, and Activity Participation. Transportation Research Record: Journal
of the Transportation Research Board, 1807, 119-128. doi: doi:10.3141/1807-
15
Lane, C. (2005). PhillyCarShare: First-Year Social and Mobility Impacts of Carsharing in
Philadelphia, Pennsylvania. Transportation Research Record: Journal of the
Transportation Research Board, 1927, 158-166. doi: doi:10.3141/1927-18
Lawler, R. (2014). Lyft-Off: Zimride’s Long Road To Overnight Success. TechCrunch.
Retrieved from https://techcrunch.com/2014/08/29/6000-words-about-a-pink-
mustache/
Le Vine, S., Adamou, O., & Polak, J. (2014). Predicting new forms of activity/mobility
patterns enabled by shared-mobility services through a needs-based stated-
response method: Case study of grocery shopping. Transport Policy, 32, 60-
68. doi: http://dx.doi.org/10.1016/j.tranpol.2013.12.008
Le Vine, S., Lee-Gosselin, M., Sivakumar, A., & Polak, J. (2014). A new approach to predict
the market and impacts of round-trip and point-to-point carsharing systems:
Case study of London. Transportation Research Part D: Transport and
Environment, 32, 218-229. doi: http://dx.doi.org/10.1016/j.trd.2014.07.005
Levitt, S. (2016, September 07). H. Huggins. (Producer). Why Uber Is an Economist’s
Dream [Podcast]. Retrieved from http://freakonomics.com/podcast
Lyft Blog. (2016). Five Days. Six Cities. A Lyft Line First. Retrieved from
http://blog.lyft.com/posts/six-cities-five-days
MacMillan, D. (2013, Nov 25, 2013). Uber Cuts Deals to Lower Car Costs. The Wall Street
Journal. Retrieved from http://blogs.wsj.com/digits/2013/11/25/uber-cuts-
deals-to-lower-car-costs/
Marshall, W. E., & Henao, A. (2015). The Shock Heard Round the Suburbs. Transportation
Research Record: Journal of the Transportation Research Board, 2531, 63-
75. doi: 10.3141/2531-08
Martin, E., & Shaheen, S. (2011). The Impact of Carsharing on Public Transit and Non-
Motorized Travel: An Exploration of North American Carsharing Survey
Data. Energies, 4(11), 2094.
Martin, E., Shaheen, S., & Lidicker, J. (2010). Impact of Carsharing on Household Vehicle
Holdings. Transportation Research Record: Journal of the Transportation
Research Board, 2143, 150-158. doi: doi:10.3141/2143-19
Martin, E. W., & Shaheen, S. A. (2011). Greenhouse Gas Emission Impacts of Carsharing in
North America. Intelligent Transportation Systems, IEEE Transactions on,
12(4), 1074-1086. doi: 10.1109/TITS.2011.2158539

107
McAlone, N. (2015). Here's how Uber got its start and grew to become the most valuable
startup in the world. Business Insider. Retrieved from
http://www.businessinsider.com/history-of-uber-and-its-rise-to-become-the-
most-valuable-startup-in-the-world-2015-9
Meijkamp, R. (1998). Changing consumer behaviour through eco-efficient services: an
empirical study of car sharing in the Netherlands. Business Strategy and the
Environment, 7(4), 234-244. doi: 10.1002/(SICI)1099-
0836(199809)7:4<234::AID-BSE159>3.0.CO;2-A
Murphy, C. (2016). Shared Mobility and the Transformation of Public Transit (pp. 39p):
Shared-Use Mobility Center.
O'Donovan, C., & Singer-Vine, J. (2016). How Much Uber Drivers Actually Make Per Hour.
BuzzFeedNews. Retrieved from
https://www.buzzfeed.com/carolineodonovan/internal-uber-driver-pay-
numbers?utm_term=.pl7eWrK0w#.km2W9aYR3
Pas, E. (1988). Weekly travel-activity behavior. Transportation, 15(1-2), 89-109. doi:
10.1007/BF00167982
Rayle, L., Dai, D., Chan, N., Cervero, R., & Shaheen, S. (2016). Just a better taxi? A survey-
based comparison of taxis, transit, and ridesourcing services in San Francisco.
Transport Policy, 45, 168-178. doi:
http://dx.doi.org/10.1016/j.tranpol.2015.10.004
Rodriguez, J. F. (2016). SF blasts Uber, Lyft for downtown traffic congestion. Retrieved
from: http://www.sfexaminer.com/sf-blasts-uber-lyft-downtown-traffic-
congestion/
Salomon, B. (2016). Lyft: We're Closing In On Uber With A 'Path To Profitability'. Forbes.
Salomon, I., & Ben-Akiva, M. (1983). The Use of the Life-Style Concept in Travel Demand
Models. Environment and Planning A, 15(5), 623-638. doi: 10.1068/a150623
Salonen, M., & Toivonen, T. (2013). Modelling travel time in urban networks: comparable
measures for private car and public transport. Journal of Transport
Geography, 31(0), 143-153. doi:
http://dx.doi.org/10.1016/j.jtrangeo.2013.06.011
Shaheen, S., & Cohen, A. (2007). Growth in Worldwide Carsharing: An International
Comparison. Transportation Research Record: Journal of the Transportation
Research Board, 1992, 81-89. doi: doi:10.3141/1992-10
Shaheen, S., & Cohen, A. (2012). Carsharing and Personal Vehicle Services: Worldwide
Market Developments and Emerging Trends. International Journal of
Sustainable Transportation, 7(1), 5-34. doi: 10.1080/15568318.2012.660103

108
Shaheen, S., Guzman, S., & Zhang, H. (2010). Bikesharing in Europe, the Americas, and
Asia. Transportation Research Record: Journal of the Transportation
Research Board, 2143, 159-167. doi: doi:10.3141/2143-20
Shaheen, S. A., Cohen, A. P., & Chung, M. S. (2009). North American Carsharing: 10-Year
Retrospective. Transportation Research Record: Journal of the
Transportation Research Board(2110), pp 25-44.
Shoup, D. C. (2006). Cruising for parking. Transport Policy, 13(6), 479-486. doi:
http://dx.doi.org/10.1016/j.tranpol.2006.05.005
Silver, N., & Fischer-Baum, R. (2015). Public Transit Should Be Uber’s New Best Friend.
FiveThirtyEight. Retrieved from FiveThirtyEight website:
http://fivethirtyeight.com/features/public-transit-should-be-ubers-new-best-
friend/
Sioui, L., Morency, C., & Trépanier, M. (2012). How Carsharing Affects the Travel Behavior
of Households: A Case Study of Montréal, Canada. International Journal of
Sustainable Transportation, 7(1), 52-69. doi: 10.1080/15568318.2012.660109
Somerville, H. (2016). Here's How Many Rides Uber Has Given to Date. Money.
Steele, K. (2010). Bicycling and Walking in the United States: 2010 Benchmarking Report
(pp. 196p). Washington, D.C.: Alliance for Biking & Walking.
Steininger, K., Vogl, C., & Zettl, R. (1996). Car-sharing organizations: The size of the
market segment and revealed change in mobility behavior. Transport Policy,
3(4), 177-185. doi: http://dx.doi.org/10.1016/S0967-070X(96)00024-8
Stopher, P. R., & Greaves, S. P. (2007). Household travel surveys: Where are we going?
Transportation Research Part A: Policy and Practice, 41(5), 367-381. doi:
http://dx.doi.org/10.1016/j.tra.2006.09.005
Truong, L., & Marshall, W. (2014). Are Park-and-Rides Saving the Environment or Just
Saving Parking Costs? Transportation Research Record: Journal of the
Transportation Research Board, 2419, 109-117. doi: 10.3141/2419-11
U.S. Census Bureau. (2015). 2011-2015 American Community Survey 5-Year Estimates.
Retrieved Jan 01, 2017
Uber Newsroom. (2014). Announcing UberPool. Retrieved from
https://newsroom.uber.com/announcing-uberpool/
Uber Newsroom. (2016). uberPOOL: Share your ride and save. Retrieved from
https://www.uber.com/ride/uberpool/
109
Vaccaro, A. (2016, December 05). Highly touted Boston-Uber partnership has not lived up to
hype so far. Boston.com. Retrieved from
http://www.boston.com/news/business/2016/06/16/bostons-uber-partnership-
has-not-lived-up-to-promise
Vij, A., Carrel, A., & Walker, J. L. (2013). Incorporating the influence of latent modal
preferences on travel mode choice behavior. Transportation Research Part A:
Policy and Practice, 54, 164-178. doi:
http://dx.doi.org/10.1016/j.tra.2013.07.008
Vredin Johansson, M., Heldt, T., & Johansson, P. (2006). The effects of attitudes and
personality traits on mode choice. Transportation Research Part A: Policy
and Practice, 40(6), 507-525. doi: http://dx.doi.org/10.1016/j.tra.2005.09.001
Vuong, A. (2014). Colorado first to authorize Lyft and Uber’s ridesharing services.
DenverPost. Retrieved from
http://www.denverpost.com/2014/06/05/colorado-first-to-authorize-lyft-and-
ubers-ridesharing-services/
Walker, J. L., & Ben-Akiva, M. (2011). Advances in discrete choice: mixture models. A
Handbook of Transport Economics, 160.
Warzel, C. (2015). Let’s All Join The AP Stylebook In Killing The Term “Ride-Sharing”.
Retrieved from Buzzfeed News website:
http://www.buzzfeed.com/charliewarzel/lets-all-join-the-ap-stylebook-in-
killing-the-term-ride-shar#.chRy8o4py
Related Documents


