ADVANCES IN ATMOSPHERIC SCIENCES, VOL. 25, NO. 6, 2008, 960–973 Impacts of Global Warming on Hydrological Cycles in the Asian Monsoon Region Koji DAIRAKU ∗ 1 , Seita EMORI 2 , and Toru NOZAWA 3 1 Storm, Flood, and Landslide Research Department, National Research Institute for Earth Science and Disaster Prevention, Tsukuba, Japan 2 Climate Risk Assessment Research Section, Center for Global Environmental Research, National Institute for Environmental Studies, Tsukuba, Japan 3 Atmospheric Physics Section, Atmospheric Environment Division, National Institute for Environmental Studies, Tsukuba, Japan (Received 16 May 2007; revised 3 March 2008) ABSTRACT The hydrologic changes and the impact of these changes constitute a fundamental global-warming- related concern. Faced with threats to human life and natural ecosystems, such as droughts, floods, and soil erosion, water resource planners must increasingly make future risk assessments. Though hydrological predictions associated with the global climate change are already being performed, mainly through the use of GCMs, coarse spatial resolutions and uncertain physical processes limit the representation of terrestrial water/energy interactions and the variability in such systems as the Asian monsoon. Despite numerous studies, the regional responses of hydrologic changes resulting from climate change remains inconclusive. In this paper, an attempt at dynamical downscaling of future hydrologic projection under global climate change in Asia is addressed. The authors conducted present and future Asian regional climate simulations which were nested in the results of Atmospheric General Circulation Model (AGCM) experiments. The regional climate model could capture the general simulated features of the AGCM. Also, some regional phenomena such as orographic precipitation, which did not appear in the outcome of the AGCM simulation, were successfully produced. Under global warming, the increase of water vapor associated with the warmed air temperature was projected. It was projected to bring more abundant water vapor to the southern portions of India and the Bay of Bengal, and to enhance precipitation especially over the mountainous regions, the western part of India and the southern edge of the Tibetan Plateau. As a result of the changes in the synoptic flow patterns and precipitation under global warming, the increases of annual mean precipitation and surface runoff were projected in many regions of Asia. However, both the positive and negative changes of seasonal surface runoff were projected in some regions which will increase the flood risk and cause a mismatch between water demand and water availability in the agricultural season. Key words: hydrologic change, dynamical downscaling, regional climate model, Asian monsoon region Citation: Dairaku, K., S. Emori, and T. Nozawa, 2008: Impacts of global warming on hydrological cycles in the Asian monsoon region. Adv. Atmos. Sci., 25(6), 960–973, doi: 10.1007/s00376-008-0960-1. 1. Introduction The hydrologic cycle is vital to human life and nat- ural ecosystems. It has complex interactions within the climate system, and it also has an important role in regulating climate stability and variability. The industrial transformation and human activities may influence the hydrological cycle globally and region- ally. The compelling evidence of the attribution of hu- man activities to the hydrologic change and variability has not yet been provided systematically. Faced with threats to human life and natural ecosystems, such as ∗ Corresponding author: Koji DAIRAKU, [email protected]

Welcome message from author
This document is posted to help you gain knowledge. Please leave a comment to let me know what you think about it! Share it to your friends and learn new things together.
Transcript
ADVANCES IN ATMOSPHERIC SCIENCES, VOL. 25, NO. 6, 2008, 960–973
Impacts of Global Warming on Hydrological
Cycles in the Asian Monsoon Region
Koji DAIRAKU∗1, Seita EMORI2, and Toru NOZAWA3
1Storm, Flood, and Landslide Research Department, National Research Institute
for Earth Science and Disaster Prevention, Tsukuba, Japan
2Climate Risk Assessment Research Section, Center for Global Environmental Research,
National Institute for Environmental Studies, Tsukuba, Japan
3Atmospheric Physics Section, Atmospheric Environment Division,
National Institute for Environmental Studies, Tsukuba, Japan
(Received 16 May 2007; revised 3 March 2008)
ABSTRACT
The hydrologic changes and the impact of these changes constitute a fundamental global-warming-related concern. Faced with threats to human life and natural ecosystems, such as droughts, floods, andsoil erosion, water resource planners must increasingly make future risk assessments. Though hydrologicalpredictions associated with the global climate change are already being performed, mainly through the useof GCMs, coarse spatial resolutions and uncertain physical processes limit the representation of terrestrialwater/energy interactions and the variability in such systems as the Asian monsoon. Despite numerousstudies, the regional responses of hydrologic changes resulting from climate change remains inconclusive. Inthis paper, an attempt at dynamical downscaling of future hydrologic projection under global climate changein Asia is addressed. The authors conducted present and future Asian regional climate simulations whichwere nested in the results of Atmospheric General Circulation Model (AGCM) experiments. The regionalclimate model could capture the general simulated features of the AGCM. Also, some regional phenomenasuch as orographic precipitation, which did not appear in the outcome of the AGCM simulation, weresuccessfully produced. Under global warming, the increase of water vapor associated with the warmed airtemperature was projected. It was projected to bring more abundant water vapor to the southern portionsof India and the Bay of Bengal, and to enhance precipitation especially over the mountainous regions, thewestern part of India and the southern edge of the Tibetan Plateau. As a result of the changes in thesynoptic flow patterns and precipitation under global warming, the increases of annual mean precipitationand surface runoff were projected in many regions of Asia. However, both the positive and negative changesof seasonal surface runoff were projected in some regions which will increase the flood risk and cause amismatch between water demand and water availability in the agricultural season.
Key words: hydrologic change, dynamical downscaling, regional climate model, Asian monsoon region
Citation: Dairaku, K., S. Emori, and T. Nozawa, 2008: Impacts of global warming on hydrological cyclesin the Asian monsoon region. Adv. Atmos. Sci., 25(6), 960–973, doi: 10.1007/s00376-008-0960-1.
1. Introduction
The hydrologic cycle is vital to human life and nat-ural ecosystems. It has complex interactions withinthe climate system, and it also has an important rolein regulating climate stability and variability. The
industrial transformation and human activities mayinfluence the hydrological cycle globally and region-ally. The compelling evidence of the attribution of hu-man activities to the hydrologic change and variabilityhas not yet been provided systematically. Faced withthreats to human life and natural ecosystems, such as
∗Corresponding author: Koji DAIRAKU, [email protected]
NO. 6 DAIRAKU ET AL. 961
droughts, floods, and soil erosion, water resource plan-ners must increasingly make future risk assessments(Schnur, 2002). Historically, stable climatic conditionshave been assumed for water resource management,planning, and civil engineering designs. However,global climate changes may lead to changes in rain-fall events by an enhancement of atmospheric moisturecontent (Palmer and Ralsanen, 2002). Therefore, thehydrologic changes and the impact of these changesconstitute a fundamental global-warming-related con-cern.
Floods and droughts caused by Asian monsoons af-fect agriculture, water resources, and the economies ofmany Asian countries where billions of people live andwhich are characterized by diverse geography. Dairakuand Emori (2006) suggest that the changes in theAsian summer monsoon resulting from climate changewill especially affect the hydrological components suchas extreme precipitation. Societies in Monsoon Asiamust urgently learn how to adapt to climate changesand cope with the large variability of the Asian mon-soons. Is the Asian monsoon system resilient to theanthropogenic transformation of land, water, and air?The importance of the coupled human and environ-ment system in the Asian monsoon region is raised asa key question by the Monsoon Asia Integrated Re-gional Study (MAIRS; Fu et al., 2006). To controlwater resources in the face of drought, flood, and soilerosion, which frequently present a serious threat tohuman life and natural ecosystems, predictions andrisk assessments are being required more frequentlyby policy makers.
Hydrologic predictions that account for global cli-mate changes mainly use GCMs (Coe, 2000; Kosteret al., 2000; Vorosmarty et al., 2000; Palmer andRalsanen, 2002; Milly et al., 2002). Despite nu-merous studies, the regional responses of hydrologicchanges (atmosphere-ocean-land interactions, precip-itation, and extreme events such as droughts andfloods) resulting from climate change remain unclearand have many uncertain factors (e.g., model uncer-tainties, large amplitude of natural variability and an-thropogenic influences such as black carbon, deforesta-tion, and irrigation).
One of the approaches dealing with these uncertaininputs and processes in climate prediction is to useensemble projections that produce predictions in theform of the probability (Collins, 2007). However, thisapproach is very expensive computationally and can-not deal with the uncertainty associated with spatialresolutions. Though detailed information for regionalareas is frequently required, coarse spatial resolutions(those with grid spacing of approximately 300 km)and uncertain physical processes particularly limit the
representation of terrestrial water/energy interactionsand the variability and extremes in such systems as theAsian monsoon. Therefore only a very restricted num-ber of regional-scale estimates are available to plan-ners.
To solve this problem, downscaling methods areemployed to produce finer scale information fromGCMs with coarse spatial resolution. Two kindsof methods are usually employed. One is statis-tical downscaling, which estimates local scale vari-ables (e.g., precipitation, temperature, and wind) fromGCMs usually based on statistical relationships be-tween synoptic-scale conditions and local-scale vari-ables. Another is dynamical downscaling, which isusually achieved by a high-resolution regional climatemodel (RCM).
The model is conducted in a limited region anddriven by lateral boundary conditions obtained fromGCMs (so-called nesting). Therefore, the RCM isstrongly controlled by the imposed lateral boundariesthat bring large-scale circulations down into the RCMdomain. Therefore, it is strongly desired that theboundary conditions are as accurate as possible andthe simulated synoptic circulations of RCM should notbe greatly different from those of the GCM.
Mesoscale atmospheric systems can be catego-rized into two groups. The first group is surfaceinhomogeneities-induced mesoscale systems such assea and land breezes, mountain valley winds, urbancirculations, and forced airflow over rough terrain.The second group is synoptically-induced mesoscalesystems such as fronts, squall lines, and hurricanes(Pielke et al., 2002). Because of the higher resolution,the RCM is expected to have the advantage of higheraccuracy and the ability to “add value” in small-scalefeatures not well represented by the GCM (Castro etal., 2005).
Surface boundary forcing, such as topography, isthe dominant factor for generating small-scale atmo-spheric variability (Wang et al., 2004), therefore ahigher resolution simulation by the RCM is expectedto be able to improve the regional circulation patternand produce realistic intensities and frequencies formesoscale features, such as orographic precipitationresulting from realistic topography. These mesoscalefeatures can be considered as a boundary value prob-lem.
On the other hand, the synoptically inducedmesoscale systems are not necessarily improved by ahigher resolution simulation by the RCM. As men-tioned above, it is necessary that the boundary con-ditions are as accurate as possible. And also, theadequate representation of physical processes may benecessary. Therefore, model physics has been an im-

962 IMPACTS OF GLOBAL WARMING ON HYDROLOGICAL CYCLES IN ASIA VOL. 25
portant issue. One of the strategies in the dynamicaldownscaling by the RCM is to have a “physics compat-ibility” with the host GCM. That is, the full physicsin the GCM used to provide driving conditions for theRCM is implemented in the RCM. The physics com-patibility between the RCM and the host GCM en-ables the interpretation of the downscaled results tobe relatively simple. However, because a physical pa-rameterization such as a cumulus convection schemecan have a significant sensitivity to horizontal reso-lution, physics schemes developed and tuned for theGCM with coarse horizontal resolution may not beadequate for the nested RCM with the high horizontalresolutions (Giorgi and Mearns, 1999).
In this paper, an attempt of the dynamical down-scaling using an RCM having a fully compatiblephysics schemes with the host GCM is addressed.Also, the influences of anthropogenic activities on themaintenance and variability of regional hydrologicalcycles in the Asian monsoon region were investigatedunder global climate change.
2. Model and experiments
The model physics in RCMs are a matter of greatconcern. The differences in the physics parameteriza-tions between an RCM and the host GCM to drive theRCM can often indicate different behaviors becausethe different physics schemes might cause spurious cir-culations in the nested interior domain. In addition,similar behaviors obtained from different models canresult from different causes (Takayabu et al., 2007).Thereby, the interpretation of the downscaled resultscan be quite difficult. The physics compatibility be-tween the RCM and the GCM may have the advantagein the interpretation of the results (Giorgi and Mearns,1999).
We developed a regional climate model based onthe strategy to maximize the physics compatibility be-tween the nested RCM and the host GCM as muchas possible. A regional climate model was devel-oped, NIES-RAMS (Emori et al., 2001), which is basedon a three-dimensional nonhydrostatic compressibledynamic-equations model (RAMS: Regional Atmo-spheric Modeling System) developed at Colorado StateUniversity (Pielke et al., 1992). For dynamical down-scaling using an RCM, which has consistency with theGCM schemes, the full physics of the CCSR/NIESAGCM (Numaguti et al., 1997), Arakawa-Schubertcumulus parameterization (Arakawa and Schubert,1974), large-scale condensation scheme, a radiationscheme based on the two-steam k-distribution method(Nakajima et al., 2000), the Mellor-Yamada level 2.0turbulence scheme (Mellor and Yamada, 1974, 1982),
and the soil and vegetation model (MATSIRO: Mini-mal Advanced Treatments of Surface Interaction andRunOff) developed by Takata et al. (2003) are imple-mented within the RAMS framework.
The present (1981–1990) and future (2041–2050)Asian regional climates were simulated by the NIES-RAMS nested in the CCSR/NIES AGCM experimentresults (6 hourly), whose horizontal resolution is T42spectral truncation (about 2.8◦ in each grid). The pre-sumed future climate projection is based on the IPCCSRES-A2 scenario. The present climate was also sim-ulated by the RCM driven by the ECMWF objectivereanalysis data (ERA15, 6 hourly) whose horizontalresolution is 2.5◦. This is comparable with the RCM’ssimulation driven by the AGCM experiment to evalu-ate the RCM’s performance without the influences ofthe parent model’s bias.. In the RCM experiments,the domain is about 9600×7100 km2 and representedby 161×119 grids with a spatial resolution of 60 km.The nudging timescale of the lateral boundary is 600s, and the nudging points from the lateral boundaryare 10 grids. In the present Asian climate experiment,the observed SST and sea-ice distributions for 1981–1990 (GISST; Rayner et al., 1996) were used. In thefuture experiment, a seasonally varying “warming pat-tern”, which is derived from a transient climate changeexperiment with CCSR/NIES coupled with an ocean-atmosphere climate model, was added to the observedSST.
3. Hydrologic projection in Asia with a re-gional climate model nested in a generalcirculation model
3.1 Present regional climates
Because the RCM is driven by lateral boundaryconditions in a limited region, the simulated synopticcirculations in the RCM is strongly controlled by the
Fig. 1. Simulated region and topography.

NO. 6 DAIRAKU ET AL. 963
Fig. 2. Observed and simulated annual mean wind at 850 hPa (m s−1) for 1981–1990. By ERA15 (left),Model (right).
imposed lateral boundaries. The present (1981–1990)climates in the Asian region were simulated by theNIES-RAMS driven by the ERA15 to evaluate theperformance. In the future regional hydrological pro-jection by the dynamical downscaling approach, thesimulated results can be affected by both the lat-eral boundary conditions and the implemented modelphysics. The simulation forced by the objective re-analysis helps to interpret the influence of the modelphysics on the downscaled projected results.
Figure 2 shows the present annual mean wind at850 hPa (1981–1990) by the ERA15 and the RCM.Basically, the model could capture the general spatialpatterns of observed monsoonal flow, flows along thesub tropical high, and westerlies in the mid-high lati-tude. Though it is reasonable that the simulated windis relatively stronger than the ERA15 because of thehigher resolution of the model, monsoonal flow overEast China seems to be exaggerated by the model.
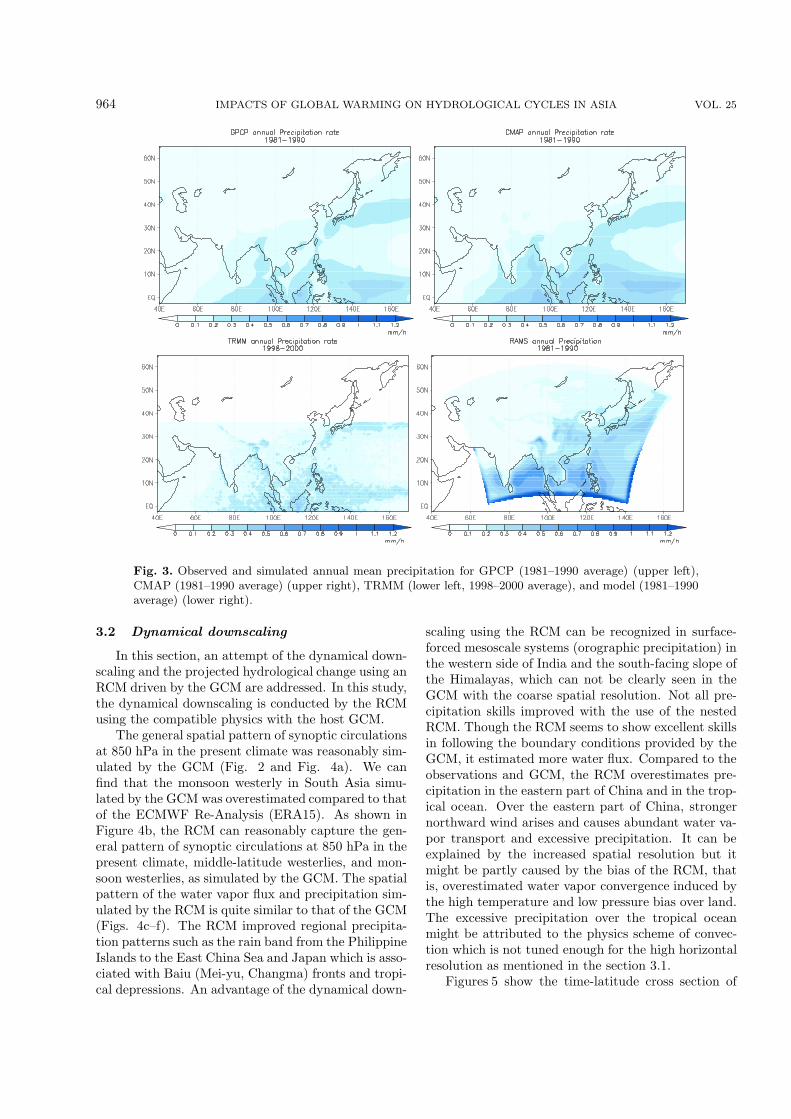
Figure 3 shows the present annual mean precipita-tion by the Global Precipitation Climatology Project(GPCP; Huffman et al., 1997), the CPC Merged Anal-ysis of Precipitation (CMAP; Xie and Arkin, 1997),the TRMM, and the RCM. The general spatial patternis relatively well simulated [e.g., annual spatial cor-relation coefficient between the CMAP (GPCP) andmodel is 0.85 (0.79)]. The model can capture thesurface-induced mesoscale precipitation system (oro-graphic precipitation) on the western side of India andthe south-facing slope of the Himalayas, which is ob-served by the TRMM, though it doesn’t appear in theCMAP and GPCP with coarse spatial resolution (1◦–2.5◦). However, the simulated precipitation over thetropical ocean and over the eastern part of China isapparently overestimated by the model.
The model bias is developed internally by themodel dynamics and physical schemes. Compared to
the objective reanalysis (ERA15) used for driving theRCM, the simulated geopotential height is 100–150 mhigher than the ERA15, the simulated sea level pres-sure is systematically lower than observation, in par-ticular over land (4 to 8 hPa), and specific humidity(0.002–0.004 kg kg−1) is higher over the eastern part ofChina (not shown). It can be speculated that the RCMhas high temperature and low pressure biases particu-larly over land. The lower pressure over land can causestronger convergence, increase water vapor, and canproduce excessive precipitation over the eastern partof China. Since we took an approach in the dynamicaldownscaling by the RCM to have a “physics compati-bility” with the host GCM, the implemented cumulusconvection scheme which is developed and tuned forthe GCM with coarse horizontal resolution may notbe adequate for the RCM and may overestimate pre-cipitation over the tropical ocean. One of the reasonsis that the presumed statistical equilibrium of the cu-mulus parameterization in a grid may not be properlyestablished with finer grid spacing. The increased la-tent heat release in the domain can induce the increaseof air temperature and thickness.
Suh and Lee (2004) used NCAR RegCM2 for anAsian summer simulation. They reported the posi-tive and negative bias of 2–4 K in temperature overNorth China and in Mongolia, and excessive precipita-tion over land, but underestimated precipitation overthe southern ocean. It is also reported that RCMsdriven by observed boundary conditions have the areaaveraged temperature biases generally within 2 K andprecipitation biases within 50% over the regional scalesof 105 to 106 km2 (c.f., our simulation region: 6.9×10⁷
km2) (IPCC, 2001). Though it is necessary to improveand tune the model used in this study, the biases inthis model are not significantly different from thosereported biases.
964 IMPACTS OF GLOBAL WARMING ON HYDROLOGICAL CYCLES IN ASIA VOL. 25
Fig. 3. Observed and simulated annual mean precipitation for GPCP (1981–1990 average) (upper left),CMAP (1981–1990 average) (upper right), TRMM (lower left, 1998–2000 average), and model (1981–1990average) (lower right).
3.2 Dynamical downscaling
In this section, an attempt of the dynamical down-scaling and the projected hydrological change using anRCM driven by the GCM are addressed. In this study,the dynamical downscaling is conducted by the RCMusing the compatible physics with the host GCM.
The general spatial pattern of synoptic circulationsat 850 hPa in the present climate was reasonably sim-ulated by the GCM (Fig. 2 and Fig. 4a). We canfind that the monsoon westerly in South Asia simu-lated by the GCM was overestimated compared to thatof the ECMWF Re-Analysis (ERA15). As shown inFigure 4b, the RCM can reasonably capture the gen-eral pattern of synoptic circulations at 850 hPa in thepresent climate, middle-latitude westerlies, and mon-soon westerlies, as simulated by the GCM. The spatialpattern of the water vapor flux and precipitation sim-ulated by the RCM is quite similar to that of the GCM(Figs. 4c–f). The RCM improved regional precipita-tion patterns such as the rain band from the PhilippineIslands to the East China Sea and Japan which is asso-ciated with Baiu (Mei-yu, Changma) fronts and tropi-cal depressions. An advantage of the dynamical down-
scaling using the RCM can be recognized in surface-forced mesoscale systems (orographic precipitation) inthe western side of India and the south-facing slope ofthe Himalayas, which can not be clearly seen in theGCM with the coarse spatial resolution. Not all pre-cipitation skills improved with the use of the nestedRCM. Though the RCM seems to show excellent skillsin following the boundary conditions provided by theGCM, it estimated more water flux. Compared to theobservations and GCM, the RCM overestimates pre-cipitation in the eastern part of China and in the trop-ical ocean. Over the eastern part of China, strongernorthward wind arises and causes abundant water va-por transport and excessive precipitation. It can beexplained by the increased spatial resolution but itmight be partly caused by the bias of the RCM, thatis, overestimated water vapor convergence induced bythe high temperature and low pressure bias over land.The excessive precipitation over the tropical oceanmight be attributed to the physics scheme of convec-tion which is not tuned enough for the high horizontalresolution as mentioned in the section 3.1.
Figures 5 show the time-latitude cross section of

NO. 6 DAIRAKU ET AL. 965
Fig. 4. Simulated results averaged for 1981–1990 by the CCSR/NIES AGCM (left panels) and theNIES RAMS (right panels). Also shown are the wind (m s−1) at 850 hPa (upper panels), watervapor flux (kg m−1 s−1) (middle panels), and precipitation (mm h−1) (lower panel).
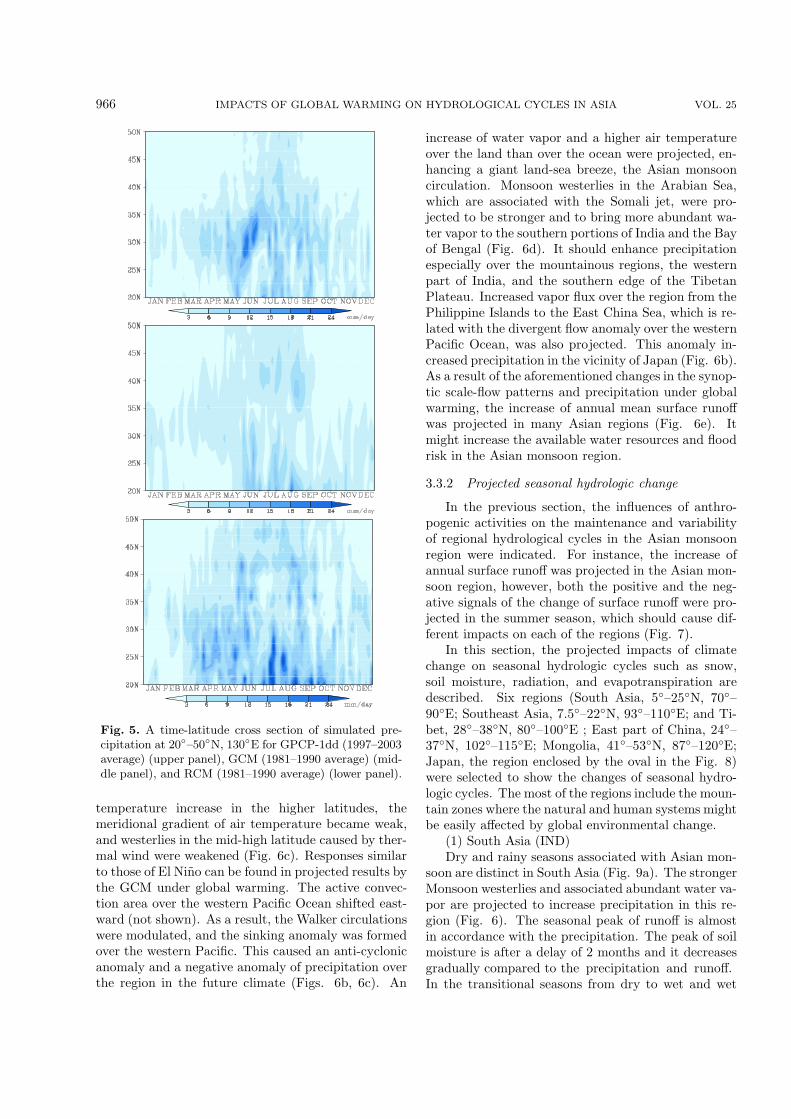
observed precipitation (GPCP 1dd; Huffman et al.,2001, 1997–2003 average) and simulated precipitation(GCM and RCM, 1981–1990 average). As indicated inthe upper panel, a northward migration of relativelystrong precipitation is associated with Baiu (Mei-yu,Changma) from May to July. The GCM could notadequately capture the seasonal migration. Thoughthe seasonal migration of precipitation was to somedegree augmented by the RCM derived by the GCMas a lateral boundary condition, neither the GCM northe RCM captures the gradual northward propagationof the monsoon in early summer particularly well.
Though the improvement and tuning of the model
physics schemes is necessary, it can be said that thedynamical downscaling using the developed RCM suc-cessfully increased temporal and spatial information inthe Asian monsoon region.
3.3 Future climate projection in the Asianmonsoon region
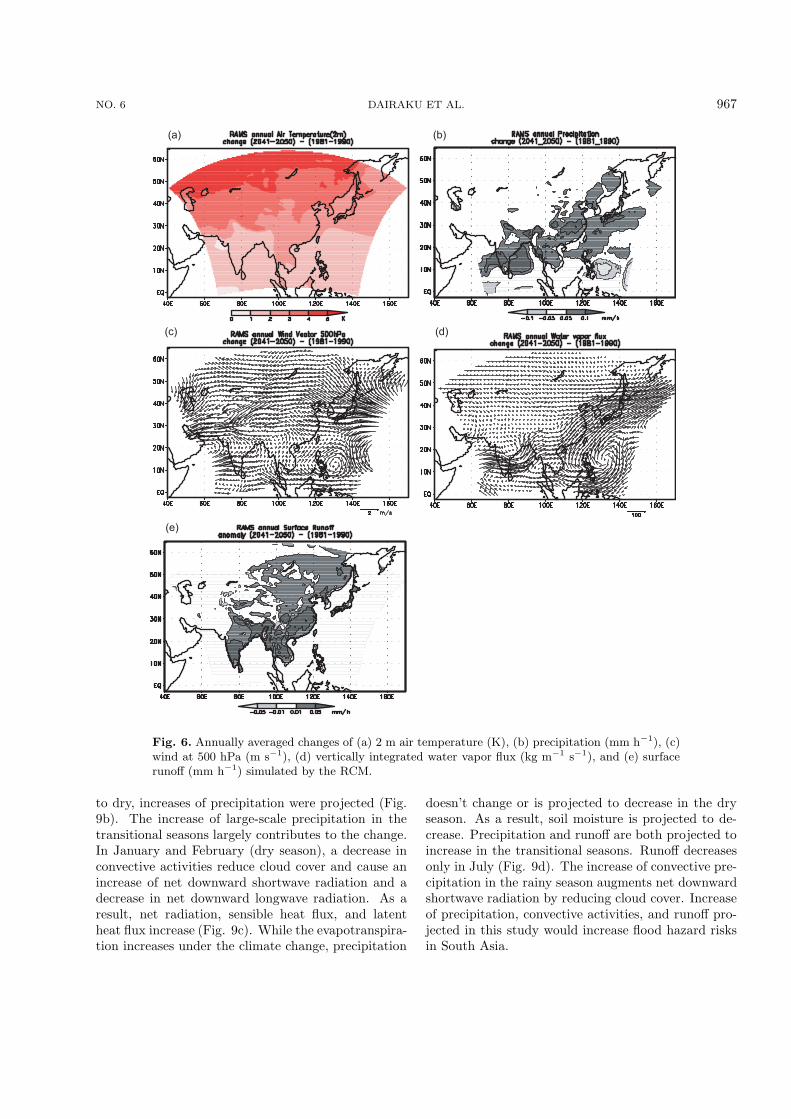
3.3.1 Annual mean changeAbout 1◦C increase of the annual mean 2 m air
temperature in the tropical region and about a 3◦C–4◦C increase in the mid-to-high latitudinal region areprojected from the present climate (1981–1990) to thefuture (2041–2050) (Fig. 6a). As a result of a stronger
966 IMPACTS OF GLOBAL WARMING ON HYDROLOGICAL CYCLES IN ASIA VOL. 25
Fig. 5. A time-latitude cross section of simulated pre-cipitation at 20◦–50◦N, 130◦E for GPCP-1dd (1997–2003average) (upper panel), GCM (1981–1990 average) (mid-dle panel), and RCM (1981–1990 average) (lower panel).
temperature increase in the higher latitudes, themeridional gradient of air temperature became weak,and westerlies in the mid-high latitude caused by ther-mal wind were weakened (Fig. 6c). Responses similarto those of El Nino can be found in projected results bythe GCM under global warming. The active convec-tion area over the western Pacific Ocean shifted east-ward (not shown). As a result, the Walker circulationswere modulated, and the sinking anomaly was formedover the western Pacific. This caused an anti-cyclonicanomaly and a negative anomaly of precipitation overthe region in the future climate (Figs. 6b, 6c). An
increase of water vapor and a higher air temperatureover the land than over the ocean were projected, en-hancing a giant land-sea breeze, the Asian monsooncirculation. Monsoon westerlies in the Arabian Sea,which are associated with the Somali jet, were pro-jected to be stronger and to bring more abundant wa-ter vapor to the southern portions of India and the Bayof Bengal (Fig. 6d). It should enhance precipitationespecially over the mountainous regions, the westernpart of India, and the southern edge of the TibetanPlateau. Increased vapor flux over the region from thePhilippine Islands to the East China Sea, which is re-lated with the divergent flow anomaly over the westernPacific Ocean, was also projected. This anomaly in-creased precipitation in the vicinity of Japan (Fig. 6b).As a result of the aforementioned changes in the synop-tic scale-flow patterns and precipitation under globalwarming, the increase of annual mean surface runoffwas projected in many Asian regions (Fig. 6e). Itmight increase the available water resources and floodrisk in the Asian monsoon region.
3.3.2 Projected seasonal hydrologic change
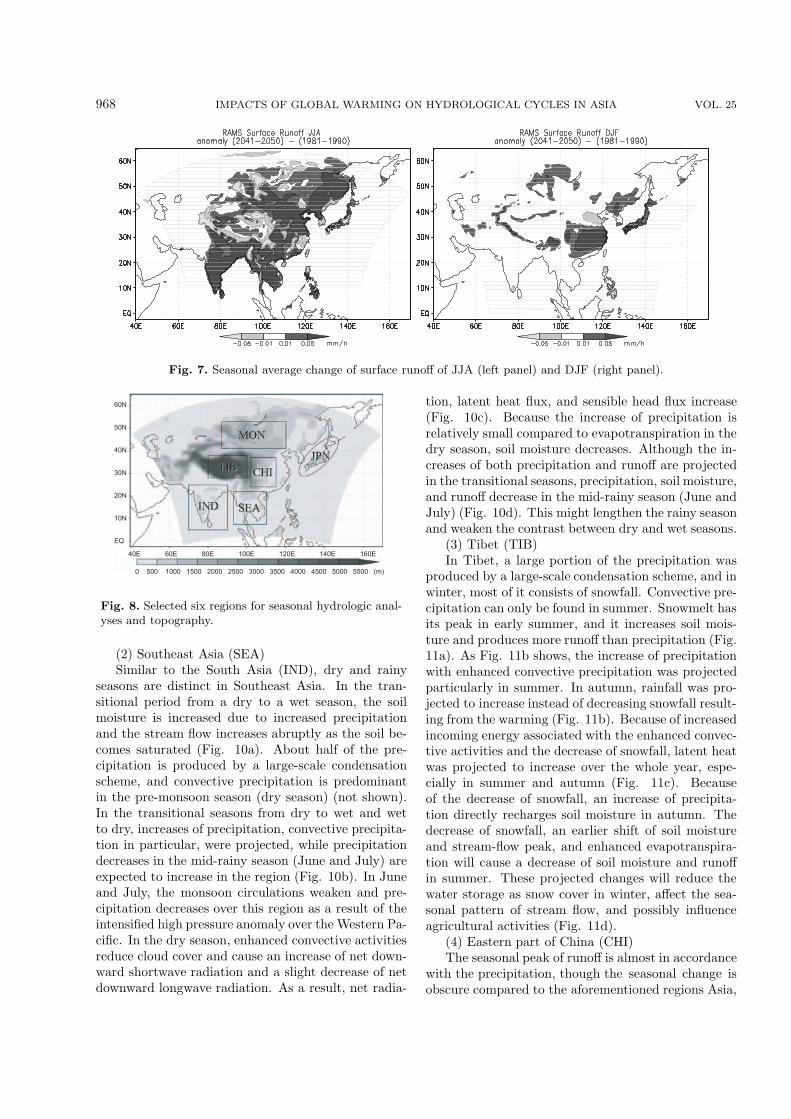
In the previous section, the influences of anthro-pogenic activities on the maintenance and variabilityof regional hydrological cycles in the Asian monsoonregion were indicated. For instance, the increase ofannual surface runoff was projected in the Asian mon-soon region, however, both the positive and the neg-ative signals of the change of surface runoff were pro-jected in the summer season, which should cause dif-ferent impacts on each of the regions (Fig. 7).
In this section, the projected impacts of climatechange on seasonal hydrologic cycles such as snow,soil moisture, radiation, and evapotranspiration aredescribed. Six regions (South Asia, 5◦–25◦N, 70◦–90◦E; Southeast Asia, 7.5◦–22◦N, 93◦–110◦E; and Ti-bet, 28◦–38◦N, 80◦–100◦E ; East part of China, 24◦–37◦N, 102◦–115◦E; Mongolia, 41◦–53◦N, 87◦–120◦E;Japan, the region enclosed by the oval in the Fig. 8)were selected to show the changes of seasonal hydro-logic cycles. The most of the regions include the moun-tain zones where the natural and human systems mightbe easily affected by global environmental change.
(1) South Asia (IND)Dry and rainy seasons associated with Asian mon-
soon are distinct in South Asia (Fig. 9a). The strongerMonsoon westerlies and associated abundant water va-por are projected to increase precipitation in this re-gion (Fig. 6). The seasonal peak of runoff is almostin accordance with the precipitation. The peak of soilmoisture is after a delay of 2 months and it decreasesgradually compared to the precipitation and runoff.In the transitional seasons from dry to wet and wet
NO. 6 DAIRAKU ET AL. 967
Fig. 6. Annually averaged changes of (a) 2 m air temperature (K), (b) precipitation (mm h−1), (c)wind at 500 hPa (m s−1), (d) vertically integrated water vapor flux (kg m−1 s−1), and (e) surfacerunoff (mm h−1) simulated by the RCM.
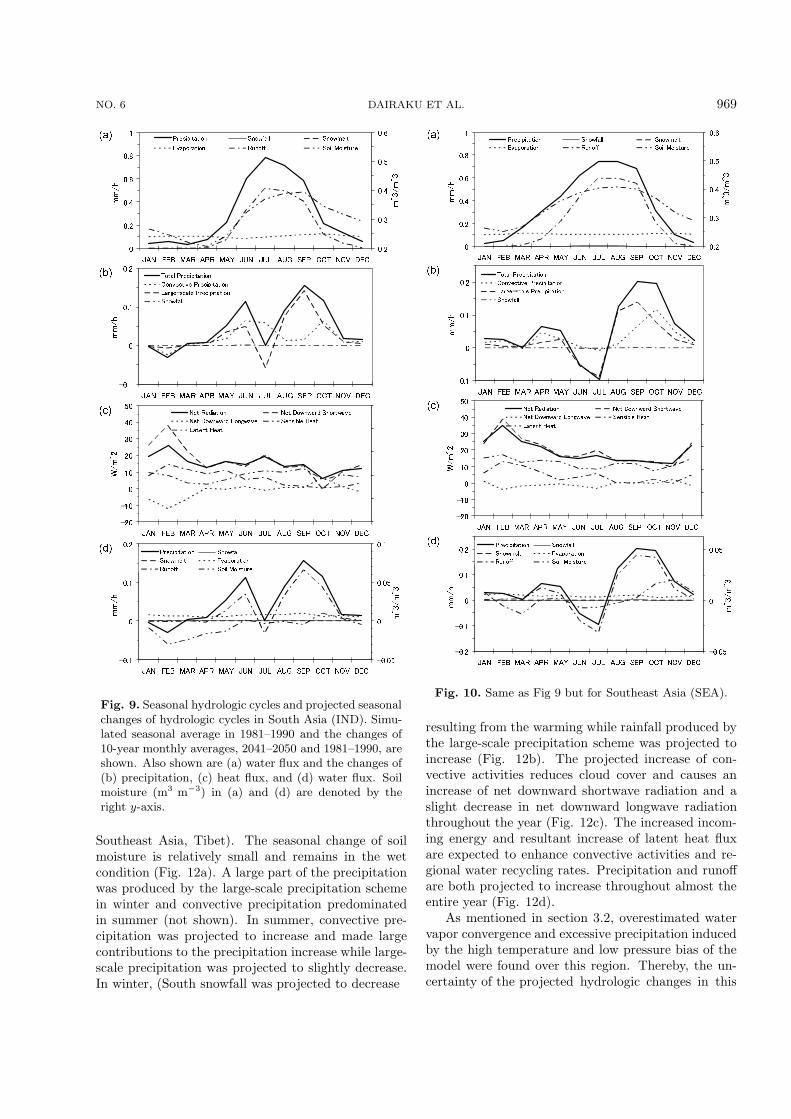
to dry, increases of precipitation were projected (Fig.9b). The increase of large-scale precipitation in thetransitional seasons largely contributes to the change.In January and February (dry season), a decrease inconvective activities reduce cloud cover and cause anincrease of net downward shortwave radiation and adecrease in net downward longwave radiation. As aresult, net radiation, sensible heat flux, and latentheat flux increase (Fig. 9c). While the evapotranspira-tion increases under the climate change, precipitation
doesn’t change or is projected to decrease in the dryseason. As a result, soil moisture is projected to de-crease. Precipitation and runoff are both projected toincrease in the transitional seasons. Runoff decreasesonly in July (Fig. 9d). The increase of convective pre-cipitation in the rainy season augments net downwardshortwave radiation by reducing cloud cover. Increaseof precipitation, convective activities, and runoff pro-jected in this study would increase flood hazard risksin South Asia.
968 IMPACTS OF GLOBAL WARMING ON HYDROLOGICAL CYCLES IN ASIA VOL. 25
Fig. 7. Seasonal average change of surface runoff of JJA (left panel) and DJF (right panel).
Fig. 8. Selected six regions for seasonal hydrologic anal-yses and topography.
(2) Southeast Asia (SEA)Similar to the South Asia (IND), dry and rainy
seasons are distinct in Southeast Asia. In the tran-sitional period from a dry to a wet season, the soilmoisture is increased due to increased precipitationand the stream flow increases abruptly as the soil be-comes saturated (Fig. 10a). About half of the pre-cipitation is produced by a large-scale condensationscheme, and convective precipitation is predominantin the pre-monsoon season (dry season) (not shown).In the transitional seasons from dry to wet and wetto dry, increases of precipitation, convective precipita-tion in particular, were projected, while precipitationdecreases in the mid-rainy season (June and July) areexpected to increase in the region (Fig. 10b). In Juneand July, the monsoon circulations weaken and pre-cipitation decreases over this region as a result of theintensified high pressure anomaly over the Western Pa-cific. In the dry season, enhanced convective activitiesreduce cloud cover and cause an increase of net down-ward shortwave radiation and a slight decrease of netdownward longwave radiation. As a result, net radia-
tion, latent heat flux, and sensible head flux increase(Fig. 10c). Because the increase of precipitation isrelatively small compared to evapotranspiration in thedry season, soil moisture decreases. Although the in-creases of both precipitation and runoff are projectedin the transitional seasons, precipitation, soil moisture,and runoff decrease in the mid-rainy season (June andJuly) (Fig. 10d). This might lengthen the rainy seasonand weaken the contrast between dry and wet seasons.
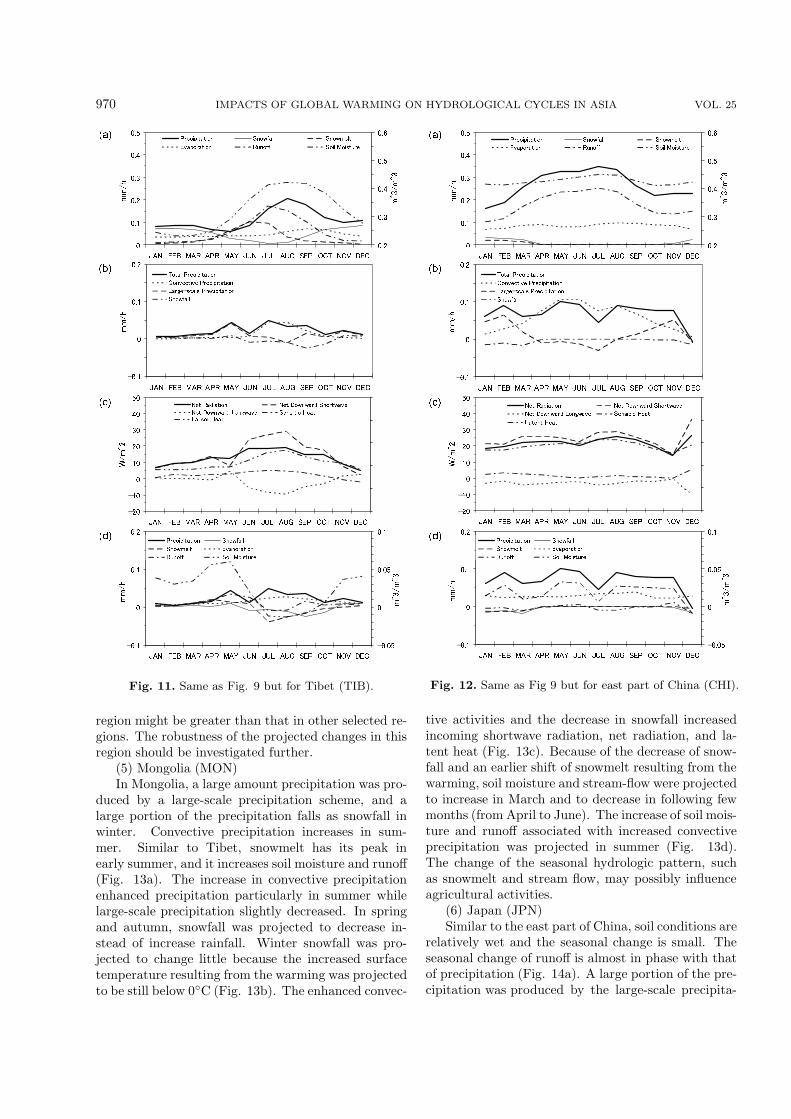
(3) Tibet (TIB)In Tibet, a large portion of the precipitation was
produced by a large-scale condensation scheme, and inwinter, most of it consists of snowfall. Convective pre-cipitation can only be found in summer. Snowmelt hasits peak in early summer, and it increases soil mois-ture and produces more runoff than precipitation (Fig.11a). As Fig. 11b shows, the increase of precipitationwith enhanced convective precipitation was projectedparticularly in summer. In autumn, rainfall was pro-jected to increase instead of decreasing snowfall result-ing from the warming (Fig. 11b). Because of increasedincoming energy associated with the enhanced convec-tive activities and the decrease of snowfall, latent heatwas projected to increase over the whole year, espe-cially in summer and autumn (Fig. 11c). Becauseof the decrease of snowfall, an increase of precipita-tion directly recharges soil moisture in autumn. Thedecrease of snowfall, an earlier shift of soil moistureand stream-flow peak, and enhanced evapotranspira-tion will cause a decrease of soil moisture and runoffin summer. These projected changes will reduce thewater storage as snow cover in winter, affect the sea-sonal pattern of stream flow, and possibly influenceagricultural activities (Fig. 11d).
(4) Eastern part of China (CHI)The seasonal peak of runoff is almost in accordance
with the precipitation, though the seasonal change isobscure compared to the aforementioned regions Asia,
NO. 6 DAIRAKU ET AL. 969
-0.1
0
0.1
0.2
JAN FEB MAR APR MAY JUN JUL AUG SEP OCT NOV DEC
mm/h
Total Precipitation
Convective Precipitation
Large-scale Precipitation
Snowfall
-0.1
0
0.1
0.2
JAN FEB MAR APR MAY JUN JUL AUG SEP OCT NOV DEC
mm/h
-0.05
0
0.05
0.1
m^3/m^3
Precipitation Snowfall
Snowmelt Evaporation
Runoff Soil Moisture
-20
-10
0
10
20
30
40
50
JAN FEB MAR APR MAY JUN JUL AUG SEP OCT NOV DEC
W/m^2
Net Radiation Net Downward Shortwave
Net Downward Longwave Sensible Heat
Latent Heat
0
0.2
0.4
0.6
0.8
1
JAN FEB MAR APR MAY JUN JUL AUG SEP OCT NOV DEC
mm/h
0.2
0.3
0.4
0.5
0.6
m^3/m^3
Precipitation Snowfall Snowmelt
Evaporation Runoff Soil Moisture
(a)
(b)
(c)
(d)
Fig. 9. Seasonal hydrologic cycles and projected seasonalchanges of hydrologic cycles in South Asia (IND). Simu-lated seasonal average in 1981–1990 and the changes of10-year monthly averages, 2041–2050 and 1981–1990, areshown. Also shown are (a) water flux and the changes of(b) precipitation, (c) heat flux, and (d) water flux. Soilmoisture (m3 m−3) in (a) and (d) are denoted by theright y-axis.
Southeast Asia, Tibet). The seasonal change of soilmoisture is relatively small and remains in the wetcondition (Fig. 12a). A large part of the precipitationwas produced by the large-scale precipitation schemein winter and convective precipitation predominatedin summer (not shown). In summer, convective pre-cipitation was projected to increase and made largecontributions to the precipitation increase while large-scale precipitation was projected to slightly decrease.In winter, (South snowfall was projected to decrease
(d)
-0.1
0
0.1
0.2
JAN FEB MAR APR MAY JUN JUL AUG SEP OCT NOV DEC
mm/h
Total Precipitation
Convective Precipitation
Large-scale Precipitation
Snowfall
-20
-10
0
10
20
30
40
50
JAN FEB MAR APR MAY JUN JUL AUG SEP OCT NOV DEC
W/m^2
Net Radiation Net Downward Shortwave
Net Downward Longwave Sensible Heat
Latent Heat
-0.2
-0.1
0
0.1
0.2
JAN FEB MAR APR MAY JUN JUL AUG SEP OCT NOV DEC
mm/h
-0.05
0
0.05
m^3/m^3
Precipitation Snowfall
Snowmelt Evaporation
Runoff Soil Moisture
0
0.2
0.4
0.6
0.8
1
JAN FEB MAR APR MAY JUN JUL AUG SEP OCT NOV DEC
mm/h
0.2
0.3
0.4
0.5
0.6
m^3/m^3
Precipitation Snowfall Snowmelt
Evaporation Runoff Soil Moisture
(a)
(b)
(c)
Fig. 10. Same as Fig 9 but for Southeast Asia (SEA).
resulting from the warming while rainfall produced bythe large-scale precipitation scheme was projected toincrease (Fig. 12b). The projected increase of con-vective activities reduces cloud cover and causes anincrease of net downward shortwave radiation and aslight decrease in net downward longwave radiationthroughout the year (Fig. 12c). The increased incom-ing energy and resultant increase of latent heat fluxare expected to enhance convective activities and re-gional water recycling rates. Precipitation and runoffare both projected to increase throughout almost theentire year (Fig. 12d).
As mentioned in section 3.2, overestimated watervapor convergence and excessive precipitation inducedby the high temperature and low pressure bias of themodel were found over this region. Thereby, the un-certainty of the projected hydrologic changes in this
970 IMPACTS OF GLOBAL WARMING ON HYDROLOGICAL CYCLES IN ASIA VOL. 25
(d)
(a)
(b)
(c)
-0.1
0
0.1
0.2
JAN FEB MAR APR MAY JUN JUL AUG SEP OCT NOV DEC
mm/h
Total Precipitation
Convective Precipitation
Large-scale Precipitation
Snowfall
-20
-10
0
10
20
30
40
50
JAN FEB MAR APR MAY JUN JUL AUG SEP OCT NOV DEC
W/m^2
Net Radiation Net Downward Shortwave
Net Downward Longwave Sensible Heat
Latent Heat
-0.1
0
0.1
0.2
JAN FEB MAR APR MAY JUN JUL AUG SEP OCT NOV DEC
mm/h
-0.05
0
0.05
0.1
m^3/m^3
Precipitation Snowfall
Snowmelt Evaporation
Runoff Soil Moisture
0
0.1
0.2
0.3
0.4
0.5
JAN FEB MAR APR MAY JUN JUL AUG SEP OCT NOV DEC
mm/h
0.2
0.3
0.4
0.5
0.6
m^3/m^3
Precipitation Snowfall Snowmelt
Evaporation Runoff Soil Moisture
Fig. 11. Same as Fig. 9 but for Tibet (TIB).
region might be greater than that in other selected re-gions. The robustness of the projected changes in thisregion should be investigated further.
(5) Mongolia (MON)In Mongolia, a large amount precipitation was pro-
duced by a large-scale precipitation scheme, and alarge portion of the precipitation falls as snowfall inwinter. Convective precipitation increases in sum-mer. Similar to Tibet, snowmelt has its peak inearly summer, and it increases soil moisture and runoff(Fig. 13a). The increase in convective precipitationenhanced precipitation particularly in summer whilelarge-scale precipitation slightly decreased. In springand autumn, snowfall was projected to decrease in-stead of increase rainfall. Winter snowfall was pro-jected to change little because the increased surfacetemperature resulting from the warming was projectedto be still below 0◦C (Fig. 13b). The enhanced convec-
(d)
(a)
(b)
(c)
0
0.1
0.2
0.3
0.4
0.5
JAN FEB MAR APR MAY JUN JUL AUG SEP OCT NOV DEC
mm/h
0.2
0.3
0.4
0.5
0.6
m^3/m^3
Precipitation Snowfall Snowmelt
Evaporation Runoff Soil Moisture
-0.1
0
0.1
0.2
JAN FEB MAR APR MAY JUN JUL AUG SEP OCT NOV DEC
mm/h
Total Precipitation
Convective Precipitation
Large-scale Precipitation
Snowfall
-20
-10
0
10
20
30
40
50
JAN FEB MAR APR MAY JUN JUL AUG SEP OCT NOV DEC
W/m^2
Net Radiation Net Downward Shortwave
Net Downward Longwave Sensible Heat
Latent Heat
-0.1
0
0.1
0.2
JAN FEB MAR APR MAY JUN JUL AUG SEP OCT NOV DEC
mm/h
-0.05
0
0.05
0.1
m^3/m^3
Precipitation Snowfall
Snowmelt Evaporation
Runoff Soil Moisture
Fig. 12. Same as Fig 9 but for east part of China (CHI).
tive activities and the decrease in snowfall increasedincoming shortwave radiation, net radiation, and la-tent heat (Fig. 13c). Because of the decrease of snow-fall and an earlier shift of snowmelt resulting from thewarming, soil moisture and stream-flow were projectedto increase in March and to decrease in following fewmonths (from April to June). The increase of soil mois-ture and runoff associated with increased convectiveprecipitation was projected in summer (Fig. 13d).The change of the seasonal hydrologic pattern, suchas snowmelt and stream flow, may possibly influenceagricultural activities.
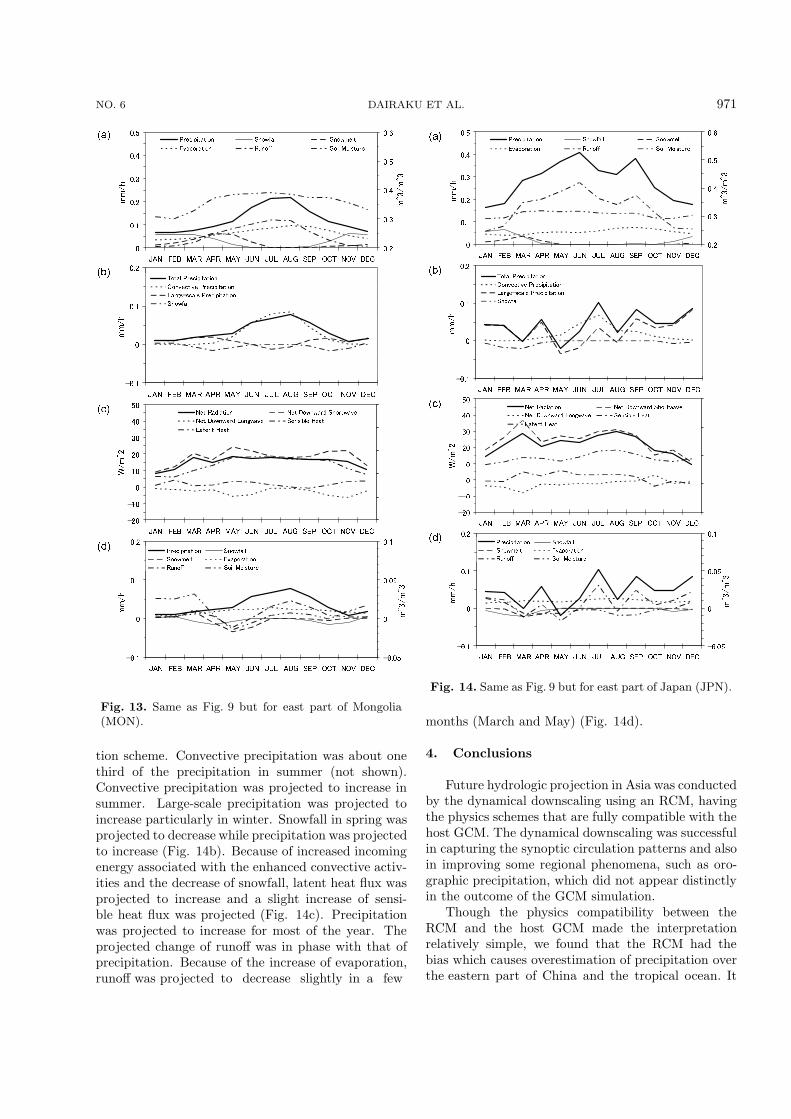
(6) Japan (JPN)Similar to the east part of China, soil conditions are
relatively wet and the seasonal change is small. Theseasonal change of runoff is almost in phase with thatof precipitation (Fig. 14a). A large portion of the pre-cipitation was produced by the large-scale precipita-
NO. 6 DAIRAKU ET AL. 971
(d)
(a)
(b)
(c)
0
0.1
0.2
0.3
0.4
0.5
JAN FEB MAR APR MAY JUN JUL AUG SEP OCT NOV DEC
mm/h
0.2
0.3
0.4
0.5
0.6
m^3/m^3
Precipitation Snowfall Snowmelt
Evaporation Runoff Soil Moisture
-0.1
0
0.1
0.2
JAN FEB MAR APR MAY JUN JUL AUG SEP OCT NOV DEC
mm/h
Total Precipitation
Convective Precipitation
Large-scale Precipitation
Snowfall
-20
-10
0
10
20
30
40
50
JAN FEB MAR APR MAY JUN JUL AUG SEP OCT NOV DEC
W/m^2
Net Radiation Net Downward Shortwave
Net Downward Longwave Sensible Heat
Latent Heat
-0.1
0
0.1
0.2
JAN FEB MAR APR MAY JUN JUL AUG SEP OCT NOV DEC
mm/h
-0.05
0
0.05
0.1
m^3/m^3
Precipitation Snowfall
Snowmelt Evaporation
Runoff Soil Moisture
Fig. 13. Same as Fig. 9 but for east part of Mongolia(MON).
tion scheme. Convective precipitation was about onethird of the precipitation in summer (not shown).Convective precipitation was projected to increase insummer. Large-scale precipitation was projected toincrease particularly in winter. Snowfall in spring wasprojected to decrease while precipitation was projectedto increase (Fig. 14b). Because of increased incomingenergy associated with the enhanced convective activ-ities and the decrease of snowfall, latent heat flux wasprojected to increase and a slight increase of sensi-ble heat flux was projected (Fig. 14c). Precipitationwas projected to increase for most of the year. Theprojected change of runoff was in phase with that ofprecipitation. Because of the increase of evaporation,runoff was projected to decrease slightly in a few
-0.1
0
0.1
0.2
JAN FEB MAR APR MAY JUN JUL AUG SEP OCT NOV DEC
mm/h
Total Precipitation
Convective Precipitation
Large-scale Precipitation
Snowfall
(d)
(a)
(b)
(c)
0
0.1
0.2
0.3
0.4
0.5
JAN FEB MAR APR MAY JUN JUL AUG SEP OCT NOV DEC
mm/h
0.2
0.3
0.4
0.5
0.6
m^3/m^3
Precipitation Snowfall Snowmelt
Evaporation Runoff Soil Moisture
-20
-10
0
10
20
30
40
50
JAN FEB MAR APR MAY JUN JUL AUG SEP OCT NOV DEC
W/m^2
Net Radiation Net Downward Shortwave
Net Downward Longwave Sensible Heat
Latent Heat
-0.1
0
0.1
0.2
JAN FEB MAR APR MAY JUN JUL AUG SEP OCT NOV DEC
mm/h
-0.05
0
0.05
0.1
m^3/m^3
Precipitation Snowfall
Snowmelt Evaporation
Runoff Soil Moisture
Fig. 14. Same as Fig. 9 but for east part of Japan (JPN).
months (March and May) (Fig. 14d).
4. Conclusions
Future hydrologic projection in Asia was conductedby the dynamical downscaling using an RCM, havingthe physics schemes that are fully compatible with thehost GCM. The dynamical downscaling was successfulin capturing the synoptic circulation patterns and alsoin improving some regional phenomena, such as oro-graphic precipitation, which did not appear distinctlyin the outcome of the GCM simulation.
Though the physics compatibility between theRCM and the host GCM made the interpretationrelatively simple, we found that the RCM had thebias which causes overestimation of precipitation overthe eastern part of China and the tropical ocean. It

972 IMPACTS OF GLOBAL WARMING ON HYDROLOGICAL CYCLES IN ASIA VOL. 25
might be partly attributed to the implemented cumu-lus convection scheme and large scale condensationscheme which are developed and tuned for the GCMwith coarse horizontal resolution. The model physicsshould be improved and tuned for the RCM with thehigh horizontal resolutions to reduce the uncertaintyof the results.
The influences of anthropogenic activities on themaintenance and variability of regional hydrologicalcycles in the Asian monsoon region were projected un-der global climate change. About 1◦C increase and a3◦C–4◦C increase of the annual mean 2 m air tem-perature from the present climate (1981–1990) to thefuture (2041–2050) were projected in the tropical re-gions and in the mid-to-high latitudinal regions, re-spectively. Weakened westerlies resulting from theweaker meridional gradient of air temperature in themid-high latitudes, enhanced Monsoon westerlies andwater vapor flux in South Asia, and increased vaporflux over the region from the Philippine Islands to theEast China Sea, which is related with the divergentflow anomaly over the western Pacific Ocean, were pro-jected. As the result of the changes in these synopticflow patterns and the increase of water vapor resultingfrom the warmed air temperature and enhanced evapo-ration, the increases of precipitation and surface runoffwere projected in many Asian regions. However, boththe positive and negative changes of seasonal surfacerunoff partly attributed to the earlier shift of snowmeltwere projected in some regions. This will increase theflood risk and might cause mismatch between waterdemand and water availability in the agricultural sea-son. An increase in convective precipitation, evapora-tion, and runoff would enhance the hydrological cycleand increase flood hazard risks in the Asian monsoonregion unless water resources are effectively managed.
Because dynamical downscaling by a regional cli-mate model is strongly dependent on the results of par-ent GCMs, the robustness of the projected results inthe present study must be assessed further by using en-semble experiments based on high-resolution GCMs orAGCMs that are coupled to a slab ocean model. Also,the high-resolution global climate model has not yethad enough capability to examine regional-scale feed-backs, especially between atmosphere and terrestrialecosystems. It is necessary to add spatial resolution(less than 30 km grid spacing), by RCM or in GCM,and biophysical and biogeochemical processes to ac-curately assess critical synoptic/regional interactionswithin the Asian monsoon system which is character-ized by diverse geography.
Though the investigation of the resilience and vul-nerability of the human society in the Asian mon-soon region to the global climate change is beyond the
scope of this study, the projected hydrologic changesmight have significant influences on social developmentand human well-being. The social and technologi-cal development may have a potential to reduce thesocial vulnerabilities to natural disasters by employ-ing effective risk management. However, inconsideratedevelopment might worsen the social vulnerabilities.Therefore a further comprehensive study to under-stand the integrated physical-biogeochemical-humaninteractions in the Asia monsoon regions is needed.
Acknowledgements. This study was conducted as
one of the research activities of “Water Resources and
Variability in Asia in the 21st Century” of the Research
Fund to Promote Science and Technology of Japan’s Min-
istry of Education, Culture, Sports, Science and Technol-
ogy (MEXT) supervised by Dr. A. Kitoh of the Mete-
orological Research Institute of the Japan Meteorological
Agency. The work was partially supported by the Global
Environment Research Fund of Japan’s Ministry of the En-
vironment (S-5-3). The data used in this study were ac-
quired as part of the Tropical Rainfall Measuring Mission
(TRMM). The algorithms were developed by the TRMM
Science Team. The data were processed by the TRMM
Science Data and Information System (TSDIS) and the
TRMM Office.
REFERENCES
Arakawa, A., and W. H. Schubert, 1974: Interaction ofa cumulus cloud ensemble with the large-scale envi-ronment, Part I. J. Atmos. Sci., 31, 674–701.
Castro, C. L., R. A. Pielke Sr., and G. Leoncini, 2005: Dy-namical downscaling: Assessment of value retainedand added using the Regional Atmospheric Model-ing System (RAMS). J. Geophys. Res., 110, doi:101029/2004J.
Coe, M. T., 2000: Modeling terrestrial hydrological sys-tems at the continental scale: Testing the accuracyof an atmospheric GCM. J. Climate, 13, 686–704.
Collins, M., 2007: Ensembles and probabilities: A newera in the prediction of climate change. Philos. Trans.Roy. Soc. London A, 365, 1957–1970.
Dairaku, K., and S. Emori, 2006: Dynamic and thermo-dynamic influences on intensified daily rainfall dur-ing the Asian summer monsoon under doubled at-mospheric CO2 conditions. Geophys. Res. Lett., 33,L01704, doi: 101029/2005GL024754.
Emori, S., T. Nozawa, A. Numaguti, and I. Uno, 2001:Importance of cumulus parameterization for precipi-tation simulation over East Asia in June. J. Meteor.Soc. Japan, 79, 939–947.
Fu, C., F. W. T. Penning de Vries, Ailikun, C. T.A. Chen, L. Lebel, M. Manton, A. Snidvongs,and H. Virji, Eds, 2006: The initial science planof the Monsoon Asia Integrated Regional Study.MAIRS-IPO,

NO. 6 DAIRAKU ET AL. 973
IAP-CAS, Beijing, China, 80pp.Giorgi, F., and L. O. Mearns, 1999: Introdution to spe-
cial section: Regional climate modeling revisited. J.Geophys. Res., 104, 6335–6352 98JD02072.
Huffman, G. J., and Coauthors, 1997: The Global Precip-itation Climatology Project (GPCP) combined pre-cipitation dataset. Bull. Amer. Meteor. Soc., 78, 5–20.
Huffman, G. J., R. F. Adler, M. M. Morrissey, D. T.Bolvin, S. Curtis, R. Joyce, B. McGavock, and J.Susskind, 2001: Global precipitation at one-degreedaily resolution from multisatellite observations. J.Hydrometeor., 2, 36–50.
IPCC, 2001: Climate Change 2001: The Scientific Basis.Contribution of Working Group I to the Third As-sessment Report of the Intergovernmental Panel onClimate Change. Houghton et al., Eds., CambridgeUniversity Press, Cambridge, United Kingdom andNew York, NY, USA, 881pp.
Koster, R. D., M. J. Suarez, and M. Heiser, 2000: Vari-ance and predictability of precipitation at seasonal-to-interannual timescales. J. Hydrometeor., 1, 26–46.
Mellor, G. L., and T. Yamada, 1974: A hierarchy of tur-bulence closure models for planetary boundary lay-ers. J. Atmos. Sci., 31, 1791–1806.
Mellor, G. L., and T. Yamada, 1982: Development of aturbulence closure model for geophysical fluid prob-lems. Rev. Geophys., 20, 851–875.
Milly, P. C. D., R. T. Wetherald, K. A. Dunne, and T.L. Delworth, 2002: Increasing risk of great foods ina changing climate. Nature, 415, 514–517.
Nakajima, T., M. Tsukamoto, Y. Tsushima, A. Nu-maguti, and T. Kimura, 2000: Modelling of the ra-diative process in an atmospheric general circulationmodel. Appl. Opt., 39, 4869–4878.
Numaguti, A., M. Takahashi, T Nakajima, and A.Sumi, 1997: Description of CCSR/NIES Atmo-spheric General Circulation Model. CGER’s Super-computer Monograph Report. 3, Center for GlobalEnvironmental Research, National Institute for En-vironmental Studies, 1–48.
Palmer, T. N., and J. Ralsanen, 2002: Quantifying therisk of extreme seasonal precipitation events in achanging climate. Nature, 415, 512–514.
Pielke, R. A., and Coauthors, 1992: A comprehensivemeteorological modeling—RAMS. Meteor. Atmos.Phys., 49, 69–91.
Pielke, Sr. R. A., Ed., 2002: Mesoscale MeteorologicalModeling. 2nd ed., Academic Press, 676pp.
Rayner, N. A., E. B. Horton, D. E. Parker, C. K. Folland,and R. B. Hackett, 1996: Version 2.2 of the globalsea-ice and sea surface temperature data set, 1903–1994. Climate Research Technical (CRTN) No. 74,43pp. [Available from The Met Office, London Road,Bracknell, UK]
Schnur, R., 2002: The investment forecast. Nature, 415,483–484.
Suh, M. -S., and D.-K. Lee, 2004: Impacts of landuse/cover changes on surface climate over east Asiafor extreme climate cases using RegCM2. J. Geophys.Res., 109, doi: 101029/2003J.
Takata, K., S. Emori, and T. Watanabe, 2003: Develop-ment of the minimal advanced treatments of surfaceinteraction and runoff. Global and Planetary Change,38, 209–222.
Takayabu, I., H. Kato, K. Nishizawa, Y. N. Takayabu, Y.Sato, H. Sasaki, K. Kurihara, and A. Kitoh, 2007:Future projections in precipitation over Asia simu-lated by two RCMs nested into MRI-CGCM2.2. J.Meteor. Soc. Japan, 85, 511–519.
Vorosmarty, C. J., P. Green, J. Salisbury, and R. B. Lam-mers, 2000: Global Water Resources: Vulnerabilityfrom Climate Change and Population Growth. Sci-ence, 289, 284–288.
Wang, Y., L. R. Leung, J. L. McGregor, D.-K. Lee,W.-C. Wang, Y. Ding, and F. Kimura, 2004: Re-gional Climate Modeling: Progress, Challenges, andProspects. J. Meteor. Soc. Japan, 82, 1599–1628.
Xie, P., and P. A. Arkin, 1997: Global Precipitation: A17-Year Monthly Analysis Based on Gauge Obser-vations, Satellite Estimates, and Numerical ModelOutputs. Bull. Amer. Meteor. Soc., 78, 2539–2558.
Related Documents