University of North Dakota UND Scholarly Commons eses and Dissertations eses, Dissertations, and Senior Projects January 2014 Impacts Of Gas And Oil Development On Sharp- Tailed Grouse (tympanuchus Phasianellus) Nest Success And Predator Dynamics In Western North Dakota Paul Curtis Burr Follow this and additional works at: hps://commons.und.edu/theses is esis is brought to you for free and open access by the eses, Dissertations, and Senior Projects at UND Scholarly Commons. It has been accepted for inclusion in eses and Dissertations by an authorized administrator of UND Scholarly Commons. For more information, please contact [email protected]. Recommended Citation Burr, Paul Curtis, "Impacts Of Gas And Oil Development On Sharp-Tailed Grouse (tympanuchus Phasianellus) Nest Success And Predator Dynamics In Western North Dakota" (2014). eses and Dissertations. 1625. hps://commons.und.edu/theses/1625

Welcome message from author
This document is posted to help you gain knowledge. Please leave a comment to let me know what you think about it! Share it to your friends and learn new things together.
Transcript

University of North DakotaUND Scholarly Commons
Theses and Dissertations Theses, Dissertations, and Senior Projects
January 2014
Impacts Of Gas And Oil Development On Sharp-Tailed Grouse (tympanuchus Phasianellus) NestSuccess And Predator Dynamics In Western NorthDakotaPaul Curtis Burr
Follow this and additional works at: https://commons.und.edu/theses
This Thesis is brought to you for free and open access by the Theses, Dissertations, and Senior Projects at UND Scholarly Commons. It has beenaccepted for inclusion in Theses and Dissertations by an authorized administrator of UND Scholarly Commons. For more information, please [email protected].
Recommended CitationBurr, Paul Curtis, "Impacts Of Gas And Oil Development On Sharp-Tailed Grouse (tympanuchus Phasianellus) Nest Success AndPredator Dynamics In Western North Dakota" (2014). Theses and Dissertations. 1625.https://commons.und.edu/theses/1625

IMPACTS OF GAS AND OIL DEVELOPMENT ON SHARP-TAILED GROUSE
(TYMPANUCHUS PHASIANELLUS) NEST SUCCESS AND PREDATOR DYNAMICS
IN WESTERN NORTH DAKOTA
by
Paul Curtis Burr
Bachelor of Science, University of North Dakota, 2010
A Thesis
Submitted to the Graduate Faculty
of the
University of North Dakota
in partial fulfillment of the requirements
for the degree of
Master of Science
Grand Forks, North Dakota
August
2014

ii
Copyright 2014 Paul Burr


iv
PERMISSION
Title Impacts of Gas and Oil Development on Sharp-tailed Grouse (Tympanuchus
phasianellus) Nest Success and Predator Dynamics in Western North Dakota
Department Biology
Degree Master of Science
In presenting this thesis in partial fulfillment of the requirements for a graduate degree
from the University of North Dakota, I agree that the library of this University shall make it
freely available for inspection. I further agree that permission for the extensive copying for
scholarly purposes may be granted by the professor who supervised my thesis work or, in her
absence, by the Chairperson of the department or the dean of the School of Graduate Studies. It
is understood that any copying or publication or other use of this thesis or part thereof for
financial gain shall not be allowed without my written permission. It is also understood that due
recognition shall be given to me and to the University of North Dakota in any scholarly use
which may be made of any material in my thesis.
Paul Burr
August 2014

v
TABLE OF CONTENTS
LIST OF FIGURES ...................................................................................................................... vii
LIST OF TABLES ....................................................................................................................... viii
ACKNOWLEDGMENTS ...............................................................................................................x
ABSTRACT .................................................................................................................................. xii
CHAPTER
I. BACKGROUND AND LITERATURE REVIEW: SHARP-TAILED
GROUSE AND NEST PREDATORS ON A CHANGING LANDSCAPE .................1
Gas and Oil Development in North Dakota .......................................................1
Sharp-tailed Grouse Ecology .............................................................................3
Nest Predator Ecology .......................................................................................5
Potential Impacts of Gas and Oil on Wildlife ....................................................8
Study Objectives and Hypotheses ....................................................................10
Methodology ....................................................................................................13
Literature Cited ................................................................................................18
II. IMPACTS OF GAS AND OIL DEVELOPMENT ON SHARP-TAILED
GROUSE NEST SURVIVAL AND CAUSE SPECIFIC NEST
MORTALITY IN WESTERN NORTH DAKOTA ....................................................30
Abstract ............................................................................................................30
Introduction ......................................................................................................31
Methods............................................................................................................34
Results ..............................................................................................................40

vi
Discussion ........................................................................................................43
Literature Cited ................................................................................................51
III. IMPACTS OF GAS AND OIL DEVELOPMENT ON MAMMALIAN
PREDATOR HABITAT USE IN WESTERN NORTH DAKOTA............................67
Abstract ............................................................................................................67
Introduction ......................................................................................................68
Methods............................................................................................................71
Results ..............................................................................................................78
Discussion ........................................................................................................83
Literature Cited ................................................................................................91
IV. CONCLUSION ..........................................................................................................109
Literature Cited ..............................................................................................114
APPENDICES .............................................................................................................................116

vii
LIST OF FIGURES
Figure Page
1. Number of actively producing oil wells per year in North Dakota (1951-
August, 2013). ....................................................................................................................29
2. Two study areas established in Mountrail County of western North Dakota
used to trap sharp-tailed grouse in 2012 and 2013 ............................................................65
3. Number of sharp-tailed grouse nest depredations caused by specific nest
predators in western North Dakota, 2012-2013 .................................................................66
4. Two study areas established in Mountrail County of western North Dakota
used to conduct meso-mammalian surveys, 2012-2013 ..................................................107
5. Locations of camera scent stations at our Belden study area (intense gas
and oil, A), and our Blaisdell study area (minimal gas and oil, B), 2012
and 2013. ..........................................................................................................................108
6. Moran’s I correlograms produced in program SAM using sharp-tailed
grouse nest success by study area ....................................................................................122
7. Moran’s I correlograms produced in program SAM using detections of all
targeted meso-mammal species by study area and by year .............................................129
8. Moran’s I correlograms produced in program SAM using coyote
detections by study area and by year ...............................................................................130
9. Moran’s I correlograms produced in program SAM using raccoon
detections by study area and by year ...............................................................................131
10. Moran’s I correlograms produced in program SAM using American
badger detections by study area and by year ...................................................................132

viii
LIST OF TABLES
Table Page
1. Explanatory covariates used for analyzing sharp-tailed grouse daily nest
survival rates in western North Dakota, 2012–2013 ..........................................................62
2. Summary of sharp-tailed grouse nests monitored in 2012 and 2013 in
western North Dakota ........................................................................................................63
3. Models within two AICc scores from the highest ranked daily nest survival
model constructed for sharp-tailed grouse in western North Dakota ................................63
4. Model averaged beta (β) estimates for all covariates included in the sharp-
tailed grouse daily nest survival analysis in Program MARK ...........................................64
5. Meso-Mammal detections recorded from camera scent-stations deployed
in 2012 and 2013 between two study areas in western North Dakota .............................101
6. Explanatory covariates used for analyzing occupancy and detection rates
of the meso-mammal community in western North Dakota, 2012–2013 ........................101
7. Goodness-of-fit analysis results on the most general models for each
meso-mammal species analyzed by year .........................................................................102
8. Models within two AICc scores from the highest ranked model in each
model set constructed for occupancy analysis in program MARK .................................103
9. Model averaged beta (β) estimates for all covariates included within the
occupancy parameter based on the top 95% of model constructed for each
model set ..........................................................................................................................104
10. Estimates of occupancy and detection rates for detected meso-mammals in
western North Dakota ......................................................................................................105
11. Model averaged beta (β) estimates for all covariates included within the
detection parameter based on the top 95% of model constructed for each
model set ..........................................................................................................................106

ix
12. Pearson correlation squared coefficients calculated among spatial
covariates measured for sharp-tailed grouse nests ...........................................................117
13. Summary statistics of the continuous covariates calculated from sharp-
tailed grouse nest locations, used in the daily nest survival analysis ...............................118
14. Pearson correlation squared coefficients calculated among habitat
covariates measured at sharp-tailed grouse nests.............................................................119
15. Daily nest survival models constructed using only sharp-tailed grouse
nests that had available habitat data .................................................................................119
16. Daily nest survival models constructed using all 163 sharp-tailed grouse
nests monitored in western North Dakota ........................................................................120
17. Pearson correlation squared coefficients among continuous covariates
used in meso-mammal occupancy analysis .....................................................................123
18. Summary statistics of the continuous covariates calculated from camera-
scent station sites, used in the meso-mammal occupancy analysis .................................124
19. All occupancy models constructed for the species coyote (Canis latrans) .....................125
20. All occupancy models constructed for the species American badger
(Taxidea taxus).................................................................................................................126
21. All occupancy models constructed for the species raccoon (Procyon lotor) ...................127
22. Occupancy models constructed for all meso-mammal species detected,
including coyotes (Canis latrans), striped skunks (Mephitis mephitis),
American badgers (Taxidea taxus), raccoons (Procyon lotor), and red fox
(Vulpes vulpes) .................................................................................................................128

x
ACKNOWLEDGMENTS
I wish to express my sincere appreciation to my academic advisor, Susan Felege. Thank
you for giving me the opportunity to be the first of many students to work in your lab. Your
guidance, confidence, and support have made this work possible. I appreciate all you’ve done for
me, and will always remember the time spent working with you in the oil patch of North Dakota.
My appreciation also goes out to my academic committee members, Dr. Robert Newman and Dr.
Michael Niedzielski. Thank you for all of your insight, guidance, advice, and discussions
pertaining to this project. Your involvement has aided in this research more than you will ever
realize.
I am also very appreciative of Aaron Robinson of the North Dakota Game and Fish. Your
continued work and dedication on energy developments impact on wildlife is commendable. I
would like to thank you for giving us the opportunity to be a part of this exciting research. I have
gained tremendous experience and knowledge from this project.
I would also like to thank all of the crew members in which I had the privilege to work
with on this project. Thank you to Rebecca Eckroad, Scott Fox, Julia Johnson, Jesse Kolar, Anna
Mattson, Paul O’Neel, Adam Pachl, and Anthony Veroline. Thanks also to Susan Felege and
Chris Felege who aided in field work, boosted morale, and kept us fed and happy. Without the
hard work and dedication given by all of these of people, this project would not have been the
success that it is.
There are numerous collaborators I would also like to acknowledge. These organizations
and groups have provided instrumental assistance in this research through the funding of

xi
equipment, personnel, travel, and assisting in the design and implementation of this work.
Funding was graciously provided by SportDOG Brand Conservation Fund Grant Program, UND
Collaborative SEED Grant, UND Faculty Research Seed Money, North Dakota Game and Fish
Department, Brigham Young University, Energy Initiative Seed Funding for Non-Engineering or
Geology Disciplines, the National Science Foundation, the UND Biology Department, Pheasants
Forever, and North Dakota EPSCoR. Thanks also to the U.S. Fish and Wildlife Service,
particularly staff at Lostwood National Wildlife Refuge, for assisting with logistics and
providing housing during critical periods of this project.

To my father David and my mother Tera

xii
ABSTRACT
Recent advancements in extraction technologies are resulting in rapid increases of gas
and oil development in western North Dakota. This expansion of energy development may have
unknown effects on local wildlife populations and the ecological interactions within and among
species. Sharp-tailed grouse (Tympanuchus phasianellus) are a popular upland game bird species
that rely on grassland habitat found throughout the state. Potential impacts of gas and oil
development on the nest success of sharp-tailed grouse is an area of particular interest as it is an
important factor in avian reproduction. Similarly, it is equally important to understand the
impacts experienced by the mammalian predator community as these species are the primary
cause of sharp-tailed grouse nest failure. Our objectives for this study were to evaluate potential
impacts on sharp-tailed grouse nest success and nest predator dynamics using two study sites that
represented areas of high and low energy development intensities in western North Dakota.
During the summers of 2012 and 2013, we monitored a total of 163 grouse nests using radio
telemetry. Of these, 90 nests also were monitored using miniature cameras to accurately
determine nest fates, estimate nest predator frequencies, and record various hen behaviors. We
evaluated various nest site characteristics on daily nest survival using Program MARK.
American badgers (Taxidea taxus) and striped skunks (Mephitis mephitis) were the primary nest
predators, accounting for 56.7% of all video recorded nest depredations. Top models included
predictors of study area and whether or not the nest was monitored with a camera. Nests in our
high intensity gas and oil area were 1.95 times more likely to succeed compared to our minimal
intensity area. Model average estimated daily nest survival was 0.975 (CI = 0.963-0.984) in the

xiii
high intensity area, and 0.955 (CI = 0.937-0.967) in the low intensity area. Camera monitored
nests were 2.03 times more likely to succeed than non-camera monitored nests. To evaluate the
impacts of energy development on mammalian predators’ use of the landscape, we
simultaneously conducted predator surveys using camera scent stations during the summers of
2012 and 2013. We detected coyotes (Canis latrans), striped skunks (Mephitis mephitis), red fox
(Vulpes vulpes), American badgers (Taxidea taxus), and raccoons (Procyon lotor). We conducted
occupancy analysis to evaluate differences in predator occurrence between study areas while
incorporating various covariates associated with survey site characteristics and year in Program
MARK. We found the mammalian predator community as a whole to be 4.5 times more likely to
occur in our study area of minimal gas and oil intensity compared to the high intensity area,
suggesting a negative relationship between energy development and predator occurrence.
Although only a correlative study, our results suggest energy development may be negatively
impacting the predator community, thereby increasing nest success for sharp-tailed grouse in
areas of intense development while adjacent areas of minimal development may have increased
predator occurrence and reduced grouse nest success. Thus, our study illustrates the potential
influences of energy development on the nest predator prey dynamics of sharp-tailed grouse in
western North Dakota and the complexity of evaluating these impacts on wildlife.

1
BACKGROUND AND LITERATURE REVIEW: SHARP-TAILED GROUSE AND NEST
PREDATORS ON A CHANGING LANDSCAPE
GAS AND OIL DEVELOPMENT IN NORTH DAKOTA
The state of North Dakota has been producing gas and oil since the early 1950’s
(Nordeng 2010), and is now one of the leading producers of oil in the United States (Ausick and
Sauter 2013). However, it wasn’t until the early 2000’s that North Dakota experienced its
significant increase in oil production with the advent of hydraulic fracturing in conjunction with
horizontal drilling (Wiseman 2009).
The process of horizontal drilling allows oil wells to be drilled horizontally through
desired substrate increasing the total area being pumped per individual well (Allouche et al.
2000). The wells then undergo the process of hydraulic fracturing in which water, or a solution,
is pumped at high pressure through the well, resulting in fracturing of nearby oil reservoirs
creating pathways for the flow of oil and gas (Nordeng 2009, Wiseman 2009). These techniques
together have increased the potential amount of recoverable oil and have made commercial scale
of oil production possible (Mason 2012). As a result, the number of oil wells in North Dakota
has more than doubled in the past eight years (Figure 1). At the end of 2013 the state had more
than 9,600 active oil wells on its landscape, predominantly in the northwest portion (NDIC
2013).
The majority of oil and gas extracted in North Dakota comes from the Bakken and Three
Forks Formations which span throughout the western part of North Dakota into eastern Montana
and south central Canada (Meissner 1991, Gaswirth et al. 2013). These formations consist of the

2
Upper Devonian and Lower Mississippian layers within the Williston Basin and contain organic-
rich shale’s that have been documented as excellent petroleum sources (Dow 1974, Williams
1974, Schmoker 1996). Recent estimations claim there to be an average of 7,375 million barrels
of oil and 6,723 billion cubic feet of gas still extractable within these reserves located in the
United States (Gaswirth et al. 2013). Estimates also suggest that the portion of the Bakken
formation contained in North Dakota alone may sustain more than 38,000 oil wells and have the
potential to impact more than one seventh of the states 183,000 square kilometers (Mason 2012).
As global demands for energy resources continue to rise (IEA 2012), North Dakota has
benefited from gas and oil development through increased economic growth and employment
opportunities. In fact, North Dakota currently has the lowest unemployment rate as well as one
of the highest population growth rates in the country (BLS 2014, USCB 2014). In addition,
during the year 2012 the state produced 243.2 million barrels of oil which can sell for prices
ranging from approximately $70 to $120 per barrel (NDIC 2013). Although financially
favorable, energy development also brings substantial challenges in understanding and managing
the environmental impact of these activities (Dyke et al. 2010).
Various environmental impacts can result from disturbances associated with gas and oil
development. These disturbances include noise and light pollution, dust, traffic, road and housing
development, and fragmentation of the landscape (Pitman et al. 2005, Beck 2009, Copeland et al.
2009, Lawson et al. 2011, Mason 2012). North Dakota Game and Fish has recognized a
knowledge gap on these impacts affecting wildlife resources within the state (Dyke et al. 2010).
Furthermore, tourism related to these wildlife resources provided an estimated $269 million in
2006, and it is therefore of great interest to the state to study such impacts (USFWS 2006). Of

3
particular concern is the limited information available on North Dakota’s prairie grouse species
such as sharp-tailed grouse (Dyke et al. 2010).
SHARP-TAILED GROUSE ECOLOGY
Sharp-tailed grouse (Tympanuchus phasianellus) are one of three species of the genus
Tympanuchus, known as prairie grouse. They average in length between 41 and 47 cm, and
weigh approximately 600 to 1,110 grams, with males being slightly larger than females
(Connelly et al. 1998). They are stocky bird, with short legs, elongated central rectrices, and in
general are cryptic in coloration (Connelly et al. 1998). Like other gallinaceous species, sharp-
tailed grouse are well adapted for walking and running on the ground (Connelly et al. 1998).
Their range extends from the Rocky Mountains and Great Plains regions into the Northwest
Territories of Canada, and north to Alaska (Spaulding et al. 2006).
Sharp-tailed grouse are a popular game bird species throughout their range, and are
recognized as an indicator species of prairie ecosystems health (USFS 2002, Dyke et al. 2011).
As such, this species is of particular concern for the U.S. Forest Service and North Dakota Game
and Fish when making future prairie management decisions and understanding how landscape
changes may influence grassland birds (USFS 2002). Although sharp-tailed grouse have the
largest distribution of all prairie grouse species, its historic range has been reduced due to various
habitat alterations (Connelly et al. 1998, Akçakaya et al. 2004). This species is well established
throughout North Dakota but current threats to their habitat include disturbances related to gas
and oil development (Beck 2009, Dyke et al. 2010). Current literature on sharp-tailed grouse
response to such development is very limited and should be of concern for future studies (Beck
2009).

4
Habitat requirements vary between season and geographic location, but preferences
toward native grasslands, shrubs, and prairie habitat has been observed in the Midwest
populations (Giesen and Connelley 1993). Main dietary composition includes buds, grains,
seeds, fruits, other herbaceous matter, and insects (Connelly et al. 1998). Home ranges are
typically larger during the breeding and summer months compared to winter ranges when sharp-
tailed grouse become more reliant on riparian, woody, and shrubby areas for feeding and cover
(Connelly et al. 1998).
Detailed information on the reproductive ecology of sharp-tailed grouse can be found in
Connelly et al. (1998). Typically in the northwest populations, sharp-tailed grouse begin their
breeding season in early spring during the month of March or April (Drummer et al. 2011).
Males congregate at leks where they establish and defend individual territories while displaying
for females. In this male-dominated polygyny mating system, males compete for opportunities to
mate, with only a small number of dominate males successfully mating with multiple females
(Gratson et al. 1991). Males do not participate in any other reproductive aspects such as nest
construction, incubation of eggs, or rearing of chicks.
Nest locations are on average, between 0.4 and 1.8 km from the nearest lek (Connelly et
al. 1998). Selection of nest sites are correlated with habitat characteristics such as increased
vegetation height and increased cover at the nest site and the area surrounding the nest (Manzer
and Hannon 2005). Females typically begin laying eggs 1-3 days after successful copulation, and
on average lay 1 egg every 1-2 days thereafter. Eggs are ovate in shape, rufous brown in color,
and are often speckled. Average clutch size is 12 for the first nest attempt, with subsequent
attempts typically having fewer eggs. Incubation is reported to last on average 23 days, and
concludes with synchronous hatching (Connelly et al. 1998). Success of nests is often correlated

5
with habitat characteristics such as landscape composition, vegetation height, patch size, and
possibly edge density (Paton 1994, Manzer and Hannon 2005). Re-nesting typically occurs in
the event of a failed nest, but only one successful brood is reared per breeding season. Young are
born precocial and remain near the nest for 1 to 2 days after hatching. Young forage primarily on
insects and obtain most body growth and development within 12 weeks (Connelly et al. 1998).
Disturbances associated with of gas and oil development have the potential to affect
multiple aspects of sharp-tailed grouse ecology, both directly and indirectly. Impacts on nest
success of sharp-tailed grouse is an area of particular interest as it is one of the most important
factors influencing its reproductive success (Bergerud and Gratson 1988). However, studying
impacts on nest success alone may not be sufficient. Understanding how nest predator habitat use
is influenced by gas and oil disturbances is of equal importance as they are the main factor
potentially limiting nest success and reproductive potential (Ricklefs 1969, Bergerud and
Gratson 1988). Therefore, to gain a broad understanding of oil and gas development’s impacts on
sharp-tailed grouse nesting ecology we must also look at impacts experienced by their nest
predators.
NEST PREDATOR ECOLOGY
A number of species found in North Dakota are capable of depredating the eggs of sharp-
tailed grouse nests, including numerous medium-sized mammals, small mammals (e.g., ground
squirrels), raptors (typically by killing incubating hens), and members of the Corvidae family
(Côté and Sutherland 1997, Connelly et al. 1998, Sargeant et al. 1998, Chalfoun et al. 2002,
Seabloom 2011). Here, we focus on the medium-sized mammalian nest predators (hereafter
meso-mammals), as they are responsible for the majority of nest depredations reported for
6
similar ground nesting birds such as waterfowl and other gallinaceous species in the state.
Primary meso-mammal nest predators found in North Dakota include coyotes (Canis latrans),
striped skunks (Mephitis mephitis), American badgers (Taxidea taxus), raccoons (Procyon lotor),
and red fox (Vulpes vulpes) (Sargeant et al. 1998, Seabloom 2011).
Current populations of these five meso-mammal species are stable and distributed
throughout the entire state of North Dakota (Seabloom 2011, Tucker 2014). Although difference
exist between individual life history strategies (Seabloom 2011), collectively meso-mammals are
known to perform vital roles in the functioning of ecosystems as predators of a variety of prey
species (Palomares et al. 1995, Crooks and Soule 1999). For example, reduction of these
predators has been shown to positively influence nest success of many bird species (Sargeant et
al. 1995, Côté and Sutherland 1997, Chalfoun et al. 2002). In addition, these species consume
many smaller mammalian species (Seabloom 2011), which can have direct influences on small
mammal population dynamics (Korpimäki and Norrdahl 1998, Klemola et al. 2000).
Furthermore, these meso-mammals are an important furbearer species regularly targeted by
trappers in the state. During the 2013 trapping season alone, approximately one million dollars
were spent by North Dakota fur buyers on pelts from all furbearer species found in the state
(Tucker 2014). Therefore, impacts of energy development on these meso-mammals may have
indirect implications on prey species populations, such as sharp-tailed grouse, as well as the
economy of the state.
Depending on individual tolerance levels, meso-mammal species will most likely respond
to disturbances related to energy development to various degrees. For example, gas and oil
development introduces a variety of infrastructure such as access roads, buildings, camp sites,
drill pads, and power lines (Weller et al. 2002). Coyotes and raccoons are more likely to adapt to

7
such structures, as they are known to be tolerant to human activity and disturbances (George and
Crooks 2006, Gehrt 2007, Ordeñana et al. 2010). In contrast, red fox, American badgers, and
skunks are known to be less adaptable to such pressures and may therefore express less tolerance
or even avoidance (Crooks 2002, Ordeñana et al. 2010, Seabloom 2011).
Areas of gas and oil development also experience large increases of vehicle traffic
associated with the construction, drilling, and maintenance of oil wells (Wilke et al. 2011). This
increase may have the indirect effect of meso-mammals shifting their movement behavior away
from roads, or directly through mortality caused by vehicle collisions. In fact, a primary cause of
mortality for these meso-mammal species is vehicle collisions (Ashley and Robinson 1996,
Tigas et al. 2002, Gehrt 2005, Gosselink et al. 2007, Kinley and Newhouse 2008). Likewise,
energy development produces high levels of chronic noise which has been found to negatively
impact a variety of different taxa (Barber et al. 2010).
Gas and oil development may also have possible benefits on these meso-mammals as it
has the potential to increase fragmentation of the landscape (Copeland et al. 2009, Mason 2012).
In general, these species thrive in fragmented landscape by exploiting habitat edges when
traveling and foraging for prey items (Andrén 1995, Dijak and Thompson III 2000, Kuehl and
Clark 2002, Batary and Baldi 2004).
Meso-mammals are often times understudied and overlooked compared to the more
charismatic or game species. However, their significance on the ecology of other species
warrants evaluation when studying the impacts of large scale environmental pressures such as
energy development. Unfortunately, research is currently lacking on this subject.

8
POTENTIAL IMPACTS OF GAS AND OIL ON WILDLIFE
Ecological impacts of energy development have gained a great deal of attention in recent
years over the concern for the management and conservation of wildlife and their habitats. While
research is still limited, numerous efforts have been made to understand how wildlife are
impacted as energy development continues to rapidly expand across the country (Copeland et al.
2009). These studies have examined multiple ecological aspects on a wide array of taxa inducing
both birds and mammals.
Greater sage-grouse (Centrocercus urophasianus) inhabit 11 states and are the largest of
the North American grouse species (Schroeder et al. 1999). Sage-grouse have been extensively
studied due to various reasons that warrant possible protection under the Endangered Species Act
of 1973, including impacts related to energy development (Hess and Beck 2012). Lek
abandonment, decreased lek attendance, and reduced occurrence of greater sage-grouse has been
contributed to oil well density (Harju et al. 2010, Hess and Beck 2012), proximity to fields with
natural gas development (Walker et al. 2007), drilling activities (Taylor et al. 2013), and general
anthropogenic disturbances related to energy development (Smith et al. 2014). Other aspects
affected by energy development include nest site locations and yearling survival rates in areas
with natural gas infrastructure (Holloran et al. 2010). Nest initiation rates also have been reduced
by vehicle traffic and proximity to oil wells (Lyon and Anderson 2003).
Other avian species that have been studied with respect to energy development include
songbirds (Gilbert and Chalfoun 2011) and grassland bird species (Lawson et al. 2011). In both
cases, overall abundance has been shown to decrease with oil well density. Nest site selection for
the threatened lesser prairie chicken (Tympanuchus pallidicinctus) is also influenced by factors

9
relating to energy development, such as transmission lines, oil pads, and buildings (Pitman et al.
2005).
Research also has been conducted on a number of mammalian species responses to
energy development, although most has focused on species that peak public interest such as the
larger, more charismatic mammals. Caribou (Rangifer tarandus) density has been shown to be
inversely related to road densities in oil-field regions of Alaska (Nellemann and Cameron 1998),
and in general this species shows avoidance toward human disturbance and an increase in
activity levels near these disturbances (Wolfe et al. 2000). Avoidance of roads and increased
mortality by vehicle collisions and hunting along roads has also been documented (Wolfe et al.
2000). These affects are reported as being particularly apparent for females and calves
(Nellemann and Cameron 1998, Wolfe et al. 2000).
Sawyer et al. (2002) predicted oil and gas development to reduce winter ranges, increase
density, reduce forage quality, and possibly reduce fawn survival of mule deer (Odocoileus
hemionus) and pronghorn (Antilocapra americana) in Wyoming. Sawyer et al. (2006) later found
female mule deer to be selecting habitat away from well pads, even if the habitat was of lower
quality. Similar findings have been shown with elk (Cervus elaphus) shifting their home ranges
and areas of use away from drilling activities and oil wells (Van Dyke and Klein 1996).
Here we address similar research questions pertaining to gas and oil developments
impacts on the nesting ecology of sharp-tailed grouse in North Dakota. Like all species, the
reproductive ecology of sharp-tailed grouse is a dynamic and complex process with numerous
factors influencing success. As described above, nest depredation is the primary reproductive
limiting factor for sharp-tailed grouse. Therefore, we are also addressing how nest predators are
impacted by energy development. Whereas some research may focus only on one of these

10
aspects at a time, we are taking a holistic approach looking at both simultaneously to better
understand the complex system of sharp-tailed grouse nesting ecology.
STUDY OBJECTIVES AND HYPOTHESES
This study aims to develop baseline data on gas and oil development’s effects on sharp-
tailed grouse nesting ecology and nest predator dynamics in western North Dakota. In order to
accomplish this we (I) estimated daily nest survival and cause-specific nest mortalities for sharp-
tailed grouse with respect to energy development (Chapter 2), and (II) evaluated relationships of
gas and oil development on occupancy rates of mammalian nest predators on the landscape
(Chapter 3). Additionally, we explored relationships between nest success (objective I) and nest
predator occupancy (objective II) in the final chapter (Chapter 4).
The research presented here will help clarify how the predator-prey interactions of sharp-
tailed grouse nests are potentially altered through disturbances caused by oil and gas
development in North Dakota. Together, the study objectives addressed here coupled with
additional research being conducted on other demographic processes (e.g., chick and hen
survival, lek attendance) will facilitate the broader understanding of energy developments impact
on sharp-tailed grouse populations in North Dakota. Before beginning this work, we
hypothesized the following three scenarios and rationale as possible results to occur from our
research.
(1) Areas of intense gas and oil development will have greater sharp-tailed grouse daily nest
survival rates and lower nest predator occupancy rates compared to areas outside of energy
development.

11
Here, we predict daily nest survival rates to be positively correlated with areas containing
gas and oil development. Because nest success is often driven by predation, we also predict nest
predator occupancy to be negative correlated with gas and oil development. In this scenario,
energy development may be indirectly improving sharp-tailed grouse nest success by negatively
influencing the local nest predator community.
Disturbances associated with energy development may be causing nest predators to
actively avoid such areas. For example, mammalian abundance has been shown to be negatively
influenced in relation to proximity to human infrastructure (Benítez-López et al. 2010). Energy
development also produces high levels of chronic noise which has been found to negatively
impact a variety of different taxa (Barber et al. 2010). Additionally, areas under development
experience substantial increases in vehicle traffic (Wilke et al. 2011), which may increase direct
mortality of mammalian predators through increased rates of vehicle collisions (Ashley and
Robinson 1996, Tigas et al. 2002, Gehrt 2005, Gosselink et al. 2007, Kinley and Newhouse
2008). Reduced nest predator occurrence may then lead to increases in nest success. Similar
affects have been seen in predator removal studies for different taxa (Sargeant et al. 1995, Côté
and Sutherland 1997, Chalfoun et al. 2002).
(2) Areas of intense gas and oil development will have lower sharp-tailed grouse daily nest
survival rates and higher nest predator occupancy rates compared to areas outside of energy
development.
Here, we predict daily nest survival rates to be negatively correlated with areas
containing gas and oil development, and predator occupancy to be positively correlated with
such areas. Possible explanations for reduced nest success include direct nest destruction or hen

12
abandonment caused by activities associated with energy development. Indirect causes include
increased nest predator activity or reduced quality of nesting habitat.
Activities relating to gas and oil development have the potential to increase fragmentation
of the landscape (Copeland et al. 2009, Mason 2012). Increased fragmentation and habitat edges
have been linked to increased depredation of various ground nesting birds (Kuehl and Clark
2002, Batary and Baldi 2004). Nest predators may therefore benefit from these activities by
exploiting habitat edges and reducing nest success of sharp-tailed grouse in areas containing gas
and oil development. Nest depredation of sharp-tailed grouse nests and similar species have also
been shown to be related to the vegetation structure at the nesting site (Gregg and Crawford
1994, Manzer and Hannon 2005). If nesting habitat is lower in quality in areas containing gas
and oil development, they may therefore experience increased depredation.
(3) No effect on either nest survival rates of predator occupancy will be observed.
The hypothesis of no difference in either nest survival rates, nor nest predator occupancy
will be detected. This may be due to no true effect of energy development acting on the system,
or our inability to quantitatively measure such an effect. In addition, gas and oil development is
a dynamic process that progresses through various stages differing in activity intensities. This
process can take place over a large temporal scale, and therefore impact species to various
degrees throughout time. The course of this study may not have been adequately long enough to
have captured effects on either nest success or nest predator occupancy. Regardless of the results
observed here, research should continue to measure such impacts as energy development
continues to expand throughout North Dakota.

13
METHODOLOGY
Study Areas
We conducted our research in western North Dakota where gas and oil development
activity is most intense within the state. Our goal was to gather data on sharp-tailed grouse nests
and mammalian nest predators from areas with similar land use but substantial differences in gas
and oil development intensities. Therefore, we established two study areas based on their relative
oil well densities and habitat composition. One area was heavily exposed to gas and oil
development activities, and the other was on the skirts of this development where minimum gas
and oil activities were occurring. Both areas were similarly dominated by agriculture practices,
hay land, and pastures.
During the summers of 2012 and 2013 we assessed the impacts of gas and oil
development on sharp-tailed grouse nesting ecology and nest predators within these areas. To
accomplish our objectives we used a combination of the tools and techniques highlighted in the
following sections. Specific methodology of field and data analysis techniques are described in
chapters 2 and 3.
Objective I) Estimate daily nest survival and cause-specific nest mortality for sharp-tailed
grouse with respect to energy development (Chapter 2).
Nesting data is commonly collected by monitoring nests throughout a species
reproductive season until they either successfully hatch or fail. Frequently, radio telemetry
equipment is used to locate these nests by tracking the locations of radio-marked hens. However,
monitoring nest periodically using radio telemetry has its inherent problems. For example,

14
researchers are often logistically restricted to checking nests periodically rather than daily. In
addition, without continuous and direct observation of the nest it can be difficult to accurately
fate the nest, determine specific timing of the fate, or determine specific failure causes (Ribic et
al. 2012). Such drawbacks ultimately limit our ability to make inferences on nesting ecology.
Monitoring nests with video cameras has become a popular way to address such
challenges. Advancements in technology have given rise to camera systems that are affordable,
capable of storing large amounts of data on portable memory devices, and can continuously
record for prolonged periods of time (Cox et al. 2012). Because of this, video cameras have
received a great deal of attention in wildlife research in recent years, particularly as a reliable
method for observing avian nests (Ribic et al. 2012). These systems provide biologists the
opportunity to study multiple aspects of avian nesting ecology while eliminating the need for
researcher presence (Ellis-Felege and Carroll 2012). Gathering such a wealth of information has
historically been both financially and logistically challenging (Weller and Derksen 1972).
Studies have used nest cameras to address numerous research questions regarding nest
depredation, feeding ecology, parental behavior at the nest, parental time budgeting, and general
nesting behavior (Cox et al. 2012, Ellis-Felege and Carroll 2012). However, identification of
specific nest predators has received the most attention in nest camera studies (Cox et al. 2012).
These studies have since discovered that accurately identifying nest predators is extremely
difficult without the use of cameras (Thompson III et al. 1999, Pietz and Granfors 2000).
An additional benefit of using nest cameras as opposed to radio telemetry alone, is the
ability to precisely determine when a nest has hatched or failed. This gives researchers the ability
to more accurately determine daily survival rates. Unlike apparent nest success, or simply the
proportion of successful nests, daily nest survival determines the probability a nest will persist on

15
a daily basis while correcting for the fact not all nests are found on the same day of incubation
(Mayfield 1975). Without this correction, nest success can be severely overestimated (Mayfield
1975).
Modeling daily nest survival has become a popular way to analyze nesting data as it
allows for the incorporation of individual nest site covariates (Dinsmore et al. 2002, Rotella et al.
2004). Such covariates are almost certainly important in understanding the differences between
successful and unsuccessful nests. This analysis can easily be done using a variety of computer
programs, including Programs MARK (White and Burnham 1999) and SAS (SAS Institute
2005). Multi-model inference can then be used to determine what covariates best explain the
patterns of nest survival present within the data (Burnham and Anderson 2002).
Objective II) Evaluate potential impacts of gas and oil development on occupancy rates of
mammalian nest predators on the landscape (Chapter 3).
Monitoring meso-mammals is generally difficult as most are crepuscular or nocturnal, as
well as cryptic and elusive (Seabloom 2011). Because of this, we rarely detect them at a site even
when they are present. In fact, detection probabilities of wildlife are rarely perfect, and if not
accounted for may lead to biased estimates of the species status (MacKenzie et al. 2003, Conroy
and Carroll 2009). Occupancy analysis estimates the probability of a site to be occupied by the
target species, while correcting for this imperfect detection (MacKenzie et al. 2002, MacKenzie
et al. 2006). To do this, occupancy analysis requires survey sites to be surveyed multiple times to
gather both detection and non-detection data for the target species (MacKenzie et al. 2006). This

16
data allows for the estimation of detection rates, which are then incorporated into the estimation
of occupancy (MacKenzie et al. 2002).
Camera trapping has become a popular and widely used method for collecting such
detection data on a variety of different taxa (O'Connell et al. 2006, Lyra-Jorge et al. 2008,
Rowcliffe and Carbone 2008). Camera traps record detections by taking a photograph of species
within the cameras field of view that successfully trips its infrared or motion sensors. To attract
species, lures such as a scented bait or food reward are often employed in front of the camera.
This technique allows a site to be surveyed for extended lengths of time without the need for
researcher presence. In addition, technology has made the use of cameras affordable and
logistically favorable with increased memory storage and battery life (Locke et al. 2012).
Camera trapping is also effective when conducting a multi-species monitoring study, and has
been shown to outperform other methods such as track plates and hair traps for detecting species
(O'Connell et al. 2006, Lyra-Jorge et al. 2008). However, camera traps are less efficient at
detecting smaller mammals that are unable to trip the cameras sensors, or species that tend to
show avoidance toward novel items such as coyotes (Gompper et al. 2006).
Occupancy analysis enables relationships between detection and occupancy to be
explored through the incorporation of covariates specific to individual survey sites (MacKenzie
et al. 2002). It can be modeled using such covariates in a variety of programs, including Program
MARK (White and Burnham 1999) and PRESENCE (MacKenzie et al. 2006). Multi-model
inference can then be used to determine what covariates best explain the pattern of species
occurrence within the data (Burnham and Anderson 2002).
Findings from this work will add to the knowledge gap on energy developments impacts
on wildlife. Of particular importance is how we manage wildlife species in the future as the large

17
scale environmental pressures of energy development continue to expand in North Dakota. Both
sharp-tailed grouse and the meso-mammal nest predator community play integral parts in the
ecology of the prairie ecosystem throughout the state. Additionally, revenue related to the
hunting, trapping, and recreational watching of these species is substantial to the state’s
economy. Continued research on this subject will ultimately aid in the understanding and
mitigation of energy developments impacts on local ecosystems.

18
LITERATURE CITED
Akçakaya, H. R., V. C. Radeloff, D. J. Mladenoff, and H. S. He. 2004. Integrating Landscape
and Metapopulation Modeling Approaches: Viability of the Sharp-Tailed Grouse in a
Dynamic Landscape. Conservation Biology 18:526-537.
Allouche, E. N., S. T. Ariaratnam, and J. S. Lueke. 2000. Horizontal Directional Drilling: Profile
of an Emerging Industry. Journal of Construction Engineering and Management 126:68-
76.
Andrén, H. 1995. Effects of landscape composition on predation rates at habitat edges. Pages
225-255 in L. Hansson, L. Farig, andG. Marriam, editors. Mosaic landscapes and
ecological processes. Springer Netherlands, London, United Kingdom.
Ashley, E. P., and J. T. Robinson. 1996. Road mortality of amphibians, reptiles and other
wildlife on the Long Point Causeway, Lake Erie, Ontario. Canadian Field Naturalist
110:403-412.
Ausick, P., and M. B. Sauter. 2013. The 10 most oil-rich states. in USA Today. 24/7 Wall St.,
New York, NY.
Barber, J. R., K. R. Crooks, and K. M. Fristrup. 2010. The costs of chronic noise exposure for
terrestrial organisms. Trends in Ecology & Evolution 25:180-189.
Batary, P., and A. Baldi. 2004. Evidence of an edge effect on avian nest success. Conservation
Biology 18:389-400.

19
Beck, J. L. Impacts of oil and natural gas on prairie grouse: current knowledge and research
needs., Pages 66-87 in Conference Impacts of oil and natural gas on prairie grouse:
current knowledge and research needs. R. I. Barnhisel. 3134 Montavesta Rd., Lexington,
KY 40502.
Benítez-López, A., R. Alkemade, and P. A. Verweij. 2010. The impacts of roads and other
infrastructure on mammal and bird populations: a meta-analysis. Biological conservation
143:1307-1316.
Bergerud, A. T., and M. W. Gratson. 1988. Adaptive strategies and population ecology of
northern grouse. University of Minnesota Press, Minneapolis.
Burnham, K. P., and D. R. Anderson. 2002. Model selection and multimodel inference : a
practical information-theoretic approach. 2nd edition. Springer, New York.
Chalfoun, A. D., F. R. Thompson, and M. J. Ratnaswamy. 2002. Nest predators and
fragmentation: a review and meta-analysis. Conservation Biology 16:306-318.
Connelly, J. W., M. W. Gratson, and K. P. Reese. 1998. Sharp-tailed Grouse (Tympanuchus
phasianellus). The Birds of North America Online (A. Poole, Ed.). Ithaca: Cornell Lab of
Ornithology. <http://bna.birds.cornell.edu/bna/>. Accessed 29 May 2013.
Conroy, M. J., and J. P. Carroll. 2009. Quantitative conservation of vertebrates. Wiley-
Blackwell, Chichester, West Sussex, UK ; Hoboken, NJ.
Copeland, H. E., K. E. Doherty, D. E. Naugle, A. Pocewicz, and J. M. Kiesecker. 2009. Mapping
Oil and Gas Development Potential in the US Intermountain West and Estimating
Impacts to Species. PLoS ONE 4:1-7.
Côté, I. M., and W. J. Sutherland. 1997. The effectiveness of removing predators to protect bird
populations. Conservation Biology 11:395-405.

20
Cox, W. A., M. S. Pruett, T. J. Benson, S. J. Chiavacci, and F. R. Thompson III. 2012.
Development of Camera Technology for Monitoring Nests. Pages 185-210 in C. A.
Ribic, F. R. Thompson, andP. J. Pietz, editors. Video surveillance of nesting birds.
Studies in Avian Biology (no. 43). University of California Press, Berkeley, CA.
Crooks, K. R. 2002. Relative sensitivities of mammalian carnivores to habitat fragmentation.
Conservation Biology 16:488-502.
Crooks, K. R., and M. E. Soule. 1999. Mesopredator release and avifaunal extinctions in a
fragmented system. Nature 400:563-566.
Dijak, W. D., and F. R. Thompson III. 2000. Landscape and edge effects on the distribution of
mammalian predators in Missouri. The Journal of Wildlife Management 64:209-216.
Dinsmore, S. J., G. C. White, and F. L. Knopf. 2002. Advanced techniques for modeling avian
nest survival. Ecology 83:3476-3488.
Dow, W. G. 1974. Application of oil-correlation and source-rock data to exploration in Williston
basin. AAPG bulletin 58:1253-1262.
Drummer, T. D., R. G. Corace Ii, and S. J. Sjogren. 2011. Sharp-Tailed Grouse Lek Attendance
and Fidelity in Upper Michigan. Journal of Wildlife Management 75:311-318.
Dyke, S., D. Fryda, D. Kleyer, J. Williams, B. Hosek, W. Jensen, S. Johnson, A. Robinson, B.
Ryckman, B. Stillings, M. Szymanski, S. Tucker, and B. Wiedmann. 2010. Potential
impacts of oil and gas development on select North Dakota natural resources: a report to
the director. North Dakota Game and Fish Department, Bismarck, ND.

21
Ellis-Felege, S. N., and J. P. Carroll. 2012. Gamebirds and Nest Cameras: Present and Future.
Pages 35-44 in C. A. Ribic, F. R. Thompson, andP. J. Pietz, editors. Video surveillance of
nesting birds. Studies in Avian Biology (no. 43). University of California Press,
Berkeley, CA.
Gaswirth, S. B., K. R. Marra, T. A. Cook, R. R. Charpentier, D. L. Gautier, D. K. Higley, T. R.
Klett, M. D. Lewan, P. G. Lillis, C. J. Schenk, M. E. Tennyson, and K. J. Whidden. 2013.
Assessment of undiscovered oil resources in the Bakken and Three Forks formations,
Williston Basin Province, Montana, North Dakota, and South Dakota, 2013: USGS
national assessment of oil and gas fact sheet 2013-3013.4p.
Gehrt, S. D. 2005. Seasonal survival and cause-specific mortality of urban and rural striped
skunks in the absence of rabies. Journal of Mammalogy 86:1164-1170.
_____. 2007. Ecology of coyotes in urban landscapes. Wildlife Damage Management
Conferences, Proceedings. Paper 63.
George, S. L., and K. R. Crooks. 2006. Recreation and large mammal activity in an urban nature
reserve. Biological conservation 133:107-117.
Giesen, K. M., and J. W. Connelley. 1993. Guidelines for management of Columbian sharptailed
grouse habitats. Wildlife Society Bulletin 21:325-333.
Gilbert, M. M., and A. D. Chalfoun. 2011. Energy development affects populations of sagebrush
songbirds in Wyoming. The Journal of Wildlife Management 75:816-824.
Gompper, M. E., R. W. Kays, J. C. Ray, S. D. Lapoint, D. A. Bogan, and J. R. Cryan. 2006. A
comparison of noninvasive techniques to survey carnivore communities in northeastern
North America. Wildlife Society Bulletin 34:1142-1151.

22
Gosselink, T. E., T. R. Deelen, R. E. Warner, and P. C. Mankin. 2007. Survival and cause-
specific mortality of red foxes in agricultural and urban areas of Illinois. The Journal of
Wildlife Management 71:1862-1873.
Gratson, M. W., G. K. Gratson, and A. T. Bergerud. 1991. Male Dominance and Copulation
Disruption Do Not Explain Variance in Male Mating Success on Sharp-Tailed Grouse
(Tympanuchus phasianellus) Leks. Behaviour 118:187-213.
Gregg, M. A., and J. A. Crawford. 1994. Vegetational cover and predation of sage grouse nest in
Oregon. Journal of Wildlife Management 58:162-166.
Harju, S. M., M. R. Dzialak, R. C. Taylor, L. D. Hayden-Wing, and J. B. Winstead. 2010.
Thresholds and Time Lags in Effects of Energy Development on Greater Sage-Grouse
Populations. Journal of Wildlife Management 74:437-448.
Hess, J. E., and J. L. Beck. 2012. Disturbance factors influencing greater sage-grouse lek
abandonment in north-central Wyoming. Journal of Wildlife Management 76:1625-1634.
Holloran, M. J., R. C. Kaiser, and W. A. Hubert. 2010. Yearling greater sage-grouse response to
energy development in Wyoming. Journal of Wildlife Management 74:65-72.
Internation Energy Agency (IEA). 2012. World energy outlook 2012.
<http://www.worldenergyoutlook.org> Accessed 2014 April 1.
Kinley, T. A., and N. J. Newhouse. 2008. Ecology and Translocation-Aided Recovery of an
Endangered Badger Population. The Journal of Wildlife Management 72:113-122.
Klemola, T., M. Koivula, E. Korpimäki, and K. Norrdahl. 2000. Experimental tests of predation
and food hypotheses for population cycles of voles. Proceedings of the Royal Society of
London. Series B: Biological Sciences 267:351-356.

23
Korpimäki, E., and K. Norrdahl. 1998. Experimental reduction of predators reverses the crash
phase of small-rodent cycles. Ecology 79:2448-2455.
Kuehl, A. K., and W. R. Clark. 2002. Predator activity related to landscape features in northern
Iowa. The Journal of Wildlife Management 66:1224-1234.
Lawson, A. L., M. L. Morrison, and R. D. Slack. 2011. Impacts of Oil and Gas Development on
Wintering Grassland Birds at Padre Island National Seashore, Texas. Southeastern
Naturalist 10:303-320.
Locke, S. L., I. D. Parker, and R. R. Lopez. 2012. Use of Remote Camera in Wildlife Ecology.
Pages 311-318 in N. J. Silvy, editor. The Wildlife Techniques Manual. Johns Hopkins
University Press, Baltimore, MD.
Lyon, A. G., and S. H. Anderson. 2003. Potential gas development impacts on sage grouse nest
initiation and movement. Wildlife Society Bulletin 31:486-491.
Lyra-Jorge, M. C., G. Ciocheti, V. R. Pivello, and S. T. Meirelles. 2008. Comparing methods for
sampling large-and medium-sized mammals: camera traps and track plots. European
Journal of Wildlife Research 54:739-744.
MacKenzie, D. I., J. D. Nichols, J. E. Hines, M. G. Knutson, and A. D. Franklin. 2003.
Estimating site occupancy, colonization and local extinction when a species is detected
imperfectly. Ecology 84:2200-2207.
MacKenzie, D. I., J. D. Nichols, G. B. Lachman, S. Droege, J. Andrew Royle, and C. A.
Langtimm. 2002. Estimating site occupancy rates when detection probabilities are less
than one. Ecology 83:2248-2255.

24
MacKenzie, D. I., J. A. Royle, J. D. Nichols, K. H. Pollock, L. L. Bailey, and J. E. Hines. 2006.
Occupancy estimation and modeling: inferring patterns and dynamics of species
occurrence. Acedemic, New York, New York, USA.
Manzer, D. L., and S. J. Hannon. 2005. Relating grouse nest success and corvid density to
habitat: a multi-scale approach. Journal of Wildlife Management 69:110-123.
Mason, J. 2012. Oil production potential of the North Dakota Bakken. Oil and Gas Journal
110:76-86.
Mayfield, H. F. 1975. Suggestions for calculating nest success. The Wilson Bulletin 87:456-466.
Meissner, F. F. 1991. Petroleum geology of the Bakken Formation, Williston basin, North
Dakota and Montana. Montana Geological Soceity: Guidebook to Geology and
Horizontal Drilling of the Bakken Formation:19-42.
Nellemann, C., and R. Cameron. 1998. Cumulative impacts of an evolving oil-field complex on
the distribution of calving caribou. Canadian journal of Zoology 76:1425-1430.
Nordeng, S. 2009. The Bakken petroleum system: An example of a continuous petroleum
accumulation. North Dakota Department of Mineral Resources Newsletter 36:21-24.
Nordeng, S. 2010. A brief history of oil production from the Bakken Formation in the Williston
Basin. NDGS newsletter 37:5-9.
North Dakota Industrial Commission. (NDIC). 2013. Department of Mineral Resources, Oil and
Gas Division. https://www.dmr.nd.gov/oilgas/.
O'Connell, A. F., Jr., N. W. Talancy, L. L. Bailey, J. R. Sauer, R. Cook, and A. T. Gilbert. 2006.
Estimating site occupancy and detection probability parameters for meso- and large
mammals in a coastal ecosystem. Journal of Wildlife Management 70:1625-1633.

25
Ordeñana, M. A., K. R. Crooks, E. E. Boydston, R. N. Fisher, L. M. Lyren, S. Siudyla, C. D.
Haas, S. Harris, S. A. Hathaway, and G. M. Turschak. 2010. Effects of urbanization on
carnivore species distribution and richness. Journal of Mammalogy 91:1322-1331.
Palomares, F., P. Gaona, P. Ferreras, and M. Delibes. 1995. Positive effects on game species of
top predators by controlling smaller predator populations: An example with lynx,
mongooses, and rabbits. Conservation Biology 9:295-305.
Paton, P. W. 1994. The effect of edge on avian nest success: how strong is the evidence?
Conservation Biology 8:17-26.
Pietz, P. J., and D. A. Granfors. 2000. Identifying predators and fates of grassland passerine nests
using miniature video cameras. Journal of Wildlife Management 64:71-87.
Pitman, J. C., C. A. Hagen, R. J. Robel, T. M. Loughin, and R. D. Applegate. 2005. Location and
success of Lesser Prairie-Chicken nests in relation to vegetation and human disturbance.
The Journal of Wildlife Management 69:1259-1269.
Ribic, C. A., F. R. Thompson, and P. J. Pietz. 2012. Video surveillance of nesting birds.
University of California Press, Berkeley, CA.
Ricklefs, R. E. 1969. An analysis of nesting mortality in birds. Smithsonian Contributions to
Zoology 9:1-48.
Rotella, J. J., S. J. Dinsmore, and T. L. Shaffer. 2004. Modeling nest-survival data: a comparison
of recently developed methods that can be implemented in MARK and SAS. Animal
Biodiversity and Conservation 27:187-204.
Rowcliffe, J. M., and C. Carbone. 2008. Surveys using camera traps: are we looking to a brighter
future? Animal Conservation 11:185-186.

26
Sargeant, A. B., M. A. Sovada, and R. J. Greenwood. 1998. Interpreting evidence of depredation
of duck nests in the prairie pothole region. U.S. Geological Survey, Northern Prairie
Wildlife Research Center, Jamestown, ND and Ducks Unlimited, Inc., Mamphis, TN.
Sargeant, A. B., M. A. Sovada, and T. L. Shaffer. 1995. Seasonal predator removal relative to
hatch rate of duck nests in waterfowl production areas. Wildlife Society Bulletin:507-
513.
SAS Institute. 2005. SAS 9.1.3 Help and Documentation. SAS Institute Inc., Cary, North
Carolina.
Sawyer, H., F. Lindzey, D. McWhirter, and K. Andrews. Potential effects of oil and gas
development on mule deer and pronghorn populations in western Wyoming, Pages 350-
365 in Conference Potential effects of oil and gas development on mule deer and
pronghorn populations in western Wyoming. J. Rahm. Washington, DC.
Sawyer, H., R. M. Nielson, F. Lindzey, and L. L. McDONALD. 2006. Winter habitat selection
of mule deer before and during development of a natural gas field. Journal of Wildlife
Management 70:396-403.
Schmoker, J. W. 1996. A resource evaluation of the Bakken formation (upper devonian and
lower mississippian) continuous oil accumulation, Williston Basin, North Dakota and
Montana. The Mountaint Geologist 33:1-10.
Schroeder, M. A., J. R. Young, and C. E. Braun. 1999. Greater Sage-Grouse (Centrocercus
urophasianus), The Birds of North America Online (A. Poole, Ed.). Ithaca: Cornell Lab
of Ornithology. <http://bna.birds.cornell.edu/bna/>. Accessed 17 Sept 2012.
Seabloom, R. 2011. The mammals of North Dakota. Institute for Regional Studies, NDSU,
Fargo, N.D.

27
Smith, K. T., C. P. Kirol, J. L. Beck, and F. C. Blomquist. 2014. Prioritizing winter habitat
quality for greater sage-grouse in a landscape influenced by energy development.
Ecosphere 5:ArticleNo.:15.
Spaulding, A. W., K. E. Mock, M. A. Schroeder, and K. I. Warheit. 2006. Recency, range
expansion, and unsorted lineages: implications for interpreting neutral genetic variation
in the sharp-tailed grouse (Tympanuchus phasianellus). Molecular Ecology 15:2317-
2332.
Taylor, R. L., J. D. Tack, D. E. Naugle, and L. S. Mills. 2013. Combined Effects of Energy
Development and Disease on Greater Sage-Grouse. PLoS ONE 8:1-10.
Thompson III, F. R., W. Dijak, and D. E. Burhans. 1999. Video identification of predators at
songbird nests in old fields. The Auk 116:259-264.
Tigas, L. A., D. H. Van Vuren, and R. M. Sauvajot. 2002. Behavioral responses of bobcats and
coyotes to habitat fragmentation and corridors in an urban environment. Biological
conservation 108:299-306.
Tucker, S. 2014. Study No. E-11: Furbearer Harvest Regulations Study. North Dakota Game and
Fish Department.
United States Census Bureau (USCB). 2014. State and County QuickFacts. United State
Department of Commerce. Available at: http://www.census.gov/.
United States Forest Service (USFS). 2002. Record of decision for Dakota prairie grasslands :
final environmental impact statement and land and resource management plan. Forest
Service, U.S. Dept. of Agriculture, Missoula, MT.

28
USFWS. U.S. Department of Interior, Fish and Wildlife Service, U.S., U.S. Department of
Commerce, U.S. Bureau of Census. 2006. 2006 National survey of fishing, hunting, and
wildlife-associated recreation.
Van Dyke, F., and W. C. Klein. 1996. Response of elk to installation of oil wells. Journal of
Mammalogy 77:1028-1041.
Walker, B. L., D. E. Naugle, and K. E. Doherty. 2007. Greater Sage-Grouse Population
Response to Energy Development and Habitat Loss. Journal of Wildlife Management
71:2644-2654.
Weller, C., P. Thompson, P. Morton, and G. Aplet. 2002. Fragmenting our lands: the ecological
footprint from oil and gas development. The Wilderness Society, Washington, D.C.,
USA.
Weller, M. W., and D. V. Derksen. 1972. Use of time-lapse photography to study nesting
activities of birds. The Auk 89:196-200.
White, G. C., and K. P. Burnham. 1999. Program MARK: survival estimation from populations
of marked animals. Bird Study 46:120-139.
Wilke, P. W., P. P. Engineer, and M. Harrell. Assessment of Impact of Energy Development
Projects on Local Roads. 2011.
Williams, J. A. 1974. Characterization of oil types in Williston Basin. American Association of
Petroleum Geologists Bulletin 58:1243-1252.
Wiseman, H. 2009. Untested waters: the rise of hydraulic fracturing in oil and gas production
and the need to revisit regulation. Fordham Environmental Law Review 20:115-170.
Wolfe, S. A., B. Griffith, and C. A. Gray Wolfe. 2000. Response of reindeer and caribou to
human activities. Polar Research 19:63-73.

29
0
2000
4000
6000
8000
10000
Pro
du
cin
g W
ells
in
Nort
h D
ak
ota
Year
Figure 1. Number of actively producing oil wells per year in North Dakota (1951-
August, 2013). Data taken from the North Dakota Industrial Commission (NDIC
2013).

30
IMPACTS OF GAS AND OIL DEVELOPMENT ON SHARP-TAILED GROUSE NEST
SURVIVAL AND CAUSE SPECIFIC NEST MORTALITY IN WESTERN NORTH
DAKOTA
ABSTRACT
Recent advancements in extraction technologies are resulting in rapid increases of gas and oil
development in western North Dakota. This expansion of energy development may have
unknown effects on local wildlife populations and the ecological interactions within and among
species. Sharp-tailed grouse (Tympanuchus phasianellus) are a popular upland game bird species
that inhabit the grassland habitat found throughout the state. Currently, this habitat is being
threatened by fragmentation, noise, light, and other disturbances caused by energy development.
Potential impacts of gas and oil development on the nest success of sharp-tailed grouse is an area
of particular concern as it is an important factor influencing reproductive success. To evaluate
energy development impacts on nest success, we established two study areas that represent areas
of high and low energy development intensities in western North Dakota. During the summers of
2012 and 2013, we monitored a total of 163 grouse nests using telemetry. Of these, 90 also were
monitored using miniature cameras to accurately determine nest fates and estimate nest predator
frequencies. We evaluated various nest site characteristics on daily nest survival using Program
MARK. American badgers (Taxidea taxus) and striped skunks (Mephitis mephitis) were the
primary nest predators, accounting for 56.7% of all video recorded nest depredations. Top
models included predictors of study area and whether or not the nest was monitored with a
camera. Nests in our high intensity gas and oil area were 1.95 times more likely to succeed

31
compared to our minimal intensity area. Model average estimated daily nest survival was 0.975
(CI = 0.963-0.984) in the high intensity area, and 0.955 (CI = 0.937-0.967) in the low intensity
area. Camera monitored nests were 2.03 times more likely to succeed than non-camera
monitored nests. These results complement our findings in a related study finding a negative
relationship between nest predator occupancy and energy development, illustrating the potential
influences in and around areas of gas and oil development on sharp-tailed grouse nesting ecology
in western North Dakota.
INTRODUCTION
North Dakota first began extracting oil in 1951 (Nordeng 2010), and is now one of the
leading producers of oil in the United States (Ausick and Sauter 2013). However, it wasn’t until
the early 2000’s that North Dakota experienced this significant increase in oil production with
the advent of hydraulic fracturing in conjunction with horizontal drilling (Wiseman 2009). These
techniques together have increased the potential amount of recoverable oil and have made
commercial scale of oil production in North Dakota possible (Mason 2012). As a result, the
number of oil wells in North Dakota has more than doubled in the past eight years. At the end of
2013 the state had more than 9,600 active oil wells on its landscape, predominantly in the north
west portion (NDIC 2013).
The majority of oil produced out of North Dakota comes from the Bakken and Three
Forks formations which span throughout western North Dakota into eastern Montana and
southern Saskatchewan (Meissner 1991, Gaswirth et al. 2013). Estimates suggest that the portion
of the Bakken formation contained in North Dakota alone may sustain more than 38,000 oil
wells and have the potential to impact more than one seventh of the states 183,000 square

32
kilometers (Mason 2012). Although this results in a great economic boost and employment
opportunities for the state, it also brings challenges in understanding and managing the
environmental impact of these activities (Dyke et al. 2010). Such impacts stemming from
disturbances associated with gas and oil development include noise and light pollution, dust,
traffic, road and housing development, and fragmentation of the landscape (Pitman et al. 2005,
Beck 2009, Copeland et al. 2009, Barber et al. 2010, Lawson et al. 2011, Wilke et al. 2011,
Mason 2012).
While research is limited, efforts have been made to understand how wildlife are
impacted as energy development continues to rapidly expand across the country (Copeland et al.
2009). Much of the current research has focused primarily on species that peak public interest
such as large mammals (Tietje and Ruff 1983, Van Dyke and Klein 1996, Nellemann and
Cameron 1998, Wolfe et al. 2000, Sawyer et al. 2002, Sawyer et al. 2006), game birds (Beck
2009), and songbirds (Gilbert and Chalfoun 2011, Lawson et al. 2011). However, little is
presently known about the effects of energy development on the ecology of sharp-tailed grouse
(Beck 2009, Dyke et al. 2010).
Sharp-tailed grouse are a popular game bird species throughout their range, and are
recognized as an indicator species of grassland ecosystems health (USFS 2002, Dyke et al.
2011). As such, this species is of particular concern for the U.S. Forest Service and North Dakota
Game and Fish when making future prairie management decisions and understanding how
landscape changes may influence grassland birds (USFS 2002). Although sharp-tailed grouse
have the largest distribution of all prairie grouse species, its historic range has been reduced due
to various habitat alterations (Connelly et al. 1998, Akçakaya et al. 2004, Spaulding et al. 2006).
This species is well established throughout North Dakota but immediate current threats to their

33
habitat include disturbances related to gas and oil development (Beck 2009, Dyke et al. 2010).
These disturbances have the potential to impact multiple aspects of sharp-tailed grouse ecology,
both directly and indirectly. Impacts on nest success is an area of particular concern as it is one
of the most important factors influencing its reproductive success (Bergerud and Gratson 1988).
Radio telemetry has been a valuable tool used to study avian nesting ecology by allowing
researchers to locate and monitor nesting birds (Millspaugh et al. 2012). However, this technique
often logistically restricts researchers to checking nests periodically rather than daily. Without
continuous and direct observation of the nest it can be difficult to accurately fate the nest,
determine specific timing of the fate, or determine specific failure causes (Thompson III et al.
1999, Pietz and Granfors 2000, Cox et al. 2012, Ribic et al. 2012). Such drawbacks ultimately
limit our ability to make inferences on nesting ecology. Monitoring nests with video cameras has
become a popular way to address such challenges. The use of these systems have since provided
opportunities to gather a wealth of information which has historically been both financially and
logistically challenging (Weller and Derksen 1972, Ribic et al. 2012).
Using nest cameras to accurately determine the timing of nest fates is particularly useful
when estimating daily nest survival rates. Unlike apparent nest success, daily nest survival
determines the probability a nest will persist on a daily basis while correcting for the fact not all
nests are found on the same day of incubation (Mayfield 1975). Without this correction, nest
success can be severely overestimated (Mayfield 1975). At the same time, nest cameras give us
the ability to accurately identify specific nest predators. This is vital information for avian
species as depredation is considered the leading cause of nest failure (Ricklefs 1969, Martin
1988;1995, Jones and Dieni 2007). Furthermore, accurately identifying nest predators has been
found extremely difficult without the use of cameras (Thompson III et al. 1999, Pietz and

34
Granfors 2000). A number of species found in North Dakota are capable of depredating the eggs
of sharp-tailed grouse nests, including a variety of both mammalian and avian species (Côté and
Sutherland 1997, Connelly et al. 1998, Sargeant et al. 1998, Chalfoun et al. 2002, Seabloom
2011). Medium sized mammalian predators (hereafter meso-mammals) are thought to be the
primary nest predators and may include coyotes (Canis latrans), striped skunks (Mephitis
mephitis), American badgers (Taxidea taxus), raccoons (Procyon lotor), and red fox (Vulpes
vulpes) (Sargeant et al. 1998, Seabloom 2011).
The objective of our study was to evaluate the potential impacts gas and oil development
may have on the nest success of sharp-tailed grouse in western North Dakota. We estimated daily
nest survival rates at two study areas varying in energy development intensities using nesting
data collected with nest cameras and telemetry. We also used nest cameras to identify individual
nest predators and explored possible differences of predation rates and species responsible for
nest failures between areas of differing intensities of gas and oil development.
METHODS
Study Areas
Two study areas, Belden and Blaisdell, were established in Mountrail country of Western
North Dakota based on their relative oil well densities with the goal of gathering data from areas
with similar land use but differing levels of oil and gas intensities. Study boundaries were
constructed using 95% minimum convex polygons around previous years of nesting locations
(unpublished data, A. Robinson 2010, 2011) of sharp-tailed grouse (Tympanuchus phasianellus)
(Figure 2).

35
Belden covered 147.2 km2 (centroid: N 48.107922, W -102.393517), and was our study
area of intense oil activity with numerous active oil wells present within and around its
boundary. We calculated well densities using our study area polygons and well location data
from the North Dakota Industrial Commission (NDIC 2013). Oil well density in Belden was
0.767 wells/km2 in the August of 2012 and 0.950 wells/km
2 in August of 2013 (NDIC 2013,
Figure 2).
Blaisdell represented an area of minimal oil development and covered 38.7 km2 in 2012
(centroid: N 48.300744, W -102.130655), but was expanded to 158.3 km2 in 2013 (centroid: N
48.262096, W -102.077418) in order to create more equitable study area size and increase
sample sizes for monitoring sharp-tailed grouse nests. This expansion was done by adding grouse
nesting locations recorded in 2012, as well as two additional leks to our original convex polygon.
A 3.22 km (2 mile) buffer was also included around each lek to encompass potential nesting
habitat for grouse at these leks (Connelly et al. 1998) (Figure 2). No active oil wells were within
the 2012 boundary, but one oil well was within the extended 2013 boundary resulting in a
density of 0.006 wells/km2 (NDIC 2013). Although no active drilling of oil wells occurred within
Blaisdell during this study, there was activity present around the study area, primarily to the
west. Therefore, it was still susceptible to disturbances associated with oil development. Thus,
we considered it as an area of minimal development rather than no activity.
Our study area boundaries were approximately 15 kilometers apart and were composed of
similar landscapes dominated by agriculture, grassland, hay land, and water bodies of various
sizes. Of the land within the Belden polygon, 61% is characterized as grassland/hay land, 31%
cropland, 6% wetland, and 2% trees/shrubs. The larger, 2013 Blaisdell polygon contained 44%
grassland/hay land, 45% cropland, 11% wetland, and 0% trees/shrubs (USFWS 2002). Mean

36
summer (May-August) temperature of Mountrail County is 16.7OC, with the warmest
temperatures occurring in July. Mean summer precipitation is approximately 6.3cm, with most
rainfall occurring in June and July (Mountrail County Records 2013).
Field Methods
We captured hens beginning in late April of 2012 and 2013 using walk-in funnel traps at
leks (Toepfer et al. 1987). Five leks were trapped at each study area, with the exception of
Blaisdell in 2013 when we included an additional two leks to expand its size (see study areas).
We fit hens with a VHF necklace style radio collar (10.7 or 16 grams) and released them at the
capture site. We also recorded age, sex, weight, took blood samples, and banded each captured
grouse regardless of sex. We tracked hens throughout the summer months using radio telemetry
via hand held, vehicle mounted, and fix winged aircraft mounted units and recorded all locations
using either a Garmin or Trimble GPS unit. Once a hen was found incubating a nest, we recorded
the number of eggs and confirmed it remained active every 4–5 days using telemetry. If a hen
was not found to be by its nest we then examined the nest bowl to determine if a depredation or
hatching event occurred. A nest was considered successful if at least one egg hatched.
We monitored a subset of nests using 24-hour video surveillance nest cameras to
accurately determine nest fates and to estimate nest predator frequencies. During camera
installation field technicians wore latex gloves to avoid leaving human scent. Cameras were
clamped to a two-foot piece of steal bar that was inserted into the ground approximately half of a
meter from the nest. We concealed the camera with earth colors and surrounding vegetation and
attached a power/video cord to it. We concealed the cord in vegetation material running no less
than 30 meters from the nest to a digital video recorder (DVR) placed inside of a waterproof box.

37
The DVR and camera were powered by a 12 volt, 35 amp battery. Earth colors and surrounding
vegetation were also used to disguise the DVR box and battery. Footage was recorded by the
DVR unit and saved onto a portable memory card.
After installation of the camera was complete, we confirmed the hen returned to its nest
the following day via telemetry. Batteries and memory cards were changed every 4–5 days to
insure continuous recording. If the hen was absent from the nest at this time, we visually
inspected the nest to determine if the nest was still actively being incubated. After a nest had
been depredated or successfully hatched, all camera equipment was removed and placed at
another nest. All video footage was later reviewed to accurately assess nest fates. Specific dates
and times of hatching and depredation events were recorded, and all nest predators were
identified to species if possible.
We collected habitat data on a subset of nests within a week of determining nest fate. We
estimated nest concealment by averaging four visual obstruction readings (VORs) taken in
ordinal directions (north, east, south, west) centered around the nest (Robel et al. 1970). We also
measured new grass and residual grass height directly over the nest bowl. To collect habitat data
surrounding the nest, we ran four transects running 25 meters from the nest in the four ordinal
directions. We recorded VORs (as described above) at 1m, 3m, 5m, 15m, and 25m along each
transect. New grass and residual grass height were also measured at 5m, 15m, and 25, along each
transect. All VORs and height measurements taken along these transects were averaged to
describe habitat around the nest within a 25m radius circle.

38
Data Analysis
We estimated overall nest predator frequencies of sharp-tailed grouse using video footage
recorded from nest cameras. We also explored differences in nest predator frequencies between
study areas as a possible result of disturbances associated with gas and oil development.
We estimated daily nest survival rates using model construction in Program MARK
(Mayfield 1975, White and Burnham 1999, Dinsmore et al. 2002, Rotella et al. 2004). We
included all nests monitored in both years, regardless of individual hens re-nested within or
between years. We did not include any nests that appeared to fail due to abandonment caused by
researcher disturbance or camera presence. Model selection was made using Akaike’s
Information Criterion scores corrected for small sample sizes (AICc) to determine which models
had the most support (Akaike 1973, Burnham and Anderson 2002).
We explored multiple covariates influence on daily nest survival (Table 1). Study area
was included as a grouping variable, and year and nest camera presence were included as binary
covariates. We hypothesized oil wells and roads would influence nest survival by potentially
impacting local nest predator activities. Therefore, we included euclidean distance to the nearest
active oil well and nearest road as categorical covariates. Nearest active oil well was classified as
either less than 450m, 450–1,000m, or > 1,000m from the nest. Nearest road was classified as
either less than 450m or greater than 450m from the nest. We selected these distance categories
based on the approximate 450 meter average home range of sharp-tailed grouse hens while
laying and incubating eggs (Manzer and Hannon 2005).
We included habitat composition around nest locations using multiple spatial scales in
model construction. To classify composition, we used the U.S. Fish and Wildlife Service (2002)
land use layer and lumped similar land use categories as water, grassland, agriculture, or

39
trees/shrubs. We then calculated the percentage of area covered by each of these categories
within a 50m, 200m, and 450m buffer centered at the nest. The 450m buffer was included to
capture potential habitat used by hens while incubating (Manzer and Hannon 2005), the 50 meter
buffer captured differences between nests at the microsite level, and the 200 meter buffer was
used as an intermediate measure. We did not mix spatial extents when including habitat
composition within models. Edge density (m/km2) was also calculated at the 450 meter extent
with edges characterized as areas where habitat type changed across the landscape and roads. We
hypothesized this edge metric may influence survival as numerous mammalian nest predators
exploit habitat edges when traveling and foraging for prey items (Andrén 1995, Dijak and
Thompson III 2000, Kuehl and Clark 2002, Batary and Baldi 2004). All spatial covariates were
calculated in ArcGIS (ESRI 2012) using the NAD 1983 UTM zone 13N projected coordinate
system.
Habitat data recorded at the nest site were also included as continuous covariates in
model construction. These included average VOR, new grass height, and residual grass height
measured at the nest site and within 25 meters from the nest (see field methods). However, due
to logistical reasons, this data was only collected on a subset of all nests. Therefore, when
incorporating nest habitat covariates in model construction we could only include nests that had
habitat data available. This resulted in a tradeoff between increased sample size or the inclusion
of nesting habitat data. We first modeled daily nest survival using only nests with available
habitat data. If any covariates describing nesting habitat showed a strong influence on daily nest
survival we did not include the remaining nests without such data. However, if these covariates
were not strong predictors of daily nest survival, we then excluded them and included all nests in
the analysis.

40
To avoid multicollinearity we tested correlations among all continuous variables by
calculating Pearson’s correlation coefficients. If associated r2 values were greater than 0.3, we
did not use both covariates in the analysis (Moore and McCabe 1993). We also tested for spatial
autocorrelation to verify we did not violate the assumption of spatial independence among nests
using nest success (successful [0] vs. failed [1]) to calculate Moran’s I in program Spatial
Analysis in Macroecology (SAM) (Rangel et al. 2010). We assessed presence of spatial
autocorrelation by visually inspecting correlograms of Moran’s I values for each study area and
year.
We estimated daily nest survival rates (S), as well as individual covariate beta estimates
(ß) using model averaging of all models constructed (Burnham and Anderson 2002). We then
back-transformed beta estimates to their respective odds ratio (OR) for interpretation. Odds ratio
confidence intervals including 1.0 are not considered statistically significant, but may be
biologically important if estimates are deviating from 1.0. For this study, we refer to these
potentially important biological results as trending.
RESULTS
We monitored 163 sharp-tailed grouse nests between both study areas and years (Table
2). Apparent nest success at Belden (i.e. intense gas and oil development area) was 62% based
on 79 nest events across years, and 44% at Blaisdell (i.e. minimum gas and oil development
area) based on 84 nest events across years (Table 2). A total of 90 nests were also monitored
using nest cameras, with 42 deployed at Belden and 48 at Blaisdell, across years. Overall
apparent nest success for nests monitored with cameras was 58.9% and 45.2% for those not
monitored with cameras (Table 2). In total, 11 nest abandonments occurred between both study

41
areas and years. All abandonments occurred after the hen was initially flushed or after nest
camera installation, and were therefore not included in any subsequent analysis.
A total of 78 nests failed between both study areas and years. Depredation was the
leading cause of nest failures, accounting for 81% (n = 63) of all failed nests (Table 2). Our
Belden study area had fewer depredations (n = 19) compared to Blaisdell (n = 44). Hen mortality
accounted for 9% (n = 7) of all failures, followed by cattle trampling (6%, n = 5), and farm
machinery (4%, n = 3; Table 2). We captured 38 nest failures on camera; 30 of which were
depredation events. Belden had fewer depredations (n = 6) caught on camera compared to
Blaisdell (n = 24). In total, American badgers and skunks were the primary nest predators
accounting for 30% (n = 9) and 26.7% (n = 8) of all recorded depredations, respectively (Figure
3). Raccoons were responsible for the third most depredations (16.7%, n = 5), all of which
occurred at Blaisdell. Coyotes accounted for the next most depredations (10.0%, n = 3), followed
by red fox (6.7%, n = 2) and raptor (6.7%, n = 2) depredations (Figure 3). We could not
accurately identify one nest predator (3.3%) recorded at Blaisdell, and therefore classified it as
unknown. The remaining 8 non-depredation nest failure events included those caused by hen
mortalities away from the nest (4 events), cattle trampling (3 events), and farm machinery (1
event; Table 2).
When evaluating covariate correlation, we found evidence of correlation among a number
of continuous covariates. Percent grass and percent agriculture were highly correlated at each
spatial extent (Appendix A, Table 12). We therefore excluded percent agriculture from our
analysis. In addition, we also excluded percent trees as there was extremely low variation among
nest locations. In fact, 78.5% (128 out of 163) of the nest locations had 0% trees within the
largest spatial extent of 450m, and average percent trees of all nests was lower than 1.4% at each

42
spatial extent (Appendix A, Table 13). There was also a high correlation among nesting habitat
data collected. All measurements taken at the nest bowl were correlated with their respective
measurements averaged at the 25 meter extent (Appendix A, Table 14). In addition, both new
grass height at the nest and new grass height averaged at the 25 meter extent were correlated
with nest VOR and 25m VOR. Therefore, we only included nest VOR and residual grass height
at the nest in our analysis. We found no evidence of spatial autocorrelation among nest fates (i.e.,
success or failure; Appendix A, Figure 6).
We collected habitat data on 102 of the 163 nests monitored, and initially constructed
models using only the 102 nests with habitat data at the nest. Both nest VOR and nest residual
grass height showed little influence on daily nest survival rates. When included alone or together,
models containing these covariates had less weight than the null model (Appendix A, Table 15).
These covariates did appear in the second and third ranked models, but only when in
combination with study area and camera presence. Moreover, beta estimates for nest residual
grass height (ß = 0.010, CI = -0.011 – 0.031) and nest VOR (ß = 0.007, CI = -0.007 – 0.022)
showed no influence on daily nest survival rates within these models. Because these habitat
metrics appeared to be poor predictors of daily nest survival rates, we continued the analysis
using all nests without the incorporation of habitat data.
We constructed a total of 59 models using all sharp-tailed grouse nests (Appendix A,
Table 16). The covariates of study area and camera presence appeared together in the top ranked
model as the best predictors describing daily nest survival rates (Table 3). These two covariates
were also included together in the next top 11 models, containing 89% of all model weight.
Additionally, study area and camera presence were included in combination or alone with a
combination of other covariates in models containing over 99% of all weight (Appendix A,

43
Table 16). Nests at Belden were 1.95 times more likely to succeed than nests at Blaisdell (Table
4). Model average estimated daily nest survival was 0.975 (CI = 0.963–0.984) in Belden, and
0.955 (CI = 0.937–0.967) in Blaisdell. Overall nest success probability over the average 23 day
incubation period of sharp-tailed grouse was 55.9% at Belden, and only 34.7% at Blaisdell.
Camera monitored nests were 2.03 times more likely to succeed than non-camera monitored
nests (Table 4).
Other covariates contained in candidate models within 2 AICc scores from the top model
included habitat composition metrics from each spatial extent, year, and distance to roads (Table
3). However, model averaged beta estimates and associated odds ratio revealed there to be no
influence on daily nest survival (Table 4). Similarly, all other covariates used in the analysis
showed no influence on daily nest survival rates with odds ratio estimates essentially equal to
one (Table 4). All models containing the covariate of edge density within 450 meters failed to
converge and were not reported.
DISCUSSION
Our results suggest gas and oil development may be impacting sharp-tailed grouse nest
success in western North Dakota. The covariate of study area was one of the most influential
predictors of daily nest survival rates, appearing in models containing substantial amount of
weight. Model averaged estimate revealed nests at Belden (i.e. intense gas and oil development)
were more likely to succeed (55.9%) compared to those at Blaisdell (34.7%) (i.e. minimum gas
and oil development), illustrating a positive relationship between daily nest survival rates and gas
and oil development.

44
A number of studies have examined the effects of energy development on multiple
ecological aspects of prairie grouse (Hagen 2010). Most of these have reported overall negative
effects such as reduced survival rates (Holloran et al. 2010), behavioral avoidance of
infrastructure (Lyon and Anderson 2003, Pitman et al. 2005, Doherty et al. 2008, Hagen et al.
2011), and reduced lek attendance (Walker et al. 2007, Blickley et al. 2012, Hess and Beck 2012,
Taylor et al. 2013). Williamson (2009) found sharp-tailed ground nest success to be similar in
areas with and without gas and oil development in the Little Missouri National Grasslands of
North Dakota. Lyon and Anderson (2003) also reported no difference in nest success of greater
sage-grouse between disturbed and undisturbed areas in Wyoming. Although only a correlative
study, we found higher nest survival for sharp-tailed grouse in western North Dakota in areas of
intense gas and oil development relative to an adjacent area of lower development intensity.
Apparent nest success at Belden is comparable to that of others reported, whereas Blaisdell was
slightly lower (Kantrud and Higgins 1992, Kirby and Grosz 1995, Norton 2005, Williamson
2009). Estimating overall nest survival using daily nest survival rates resulted in lower overall
probabilities compared to apparent nest success, illustrating the inherent bias within apparent
nest success measurements.
Similar to other prairie grouse species, we found depredation to be the leading cause of
nest failure for sharp-tailed grouse (Ricklefs 1969, Pitman et al. 2005, Pitman et al. 2006, Coates
et al. 2008, Webb et al. 2012). Blaisdell had more than double the number of depredations
compared to Belden. Similar to waterfowl and other ground nesting birds in the state, we found
meso-mammalian species responsible for the majority of depredations (Sargeant et al. 1998).
Therefore, one possible explanation for higher nest success at Belden is that gas and oil
development may be negatively affecting meso-mammal activity. We explored this hypothesis

45
simultaneously by estimating meso-mammal occupancy rates within both study areas during
2012 and 2013 (see Chapter 3). We found the meso-mammal community as a whole to have
lower occupancy rates at Belden compared to Blaisdell, supporting this hypothesis. Similarly,
Winder et al. (2014) found reduced mortality of greater prairie-chicken after wind energy
development and proposed development may have altered predator activity. Reduced nest
success and increased predator occurrence at our Blaisdell site suggests areas adjacent to intense
gas and oil development may be experiencing the greatest impact from development. We suggest
further research using study areas farther into developed areas is needed to determine impacts on
species found in higher densities of development.
Accurate identification of nest predators has generally relied on interpreting the remains
of depredated nests, which can lead to misidentification (Marini and Melo 1998, Larivière 1999,
Coates et al. 2008). Here, we confirm the identity of primary nest predators for sharp-tailed
grouse in western North Dakota using nest cameras. American badgers and skunks were
responsible for the most depredations captured on camera at either site (Figure 3). Unfortunately,
due to the low sample size of depredated nests recorded at our Belden site, we could not
confidently make inferences regarding differences in predator frequencies between study areas.
However, the absence of recorded raccoon depredations at Belden is surprising as raccoon
accounted for 21% of depredations at Blaisdell, and raccoon occupancy rates were similar
between study areas (Chapter 3). We observed two instances of raptors depredating eggs, and
were able to successfully identify one as a northern harrier (Circus cyaneus). We did not observe
any other avian nest predators such as members of the Corvidae family, which have been
reported for sharp-tailed grouse and similar ground nesting birds such as greater sage-grouse and
waterfowl (Sargeant et al. 1998, Manzer and Hannon 2005, Dzialak et al. 2011).

46
Overall fecundity of sharp-tailed grouse has been found to be a vital role in the
population dynamics of the species (Akçakaya et al. 2004). Although our results suggest no
evidence of gas and oil development to negatively impact nest success, we did not explore its
impacts on brood success. Chick survival is potentially one of the most important drivers in the
population dynamics of prairie grouse (Wisdom and Mills 1997, Johnson and Johnson 1999,
Hagen et al. 2009). Therefore, impacts on this vital rate may be more influential on recruitment
compared to nest success alone. Reduced chick survival has been reported for greater sage-
grouse in areas of energy development (Aldridge 2007, Holloran et al. 2010), whereas
Williamson (2009) found higher chick survival of sharp-tailed grouse within developed areas in
the Little Missouri National Grasslands of North Dakota. We have found predators to be less
likely to occupy developed areas (Chapter 3), therefore brood loss by depredation in these areas
may be less common, as nest loss was. However, a multitude of other aspects have been shown
related to chick survival such as vegetation cover and food availability (Goddard et al. 2009,
Harju et al. 2013). We cannot speculate here on the effects gas and oil development may be
having on such local habitat qualities, but further investigation is warranted.
We found the presence of nest cameras to have a significant, positive influence on daily
nest survival. Similarly, a meta-analysis conducted by Richardson et al. (2009) also found an
overall positive effect of nest cameras on daily nest survival of a number of monitored avian
species. We believe two possible explanations could be driving this result. One is that predators
may be avoiding the novel structures of nest camera systems, rather than possibly using them as
cues. Secondly, we generally deployed nest cameras later in incubation due to logistical
restrictions, which may therefore bias our result as nests farther along in incubation are more
likely to succeed (Mayfield 1975). Similar findings have been reported for the monitoring of

47
greater sage-grouse nests (Moynahan et al. 2006, Coates et al. 2008). We believe it is most likely
the combination of these explanations, rather than one alone, which played a role in the positive
influence of nest cameras on sharp-tailed grouse nest success.
Previous work has found success of prairie grouse nests to be correlated with habitat
characteristics such as landscape composition, vegetation height, grassland patch size, and
possibly edge density (Paton 1994, Connelly et al. 1998, Batary and Baldi 2004, Manzer and
Hannon 2005). Here, we have found no such effect as no other covariates were influential on
daily nest survival rates (Table 4). Habitat data collected at the nest appeared to be poor
indicators of nest success, and were highly correlated with measurements taken within 25m of
the nest. We did not explore nest habitat selection for this study, but high correlation between the
nest site and surrounding habitat indicates a fairly homogeneous landscape at the microhabitat
level (within 25m of the nest) resulting in little variation among nests. Manzer and Hannon
(2005) found the habitat composition of agriculture to be particularly influential on sharp-tailed
grouse nest survival at broad extents (1,600m). We did not measure such a large extent as the
nests we monitored were spatially clumped together and larger buffers would result in extreme
overlap. Given our study areas in North Dakota were primarily dominated by either agriculture
or grasslands, larger buffers would result in very little variation of habitat composition among
nests. However, using our study area as a covariate likely represented variation at a larger spatial
extent.
Neither distances to active oil well or road were good predictors of sharp-tailed grouse
daily nest survival rates. Generally, there was little variation in distance to roads among nests,
which may have limited our ability to detect a signal. This is the result of the grid system for
roads that exists across our study areas with roads located approximately 1.6 km (1 mile) apart.

48
Further, much of the well pad development occurred along these roads. Although not captured in
our analysis, we did notice substantially more vehicle traffic at our Belden study area. This point
may have underlying impacts on the predator community, nest site selection, and hen stress, all
of which may affect nest success. Distance to active oil wells was most likely correlated with
study area, as all nests except one in Blaisdell were greater than 1,000m from an oil well.
Dzialak et al. (2011) found risk of nest failure for greater sage-grouse to increase with proximity
to oil wells. Although we did not detect such an influence in our study, the fact that Belden nests
were depredated much less often indicates a possible positive relationship with oil wells, which
may be the result of impacts on the local predator community (Chapter 3).
No spatial covariates used in our analysis seemed to be strong predictors of nest survival.
We based these covariates on incubating hen’s home range size of approximately 450m (Manzer
and Hannon 2005) as we predicted nest survival to be influenced by processes occurring within
the habitat area used by these hens. However, lack of influence of these covariates may indicate
impacts of gas and oil development are more influential at scales larger than we were able to
capture with these spatial covariates. We predict our study area scale is perhaps more effectively
capturing these impacts, and is the reason for study area’s significant influence on daily nest
survival rates.
The process of gas and oil development can commonly be broken down into four general
stages: exploration, drilling, production, and abandonment. During the two years this study took
place, we worked in an area dominated by the drilling stage, which includes the active
construction and drilling of oil wells. These activities are often accredited to the fragmentation of
the landscape through the introduction of roads, well pads, buildings, power lines, and other
infrastructure (Weller et al. 2002, Copeland et al. 2009, Mason 2012). Eventually this area will

49
be saturated with wells extracting oil and gas and will then be in the production stage, at which
point human presence is only required for regular maintenance and inspection. This will result in
a landscape left altered and fragmented to a certain degree, but experiencing less disturbance.
Such fragmentation and increased habitat edges are often exploited by predators when foraging
and can be linked to decreased nest survival of ground nesting birds (Paton 1994, Andrén 1995,
Dijak and Thompson III 2000). If disturbances associated with gas and oil are currently
displacing predators and reducing nest depredations, it is possible as energy development
progresses through its phases that predators may ultimately return and reduce nest success in the
newly fragmented landscape. This idea illustrates the importance of future research continuing to
assess the impacts on wildlife as the dynamic process of gas and oil development progresses
through each stage.
Management Implications
Ecological impacts of energy development have gained a great deal of attention in recent
years over the concern for the management and conservation of wildlife and their habitats. Here,
we have found no evidence of a gas and oil development negatively impacting sharp-tailed
grouse nest success in areas of intense development. However, this is not to say other
demographic factors are not being impacted. Additional factors such as chick and hen survival
also have direct impacts on sharp-tailed grouse population dynamics and require further
investigation. Although this species is not facing the same challenges currently posed on other
prairie grouse, mitigating energy developments impacts on sharp-tailed grouse now will help
maintain future populations.

50
Nest cameras have proven to be a valuable tool in studying avian ecology. We have
accurately identified primary nest predator of sharp-tailed grouse which may ultimately be
beneficial for future management decisions such as predator removal efforts to increase nest
success (Sargeant et al. 1995, Côté and Sutherland 1997, Chalfoun et al. 2002). Additionally,
other data gathered from our nest cameras will be used for future research on sharp-tailed grouse
nesting behavior, nest attendance, and behavior related to camera installation. This research will
provide literature on these nesting ecology aspects which have not been well studied for sharp-
tailed grouse. Such data has been beneficial to understanding nesting ecology of other bird
species (Cox et al. 2012, Ellis-Felege and Carroll 2012, Ribic et al. 2012).
As North Dakota economy continues to benefit from oil and gas exploration, the future of
the state’s wildlife resources remains unknown. Prior to the oil boom, tourism related to these
wildlife resources was the second major source of revenue in the state (USFWS 2006). Although
at the moment sharp-tailed grouse nest survival does not appear to be of immediate threat,
development will continue to be a significant pressure on all wildlife as global energy demands
continue to increase (IEA 2012). Continued research on this subject will ultimately help to
understand these processes, as well as mitigate impacts on local ecosystems.

51
LITERATURE CITED
Akaike, H. 1973. Information theory as an extension of the maximum likelihood principle. Pages
267-281 in B. N. Petrov, andF. Csaki, editors. Second International Symposium on
Information Theory. Akademiai Kiado, Budapest.
Akçakaya, H. R., V. C. Radeloff, D. J. Mladenoff, and H. S. He. 2004. Integrating Landscape
and Metapopulation Modeling Approaches: Viability of the Sharp-Tailed Grouse in a
Dynamic Landscape. Conservation Biology 18:526-537.
Aldridge, C. 2007. Linking Occurrence and Fitness to Persistence: Habitat-Based Approach for
Endangered Greater Sage-Grouse. Ecological Applications 17:508-526.
Andrén, H. 1995. Effects of landscape composition on predation rates at habitat edges. Pages
225-255 in L. Hansson, L. Farig, andG. Marriam, editors. Mosaic landscapes and
ecological processes. Springer Netherlands, London, United Kingdom.
Ausick, P., and M. B. Sauter. 2013. The 10 most oil-rich states. in USA Today. 24/7 Wall St.,
New York, NY.
Barber, J. R., K. R. Crooks, and K. M. Fristrup. 2010. The costs of chronic noise exposure for
terrestrial organisms. Trends in Ecology & Evolution 25:180-189.
Batary, P., and A. Baldi. 2004. Evidence of an edge effect on avian nest success. Conservation
Biology 18:389-400.

52
Beck, J. L. Impacts of oil and natural gas on prairie grouse: current knowledge and research
needs., Pages 66-87 in Conference Impacts of oil and natural gas on prairie grouse:
current knowledge and research needs. R. I. Barnhisel. 3134 Montavesta Rd., Lexington,
KY 40502.
Bergerud, A. T., and M. W. Gratson. 1988. Adaptive strategies and population ecology of
northern grouse. University of Minnesota Press, Minneapolis.
Blickley, J. L., D. Blackwood, and G. L. Patricelli. 2012. Experimental evidence for the effects
of chronic anthropogenic noise on abundance of greater sage-grouse at leks. Conservation
Biology 26:461-471.
Burnham, K. P., and D. R. Anderson. 2002. Model selection and multimodel inference : a
practical information-theoretic approach. 2nd edition. Springer, New York.
Chalfoun, A. D., F. R. Thompson, and M. J. Ratnaswamy. 2002. Nest predators and
fragmentation: a review and meta-analysis. Conservation Biology 16:306-318.
Coates, P. S., J. W. Connelly, and D. J. Delehanty. 2008. Predators of Greater Sage-Grouse nests
identified by video monitoring. Journal of Field Ornithology 79:421-428.
Connelly, J. W., M. W. Gratson, and K. P. Reese. 1998. Sharp-tailed Grouse (Tympanuchus
phasianellus). The Birds of North America Online (A. Poole, Ed.). Ithaca: Cornell Lab of
Ornithology. <http://bna.birds.cornell.edu/bna/>. Accessed 29 May 2013.
Copeland, H. E., K. E. Doherty, D. E. Naugle, A. Pocewicz, and J. M. Kiesecker. 2009. Mapping
Oil and Gas Development Potential in the US Intermountain West and Estimating
Impacts to Species. PLoS ONE 4:1-7.
Côté, I. M., and W. J. Sutherland. 1997. The effectiveness of removing predators to protect bird
populations. Conservation Biology 11:395-405.

53
Cox, W. A., M. S. Pruett, T. J. Benson, S. J. Chiavacci, and F. R. Thompson III. 2012.
Development of Camera Technology for Monitoring Nests. Pages 185-210 in C. A.
Ribic, F. R. Thompson, andP. J. Pietz, editors. Video surveillance of nesting birds.
Studies in Avian Biology (no. 43). University of California Press, Berkeley, CA.
Dijak, W. D., and F. R. Thompson III. 2000. Landscape and edge effects on the distribution of
mammalian predators in Missouri. The Journal of Wildlife Management 64:209-216.
Dinsmore, S. J., G. C. White, and F. L. Knopf. 2002. Advanced techniques for modeling avian
nest survival. Ecology 83:3476-3488.
Doherty, K. E., D. E. Naugle, B. L. Walker, and J. M. Graham. 2008. Greater Sage-Grouse
Winter Habitat Selection and Energy Development. The Journal of Wildlife Management
72:187-195.
Dyke, S., D. Fryda, D. Kleyer, J. Williams, B. Hosek, W. Jensen, S. Johnson, A. Robinson, B.
Ryckman, B. Stillings, M. Szymanski, S. Tucker, and B. Wiedmann. 2010. Potential
impacts of oil and gas development on select North Dakota natural resources: a report to
the director. North Dakota Game and Fish Department, Bismarck, ND.
Dzialak, M. R., C. V. Olson, S. M. Harju, S. L. Webb, J. P. Mudd, J. B. Winstead, and L.
Hayden-Wing. 2011. Identifying and prioritizing greater sage-grouse nesting and brood-
rearing habitat for conservation in human-modified landscapes. PLoS ONE 6:e26273.
Ellis-Felege, S. N., and J. P. Carroll. 2012. Gamebirds and Nest Cameras: Present and Future.
Pages 35-44 in C. A. Ribic, F. R. Thompson, andP. J. Pietz, editors. Video surveillance of
nesting birds. Studies in Avian Biology (no. 43). University of California Press,
Berkeley, CA.
54
Gaswirth, S. B., K. R. Marra, T. A. Cook, R. R. Charpentier, D. L. Gautier, D. K. Higley, T. R.
Klett, M. D. Lewan, P. G. Lillis, C. J. Schenk, M. E. Tennyson, and K. J. Whidden. 2013.
Assessment of undiscovered oil resources in the Bakken and Three Forks formations,
Williston Basin Province, Montana, North Dakota, and South Dakota, 2013: USGS
national assessment of oil and gas fact sheet 2013-3013.4p.
Gilbert, M. M., and A. D. Chalfoun. 2011. Energy development affects populations of sagebrush
songbirds in Wyoming. The Journal of Wildlife Management 75:816-824.
Goddard, A., R. Goddard, and M. Dawson. 2009. Habitat selection by nesting and brood-rearing
sharp-tailed grouse. Canadian journal of Zoology 87:326-336.
Hagen, C., B. Hagen, J. Sandercock, R. Pitman, and R. Robel. 2009. Spatial Variation in Lesser
Prairie-Chicken Demography: A Sensitivity Analysis of Population Dynamics and
Management Alternatives. Journal of Wildlife Management 73:1325-1332.
Hagen, C. A. Impacts of energy development on prairie grouse ecology: a research synthesis.
2010.
Hagen, C. A., J. C. Pitman, T. M. Loughin, B. K. Sandercock, R. Robel, and R. D. Applegate.
2011. Impacts of Anthropogenic Features on Habitat Use by Lesser Prairie-Chickens.
Studies in Avian Biology 39:63-75.
Harju, S. M., C. V. Olson, L. Foy-Martin, S. L. Webb, M. R. Dzialak, J. B. Winstead, and L. D.
Hayden-Wing. 2013. Occurrence and Success of greater sage-grouse broods in realtino to
insect-vegetation community gradients. Human-Wildlife Interactions 7:214-229.
Hess, J. E., and J. L. Beck. 2012. Disturbance factors influencing greater sage-grouse lek
abandonment in north-central Wyoming. Journal of Wildlife Management 76:1625-1634.

55
Holloran, M. J., R. C. Kaiser, and W. A. Hubert. 2010. Yearling greater sage-grouse response to
energy development in Wyoming. Journal of Wildlife Management 74:65-72.
Internation Energy Agency (IEA). 2012. World energy outlook 2012.
<http://www.worldenergyoutlook.org> Accessed 2014 April 1.
Johnson, K., and C. Johnson. 1999. Viability and Conservation of an Exploited Sage Grouse
Population. Conservation Biology 13:77-84.
Jones, S. L., and J. S. Dieni. 2007. The relationship between predation and nest concealment in
mixed-grass prairie passerines: an analysis using program MARK. Studies in Avian
Biology:117-123.
Kantrud, H. A., and K. F. Higgins. 1992. Some Ground-nesting, Non-passerine Birds of
Northern Grasslands. Prairie Naturalist 24:67-84.
Kirby, D. R., and K. L. Grosz. 1995. Cattle grazing and sharp-tailed grouse nesting success.
Rangelands 17:124-126.
Kuehl, A. K., and W. R. Clark. 2002. Predator activity related to landscape features in northern
Iowa. The Journal of Wildlife Management 66:1224-1234.
Larivière, S. 1999. Reasons why predators cannot be inferred from nest remains. The Condor
101:718-721.
Lawson, A. L., M. L. Morrison, and R. D. Slack. 2011. Impacts of Oil and Gas Development on
Wintering Grassland Birds at Padre Island National Seashore, Texas. Southeastern
Naturalist 10:303-320.
Lyon, A. G., and S. H. Anderson. 2003. Potential gas development impacts on sage grouse nest
initiation and movement. Wildlife Society Bulletin 31:486-491.
56
Manzer, D. L., and S. J. Hannon. 2005. Relating grouse nest success and corvid density to
habitat: a multi-scale approach. Journal of Wildlife Management 69:110-123.
Marini, M., and C. Melo. 1998. Predators of quail eggs, and the evidence of the remains:
implications for nest predation studies. The Condor 100:395-399.
Martin, T. E. 1988. Processes organizing open-nesting bird assemblages: competition or nest
predation? Evolutionary Ecology 2:37-50.
_____. 1995. Avian life history evolution in relation to nest sites, nest predation, and food.
Ecological monographs 65:101-127.
Mason, J. 2012. Oil production potential of the North Dakota Bakken. Oil and Gas Journal
110:76-86.
Mayfield, H. F. 1975. Suggestions for calculating nest success. The Wilson Bulletin 87:456-466.
Meissner, F. F. 1991. Petroleum geology of the Bakken Formation, Williston basin, North
Dakota and Montana. Montana Geological Soceity: Guidebook to Geology and
Horizontal Drilling of the Bakken Formation:19-42.
Millspaugh, J. J., D. C. Kesler, R. W. Kays, R. A. Gitzen, J. H. Schulz, C. T. Rota, C. M.
Bodinof, J. L. Belant, and B. J. Keller. 2012. Wildlife Radiotelemetry and Remote
Monitoring. Pages 258-283 in N. J. Silvy, editor. The Wildlife Techniques Manual. Johns
Hopkins University Press, Baltimore, Md.
Moore, D. R., and G. P. McCabe. 1993. Introduction to the practice of statistics. Second edition.
W. H. Freeman and Company, New York, New York.
Mountrail County Records. 2013. North Dakota/Mountrail County Weather. USA.com.
Available at: http://www.usa.com/mountrail-county-nd-weather.htm.

57
Moynahan, B. J., M. S. Lindberg, and J. W. Thomas. 2006. Factors contributing to process
variance in annual survival of female greater sage-grouse in Montana. Ecological
Applications 16:1529-1538.
Nellemann, C., and R. Cameron. 1998. Cumulative impacts of an evolving oil-field complex on
the distribution of calving caribou. Canadian journal of Zoology 76:1425-1430.
Nordeng, S. 2010. A brief history of oil production from the Bakken Formation in the Williston
Basin. NDGS newsletter 37:5-9.
North Dakota Industrial Commission. (NDIC). 2013. Department of Mineral Resources, Oil and
Gas Division. https://www.dmr.nd.gov/oilgas/.
Norton, M. A. 2005. Reproductive success and brood habitat use of greater prairie chickens and
sharp-tailed grouse on the Fort Pierre National Grassland of central South Dakota.
Wildlife and Fisheries Sciences Department, South Dakota State University.
Paton, P. W. 1994. The effect of edge on avian nest success: how strong is the evidence?
Conservation Biology 8:17-26.
Pietz, P. J., and D. A. Granfors. 2000. Identifying predators and fates of grassland passerine nests
using miniature video cameras. Journal of Wildlife Management 64:71-87.
Pitman, J. C., C. A. Hagen, B. E. Jamison, R. J. Robel, T. M. Loughin, and R. D. Applegate.
2006. Nesting ecology of lesser prairie-chickens in sand sagebrush prairie of
southwestern Kansas. Wilson Journal of Ornithology 118:23-35.
Pitman, J. C., C. A. Hagen, R. J. Robel, T. M. Loughin, and R. D. Applegate. 2005. Location and
success of Lesser Prairie-Chicken nests in relation to vegetation and human disturbance.
The Journal of Wildlife Management 69:1259-1269.

58
Rangel, T. F., J. A. F. Diniz-Filho, and L. M. Bini. 2010. SAM: a comprehensive application for
spatial analysis in macroecology. Ecography 33:46-50.
Ribic, C. A., F. R. Thompson, and P. J. Pietz. 2012. Video surveillance of nesting birds.
University of California Press, Berkeley, CA.
Richardson, T., T. Gardali, and S. H. Jenkins. 2009. Review and meta-analysis of camera effects
on avian nest success. The Journal of Wildlife Management 73:287-293.
Ricklefs, R. E. 1969. An analysis of nesting mortality in birds. Smithsonian Contributions to
Zoology 9:1-48.
Robel, R. J., J. N. Briggs, J. J. Cebula, N. J. Silvy, C. E. Viers, and P. G. Watt. 1970. Greater
prairie chicken ranges, movements, and habitat usage in Kansas. The Journal of Wildlife
Management 34:286-306.
Rotella, J. J., S. J. Dinsmore, and T. L. Shaffer. 2004. Modeling nest-survival data: a comparison
of recently developed methods that can be implemented in MARK and SAS. Animal
Biodiversity and Conservation 27:187-204.
Sargeant, A. B., M. A. Sovada, and R. J. Greenwood. 1998. Interpreting evidence of depredation
of duck nests in the prairie pothole region. U.S. Geological Survey, Northern Prairie
Wildlife Research Center, Jamestown, ND and Ducks Unlimited, Inc., Mamphis, TN.
Sargeant, A. B., M. A. Sovada, and T. L. Shaffer. 1995. Seasonal predator removal relative to
hatch rate of duck nests in waterfowl production areas. Wildlife Society Bulletin:507-
513.

59
Sawyer, H., F. Lindzey, D. McWhirter, and K. Andrews. Potential effects of oil and gas
development on mule deer and pronghorn populations in western Wyoming, Pages 350-
365 in Conference Potential effects of oil and gas development on mule deer and
pronghorn populations in western Wyoming. J. Rahm. Washington, DC.
Sawyer, H., R. M. Nielson, F. Lindzey, and L. L. McDONALD. 2006. Winter habitat selection
of mule deer before and during development of a natural gas field. Journal of Wildlife
Management 70:396-403.
Seabloom, R. 2011. The mammals of North Dakota. Institute for Regional Studies, NDSU,
Fargo, N.D.
Spaulding, A. W., K. E. Mock, M. A. Schroeder, and K. I. Warheit. 2006. Recency, range
expansion, and unsorted lineages: implications for interpreting neutral genetic variation
in the sharp-tailed grouse (Tympanuchus phasianellus). Molecular Ecology 15:2317-
2332.
Taylor, R. L., J. D. Tack, D. E. Naugle, and L. S. Mills. 2013. Combined Effects of Energy
Development and Disease on Greater Sage-Grouse. PLoS ONE 8:1-10.
Thompson III, F. R., W. Dijak, and D. E. Burhans. 1999. Video identification of predators at
songbird nests in old fields. The Auk 116:259-264.
Tietje, W. D., and R. L. Ruff. 1983. Responses of black bears to oil development in Alberta.
Wildlife Society Bulletin 11:99-112.
Toepfer, J. E., J. A. Newell, and J. Monarch. 1987. A Method for Trapping Prairie Grouse Hens
on Display Grounds. Prairie chickens on the Sheyenne grasslands. USDA General
Technical Report RM-159.

60
United States Forest Service (USFS). 2002. Record of decision for Dakota prairie grasslands :
final environmental impact statement and land and resource management plan. Forest
Service, U.S. Dept. of Agriculture, Missoula, MT.
USFWS. 2002. US Fish and Wildlife Service 2002 Landcover. Region 6. ISO
19115:2003/19139.
Van Dyke, F., and W. C. Klein. 1996. Response of elk to installation of oil wells. Journal of
Mammalogy 77:1028-1041.
Walker, B. L., D. E. Naugle, and K. E. Doherty. 2007. Greater Sage-Grouse Population
Response to Energy Development and Habitat Loss. Journal of Wildlife Management
71:2644-2654.
Webb, S., C. Olson, M. Dzialak, S. Harju, J. Winstead, and D. Lockman. 2012. Landscape
features and weather influence nest survival of a ground-nesting bird of conservation
concern, the greater sage-grouse, in human-altered environments. Ecological Processes
1:1-15.
Weller, C., P. Thompson, P. Morton, and G. Aplet. 2002. Fragmenting our lands: the ecological
footprint from oil and gas development. The Wilderness Society, Washington, D.C.,
USA.
Weller, M. W., and D. V. Derksen. 1972. Use of time-lapse photography to study nesting
activities of birds. The Auk 89:196-200.
White, G. C., and K. P. Burnham. 1999. Program MARK: survival estimation from populations
of marked animals. Bird Study 46:120-139.
Wilke, P. W., P. P. Engineer, and M. Harrell. Assessment of Impact of Energy Development
Projects on Local Roads. 2011.

61
Williamson, R. M. 2009. Impacts of oil and gas development on sharp-tailed grouse on the Little
Missouri National Grasslands, North Dakota. Wildlife and Fisheries Sciences
Department, South Dakota State University.
Winder, V. L., L. B. McNew, A. J. Gregory, L. M. Hunt, S. M. Wisely, and B. K. Sandercock.
2014. Effects of wind energy development on survival of female greater prairie-chickens.
Journal of Applied Ecology 51:395-405.
Wisdom, M. J., and L. S. Mills. 1997. Sensitivity analysis to guide population recovery: prairie-
chickens as an example. The Journal of Wildlife Management 61:302-312.
Wiseman, H. 2009. Untested waters: the rise of hydraulic fracturing in oil and gas production
and the need to revisit regulation. Fordham Environmental Law Review 20:115-170.
Wolfe, S. A., B. Griffith, and C. A. Gray Wolfe. 2000. Response of reindeer and caribou to
human activities. Polar Research 19:63-73.

62
Table 1. Explanatory covariates used for analyzing sharp-tailed grouse daily nest survival
rates in western North Dakota, 2012–2013. Covariates marked with an asterisk(*) were not
used in the analysis due to correlation or model convergence issues (see results).
Covariate Data Type Description
Area Categorical Study area: Belden or Blaisdell
Cam Categorical Presence or absence of a nest camera on nest
Year Categorical Study year: 2012 or 2013
DistRoad Categorical Distance to nearest road: 0–450m, > 450m
DistWell Categorical Distance to nearest oil well: 0–450m (DistWell1), 451m–1,000m
(DistWell2), or > 1,000m
NestVOR Continuous Average of four visual obstruction readings taken from cardinal
directions centered at the nest bowl (cm).
NestGrass* Continuous Greatest new grass height over nest bowl (cm)
NestResid Continuous Greatest residual grass height over nest bowl (cm)
25mVOR* Continuous
Average visual obstruction reading recorded at 1m, 3m, 5m, 15m,
and 25m in each cardinal direction from the nest bowl. Four
readings were taken at each interval (cm).
25mGrass* Continuous Average new grass height recorded at 5m, 15m, and 25m in each
cardinal direction from the nest bowl (cm).
25mResid* Continuous Average residual grass height recorded at 5m, 15m, and 25m in
each cardinal direction from the nest bowl (cm).
50Grs Continuous Percent grass within 50 meters of the nest
50 Ag* Continuous Percent agriculture within 50 meters of the nest
50Wtr Continuous Percent water within 50 meters of the nest
50Tr* Continuous Percent Trees/shrubs within 50 meters of the nest
200Grs Continuous Percent grass within 200 meters of the nest
200 Ag* Continuous Percent agriculture within 200 meters of the nest
200Wtr Continuous Percent water within 200 meters of the nest
200Tr* Continuous Percent Trees/shrubs within 200 meters of the nest
450Grs Continuous Percent grass within 450 meters of the nest
450Ag* Continuous Percent agriculture within 450 meters of the nest
450Wtr Continuous Percent water within 450 meters of the nest
450Tr* Continuous Percent Trees/shrubs within 450 meters of the nest
450Edge* Continuous Edge density within 450 meters of the nest (m/km
2)

63
Table 2. Summary of sharp-tailed grouse nests monitored in 2012 and 2013 in western
North Dakota. Nests are also broken up by study area and monitoring method. Listed are
categories of all nest failures. Belden study area represents intense gas and oil development,
whereas Blaisdell represents minimal development.
Total Nests
Monitored Depredated
Hen
Mortality
Cattle
Trampling
Farm
Machinery
Apparent
Nest
Success
All Nests 163 63 7 5 3 53.8 %
By Study Area
Blaisdell 84 44 3 0 1 44.0 %
Belden 79 19 4 5 2 62.0 %
By Monitoring Method
Nest Camera 90 30 4 3 1 58.9 %
Telemetry Only 73 33 3 2 2 45.2 %
Table 3. Models within two AICc scores from the highest ranked daily nest
survival model constructed for sharp-tailed grouse in western North
Dakota. See table 1 for covariate descriptions. See table 16 in appendix A for
all models constructed in this analysis.
Model AICc ∆AICc w L K Deviance
S(Area + Cam) 520.29 0.00 0.16 1.00 3 514.28
S(Area + Cam + 50Grs) 520.77 0.48 0.13 0.79 4 512.75
S(Area + Cam + 200Grs) 521.67 1.38 0.08 0.50 4 513.65
S(Area + Cam + 50Wtr) 521.80 1.51 0.08 0.47 4 513.78
S(Area + Cam + 450Grs) 521.89 1.60 0.07 0.45 4 513.88
S(Area + Cam + Year) 521.99 1.70 0.07 0.43 4 513.98
S(Area + Cam + DistRoad) 522.06 1.77 0.07 0.41 4 514.04
S(Area + Cam + 200Wtr) 522.17 1.88 0.06 0.39 4 514.15
S(Area + Cam + 450Wtr) 522.24 1.95 0.06 0.38 4 514.23

64
Table 4. Model averaged beta (β) estimates for all covariates included in the sharp-tailed
grouse daily nest survival analysis in Program MARK. Associated odds ratios (OR) are also
calculated for result interpretation. Bolded terms are statistically significant. See table 1 for
covariate descriptions.
Model covariate β
Estimate
β
SE
β
LCI
β
UCI
Odds Ratio
(OR)
OR
LCI
OR
UCI
Intercept 2.566 0.350 1.879 3.253
Study Area 0.669 0.267 0.147 1.191 1.952 1.158 3.292
Camera 0.708 0.237 0.244 1.172 2.029 1.276 3.227
Year -0.128 0.241 -0.601 0.346 0.880 0.548 1.413
Distance to Road -0.109 0.249 -0.596 0.379 0.897 0.551 1.460
Distance to Well-1 -0.091 0.616 -1.298 1.117 0.913 0.273 3.056
Distance to Well-2 0.043 0.556 -1.047 1.134 1.044 0.351 3.107
50 Grass 0.005 0.004 -0.003 0.013 1.005 0.997 1.013
50 Water -0.023 0.031 -0.084 0.037 0.977 0.919 1.038
200 Grass 0.004 0.005 -0.005 0.013 1.004 0.995 1.013
200 Water -0.014 0.040 -0.092 0.064 0.986 0.912 1.067
450 Grass 0.004 0.006 -0.007 0.015 1.004 0.993 1.015
450 Water 0.009 0.037 -0.064 0.082 1.009 0.938 1.085

65
Figure 2. Two study areas established in Mountrail County of western North Dakota used
to trap sharp-tailed grouse in 2012 and 2013. Belden, in the southwest, is our study area of
intense oil development. Blaisdell, in the northeast, is our area of minimal oil development. Five
leks were trapped in each study area per year, except Blaisdell in 2013 when seven leks were
trapped (see methods). Dashed line within Blaisdell represents its boundary in 2012.

66
Figure 3. Number of sharp-tailed grouse nest depredations caused by specific nest
predators in western North Dakota, 2012-2013. Total number of depredation events is shown
along with number of events per study area for 90 nests monitored using nest cameras. Blaisdell
represents an area of minimal gas and oil development, whereas Belden represents an area of
intense gas and oil development.
0
1
2
3
4
5
6
7
8
9
10
Badger Skunk Raccoon Coyote Raptor Fox Unknown
Nu
mb
er o
f D
epre
da
tio
n E
ven
ts
Nest Predator
TOTAL
BLAISDELL
BELDEN

67
IMPACTS OF GAS AND OIL DEVELOPMENT ON MAMMALIAN PREDATOR
HABITAT USE IN WESTERN NORTH DAKOTA
ABSTRACT
Recent advances in extraction technologies are resulting in rapid increases in gas and oil
development in western North Dakota. This expansion of energy development may have effects
on local wildlife populations and the ecological interactions within and among species. Impacts
on the mammalian predator community is an area of particular interest as these species play
central roles in the ecology of many ground-nesting bird species found in North Dakota through
the depredation of eggs, chicks, and adults. Disturbances associated with gas and oil
development such as habitat fragmentation, traffic, noise, and artificial light may alter the spatial
use of the local mammalian predators, thereby indirectly impacting prey species populations. To
evaluate the impacts of energy development on mammalian predators’ use of the landscape, we
established two study areas representing areas of high and low energy development intensities in
western North Dakota. We conducted predator occupancy surveys using camera scent stations
during the summers of 2012 and 2013. We detected coyotes (Canis latrans), striped skunks
(Mephitis mephitis), red fox (Vulpes vulpes), American badgers (Taxidea taxus), and raccoons
(Procyon lotor). We conducted occupancy analysis to evaluate differences in predator
occurrence between study areas while incorporating various covariates associated with survey
site characteristics and year. We found the mammalian predator community as a whole to be 4.5
times more likely to occur in our study area of minimal gas and oil intensity compared to the
high intensity area, suggesting a negative relationship between energy development and predator

68
occurrence. These results reinforce a possible mechanism that is correlated to findings of higher
sharp-tailed grouse nest success in the area of intense energy development, and illustrate
potential secondary impacts of gas and oil development on wildlife interactions in western North
Dakota.
INTRODUCTION
North Dakota first began extracting oil in 1951 (Nordeng 2010), and is now one of the
leading producers of oil in the United States (Ausick and Sauter 2013). However, it wasn’t until
the early 2000’s that North Dakota experienced this significant increase in oil production with
the advent of hydraulic fracturing in conjunction with horizontal drilling (Wiseman 2009). These
techniques together have increased the potential amount of recoverable oil and have made
commercial scale of oil production in North Dakota possible (Mason 2012). As a result, the
number of oil wells in North Dakota has more than doubled in the past eight years. At the end of
2013 the state had more than 9,600 active oil wells on its landscape, predominantly in the north
west portion (NDIC 2013).
The majority of oil produced out of North Dakota comes from the Bakken and Three
Forks formations which spans throughout western North Dakota into eastern Montana and
southern Saskatchewan (Meissner 1991, Gaswirth et al. 2013). Estimates suggest that the portion
of the Bakken formation contained in North Dakota alone may sustain more than 38,000 oil
wells and have the potential to impact more than one seventh of the states 183,000 square
kilometers (Mason 2012). Although this results in a great economic boost and employment
opportunities for the state, it also brings challenges in understanding and managing the
environmental impact of these activities (Dyke et al. 2010). While research is limited, efforts

69
have been made to understand how wildlife are impacted as energy development continues to
rapidly expand across the country (Copeland et al. 2009). Much of the current research has
focused primarily on species that peak public interest such as large mammals (Tietje and Ruff
1983, Van Dyke and Klein 1996, Nellemann and Cameron 1998, Wolfe et al. 2000, Sawyer et al.
2002, Sawyer et al. 2006), game birds (Beck 2009), and songbirds (Gilbert and Chalfoun 2011,
Lawson et al. 2011). However, research is lacking on how medium-sized mammalian carnivores,
or meso-mammals, are responding to the pressures of energy development.
Meso-mammals perform vital roles in the functioning of ecosystems as predators of a
variety of prey species (Palomares et al. 1995, Crooks and Soule 1999). For example, meso-
mammals are the primary nest predator of many ground nesting birds (Sargeant et al. 1998), and
predation is considered the leading cause of nest failure of avian species (Ricklefs 1969, Martin
1988;1995, Jones and Dieni 2007). North Dakota is home to numerous ground nesting birds
including upland game birds, songbirds, and a wide variety of waterfowl (Peterson 2008).
Reduction of these predators has been shown to positively influence nest success of many bird
species (Sargeant et al. 1995, Côté and Sutherland 1997, Chalfoun et al. 2002). In addition,
meso-mammals consume many smaller mammalian species (Seabloom 2011), which can have
direct influences on small mammal population dynamics (Korpimäki and Norrdahl 1998,
Klemola et al. 2000). Impacts of energy development on the community of meso-mammals
could therefore have indirect implications on these prey species populations. Furthermore, meso-
mammals are an important furbearer species regularly targeted by trappers in the state. During
the 2013 trapping season alone, approximately one million dollars were spent by North Dakota
fur buyers on a variety of meso-mammal pelts (Tucker 2014).

70
For the purposes of this study we focused on meso-mammal species that are primarily
found throughout North Dakota’s prairie ecosystem, and are known nest predators of ground
nesting birds found in the state. These included coyotes (Canis latrans), striped skunks (Mephitis
mephitis), American badgers (Taxidea taxus), raccoons (Procyon lotor), and red fox (Vulpes
vulpes) (Sargeant et al. 1998, Seabloom 2011).
Monitoring these meso-mammals is generally difficult as most are crepuscular or
nocturnal, as well as cryptic and elusive (Seabloom 2011). Because of this, we rarely detect them
at a site even when they are present. In fact, detection probabilities of wildlife are rarely perfect,
and if not accounted for may lead to biased estimates of the species status (MacKenzie et al.
2003). In addition, meso-mammals vary in morphology and life history strategies and have
traditionally required species-specific sampling methods (Jones et al. 1996), making it
challenging to understand community dynamics. Occupancy modeling is a reliable, cost-
effective method that allows us to account for such challenges. This analysis gives an estimation
of a site being occupied while correcting for the imperfect detection of the target species
(MacKenzie et al. 2002). It is also effective when conducting a multi-species monitoring study
(O'Connell et al. 2006), and enables relationships between detection and occupancy with various
covariates to be explored (MacKenzie et al. 2002).
Occupancy estimation requires sample sites to be surveyed multiple times to gather both
detection and non-detection data for the target species (MacKenzie et al. 2006). Camera trapping
has become a popular and widely used method for collecting such data on a variety of different
taxa (O'Connell et al. 2006, Lyra-Jorge et al. 2008, Rowcliffe and Carbone 2008). This technique
allows a site to be surveyed for extended lengths of time without the need for researcher

71
presence. In addition, technology has made the use of cameras affordable and logistically
favorable with increased memory storage and battery life (Locke et al. 2012).
Our objective for this study was to evaluate potential impacts gas and oil development
may have on the patterns of occurrence of meso-mammals in western North Dakota. We
estimated occupancy probabilities for two study areas varying in energy development intensities
using detection and non-detection data gathered from camera-scent stations over a two-year
period.
METHODS
Study Areas
Two study areas, Belden and Blaisdell, were established based on their relative oil well
densities with the goal of gathering data from areas with similar land use but differing levels of
oil and gas intensities. Study boundaries were constructed using 95% minimum convex polygons
around previous years of nesting locations (A. Robinson 2010, 2011) of sharp-tailed grouse
(Tympanuchus phasianellus) as part of a larger, related study conducted by the North Dakota
Game and Fish Department, Brigham Young University, and the University of North Dakota
(Figure 4).
Belden covered 147.2 km2 (centroid: N 48.107922, W -102.393517), and was our study
area of intense oil activity with numerous active oil wells present within and around its
boundary. We calculated well densities using our study area polygons and well location data
from the North Dakota Industrial Commission (NDIC 2013). Oil well density in Belden was
0.767 wells/km2 in the August of 2012 and 0.950 wells/km
2 in August of 2013 (NDIC 2013,
Figure 4).

72
Blaisdell represented an area of minimal oil development and covered 38.7 km2 in 2012
(centroid: N 48.300744, W -102.130655), but was expanded to 158.3 km2 in 2013 (centroid: N
48.262096, W -102.077418) in order to create more equitable study area size and increase
sample sizes for monitoring sharp-tailed grouse nests. This expansion was done by adding grouse
nesting locations recorded in 2012, as well as two additional leks to our original convex polygon.
A 3.22 km (2 mile) buffer was also included around each lek to encompass potential nesting
habitat for grouse at these leks (Figure 4). No active oil wells were within the 2012 boundary,
but one oil well was within the extended 2013 boundary resulting in a density of 0.006 wells/km2
(NDIC 2013). Although no active drilling occurred within Blaisdell during this study, there was
activity present around the study area, primarily to the west. Therefore, it was still susceptible to
disturbances associated with oil development. Thus, we considered it as an area of minimal
development rather than no activity.
Our study area boundaries were approximately 15 kilometers apart and where composed
of similar landscapes dominated by agriculture, grassland, hay land, and water bodies of various
sizes. Of the land within the Belden polygon, 61% is characterized as grassland/hay land, 31%
cropland, 6% wetland, and 2% trees/shrubs. The larger, 2013 Blaisdell polygon contained 44%
grassland/hay land, 45% cropland, 11% wetland, and 0% trees/shrubs (USFWS 2002). Mean
summer (May-August) temperature of Mountrail County is 16.7OC, with the warmest
temperatures occurring in July. Mean summer precipitation is approximately 6.3cm, with most
rainfall occurring in June and July (Mountrail County Records 2013).

73
Field Methods
We conducted predator surveys using camera-scent stations within both study areas from
May through July in 2012 and 2013. Each station consisted of a PC900 HyperfireTM
Reconyx
passive infrared field camera mounted on a metal stake approximately one meter above the
ground and placed approximately five meters in front of a scent lure. During camera installation
field technicians wore latex gloves to conceal human scent. Vegetation between the camera and
scent lure was removed or reduced to create a clear line of sight for the camera. Each camera was
set to take three consecutive photographs three seconds apart. After the third photograph was
taken the camera could not be triggered again for five minutes.
We deployed stations across the landscape using a two-stage sampling design. A grid
system with a cell size of 1 km by 1 km was overlayed on each study area using ArcGIS 10.1
(Esri 2012). Two random points, a primary and secondary, were generated within each grid cell
along a habitat edge. These edges were identified using the U.S. Fish and Wildlife Service
(2002) land use layer in ArcGIS and were characterized as areas where land use classification
changed across the landscape. Specifically, edges were identified as areas where water,
grassland, agriculture, or trees/shrubs intersected. Habitat edges were used in hopes of increasing
our detection probabilities, as mammalian predators are thought to utilize such edges while
traveling and foraging (Andrén 1995, Dijak and Thompson III 2000). Each grid cell and its
associated random point served as a potential location for one predator survey. However, all grid
cells could not be sampled due to the size of the study areas and logistical limitations. Therefore,
grid cells that received a predator survey were systematically chosen to ensure representative
sampling across the two study areas. In some instances, selected grid cells were not able to be

74
sampled due to access limitations on private land. In such cases, we then sampled using the
secondary random point or the next closest grid cell.
To increase our coverage of the study areas we sampled three groups of selected grid
cells throughout the summer, resulting in three separate sampling periods spanning from 21 May
to 30 July. We conducted our surveys during this time of year as it corresponds with the nesting
of many bird species in the state, including sharp-tailed grouse (Connelly et al. 1998, Peterson
2008). In 2012 each sample period lasted approximately 14 days. The three periods began on 21
May, 4 June, and 18 June, respectively. After discovering the number of detections to be lower
than expected in 2012, we increased the sample period length in 2013 in hopes of increasing our
detection probabilities (MacKenzie et al. 2006). The three sample periods for 2013 lasted
approximately 22 days and began on 24 May, 16 June, and 8 July, respectively. We also
increased the total number of predator surveys deployed in 2013 to increase overall sample size
and coverage of both areas.
Within the first half of each survey in both years, we used a fatty acid scented predator
disk (Pocatello Supply Depot) to lure mammalian predators to the camera. To avoid predator
acclimation to the scent of the predator disks, we replaced them half way through the survey with
Caven’s “Violator 7” predator lure (Minnesota Trap Line) with the goal of maintaining predator
interest and increasing detection probabilities. This second scent lure was placed inside of a
hollowed golf ball that was mounted on a wooden dowel and staked into the ground. The golf
ball served as a visual stimulus for predators in addition to the olfactory stimulus of the scent.
Such stimuli have been shown to elicit explorative behavior in coyotes when in unfamiliar
environments (Windberg 1996, Harris and Knowlton 2001). Scent lures were replaced in the

75
event of precipitation throughout the study to avoid scent being washed out. We collected
cameras at the conclusion of each survey and downloaded all pictures.
Pictures were reviewed and all meso-mammals were identified to species and recorded
per sampling occasion. We defined a single sampling occasion as a full 24 hour period making
up one calendar day. If a species was detected at least once within a sampling occasion a ‘1’ was
recorded. Likewise, if the species was not detected a ‘0’ was recorded. We did not use any
detections observed during the day of installation or termination of the camera-scent station as
these did not encompass a full 24 hour period. We increased sampling effort from 62 scent-
stations in 2012, to 101 in 2013 (Table 5). Of the original 62 survey locations across the two
study areas, 50 were resampled in 2013 (Figure 5). In total, we placed 163 camera-scent stations
across the landscape between both study areas and years, resulting in 2,930 separate trap
occasions (Table 5; Figure 5).
Data Analysis
We used a single season occupancy model to estimate predator occupancy in program
MARK (White and Burnham 1999). Because our study included only two years of data, and not
all survey sites were resampled in both years, we chose to include year as a covariate in our
analysis rather than using a robust model option. Moreover, our goal was to determine if
differences in species occurrence existed between study areas, rather than directly modeling
changes in occupancy over the two years. Model selection was made using Akaike’s Information
Criterion scores corrected for small sizes (AICc) to determine which models had the most
support (Akaike 1973, Burnham and Anderson 2002).

76
For the detection parameter (p) we explored the effects of year and sampling period (time
of summer) as covariates in our model construction (Table 6). Although the specific dates of our
sampling periods differed between years, we formatted sampling periods to include similar
portions of the summer months. The first period included scent stations that were active between
the dates of 20 May and 18 June, the second between 19 June and 8 July, and the third between 9
July and 29 July. For the purposes of our analysis, period one and period two were compared to
period three. We also allowed detection to vary within sampling periods to determine if
detections differed between individual sampling occasions (daily variation) or between scent
lures.
For the occupancy parameter (ψ), we included study area as a grouping variable while
exploring the covariates of year, euclidean distance to nearest oil well (m), euclidean distance to
nearest road (m), and oil well density and habitat composition within a 500 m radius of the
survey location (Table 6). This 500 m buffer was chosen to limit the amount of overlap between
neighboring survey locations while maintaining independence between sampling sites. We
lumped habitat composition into similar land use categories and classified them as water,
grassland, agriculture, or trees/shrubs. We then calculated the percentage of area covered by each
of these categories within the 500 m buffer around the survey locations. All spatial covariates
were calculated in ArcGIS using the NAD 1983 UTM zone 13N projected coordinate system.
To avoid multicollinearity we tested correlations among all continuous variables by
calculating Pearson’s correlation coefficients. If associated r2 values were greater than 0.3, we
did not use both covariates in the analysis (Moore and McCabe 1993).
We first developed a candidate set of biologically relevant models for each individual
meso-mammalian predator detected to determine individual species occupancy. To determine

77
habitat use of the predator community as a whole, we then constructed a model set that included
detections of all species lumped together, such that we did not differentiate among the predator
species (i.e., any predator occurrence resulted in a “1” regardless of species). If detections were
too low for successful modeling to be conducted for any individual species (failure of models to
converge), we did not conduct analysis on that particular species. However, their detections were
still included in the all species model. We estimated occupancy rates (ψ), detection rates (p), as
well as individual covariate beta’s (ß) by averaging the top models making up 95% of the total
weight (Burnham and Anderson 2002). We then back-transformed beta estimates to their
respective odds ratio (OR) for interpretation. Odds ratio confidence intervals including 1.0 are
not considered statistically significant, but may be biologically important if estimates are
deviating from 1.0. For this study, we refer to these potentially important biological results as
trending.
To assess the fit of our models we adapted the approach described by White et al. (2002).
We compared the model deviance of the most general model with the distribution of deviance
values obtained from 1000 parametric bootstrapping replicates ran in program MARK.
Currently, program MARK is unable to perform the bootstrap procedure with the incorporation
of individual covariates (Cooch and White 2006). Therefore, we used the most general models
without individual covariates for our goodness of fit analysis. If the model did not converge
properly we then chose the next most general model. Because the number of sampling occasions
differed between years, and program MARK cannot run parametric bootstraps with missing
observations, we tested goodness of fit by individual year (Cooch and White 2006). If lack of fit
was evident for either year, we used an overdispersion parameter ( to adjust and re-evaluate
the model selection procedures using quasi-AICc (Burnham and Anderson 2002). We calculated

78
by dividing the model deviance by the average deviance of all the replicates (White et al.
2002). Although missing observations are problematic when evaluating goodness of fit, they do
not contribute to the model likelihood in occupancy analysis (MacKenzie et al. 2002, MacKenzie
and Bailey 2004). We, therefore, combined both years of data when running our models by
formatting all data to include 22 sampling occasions per survey site.
We also tested for spatial autocorrelation to verify we did not violate the assumption of
independence among sampling points by using species detections to calculate Moran’s I in
program Spatial Analysis in Macroecology (SAM) (Rangel et al. 2010). We assessed presence of
spatial autocorrelation by visually inspecting correlograms of Moran’s I values.
RESULTS
Coyotes had the highest number of detections with a total of 64 of the 163 stations
detecting the species at least once. American badgers and raccoons were each detected > 1 times
at 27 stations. Striped skunks and red fox were detected at the fewest stations, with 19 and 4
stations detecting these species > 1 times, respectively (Table 5).
We found no evidence of lack of fit for any of the general models that successfully
converged (Table 7). Therefore, we used AICc as our model selection criteria without the
incorporation of an overdispersion factor. Percent agriculture and percent grassland were the
only covariates to have a coefficient that exceeded our cut-off (r2 = 0.912) (Appendix B, Table
17). We predicted grassland habitat to be more influential on predator occurrence and therefore
excluded percent agriculture from our analysis to avoid multicollinearity. In addition, we also
excluded percent trees as there was extremely low variation among the scent stations. In fact,
73.6% (120 out of 163) of the stations had 0% trees within their 500 m buffer, and the average
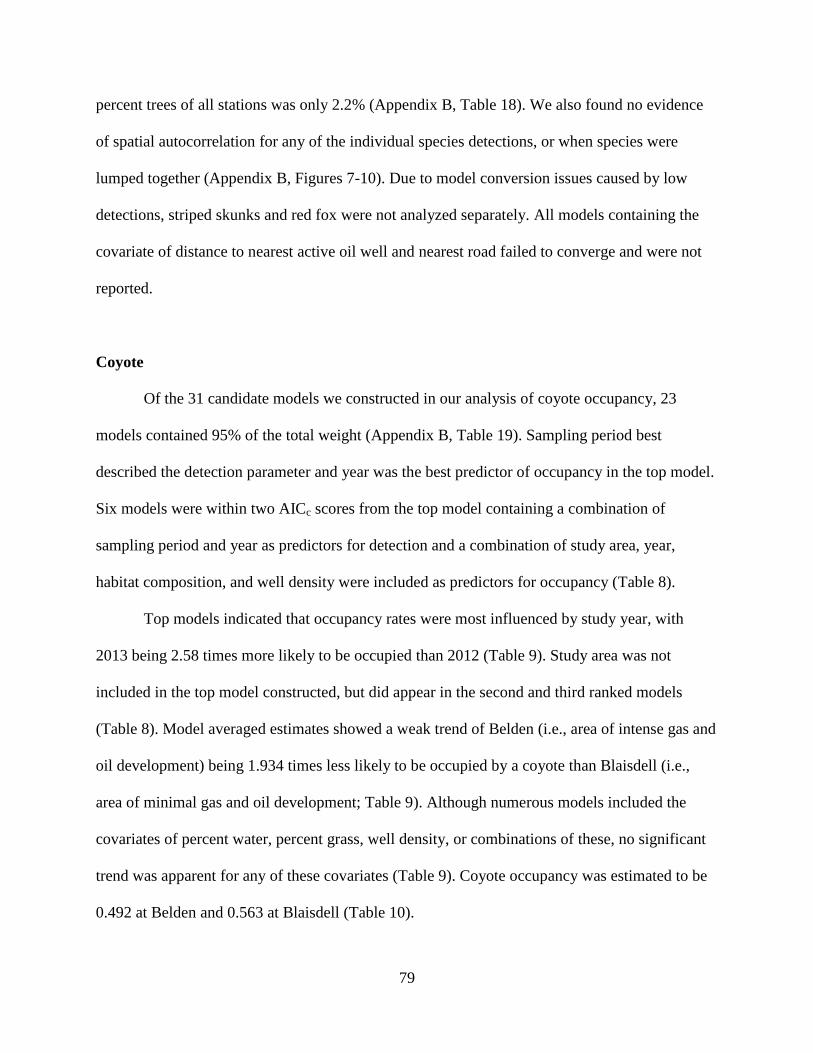
79
percent trees of all stations was only 2.2% (Appendix B, Table 18). We also found no evidence
of spatial autocorrelation for any of the individual species detections, or when species were
lumped together (Appendix B, Figures 7-10). Due to model conversion issues caused by low
detections, striped skunks and red fox were not analyzed separately. All models containing the
covariate of distance to nearest active oil well and nearest road failed to converge and were not
reported.
Coyote
Of the 31 candidate models we constructed in our analysis of coyote occupancy, 23
models contained 95% of the total weight (Appendix B, Table 19). Sampling period best
described the detection parameter and year was the best predictor of occupancy in the top model.
Six models were within two AICc scores from the top model containing a combination of
sampling period and year as predictors for detection and a combination of study area, year,
habitat composition, and well density were included as predictors for occupancy (Table 8).
Top models indicated that occupancy rates were most influenced by study year, with
2013 being 2.58 times more likely to be occupied than 2012 (Table 9). Study area was not
included in the top model constructed, but did appear in the second and third ranked models
(Table 8). Model averaged estimates showed a weak trend of Belden (i.e., area of intense gas and
oil development) being 1.934 times less likely to be occupied by a coyote than Blaisdell (i.e.,
area of minimal gas and oil development; Table 9). Although numerous models included the
covariates of percent water, percent grass, well density, or combinations of these, no significant
trend was apparent for any of these covariates (Table 9). Coyote occupancy was estimated to be
0.492 at Belden and 0.563 at Blaisdell (Table 10).

80
Detection probability for coyotes was fairly low, p = 0.078 (Table 10). Although not
significant, coyotes were trending to be 1.572 times more likely to be detected during sampling
period one compared to period three, and 1.495 times less likely during period two (Table 11).
Odds ratio showed no real influence of the covariate year on detection (Table 11).
American badger
We constructed a total of 31 models in our analysis for American badgers, of which 19
models contained 95% of the total weight (Appendix B, Table 20). The top model contained the
covariate of sampling period for the detection parameter and study area, percent grass, and
percent water best described the occupancy parameter. Three models were within two AICc
scores from the top model containing sampling period or no covariate as predictors for detection
and a combination of study area, percent grass, and percent water as predictors for occupancy
(Table 8).
The covariate of study area was included in the occupancy parameter for all top 95%
models, with Belden occupancy strongly trending to be 10.417 times less likely compared to
Blaisdell based on model-averaged estimates (Table 9). American badger occupancy was
estimated to be 0.174 at Belden and 0.670 at Blaisdell (Table 10). Although the covariate of year
only appeared in 4 models as a predictor of occupancy, model-averaged estimate revealed
occupancy trending to be 2.260 times greater in 2013 compared to 2012 (Table 9). Combinations
of percent grass and percent water were included in many of the top models, including the top 5,
but no significant trend was evident. Similarly, well density showed no evidence of a trend.
Detection probability for badgers were extremely low, p = 0.029 (Table 10). Sampling
period was included within the detection parameter in 12 of the top models containing 95% of

81
the total weight, including the top two models (Table 8). Averaged estimates revealed American
badger detections trending to be 1.522 times lower in period one compared to period three, and
period two was 3.236 times lower than period three (Table 11). Year appeared in 5 of the top
95% models, but odds ratios for this covariate did not show any kind of trend on detection (Table
11).
Raccoon
We constructed a total of 33 models in our analysis for raccoons, of which 10 models
contained 95% of the total weight (Appendix B, Table 21). The top model contained sampling
period describing detection parameter and year, percent grass, and percent water as predictors for
the occupancy parameter. Two models were within two AICc scores from the top model
containing a combination of sampling period and year as predictors for detection and a
combination of study area, year, and habitat composition as predictors for occupancy (Table 8).
Although not present in the top model, model averaged estimates revealed study area to
have a trend of Belden being 2.160 times less likely to be occupied by a raccoon compared to
Blaisdell (Table 9). Raccoon occupancy at Belden was estimated to be 0.143 and at Blaisdell was
estimated at 0.188 (Table 10). The covariates of year and habitat composition seemed to have the
most influence on occupancy, appearing in the top model and throughout most models that
contained 95% of the total weight (Table 8). The covariate of year indicated occupancy to be
trending 3.577 times higher in 2013 compared to 2012, but have confidence overlapping zero
(Table 9). Percent water consistently appeared in many of the top models, but no strong trend
was apparent. Percent grass was included in all top 95% models, and although confidence

82
interval indicated a significant affect, the odds ratio (OR = 0.962) revealed a very weak influence
(Table 9).
Detection probability for raccoons were fairly low, p = 0.081 (Table 10). Sampling period
was included in all top 95% models within the detection parameter. Raccoons detection was 5.05
times higher in sampling period one compared to period three, and period two was trending to be
1.712 times lower than period three (Table 11). There was also evidence for a weak trend effect
of year, with 2013 detection being 1.321 times greater than 2012 (Table 11).
All Species
We constructed a total of 30 models using all species detections lumped together. Of
these, 11 models contained the top 95% of the total weight (Appendix B, Table 22). The top
model contained sampling period as a predictor of the detection parameter and study area, year,
and percent grass best describing occupancy. Three models were within two AICc scores from
the top model containing sampling period as predictors for detection and a combination of study
area, year, and habitat composition, as predictors for occupancy (Table 8).
The occupancy parameter included the covariates of study area and year in all of the top
95% models. Belden was 4.50 times less likely to be occupied than Blaisdell and occupancy was
4.75 times greater in 2013 compared to 2012 (Table 9). Occupancy estimates for the predator
community as a whole was 0.863 for Blaisdell, and 0.582 for Belden (Table 10). Percent grass
and percent water were also included in the top two models and several other candidate models.
However, no significant trend appeared for either covariate (Table 9).
Detection probabilities were moderately low for the predator community as a whole, p =
0.121 (Table 10). Sampling period appeared to be influential on detection as it appeared in all top

83
models containing 95% of the total weight. Detections were trending to be 1.354 times greater
during the first sampling period compared with sampling period three, but lacked statistical
significance. Sampling period two was significantly 1.718 times less likely to detect a meso-
mammal compared to detection probabilities of period three (Table 11). Odds ratios for the
covariate of year did not show any kind of trend on detection (Table 11).
DISCUSSION
Our results suggest that gas and oil development may impact meso-mammal occurrence
patterns. In general, we found higher occupancy rates at Blaisdell (i.e., area of minimal gas and
oil development) compared to Belden (i.e., area of intense gas and oil development). These
results suggest a possible negative influence of gas and oil development on the patterns of meso-
mammalian habitat use in western North Dakota that may be the result of the disturbances
associated with energy development.
This trend was strongest for American badgers and moderate for coyotes and raccoons.
These weaker effects were fairly predictable as both coyotes and raccoons are known to show
some level of tolerance toward human activity (George and Crooks 2006, Gehrt 2007, Ordeñana
et al. 2010). Coyotes have relatively large home ranges, generally thrive in fragmented
landscapes, and are willing to cross roads when traveling (Tigas et al. 2002, Atwood et al. 2004).
Likewise, raccoons are often found in areas with substantial human activity, including urban and
suburban areas (Prange et al. 2004, Ordeñana et al. 2010). Raccoon abundance also has been
found to be positively related to agricultural patch size (Dijak and Thompson III 2000), and
agriculture is a dominate habitat in our studies areas. This relationship with agriculture is most
likely the reason why the covariate of percent grass was statistically significant in our findings of

84
raccoon occupancy since our results showed a slightly negative relationship with percent grass,
which was highly correlated with percent agriculture. Although odds ratio did not show a strong
trend, the fact this covariate was in numerous top models and had extremely tight confidence
intervals elucidates its effects on raccoon occurrence.
Although there was substantial variability, Blaisdell was, on average, 10.4 times more
likely to be occupied by an American badger compared to Belden. Badgers are rarely found in
close proximity with human development (Ordeñana et al. 2010), and are sensitive to increased
fragmentation and decreased patch size (Crooks 2002). Activities relating to gas and oil
development have the potential to increase such fragmentation of the landscape (Copeland et al.
2009, Mason 2012). Duquette et al. (2014) found badgers to select for large habitats containing
a mixture of pasture, cropland, and prairie. Both study areas are dominated by these land use
categories, which is most likely the cause for not finding a significant influence of habitat
composition on badger occupancy.
In our all species model set, we lumped all species detections together to evaluate
occupancy of the meso-mammal community as a whole. We found study area to be a significant
predictor of occupancy following the pattern of the individual species models. Although
individual species tolerance toward disturbances varies, we found an overall negative effect
associated with gas and oil development. Exact cause of this relationship was not explored here,
but should be an area of focus for future studies.
Previous work has found a negative impact of human built infrastructure on mammalian
abundance (Benítez-López et al. 2010). Gas and oil development introduces a variety of
infrastructure such as access roads, buildings, camp sites, drill pads, and power lines (Weller et
al. 2002). Meso-mammals may possibly be avoiding such structures and seeking out other

85
habitat. In addition, areas under development experience large increases of vehicle traffic
associated with the construction, drilling, and maintenance of oil wells (Wilke et al. 2011). This
increase may have the indirect effect of species shifting their movement behavior away from
roads, or directly through mortality caused by vehicle collisions. In fact, a primary cause of
mortality for many meso-mammal species is vehicle collisions (Ashley and Robinson 1996,
Tigas et al. 2002, Gehrt 2005, Gosselink et al. 2007, Kinley and Newhouse 2008). Likewise,
energy development produces high levels of chronic noise which has been found to negatively
impact a variety of different taxa (Barber et al. 2010). Meso-mammals are most likely
responding to all of these factors to different degrees, resulting in the reduced occurrence
observed at our intense energy development study area.
Occupancy was consistently greater in the year 2013 compared to 2012. This was
significant for our all species and coyote model sets, and strongly trending for badgers and
raccoons. These findings agree with North Dakota’s annual rural mail carrier survey of furbearer
species (Tucker 2014). These surveys encompass large geographical regions of the state and are
primarily used to evaluate trends in species populations. Coyotes, striped skunks, red fox, and
raccoons all showed increases in the number of observations per 1,000 miles between 2012 and
2013 in our study region (Tucker 2014). However, badgers showed a six percent drop. This
slight decrease was not evident in our findings, but badgers occurrence had the weakest increase
between years.
No spatial covariates used in our analysis seemed to be strong predictors of occupancy in
any model sets. We used the scale of 500 meters for these covariates to limit overlap and
maintained spatial independence between survey sites. However, lack of influence of these
covariates may indicate impacts of gas and oil development are more influential at scales larger

86
than we were able to capture with this spatial extent. Using larger extents would have resulted in
correlation among survey sites at each study area. However, we predict the scale of our study
areas is perhaps more effectively capturing these impacts on the meso-mammal community and
is the reason for its influences in our models.
Estimated detection probabilities for each model set was fairly low (Table 10), and
overall lower than related studies (Gompper et al. 2006, O'Connell et al. 2006). Coyotes were
photographed at the greatest number of scent stations (39.9%), but had a low detection
probability of only 0.078. This species has the largest home range compared to the other species
studied here, and can readily move large distances in short periods of time (Seabloom 2011).
Because of this, it is most likely coyotes had the greatest number of opportunities to come in
contact with a scent station. However, coyotes are also known to avoid novel items and may
show avoidance toward camera scent stations (Séquin et al. 2003). Badgers and skunks were
photographed at an equal number of scent stations (16.6%), but had considerably different
detection probabilities. Raccoons had the highest probability of all species (0.081) and badgers
had the lowest (0.029). The ecology of these species is markedly different and most likely the
cause for the differences observed in our study. Raccoons have larger home ranges that typically
overlap, whereas badgers are highly territorial. Raccoons are also more social compared to the
solitary nature of badgers, and raccoons have long been known to be highly curious toward novel
items (Davis 1907, Seabloom 2011).
Low detection rates of all species studied here indicate a general lack of repeated
visitations at scent stations. This may be the product of predator acclimation toward our scent
lures, or from our relatively short sampling period. The covariate of year did not show an
influence on detection for any of the model sets which suggest daily probability of detection

87
were not different between years. Further, optimal length of a camera survey needed for one
detection has been reported to be greater than 40 days for coyotes and greater than 30 days for
raccoons (Gompper et al. 2006, O'Connell et al. 2006). It is likely our trade-off for increased
representation of scent stations across the study area resulted in our survey duration not being
adequately long enough to accurately detect the presence of the target species (Mackenzie and
Royle 2005).
Unfortunately, we were unable to conduct an individual species analysis on the red fox
and striped skunks due to extremely low detections. Red fox are commonly known to avoid
coyotes (Sargeant et al. 1987, Harrison et al. 1989), and possibly even be competitively excluded
by them (Lavin et al. 2003). Because occupancy estimates of coyotes at both of our study areas
were higher than other meso-mammals (Table 10), this may have reduced the occurrence and
detection of red fox. On the other hand, low detections of striped skunks were unexpected, as
they were thought to be relatively abundant across this region of North Dakota (Tucker 2014).
Generally, other studies have shown high success using camera traps for detecting striped skunks
(O'Connell et al. 2006, Nichols et al. 2008, Ordeñana et al. 2010). However, detectability of
striped skunks has been shown to greatly decline during the late spring and summer months due
to resource availability, male sexual behavior, and reduced movement of pregnant females
(Bailey 1971). Hackett et al. (2007) found similar detection results when surveying the eastern
spotted skunk (Spilogale putorius) and attributed these low detections to their reproduction
ecology and variation in seasonal habitat use. Therefore, low detections of stripped skunks is
presumably a result of the seasonal timing of our study and not the methodology used.
Time of summer consistently influenced our ability to detect the target species. This can
best be attributed to the species activity patterns relating to their reproductive ecology (see

88
Seabloom 2011). Model sets of coyote, raccoon, and all species lumped together revealed
detection probabilities to be greatest during our first sampling period which took place at the
beginning of summer. Breeding of these species occurs at this time and activity levels typically
increase for mate selection and foraging purposes. Conversely, detection of badgers was greatest
during our third and final sampling period. This finding is reflective of the fact badgers begin
breeding at end of the summer.
Detection probabilities were lowest for all species analyzed during our second sampling
period. During the mid-summer male activity generally decreases once the breeding season is
concluded, and female’s activity decreases as the gestation period begins. After parturition,
mother and young are typically restricted to dens as nursing takes place, often for multiple
weeks. Once matured enough, young will then leave their dens but remain in confined areas and
dependent on their mother. Gradually they will begin to move larger distances as the summer
progress, increasing the chance of detection.
Although our data suggests lower occurrence of meso-mammals at the study area of
intense energy development, the fast pace and large scale of gas and oil development occurring
in western North Dakota makes before and after studies on the impacts on wildlife extremely
difficult. To our knowledge, no prior work has been done on the meso-mammal community in
western North Dakota aside from the state’s annual rural mail carrier surveys. Therefore, it is
possible meso-mammal occupancy was initially different between our study areas before energy
development began. Further, given our lack of spatial replication at the study area level we are
unable to evaluate cause and effect of energy development impacts and only able to assess
correlative impacts. However, with the study area similarities in habitat composition and close
proximity to one another, it is logical that the predator community would thrive equally well at

89
both study areas. Further work on meso-mammals in western North Dakota is needed to clarify
responses of these species to energy development.
The process of gas and oil development can commonly be broken down into four general
stages: exploration, drilling, production, and abandonment. During the two years this study took
place, we worked in an area dominated by the drilling stage, which includes the active
construction and drilling of oil wells. These activities result in increased disturbances created
from machinery, traffic, and human presence. Eventually this area will be saturated with wells
extracting oil and gas and will then be in the production stage, at which point human presence is
only required for regular maintenance and inspection. This will result in a landscape left altered
and fragmented to a certain degree, but experiencing much less disturbance. Therefore, we
predict occupancy rates may shift back toward this area of intense gas and oil development
during the production stage. Future research should focus on capturing a longer temporal scale so
that the dynamic process of gas and oil development progresses through each stage can be
assessed.
Management Implications
Ecological impacts of energy development have gained a great deal of attention in recent
years over the concern for the management and conservation of wildlife and their habitats. Here,
we have found a negative correlation on the meso-mammal community which may impact the
ecology of other species. One primary concern is that of the local bird species found throughout
North Dakota. We estimated higher sharp-tailed grouse nest success at our high intensity study
area and greater predation rates at the low intensity study area in a complementing study (see
Chapter 2), reinforcing our results from the predator surveys. Although areas of development

90
may have greater nest success, it is unclear at this point whether this translates into greater
recruitment.
Trapping of furbearer species is also very popular throughout the state. Recently, fur
prices have increased to the highest they have been in decades (Tucker 2014). If these species are
being displaced by disturbances associated with energy development, they may be restricted to
areas with greater competition pressures. Likewise, energy development may be directly
reducing population numbers through mortality related to road kill or illegal poaching.
Development will continue to be a significant pressure on wildlife as energy demands continue
to increase (IEA 2012). Continued research on this subject will ultimately help to understand
these processes as well as mitigate impacts on local ecosystems.

91
LITERATURE CITED
Akaike, H. 1973. Information theory as an extension of the maximum likelihood principle. Pages
267-281 in B. N. Petrov, andF. Csaki, editors. Second International Symposium on
Information Theory. Akademiai Kiado, Budapest.
Andrén, H. 1995. Effects of landscape composition on predation rates at habitat edges. Pages
225-255 in L. Hansson, L. Farig, andG. Marriam, editors. Mosaic landscapes and
ecological processes. Springer Netherlands, London, United Kingdom.
Ashley, E. P., and J. T. Robinson. 1996. Road mortality of amphibians, reptiles and other
wildlife on the Long Point Causeway, Lake Erie, Ontario. Canadian Field Naturalist
110:403-412.
Atwood, T. C., H. P. Weeks, T. M. Gehring, and J. White. 2004. Spatial ecology of coyotes
along a suburban-to-rural gradient. Journal of Wildlife Management 68:1000-1009.
Ausick, P., and M. B. Sauter. 2013. The 10 most oil-rich states. in USA Today. 24/7 Wall St.,
New York, NY.
Bailey, T. N. 1971. Biology of striped skunks on a southwestern Lake Erie marsh. American
Midland Naturalist 85:196-207.
Barber, J. R., K. R. Crooks, and K. M. Fristrup. 2010. The costs of chronic noise exposure for
terrestrial organisms. Trends in Ecology & Evolution 25:180-189.

92
Beck, J. L. Impacts of oil and natural gas on prairie grouse: current knowledge and research
needs., Pages 66-87 in Conference Impacts of oil and natural gas on prairie grouse:
current knowledge and research needs. R. I. Barnhisel. 3134 Montavesta Rd., Lexington,
KY 40502.
Benítez-López, A., R. Alkemade, and P. A. Verweij. 2010. The impacts of roads and other
infrastructure on mammal and bird populations: a meta-analysis. Biological conservation
143:1307-1316.
Burnham, K. P., and D. R. Anderson. 2002. Model selection and multimodel inference : a
practical information-theoretic approach. 2nd edition. Springer, New York.
Chalfoun, A. D., F. R. Thompson, and M. J. Ratnaswamy. 2002. Nest predators and
fragmentation: a review and meta-analysis. Conservation Biology 16:306-318.
Connelly, J. W., M. W. Gratson, and K. P. Reese. 1998. Sharp-tailed Grouse (Tympanuchus
phasianellus). The Birds of North America Online (A. Poole, Ed.). Ithaca: Cornell Lab of
Ornithology. <http://bna.birds.cornell.edu/bna/>. Accessed 29 May 2013.
Cooch, E., and G. White. 2006. Program MARK: a gentle introduction. 13 edition. Volume
7.available online with the MARK programme.
Copeland, H. E., K. E. Doherty, D. E. Naugle, A. Pocewicz, and J. M. Kiesecker. 2009. Mapping
Oil and Gas Development Potential in the US Intermountain West and Estimating
Impacts to Species. PLoS ONE 4:1-7.
Côté, I. M., and W. J. Sutherland. 1997. The effectiveness of removing predators to protect bird
populations. Conservation Biology 11:395-405.
Crooks, K. R. 2002. Relative sensitivities of mammalian carnivores to habitat fragmentation.
Conservation Biology 16:488-502.

93
Crooks, K. R., and M. E. Soule. 1999. Mesopredator release and avifaunal extinctions in a
fragmented system. Nature 400:563-566.
Davis, H. B. 1907. The raccoon: a study in animal intelligence. The American Journal of
Psychology 18:447-489.
Dijak, W. D., and F. R. Thompson III. 2000. Landscape and edge effects on the distribution of
mammalian predators in Missouri. The Journal of Wildlife Management 64:209-216.
Duquette, J. F., S. D. Gehrt, B. Ver Steeg, and R. E. Warner. 2014. Badger (Taxidea taxus)
Resource Selection and Spatial Ecology in Intensive Agricultural Landscapes. The
American Midland Naturalist 171:116-127.
Dyke, S., D. Fryda, D. Kleyer, J. Williams, B. Hosek, W. Jensen, S. Johnson, A. Robinson, B.
Ryckman, B. Stillings, M. Szymanski, S. Tucker, and B. Wiedmann. 2010. Potential
impacts of oil and gas development on select North Dakota natural resources: a report to
the director. North Dakota Game and Fish Department, Bismarck, ND.
Gaswirth, S. B., K. R. Marra, T. A. Cook, R. R. Charpentier, D. L. Gautier, D. K. Higley, T. R.
Klett, M. D. Lewan, P. G. Lillis, C. J. Schenk, M. E. Tennyson, and K. J. Whidden. 2013.
Assessment of undiscovered oil resources in the Bakken and Three Forks formations,
Williston Basin Province, Montana, North Dakota, and South Dakota, 2013: USGS
national assessment of oil and gas fact sheet 2013-3013.4p.
Gehrt, S. D. 2005. Seasonal survival and cause-specific mortality of urban and rural striped
skunks in the absence of rabies. Journal of Mammalogy 86:1164-1170.
_____. 2007. Ecology of coyotes in urban landscapes. Wildlife Damage Management
Conferences, Proceedings. Paper 63.

94
George, S. L., and K. R. Crooks. 2006. Recreation and large mammal activity in an urban nature
reserve. Biological conservation 133:107-117.
Gilbert, M. M., and A. D. Chalfoun. 2011. Energy development affects populations of sagebrush
songbirds in Wyoming. The Journal of Wildlife Management 75:816-824.
Gompper, M. E., R. W. Kays, J. C. Ray, S. D. Lapoint, D. A. Bogan, and J. R. Cryan. 2006. A
comparison of noninvasive techniques to survey carnivore communities in northeastern
North America. Wildlife Society Bulletin 34:1142-1151.
Gosselink, T. E., T. R. Deelen, R. E. Warner, and P. C. Mankin. 2007. Survival and cause-
specific mortality of red foxes in agricultural and urban areas of Illinois. The Journal of
Wildlife Management 71:1862-1873.
Hackett, H. M., D. B. Lesmeister, J. Desanty-Combes, W. G. Montague, J. J. Millspaugh, and M.
E. Gompper. 2007. Detection rates of eastern spotted skunks (Spilogale putorius) in
Missouri and Arkansas using live-capture and non-invasive techniques. The American
Midland Naturalist 158:123-131.
Harris, C. E., and F. F. Knowlton. 2001. Differential responses of coyotes to novel stimuli in
familiar and unfamiliar settings. Canadian journal of Zoology 79:2005-2013.
Harrison, D. J., J. A. Bissonette, and J. A. Sherburne. 1989. Spatial relationships between
coyotes and red foxes in eastern Maine. The Journal of Wildlife Management:181-185.
Internation Energy Agency (IEA). 2012. World energy outlook 2012.
<http://www.worldenergyoutlook.org> Accessed 2014 April 1.

95
Jones, C., M. J. McShea, M. J. Conroy, and T. H. Kunz. 1996. Capturing mammals. Pages 115-
155 in D. E. Wilson, F. R. Cole, J. D. Nichils, R. Rudran, andM. S. Foster, editors.
Measuring and monitoring biological diversity: Standard methods for mammals.
Smithsonian Institution Press, Washington, D.C., USA.
Jones, S. L., and J. S. Dieni. 2007. The relationship between predation and nest concealment in
mixed-grass prairie passerines: an analysis using program MARK. Studies in Avian
Biology:117-123.
Kinley, T. A., and N. J. Newhouse. 2008. Ecology and Translocation-Aided Recovery of an
Endangered Badger Population. The Journal of Wildlife Management 72:113-122.
Klemola, T., M. Koivula, E. Korpimäki, and K. Norrdahl. 2000. Experimental tests of predation
and food hypotheses for population cycles of voles. Proceedings of the Royal Society of
London. Series B: Biological Sciences 267:351-356.
Korpimäki, E., and K. Norrdahl. 1998. Experimental reduction of predators reverses the crash
phase of small-rodent cycles. Ecology 79:2448-2455.
Lavin, S. R., T. R. Van Deelen, P. W. Brown, R. E. Warner, and S. H. Ambrose. 2003. Prey use
by red foxes (Vulpes vulpes) in urban and rural areas of Illinois. Canadian journal of
Zoology 81:1070-1082.
Lawson, A. L., M. L. Morrison, and R. D. Slack. 2011. Impacts of Oil and Gas Development on
Wintering Grassland Birds at Padre Island National Seashore, Texas. Southeastern
Naturalist 10:303-320.
Locke, S. L., I. D. Parker, and R. R. Lopez. 2012. Use of Remote Camera in Wildlife Ecology.
Pages 311-318 in N. J. Silvy, editor. The Wildlife Techniques Manual. Johns Hopkins
University Press, Baltimore, MD.

96
Lyra-Jorge, M. C., G. Ciocheti, V. R. Pivello, and S. T. Meirelles. 2008. Comparing methods for
sampling large-and medium-sized mammals: camera traps and track plots. European
Journal of Wildlife Research 54:739-744.
MacKenzie, D., and L. L. Bailey. 2004. Assessing the fit of site-occupancy models. Journal of
Agricultural Biological and Environmental Statistics 9:300-318.
MacKenzie, D. I., J. D. Nichols, J. E. Hines, M. G. Knutson, and A. D. Franklin. 2003.
Estimating site occupancy, colonization and local extinction when a species is detected
imperfectly. Ecology 84:2200-2207.
MacKenzie, D. I., J. D. Nichols, G. B. Lachman, S. Droege, J. Andrew Royle, and C. A.
Langtimm. 2002. Estimating site occupancy rates when detection probabilities are less
than one. Ecology 83:2248-2255.
Mackenzie, D. I., and J. A. Royle. 2005. Designing occupancy studies: general advice and
allocating survey effort. Journal of Applied Ecology 42:1105-1114.
MacKenzie, D. I., J. A. Royle, J. D. Nichols, K. H. Pollock, L. L. Bailey, and J. E. Hines. 2006.
Occupancy estimation and modeling: inferring patterns and dynamics of species
occurrence. Acedemic, New York, New York, USA.
Martin, T. E. 1988. Processes organizing open-nesting bird assemblages: competition or nest
predation? Evolutionary Ecology 2:37-50.
_____. 1995. Avian life history evolution in relation to nest sites, nest predation, and food.
Ecological monographs 65:101-127.
Mason, J. 2012. Oil production potential of the North Dakota Bakken. Oil and Gas Journal
110:76-86.

97
Meissner, F. F. 1991. Petroleum geology of the Bakken Formation, Williston basin, North
Dakota and Montana. Montana Geological Soceity: Guidebook to Geology and
Horizontal Drilling of the Bakken Formation:19-42.
Moore, D. R., and G. P. McCabe. 1993. Introduction to the practice of statistics. Second edition.
W. H. Freeman and Company, New York, New York.
Mountrail County Records. 2013. North Dakota/Mountrail County Weather. USA.com.
Available at: http://www.usa.com/mountrail-county-nd-weather.htm.
Nellemann, C., and R. Cameron. 1998. Cumulative impacts of an evolving oil-field complex on
the distribution of calving caribou. Canadian journal of Zoology 76:1425-1430.
Nichols, J. D., L. L. Bailey, N. W. Talancy, E. H. Campbell Grant, A. T. Gilbert, E. M. Annand,
T. P. Husband, and J. E. Hines. 2008. Multi-scale occupancy estimation and modelling
using multiple detection methods. Journal of Applied Ecology 45:1321-1329.
Nordeng, S. 2010. A brief history of oil production from the Bakken Formation in the Williston
Basin. NDGS newsletter 37:5-9.
North Dakota Industrial Commission. (NDIC). 2013. Department of Mineral Resources, Oil and
Gas Division. https://www.dmr.nd.gov/oilgas/.
O'Connell, A. F., Jr., N. W. Talancy, L. L. Bailey, J. R. Sauer, R. Cook, and A. T. Gilbert. 2006.
Estimating site occupancy and detection probability parameters for meso- and large
mammals in a coastal ecosystem. Journal of Wildlife Management 70:1625-1633.
Ordeñana, M. A., K. R. Crooks, E. E. Boydston, R. N. Fisher, L. M. Lyren, S. Siudyla, C. D.
Haas, S. Harris, S. A. Hathaway, and G. M. Turschak. 2010. Effects of urbanization on
carnivore species distribution and richness. Journal of Mammalogy 91:1322-1331.

98
Palomares, F., P. Gaona, P. Ferreras, and M. Delibes. 1995. Positive effects on game species of
top predators by controlling smaller predator populations: An example with lynx,
mongooses, and rabbits. Conservation Biology 9:295-305.
Peterson, R. T. 2008. Peterson field guide to birds of North America. Houghton Mifflin
Harcourt, Boston, New York.
Prange, S., S. D. Gehrt, and E. P. Wiggers. 2004. Influences of anthropogenic resources on
raccoon (Procyon lotor) movements and spatial distribution. Journal of Mammalogy
85:483-490.
Rangel, T. F., J. A. F. Diniz-Filho, and L. M. Bini. 2010. SAM: a comprehensive application for
spatial analysis in macroecology. Ecography 33:46-50.
Ricklefs, R. E. 1969. An analysis of nesting mortality in birds. Smithsonian Contributions to
Zoology 9:1-48.
Rowcliffe, J. M., and C. Carbone. 2008. Surveys using camera traps: are we looking to a brighter
future? Animal Conservation 11:185-186.
Sargeant, A. B., S. H. Allen, and J. O. Hastings. 1987. Spatial relations between sympatric
coyotes and red foxes in North Dakota. The Journal of Wildlife Management:285-293.
Sargeant, A. B., M. A. Sovada, and R. J. Greenwood. 1998. Interpreting evidence of depredation
of duck nests in the prairie pothole region. U.S. Geological Survey, Northern Prairie
Wildlife Research Center, Jamestown, ND and Ducks Unlimited, Inc., Mamphis, TN.
Sargeant, A. B., M. A. Sovada, and T. L. Shaffer. 1995. Seasonal predator removal relative to
hatch rate of duck nests in waterfowl production areas. Wildlife Society Bulletin:507-
513.

99
Sawyer, H., F. Lindzey, D. McWhirter, and K. Andrews. Potential effects of oil and gas
development on mule deer and pronghorn populations in western Wyoming, Pages 350-
365 in Conference Potential effects of oil and gas development on mule deer and
pronghorn populations in western Wyoming. J. Rahm. Washington, DC.
Sawyer, H., R. M. Nielson, F. Lindzey, and L. L. McDONALD. 2006. Winter habitat selection
of mule deer before and during development of a natural gas field. Journal of Wildlife
Management 70:396-403.
Seabloom, R. 2011. The mammals of North Dakota. Institute for Regional Studies, NDSU,
Fargo, N.D.
Séquin, E. S., M. M. Jaeger, P. F. Brussard, and R. H. Barrett. 2003. Wariness of coyotes to
camera traps relative to social status and territory boundaries. Canadian journal of
Zoology 81:2015-2025.
Tietje, W. D., and R. L. Ruff. 1983. Responses of black bears to oil development in Alberta.
Wildlife Society Bulletin 11:99-112.
Tigas, L. A., D. H. Van Vuren, and R. M. Sauvajot. 2002. Behavioral responses of bobcats and
coyotes to habitat fragmentation and corridors in an urban environment. Biological
conservation 108:299-306.
Tucker, S. 2014. Study No. E-11: Furbearer Harvest Regulations Study. North Dakota Game and
Fish Department.
USFWS. 2002. US Fish and Wildlife Service 2002 Landcover. Region 6. ISO
19115:2003/19139.
Van Dyke, F., and W. C. Klein. 1996. Response of elk to installation of oil wells. Journal of
Mammalogy 77:1028-1041.

100
Weller, C., P. Thompson, P. Morton, and G. Aplet. 2002. Fragmenting our lands: the ecological
footprint from oil and gas development. The Wilderness Society, Washington, D.C.,
USA.
White, G. C., and K. P. Burnham. 1999. Program MARK: survival estimation from populations
of marked animals. Bird Study 46:120-139.
White, G. C., K. P. Burnham, and D. R. Anderson. Advanced features of program MARK. The
Wildlife Society, 2002.
Wilke, P. W., P. P. Engineer, and M. Harrell. Assessment of Impact of Energy Development
Projects on Local Roads. 2011.
Windberg, L. A. 1996. Coyote responses to visual and olfactory stimuli related to familiarity
with an area. Canadian journal of Zoology 74:2248-2253.
Wiseman, H. 2009. Untested waters: the rise of hydraulic fracturing in oil and gas production
and the need to revisit regulation. Fordham Environmental Law Review 20:115-170.
Wolfe, S. A., B. Griffith, and C. A. Gray Wolfe. 2000. Response of reindeer and caribou to
human activities. Polar Research 19:63-73.

101
Table 5. Meso-Mammal detections recorded from camera scent-stations deployed in 2012
and 2013 between two study areas in western North Dakota. Belden represented intense gas
and oil development, whereas Blaisdell represented minimal development. Numbers listed for
each species represent the number of stations it was detected at, regardless of how many times.
2012 2013
Belden Blaisdell Belden Blaisdell Total
Number of Stations 33 29 51 50 163
Sampling Occasions
(Trap-Nights) 429 377 1,072 1,052 2,930
Coyote (Canis latrans) 7 9 22 26 64
American badger (Taxidea taxus) 0 7 7 13 27
Raccoon (Procyon lotor) 2 4 5 16 27
Striped skunk (Mephitis mephitis) 1 4 5 9 19
Red fox (Vulpes vulpes) 0 1 0 3 4
Table 6. Explanatory covariates used for analyzing occupancy and detection rates of the
meso-mammal community in western North Dakota, 2012–2013. Covariates marked with an
asterisk(*) were not used in the analysis due to correlation or model convergence issues (see
results).
Covariate Data Type Description
Detection Parameter
Year Categorical Study year: 2012 or 2013
Sample period (P) Categorical
Corresponding to the time of summer camera-scent stations were
deployed: 20 May – 18 June (P1), 19 June – 8 July (P2), or 9 July –
29 July.
Occupancy Parameter
Area Categorical Study area: Belden or Blaisdell
Year Categorical Study year: 2012 or 2013
DistWell* Continuous Distance to nearest active oil well (m)
DistRoad* Continuous Distance to nearest road (m)
WellDens Continuous Active oil well density within 500m of the camera-scent station
(wells/km2)
PerGrass Continuous Percent grass within 500 meters of the camera scent station
PerAg* Continuous Percent agriculture within 500 meters of the camera scent station
PerWtr Continuous Percent Water within 500 meters of the camera scent station
PerTr* Continuous Percent Trees within 500 meters of the camera scent station

102
Table 7. Goodness-of-fit analysis results on the most general models for each meso-
mammal species analyzed by year. Deviance adjusted was calculated by dividing the models
observed deviance by the averaged bootstrap deviance. *1000 parametric bootstraps were used in
the analysis in program MARK.
Model
Observed
model
deviance
Average
bootstrap
deviance*
Deviance
adjusted
Deviance
distribution
p-value
Coyote
2012 ψ(Area) p(.) 100.543 95.615 1.05 0.410
2013 ψ(Area) p(t) 279.255 266.76 1.05 0.376
Badger
2012 ψ(Area) p(.) 27.73 26.375 1.05 0.413
2013 ψ(Area) p(.) 49.646 97.705 0.51 0.990
Raccoon
2012 ψ(Area) p(.) 61.636 57.507 1.07 0.415
2013 ψ(Area) p(.) 161.294 193.737 0.83 0.766
All Species
2012 ψ(Area) p(t) 160.66 138.95 1.16 0.181
2013 ψ(Area) p(t) 567.72 568.05 1.00 0.505

103
Table 8. Models within two AICc scores from the highest ranked model in each model set
constructed for occupancy analysis in program MARK. All species model set includes
detection from coyotes, American badger, raccoons, skunks, and red fox. See table 6 for
covariate descriptions. See tables 19-22 in appendix B for all models constructed in this analysis.
Model AICc ∆AICc w L K Deviance
Coyote
ψ(Year) p(P1 + P2) 991.43 0.00 0.14 1.00 5 981.05
ψ(Area + Year) p(P1 + P2) 991.96 0.53 0.11 0.77 6 979.42
ψ(Area + Year + PerWater) p(P1 + P2) 992.18 0.75 0.10 0.69 7 977.46
ψ(Year + PerWater) p(P1 + P2) 993.02 1.59 0.06 0.45 6 980.48
ψ(Year + PerGrass) p(P1 + P2) 993.15 1.72 0.06 0.42 6 980.61
ψ(Year) p(P1 + P2 + Year) 993.31 1.88 0.05 0.39 6 980.78
ψ(Year + Welldens) p(P1 + P2) 993.43 1.99 0.05 0.37 6 980.89
Badger
ψ(Area + PerGrass + PerWater) p(P1 + P2) 380.45 0.00 0.20 1.00 7 365.72
ψ(Area + PerGrass) p(P1 + P2) 381.14 0.69 0.14 0.71 6 368.60
ψ(Area + PerGrass + PerWater) p(.) 381.81 1.37 0.10 0.51 5 371.43
ψ(Area + PerGrass) p(.) 382.33 1.88 0.08 0.40 4 374.08
Raccoon
ψ(Year + PerGrass + PerWater) p(P1 + P2) 487.47 0.00 0.34 1.00 7 472.75
ψ(Area + Year + PerGrass + PerWater) p(P1 + P2) 488.81 1.34 0.17 0.51 8 471.88
ψ(Year + PerGrass + PerWater) p(P1 + P2 + Year) 489.45 1.99 0.13 0.37 8 472.52
All species
ψ(Area + Year + PerGrass) p(P1 + P2) 1636.95 0.00 0.19 1.00 7 1622.23
ψ(Area + Year + PerWater) p(P1 + P2) 1637.17 0.21 0.18 0.90 7 1622.44
ψ(Area + Year) p(P1 + P2) 1637.55 0.60 0.15 0.74 6 1625.01
ψ(Area + Year + PerGrass + PerWater) p(P1 + P2) 1638.21 1.26 0.11 0.53 8 1621.28

104
Table 9. Model averaged beta (β) estimates for all covariates included within the occupancy
parameter based on the top 95% of model constructed for each model set. Associated odds
ratios (OR) were also calculated for result interpretation. Bolded terms are statistically
significant. All species model set includes detection from coyotes, American badger, raccoons,
skunks, and red fox. See table 6 for covariate descriptions.
Model parameter β
Estimate
β
SE
β
LCI
β
UCI
Odds Ratio
(OR)
OR
LCI
OR
UCI
Coyote
Intercept -0.186 0.601 -1.364 0.992
Year 0.950 0.454 0.059 1.840 2.584 1.061 6.294
Study Area -0.660 0.475 -1.591 0.271 0.517 0.204 1.312
Percent Water -0.035 0.034 -0.102 0.032 0.965 0.903 1.033
Percent Grass 0.005 0.008 -0.011 0.021 1.005 0.989 1.021
Well Density -0.035 0.182 -0.391 0.321 0.966 0.676 1.379
Badger
Intercept 2.477 2.494 -2.410 7.365
Study Area -2.343 1.332 -4.954 0.267 0.096 0.007 1.307
Percent Grass -0.032 0.020 -0.072 0.007 0.968 0.931 1.007
Percent Water -0.127 0.110 -0.342 0.088 0.881 0.711 1.092
Year 0.815 1.193 -1.522 3.153 2.260 0.218 23.399
Well Density 0.148 0.317 -0.474 0.769 1.159 0.623 2.158
Raccoon
Intercept -0.750 1.150 -3.005 1.504
Year 1.274 0.680 -0.059 2.608 3.577 0.943 13.569
Percent Grass -0.038 0.015 -0.067 -0.009 0.962 0.935 0.991
Percent Water 0.138 0.089 -0.037 0.312 1.147 0.964 1.366
Study Area -0.771 0.636 -2.017 0.475 0.463 0.133 1.608
Well Density 0.073 0.278 -0.472 0.618 1.076 0.624 1.855
All Species
Intercept 0.897 1.056 -1.173 2.967
Study Area -1.506 0.579 -2.641 -0.371 0.222 0.071 0.690
Year 1.559 0.514 0.551 2.568 4.755 1.735 13.035
Percent Grass -0.014 0.010 -0.035 0.006 0.986 0.966 1.006
Percent Water 0.132 0.092 -0.049 0.313 1.141 0.952 1.367
Well Density 0.042 0.208 -0.365 0.449 1.043 0.694 1.566

105
Table 10. Estimates of occupancy and detection rates for detected meso-mammals in
western North Dakota. Estimates were calculated by model-averaging the top models
containing 95% of all model weight from each candidate set. Belden represented intense gas and
oil development, whereas Blaisdell represented minimal development.
Model Parameter Estimate SE 95%
LCI
95%
UCI
Coyote ψ - Belden 0.492 0.079 0.343 0.642
ψ - Blaisdell 0.563 0.085 0.396 0.716
p 0.078 0.010 0.061 0.099
American Badger ψ - Belden 0.174 0.088 0.059 0.411
ψ - Blaisdell 0.670 0.235 0.202 0.942
p 0.029 0.010 0.015 0.056
Raccoon ψ - Belden 0.143 0.053 0.067 0.279
ψ - Blaisdell 0.188 0.068 0.088 0.358
p 0.081 0.016 0.055 0.118
All Species ψ - Belden 0.582 0.095 0.393 0.750
ψ - Blaisdell 0.863 0.064 0.687 0.947
p 0.121 0.009 0.104 0.140

106
Table 11. Model averaged beta (β) estimates for all covariates included within the detection
parameter based on the top 95% of model constructed for each model set. Associated odds
ratios (OR) were also calculated for result interpretation. Bolded terms are statistically
significant. All species model set includes detections from coyotes, American badgers, raccoons,
skunks, and red fox. See table 6 for covariate descriptions.
Model Parameter β
Estimate
β
SE
β
LCI
β
UCI
Odds Ratio
(OR)
OR
LCI
OR
UCI
Coyote
Intercept -2.514 0.254 -3.012 -2.016
Period 1 (P1) 0.423 0.275 -0.116 0.963 1.527 0.890 2.619
Period 2 (P2) -0.402 0.332 -1.054 0.249 0.669 0.349 1.283
Year -0.161 0.308 -0.764 0.443 0.852 0.466 1.558
Badger
Intercept -3.083 0.463 -3.990 -2.176
Period 1 (P1) -0.420 0.439 -1.280 0.440 0.657 0.278 1.553
Period 2 (P2) -1.176 0.523 -2.200 -0.151 0.309 0.111 0.860
Year -0.117 0.472 -1.043 0.809 0.890 0.353 2.246
Raccoon
Intercept -2.946 0.422 -3.773 -2.119
Period 1 (P1) 1.619 0.423 0.791 2.447 5.048 2.205 11.558
Period 2 (P2) -0.539 0.541 -1.599 0.522 0.584 0.202 1.685
Year -0.278 0.389 -1.042 0.485 0.757 0.353 1.624
All Species
Intercept -1.918 0.175 -2.261 -1.574
Period 1 (P1) 0.303 0.178 -0.045 0.652 1.354 0.956 1.919
Period 2 (P2) -0.541 0.219 -0.970 -0.113 0.582 0.379 0.893
Year -0.080 0.204 -0.479 0.319 0.923 0.619 1.375

107
Figure 4. Two study areas established in Mountrail County of western North Dakota used
to conduct meso-mammalian surveys, 2012-2013. Belden, in the southwest, is our study area
of intense oil development. Blaisdell, in the northeast, is our area of minimal oil development.
Dashed line within Blaisdell represents its boundary in 2012.

108
Figure 5. Locations of camera scent stations at our Belden study area (intense gas and oil, A), and our Blaisdell study area
(minimal gas and oil, B) in western North Dakota, 2012 and 2013. A total of 84 locations were surveyed in Belden, of which 29
were sampled in both years. A total of 79 locations were surveyed in Blaisdell, of which 21 were sampled in both years.
A B
108

109
CONCLUSION
Global demands for energy resources have become a prevailing issue and will remain so
for generations to come (IEA 2012). Unfortunately, there is an inherent tradeoff between
meeting these growing demands and the environment. Although a variety of energy development
techniques and strategies exist, most are drastically altering the landscape to some degree
throughout many parts of the world. This has resulted in the widespread and controversial
conflict between energy development and wildlife (Copeland et al. 2009).
North Dakota is fortunate enough to possess numerous natural resources, including those
related to both wildlife and energy potentials. Historically, the former has been more
economically beneficial to the state. However, oil and gas development is now the largest source
of economic growth and available employment opportunities within North Dakota (USFWS
2006). Although it produces these benefits, energy development also brings substantial
environmental impacts affecting large expanses of land area (Copeland et al. 2009). Such
impacts are occurring at a rapid pace, which brings challenges in understanding and managing
the effects experienced by the habitat and wildlife found throughout the state (Dyke et al. 2010).
We sought to address gas and oil developments impacts on sharp-tailed grouse nesting
ecology in North Dakota. During 2012 and 2013 we monitored sharp-tailed grouse nests using
radio telemetry and nest camera systems in areas varying in gas and oil development intensities
to calculate possible difference in daily nest survival rates and nest predator frequencies. We also
monitored the meso-mammal population simultaneously to determine if gas and oil development
was possibly impacting these known predators of sharp-tailed grouse nests.

110
In summary, we found no evidence for a negative effect of gas and oil development on
the nest survival of sharp-tailed grouse during our 2 year study (Chapter 2). In fact, we found
areas outside of gas and oil development to have lower rates of nest success, indicating gas and
oil development impacts may be operating at very large spatial scales. We believe the ecological
mechanisms driving this finding are related to gas and oil developments impacts on the local
predator community, as nest predation is considered the leading cause of nest failure (Ricklefs
1969, Martin 1988;1995, Jones and Dieni 2007). This hypothesis was supported by our findings
of lower occupancy rates of the local meso-mammal predator community in areas of intense gas
and oil development compared to those outside of development (Chapter 3). Therefore, grouse
on adjacent areas to gas and oil may experience lower nest success due to a displacement of
meso-mammals. Although our findings are confounded by site characteristics due to lack of
spatial replication and we examined only a short temporal scale, our ecosystem level study has
illustrated potential impacts of energy development on the trophic interactions among sharp-
tailed grouse and their nest predators. The negative relationship between gas and oil development
and the meso-mammal community may possibly be benefiting some aspects of sharp-tailed
grouse ecology in unexpected ways. However, there are numerous other ecological aspects to
consider when assessing the broad impacts of energy development on the population dynamics
of sharp-tailed grouse. Further relationships need examination to determine effects on other
grouse demographic processes such as nest site selection, adult survival, juvenile survival and
recruitment, and lek attendance relative to disturbances caused by gas and oil development.
Many of these were being simultaneously studied as part of the larger North Dakota Game and
Fish project on sharp-tailed grouse and gas and oil development (A. Robinson, personal
communication). Additionally, impacts on habitat quality are of equal importance as habitat is

111
greatly entwined in species ecology. For example, the insect community, nest site characteristics,
and chick mobility of sharp-tailed grouse may all be influenced by habitat quality. This
additional information will provide an opportunity to explore population level changes and a
more complete understanding of sharp-tailed grouse demographic responses to gas and oil
development.
Although sharp-tailed grouse nesting success does not seem to be negatively impacted by
gas and oil development at this time, the meso-mammal community currently appears to be
influenced. These predators receive less attention, but meso-mammals play integral parts in the
prairie ecosystem throughout North Dakota. They are also major sources of income from
recreational activities such as hunting and trapping (Tucker 2014). It is unclear at this point to
what extent the meso-mammals community is negatively affected by energy development and
future work is needed to further clarify if this finding will remain as gas and oil development
continues to expand throughout the state. Depending on the severity of this impact, management
may want to take action to ensure meso-mammals are not drastically impacted.
In this study, we documented meso-mammals to be the primary predators of sharp-tailed
grouse nests in North Dakota (Chapter 2). American badgers and skunks attributed to more than
half of all recorded depredations, followed by raccoons, coyotes, red fox, and raptor species.
This information is particularly useful for possible future management decisions pertaining to the
manipulation of or shifts in the predator community and is likely relevant for most ground
nesting grassland species in North Dakota.
Gas and oil development will continue to be an ecological stressor for the wildlife and
habitat in North Dakota for years to come. The process of energy development is very dynamic
in nature, resulting in varying levels of disturbances throughout time. Although our findings here

112
demonstrate no impact on sharp-tailed grouse nest success and negative impacts on the meso-
mammals community, this may not always be the case. During the two years this study took
place, we worked in an area dominated by the active drilling and construction of oil wells. These
activities result in increased disturbances created from machinery, traffic, and human presence.
Eventually this area will be saturated with wells extracting oil and gas and will then be in a phase
where human presence is only required for regular maintenance and inspection. This will result
in a landscape left altered and fragmented to a certain degree, but experiencing much less
disturbance than the initial phrase of active drilling. At this point in time meso-mammals may
respond positively to such a landscape and occupancy rates may increase in areas of intense
development. If this is the case, future sharp-tailed grouse nest survival along with other ground
nesting birds may greatly reduce as nest predators utilize the fragmented landscape with
increased foraging efficiency due to increased edge densities and travel corridors (Andrén 1995,
Dijak and Thompson III 2000).
With lack of spatial replication it is uncertain whether our findings are consistent in other
developed areas. Areas adjacent to gas and oil development, however, may be experiencing
lower nest success if nest predators are being displaced as predicted here. Although this initially
appears to be beneficial for game managers, these results should be taken cautiously given the
limited temporal and spatial scales. Further, nest success is only one part of avian population
dynamics, and all aspects must be thoroughly evaluated across varying gradients of energy
development to determine population level effects.
Our findings presented here produce unique challenges for wildlife management and
demonstrate the complexity of gas and oil development impacts on wildlife. Understanding these
impacts ultimately requires studying community dynamics across large spatial and temporal

113
scales. Continuous research on all aspects of sharp-tailed grouse ecology, predator interactions,
and habitat changes in the ecosystem are needed in preparation for future management decisions
to mitigate potential negative impacts of energy development. Collaboration between wildlife
experts and gas and oil companies will also benefit this cause as the needs of both sides may be
addressed.

114
LITERATURE CITED
Andrén, H. 1995. Effects of landscape composition on predation rates at habitat edges. Pages
225-255 in L. Hansson, L. Farig, andG. Marriam, editors. Mosaic landscapes and
ecological processes. Springer Netherlands, London, United Kingdom.
Copeland, H. E., K. E. Doherty, D. E. Naugle, A. Pocewicz, and J. M. Kiesecker. 2009. Mapping
Oil and Gas Development Potential in the US Intermountain West and Estimating
Impacts to Species. PLoS ONE 4:1-7.
Dijak, W. D., and F. R. Thompson III. 2000. Landscape and edge effects on the distribution of
mammalian predators in Missouri. The Journal of Wildlife Management 64:209-216.
Dyke, S., D. Fryda, D. Kleyer, J. Williams, B. Hosek, W. Jensen, S. Johnson, A. Robinson, B.
Ryckman, B. Stillings, M. Szymanski, S. Tucker, and B. Wiedmann. 2010. Potential
impacts of oil and gas development on select North Dakota natural resources: a report to
the director. North Dakota Game and Fish Department, Bismarck, ND.
Internation Energy Agency (IEA). 2012. World energy outlook 2012.
<http://www.worldenergyoutlook.org> Accessed 2014 April 1.
Jones, S. L., and J. S. Dieni. 2007. The relationship between predation and nest concealment in
mixed-grass prairie passerines: an analysis using program MARK. Studies in Avian
Biology:117-123.
Martin, T. E. 1988. Processes organizing open-nesting bird assemblages: competition or nest
predation? Evolutionary Ecology 2:37-50.

115
_____. 1995. Avian life history evolution in relation to nest sites, nest predation, and food.
Ecological monographs 65:101-127.
Ricklefs, R. E. 1969. An analysis of nesting mortality in birds. Smithsonian Contributions to
Zoology 9:1-48.
Tucker, S. 2014. Study No. E-11: Furbearer Harvest Regulations Study. North Dakota Game and
Fish Department.
USFWS. U.S. Department of Interior, Fish and Wildlife Service, U.S., U.S. Department of
Commerce, U.S. Bureau of Census. 2006. 2006 National survey of fishing, hunting, and
wildlife-associated recreation.

116
APPENDICES

117
117
Table 12. Pearson correlation squared coefficients calculated among spatial covariates measured for
sharp-tailed grouse nests. Asterisks (*) indicate a value above the cut off value of 0.3. See table 1 for
covariate descriptions.
Dist
Well
Dist
Road
50
Grs
50
Ag
50
Wtr
50
Tr
200
Grs
200
Ag
200
Wtr
200
Tr
450
Grs
450
Ag
450
Wtr
450
Tr
Dist Well 1.00
Dist Road 0.00 1.00
50 Grs 0.01 0.00 1.00
50 Ag 0.01 0.00 0.95* 1.00
50 Wtr 0.00 0.00 0.05 0.01 1.00
50 Tr 0.02 0.00 0.02 0.00 0.00 1.00
200 Grs 0.00 0.00 0.73* 0.72* 0.03 0.00 1.00
200 Ag 0.01 0.00 0.72* 0.76* 0.02 0.01 0.95* 1.00
200 Wtr 0.19 0.01 0.01 0.01 0.03 0.01 0.00 0.01 1.00
200 Tr 0.03 0.01 0.01 0.00 0.00 0.52* 0.01 0.01 0.03 1.00
450 Grs 0.00 0.02 0.43* 0.42* 0.02 0.00 0.73* 0.70* 0.01 0.00 1.00
450 Ag 0.01 0.02 0.41* 0.42* 0.02 0.00 0.69* 0.73* 0.00 0.01 0.95* 1.00
450 Wtr 0.23 0.00 0.01 0.01 0.01 0.01 0.00 0.01 0.43* 0.03 0.00 0.03 1.00
450 Tr 0.08 0.00 0.01 0.00 0.00 0.31* 0.01 0.00 0.07 0.68* 0.00 0.00 0.08 1.00
Ap
pen
dix
A
Chap
ter 2

118
Table 13. Summary statistics of the continuous covariates calculated from sharp-tailed
grouse nest locations, used in the daily nest survival analysis. Belden study area represents
intense gas and oil development, and Blaisdell represents minimal gas and oil development. Belden Blaisdell
Min. Max. Mean
Std.
dev. Min. Max. Mean
Std.
dev.
Distance to nearest
well (m)
150.43 1571.22 720.43 334.30 529.99 9807.57 4676.66 2641.05
Distance to nearest
road (m)
4.44 1185.47 402.59 262.05 2.41 1649.57 446.42 339.65
Nest grass height (cm) 7.62 116.84 54.69 19.52 30.48 124.46 64.92 23.08
Nest residual height
(cm)
5.08 114.30 27.58 17.73 2.54 104.14 33.85 19.93
Average nest VOR
(cm)
23.75 106.25 57.83 18.15 27.50 142.50 68.56 26.11
Average grass height
within 25m of nest
(cm)
13.46 83.57 54.66 13.18 34.04 104.14 62.75 16.68
Average residual
height within 25m of
nest (cm)
6.10 49.02 23.80 8.02 6.35 76.45 29.59 15.03
Average VOR within
25m of nest (cm)
22.50 107.80 56.18 17.84 28.90 115.10 65.61 21.19
Percent Grass (50m
buffer)
0.00 100.00 82.61 30.89 0.00 100.00 88.56 27.85
Percent Agriculture
(50m buffer)
0.00 100.00 14.74 29.41 0.00 100.00 10.54 27.63
Percent water (50m
buffer)
0.00 40.00 0.51 4.50 0.00 22.22 0.90 3.46
Percent Tree
(50m buffer)
0.00 44.44 2.14 8.07 0.00 0.00 0.00 0.00
Percent Grass (200m
buffer)
0.00 100.00 75.76 28.91 3.24 100.00 80.43 22.98
Percent Agriculture
200m buffer)
0.00 100.00 21.04 28.86 0.00 94.15 14.30 22.88
Percent water (200m
buffer)
0.00 3.89 0.57 0.90 0.00 19.99 5.26 4.35
Percent Tree
(200m buffer)
0.00 36.42 2.63 7.27 0.00 0.00 0.00 0.00
Percent Grass (450m
buffer)
0.00 99.87 66.68 22.95 25.99 97.81 71.11 19.02
Percent Agriculture
(450m buffer)
0.00 98.47 29.00 23.45 0.00 69.49 20.79 18.73
Percent water (450m
buffer)
0.00 6.25 1.59 1.65 0.12 19.99 8.07 4.42
Percent Tree
(450m buffer)
0.00 22.07 2.71 4.72 0.00 1.14 0.02 0.13
Edge Density within
450m if nest (m/km2)
112.83 10477.11 5298.90 2325.22 1377.87 11833.13 6727.86 2205.98

119
Table 14. Pearson correlation squared coefficients calculated among habitat covariates
measured at sharp-tailed grouse nests. Asterisks (*) indicate a value above the cut off value of
0.3. See table 1 for covariate descriptions.
Nest
VOR
25m
VOR
Nest
Grass
Nest
Resid
25m
Grass
25m
Resid
Nest VOR 1.00
25m VOR 0.87* 1.00
Nest Grass 0.76* 0.64* 1.00
Nest Resid 0.14 0.08 0.14 1.00
25m Grass 0.70* 0.82* 0.70* 0.08 1.00
25m Resid 0.02 0.02 0.01 0.62* 0.10 1.00
Table 15. Daily nest survival models constructed using only sharp-tailed grouse nests that
had available habitat data. A total of 102 nests were included in this analysis. See table 1 for
covariate descriptions.
Model AICc ∆AICc w L K Deviance
S(Area + Cam) 278.98 0.00 0.16 1.00 3 272.96
S(Area + Cam + nestVOR) 279.95 0.98 0.10 0.61 4 271.93
S(Area + Cam + NestResid) 280.08 1.10 0.09 0.58 4 272.05
S(Area + Cam + 50Grs) 280.52 1.54 0.07 0.46 4 272.50
S(Area + Cam + 450Grs) 280.71 1.73 0.07 0.42 4 272.68
S(Area) 280.73 1.75 0.07 0.42 2 276.72
S(Area + Cam + 200Grs) 280.76 1.78 0.06 0.41 4 272.73
S(Area + Cam + nestVOR + NestResid) 280.90 1.92 0.06 0.38 5 270.86
S(Area + Year + Cam) 280.90 1.92 0.06 0.38 4 272.88
S(Area + nestVOR) 281.36 2.38 0.05 0.30 3 275.34
S(Area + NestResid) 281.61 2.63 0.04 0.27 3 275.59
S(Area + Year + Cam + NestResid) 281.90 2.92 0.04 0.23 5 271.86
S(Area + Year + Cam + nestVOR) 281.95 2.97 0.04 0.23 5 271.91
S(Area + nestVOR + NestResid) 282.09 3.11 0.03 0.21 4 274.06
S(Area + Year) 282.66 3.68 0.02 0.16 3 276.64
S(Area + Year + Cam + nestVOR + NestResid) 282.84 3.86 0.02 0.15 6 270.78
S(Cam) 284.13 5.15 0.01 0.08 2 280.12
S(.) 286.13 7.15 0.00 0.03 1 284.13
S(NestResid) 287.64 8.66 0.00 0.01 2 283.63
S(nestVOR) 287.93 8.95 0.00 0.01 2 283.92
S(nestVOR + NestResid) 289.46 10.49 0.00 0.01 3 283.45

120
Table 16. Daily nest survival models constructed using all 163 sharp-tailed grouse nests
monitored in western North Dakota. A total of 59 models were constructed. See table 1 for
covariate descriptions.
Model AICc ∆AICc w L K Deviance
S(Area + Cam) 520.29 0.00 0.16 1.00 3 514.28
S(Area + Cam + 50Grs) 520.77 0.48 0.13 0.79 4 512.75
S(Area + Cam + 200Grs) 521.67 1.38 0.08 0.50 4 513.65
S(Area + Cam + 50Wtr) 521.80 1.51 0.08 0.47 4 513.78
S(Area + Cam + 450Grs) 521.89 1.60 0.07 0.45 4 513.88
S(Area + Cam + Year) 521.99 1.70 0.07 0.43 4 513.98
S(Area + Cam + DistRoad) 522.06 1.77 0.07 0.41 4 514.04
S(Area + Cam + 200Wtr) 522.17 1.88 0.06 0.39 4 514.15
S(Area + Cam + 450Wtr) 522.24 1.95 0.06 0.38 4 514.23
S(Area + Cam + Year + 50Grs) 522.52 2.23 0.05 0.33 5 512.49
S(Area + Cam + Year + DistRoad) 523.80 3.51 0.03 0.17 5 513.77
S(Area + Cam + DistWell1 + DistWell2) 524.01 3.72 0.03 0.16 5 513.98
S(Cam + DistWell1 + DistWell2) 525.69 5.41 0.01 0.07 4 517.68
S(Area + Cam + Year + DistWell1 + DistWell2) 525.74 5.45 0.01 0.07 6 513.70
S(Area + Cam + DistWell1 + DistWell2 + DistRoad) 525.85 5.56 0.01 0.06 6 513.81
S(Cam) 525.86 5.57 0.01 0.06 2 521.85
S(Cam + 50Grs) 526.92 6.63 0.01 0.04 3 520.91
S(Area + 50Grs) 527.32 7.03 0.00 0.03 3 521.31
S(Area) 527.37 7.08 0.00 0.03 2 523.37
S(Cam + Year + DistWell1 + DistWell2) 527.38 7.09 0.00 0.03 5 517.35
S(Cam + DistWell1 + DistWell2 + DistRoad) 527.46 7.17 0.00 0.03 5 517.43
S(Area + Cam + Year + DistWell1 + DistWell2 +
DistRoad) 527.61 7.32 0.00 0.03 7 513.56
S(Cam + DistRoad) 527.71 7.42 0.00 0.02 3 521.70
S(Cam + Year) Road 527.77 7.48 0.00 0.02 3 521.76
S(Area + 200Grs) 528.55 8.26 0.00 0.02 3 522.54
S(Area + Year) 528.70 8.41 0.00 0.01 3 522.68
S(Area + 450Grs) 528.78 8.49 0.00 0.01 3 522.77
S(Area + 50Wtr) 528.84 8.55 0.00 0.01 3 522.83
S(Area + 50Grs + 50Wtr) 528.99 8.70 0.00 0.01 4 520.97
S(Area + 450Wtr) 529.12 8.83 0.00 0.01 3 523.11
S(Cam + Year + DistWell1 + DistWell2 + DistRoad) 529.17 8.88 0.00 0.01 6 517.13
S(Area + DistRoad) 529.26 8.97 0.00 0.01 3 523.24
S(Area + 200Wtr) 529.35 9.06 0.00 0.01 3 523.34
S(Cam + Year + DistRoad) 529.63 9.34 0.00 0.01 4 521.61
S(Area + Cam + Year + DistWell1 + DistWell2 +
DistRoad + 50Grs + 50Wtr) 529.71 9.42 0.00 0.01 9 511.62
S(Area + 450Grs + 450Wtr) 530.42 10.13 0.00 0.01 4 522.40
S(Area + 200Grs + 200Wtr) 530.49 10.20 0.00 0.01 4 522.47
S(Area + Year + DistRoad) 530.54 10.25 0.00 0.01 4 522.52

121
Table 16. cont.
Model AICc ∆AICc w L K Deviance
S(Area + Cam + Year + DistWell1 + DistWell2 +
DistRoad + 200Grs + 200Wtr) 530.99 10.70 0.00 0.00 9 512.90
S(Area + DistWell1 + DistWell2) 531.05 10.76 0.00 0.00 4 523.03
S(Area + Cam + Year + DistWell1 + DistWell2 +
DistRoad + 450Grs + 450Wtr) 531.19 10.90 0.00 0.00 9 513.11
S(Area + Year + DistWell1 + DistWell2) 532.46 12.17 0.00 0.00 5 522.43
S(450Wtr) 532.49 12.20 0.00 0.00 2 528.49
S(200Wtr) 532.67 12.38 0.00 0.00 2 528.67
S(Area + DistWell1 + DistWell2 + DistRoad) 532.90 12.61 0.00 0.00 5 522.87
S(.) 533.17 12.88 0.00 0.00 1 531.17
S(DistWell1 + DistWell2) 533.33 13.04 0.00 0.00 3 527.32
S(50Grs) 533.83 13.54 0.00 0.00 2 529.82
S(50Wtr) 534.03 13.74 0.00 0.00 2 530.03
S(Area + Year + DistWell1 + DistWell2 + DistRoad) 534.26 13.97 0.00 0.00 6 522.23
S(Year + DistWell1 + DistWell2) 534.55 14.26 0.00 0.00 4 526.54
S(200Grs) 534.79 14.51 0.00 0.00 2 530.79
S(Year) 534.80 14.51 0.00 0.00 2 530.80
S(DistRoad) 534.97 14.68 0.00 0.00 2 530.96
S(450Grs) 535.08 14.79 0.00 0.00 2 531.07
S(DistWell1 + DistWell2 + DistRoad) 535.21 14.92 0.00 0.00 4 527.19
S(Year + DistWell1 + DistWell2 + DistRoad) 536.40 16.11 0.00 0.00 5 526.37
S(Year + DistRoad) 536.58 16.29 0.00 0.00 3 530.57
S(Area + Cam + Year + DistWell1 + DistWell2 +
DistRoad + 50Grs + 50Wtr + 200Grs + 200Wtr + 450Grs
+ 450Wtr)
536.91 16.62 0.00 0.00 13 510.75

122
Figure 6. Moran’s I correlograms produced in program SAM using sharp-tailed grouse
nest success by study area. No evidence of spatial autocorrelation was present for Belden (A) or
Blaisdell (B).
A
B

123
123
Table 17. Pearson correlation squared coefficients among continuous covariates used in meso-mammal
occupancy analysis. Asterisks (*) indicate a value above the cut off value of 0.3.
Distance to
nearest well
(m)
Distance to
nearest road
(m)
Well density
(500m buffer)
Percent water
(500m buffer)
Percent Grass
(500m buffer)
Percent
Agriculture
(500m buffer)
Percent Trees
(500m buffer)
Distance to
nearest well (m) 1
Distance to
nearest road (m) 0.021 1
Well density
(500m buffer) 0.119 0.006 1
Percent water
(500m buffer) 0.215 0.004 0.023 1
Percent Grass
(500m buffer) 0.000 0.149 0.008 0.057 1
Percent
Agriculture
(500m buffer)
0.004 0.151 0.012 0.001 0.912* 1
Percent Trees
(500m buffer) 0.066 0.013 0.005 0.106 0.023 0.088 1
Ap
pen
dix
B
Chap
ter 3

124
Table 18. Summary statistics of the continuous covariates calculated from camera-scent
station sites, used in the meso-mammal occupancy analysis. Belden study area represents
intense gas and oil development, and Blaisdell represents minimal gas and oil development. Belden Blaisdell
Min. Max. Mean Std. dev. Min. Max. Mean Std. dev.
Distance to nearest
well (m) 161.5 1893.6 784.1 463.6 933.3 11033.7 4159.6 2299.6
Distance to nearest
road (m) 6.9 1262.7 404.3 334.8 6.7 1589.3 523.9 428.9
Well density within
500m (wells/km2)
0 6.7 0.9 1.6 0 0 0 0
Percent water (500m
buffer) 0 22.9 3.8 4.5 0.1 42.9 10.3 7.9
Percent Grass (500m
buffer) 5.8 99.6 61 24.4 0 97.7 55.8 26.3
Percent Agriculture
(500m buffer) 0 89.7 30.9 25.7 0 90.5 33.9 26
Percent Tree
(500m buffer) 0 35.2 4.3 8.1 0 0.9 0.05 0.2

125
Table 19. All occupancy models constructed for the species coyote (Canis latrans). A total of
31 models were constructed in this analysis, of which 23 contained 95% of the total weight
(shown by a gray line). See table 6 for covariate descriptions.
Model AICc ∆AICc w L K Deviance
ψ(Year) p(P1 + P2) 991.43 0.00 0.13 1.00 5 981.05
ψ(Area + Year) p(P1 + P2) 991.96 0.53 0.10 0.77 6 979.42
ψ(Area + Year + PerWater) p(P1 + P2) 992.18 0.75 0.09 0.69 7 977.46
ψ(Year + PerWater) p(P1 + P2) 993.02 1.59 0.06 0.45 6 980.48
ψ(Year + PerGrass) p(P1 + P2) 993.15 1.72 0.06 0.42 6 980.61
ψ(Year) p(P1 + P2 + Year) 993.31 1.88 0.05 0.39 6 980.78
ψ(Year + Welldens) p(P1 + P2) 993.43 1.99 0.05 0.37 6 980.89
ψ(Area + Year + PerGrass) p(P1 + P2) 993.59 2.15 0.05 0.34 7 978.86
ψ(.) p(P1 + P2) 993.66 2.23 0.04 0.33 4 985.41
ψ(Area + PerWater) p(P1 + P2) 994.13 2.70 0.03 0.26 6 981.60
ψ(Area + Year + Welldens) p(P1 + P2) 994.14 2.71 0.03 0.26 7 979.42
ψ(Area) p(P1 + P2) 994.16 2.72 0.03 0.26 5 983.78
ψ(Area + Year + PerGrass + PerWater) p(P1 + P2) 994.30 2.87 0.03 0.24 8 977.37
ψ(Year + Welldens + PerWater) p(P1 + P2) 994.93 3.50 0.02 0.17 7 980.21
ψ(Year + PerWater) p(P1 + P2 + Year) 995.00 3.56 0.02 0.17 7 980.27
ψ(Year + PerWater + PerGrass) p(P1 + P2) 995.01 3.57 0.02 0.17 7 980.28
ψ(PerWater) p(P1 + P2) 995.13 3.69 0.02 0.16 5 984.74
ψ(Year + Welldens) p(P1 + P2 + Year) 995.32 3.89 0.02 0.14 7 980.60
ψ(PerGrass) p(P1 + P2) 995.41 3.98 0.02 0.14 5 985.03
ψ(Welldens) p(P1 + P2) 995.77 4.34 0.02 0.11 5 985.39
ψ(Area + PerGrass) p(P1 + P2) 995.80 4.36 0.02 0.11 6 983.26
ψ(Area + Year + Welldens) p(P1 + P2+ Year) 996.08 4.65 0.01 0.10 8 979.15
ψ(Area + PerWater + Welldens) p(P1 + P2) 996.18 4.74 0.01 0.09 7 981.45
ψ(Year) p(.) 996.45 5.01 0.01 0.08 3 990.30
ψ(PerWater + PerGrass) p(P1 + P2) 997.13 5.70 0.01 0.06 6 984.60
ψ(PerWater + Welldens) p(P1 + P2) 997.21 5.78 0.01 0.06 6 984.68
ψ(.) p(.) 997.64 6.20 0.01 0.05 2 993.56
ψ(Area + Year + Welldens + PerGrass) p(P1 + P2 + Year) 997.80 6.37 0.01 0.04 9 978.62
ψ(Area) p(.) 998.07 6.64 0.00 0.04 3 991.92
ψ(Area + Year + Welldens + PerGrass + PerWater) p(P1 +
P2 + Year) 998.67 7.23 0.00 0.03 10 977.22
ψ(.) p(t) 1023.50 32.07 0.00 0.00 23 969.56

126
Table 20. All occupancy models constructed for the species American badger (Taxidea
taxus). A total of 31 models were constructed in this analysis, of which 19 contained 95% of the
total weight (shown by a gray line). See table 6 for covariate descriptions.
Model AICc ∆AICc w L K Deviance
ψ(Area + PerGrass + PerWater) p(P1 + P2) 380.45 0.00 0.19 1.00 7 365.72
ψ(Area + PerGrass) p(P1 + P2) 381.14 0.69 0.14 0.71 6 368.60
ψ(Area + PerGrass + PerWater) p(.) 381.81 1.37 0.10 0.51 5 371.43
ψ(Area + PerGrass) p(.) 382.33 1.88 0.07 0.39 4 374.08
ψ(Area + PerGrass + Year) p(P1 + P2) 382.98 2.53 0.05 0.28 7 368.26
ψ(Area) p(P1 + P2) 383.08 2.63 0.05 0.27 5 372.70
ψ(Area + Welldens + PerGrass) p(P1 + P2) 383.08 2.64 0.05 0.27 7 368.36
ψ(Area + PerGrass) p(P1 + P2 + Year) 383.21 2.76 0.05 0.25 7 368.49
ψ(Area) p(.) 383.65 3.20 0.04 0.20 3 377.49
ψ(Area + PerGrass) p(Year) 384.46 4.01 0.03 0.13 5 374.08
ψ(Area + PerGrass + PerWater + Welldens) p(P1 + P2 +
Year) 384.51 4.07 0.03 0.13 9 365.34
ψ(Area + PerWater) p(P1 + P2) 384.53 4.08 0.02 0.13 6 371.99
ψ(Area + Year) p(P1 + P2) 384.73 4.29 0.02 0.12 6 372.19
ψ(Area + Welldens) p(P1 + P2) 384.87 4.43 0.02 0.11 6 372.33
ψ(Area + PerWater) p(.) 384.93 4.48 0.02 0.11 4 376.68
ψ(Area + Year) p(.) 385.00 4.55 0.02 0.10 4 376.75
ψ(Area) p(P1 + P2 + Year) 385.15 4.71 0.02 0.10 6 372.61
ψ(Area + PerGrass + Welldens) p(P1 + P2 + Year) 385.16 4.72 0.02 0.09 8 368.23
ψ(Area + PerWater + Year) p(P1 + P2) 385.59 5.14 0.01 0.08 7 370.87
ψ(Area + Welldens + PerWater) p(P1 + P2) 386.32 5.87 0.01 0.05 7 371.60
ψ(Area + PerWater) p(P1 + P2 + Year) 386.67 6.22 0.01 0.04 7 371.94
ψ(PerGrass) p(P1 + P2) 386.78 6.33 0.01 0.04 5 376.40
ψ(PerWater) p(P1 + P2) 386.91 6.46 0.01 0.04 5 376.52
ψ(PerWater + Year) p(P1 + P2) 387.20 6.75 0.01 0.03 6 374.66
ψ(PerGrass + PerWater) p(P1 + P2) 388.89 8.45 0.00 0.01 6 376.36
ψ(PerGrass + Year) p(P1 + P2) 388.94 8.49 0.00 0.01 6 376.40
ψ(.) p(.) 390.03 9.58 0.00 0.01 2 385.95
ψ(PerWater + PerGrass + Year) p(P1 + P2) 391.08 10.63 0.00 0.00 7 376.35
ψ(Year) p(P1 + P2) 391.30 10.85 0.00 0.00 5 380.92
ψ(Year) p(.) 391.76 11.32 0.00 0.00 3 385.61
ψ(.) p(t) 393.91 13.46 0.00 0.00 18 353.16

127
Table 21. All occupancy models constructed for the species raccoon (Procyon lotor). A total
of 33 models were constructed in this analysis, of which 10 contained 95% of the total weight
(shown by a gray line). See table 6 for covariate descriptions.
Model AICc ∆AICc w L K Deviance
ψ(Year + PerGrass + PerWater) p(P1 + P2) 487.47 0.00 0.32 1.00 7 472.75
ψ(Area + Year + PerGrass + PerWater) p(P1 + P2) 488.81 1.34 0.16 0.51 8 471.88
ψ(Year + PerGrass + PerWater) p(P1 + P2 + Year) 489.45 1.99 0.12 0.37 8 472.52
ψ(PerGrass + PerWater) p(P1 + P2) 489.61 2.14 0.11 0.34 6 477.07
ψ(Area + PerGrass + PerWater) p(P1 + P2) 490.32 2.86 0.08 0.24 7 475.60
ψ(Area + Year +PerGrass + PerWater) p(P1 + P2 + Year) 490.57 3.10 0.07 0.21 9 471.40
ψ(Area + Year + PerGrass) p(P1 + P2) 491.78 4.31 0.04 0.12 7 477.06
ψ(Area + Year + Welldens + PerGrass + PerWater) p(P1 +
P2 + Year) 492.77 5.31 0.02 0.07 10 471.33
ψ(Area + Year + PerGrass) p(P1 + P2 + Year) 493.47 6.00 0.02 0.05 8 476.53
ψ(Area + PerGrass) p(P1 + P2) 493.72 6.25 0.01 0.04 6 481.18
ψ(Area + Year + Welldens + PerGrass) p(P1 + P2) 493.97 6.50 0.01 0.04 8 477.03
ψ(Area + Welldens + PerGrass + PerWater) p(P1 + P2 +
Year) 494.45 6.98 0.01 0.03 9 475.27
ψ(Area + Year + Welldens + PerGrass) p(P1 + P2 + Year) 495.69 8.22 0.01 0.02 9 476.51
ψ(Area + PerGrass) p(P1 + P2 + Year) 495.79 8.33 0.01 0.02 7 481.07
ψ(Area + Year +PerWater) p(P1 + P2) 496.06 8.60 0.00 0.01 7 481.34
ψ(PerGrass) p(P1 + P2) 497.13 9.67 0.00 0.01 5 486.75
ψ(PerWater) p(P1 + P2) 497.59 10.13 0.00 0.01 5 487.21
ψ(Area + PerWater) p(P1 + P2) 497.82 10.35 0.00 0.01 6 485.28
ψ(Area + Welldens + PerGrass) p(P1 + P2 + Year) 497.83 10.37 0.00 0.01 8 480.90
ψ(Area + Year + Welldens + PerWater) p(P1 + P2) 498.01 10.54 0.00 0.01 8 481.07
ψ(Area + Year + Welldens + PerWater) p(P1 + P2 + Year) 499.90 12.43 0.00 0.00 9 480.72
ψ(Area + Welldens + PerWater) p(P1 + P2 + Year) 501.61 14.14 0.00 0.00 8 484.67
ψ(Area + Year) p(P1 + P2) 501.78 14.31 0.00 0.00 6 489.24
ψ(Area + Year + Welldens) p(P1 + P2) 503.76 16.30 0.00 0.00 7 489.04
ψ(Area) p(P1 + P2) 503.90 16.43 0.00 0.00 5 493.52
ψ(Area + Welldens) p(P1 + P2) 505.58 18.11 0.00 0.00 6 493.04
ψ(Area) p(P1 + P2 + Year) 506.02 18.55 0.00 0.00 6 493.48
ψ(Year) p(P1 + P2) 507.42 19.95 0.00 0.00 5 497.04
ψ(Year + PerGrass + PerWater) p(.) 516.34 28.87 0.00 0.00 5 505.96
ψ(Area + Year + PerGrass) p(.) 527.15 39.68 0.00 0.00 5 516.77
ψ(Area) p(.) 534.70 47.23 0.00 0.00 3 528.55
ψ(.) p(.) 541.32 53.86 0.00 0.00 2 537.25
ψ(.) p(t) 574.68 87.22 0.00 0.00 23 520.74

128
Table 22. Occupancy models constructed for all meso-mammal species detected, including
coyotes (Canis latrans), striped skunks (Mephitis mephitis), American badgers (Taxidea
taxus), raccoons (Procyon lotor), and red fox (Vulpes vulpes). A total of 30 models were
constructed in this analysis, of which 11 contained 95% of the total weight (shown by a gray
line). See table 6 for covariate descriptions.
Model AICc ∆AICc w L K Deviance
ψ(Area + Year + PerGrass) p(P1 + P2) 1636.95 0.00 0.19 1.00 7 1622.23
ψ(Area + Year + PerWater) p(P1 + P2) 1637.17 0.21 0.17 0.90 7 1622.44
ψ(Area + Year) p(P1 + P2) 1637.55 0.60 0.14 0.74 6 1625.01
ψ(Area + Year + PerGrass + PerWater) p(P1 + P2) 1638.21 1.26 0.10 0.53 8 1621.28
ψ(Area + Year + PerGrass) p(P1 + P2 + Year) 1638.95 2.00 0.07 0.37 8 1622.02
ψ(Area + Year + Welldens + PerGrass) p(P1 + P2) 1639.10 2.14 0.06 0.34 8 1622.16
ψ(Area + Year + PerWater) p(P1 + P2 + Year) 1639.30 2.34 0.06 0.31 8 1622.36
ψ(Area + Year + Welldens + PerWater) p(P1 + P2) 1639.37 2.41 0.06 0.30 8 1622.43
ψ(Area + Year) p(P1 + P2 + Year) 1639.60 2.64 0.05 0.27 7 1624.87
ψ(Area + Year + PerGrass + PerWater) p(P1 + P2 + Year) 1640.27 3.31 0.04 0.19 9 1621.09
ψ(Area + Year + Welldens + PerGrass) p(P1 + P2 + Year) 1641.13 4.18 0.02 0.12 9 1621.95
ψ(Area + Year + Welldens + PerWater) p(P1 + P2 + Year) 1641.53 4.57 0.02 0.10 9 1622.35
ψ(Area + Year + Welldens + PerGrass + PerWater) p(P1 +
P2 + Year) 1642.51 5.56 0.01 0.06 10 1621.06
ψ(Area + PerGrass) p(P1 + P2) 1644.90 7.94 0.00 0.02 6 1632.36
ψ(Area) p(P1 + P2) 1645.38 8.43 0.00 0.01 5 1635.00
ψ(Area + PerWater) p(P1 + P2) 1646.16 9.21 0.00 0.01 6 1633.63
ψ(Area + Welldens + PerGrass) p(P1 + P2) 1646.67 9.71 0.00 0.01 7 1631.95
ψ(Area) p(P1 + P2 + Year) 1646.76 9.80 0.00 0.01 6 1634.22
ψ(PerWater) p(P1 + P2) 1649.20 12.24 0.00 0.00 5 1638.81
ψ(Area + PerWater + PerGrass) p(P1 + P2) 1650.83 13.88 0.00 0.00 6 1638.29
ψ(Area + Year + PerGrass) p(.) 1653.14 16.19 0.00 0.00 5 1642.76
ψ(Area + Year) p(Year) 1654.75 17.80 0.00 0.00 5 1644.37
ψ(Area + Year + Welldens + PerWater) p(.) 1654.85 17.89 0.00 0.00 6 1642.31
ψ(Area + Year + Welldens + PerGrass) p(.) 1655.30 18.34 0.00 0.00 6 1642.76
ψ(Area + PerGrass) p(.) 1659.79 22.84 0.00 0.00 4 1651.54
ψ(Area) p(.) 1660.12 23.16 0.00 0.00 3 1653.96
ψ(Area) p(Year) 1662.08 25.13 0.00 0.00 4 1653.83
ψ(.) p(.) 1669.81 32.85 0.00 0.00 2 1665.73
ψ(Area) p(t) 1671.84 34.89 0.00 0.00 24 1615.15
ψ(.) p(t) 1680.93 43.98 0.00 0.00 23 1626.99

129
Figure 7. Moran’s I correlograms produced in program SAM using detections of all
targeted meso-mammal species by study area and by year. No evidence of spatial
autocorrelation was present for Blaisdell during 2012 (A) and 2013 (B), or Belden during 2012
(C) and 2013 (D). A total of eight distance classes were used in 2012 and ten in 2013.
A
B
D
C

130
Figure 8. Moran’s I correlograms produced in program SAM using coyote detections by
study area and by year. No evidence of spatial autocorrelation was present for Blaisdell during
2012 (A) and 2013 (B), or Belden during 2012 (C) and 2013 (D). A total of eight distance classes
were used in 2012 and ten in 2013.
A
B
C
D

131
Figure 9. Moran’s I correlograms produced in program SAM using raccoon detections by
study area and by year. No evidence of spatial autocorrelation was present for Blaisdell during
2012 (A) and 2013 (B), or Belden during 2012 (C) and 2013 (D). A total of eight distance classes
were used in 2012 and ten in 2013.
A
B
C
D

132
Figure 10. Moran’s I correlograms produced in program SAM using American badger
detections by study area and by year. No evidence of spatial autocorrelation was present for
Blaisdell during 2012 (A) and 2013 (B), or Belden during 2013 (C). No detections of American
badgers were recorded in Belden during 2012. A total of eight distance classes were used in 2012
and ten in 2013.
A
B
C
Related Documents