Impacts of experimentally imposed drought on leaf respiration and morphology in an Amazon rain forest Daniel B. Metcalfe* ,1 , Raquel Lobo-do-Vale 2 , Manuela M. Chaves 2 , Joao P. Maroco 3,4 , Luiz E. O.C Araga˜o 1 , Yadvinder Malhi 1 , Antonio L. Da Costa 5 , Alan P. Braga 5 , Paulo L. Gonc ¸ alves 5 , Joao De Athaydes 5 , Mauricio Da Costa 5 , Samuel S. Almeida 6 , Catherine Campbell 7 , Vaughan Hurry 7 , Mathew Williams 8 and Patrick Meir 8 1 Environmental Change Institute, University of Oxford, Oxford OX1 3QY, UK; 2 Instituto Superior de Agronomia, Universidade Tecnica de Lisboa, Lisbon 1349 017, Portugal; 3 Instituto Superior de Psicologia Aplicada, Lisbon 1149 041, Portugal; 4 Instituto de Tecnologia Quimica e Biologica, Oeiras 2780 157, Portugal; 5 Centro de Geocieˆncias, Universidade Federal do Para´, Bele´m CP 66075 110, Brazil; 6 Coordenac ¸ao de Botaˆnica, Museu Paraense Emilio Goeldi, Bele´m CP 66077 830, Brazil; 7 Department of Plant Physiology, Umea˚Plant Science Centre,Umea˚University, Umea˚SE 901 87, Sweden; and 8 School of Geosciences, University of Edinburgh, Edinburgh EH8 9XP, UK Summary 1. The Amazon region may experience increasing moisture limitation over this century. Leaf dark respiration (R) is a key component of the Amazon rain forest carbon (C) cycle, but rela- tively little is known about its sensitivity to drought. 2. Here, we present measurements of R standardized to 25 ŶC and leaf morphology from differ- ent canopy heights over 5 years at a rain forest subject to a large-scale through-fall reduction (TFR) experiment, and nearby, unmodified Control forest, at the Caxiuana˜ reserve in the eastern Amazon. 3. In all five post-treatment measurement campaigns, mean R at 25 ŶC was elevated in the TFR forest compared to the Control forest experiencing normal rainfall. After 5 years of the TFR treatment, R per unit leaf area and mass had increased by 65% and 42%, respectively, relative to pre-treatment means. In contrast, leaf area index (L) in the TFR forest was consistently lower than the Control, falling by 23% compared to the pre-treatment mean, largely because of a decline in specific leaf area (S). 4. The consistent and significant effects of the TFR treatment on R, L and S suggest that severe drought events in the Amazon, of the kind that may occur more frequently in future, could cause a substantial increase in canopy carbon dioxide emissions from this ecosystem to the atmo- sphere. Key-words: tropical forest, climate change, moisture deficit, leaf dark respiration, night-time foliar carbon emissions, specific leaf area, leaf area index, through-fall exclusion experiment Introduction Leaf dark respiration (R) of carbon dioxide (CO 2 ) is a key component of the Amazon rain forest ecosystem carbon (C) cycle but remains poorly understood and rarely measured, compared to other ecosystem fluxes such as photosynthesis and soil CO 2 efflux (Malhi, Baldocchi & Jarvis 1999; Cham- bers et al. 2004b; Meir et al. 2008). This lack of knowledge impedes attempts to predict the impacts of current and future environmental change upon C cycling in the Amazon rain forest. In the case of the Amazon, of particular interest is the effect of water availability upon R because the region may experience increasingly frequent and severe drought events associated with global climate change, fire and deforestation over the next 100 years (Werth & Avissar 2002; Christensen et al. 2007; Cox et al. 2008; Harris, Huntingford & Cox 2008; Malhi et al. 2008). Previous periods of drought dur- ing El Nin˜ o events have appeared to cause a shift in regio- nal scale C exchange across the entire Amazon forest from a net C sink to a source of up to 15 · 10 9 t C year )1 *Correspondence author. E-mail: [email protected] ȑ 2010 The Authors. Journal compilation ȑ 2010 British Ecological Society Functional Ecology 2010, 24, 524–533 doi: 10.1111/j.1365-2435.2009.01683.x

Welcome message from author
This document is posted to help you gain knowledge. Please leave a comment to let me know what you think about it! Share it to your friends and learn new things together.
Transcript
Impacts of experimentally imposed drought on leaf
respiration and morphology in an Amazon rain forest
Daniel B. Metcalfe*,1, Raquel Lobo-do-Vale2, Manuela M. Chaves2, Joao P. Maroco3,4,
Luiz E. O. C Aragao1, Yadvinder Malhi1, Antonio L. Da Costa5, Alan P. Braga5,
Paulo L. Goncalves5, Joao De Athaydes5, Mauricio Da Costa5, Samuel S. Almeida6,
Catherine Campbell7, Vaughan Hurry7, Mathew Williams8 and Patrick Meir8
1Environmental Change Institute, University of Oxford, Oxford OX1 3QY, UK; 2Instituto Superior de Agronomia,
Universidade Tecnica de Lisboa, Lisbon 1349 017, Portugal; 3Instituto Superior de Psicologia Aplicada, Lisbon 1149 041,
Portugal; 4Instituto de Tecnologia Quimica e Biologica, Oeiras 2780 157, Portugal; 5Centro de Geociencias, Universidade
Federal do Para, Belem CP 66075 110, Brazil; 6Coordenacao de Botanica, Museu Paraense Emilio Goeldi, Belem CP
66077 830, Brazil; 7Department of Plant Physiology, Umea Plant Science Centre, Umea University, Umea SE 901 87,
Sweden; and 8School of Geosciences, University of Edinburgh, Edinburgh EH8 9XP, UK
Summary
1. The Amazon region may experience increasing moisture limitation over this century. Leaf
dark respiration (R) is a key component of the Amazon rain forest carbon (C) cycle, but rela-
tively little is known about its sensitivity to drought.
2. Here, we present measurements of R standardized to 25 �C and leaf morphology from differ-
ent canopy heights over 5 years at a rain forest subject to a large-scale through-fall reduction
(TFR) experiment, and nearby, unmodified Control forest, at the Caxiuana reserve in the eastern
Amazon.
3. In all five post-treatment measurement campaigns, mean R at 25 �C was elevated in the TFR
forest compared to the Control forest experiencing normal rainfall. After 5 years of the TFR
treatment, R per unit leaf area and mass had increased by 65% and 42%, respectively, relative to
pre-treatment means. In contrast, leaf area index (L) in the TFR forest was consistently lower
than the Control, falling by 23% compared to the pre-treatment mean, largely because of a
decline in specific leaf area (S).
4. The consistent and significant effects of the TFR treatment on R, L and S suggest that severe
drought events in the Amazon, of the kind that may occur more frequently in future, could cause
a substantial increase in canopy carbon dioxide emissions from this ecosystem to the atmo-
sphere.
Key-words: tropical forest, climate change, moisture deficit, leaf dark respiration, night-time
foliar carbon emissions, specific leaf area, leaf area index, through-fall exclusion experiment
Introduction
Leaf dark respiration (R) of carbon dioxide (CO2) is a key
component of the Amazon rain forest ecosystem carbon (C)
cycle but remains poorly understood and rarely measured,
compared to other ecosystem fluxes such as photosynthesis
and soil CO2 efflux (Malhi, Baldocchi & Jarvis 1999; Cham-
bers et al. 2004b; Meir et al. 2008). This lack of knowledge
impedes attempts to predict the impacts of current and
future environmental change upon C cycling in the Amazon
rain forest.
In the case of the Amazon, of particular interest is the
effect of water availability upon R because the region may
experience increasingly frequent and severe drought events
associated with global climate change, fire and deforestation
over the next 100 years (Werth & Avissar 2002; Christensen
et al. 2007; Cox et al. 2008; Harris, Huntingford & Cox
2008; Malhi et al. 2008). Previous periods of drought dur-
ing El Nino events have appeared to cause a shift in regio-
nal scale C exchange across the entire Amazon forest from
a net C sink to a source of up to 1Æ5 · 109 t C year)1*Correspondence author. E-mail: [email protected]
� 2010 The Authors. Journal compilation � 2010 British Ecological Society
Functional Ecology 2010, 24, 524–533 doi: 10.1111/j.1365-2435.2009.01683.x
(Roedenbeck et al. 2003; Zeng, Mariotti & Wetzel 2005).
Models that simulate the interactions between forest and
atmosphere have been able to approximate this inter-annual
pattern of regional C fluxes by simulating a simultaneous
decline in C uptake via photosynthesis and a rise in ecosys-
tem respiration during drier and warmer years (Tian et al.
1998; Peylin et al. 2005; Zeng, Mariotti & Wetzel 2005).
Several studies have attempted to experimentally corrobo-
rate these model predictions. While there is reasonable sup-
porting evidence for a drought-induced reduction in
photosynthesis (Chaves & Oliveira 2004; Flexas et al. 2004;
Fisher et al. 2007), most available data on ecosystem respi-
ration suggest that it decreases under dry conditions (Sales-
ka et al. 2003; Vourlitis et al. 2005; Hutyra et al. 2007;
Meir et al. 2008). Much of this drought-induced inhibition
may be attributable to a decline in the largest single compo-
nent of ecosystem respiration-soil CO2 efflux (Davidson
et al. 2000; Schwendenmann et al. 2003; Sotta et al. 2004,
2007; Metcalfe et al. 2007).
However, ecosystem respiration is a composite flux derived
from not only soil CO2 efflux but also R and other sources,
whichmay each respond to environmental change in different
ways. Foliar C emissions per unit ground area are the inte-
grated product ofR, leaf area index (L) and the vertical distri-
bution ofR andL through the forest canopy. L, in turn, is the
product of foliar biomass per unit ground area (M) and spe-
cific leaf area (S). All of these parameters are potentially sensi-
tive to changes in water availability (Nepstad et al. 2002;
Hanson & Wullschleger 2003; Miranda et al. 2005; Wright
et al. 2006; Fisher et al. 2007; Myneni et al. 2007; Brando
et al. 2008). There currently exists relatively little information
about the individual responses ofR, S, L andM to drought in
the Amazon and even fewer data on the net effect of drought-
induced changes in these parameters upon stand-scale foliar
C emissions. Thus, it remains unclear to what extent mea-
sured responses of Amazon forest soil CO2 efflux may be off-
set or accentuated by simultaneous shifts in foliar C
emissions.
The overall objective of this study, therefore, was to assess
the sensitivity to drought ofR, S,L andM at an eastern Ama-
zon rain forest site. The impact of sustained drought was esti-
mated by comparing measurements made in a 1-ha plot
where c. 50% of incident rainfall had been excluded
(through-fall reduction or TFR plot) to an adjacent, similar
but unmodified, Control plot. While the TFR treatment was
not replicated (Hurlbert 1984, 2004) because of logistical and
financial constraints, it did provide insights into ecosystem
processes that would otherwise have been impossible to cap-
ture in smaller scale, more easily replicated experiments
(Reviews: Carpenter 1996; Sullivan 1997; Osmond et al.
2004; Stokstad 2005; Field studies: Nepstad et al. 2002;
Davidson, Ishida & Nepstad 2004; Fisher et al. 2007; Met-
calfe et al. 2007; Sotta et al. 2007; Brando et al. 2008). Specif-
ically, we used a ‘before-after-control-impact’ (Underwood
1997; Rasmussen et al. 2001; Gotelli & Ellison 2004)
approach to test for significant shifts inR and S both (i) Over
time- before and after the imposition of the TFR treatment
and between dry and wet seasons, and (ii) Between the TFR
treatment and Control for each individual measurement cam-
paign. Finally, we use existing L data to upscale leaf-level R
measurements to derive plot estimates of foliar night-time C
effluxes.
Materials and methods
S T U D Y S I T E
The experimental site is located in the Caxiuana National Forest,
Para State, north-eastern Brazil (1�43¢3Æ5¢¢S, 51�27¢36¢¢W). The forest
is a lowland terra firme rain forest situated on a level plain 10–15 m
above river water level, with a high annual rainfall (�2500 mm) and a
pronounced seasonality in leaf fall which peaks during the strong dry
season (see Table 1 for additional plot details). Plant species diversity
is high at around 100 species per hectare, of which over half are Sapot-
aceae, Fabaceae, Violaceae and Chrysobalanacae, and less than 1%
are lianas. Mean annual air temperature is c. 25 �C and the diurnal
variation is typically less than 3 �C. Themost widespread soil type is a
highly weathered yellow Oxisol (US Department of Agriculture soil
taxonomy). In January 2002, a 1-ha area of forest was modified with
the installation of plastic panels at 2 m height to exclude c. 50% of
incident rainfall (TFR plot). This reduction in rainfall is similar to a
key early long-term climate prediction for the region (Cox et al.
2000). The perimeter of the TFR plot was trenched to a mean depth
of 1 m and linedwith plastic sheeting tominimize lateral flow ofwater
into the site. Intercepted water was channelled away to a run-off area
50 m away from the plot. An adjacent 1-ha Control plot with similar
topography, soil type and vegetation structure (Fisher et al. 2007)
was used to assess natural patterns of L, S and R, in the absence of
any TFR treatment. Supplementary measurements during the first
3 years of the TFR treatment demonstrated that soil water potential,
tree stem sapflow, stomatal conductance and photosynthesis were all
substantially reduced in the TFR plot compared to the Control, par-
ticularly during the dry season (Fisher et al. 2007). At the beginning
of the experiment in January 2001, 30 m tall canopy access towers
were installed near the centre of both plots. All measurements were
Table 1. Key vegetation and soil features for each plot surveyed
Plot characteristics Control TFR
Vegetation
Tree number ha)1 434 421
Stem basal area (m2 ha)1) 23Æ9 24Æ0Tree species ha)1 118 113
Soil 0–10 cm
Clay content (%) 18 13
Silt content (%) 5 4
Sand content (%) 77 83
pH 4 4
Carbon content (g kg)1) 9 12
Nitrogen content (g kg)1) 0Æ4 0Æ3Phosphorus content (mg dm)3) 3 3
Carbon : nitrogen ratio 23 35
Soil cation exchange (cmol dm)3) 0Æ8 0Æ7
TFR, through-fall reduction. Tree number and basal area repre-
sents all individuals over 10 cm diameter at breast height, measured
in January 2005. Soil values are collated from data in Sotta et al.
(2007).
� 2010 The Authors. Journal compilation � 2010 British Ecological Society, Functional Ecology, 24, 524–533
Drought affects rain forest leaf respiration 525
taken at least 20 m inside the perimeter of each plot to minimize edge
effects.
M E A S U R E M E N T O F LE A F D A R K R E S P I R A T I O N
A N D S P E C I F I C L EA F A R EA
R and S from trees on both plots were recorded on six occasions
between November 2001 and January 2007: once before and five
times after imposition of the TFR treatment.L data are also available
from the same periods on both plots (Fisher et al. 2007). All measure-
ment campaigns sampled fully expanded, non-senescent, un-diseased
leaves, and recorded additional information about the height and tree
species of the sampled leaves. Thus, R measurements from these
leaves should primarily reflect ‘maintenance’ respiration rather than
‘growth’ respiration associated with metabolic costs of constructing
new plant tissue (McCree 1970). All leaves were sampled during the
daytime (08.30–15.00 h) and kept in the dark until CO2 gas exchange
had stabilized (usually after 5–10 min) before R at ambient air CO2
concentration (360–380 p.p.m.) and humidity (60–80%) was
recorded, thus minimizing biases potentially introduced by light-
enhanced dark respiration and the photorespiratory post-illumina-
tion burst (Atkin, Evans & Siebke 1998).
The first fivemeasurement campaigns (conducted betweenNovem-
ber 2001 and 2003) used the following methodology: 17–26 leaves
from nine trees, and 18–26 leaves from eight trees were sampled
around the canopy access towers on the Control and TFR plots
respectively (Table 2). Measurements were taken from the same trees
and from leaves at the same canopy heights in each measurement
campaign. R was measured in situ from un-excised leaves with an
infra-red gas analyser (IRGA) connected to a leaf measurement cuv-
ette (LI-COR 6400 portable photosynthesis system with 6400-02B
leaf cuvette; Lincoln, NE, USA). Leaf discs of a known area were cut
from leaves on the same branch as leaves used for R measurement,
dried at 70 �C until constant mass and weighed. S was calculated for
each leaf disc sampled by dividing drymass by one-sided area.
The final measurement campaign (in January 2007) sampled a total
of 33 and 28 individual leaves from the Control and TFR plots,
respectively, from 15 separate trees per plot. Of these trees sampled,
10 were randomly selected as the closest tree to every 10 m intersec-
tion point along two 40 m long transects in the centre of the plot. A
branch from the outer canopy of each selected tree was excised at
between one and three different canopy heights. No attempt was
made to cut and re-cut branches under water because this would not
have guaranteed that gas exchange remained unaltered (Santiago &
Mulkey 2003). Instead, we designed an experiment to quantify and, if
necessary, correct for any impacts of branch excision (see text in
Methods section). To facilitate sampling of leaves higher up in the
emergent canopy and to replicate measurements on individual trees
made earlier, an additional five trees per plot were similarly sampled
around the canopy access towers on each plot. R was measured for
most leaves within 3 h of branch excision, using an IRGA connected
to a leaf measurement cuvette (CIRAS-1 IRGA with PLC6 leaf cuv-
ette; PP Systems, Hitchen, UK). The interval of time between branch
excision and R measurement was noted for each leaf sampled. There
was no significant difference in the mean time between excision andR
measurement on the plots.
After measurement, the same leaves were photographed to calcu-
late leaf area with digital image analysis, and then dried at 70 �C until
constant mass and weighed. Swas calculated for each entire leaf sam-
pled (including petioles) by dividing drymass by one-sided area.
Measurements made with the LI-COR 6400 IRGA maintained a
flow rate of 500 lmol s)1, with a mean ± standard error (SE) differ-
ence between Cr and Cs of 0Æ52 ± 0Æ07 p.p.m. The CIRAS-1 IRGA
was set to a lower flow rate of 200 lmol s)1, and consequently the
observed mean ± SE CO2 difference was 0Æ91 ± 0Æ06 p.p.m. The
inward diffusion of respired CO2 from leaf material clamped under
the cuvette gasket (Pons & Welschen 2002) and the diluting effect of
water vapour produced by the leaf was corrected for.
Leaf temperatures recorded automatically by the IRGA systems
during Rmeasurement varied between 22 and 31 �C. Species-specificR temperature response functions were not available for all of the
trees sampled, someasurements were standardized to a reference tem-
perature of 25 �C (R25) with the following formula that describes the
average R temperature response across 116 terrestrial plant species
(Atkin&Tjoelker 2003; Atkin, Bruhn&Tjoelker 2005):
R25 ¼ Raf3�09� 0�0435½25þ Ta�=2g½ð25�TaÞ=10�
where Ra is R recorded at ambient temperature (Ta).
To investigate the potential confounding influences of branch
excision on the R values recorded in January 2007, the following
experiment was devised. An un-excised leaf was placed within the
IRGA cuvette and R was measured every minute for 1 h. After this
period, the branch attached to the leaf within the cuvette was
excised, but R measurement was continued at the same temporal fre-
quency for 5 h, to observe whether there was any change in R with
time since branch excision. Over this period, the sensor was regularly
automatically calibrated with air passed through a molecular sieve
to remove all CO2. Before and during measurements the molecular
sieve was frequently checked to ensure that it was not exhausted.
This procedure was repeated three times, on consecutive days from
three individual leaves each on separate trees of different species. All
leaves sampled showed no change in R over the hour prior to exci-
sion, but after excision R rose gradually over time, approximately
doubling after 5 h compared to the pre-excision mean value (data
not shown). A third-order polynomial model was fitted to the mean
trend of R over time since branch excision (R2 = 0Æ77). This model
was not chosen as a realistic mechanistic simulation of plant gas
exchange, but purely for limited predictive purposes over the dura-
tion of the measurements because it provided the best fit to the data.
This equation, together with data collected on the interval of time
between branch excision andRmeasurements for each leaf, was used
to correct for the confounding effect of excision and storage on Jan-
uary 2007 measurements by calculating R at time since excision = 0
for each leaf sampled. No immediate effect of excision itself on R
was apparent.
Table 2. Tree species sampled on the plots
Control TFR
Duguetia echinophora Duguetia echinophora
Hasseltia floribunda Hirtela bicornis
Licania heteromorpha Lecythis confertiflora
Manilkara bidentata Licaria armeniaca
Mezilaurus lindawiana Licania canescens
Pouteria lateriflora Manilkara paraensis
Protium heptaphyllum Mouriri duckeana
Quiina florida Swartzia racemosa
TFR, through-fall reduction. An individual representative of each
species (two individuals of Quiina florida on the Control plot) was
repeatedly sampled between November 2001 and 2003. In the final
measurement campaign (January 2007) trees sampled were not
identified to species level.
� 2010 The Authors. Journal compilation � 2010 British Ecological Society, Functional Ecology, 24, 524–533
526 D. B. Metcalfe et al.
M E A SU R E M E N T O F LE A F A R E A I N D E X A N D F OL I A G E
M A S S
Mean plot L estimated during the first five measurement campaigns
(conducted between November 2001 and 2003) is presented in Fisher
et al. (2007). These data were derived from canopy images captured
at 100 points per plot with LAI-2000 plant canopy analysers (LI-
COR Inc.). For this study, additional L data were collected in Janu-
ary 2007 based upon canopy images per plot collected at 25 locations
along a with a digital camera and fish-eye lens (Nikon Coolpix 900;
Nikon Corporation, Melville,USA) and subsequently analysed with
digital image analysis software (Hemiview 2.1 SR1; Delta-T Devices
Ltd, Cambridge, UK). All images of the canopy were recorded in the
early morning or late afternoon, during periods of fully diffuse incom-
ing radiation along a regular grid within both plots (following the
methodology of Aragao et al. (2005). The distribution of L with
height above the ground on both plots was estimated once – in
November 2001 – by recording L with the LAI-2000 plant canopy
analysers (LI-COR Inc.) every 2 m up each of the plot canopy access
towers. Plot-level M was estimated for each measurement campaign
bymultiplyingmean plot leafmass per unit leaf area (1 ⁄S) byL.
E ST I M A T I N G S T A N D -S C A L E N I G H T - T I M E F O L I A R
C A R B ON E F F L U X
To illustrate howR, S and L interact, and to facilitate direct compari-
son of our leaf-level R measurements with other ecosystem C fluxes,
we derived approximate estimates of stand-scale foliar C efflux. To do
so, we calculated mean ± 95% confidence intervals of L and R per
unit area separately for three canopy height layers (£10, 11–20,
‡21 m). Night-time foliar C emissions per unit ground area were esti-
mated for each canopy layer as the product ofR per unit leaf areamul-
tiplied by L. Given the low temporal frequency of our direct
measurements and the focus on between-plot (rather than seasonal or
annual) differences we opted for the relatively simple, more transpar-
ent, up-scaling approachof assuming constant night-time air tempera-
ture of 25 �C and 12 h of dark conditions each day throughout the
year. For the purposes of this analysis, we also assumed that dark-
equilibratedR recordedduring the day in this studywas representative
of night-time leaf respiration (Chambers et al. 2009; but seeHubbard,
Ryan & Lukens 1995). Means from each canopy layer were summed
to derive total plot estimates. Where necessary, 95% confidence inter-
vals were propagated by quadrature of absolute errors for addition
and subtraction, and quadrature of relative errors for multiplication
and division (Mood, Graybill & Boes 1974; Cavaleri, Oberhauer &
Ryan 2008). This assumes that errors are independent and normally
distributed.
D A T A A N A LY S I S
To assess the impact of the TFR treatment on S and R the following
two statistical analyses were performed. (i) Within-plot change over
time since the imposition of the TFR treatment was quantified with a
repeated-measures analysis of variance (RM-ANOVA). Data from
the final measurement campaign were not included in the RM-ANO-
VA because a different set of trees were sampled with a different
methodology, whereas the previous five campaigns repeatedly sam-
pled leaves from the same trees and same canopy heights. To examine
specifically which time periods differed from each other in terms of S
and R, pairwise comparisons between measurement campaigns were
conducted within the RM-ANOVA analysis. (ii) Between-plot differ-
ences in R and S over all measurement campaigns were quantified
with a Generalized Linear Model (GLM) with plot as a fixed-effects
factor, and leaf height, tree family and sampling time specified as ran-
dom-effects factors to control for the potentially confounding effect
of sampling differences between plots. Using this method, plot differ-
ences were examined both for all data at each measurement cam-
paign, and for all data in different canopy height categories (£10, 11–20, ‡21 m). In addition, the links between leaf height, R and S were
assessed with a Spearman’s Rank Correlation. Statistical analyses
were carried out with SPSS 14Æ0 for Windows (SPSS Inc., Chicago,
IL, USA). Key outputs of the analyses were an F-statistic (for the
RM-ANOVA and GLM), a correlation coefficient (r, for the Spear-
man’s Rank Correlation analysis) and a significance P-value for all
tests. Data were transformed with a natural logarithm, where neces-
sary, to conform to the assumptions of parametric analysis.
Results
P LO T T R E N D S I N S T A N D - S C A LE N I G H T - T I M E F O L I AR
C A R B ON E F F L U X
R per unit area together withL data, apportioned into canopy
height categories (£10, 11–20, ‡21 m), were used to estimate
total±95%confidence intervals foliarnight-timeCemissions
prior to the TFR treatment of 3Æ4 ±0Æ1 and 3Æ4 ±0Æ3 t ha)1
year)1 on the Control and TFR plots respectively (Table 3).
According to these estimates, elevatedR on the TFRplot rela-
tive to the Control was not fully offset by the drought-associ-
ated decline in L, such that night-time foliar C emissions on
the TFR plot were 0Æ7 ± 0Æ4 and 1Æ8 ± 0Æ9 t C ha)1 year)1
greater than the Control plot based upon measurements in
November 2003and January2007 respectively (Table 3).
P L O T T R E N D S I N L E A F D A R K R ES P I R A T I O N
Plot mean R values were comparable to existing data from
other studies in the Amazon forest (Table 4). In the Control
plot, there was no significant overall change inR per unit area
(RM-ANOVA, d.f. = 4, F = 0Æ77, P = 0Æ56) and mass
(RM-ANOVA, d.f. = 4, F = 1Æ78, P = 0Æ17) between
November 2001 and 2003 (Table 5, Fig. 1c,d). In contrast,
Table 3. Plot estimates of night-time stand-scale foliar C efflux (t C ha)1 year)1)
November 2001 May 2002 November 2002 May 2003 November 2003 January 2007
Control 3Æ4 ± 0Æ1 4Æ0 ± 0Æ4 4Æ2 ± 1Æ9 3Æ5 ± 0Æ6 4Æ6 ± 0Æ2 4Æ1 ± 0Æ4TFR 3Æ4 ± 0Æ3 4Æ2 ± 0Æ4 3Æ1 ± 0Æ2 4Æ8 ± 1Æ1 5Æ3 ± 0Æ3 5Æ9 ± 0Æ8Difference TFR ) Control 0Æ0 ± 0Æ4 0Æ2 ± 0Æ6 )1Æ1 ± 1Æ9 1Æ4 ± 1Æ2 0Æ7 ± 0Æ4 1Æ8 ± 0Æ9
TFR, through-fall reduction. Values are estimated from instantaneous measurements at each date extrapolated over a year assuming con-
stant air temperature of 25 �C and 12 h of dark conditions every night.
� 2010 The Authors. Journal compilation � 2010 British Ecological Society, Functional Ecology, 24, 524–533
Drought affects rain forest leaf respiration 527
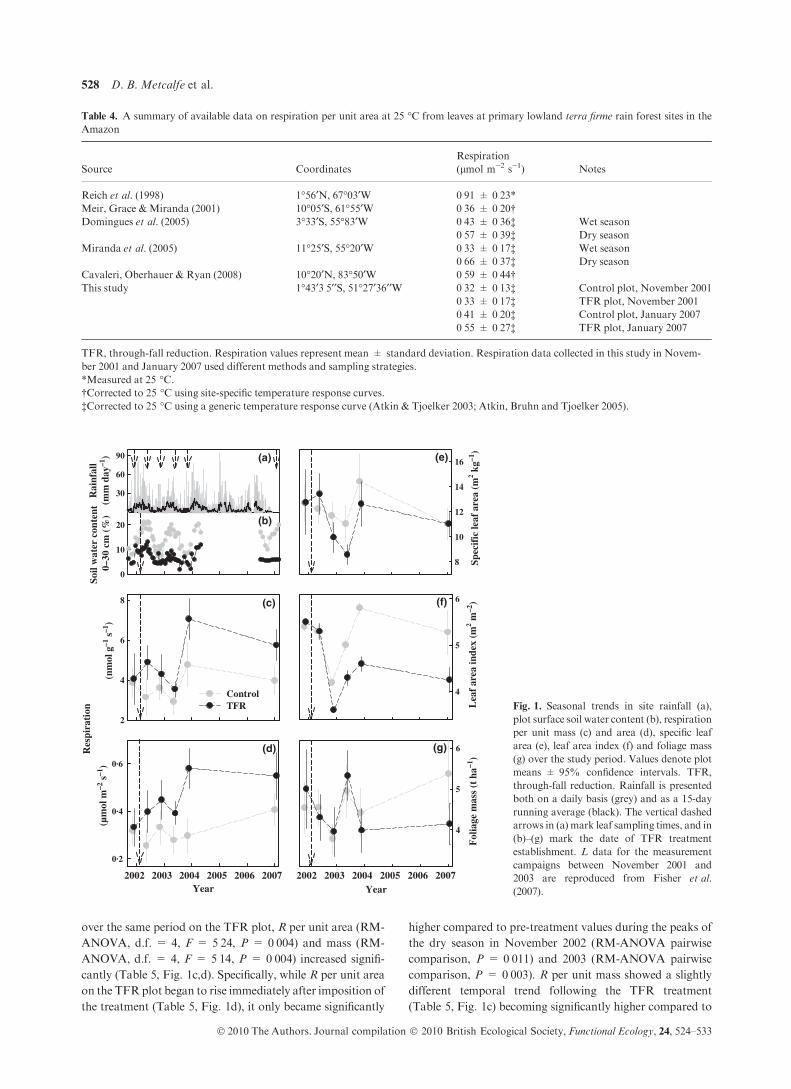
over the same period on the TFR plot, R per unit area (RM-
ANOVA, d.f. = 4, F = 5Æ24, P = 0Æ004) and mass (RM-
ANOVA, d.f. = 4, F = 5Æ14, P = 0Æ004) increased signifi-
cantly (Table 5, Fig. 1c,d). Specifically, while R per unit area
on the TFRplot began to rise immediately after imposition of
the treatment (Table 5, Fig. 1d), it only became significantly
higher compared to pre-treatment values during the peaks of
the dry season in November 2002 (RM-ANOVA pairwise
comparison, P = 0Æ011) and 2003 (RM-ANOVA pairwise
comparison, P = 0Æ003). R per unit mass showed a slightly
different temporal trend following the TFR treatment
(Table 5, Fig. 1c) becoming significantly higher compared to
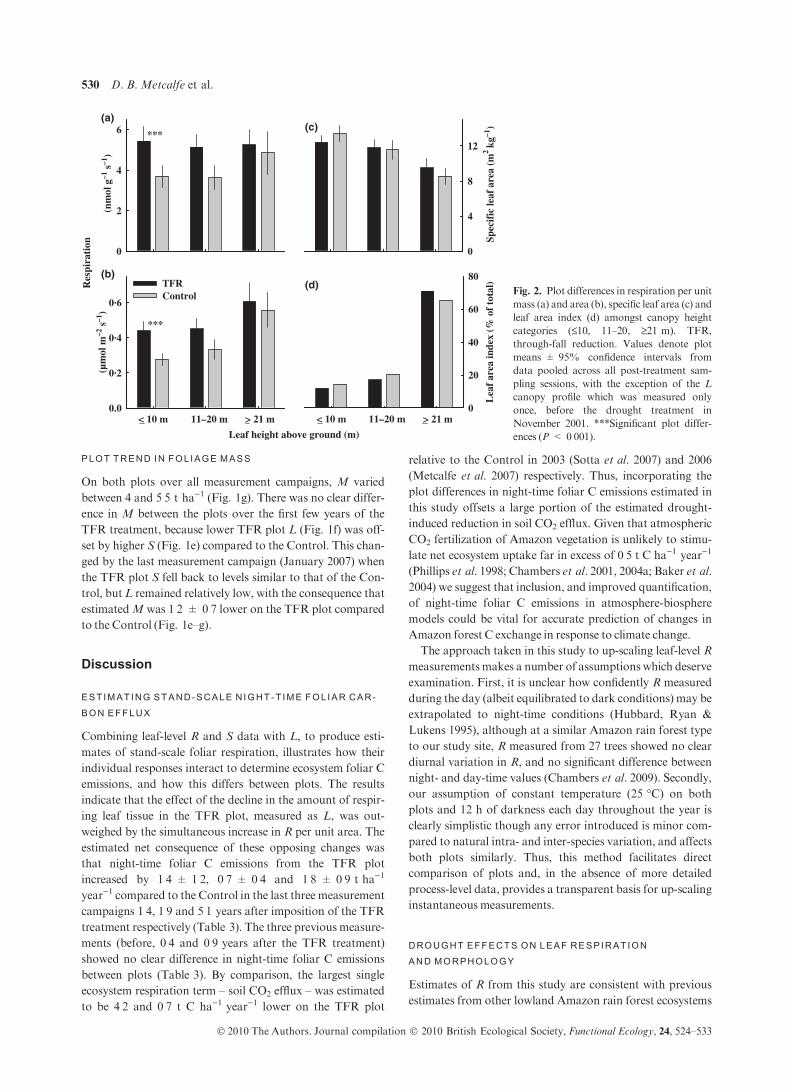
Table 4. A summary of available data on respiration per unit area at 25 �C from leaves at primary lowland terra firme rain forest sites in the
Amazon
Source Coordinates
Respiration
(lmol m)2 s)1) Notes
Reich et al. (1998) 1�56¢N, 67�03¢W 0Æ91 ± 0Æ23*Meir, Grace &Miranda (2001) 10�05¢S, 61�55¢W 0Æ36 ± 0Æ20†Domingues et al. (2005) 3�33¢S, 55�83¢W 0Æ43 ± 0Æ36‡
0Æ57 ± 0Æ39‡Wet season
Dry season
Miranda et al. (2005) 11�25¢S, 55�20¢W 0Æ33 ± 0Æ17‡0Æ66 ± 0Æ37‡
Wet season
Dry season
Cavaleri, Oberhauer & Ryan (2008) 10�20¢N, 83�50¢W 0Æ59 ± 0Æ44†This study 1�43¢3Æ5¢¢S, 51�27¢36¢¢W 0Æ32 ± 0Æ13‡
0Æ33 ± 0Æ17‡0Æ41 ± 0Æ20‡0Æ55 ± 0Æ27‡
Control plot, November 2001
TFR plot, November 2001
Control plot, January 2007
TFR plot, January 2007
TFR, through-fall reduction. Respiration values represent mean ± standard deviation. Respiration data collected in this study in Novem-
ber 2001 and January 2007 used different methods and sampling strategies.
*Measured at 25 �C.†Corrected to 25 �C using site-specific temperature response curves.
‡Corrected to 25 �C using a generic temperature response curve (Atkin & Tjoelker 2003; Atkin, Bruhn and Tjoelker 2005).
Year2002 2003 2004 2005 2006 2007
0·2
0·4
0·6
Soil
wat
er c
onte
nt
0–30
cm
(%
)
0
10
20
Rai
nfal
l
30
60
90
(µm
ol m
–2 s
–1)
2
4
6
8
Lea
f ar
ea in
dex
(m2
4
5
6
Spec
ific
leaf
are
a (m
2
8
10
12
14
16
ControlTFR
(d)
(c)
(a)
(b)
Res
pira
tion
Year2002 2003 2004 2005 2006 2007
Fol
iage
mas
s (t
ha–1
)
4
5
6
(e)
(f)
(g)
(nm
ol g
–1 s
–1)
(mm
day
–1)
kg–1
)m
–2)
Fig. 1. Seasonal trends in site rainfall (a),
plot surface soil water content (b), respiration
per unit mass (c) and area (d), specific leaf
area (e), leaf area index (f) and foliage mass
(g) over the study period. Values denote plot
means ± 95% confidence intervals. TFR,
through-fall reduction. Rainfall is presented
both on a daily basis (grey) and as a 15-day
running average (black). The vertical dashed
arrows in (a) mark leaf sampling times, and in
(b)–(g) mark the date of TFR treatment
establishment. L data for the measurement
campaigns between November 2001 and
2003 are reproduced from Fisher et al.
(2007).
� 2010 The Authors. Journal compilation � 2010 British Ecological Society, Functional Ecology, 24, 524–533
528 D. B. Metcalfe et al.
the pre-treatment mean only by November 2003 (RM-ANO-
VApairwise comparison,P = 0Æ027).Directly comparing plot R estimates from each measure-
ment campaign and controlling for plot sampling differences
in tree family, leaf height and sampling time showed that
there was no significant plot difference in R per unit area
(GLM, d.f. = 1, F = 0Æ30, P = 0Æ68) and mass (GLM,
d.f. = 1, F = 4Æ34, P = 0Æ28) prior to imposition of the
TFR treatment (Fig. 1c,d). However, after the TFR treat-
ment, measured R on the TFR plot increased (Table 5,
Fig. 1c,d) until it became significantly higher than the Con-
trol in January 2007 (GLM, d.f. = 1, Per unit mass:
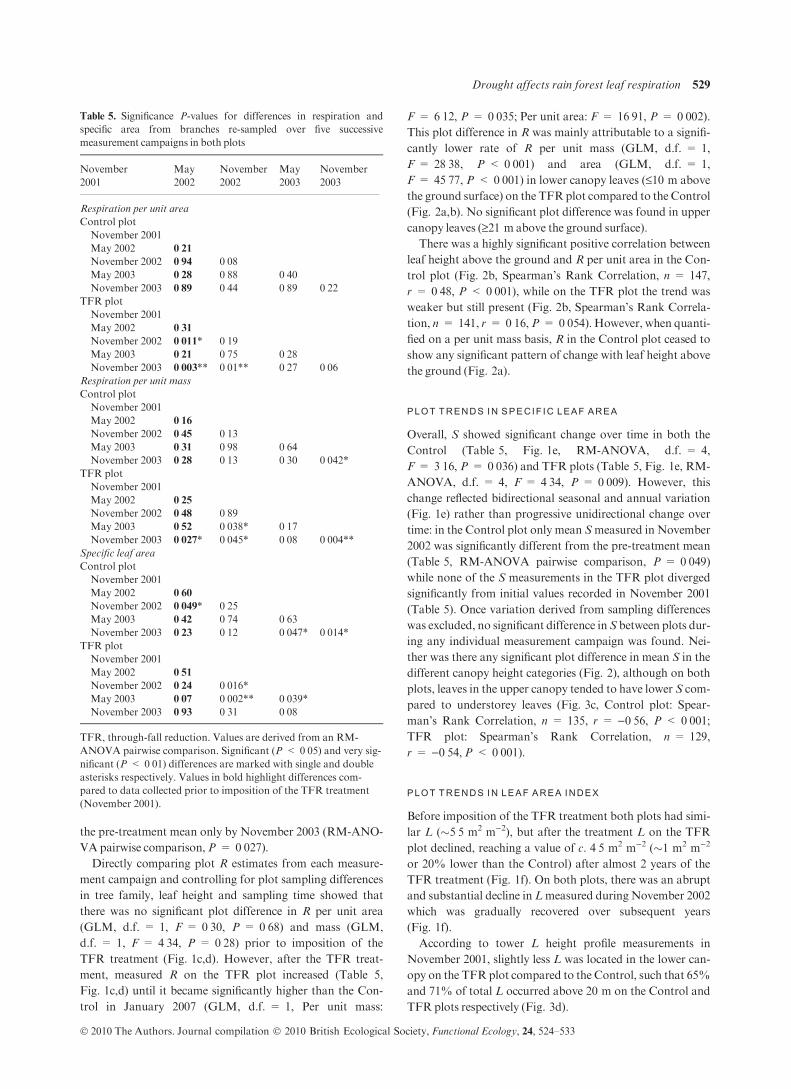
F = 6Æ12, P = 0Æ035; Per unit area: F = 16Æ91, P = 0Æ002).This plot difference in R was mainly attributable to a signifi-
cantly lower rate of R per unit mass (GLM, d.f. = 1,
F = 28Æ38, P < 0Æ001) and area (GLM, d.f. = 1,
F = 45Æ77, P < 0Æ001) in lower canopy leaves (£10 m above
the ground surface) on the TFRplot compared to the Control
(Fig. 2a,b). No significant plot difference was found in upper
canopy leaves (‡21 m above the ground surface).
There was a highly significant positive correlation between
leaf height above the ground and R per unit area in the Con-
trol plot (Fig. 2b, Spearman’s Rank Correlation, n = 147,
r = 0Æ48, P < 0Æ001), while on the TFR plot the trend was
weaker but still present (Fig. 2b, Spearman’s Rank Correla-
tion, n = 141, r = 0Æ16,P = 0Æ054). However, when quanti-
fied on a per unit mass basis, R in the Control plot ceased to
show any significant pattern of change with leaf height above
the ground (Fig. 2a).
P LO T T R E N D S I N S P E C I F I C L EA F A R EA
Overall, S showed significant change over time in both the
Control (Table 5, Fig. 1e, RM-ANOVA, d.f. = 4,
F = 3Æ16, P = 0Æ036) and TFR plots (Table 5, Fig. 1e, RM-
ANOVA, d.f. = 4, F = 4Æ34, P = 0Æ009). However, this
change reflected bidirectional seasonal and annual variation
(Fig. 1e) rather than progressive unidirectional change over
time: in the Control plot only mean Smeasured in November
2002 was significantly different from the pre-treatment mean
(Table 5, RM-ANOVA pairwise comparison, P = 0Æ049)while none of the S measurements in the TFR plot diverged
significantly from initial values recorded in November 2001
(Table 5). Once variation derived from sampling differences
was excluded, no significant difference inS between plots dur-
ing any individual measurement campaign was found. Nei-
ther was there any significant plot difference in mean S in the
different canopy height categories (Fig. 2), although on both
plots, leaves in the upper canopy tended to have lower S com-
pared to understorey leaves (Fig. 3c, Control plot: Spear-
man’s Rank Correlation, n = 135, r = )0Æ56, P < 0Æ001;TFR plot: Spearman’s Rank Correlation, n = 129,
r = )0Æ54,P < 0Æ001).
P LO T T R E N D S I N L E AF A R E A I N D E X
Before imposition of the TFR treatment both plots had simi-
lar L (�5Æ5 m2 m)2), but after the treatment L on the TFR
plot declined, reaching a value of c. 4Æ5 m2 m)2 (�1 m2 m)2
or 20% lower than the Control) after almost 2 years of the
TFR treatment (Fig. 1f). On both plots, there was an abrupt
and substantial decline in Lmeasured during November 2002
which was gradually recovered over subsequent years
(Fig. 1f).
According to tower L height profile measurements in
November 2001, slightly less L was located in the lower can-
opy on the TFRplot compared to the Control, such that 65%
and 71% of total L occurred above 20 m on the Control and
TFR plots respectively (Fig. 3d).
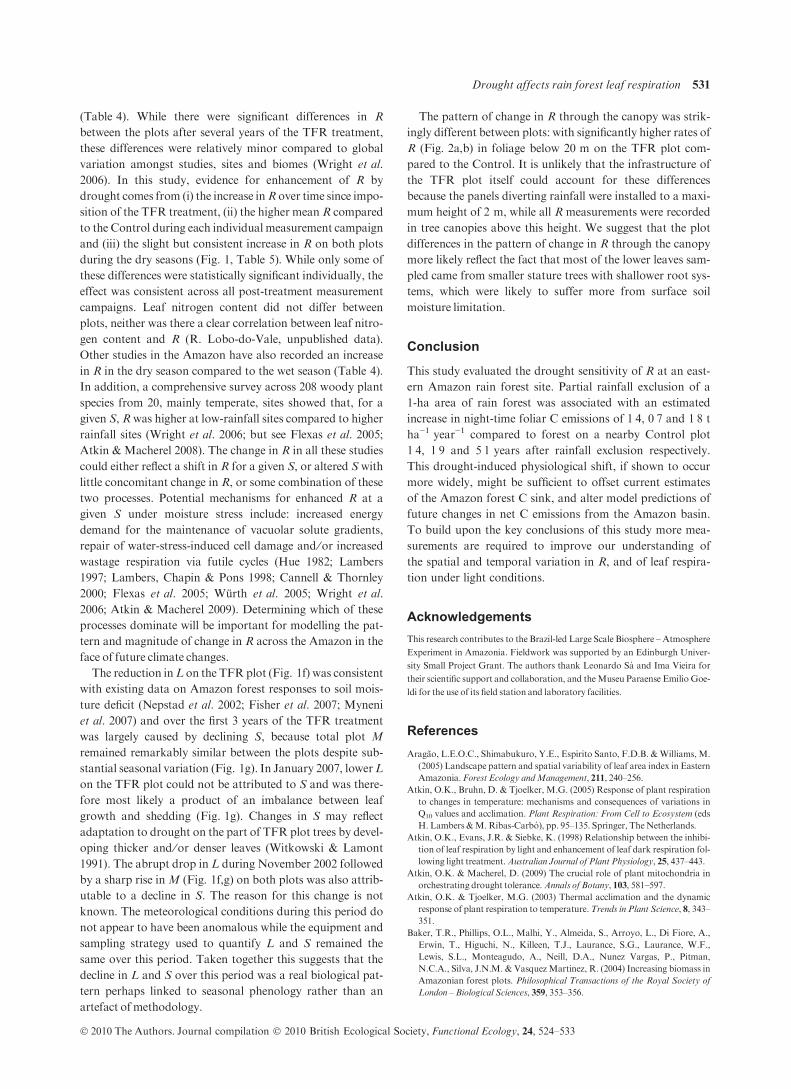
Table 5. Significance P-values for differences in respiration and
specific area from branches re-sampled over five successive
measurement campaigns in both plots
November
2001
May
2002
November
2002
May
2003
November
2003
Respiration per unit area
Control plot
November 2001
May 2002 0Æ21November 2002 0Æ94 0Æ08May 2003 0Æ28 0Æ88 0Æ40November 2003 0Æ89 0Æ44 0Æ89 0Æ22
TFR plot
November 2001
May 2002 0Æ31November 2002 0Æ011* 0Æ19May 2003 0Æ21 0Æ75 0Æ28November 2003 0Æ003** 0Æ01** 0Æ27 0Æ06
Respiration per unit mass
Control plot
November 2001
May 2002 0Æ16November 2002 0Æ45 0Æ13May 2003 0Æ31 0Æ98 0Æ64November 2003 0Æ28 0Æ13 0Æ30 0Æ042*
TFR plot
November 2001
May 2002 0Æ25November 2002 0Æ48 0Æ89May 2003 0Æ52 0Æ038* 0Æ17November 2003 0Æ027* 0Æ045* 0Æ08 0Æ004**
Specific leaf area
Control plot
November 2001
May 2002 0Æ60November 2002 0Æ049* 0Æ25May 2003 0Æ42 0Æ74 0Æ63November 2003 0Æ23 0Æ12 0Æ047* 0Æ014*
TFR plot
November 2001
May 2002 0Æ51November 2002 0Æ24 0Æ016*May 2003 0Æ07 0Æ002** 0Æ039*November 2003 0Æ93 0Æ31 0Æ08
TFR, through-fall reduction. Values are derived from an RM-
ANOVA pairwise comparison. Significant (P < 0Æ05) and very sig-
nificant (P < 0Æ01) differences are marked with single and double
asterisks respectively. Values in bold highlight differences com-
pared to data collected prior to imposition of the TFR treatment
(November 2001).
� 2010 The Authors. Journal compilation � 2010 British Ecological Society, Functional Ecology, 24, 524–533
Drought affects rain forest leaf respiration 529
P LO T T R E N D I N F O L I AG E M AS S
On both plots over all measurement campaigns, M varied
between 4 and 5Æ5 t ha)1 (Fig. 1g). There was no clear differ-
ence in M between the plots over the first few years of the
TFR treatment, because lower TFR plot L (Fig. 1f) was off-
set by higher S (Fig. 1e) compared to the Control. This chan-
ged by the last measurement campaign (January 2007) when
the TFR plot S fell back to levels similar to that of the Con-
trol, but L remained relatively low, with the consequence that
estimatedM was 1Æ2 ± 0Æ7 lower on the TFR plot compared
to the Control (Fig. 1e–g).
Discussion
E ST I M A T I N G S T A N D -S C A L E N I G H T - T I M E F O L I A R C A R -
B O N E F F L U X
Combining leaf-level R and S data with L, to produce esti-
mates of stand-scale foliar respiration, illustrates how their
individual responses interact to determine ecosystem foliar C
emissions, and how this differs between plots. The results
indicate that the effect of the decline in the amount of respir-
ing leaf tissue in the TFR plot, measured as L, was out-
weighed by the simultaneous increase in R per unit area. The
estimated net consequence of these opposing changes was
that night-time foliar C emissions from the TFR plot
increased by 1Æ4 ± 1Æ2, 0Æ7 ± 0Æ4 and 1Æ8 ± 0Æ9 t ha)1
year)1 compared to the Control in the last three measurement
campaigns 1Æ4, 1Æ9 and 5Æ1 years after imposition of the TFR
treatment respectively (Table 3). The three previous measure-
ments (before, 0Æ4 and 0Æ9 years after the TFR treatment)
showed no clear difference in night-time foliar C emissions
between plots (Table 3). By comparison, the largest single
ecosystem respiration term – soil CO2 efflux – was estimated
to be 4Æ2 and 0Æ7 t C ha)1 year)1 lower on the TFR plot
relative to the Control in 2003 (Sotta et al. 2007) and 2006
(Metcalfe et al. 2007) respectively. Thus, incorporating the
plot differences in night-time foliar C emissions estimated in
this study offsets a large portion of the estimated drought-
induced reduction in soil CO2 efflux. Given that atmospheric
CO2 fertilization of Amazon vegetation is unlikely to stimu-
late net ecosystem uptake far in excess of 0Æ5 t C ha)1 year)1
(Phillips et al. 1998; Chambers et al. 2001, 2004a; Baker et al.
2004) we suggest that inclusion, and improved quantification,
of night-time foliar C emissions in atmosphere-biosphere
models could be vital for accurate prediction of changes in
Amazon forest C exchange in response to climate change.
The approach taken in this study to up-scaling leaf-level R
measurements makes a number of assumptions which deserve
examination. First, it is unclear how confidently R measured
during the day (albeit equilibrated to dark conditions) may be
extrapolated to night-time conditions (Hubbard, Ryan &
Lukens 1995), although at a similar Amazon rain forest type
to our study site, R measured from 27 trees showed no clear
diurnal variation in R, and no significant difference between
night- and day-time values (Chambers et al. 2009). Secondly,
our assumption of constant temperature (25 �C) on both
plots and 12 h of darkness each day throughout the year is
clearly simplistic though any error introduced is minor com-
pared to natural intra- and inter-species variation, and affects
both plots similarly. Thus, this method facilitates direct
comparison of plots and, in the absence of more detailed
process-level data, provides a transparent basis for up-scaling
instantaneous measurements.
D R O U G H T E F F E C T S ON L E A F R E S P I R AT I O N
A N D M O R PH OL O G Y
Estimates of R from this study are consistent with previous
estimates from other lowland Amazon rain forest ecosystems
Res
pira
tion
Leaf height above ground (m)
(nm
ol g
–1 s
–1)
(µm
ol m
–2 s
–1)
0
2
4
6
< 10 m 11–20 m > 21 m0.0
0·2
0·4
0·6
TFRControl
Spec
ific
leaf
are
a (m
2 kg–1
)
0
4
8
12
< 10 m 11–20 m
Lea
f ar
ea in
dex
(% o
f to
tal)
0
20
40
60
80(b)
(c)
(d)
***
***
(a)
> 21 m
Fig. 2. Plot differences in respiration per unit
mass (a) and area (b), specific leaf area (c) and
leaf area index (d) amongst canopy height
categories (£10, 11–20, ‡21 m). TFR,
through-fall reduction. Values denote plot
means ± 95% confidence intervals from
data pooled across all post-treatment sam-
pling sessions, with the exception of the L
canopy profile which was measured only
once, before the drought treatment in
November 2001. ***Significant plot differ-
ences (P < 0Æ001).
� 2010 The Authors. Journal compilation � 2010 British Ecological Society, Functional Ecology, 24, 524–533
530 D. B. Metcalfe et al.
(Table 4). While there were significant differences in R
between the plots after several years of the TFR treatment,
these differences were relatively minor compared to global
variation amongst studies, sites and biomes (Wright et al.
2006). In this study, evidence for enhancement of R by
drought comes from (i) the increase inR over time since impo-
sition of the TFR treatment, (ii) the higher meanR compared
to the Control during each individual measurement campaign
and (iii) the slight but consistent increase in R on both plots
during the dry seasons (Fig. 1, Table 5). While only some of
these differences were statistically significant individually, the
effect was consistent across all post-treatment measurement
campaigns. Leaf nitrogen content did not differ between
plots, neither was there a clear correlation between leaf nitro-
gen content and R (R. Lobo-do-Vale, unpublished data).
Other studies in the Amazon have also recorded an increase
in R in the dry season compared to the wet season (Table 4).
In addition, a comprehensive survey across 208 woody plant
species from 20, mainly temperate, sites showed that, for a
given S, R was higher at low-rainfall sites compared to higher
rainfall sites (Wright et al. 2006; but see Flexas et al. 2005;
Atkin & Macherel 2008). The change in R in all these studies
could either reflect a shift in R for a given S, or altered S with
little concomitant change in R, or some combination of these
two processes. Potential mechanisms for enhanced R at a
given S under moisture stress include: increased energy
demand for the maintenance of vacuolar solute gradients,
repair of water-stress-induced cell damage and ⁄or increasedwastage respiration via futile cycles (Hue 1982; Lambers
1997; Lambers, Chapin & Pons 1998; Cannell & Thornley
2000; Flexas et al. 2005; Wurth et al. 2005; Wright et al.
2006; Atkin & Macherel 2009). Determining which of these
processes dominate will be important for modelling the pat-
tern and magnitude of change in R across the Amazon in the
face of future climate changes.
The reduction inL on the TFR plot (Fig. 1f) was consistent
with existing data on Amazon forest responses to soil mois-
ture deficit (Nepstad et al. 2002; Fisher et al. 2007; Myneni
et al. 2007) and over the first 3 years of the TFR treatment
was largely caused by declining S, because total plot M
remained remarkably similar between the plots despite sub-
stantial seasonal variation (Fig. 1g). In January 2007, lowerL
on the TFR plot could not be attributed to S and was there-
fore most likely a product of an imbalance between leaf
growth and shedding (Fig. 1g). Changes in S may reflect
adaptation to drought on the part of TFR plot trees by devel-
oping thicker and ⁄or denser leaves (Witkowski & Lamont
1991). The abrupt drop in L during November 2002 followed
by a sharp rise inM (Fig. 1f,g) on both plots was also attrib-
utable to a decline in S. The reason for this change is not
known. The meteorological conditions during this period do
not appear to have been anomalous while the equipment and
sampling strategy used to quantify L and S remained the
same over this period. Taken together this suggests that the
decline in L and S over this period was a real biological pat-
tern perhaps linked to seasonal phenology rather than an
artefact of methodology.
The pattern of change in R through the canopy was strik-
ingly different between plots: with significantly higher rates of
R (Fig. 2a,b) in foliage below 20 m on the TFR plot com-
pared to the Control. It is unlikely that the infrastructure of
the TFR plot itself could account for these differences
because the panels diverting rainfall were installed to a maxi-
mum height of 2 m, while all R measurements were recorded
in tree canopies above this height. We suggest that the plot
differences in the pattern of change in R through the canopy
more likely reflect the fact that most of the lower leaves sam-
pled came from smaller stature trees with shallower root sys-
tems, which were likely to suffer more from surface soil
moisture limitation.
Conclusion
This study evaluated the drought sensitivity of R at an east-
ern Amazon rain forest site. Partial rainfall exclusion of a
1-ha area of rain forest was associated with an estimated
increase in night-time foliar C emissions of 1Æ4, 0Æ7 and 1Æ8 t
ha)1 year)1 compared to forest on a nearby Control plot
1Æ4, 1Æ9 and 5Æ1 years after rainfall exclusion respectively.
This drought-induced physiological shift, if shown to occur
more widely, might be sufficient to offset current estimates
of the Amazon forest C sink, and alter model predictions of
future changes in net C emissions from the Amazon basin.
To build upon the key conclusions of this study more mea-
surements are required to improve our understanding of
the spatial and temporal variation in R, and of leaf respira-
tion under light conditions.
Acknowledgements
This research contributes to the Brazil-led Large Scale Biosphere – Atmosphere
Experiment in Amazonia. Fieldwork was supported by an Edinburgh Univer-
sity Small Project Grant. The authors thank Leonardo Sa and Ima Vieira for
their scientific support and collaboration, and theMuseu Paraense Emilio Goe-
ldi for the use of its field station and laboratory facilities.
References
Aragao, L.E.O.C., Shimabukuro, Y.E., Espırito Santo, F.D.B. &Williams, M.
(2005) Landscape pattern and spatial variability of leaf area index in Eastern
Amazonia.Forest Ecology andManagement, 211, 240–256.
Atkin, O.K., Bruhn, D. & Tjoelker, M.G. (2005) Response of plant respiration
to changes in temperature: mechanisms and consequences of variations in
Q10 values and acclimation. Plant Respiration: From Cell to Ecosystem (eds
H. Lambers &M.Ribas-Carbo), pp. 95–135. Springer, TheNetherlands.
Atkin, O.K., Evans, J.R. & Siebke, K. (1998) Relationship between the inhibi-
tion of leaf respiration by light and enhancement of leaf dark respiration fol-
lowing light treatment.Australian Journal of Plant Physiology, 25, 437–443.
Atkin, O.K. & Macherel, D. (2009) The crucial role of plant mitochondria in
orchestrating drought tolerance.Annals of Botany, 103, 581–597.
Atkin, O.K. & Tjoelker, M.G. (2003) Thermal acclimation and the dynamic
response of plant respiration to temperature.Trends in Plant Science, 8, 343–
351.
Baker, T.R., Phillips, O.L., Malhi, Y., Almeida, S., Arroyo, L., Di Fiore, A.,
Erwin, T., Higuchi, N., Killeen, T.J., Laurance, S.G., Laurance, W.F.,
Lewis, S.L., Monteagudo, A., Neill, D.A., Nunez Vargas, P., Pitman,
N.C.A., Silva, J.N.M. & VasquezMartinez, R. (2004) Increasing biomass in
Amazonian forest plots. Philosophical Transactions of the Royal Society of
London – Biological Sciences, 359, 353–356.
� 2010 The Authors. Journal compilation � 2010 British Ecological Society, Functional Ecology, 24, 524–533
Drought affects rain forest leaf respiration 531
Brando, P.M., Nepstad, D.C., Davidson, E.A., Trumbore, S.E., Ray, D. &
Camargo, P. (2008) Drought effects on litterfall, wood production, and
belowground carbon cycling in an Amazon forest: results of a through-fall
reduction experiment. Philosophical Transactions of the Royal Society of
London – Biological Sciences, 363, 1839–1848.
Cannell, M.G.R. & Thornley, J.H.M. (2000) Modelling the components of
plant respiration: some guiding principles.Annals of Botany, 85, 45–54.
Carpenter, S.R. (1996)Microcosm experiments have limited relevance for com-
munity and ecosystem ecology.Ecology, 77, 677–680.
Cavaleri, M.A., Oberhauer, S.F. & Ryan, M.G. (2008) Foliar and ecosystem
respiration in an old-growth tropical rainforest.Plant, Cell and Environment,
31, 473–483.
Chambers, J.Q., Higuchi, N., Tribuzy, E.S. & Trumbore, S.E. (2001) Carbon
sink for a century.Nature, 410, 429.
Chambers, J.Q., Higuchi, N., Teixeira, L.M., Dos Santos, J., Laurance, S.G. &
Trumbore, S.E. (2004a) Response of tree biomass and wood litter to distur-
bance.Oecologia, 141, 596–614.
Chambers, J.Q., Tribuzy, E.S., Toledo, L.C., Crispim, B.F., Higuchi, N.,
Dos Santos, J., Araujo, A.C., Kruijt, B., Nobre, A.D. & Trumbore,
S.E. (2004b) Respiration from a tropical forest ecosystem: partitioning
of sources and low carbon use efficiency. Ecological Applications, 14,
72–88.
Chambers, J.Q., Tribuzy, E.S., Toledo, L.C., Crispim, B.F., Higuchi, N., Dos
Santos, J., Araujo, A.C., Kruijt, B., Nobre, A.D. & Trumbore, S.E. (2009)
Tropical forest ecosystem respiration,Manaus, Brazil. Dataset available on-
line (http://daac.ornl.gov) from Oak Ridge National Laboratory Distrib-
uted Active Archive Center, Oak Ridge, Tennessee, USA. DOI: 10.3334/
ORNLDAAC/912.
Chaves,M.M.&Oliveira,M.M. (2004)Mechanisms underlying plant resilience
to water deficits: prospects for water-saving agriculture. Journal of Experi-
mental Botany, 55, 2365–2384.
Christensen, J.H., Hewitson, B., Busuioc, A., Chen, A., Gao, X., Held, I.,
Jones, R., Kolli, R.K., Kwon, W.T., Laprise, R., Magana Rueda, V.,
Mearns, L., Menendez, C.G., Raisanen, J., Rinke, A., Sarr, A. & Whetton,
P. (2007) Regional climate projections. Climate Change 2007: The Physical
Science Basis. Contribution of Working Group I to the Fourth Assessment
Report of the Intergovernmental Panel on Climate Change (eds S. Solomon,
D. Qin,M.Manning, Z. Chen,M.Marquis, K.B. Averyt, M. Tignor &H.L.
Miller), pp. 847–940. CambridgeUniversity Press, Cambridge, UK.
Cox, P.M., Betts, R.A., Jones, C.D., Spall, S.A. & Totterdell, I.J. (2000) Accel-
eration of global warming due to carbon cycle feedbacks in a coupled climate
model.Nature, 408, 184–187.
Cox, P.M., Harris, P.P., Huntingford, C., Betts, R.A., Collins,M., Jones, C.D.,
Jupp, T.E., Marengo, J.A. & Nobre, C.A. (2008) Increasing risk of Amazo-
nian drought due to decreasing aerosol pollution.Nature, 453, 212–216.
Davidson, E.A., Ishida, F.Y. & Nepstad, D.C. (2004) Effects of an experi-
mental drought on soil emissions of carbon dioxide, methane, nitrous
oxide, and nitric oxide in a moist tropical forest. Global Change Biol-
ogy, 10, 718–730.
Davidson, E.A., Verchot, L.V., Cattanio, J.H., Ackerman, I.L. & Carvalho,
J.E.M. (2000) Effects of soil water content on soil respiration in forests and
cattle pastures of eastern Amazonia.Biogeochemistry, 48, 53–69.
Domingues, T.F., Berry, J.A., Martinelli, L.A., Ometto, J.P.H.B. & Ehleringer,
J.R. (2005) Parameterizations of canopy structure and leaf-level gas
exchange for an eastern Amazonian tropical rain forest (Tapajos National
Forest, Para, Brazil).Earth Interactions, 9, 1–23.
Fisher, R.A., Williams, M., Lola Da Costa, A., Malhi, Y., Da Costa, R.F.,
Almeida, S. & Meir, P. (2007) The response of an eastern Amazonian rain
forest to drought stress: results and modeling analyses from a throughfall
exclusion experiment.Global Change Biology, 13, 2361–2378.
Flexas, J., Bota, J., Loreto, F., Cornic, G. & Sharkey, T.D. (2004) Diffusive
and metabolic limitations to photosynthesis under drought and salinity in
C3 plants.Plant Biology, 6, 269–279.
Flexas, J., Galmes, J., Ribas- Carbo, M. & Medrano, H. (2005) The effects of
water stress on plant respiration. Plant Respiration: From Cell to Ecosystem
(eds H. Lambers & M. Ribas-Carbo), pp. 95–135. Springer, The Nether-
lands.
Gotelli, N.J. & Ellison, A.M. (2004) A primer of ecological statistics. Sinauer
Associates, , Sunderland,MA,U.S.A.
Hanson, P.J. & Wullschleger, S.D. (2003) North American temperate deciduous
forest responses to changing precipitation regimes. Springer-Verlag, New
York, NY,U.S.A.
Harris, P.P., Huntingford, C. & Cox, P.M. (2008) Amazon Basin climate under
global warming: the role of the sea-surface temperature.Philosophical Trans-
actions of the Royal Society of London B, 363, 1753–1759.
Hubbard, R.M., Ryan, M.G. & Lukens, D.L. (1995) A simple, battery-oper-
ated, temperature-controlled cuvette for respiration measurements. Tree
Physiology, 15, 175–179.
Hue, L. (1982) Futile cycles and regulation of metabolism. Metabolic com-
partmentation (ed H. Sies), pp. 71-97. Academic Press, Burlington, MA,
U.S.A.
Hurlbert, S.H. (1984) Pseudoreplication and the design of ecological field exper-
iments.EcologicalMonographs, 54, 187–211.
Hurlbert, S.H. (2004) On misinterpretations of pseudoreplication and related
matters: a reply toOksanen.Oikos, 104, 591–597.
Hutyra, L.R., Munger, J.W., Saleska, S.R., Gottlieb, E., Daube, B.C., Dunn,
A.L., De Camargo, P.B. & Wofsy, S.C. (2007) Seasonal controls on the
exchange of carbon and water in an Amazonian rain forest. Journal of Geo-
physical Research – Biogeosciences, 112, G03008. DOI: 10.1029/
2006JG000365.
Lambers, H. (1997) Respiration and the alternative oxidase. A molecular
approach to primary metabolism in plants (eds C.H. Foyer & W.P. Quick).
pp. 295–309, Taylor & Francis, London, U.K.
Lambers, H., Chapin III, F.S. & Pons, T.L. (1998) Plant physiological ecology.
Springer-Verlag, NewYork, NY,U.S.A.
Malhi, Y., Baldocchi, D.D. & Jarvis, P.G. (1999) The carbon balance of tropi-
cal, temperate and boreal forests.Plant, Cell and Environment, 22, 715–740.
Malhi, Y., Roberts, J.T., Betts, R.A., Killeen, T.J., Li, W. & Nobre, C.A.
(2008) Climate change, deforestation and the fate of the Amazon. Science,
319, 169–172.
McCree, K.J. (1970) An equation for the rate of respiration of white clover
plants under controlled conditions. Prediction and Measurement of Photo-
synthetic Productivity (ed. I. Setlik), pp. 221–229. Pudoc, TheNetherlands.
Meir, P., Grace, J. & Miranda, A.C. (2001) Leaf respiration in two tropical
rainforests: constraints on physiology by phosphorus, nitrogen and tempera-
ture. Functional Ecology, 15, 378–387.
Meir, P., Metcalfe, D.B., Costa, A.C.L. & Fisher, R.A. (2008) The fate of
assimilated carbon during drought: impacts on respiration in Amazon rain-
forests. Philosophical Transactions of the Royal Society-Biological Sciences,
363, 1849–1855.
Metcalfe, D.B., Meir, P., Aragao, L.E.O.C., Malhi, Y., Da Costa, A.C.L.,
Braga, A., Goncalves, P.H.L., De Athaydes, J., De Almeida, S.S. & Wil-
liams, M. (2007) Factors controlling spatio-temporal variation in carbon
dioxide efflux from surface litter, roots, and soil organic matter at four rain
forest sites in the easternAmazon. Journal of Geophysical Research – Biogeo-
sciences, 112, G04001. DOI: 10.1029/2007JG000443.
Miranda, E.J., Vourlitis, G.L., Filho, N.P., Priante, P.C., Campelo, J.H., Jr,
Suli, G.S., Fritzen, C.L., De Almeida Lobo, F. & Shiraiwa, S. (2005) Sea-
sonal variation in the leaf gas exchange of tropical forest trees in the rain for-
est-savanna transition of the southern Amazon basin. Journal of Tropical
Ecology, 21, 451–460.
Mood, A.M., Graybill, F.A. & Boes, D.C. (1974) Introduction to the theory of
statistics.TheMcgraw-Hill Companies, Columbus, OH,U.S.A.
Myneni, R.B., Yang, Y., Ramakrishna, R.N., Huete, A.R., Dickinson, R.E.,
Knyazikhin, Y., Didan, K., Fu, R., Negron Juarez, R.I., Saatchi, S.S.,
Hashimoto, H., Ichii, K., Shabanov, N.V., Tan, B., Ratana, P., Privette,
J.L., Morisette, J.T., Vermote, E.F., Roy, D.P., Wolfe, R.E., Friedl,
M.A., Running, S.W., Votava, P., El-Saleous, N., Devadiga, S., Su, Y. &
Salomonson, V.V. (2007) Large seasonal swings in leaf area of Amazon
rainforests. Proceedings of the National Academy of Sciences, USA, 104,
4820–4823.
Nepstad, D.C, Moutinho, P., Dias-Filho, M.B., Davidson, E., Cardinot, G.,
Markewitz, D., Figueiredo, R., Vianna, N., Chambers, J., Ray, D., Guer-
reiros, J.B., Lefebvre, P., Sternberg, L., Moreira, M., Barros, L, Ishida,
F.Y., Tohlver, I., Belk, E., Kalif, K. & Schwalbe, K. (2002) The effects of
partial throughfall exclusion on canopy processes, aboveground production
and biogeochemistry of an Amazon forest. Journal of Geophysical Research
107, D20, 8085, DOI: 10.1029 ⁄ 2001JD000360.
Osmond, B., Ananyev, G., Berry, J., Langdon, C., Kolber, Z., Lin, G.H.,Mon-
son, R., Nichol, C., Rascher, U., Schurr, U., Smith, S. & Yakir, D. (2004)
Changing the way we think about global change research: scaling up in
experimental ecosystem science.Global Change Biology, 10, 393–407.
Peylin, P., Bousquet, P., Le Quere, C., Sitch, S., Friedlingstein, P., McKinley,
G., Gruber, N., Rayner, P. & Ciais, P. (2005) Multiple constraints on regio-
nal CO2 flux variations over land and oceans. Global Biogeochemical Cycles,
19, GB1011. DOI: 10.1029/2003GB002214.
Phillips, O.L., Malhi, Y., Higuchi, N., Laurance, W.F., Nunez Vargas, P., Vas-
quez Martinez, R., Laurance, S.G., Ferriera, L.V., Stern, M., Brown, S. &
Grace, J. (1998) Changes in the carbon balance of tropical forests: evidence
from long-term plots. Science, 282, 439–442.
� 2010 The Authors. Journal compilation � 2010 British Ecological Society, Functional Ecology, 24, 524–533
532 D. B. Metcalfe et al.
Pons, T.L. & Welschen, R.A.M. (2002) Overestimation of respiration rates in
commercially available clamp-on leaf chambers. Complications with mea-
surement of net photosynthesis.Plant, Cell and Environment, 25, 1367–1372.
Rasmussen, P.W., Heisey, D.M., Nordheim, E.V. & Frost, T.M. (2001) Time
series intervention analysis: unreplicated large-scale experiments.Design and
analysis of ecological experiments (eds S.M. Scheiner & J.Gurevitch), Oxford
University Press, Oxford, U.K.
Reich, P.B., Walters, M.B., Ellsworth, D.S., Vose, J.M., Volin, J.C., Gresham,
C. & Bowman, W.D. (1998) Relationships of leaf dark respiration to leaf
nitrogen, specific leaf area and leaf life-span: a test across biomes and func-
tional groups.Oecologia, 114, 471–482.
Roedenbeck, C., Howling, S., Gloor, M. & Heimann, M. (2003) CO2 flux his-
tory 1982-2001 inferred from atmospheric data using a global inversion of
atmospheric transport.Atmospheric Chemistry and Physics, 3, 1914–1964.
Saleska, S.R., Miller, S.D., Matross, D.M., Goulden, M.L., Wofsy, S.C., Da
Rocha, H.R., De Camargo, P.B., Crill, P., Daube, B.C., De Freitas, H.C.,
Hutyra, L., Keller, M., Kirchhoff, V., Menton, M., Munger, J.W., Pyle,
E.H., Rice, A.H. & Silva, H. (2003) Carbon in Amazon forests: unexpected
seasonal fluxes and disturbance-induced losses. Science, 302, 1554–1557.
Santiago, L.S. & Mulkey, S.S. (2003) A test of gas exchange measurements on
excised canopy branches of ten tropical tree species. Photosynthetica, 41,
343–347.
Schwendenmann, L., Veldkamp, E., Brenes, T., O’Brien, J.J. & Mackensen, J.
(2003) Spatial and temporal variation in soil CO2 efflux in an old-growth
neotropical rain forest, La Selva, Costa Rica.Biogeochemistry, 64, 111–128.
Sotta, E.D., Meir, P., Malhi, Y., Nobre, A.D., Hodnett, M. & Grace, J. (2004)
Soil CO2 efflux in a tropical forest in the central Amazon. Global Change
Biology, 10, 601–617.
Sotta, E.D., Veldkamp, E., Schwendenmann, L., Guimaraes, B.R., Paixao,
R.K., Ruivo, M.L.P., Da Costa, A.C.L. & Meir, P. (2007) Effects of an
induced drought on soil carbon dioxide (CO2) efflux and soil CO2 produc-
tion in an eastern Amazonian rainforest, Brazil. Global Change Biology, 13,
2218–2229.
Stokstad, E. (2005) Experimental drought predicts grim future for rainforest.
Science, 308, 346–347.
Sullivan, T.J. (1997) Ecosystem manipulation experimentation as a means
of testing a biogeochemical model. Environmental Management, 21, 15–
21.
Tian, H., Melillo, J.M., Kicklighter, D.W., McGuire, A.D., Helfrich, J.V.K.,
III, Moore, B., III & Vorosmarty, C.J. (1998) Effect of interannual variabil-
ity on carbon storage inAmazonian ecosystems.Nature, 396, 664–667.
Underwood, A.J. (1997) Experiments in ecology: their logical design and inter-
pretation using analysis of variance. Cambridge University Press, Cambridge,
U.K.
Vourlitis, G.L., De Souza Nogueira, J., Filho, N.P., Hoeger, W., Raiter, F.,
Biudes, M.S., Arruda, J.C., Capistrano, V.B., De Faria, J.L.B. & De
Almeida Lobo, F. (2005) The sensitivity of diel CO2 and H2O vapor
exchange of a tropical transitional forest to seasonal variation in meteorol-
ogy andwater availability.Earth Interactions, 9, 1–23.
Werth, D. &Avissar, R. (2002) The local and global effects of Amazon defores-
tation. Journal of Geophysical Research, 107, D20. DOI: 10.1029/
2001JD000717.
Witkowski, E.T.F. & Lamont, B.B. (1991) Leaf specific mass confounds leaf
density and thickness.Oecologia, 88, 486–493.
Wright, I.J., Reich, P.B., Atkin, O.K., Lusk, C.H., Tjoelker, M.G. &Westoby,
M. (2006) Irradiance, temperature and rainfall influence leaf dark respira-
tion in woody plants: evidence from comparisons across 20 sites. New Phy-
tologist, 169, 309–319.
Wurth, M.K.R., Pelaez-Riedl, S., Wright, S.J. & Korner, C. (2005) Non-struc-
tural carbohydrate pools in a tropical forest.Oecologia, 143, 11–24.
Zeng,N.,Mariotti, A. &Wetzel, P. (2005) Terrestrialmechanisms of interannu-
al CO2 variability. Global Biogeochemical Cycles, 19, GB1016. DOI:
10.1029/2004GB002273.
Received 6 July 2009; accepted 14December 2009
Handling Editor: DavidWhitehead
� 2010 The Authors. Journal compilation � 2010 British Ecological Society, Functional Ecology, 24, 524–533
Drought affects rain forest leaf respiration 533
Related Documents