HAL Id: tel-02136222 https://tel.archives-ouvertes.fr/tel-02136222 Submitted on 21 May 2019 HAL is a multi-disciplinary open access archive for the deposit and dissemination of sci- entific research documents, whether they are pub- lished or not. The documents may come from teaching and research institutions in France or abroad, or from public or private research centers. L’archive ouverte pluridisciplinaire HAL, est destinée au dépôt et à la diffusion de documents scientifiques de niveau recherche, publiés ou non, émanant des établissements d’enseignement et de recherche français ou étrangers, des laboratoires publics ou privés. Impacts of educational mismatches in developing countries with a focus on Cambodia Vichet Sam To cite this version: Vichet Sam. Impacts of educational mismatches in developing countries with a focus on Cambodia. Economics and Finance. Université Grenoble Alpes, 2018. English. NNT : 2018GREAA012. tel- 02136222

Welcome message from author
This document is posted to help you gain knowledge. Please leave a comment to let me know what you think about it! Share it to your friends and learn new things together.
Transcript
HAL Id: tel-02136222https://tel.archives-ouvertes.fr/tel-02136222
Submitted on 21 May 2019
HAL is a multi-disciplinary open accessarchive for the deposit and dissemination of sci-entific research documents, whether they are pub-lished or not. The documents may come fromteaching and research institutions in France orabroad, or from public or private research centers.
L’archive ouverte pluridisciplinaire HAL, estdestinée au dépôt et à la diffusion de documentsscientifiques de niveau recherche, publiés ou non,émanant des établissements d’enseignement et derecherche français ou étrangers, des laboratoirespublics ou privés.
Impacts of educational mismatches in developingcountries with a focus on Cambodia
Vichet Sam
To cite this version:Vichet Sam. Impacts of educational mismatches in developing countries with a focus on Cambodia.Economics and Finance. Université Grenoble Alpes, 2018. English. �NNT : 2018GREAA012�. �tel-02136222�

THÈSE
Pour obtenir le grade de
DOCTEUR DE LA
COMMUNAUTÉ UNIVERSITÉ GRENOBLE ALPES
Spécialité : Doctorat Sciences Économiques
Arrêté ministériel : 25 mai 2016
Présentée par Vichet Sam
Thèse dirigée par Mme Mareva Sabatier
Préparée au sein du laboratoire IREGE – Université Savoie Mont Blanc
Dans l’Ecole Doctorale SISEO
Impacts des inadéquations en termes
d’éducation aux pays en développement
avec une attention sur le Cambodge
Thèse soutenue publiquement le 15 octobre 2018,
Devant le jury composé de :
Mme Mareva Sabatier
Professeur, Université Savoie Mont Blanc
Directrice de thèse
M. Jean-Yves Lesueur
Professeur, Université Lumière Lyon 2
Président du jury et Rapporteur
M. Jean-François Giret
Professeur, Université de Bourgogne
Rapporteur
Mme Lisa Chauvet
Chercheuse, Institut de recherche pour le développement (IRD)
Suffragante
Mme Bérangère Legendre
Maître de conférences HDR, Université Savoie Mont Blanc
Suffragante

”This page is intentionally left blank.”
Contents
List of Tables iii
List of Figures v
Acknowledgments vii
Resume ix
Summary xvii
Preliminary Chapter 1
1 Introduction . . . . . . . . . . . . . . . . . . . . . . . . . . . . . . . . 1
2 Literature review . . . . . . . . . . . . . . . . . . . . . . . . . . . . . 5
2.1 Measures of educational mismatches . . . . . . . . . . . . . . 5
2.2 Determinants of educational mismatches . . . . . . . . . . . . 12
2.3 Impacts of educational mismatches . . . . . . . . . . . . . . . 19
3 Mismatches in developing countries and their specificity . . . . . . . . 32
4 Data, research questions and methods . . . . . . . . . . . . . . . . . . 51
5 Thesis contributions . . . . . . . . . . . . . . . . . . . . . . . . . . . 57
Appendices 58
I Unemployment duration and educational mis-
matches: A theoretical and empirical investi-
gation among graduates in Cambodia 67
1 Introduction . . . . . . . . . . . . . . . . . . . . . . . . . . . . . . . . 68
2 Theoretical model framework . . . . . . . . . . . . . . . . . . . . . . 71
2.1 Value function of a vacant and a filled job . . . . . . . . . . . 71
2.2 Value function of unemployment and employment . . . . . . . 72
i

3 Data and descriptive statistics . . . . . . . . . . . . . . . . . . . . . . 75
4 Methods and results . . . . . . . . . . . . . . . . . . . . . . . . . . . 79
5 Conclusion . . . . . . . . . . . . . . . . . . . . . . . . . . . . . . . . . 86
Appendices 87
II Overeducation and horizontal mismatch: A
double wage penalty for graduates in Cambo-
dia? 89
1 Introduction . . . . . . . . . . . . . . . . . . . . . . . . . . . . . . . . 90
2 Data and descriptive statistics . . . . . . . . . . . . . . . . . . . . . . 94
2.1 Measuring educational mismatches . . . . . . . . . . . . . . . 94
2.2 Descriptive statistics . . . . . . . . . . . . . . . . . . . . . . . 97
3 Method and results . . . . . . . . . . . . . . . . . . . . . . . . . . . . 99
4 Conclusion . . . . . . . . . . . . . . . . . . . . . . . . . . . . . . . . . 106
Appendices 107
IIIOvereducation among graduates in developing
countries: What impact on economic growth? 109
1 Introduction . . . . . . . . . . . . . . . . . . . . . . . . . . . . . . . . 110
2 Data . . . . . . . . . . . . . . . . . . . . . . . . . . . . . . . . . . . . 114
2.1 Macro data . . . . . . . . . . . . . . . . . . . . . . . . . . . . 116
2.2 Micro data . . . . . . . . . . . . . . . . . . . . . . . . . . . . . 117
3 Descriptive statistics . . . . . . . . . . . . . . . . . . . . . . . . . . . 120
4 Method and Results . . . . . . . . . . . . . . . . . . . . . . . . . . . 123
4.1 Method . . . . . . . . . . . . . . . . . . . . . . . . . . . . . . 123
4.2 Results . . . . . . . . . . . . . . . . . . . . . . . . . . . . . . . 127
5 Conclusion . . . . . . . . . . . . . . . . . . . . . . . . . . . . . . . . . 130
Appendices 133
General Conclusion 135
References 141
ii

List of Tables
I.1 Association of unemployment duration and educational mismatches . 74
I.2 Correspondence between occupational class and educational level . . 76
I.3 Description of educational level required for each skill level . . . . . . 76
I.4 Unemployment duration and educational mismatches . . . . . . . . . 77
I.5 Unemployment duration by graduates’ attributes . . . . . . . . . . . 78
I.6 Results . . . . . . . . . . . . . . . . . . . . . . . . . . . . . . . . . . . 81
I.7 Educational mismatches and unemployment hazards . . . . . . . . . . 83
I.8 Field of education and matching jobs . . . . . . . . . . . . . . . . . . 88
II.1 Incidence of educational mismatches . . . . . . . . . . . . . . . . . . 95
II.2 Descriptive statistics . . . . . . . . . . . . . . . . . . . . . . . . . . . 97
II.3 Results . . . . . . . . . . . . . . . . . . . . . . . . . . . . . . . . . . . 101
II.4 Observed and estimated wages (logarithms) . . . . . . . . . . . . . . 104
II.5 Correspondence between occupational class and educational level . . 107
II.6 Description of educational level required for each skill level . . . . . . 107
III.1 Variables and data sources . . . . . . . . . . . . . . . . . . . . . . . . 118
III.2 Descriptive statistics . . . . . . . . . . . . . . . . . . . . . . . . . . . 120
III.3 Test for endogeneity of overeducation . . . . . . . . . . . . . . . . . . 124
III.4 Test for the quality of instrument . . . . . . . . . . . . . . . . . . . . 125
III.5 Variance inflation factor . . . . . . . . . . . . . . . . . . . . . . . . . 125
III.6 Test for time effects . . . . . . . . . . . . . . . . . . . . . . . . . . . . 126
III.7 Impact of graduates’ overeducation on economic growth . . . . . . . . 127
III.8 Percentage of overeducated graduates by regions, countries and years 131
III.9 Correspondence between occupational class and educational level . . 133
III.10Description of educational level required for each skill level . . . . . . 133
iii

”This page is intentionally left blank.”
iv

List of Figures
1 School life expectancy* (number of years) in selected regions . . . . . 1
2 Gross enrollment ratio in tertiary education (%) in selected regions . 2
3 GDP growth (annual %) in selected regions . . . . . . . . . . . . . . 2
4 Average incidence of overeducation (%) in selected developed countries 10
5 Average incidence of horizontal mismatches (%) in selected developed
countries . . . . . . . . . . . . . . . . . . . . . . . . . . . . . . . . . . 10
6 Evolution of average overeducation rate (%) in European countries (job
analysis measure) . . . . . . . . . . . . . . . . . . . . . . . . . . . . . 11
7 Evolution of average overeducation rate (%) in European countries (sta-
tistical analysis measure) . . . . . . . . . . . . . . . . . . . . . . . . . 11
8 Compared average incidence of overeducation (worker-self-assessment)
(%) . . . . . . . . . . . . . . . . . . . . . . . . . . . . . . . . . . . . . 33
9 Incidence of overeducation (worker-self-assessment) in developing coun-
tries (%) . . . . . . . . . . . . . . . . . . . . . . . . . . . . . . . . . . 33
10 Incidence of overeducation among youth (job analysis) in developing
countries (%) . . . . . . . . . . . . . . . . . . . . . . . . . . . . . . . 34
11 Incidence of horizontal mismatches (worker-self-assessment) in devel-
oping countries (%) . . . . . . . . . . . . . . . . . . . . . . . . . . . . 35
12 Compared average incidence of horizontal mismatches (worker-self-assessment)
(%) . . . . . . . . . . . . . . . . . . . . . . . . . . . . . . . . . . . . . 35
13 Cambodia: Key economic indicators 2015 . . . . . . . . . . . . . . . . 40
14 Number of HEI in Cambodia . . . . . . . . . . . . . . . . . . . . . . 41
15 Number and ratio (%) of enrollment in tertiary education in Cambodia 41
16 Unemployment rate (%) by level of education in 2012* . . . . . . . . 43
17 Government expenditure on education (% GDP) . . . . . . . . . . . . 44
v
18 Number of researchers per million people and Research & Development
expenditure (% of GDP) in 2013/2015* . . . . . . . . . . . . . . . . . 44
19 Dissatisfaction of employers with the skills of college graduates (%) . 46
20 Student enrollment by fields of education in Cambodia in 2011 . . . . 46
21 Evolution of Cambodia’s economic sectors, value added (% of GDP) . 47
22 Graduates by fields of education (%) in Cambodia and in some ASEAN
countries in 2015* . . . . . . . . . . . . . . . . . . . . . . . . . . . . . 47
23 Manufacturing sector (% of GDP) and Graduates in Engineering, Man-
ufacturing & Construction (%) in 2015* . . . . . . . . . . . . . . . . . 48
24 Corruption Perceptions Index in ASEAN countries in 2017 . . . . . . 49
25 Structure of the thesis . . . . . . . . . . . . . . . . . . . . . . . . . . 56
III.1 Overeducation rate among tertiary graduates across regions . . . . . 119
III.2 Relation between overeducation and economic growth . . . . . . . . . 121
vi
Acknowledgments
I wish to sincerely thank all people who have contributed to this thesis.
Foremost, I would like to express my deep gratitude to my supervisor, Professor
Mareva Sabatier, for her kindness to accept my candidature to pursue my PhD degree,
and for being the supervisor that every doctoral student wishes to have. Since the
beginning of my research, she has supported me in every possible way, including
writing letters to the French embassy in Cambodia requesting for financial aids for
my thesis. Without these supports and her guidance through fruitful comments and
insightful suggestions, my thesis would have never come out in the present form.
I would like to express my sincere gratitude as well to all the jury members for
their attentive reading of my thesis and for the helpful remarks to improve my work.
I am indebted to the research laboratory ”Institut de Recherche en Gestion et
Economie” (IREGE) and the IAE Savoie Mont-Blanc for hosting me, and particularly
Gersende and Muriel for their administrative assistance.
I am grateful for the scholarship that the French embassy in Cambodia and
Campus France provide to me so that I can come to France six months a year for
conducting this doctoral research, and participating in different seminars or training
organized by IREGE and the Grenoble-Alpes university.
I wish to express my heartfelt love to my mother, KET Nary, for teaching me
at an early age the value of education and encouraging me to pursue my study to a
high level. Even though she has passed away for twenty years, her advice and all the
memories remain forever in my mind. I do not forget my father, SAM Thonn, who
has never been tired to be my constant source of moral and financial supports, which
allows me arriving at this stage of life.
Lastly, I wish to thank the other members of my family and my friends for their
encouragement, especially, my stepmother, HE Sam Ol, my cousin, HAK Sopheap,
and my girlfriend, KY Mei Ling, for their loves and cares.
vii

”This page is intentionally left blank.”
viii

Resume
La theorie de la croissance endogene (Lucas, 1988) mentionne l’education comme
un facteur cle dans la stimulation du developpement economique. La vision de cette
theorie influence tous les pays du monde a investir dans l’education. En consequence,
tous les niveaux d’education, y compris l’enseignement superieur, ont connu une aug-
mentation rapide de taux de scolarisation au cours des dernieres decennies. Dans les
pays en developpement par exemple, le taux brut de scolarisation dans l’enseignement
superieur est passe de seulement 6% en 1970 a 31% en 2016 (Banque Mondiale1).
Le Cambodge, un pays en Asie du Sud-Est et qui vient de passer son statut
d’un pays a faible revenu au pays a revenu intermediaire inferieur en 2016, n’est pas
exceptionnel : son taux de scolarisation dans l’enseignement superieur est rapidement
passe de 2,5% en 2000 a 15,9% en 2011 (Banque Mondiale2). Cependant, il existe des
inquietudes sur l’employabilite des diplomes qui semblent avoir de plus en plus des
peines a trouver des emplois correspondant a leur niveau et domaine d’etudes, ce que
l’on appelle les inadequations verticales et horizontales.
Le Cambodge represente, en effet, un cas d’etude interessant compte tenu de son
histoire tragique : durant le regime des Khmers rouges entre 1975 et 1979, 1,7 million
d’habitants, surtout des personnes eduquees, sur 7,3 millions de population etaient
morts,3 et le pays vient de pouvoir commencer a reconstruire son systeme educatif en
1998 apres trois decennies de guerre civile. En outre, aucune etude anterieure sur les
inadequations entre l’education et l’emploi n’a analyse un pays a faible revenu comme
le Cambodge.
1Source : https://data.worldbank.org/indicator/SE.TER.ENRR?locations=XO2Source : https://data.worldbank.org/indicator/SE.TER.ENRR?locations=KH3Source : https://en.wikipedia.org/wiki/Khmer Rouge Killing Fields
ix

Cette these, qui s’inscrit dans le champ de l’economie du travail et de l’education,
vise a examiner l’impact des inadequations educatives au sein des diplomes
universitaires dans les pays en developpement, avec une attention speciale
sur le cas du Cambodge.
Trois articles, qui constituent trois chapitres de cette these, cherchent a repondre
a trois questions. Deux chapitres sont analyses au niveau microeconomique sur la
relation entre la duree du chomage et les inadequations educatives (chapitre 1),
et l’impact des inadequations sur le salaire (chapitre 2) avec le cas du Cambodge.
Le dernier chapitre, qui s’ouvre au niveau plus international et macroeconomique,
analyse l’impact des inadequations educatives sur la croissance economique
dans trente-huit pays en developpement. Chaque chapitre est brievement decrit ci-
dessous :
Le chapitre 1 examine si les risques des inadequations entre l’education et
l’emploi augmentent ou diminuent la duree du chomage des diplomes universitaires au
Cambodge. Ce chapitre etudie aussi les facteurs qui influencent la duree du chomage
en tenant compte de differents types d’emplois (l’emploi associe a une adequation
d’education, celui associe a une inadequation verticale ou horizontale, ou avec une
double inadequation).
Theoriquement, l’analyse de l’impact des inadequations educatives sur la duree
du chomage n’aboutit pas a un consensus. Plusieurs theories s’affrontent :
� La theorie de la recherche d’emploi (Jovanovic, 1979) suppose que les chercheurs
d’emploi ne peuvent acceder qu’a des informations imparfaites sur les offres
d’emploi disponibles. Il leur faut donc du temps pour trouver un bon emploi.
Ainsi, ils font face a deux choix alternatifs : accepter la premiere offre d’emploi
qui pourrait etre inadequate a leur qualification ou continuer a trouver un emploi
plus adequat, et subir des couts de recherche.
De meme, dans la theorie de la mobilite de carriere (Sicherman & Galor, 1990),
certains demandeurs d’emploi, en particulier les jeunes, pourraient preferer un
emploi initialement inadequat pour acquerir des competences specifiques liees a
l’emploi, afin d’obtenir une meilleure evolution de carriere plus tard.
x
Par consequent, en basant sur ces deux theories, les risques d’inadequation
educative devraient diminuer la duree du chomage.
� En revanche, McCormick (1990) stipule que l’acceptation d’un emploi incom-
patible a la qualification est un signal negatif plus fort aux employeurs que le
chomage concernant la productivite des travailleurs. Ainsi, les individus peuvent
preferer rester au chomage et attendent un emploi correspondant a leur qualifi-
cation. Cependant, si les opportunites d’emplois sont limitees et les travailleurs
sont heterogenes selon le modele de concurrence d’emploi de Thurow (1976), il
est possible que certains travailleurs ne parviennent pas a trouver une position
adequate et restent au chomage pour une duree plus longue. Cela concerne par-
ticulierement les travailleurs moins competents qui restent probablement plus
longtemps dans la file d’attente d’un emploi et sont affectes a un emploi plus
indesirable (ou plus inadequat) que les travailleurs plus competents.
Donc, le risque des inadequations educatives pourrait s’associer aussi a une
duree du chomage plus longue.
L’incertitude theorique quant a l’effet des inadequations sur la duree du chomage
n’est pas levee par les etudes empiriques. Pendant que Cuesta (2005) et Pollmann-
Schult & Buchel (2005) trouvent que les risques d’inadequation verticale (sureducation)
diminuent la duree du chomage pour les cas d’Espagne et d’Allemagne, Rose & Or-
dine (2010), Barros et al. (2011) et Lin & Hsu (2013) trouvent que les risques de
sureducation augmentent respectivement la duree du chomage en Italie, en France et
au Taiwan. En outre, aucune etude empirique n’a donne d’eclairage sur le cas des
pays en developpement.
Ainsi, ce chapitre contribue a la litterature sur trois points principaux :
� Premierement, nous etendons la recherche a un pays en developpement, a savoir
le Cambodge, qui semble faire face a une preoccupation majeure concernant les
inadequations d’education et les risques au chomage des diplomes universitaires.
En effet, en 2012, le taux de chomage des diplomes universitaires etait de 7,7%
contre 2,7% des personnes n’ayant qu’un niveau d’education secondaire (NIS,
2012).
xi

� Deuxiemement, nous tenons compte l’endogeneite des inadequations educatives
et considerons ces inadequations dans les deux formes et toutes les dimensions
(verticales ou horizontales, une seule ou une double inadequation).
� Troisiemement, nous proposons une analyse sous deux angles : 1- un modele
theorique reliant les inadequations educatives et la duree du chomage, et 2-
un modele empirique testant la prediction theorique en utilisant un modele de
duree a des risques concurrents independants, applique sur une enquete en 2011,
provenant de dix-neuf universites au Cambodge.
Les resultats econometriques, en tenant compte l’endogeneite des inadequations,
soulignent que les risques d’inadequations educatives augmentent la duree du chomage.
Ceci suggere que les diplomes preferent attendre un travail plus adequat mais n’arrivent
pas a le trouver, probablement en raison du manque d’offre d’emplois qualifies, et de
l’inefficacite du systeme de l’education qui ne developpe pas bien les competences pro-
fessionnelles des diplomes, exigees par le marche du travail. Les resultats mettent aussi
en evidence les facteurs qui influencent la duree du chomage : le genre, les domaines
d’etudes, le stage, l’utilisation du reseau d’emplois informel, le niveau d’education des
parents et les preferences des diplomes pour les differentes caracteristiques d’emplois.
Pourtant, ces determinants affectent la duree du chomage de maniere differente en
fonction du type d’emploi (l’emploi associe a une adequation d’education, a une
inadequation verticale ou horizontale, ou avec une double inadequation).
Ayant observe que la duree du chomage n’est pas une seule consequence possible,
il est interessant pour le prochain chapitre d’analyser aussi l’impact des inadequations
d’education sur le salaire des diplomes.
Le chapitre 2 examine si les inadequations educatives diminuent les salaires
individuels et si l’impact est plus fort lorsque les diplomes souffrent des deux types
d’inadequations (verticales et horizontales).
Du point de vue theorique, il existe un consensus sur l’impact negatif des
inadequations sur le salaire. Deux mecanismes theoriques expliquent cet impact selon
que les diplomes travaillent dans un emploi inadequat en raison de leurs preferences
d’une part ou du manque d’opportunites d’emploi dans le marche du travail d’autre
part :
xii

� Premierement, les travailleurs preferaient un emploi inadequat avec des salaires
offerts plus bas en compensation pour les autres attributs d’emploi tels que les
perspectives de carriere et la promotion (Sicherman & Galor, 1990) ou moins
de pressions et de stress dans le travail (McGuinness & Sloane, 2011).
� Deuxiemement, les travailleurs acceptent un travail incompatible parce qu’ils
n’ont pas d’autres choix car les opportunites d’emploi sont limitees (Thurow,
1976 ; Sattinger, 1993). En outre, ce type d’emploi ne leur permet pas d’exploiter
leurs competences potentielles, et par consequent, ils seraient moins productifs
et gagneraient moins que s’ils etaient employes dans une occupation appariee a
leur qualification (Thurow, 1976 ; Sattinger, 1993).
Pourtant, trois limites existent dans les etudes empiriques. D’abord, il n’existe
pas de consensus meme si la plupart des recherches trouvent une penalite salariale en
consequence du travail dans un emploi incompatible (voir les revues de litterature de
Leuven et al., 2011 et McGuinness et al., 2017). Deuxiemement, peu de recherches
sur les pays en developpement : les etudes existantes sur les effets des inadequations
sur les salaires dans les pays en developpement peuvent se referer a Quinn & Rubb
(2006), Filiztekin (2011), Herrera-Idarraga et al. (2015), Reis (2017) et Pholphirul
(2017) qui trouvent des penalites salariales d’inadequations educatives au Mexique,
en Turquie, en Colombie, au Bresil et en Thailande, respectivement.4 Troisiemement,
il n’existe pas encore dans la litterature la prise en compte de l’endogeneite dans la
combinaison des deux types d’inadequations.
Ainsi, ce chapitre contribue a la litterature en trois points principaux :
� Premierement, il analyse un autre cas de pays en developpement, le Cambodge,
qui vient de passer d’un pays a faible revenu a un pays a revenu moyen inferieur,
alors que les etudes existantes concernent des pays relativement plus avances.
� Deuxiemement, il analyse les effets combines des inadequations verticales et
horizontales que les recherches precedentes dans les pays en developpement n’ont
pas encore traites.
4Seulement Pholphirul (2017) qui etudie egalement les effets des inadequations horizontales, maissans combiner les deux formes d’inadequations (le cas d’une double inadequation). Les autres seconcentrent uniquement sur la forme verticale.
xiii

� Troisiemement, pendant que la plupart des recherches precedentes supposent
que les inadequations soient exogenes (Tsai, 2010), nous prenons en compte le
probleme du biais de selection en proposant un modele de Heckman ordonne.
Ce modele de regression est applique sur des donnees d’enquetes financees par
la Banque Mondiale, dans lesquelles l’auteur de cette these a ete implique
en tant que chef d’equipe dans la collecte de donnees de huit etablissements
d’enseignement superieur au Cambodge en 2014.
Les resultats econometriques nous permettent de conclure que le niveau des
inadequations educatives5 depend des attributs individuels, des caracteristiques de
l’etude et de l’education des parents. Une penalite salariale persiste pour les diplomes
qui souffrent les inadequations educatives meme en tenant compte de ce processus de
selectivite. Cette penalite est beaucoup plus forte lorsque les inadequations verticales
et horizontales sont combinees. Ce resultat est coherent avec l’etude de Robst (2008)
qui trouve egalement qu’une penalite salariale importante existe parmi les diplomes
qui subissent une double inadequation aux Etats-Unis.
Apres avoir analyse les impacts microeconomiques des inadequations educatives
au Cambodge, nous proposons d’etudier ces impacts a un niveau macroeconomique
et plus international.
Le chapitre 3 examine l’impact de la sureducation sur la croissance economique
a court terme d’un an et a moyen terme de cinq ans au sein de trente-huit pays en
developpement.
D’un point de vue theorique, deux approches s’affrontent:
� Le modele de Job Assignment (Sattinger, 1993) etablit que la productivite d’un
travailleur depend a la fois des attributs du travail et des caracteristiques de
l’individu. Par consequent, les travailleurs sureduques sont plus productifs que
leurs collegues dans le meme emploi. En outre, un nombre important des tra-
vailleurs sureduques dans le marche du travail pourrait inciter les employeurs a
creer des emplois plus qualifies afin d’exploiter les competences de ces travailleurs
(Acemoglu, 1999). Donc, toutes ces consequences contribuent positivement a la
5Le niveau est divise en trois : 1- une adequation, 2- une inadequation verticale ou horizontale,et 3- une double inadequation.
xiv

croissance economique.
� En revanche, Tsang & Levin (1985) stipulent que les travailleurs sureduques
peuvent etre insatisfaits de leur travail, ce qui induit des comportements contre-
productifs tels que des taux eleves d’absenteisme et de roulement. En outre,
le manque de plaisir dans le travail peut egalement deteriorer la sante mentale
des travailleurs (Kornhauser, 1965 ; Artes et al., 2014). Par consequent, ces
problemes peuvent limiter le developpement de l’entreprise, et donc cela est
negatif pour la croissance economique.
Il n’existe que quelques articles qui analysent empiriquement les impacts de la
sureducation sur la croissance economique, et ces articles n’aboutissent a aucun con-
sensus. Ainsi, pendant que Guironnet & Jaoul-Grammare (2009) trouvent un effet
negatif de la sureducation des diplomes universitaires sur la croissance economique
a court terme en France, Ramos et al. (2012) trouvent un impact positif de la
sureducation sur la croissance economique a moyen terme dans neuf pays europeens.6
Le manque d’analyse des inadequations educatives au niveau macroeconomique
peut etre lie au manque de donnees sur les inadequations au niveau agrege. Pour
pallier a cette difficulte, nous avons cree une base de donnees en associant des donnees
micro et macro. Les donnees de l’enquete ”Integrated Public Use Microdata Series
International” (IPUMSI) ont ete utilisees pour calculer le taux de sureducation par
pays. Ensuite, ces donnees ont ete couplees avec des donnees macro de la Banque
Mondiale.
Ainsi, ce chapitre contribue a la litterature en trois points principaux :
� Premierement, ce chapitre contribue en termes de donnees sur le taux de sur-
education dans des differents pays en developpement.
� Deuxiemement, grace a ces donnees calculees, cet article peut etendre l’analyse
des impacts de la sureducation au niveau macroeconomique sur des pays en
developpement.
� Troisiemement, ce chapitre traite egalement l’heterogeneite non observee des
pays et l’endogeneite de la sureducation qui n’ont pas ete entierement resolues
6Ces pays sont: l’Autriche, la France, la Grece, l’Italie, le Portugal, la Roumanie, la Slovenie,l’Espagne et le Royaume-Uni.
xv
dans la litterature anterieure, en employant la methode des moindres carres en
deux etapes (two-stage least squares regression) avec des effets fixes.
Les resultats econometriques indiquent que la sureducation a des effets negatifs
sur la croissance economique a court et moyen termes. Ce resultat est plus conforme
a ”l’approche de la satisfaction au travail” qu’a ”l’approche du capital humain”,
suggerant que l’expansion du secteur de l’enseignement superieur dans les pays en
developpement doit prendre en compte le processus des inadequations d’education-
emploi pour bien exploiter les benefices de l’education tertiaire.
Mots cles:
Chapitre 1: Inadequations verticales et horizontales, duree du chomage, modele
d’appariement d’emploi, modele de duree a des risques concurrentes independantes.
Codes JEL: I23, J24, J64.
Chapitre 2: Inadequations verticales et horizontales, ecarts de salaires, modele Heck-
man ordonne.
Codes JEL: I23, I26, J24, J31.
Chapitre 3: Sureducation, croissance economique, regression par les moindres carres
en deux etapes avec des effets fixes.
Codes JEL: I23, I25, J24.
xvi

Summary
The endogenous growth theory (Lucas, 1988) mentions education as a key factor
in boosting economic development. This view influences all countries across the world
to invest in education sector. As a result, all educational levels including tertiary
education, have known a rapid increase in enrollment rate in the last few decades.
For instance, in developing countries, the gross enrollment ratio in tertiary education
has increased from just 6% in 1970 to 31% in 2016 (World Bank’s website7).
Cambodia, a country in Southeast-Asia that has just moved from the low-
income status to lower middle income country at mid-2016, is not exceptional: The
enrollment rate in higher education has risen rapidly from 2.5% in 2000 to 15.9%
in 2011 (World Bank’s website8). Nevertheless, concerns on the graduates’ employa-
bility exist: University graduates seem to be more and more struggled to find jobs,
which corresponds to their level and field of education, the so-called vertical and
horizontal mismatches.
Cambodia represents an interesting study case given his tragic history in which
1.7 million, mostly educated people, out of 7.3 million population were died during
the Khmer rouge regime from 1975 to 1979,9 and the country has just been able to
fully focus on rebuilding its education system since 1998 after the end of three decades
civil war. Additionally, no previous study on education-job mismatches has analyzed
a low-income country yet.
This thesis, written in the field of labor and education economics, aims
at examining the impacts of educational mismatches among graduates in
developing countries with a special attention to the Cambodia’s case.
7Data link: https://data.worldbank.org/indicator/SE.TER.ENRR?locations=XO8Data link: https://data.worldbank.org/indicator/SE.TER.ENRR?locations=KH9Data source: https://en.wikipedia.org/wiki/Khmer Rouge Killing Fields
xvii
In this thesis, three articles, constituting three chapters, seek to answer three
research questions. Two chapters examine, at microeconomics level, the relation
between unemployment duration and educational mismatches (chapter 1),
and the impact of mismatches on wages (chapter 2) within the context of Cam-
bodia. The last chapter, which opens to more international and macroeconomics
level, analyzes the impact of vertical mismatch (overeducation) on economic
growth in thirty-eight developing countries. Each chapter is briefly described below:
Chapter 1 examines whether education-job mismatches increase or decrease
unemployment duration among graduates in Cambodia. We also investigate what
are the factors that influence the unemployment duration when we take into account
different types of job (match, vertical mismatch, horizontal mismatch or double mis-
matches).
Theoretically, the analysis of the mismatches impacts on the unemployment
duration does not result in a consensus. Several theories challenge each other:
� The job search theory (Jovanovic, 1979) assumes that job seekers can only access
to limited information about the available job opportunities. They must thus
spend certain time to find a decent job. Therefore, they face two alternative
choices between accepting the first job offer that can be mismatched to their
qualification or continuing to find a better suitable job, which is costly in terms
of foregone income for staying unemployed and searching costs.
Similarly, in the career mobility theory (Sicherman & Galor, 1990), some job
seekers, especially the young persons, may prefer to work in an initially mis-
matched occupation to learn some specific skills related to the job, necessary
for a better career promotion in the future.
Consequently, educational mismatches should decrease unemployment duration
based on these two theories.
� In contrast, McCormick (1990) stipulates that accepting a mismatched job can
be a stronger negative signal to employers than unemployment regarding a
worker’s productivity. Thus, individuals may prefer to stay unemployed and
wait for a job that matches their qualification. However, as assumed by the
xviii
job competition model (Thurow, 1976) that workers are heterogeneous and the
job opportunities are limited, it is possible that some workers may fail to find a
matched position and stay unemployed for a longer duration. This notably con-
cerns the less competent workers, staying at the end of the labor’s queue, who
will be the last persons to be assigned to a job (longer unemployment duration)
that is also more likely undesirable (higher risks of mismatches) than the job
assigned to competent workers at the top of the queue.
Consequently, educational mismatches can also be positively correlated with
unemployment duration in this case.
The theoretical uncertainty on the effects of mismatches on the unemployment
duration is not resolved by the empirical studies. While Cuesta (2005) and Pollmann-
Schult & Buchel (2005) find that vertical mismatch (overeducation) decreases the
unemployment duration in Spain and Germany, Rose & Ordine (2010), Barros et al.
(2011) and Lin & Hsu (2013) find that overeducation increases the unemployment
duration in Italy, France and Taiwan, respectively.
Hence, this first chapter contributes to the literature in three main points:
� First, we extend the research into a developing country, namely Cambodia, that
seems to face a serious concern of educational mismatches and unemployment
risks among university graduates. For instance, in 2012, the unemployment
rate among university graduates was 7.7% against 2.7% of people with only
secondary education (NIS, 2012).
� Second, we take into account the endogeneity of educational mismatches and
consider them in their both forms and all dimensions: Vertical or horizontal,
single or double mismatches.
� Third, we propose an analysis from two angles: 1- A theoretical model linking
educational mismatches and unemployment duration, and 2- an empirical model
allows testing the theoretical prediction by using the independent-competing
risks duration model, applied on a survey data in 2011 from nineteen higher
education institutions (HEI) in Cambodia.
xix

The econometric results, by considering the endogeneity of mismatches, high-
light that unemployment duration is positively associated with the risks of educational
mismatches. This suggests that graduates might prefer to wait for a well match job
but fail to find, probably due to the lack of demand for college graduates in Cambodia,
and the inefficiency of education system that fails to develop students’ professional
skills required by the labor market. The results also underline the factors that can
impact the length of unemployment duration: Genre, fields of study, internship, using
informal job network, parents’ education and graduates’ preferences on the various
job attributes. However, these determinants affect unemployment duration differently
according to the state of issues whether graduates exit unemployment toward a right
matched, a vertical mismatched, a horizontal mismatched or a both mismatched job.
Having observed that unemployment duration is not the unique possible out-
put, we propose, for the next chapter, to analyze what is the impact of educational
mismatches on earnings.
Chapter 2 examines whether education-job mismatches lower individual wages
in Cambodia and if the impact is stronger when graduates suffer both vertical and
horizontal mismatches.
From the theoretical point of view, there is a consensus on the negative impact
of mismatches on wages. Two theoretical mechanisms explain this impact according
to whether graduates work in an inadequate job because of their preferences or due
to the lack of job opportunities in the labor market:
� First, workers may prefer a mismatched job to their qualification with lower
wages offered, in compensation for other job attributes such as career promotion
and perspectives (Sicherman & Galor, 1990) or less job pressures and stress for
which they may have stronger preferences (McGuinness & Sloane, 2011).
� Second, workers accept a mismatched job because they do not have other choices
as the job opportunities are limited, but working in this unfit job would not
allow them to exploit their potential skills, and consequently they would be less
productive and earn less than if they were employed in a matched occupation
(Thurow, 1976 ; Sattinger, 1993).
xx
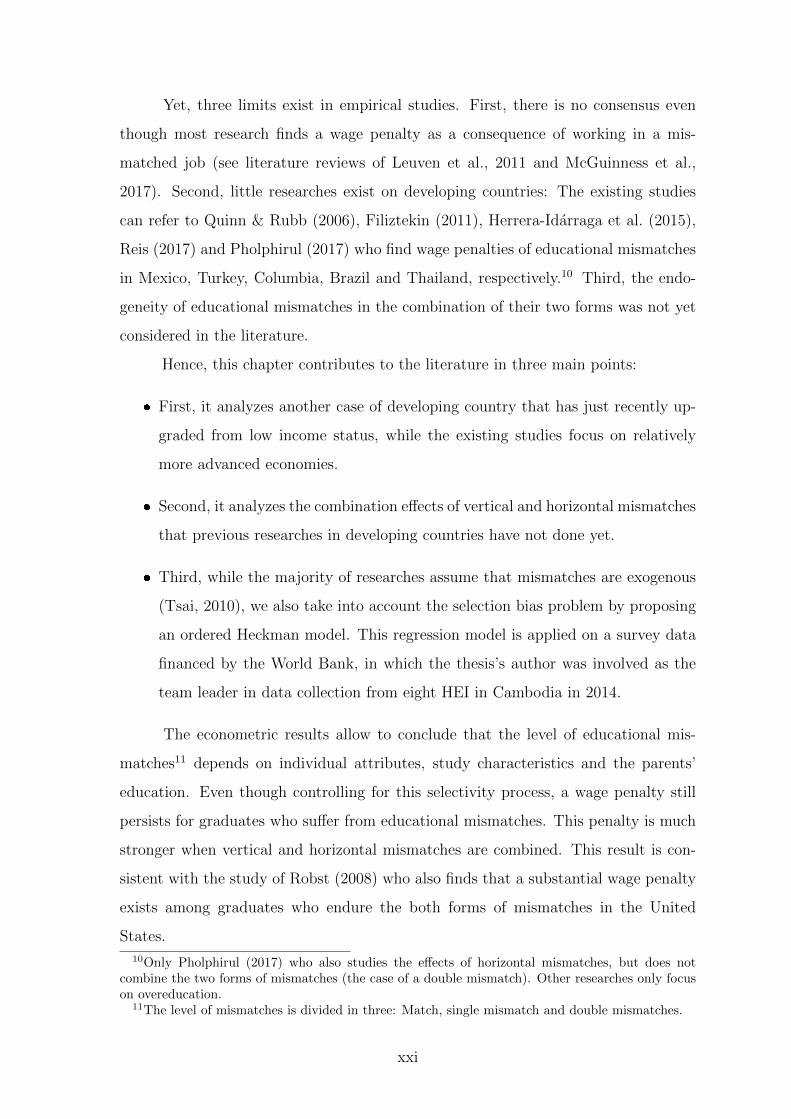
Yet, three limits exist in empirical studies. First, there is no consensus even
though most research finds a wage penalty as a consequence of working in a mis-
matched job (see literature reviews of Leuven et al., 2011 and McGuinness et al.,
2017). Second, little researches exist on developing countries: The existing studies
can refer to Quinn & Rubb (2006), Filiztekin (2011), Herrera-Idarraga et al. (2015),
Reis (2017) and Pholphirul (2017) who find wage penalties of educational mismatches
in Mexico, Turkey, Columbia, Brazil and Thailand, respectively.10 Third, the endo-
geneity of educational mismatches in the combination of their two forms was not yet
considered in the literature.
Hence, this chapter contributes to the literature in three main points:
� First, it analyzes another case of developing country that has just recently up-
graded from low income status, while the existing studies focus on relatively
more advanced economies.
� Second, it analyzes the combination effects of vertical and horizontal mismatches
that previous researches in developing countries have not done yet.
� Third, while the majority of researches assume that mismatches are exogenous
(Tsai, 2010), we also take into account the selection bias problem by proposing
an ordered Heckman model. This regression model is applied on a survey data
financed by the World Bank, in which the thesis’s author was involved as the
team leader in data collection from eight HEI in Cambodia in 2014.
The econometric results allow to conclude that the level of educational mis-
matches11 depends on individual attributes, study characteristics and the parents’
education. Even though controlling for this selectivity process, a wage penalty still
persists for graduates who suffer from educational mismatches. This penalty is much
stronger when vertical and horizontal mismatches are combined. This result is con-
sistent with the study of Robst (2008) who also finds that a substantial wage penalty
exists among graduates who endure the both forms of mismatches in the United
States.
10Only Pholphirul (2017) who also studies the effects of horizontal mismatches, but does notcombine the two forms of mismatches (the case of a double mismatch). Other researches only focuson overeducation.
11The level of mismatches is divided in three: Match, single mismatch and double mismatches.
xxi

After analyzing the microeconomics impacts of educational mismatches in Cam-
bodia, we propose to study these impacts at a more international and macroeconomics
level.
Chapter 3 examines the impacts of overeducation on economics growth in
thirty-eight developing countries at both short-term of one year and medium-term of
five years.
Two theoretical approaches confront each another:
� The assignment model (Sattinger, 1993) finds that the worker’s productivity
depends on both the job attributes and individual characteristics. Thus, over-
educated workers are more productive than their counterparts in the same job.
In addition, the presence of many overeducated workers in the labor market may
incite employers to create more high skilled jobs to exploit the human capital
of those overeducated persons (Acemoglu, 1999). These consequences can thus
positively contribute to economic growth.
� In contrast, Tsang & Levin (1985) stipulate that overeducated workers may be
dissatisfied with their jobs, which induces to counterproductive behaviors such
as high rates of absenteeism and turnover. Additionally, the lack of pleasure
in the job may also deteriorate the workers’ mental health (Kornhauser, 1965 ;
Artes et al., 2014). Consequently, these problems can limit firm’s development
and thus it is negative for economic growth.
Only few papers empirically analyze the impacts of overeducation on economic
growth and these articles do not result in a consensus. Indeed, while Guironnet &
Jaoul-Grammare (2009) find a negative effect of overeducation among graduates on
the short-term economic growth in France, Ramos et al. (2012) find a positive impact
of overeducation for economic growth at medium-term in nine European countries.12
The lack of analysis of educational mismatches at the macroeconomic level may
be related to the lack of data on mismatches at the aggregate level. To overcome this
difficulty, we create a database by combining micro and macro data. The data from
the Integrated Public Use International Microdata Series (IPUMSI) survey were used
12Those countries are Austria, France, Greece, Italy, Portugal, Romania, Slovenia, Spain andUnited Kingdom.
xxii

to calculate the overeducation rate by country. Then these data were coupled with
macro data from the World Bank.
Hence, this chapter contributes to the literature in three main points:
� First, this chapter contributes in terms of data on the rate of overeducation
across several different developing countries.
� Second, thanks to these calculated data, this chapter extends the analysis of the
overeducation impacts at macroeconomics level to developing countries.
� Third, this chapter also deals with unobserved heterogeneity and endogeneity
of overeducation that have not been fully resolved in the prior literature by
employing two-stage least squares regression with country fixed-effects.
The regression findings indicate that overeducation has negative impacts on
economic growth at both short and medium terms. This result is more conforming
to the ”job satisfaction approach” than the ”human capital approach”, suggesting
that the expansion of higher education sector in developing countries may not really
provide benefits to the countries if they do not pay attention to the education-job
mismatches process.
Key words:
Chapter 1: Vertical and horizontal education-job mismatches, the unemployment
duration, the job matching model, the independent competing risks duration model.
JEL codes: I23, J24, J64.
Chapter 2: Vertical and horizontal educational mismatches, wage differentials, the
ordered Heckman model.
JEL codes: I23, I26, J24, J31.
Chapter 3: Overeducation, economic growth, two-stage least square and country
fixed-effects regressions.
JEL codes: I23, I25, J24.
xxiii

”This page is intentionally left blank.”
xxiv
Preliminary Chapter
1 Introduction
The economics literature recognizes the importance of human capital at both
individual and macroeconomics levels. At microeconomics level, the human capital
theory (Becker, 1964) praises education as an investment in knowledge, which raises
individual productivity and thus earnings. At macroeconomics level, the endogenous
growth theory (Lucas, 1988) also recommends education for increasing the innovative
capacity of a country, which may strongly support the economic growth.
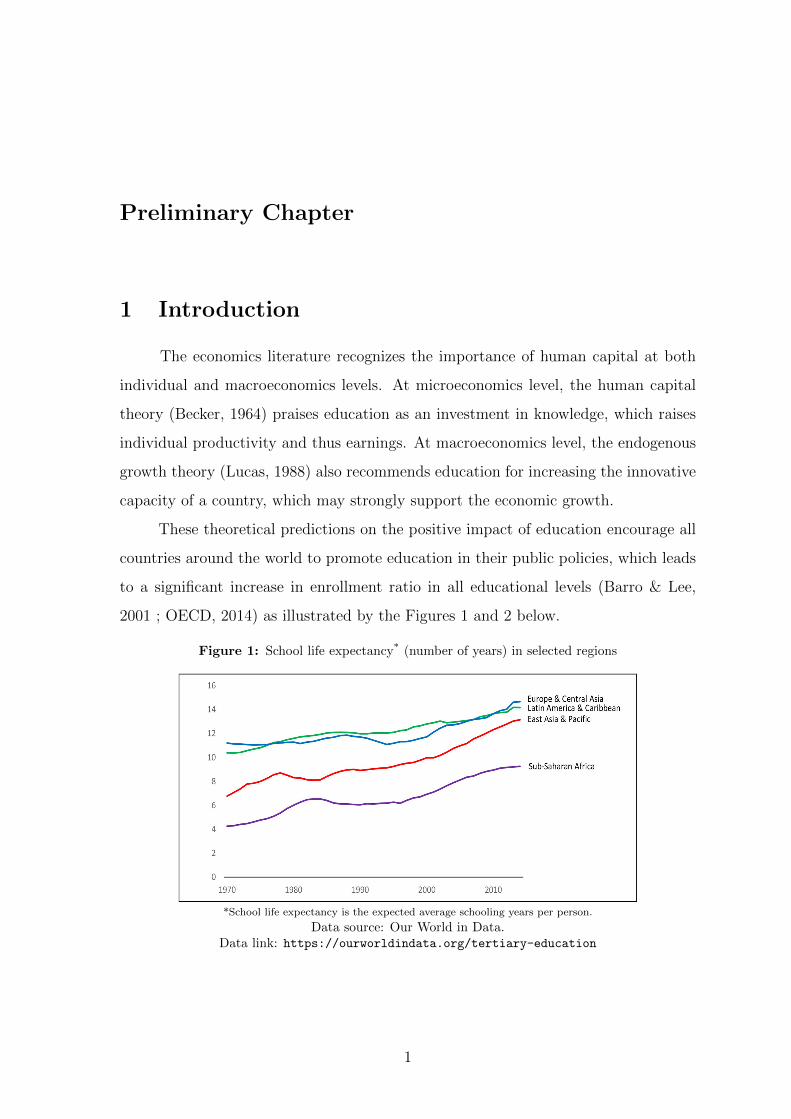
These theoretical predictions on the positive impact of education encourage all
countries around the world to promote education in their public policies, which leads
to a significant increase in enrollment ratio in all educational levels (Barro & Lee,
2001 ; OECD, 2014) as illustrated by the Figures 1 and 2 below.
Figure 1: School life expectancy* (number of years) in selected regions
*School life expectancy is the expected average schooling years per person.
Data source: Our World in Data.Data link: https://ourworldindata.org/tertiary-education
1
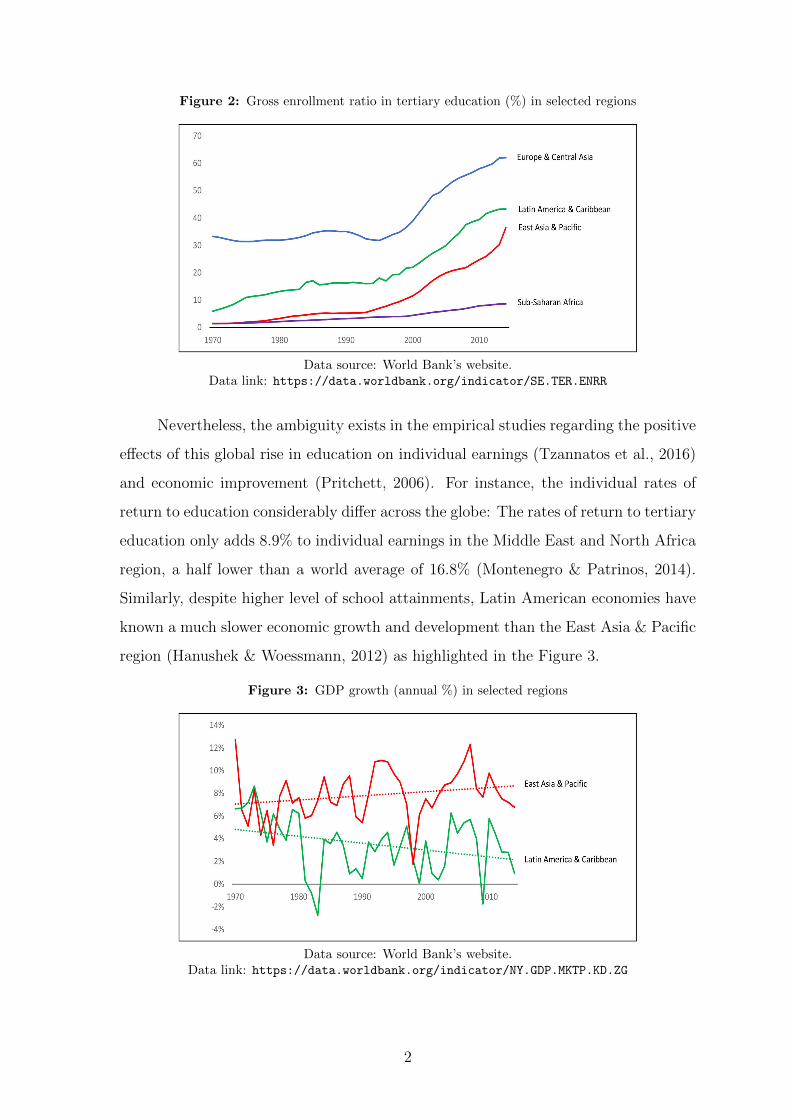
Figure 2: Gross enrollment ratio in tertiary education (%) in selected regions
Data source: World Bank’s website.Data link: https://data.worldbank.org/indicator/SE.TER.ENRR
Nevertheless, the ambiguity exists in the empirical studies regarding the positive
effects of this global rise in education on individual earnings (Tzannatos et al., 2016)
and economic improvement (Pritchett, 2006). For instance, the individual rates of
return to education considerably differ across the globe: The rates of return to tertiary
education only adds 8.9% to individual earnings in the Middle East and North Africa
region, a half lower than a world average of 16.8% (Montenegro & Patrinos, 2014).
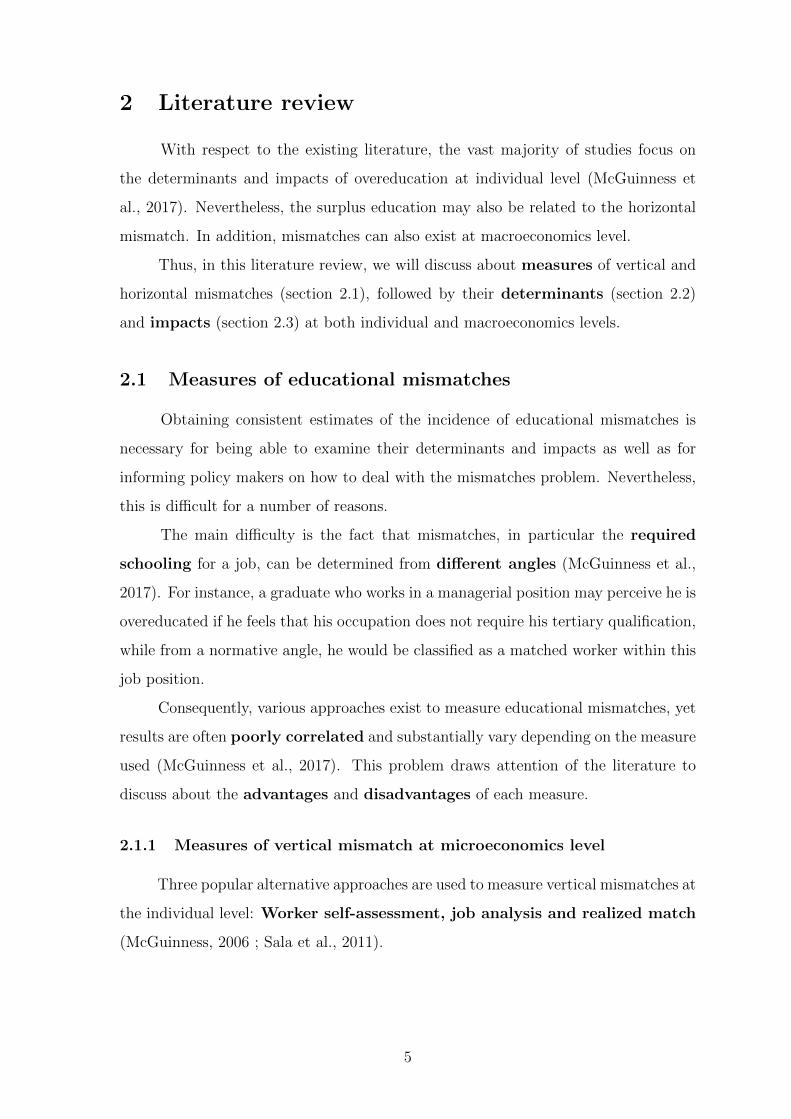
Similarly, despite higher level of school attainments, Latin American economies have
known a much slower economic growth and development than the East Asia & Pacific
region (Hanushek & Woessmann, 2012) as highlighted in the Figure 3.
Figure 3: GDP growth (annual %) in selected regions
Data source: World Bank’s website.Data link: https://data.worldbank.org/indicator/NY.GDP.MKTP.KD.ZG
2

The fact that higher level of educational attainments do not necessarily lead to
higher economic growth as predicted by the theoretical perspectives, shifts researchers’
attention to the issues of schooling quality.
To take into account the quality issues of education, international agencies such
as the UNESCO13 and World Bank, have developed measures of quality, for instance,
the pupils to teacher ratio, percent of trained teachers and government expenditure
on education as percent of GDP14. However, these measures still look incomplete to
measure the human capital development and thus insufficient to explain the gap of
economic outcome between countries (Hanushek, 2013). Cognitive skills based on the
Program for International Student Assessment (PISA) and other standardized tests
are found to provide a better picture on the role of education in earnings and economic
growth, but not fully enough (Vessman & Hanushek, 2007).
In fact, without consideration on other factors, especially on how education
acquired through schooling match labor market’s demand, education may
not have the desired impact on economic outcomes. For example, if many university
graduates are employed in jobs that do not require tertiary education or that are out-
side their fields of education, a portion of their schooling could be wasted and have
less impacts on the economy and society. Therefore, to better understand the role of
education in promoting economic development, educational mismatches emerge as an
indicator that should be taken into account carefully.
What is educational mismatch?
Educational mismatch is a concept that focuses on the interaction between the
supply of graduates from the education system and the demand for educated workers
in the labor market (Eurostat, 2016).
By definition, educational mismatches refer to a situation in which the workers’
education does not match what is required by their job (Quintini, 2011a). Two types
of educational mismatches exist: 1- A mismatch between the educational levels, called
vertical mismatch and 2- A mismatch between the fields of study, called horizontal
mismatch.
13UNESCO: United Nations Educational, Scientific and Cultural Organization.14GDP: Gross Domestic Product.
3

The starting point in the academic literature on education-job mismatches can
refer to the analysis by Freeman (1976) in his book ’The Overeducated Americans’,
which examines the decreased wage returns of college graduates in the United States
(Quintini, 2011a). Freeman (1976) links these falling rates to an excessive supply of
graduates, generating a phenomenon called overeducation (vertical mismatch15).
Overeducation is defined as an excess of education, beyond the level needed
to perform a certain job (Rumberger, 1981 ; Tsang & Levin, 1985 ; Hartog, 2000),
and the research on this mismatch has mushroomed in the United States and other
developed countries since the late of 1980s (Farooq, 2011).
Two decades later after the concerns of Freeman (1976) on overeducation, the
concept of educational mismatches has been broadened to include horizontal mis-
matches, firstly coined by Witte & Kalleberg (1995) when they study the match
between vocational education and employment in Germany.
Horizontal mismatches imply that people’s occupations do not match their fields
of education. Compared to overeducation, the horizontal mismatch is still, however,
recent in the literature because researchers have just paid much attention on this mis-
match in the last ten years since the publication of Robst (2007a) on the mismatches
between college major and occupations among graduates in the United States (Do-
madenik et al., 2013).
Since the development of academic literature on educational mismatches, three
challenges are encountered and needed to be resolved:
(1) First, how to measure educational mismatches at the individual and aggregated
levels?
(2) Second, what are the factors to explain educational mismatches at both levels?
(3) Third, what are the impacts of educational mismatches at microeconomics and
also macroeconomics levels?
Concerning these challenges, the literature has already shed lights, but no con-
sensus has been reached to settle the debates that still exist on these three questions.
15Vertical mismatch may also refer to undereducation, but in this thesis, we only focus on over-education for this type of mismatch.
4
2 Literature review
With respect to the existing literature, the vast majority of studies focus on
the determinants and impacts of overeducation at individual level (McGuinness et
al., 2017). Nevertheless, the surplus education may also be related to the horizontal
mismatch. In addition, mismatches can also exist at macroeconomics level.
Thus, in this literature review, we will discuss about measures of vertical and
horizontal mismatches (section 2.1), followed by their determinants (section 2.2)
and impacts (section 2.3) at both individual and macroeconomics levels.
2.1 Measures of educational mismatches
Obtaining consistent estimates of the incidence of educational mismatches is
necessary for being able to examine their determinants and impacts as well as for
informing policy makers on how to deal with the mismatches problem. Nevertheless,
this is difficult for a number of reasons.
The main difficulty is the fact that mismatches, in particular the required
schooling for a job, can be determined from different angles (McGuinness et al.,
2017). For instance, a graduate who works in a managerial position may perceive he is
overeducated if he feels that his occupation does not require his tertiary qualification,
while from a normative angle, he would be classified as a matched worker within this
job position.
Consequently, various approaches exist to measure educational mismatches, yet
results are often poorly correlated and substantially vary depending on the measure
used (McGuinness et al., 2017). This problem draws attention of the literature to
discuss about the advantages and disadvantages of each measure.
2.1.1 Measures of vertical mismatch at microeconomics level
Three popular alternative approaches are used to measure vertical mismatches at
the individual level: Worker self-assessment, job analysis and realized match
(McGuinness, 2006 ; Sala et al., 2011).
5
(i) In the worker self-assessment method (WSA), workers are asked to specify
the education required for the job. If an individual education acquired is above
what is required, he is defined as overeducated (McGuinness & Pouliakas, 2017).
Because vertical mismatch is defined by each employee’s opinion, this method
is known as a subjective measure.
The main advantage of this method is the explicit specification of the tasks
and the level of schooling required from each worker (Sala et al., 2011). This
measure presents, however, several drawbacks. First, workers in less structured
organizations may not have a good insight about the required level, especially
when the requirements of the job have changed over time and the employee
hired before the change is not affected by such a change (Cohn & Khan, 1995).
Second, workers may inflate the status of their position (Sloane, 2003). Third,
respondents may also apply different criteria for job requirements: The actual
level of education required to do the job or the formal educational requirements
necessary to get the job (McGuinness, 2006). Fourth, a worker’s impression
on his education-job matching might be also impacted by comparing himself to
other workers in similar jobs, which may introduce a bias perception (Maltarich
et al., 2011).
(ii) The job analysis (JA) measure, known as a normative approach, is a
systematic evaluation on the required education for specific job titles (Sala et
al., 2011). Indeed, it identifies vertical mismatches by using the International
Standard Classification of Occupations (ISCO), which categorizes the major
occupational groups by level of education in accordance with the International
Standard Classification of Education (ISCED) (McGuinness et al., 2017). For
instance, jobs in the ”legislators, senior officials and managers” category are
presumed to require a tertiary qualification, while jobs in the ”clerical support
workers” do not require. Consequently, tertiary graduates who are employed in
this latter position are defined as overeducated.
The main advantage of using this method compared to the WSA is that the
JA is conceptually objective, which avoids the subjective bias due to the
different perceptions of people when asking about the match of their education-
6

occupation. Nevertheless, having the same job title may not mean that workers
are performing the same tasks, and thus workers can be required to possess
different educational levels (McGuinness, 2006).
(iii) The third approach, namely the realized match (RM), estimates the over-
education status by two variables: Years of schooling and occupational group
of a job holder. The distribution of education is calculated for each occupation.
Employees with years of education above the mean by more than one standard
deviation are classified as overeducated workers. Another approach differs from
the first one in that it uses the mode of level of schooling instead of the mean.
Workers with educational levels above the group modal value are considered as
overeducated (Cohn & Khan, 1995 ; Kiker et al., 1997). This method is called
statistical approach since it uses the statistics mean or mode of years or level
of education, calculated from the peers working in the same occupation, as the
required schooling (Flisi et al., 2017).
Compared to other methods, this approach is inferior and only used when there
is no data to conduct the WSA or JA measures (Leuven et al., 2011). Indeed,
one main drawback of the statistical method is related to the fact that if there
is an excess supply of graduates in a given occupation, it will underestimate
the level of overeducation and will overestimate in case of excess demand (de
Oliveira et al., 2000). For example, if a particular occupation contains a high
proportion of overeducated workers (suppose that many tertiary graduates work
as street vendors), this will raise the occupational average number of years
of education and corresponding cut-off point of required educational years for
that occupation, thus likely underestimating the true level of overeducation
(McGuinness, 2006).
2.1.2 Measures of horizontal mismatch at microeconomics level
Relative to the vertical mismatch, there are much fewer published studies of the
horizontal mismatch (McGuinness et al., 2017), and based on the survey of Somers
et al. (2018), only two alternatives measures are mainly used in the literature: The
worker self-assessment and job analysis methods. These measures possess the
same advantages and disadvantages as mentioned above:
7

(i) In the WSA, employees are asked to assess the degree to which their current
job is related to the study field of their highest qualification (McGuinness et al.,
2017). For example: ’Thinking about the relationship between your work and
your education, to what extent is your work related to your doctoral degree?
Was it closely related (match), somewhat related (partly mismatch), or not
related (fully mismatch)?’ (Robst, 2007a ; Robst, 2007b).
(ii) The JA method, on the other hand, determines the educational requirements
for an occupation by assigning occupational codes to educational fields (Somers
et al., 2018). For example, Wolbers (2003) uses the International Standard
Classification of Occupations (ISCO-88 with 3 digits code) to assign different
occupations to a field of study. Accordingly, a discrepancy between the skills
obtained from a particular field of education and what needed in a job is defined
as horizontal mismatch.
2.1.3 Measures of vertical and horizontal mismatches at macroeconomics
level
In contrast to a lively discussion about the measures of educational mismatches
at microeconomics level, less attention has been paid to macroeconomics level, perhaps
due to a lack of data for analysis at the aggregated level in most countries.
Two main approaches are used in the literature (Sala et al., 2011):
(i) First, in the Manpower Requirements Approach (MRA), they estimate
the demand and supply of educated manpower in different levels and fields of
education, then they balance that supply and demand to draw the incidence of
mismatches (Dougherty, 1985).
For instance, the aggregated labor demand can be approximated by the available
job openings in the economy (both new jobs and replacement ones) for different
sectors and occupations, reflecting the needs of diverse skills and education in
the labor market (Pouliakas et al., 2012). On the other side, the size of labor
force with different educational backgrounds can be used as a proxy for the
aggregated labor supply (Pouliakas et al., 2012). The discrepancies between
8
the labor needs of the economy and the available supply of manpower generate
aggregated mismatches.
Nevertheless, by simply matching the overall demand and supply, this mismatch
indicator does not consider whether each worker is really in a job that matches or
does not match his education (European Commission, 2015). Thus, the absence
of mismatches at the aggregated level does not imply that mismatches do not
arise at the individual level (Sattinger et al., 2012).
(ii) Another main approach, called the Rate of Return (RoR), calculates the
increase in net income that an individual will be able to command throughout
his life compared with the income he would have received if he had not reached
a given educational program (ILO, 1984). Thus, the rate of returns can be
estimated for each educational program. The programs that show positive or
high net returns should be promoted, while those showing low net present value,
perhaps indicating a surplus of graduates, should be reduced (Sala et al., 2011).
For example, the decreasing wage returns for cohorts of university graduates in
Ireland between 1994 and 2001 (McGuinness et al., 2009) may indicate a faster
rising in the supply of higher-educated labor than demand during that period,
reflecting a possible mismatch problem (Pouliakas et al., 2012).
However, a weakness of this mismatch indicator includes the fact that wage is
also a function of other several factors apart from the imbalance between supply
and demand (Sattinger et al., 2012).
It seems that mismatches at macroeconomic level is a very different concept
to mismatches at microeconomic level, and the interpretation of the macroeconomic
measures should be therefore cautious (McGuinness et al., 2017).
2.1.4 Incidence and some evolution of educational mismatches
Concerns linked to the incidence of mismatches lie in the fact that different
measures generally yield important different incidences, making researchers and
policy makers hard to interpret the results and address the problem (Barone & Ortiz,
2011 ; Flisi et al., 2017).
9

For example, McGoldrick & Robst (1996) find 50% of male workers in the
the United States are overeducated under the normative approach, 30% under the
subjective measure and just 16% under the statistical terms.
The incidence of horizontal mismatch also varies considerably. Somers et al.
(2018) conduct a literature survey on papers published between 1995 and 2015 and
find that the overall average prevalence of workers with fully horizontal mismatches
are estimated to be 23% and 35% for subjective and objective measures, respectively.
Figure 4: Average incidence of overeducation (%)in selected developed countries
Source: Author’s graphic based on data in Table 2 of McGuinness et al. (2017).Note: These results are calculated based on papers published between 2006 and 2016.
Figure 5: Average incidence of horizontal mismatches (%)in selected developed countries
Source: Author’s graphic based on data in Table 2 of Somers et al. (2018).Note: These results are calculated based on papers published between 1995 and 2015.
Looking at the evolution, the incidence of educational mismatches seem to
increase over time, between 2002 and 2012, for several countries in Europe if we
10

rely on the job analysis measure. Nevertheless, it is more stable according to the
mean-based method.16
This increasing rate attracts attention in advanced economies to the quality of
education and emphasizes a necessity to examine the responsiveness of education
system to labor market’s needs (Pouliakas et al., 2012 ; ILO, 2014).
Figure 6: Evolution of average overeducation rate (%)in European countries (job analysis measure)
Source: (ILO, 2014).
Figure 7: Evolution of average overeducation rate (%)in European countries (statistical analysis measure)
Source: (ILO, 2014).
Beyond the question on how to measure educational mismatches, the literature
also endeavors to evaluate their determinants.
16Note: The figure shows unweighted averages based on data from the following countries: Bel-gium, Denmark, Finland, Germany, Hungary, the Netherlands, Norway, Poland, Slovenia, Spain,Sweden and the United Kingdom (ILO, 2014).
11

2.2 Determinants of educational mismatches
The determinants of education-job mismatches can be divided in two levels:
Individual and aggregated levels.
2.2.1 Determinants at microeconomics level
The theoretical background for the relation between education and occupation
can be started with the human capital theory of Becker (1964) who is the first to
analyze how individuals decide to invest in education.
Becker (1964) develops, within the classical framework, a model in which he
considers education as an individual investment, allowing to increase the global stock
of knowledge, called human capital. In this model, each individual faces a trade-
off between costs and benefits generated by the investment on education beyond the
compulsory schooling level. His decision to determine the duration of his educational
investment is guided by the rationality assumption in a market characterized by pure
and perfect competition.
This implies that there is no rigidity in the labor market, neither shortages
or surplus of workers in different training fields, and firms will always adapt their
production process to fully utilize the skills of their workers. As a result, from a strict
point of view of this model, educational mismatches do not exist.
How can educational mismatches exist?
Educational mismatches exist only when we go beyond the classical analysis
framework by rejecting certain hypotheses of the pure and perfect competitive market
such as: 1- Perfect information and 2- Homogeneity of economic agents.
(i) Imperfect information
Due to the informational deficits in the labor market, it is possible that education-
job mismatches exist at a certain moment. Two theories are in line with this
concept:
� In the job search theory (Jovanovic, 1979), labor market is assumed
to face search friction problems, thus, job-seekers need to spend time and
money to search for a job that corresponds to their education. Hence, they
12
confront a trade-off between accepting a mismatched job or continuing the
job search to find a better suitable job. In response to this, they determine
a reservation wage and accept the first job offer with wage equaling
or exceeding the reservation wage. Thus, unemployed workers who have
low reservation wages, would tend to accept the first job offer, and
consequently they are more likely to be mismatched.
� Similarly, in the career mobility theory (Sicherman & Galor, 1990), due
to the asymmetry of information, it may take time for employers to learn
about a worker’s productivity. Hence, some workers, particularly young
persons, are likely to be proposed and accept an initially mismatched
position, but this enables them to achieve a rapid career progression
later.
Alternatively to the career mobility theory, other authors hypothesize that
mismatch may be a consequence of individual preferences for other job
attributes, besides career perspective, such as job security, flexible working
time and other working conditions (McGuinness & Sloane, 2011).
(ii) Heterogeneity of agents
By also assuming that workers and job structures are heterogeneous, mis-
matches exist because the assignment process is too complex in matching the
heterogeneous workers to corresponding jobs. Three theories illustrate this point
of view:
� In the signaling theory (Spence, 1973), educational attainments can be
correlated with individual unobservable characteristics such as the capacity
and willingness to acquire new skills. Consequently, education can be used
as a signal to identify more able and motivated individuals to employers.
In order to acquire more of the signal to distinguish themselves from others,
individuals are incited to invest more in education even though the human
capital acquired is not fully utilized in the jobs.
� As part of this signaling framework, the job competition model proposed
by Thurow (1976) describes the allocation of job seekers to vacant jobs as
a double queuing process. The first queue is formed by jobs ranked
13
from those requiring the highest qualification to the least demanding. The
second queue is formed by workers, and the relative position of a worker
in the queue depends on the level of educational attainment. Therefore, to
reach the top of the queue that is necessary to be assigned to the best job
available in the market, individuals will invest more in education hoping
that an additional amount of education will enhance their chance of getting
a good job relative to others. Therefore, mismatches probably exist as the
skill requirements of the assigned position may not fit well those acquired
by workers.
� The assignment theory (Sattinger, 1993) also assumes that there is an
allocation problem in assigning heterogeneous workers to jobs. Never-
theless, the job allocation process is not simply a lottery as suggested by
the job competition model (Thurow, 1976) because workers may choose
particular jobs over others based on their utility maximization function.
Anyways, this model reaches the same conclusion regarding the mismatch
problem: The job structure is complex and less likely responsive to adapt
the change in relative supplies of educated labor, and as a result, mis-
matches are expected to exist.
Based on those theoretical models, it is possible for empirical studies to
identify factors that are likely to increase or decrease the risks of mismatches.
In his analysis of mismatches among graduates in the United States, Robst
(2007b) classifies the reasons for accepting a mismatched job in two categories: Supply
related and demand related factors.
(i) Supply side related factors
Following the job search and career mobility theories, factors that improve the
job search information or variables related to individual constraints and
preferences should affect the probability of being mismatched (McGuinness &
Pouliakas, 2017).
For instance, job search methods could influence the occurrence of mismatches.
Indeed, using universities’ career offices as a job search channel can reduce the
14

probability of vertical mismatch among Australian graduates, thanks to the
career information and orientation services (Carroll & Tani, 2015). In contrast,
using an informal job search network increases the risk of being mismatched in
Italy (Meliciani & Radicchia, 2016). The authors argue that using the family and
friends limits the extent of job search, thus reducing spatial flexibility to find a
better job. Then, living with a couple may also constraint the job search because
the choice of job location can be limited by the decision or the labor market
prospects of another member in the couple, making married people more likely
to be mismatched (Frank, 1978 ; Morano, 2014). Next, in developed countries,
workers’ ages are found to be negatively correlated with the probability of being
mismatched, suggesting that young workers face higher risks of mismatches
(Morano, 2014 ; Kupets, 2015). Hence, this seems to confirm the career mobility
theory in which it might be strategic for young workers to accept a mismatched
position before moving later into a better job.
Individual preferences also influence the likelihood of being mismatched. Indeed,
in the study of Robst (2007b) on the relation between college majors and job
mismatch among graduates in the United States, there exist individuals who
prefer a job that does not match their fields of education. Their justifications
are owing to family related reasons such as on-site child care or their preferences
on other job attributes such as job location, change in career interest, career
promotion and other working conditions.
(ii) Demand side related factors
The job competition and assignment theories stress the demand side regarding
the job opportunities as potential factors to explain educational mismatches
(McGuinness & Pouliakas, 2017). Labor market discrimination may also
play a role due to the heterogeneity of workers (Quintini, 2011a).
For instance, in the analysis of Robst (2007b) mentioned earlier, some graduates
also accept a mismatched occupation by cause of being unable to find a job in
their fields. Then, there is evidence suggesting that mismatch is more prevalent
among graduates of social sciences, arts and humanities due to a possible lack
of demand for graduates in those majors (Ortiz & Kucel, 2008).
15

Next, employers may rank workers based on their study grade as a signal of their
ability. Indeed, studies that include variables as proxies for individual ability,
such as study scores or graduating from a famous university, find a negative
correlation between these variables with vertical mismatches (Allen & Van der
Velden, 2001 ; Green & McIntosh, 2007 ; Chevalier & Lindley, 2009). Female
and ethnic minority workers also confront higher risks of mismatches (Morano,
2014) that might be the result of labor market discrimination, viewing them as
less productive (Altonji & Blank, 1999). Alternatively, it is also possible that
women are likely to be mismatched because their job choices are constrained
by their husband’s labor market prospects (Frank, 1978), and ethnic minority
workers are exposed to mismatches by reason of the lack of proficiency in the
country’s language (Battu & Sloane, 2004).
2.2.2 Determinants at macroeconomics level
Despite various models exist to explain why educational mismatches occur at
microeconomics level, less attention has been paid to analyze whether overall macro-
economics conditions influence the occurrence of mismatches (Morano, 2014).
For instance, the labor market tightness during the economic recession, the
skill-bias technical change and the economic structural change, can perhaps
affect the risks of education-job mismatches in an economy. Three theoretical models
illustrate these concepts:
� Pissarides (1994) develops, in line with the job search theory, a matching
model by taking firms into consideration in the search process. He views a
labor market where workers and jobs are heterogeneous in quality and where
many attributes of one are not easily observable to the other, caused by the
asymmetric information. Therefore, a period of search is required by both
employees and employers before job offers are made and accepted.
Thus, education-job matching is a result of simultaneous interaction between
individuals and firms in their process of looking for job-worker matches. This
matching process depends on the labor market tightness defined as the ratio
of job vacancies to job seekers, and also the efficiency of the search processes
in the economy. Consequently, during the negative labor market conditions,
16

which provokes a restrict number of job opportunities and thus a high level
of unemployment rates, employers may increase the skills requirements and
workers may be also incited to rather accept a job that does not match their
education than to stay unemployed.
� Acemoglu (1999) builds upon the job matching model by also assuming that the
labor market is characterized by search frictions and the interaction between
employers and employees. However, his approach differs by assuming that the
heterogeneity of firms is not exogenous but is derived from their investment
decisions. Indeed, he supposes that firms have to choose what type of job to open
before finding a worker, and this decision depends on the skill composition of
the labor force.
When the supply of skills is limited, it is not profitable to create high skilled
jobs because it is difficult and costly to find skilled workers. As a result, the
economy is in a pooling equilibrium where firms create only a single type of job,
called ”middling” jobs, for both skilled and unskilled workers. Thus, skilled
workers are overeducated. Starting from this pooling equilibrium, an increase
in the proportion of skilled workers beyond a critical threshold, will encourage
firms to upgrade their technologies and create high skilled jobs, leading to a
separating equilibrium. In other words, an increase in the supply of skills creates
its own demand or even more, reducing thus the mismatch incidence.
� The existence of educational mismatches in the economy can be also linked to
the ”creative destruction” process of Schumpeter (2010 [1942]). This process
consists of revolutionizing the economic structure from incessantly destroying
the old one to incessantly creating a new one. This economic progress is not
gradual and peaceful, but rather disjointed and sometimes unpleasant.
Thus, whenever there is a disruption of an existing industry, it is likely that
workers who were trained to work in this industry would lose the jobs because the
rapid structural change may obsolete their human capital formation acquired
in the past. These people have to move to a new sector and face high risks of
finding new jobs that are mismatched to their previous training.
17

Some empirical studies are conducted to test those theoretical predictions on
the relation between mismatches and certain macroeconomics variables.
� For example, Groot & Van Den Brink (2000), in a meta-analysis, find evidence of
a relationship between overeducation and the rate of labor force growth. Their
argument is that a rapid growth of labor force may increase the labor market
tightness mentioned by Pissarides (1994), which makes workers have to accept
a job for which they are overeducated. Then, the findings of Quintini (2011b)
on a panel of European countries show that workers losing their job during a
recession face a higher probability of being overeducated in their subsequent
employment. Similarly, Croce & Ghignoni (2012), Verhaest & Van der Velden
(2012) and Hagedorn & Manovskii (2013) who find that people graduated during
the period of economic decline are more likely to be mismatched because the
labor market is tighter.
Next, the results from Italy (Morano, 2014), show that the likelihood of being
overeducated significantly differs across economic sectors because some sectors,
for example the agriculture, relatively possess little skilled jobs. Verhaest &
Van der Velden (2012) and Davia et al. (2017), using aggregated data from
several countries in Europe, also find that major factors to explain cross-country
differences are the relative oversupply of educated labor to professional level jobs
and the imbalance between the demanded and supplied fields of study, making
graduates in some fields hard to find a job.
� Acemoglu (1999) finds that an increase in the proportion of skilled workers
creates a qualitative change in the composition of jobs by increasing the demand
for skills, reducing thus the incidence of vertical mismatches in the United States
in the early 1980s. In accordance to this ideas as well, Di Pietro (2002), in a
pooled cross-national analysis of aggregate data in eleven European countries,
finds that firing restrictions prevent firms from immediately taking advantage
of upward changes in skilled workforce availability and hence discourage firms
from creating new high skilled jobs. As a result, the mismatches are found to be
more prevalent in countries with strict regulations (Di Pietro, 2002). In contrast,
Davia et al. (2017) find that countries with stronger employment protection
18

legislation are characterized by lower levels of overeducation. They explain this
finding by the fact that employers may take greater care in achieving good
matches at recruitment because of higher costs of separation.
� Restrepo (2015) demonstrates that the structural economic change that
leads to a decline in routine-cognitive jobs outside manufacturing since the late
1990s, creates a skill mismatch observed in the United States, from 2007 to
2013, during the Great Recession and its recovery. Kupets (2015) finds the
same reasoning for transition economies such as Armenia, Georgia, Macedonia
and Ukraine where rapid structural changes make obsolete the qualifications of
the workers who were graduated under the communist economic and political
systems, making them more prone to be mismatched.
With the presence of education-job mismatch problems, the impact of education
on economic outcomes seems to be doubtful, perhaps less positive than it should has
been. The next section will focus on the impacts of mismatches.
2.3 Impacts of educational mismatches
A growing literature has provided answers to the question on the impacts of
education-job mismatches, but mostly at microeconomics level. Furthermore, while
several researches find negative consequences, a common consent is not reached, in
particular at macroeconomics level.
2.3.1 Impacts at microeconomics level
Several outputs can be affected by education-job mismatches. For instance, at
a given point in time, individual wages, job satisfaction and unemployment
duration are found to be influenced by educational mismatches. Some researches are
also conducted to analyze the dynamic case in the context of career mobility.
The impacts on wages, and to a lesser extent the job satisfaction, attract the
most attention from the literature to analyze the mechanism why educational mis-
matches may decrease individual returns to education and lower the job satisfaction.
19

The starting point to analyze the relation between education and earnings can
refer again to the standard human capital model (Becker, 1964) described before.
In this model, firms recognize education as an indicator of productivity, and workers
are always paid at their marginal productivity. Thus, worker’s earnings depend
on the education acquired, and each gap observed in wage is owing to each gap in
education endowment. Yet, the reality is far from this classical framework analysis as
mentioned by other theories cited above. Hence, education-job mismatches exist and
may have impacts on wages and job satisfaction:
(i) Impacts of mismatches due to individual choices
Due to the asymmetric information, employers cannot observe an educated
worker’s performance. As a result, the worker can be proposed for a position that
does not match well his education acquired, and with a lower wage offered
(Sicherman & Galor, 1990). This proposal is, however, compensated by higher
probabilities of occupational upgrading, especially after they acquire specific job-
related skills through on-the-job training. Thus, a part of returns to education
of mismatched workers, is in the form of training provided by employers and
better career promotions in the future.
Alternatively, it is argued that, besides career progression, certain workers may
prefer a job requiring a lower educational level and paying them less because
it is compensated by other job attributes, such as less pressure, for which they
may have a stronger preference (McGuinness & Sloane, 2011).
From the perspective of these concepts, education-job mismatches are a choice
of workers. Consequently, the mismatch problem should not negatively affect
the individual job satisfaction.
(ii) Impacts of mismatches due to the lack of high skilled jobs
Due to the existence of heterogeneity between workers, each individual may
try to invest more in education to distinguish or signal their higher productivity
relative to others, leading to a situation where the education acquired can be
beyond the education required for a given job (Spence, 1973). Then, with the
assumption that the output of a job solely depends on the education required
for performing the job (Thurow, 1976), the surplus of acquired education is not
20

rewarded. Consequently, mismatched workers would earn less than if they were
in a matched occupation in which they could use all their potential qualifications.
With the same assumption of heterogeneous workers but the output of a
job depends on both the education acquired and those required in the job,
Sattinger (1993) suggests that overeducated workers are more productive and
earn more than matched workers in the same job thanks to their more years of
education acquired, yet they are less productive and earn less than workers of
the same education who work in a matched occupation due to the job ceiling
productivity that limits them to fully exploit their qualifications.
Because mismatches are caused by labor market’s demand, thus not only
earnings that are predicted to be lower, but also the job satisfaction that
might be positive correlated with wages in such circumstances (Robst, 2008).
Furthermore, from the sociological perspective, educational mismatches could
adversely affect individual job satisfaction because the worker’s expectations
on the social position and type of work are not fulfilled like they thought when
they invested in their higher education (Capsada-Munsech, 2017).
Besides wages and job satisfaction, the consequences of educational mismatches
on unemployment duration and career mobility of mismatched workers also
draw attention from the literature, yet two concepts differ:
� Owing to the fact that job-seekers only have access to imperfect information
about the available job opportunities, workers face a trade-off between quitting
unemployment as soon as possible even though the job is mismatched to their
qualification or continuing to find a better matched job (Jovanovic, 1979).
Similarly, working in a mismatched job can be supposed as an investment in
specific skills related to the job, and thus some workers, especially young persons,
may possess a strategic behavior by selecting a mismatched job than spending
more time to look for a matched job (Sicherman & Galor, 1990).
Within these points of view, working in a mismatched job can be result in
shorter unemployment duration. In addition, these theoretical mechanisms
also predict that mismatched workers will have higher probabilities of upward
21

career mobility. Indeed, through repeated job search and/or after after
acquiring necessary specific skills, mismatched workers would be promoted to a
matched position within or across firms. Thus, educational mismatches are just
a temporary phenomenon.
� In constrast, McCormick (1990) stipulates that accepting a mismatched job is a
stronger negative signal to employers than unemployment regarding a worker’s
productivity. Thus, individuals may prefer to stay unemployed and wait for a
job that matches their qualification. Nevertheless, as a result of heterogeneous
workers and the complexity of job structure with limited job opportunities
(Thurow, 1976 ; Sattinger, 1993), there is no promise that workers will finally
end up in a matched position.
Thus, education-job mismatches and unemployment duration might be also
positively related, especially for the less competent workers. Furthermore,
those mismatched workers are also more likely to be stuck in such jobs for
a long time without any upward mobility, and thus, educational mismatch is
rather a persistent problem.
The same conclusion but with an alternative explanation that is not serious: If
workers prefer a mismatched job to compensate for other job attributes, there
is no reason to observe an upward mobility for those workers.
Regarding the empirical researches on the impacts of educational mismatches,
the majority of studies focuses on the impacts of overeducation on the wage effects.
Across literature, we can classify the impact of vertical mismatch on earnings
in two groups. The first group supposes that education-job mismatches are an exo-
genous phenomenon, but this seems to be not true providing that individuals who
work in mismatched jobs may have chosen those jobs based on characteristics, as we
have identified in the section 2.2, that may also influence wages. Hence, the second
group analyzes the impacts on earnings by taking into account the endogeneity of
education-job mismatches:
22

(i) Education-job mismatch is exogenous
Duncan & Hoffman (1981) is the first to empirically investigate the effect of
vertical mismatches on earnings in the United States by extending the Mince-
rian wage equation (Mincer, 1974)17 to include years of Over-, Required and
Under- education, called ORU specification. Later, instead of using ORU,
Verdugo & Verdugo (1989) employ dummy variables for being overeducated
and undereducated in linear regressions.
Across literature, under the ORU specification, overeducation years return is
positive but lower than required years of education, with the estimated coeffi-
cient on years of surplus education is generally found to be nearly a half of the
coefficient on required years of education (Leuven et al., 2011). This signifies
that overeducated individuals gain less than people with the same education and
posses a matched job, yet earn more than their colleagues in the same job but
not overeducated (Leuven et al., 2011). This evidence on the returns to over-
education is consistent with the assignment model where wages are determined
by both workers and job characteristics (Sattinger, 1993). Under the dummy
variable approach, overeducated workers also earn less than workers who have
the same level of education but are adequately matched (Quintini, 2011a). The
penalty associated with being overeducated is estimated to lie within a range of
8% to 27% with a mean penalty of 15.3% (McGuinness, 2006).
(ii) Education-job mismatch is endogenous
Since the early of 2000s, several articles have started to be aware of possible bias
estimation by the reason of endogenous status of education-job mismatches.
Consequently, several studies such as Dolton & Vignoles (2000) ; Bauer (2002)
; Dolton & Silles (2008) ; Lindley & McIntosh (2009) ; Korpi & Tahlin (2009)
; Tsai (2010) have applied fixed effects and instrumental variable techniques
to address the endogeneity problem. Another approach, called the propensity
score matching, is also employed by McGuinness (2008).
Taking into account the endogenous issue of overeducation makes the findings
mixed: Even though several results still report negative effects on earnings by
17The Mincer earnings function is a single equation model that explains wage income as a functionof schooling and experience.
23
being overeducated, some papers such as Bauer (2002) and Tsai (2010) find
that the wage penalty becomes smaller or disappears. Indeed, using a German
panel data, Bauer (2002) finds a wage penalty for overeducated workers drops
from 10.6%, when using Ordinary Least Square regression, to only 1.7% when
he accounts for time-constant individual characteristics, while Tsai (2010) does
not find a wage penalty when he employs the fixed-effects regression applied on
a panel data concerning the United States. He argues that the observed wages
difference between overeducated and well-matched workers is rather owing to
individual unobserved heterogeneity such as poor innate ability.
Beyond wage penalties, several empirical studies also devote attention to the
effects on job satisfaction, and again a consensus is not reached:
� First, Tsang (1987) analyzes the impacts of overeducation on job satisfaction
among the Bell employees in the United States, and finds one additional year of
overeducation leads to a drop of 0.116 in the level of job satisfaction that has a
mean of 3.52.18 Next, Battu et al. (1999) for the United Kingdom, Verhofstadt
et al. (2003) and Verhaest & Omey (2006) for the Belgium, Fleming & Kler
(2008) for the Australia, and Peiro et al. (2010) for the Spain case, all find that
overeducated workers are less satisfied with their job than well-matched workers
with the same qualification. More recently, Diem (2015) and Congregado et al.
(2016) also discover the negative effects of overeducation on job satisfaction in
Swiss and several European countries, respectively.
Furthermore, some researches find that overeducated workers are less satisfied
than well-matched workers in the same job as well. For example, by using an
ordered logit model, Verhaest & Omey (2006) find a negative effect of being
overeducated on the job satisfaction with a coefficient of -0.07 compared to
matched workers in the same job. This negative coefficient is, however, lower if
compared to matched workers in the same education (-0.31).19
18The scale of job satisfaction is ranked from 1 to 5.19They do not report the marginal effects after the ordered logit regression. The job satisfaction
in their study is scaled from 1 to 5, but no report on the average job satisfaction level.
24

� In contrast, Amador et al. (2008), Green & Zhu (2010) and Sloane (2014) find
that overeducation has no impact on job satisfaction for Spanish, British and
Australian cases, respectively. Thanks to the questions asking about workers’
skills utilization available in their data set, they find out that those overedu-
cated workers are not overskilled in their jobs. Thus, even though it appears
that their education does not correspond to their jobs, their skills do match.
Consequently, those overeducated workers are not less satisfied than the well-
matched.
� However, McGuinness & Sloane (2011) and Sanchez-Sanchez & McGuinness
(2015) use the Flexible Professional in the Knowledge Society (REFLEX) data,
which cover fifteen European countries, find that overeducation has a significant
negative impact on job satisfaction, but the effect is smaller than overskilling.
For instance, McGuinness & Sloane (2011) find that overskilling reduces the
probability of job satisfaction by 25%, while the effects from overeducation only
decrease the job satisfaction for 17%.20 They explain that some overeducation
may be voluntary as workers trade off for other desirable job characteristics,
hence, it reduces the overall negative effects of overeducation on job satisfaction.
Little attention has been paid as well to the relation between overeducation and
unemployment duration, but results diverge:
� Cuesta (2005) finds an existence of unobserved factors that increase the duration
of unemployment and also reduce the probability of being overeducated among
Spanish youths. Similarly, Pollmann-Schult & Buchel (2005), who use a data
from the West Germany, find that job-seekers with receipt of unemployment
benefits stay unemployed with the length of unemployment spell 40% longer
than those without unemployment benefits, but they face lower risks of exit to
overeducated jobs by 74%. Pollmann-Schult & Buchel (2005) explains that the
lack of unemployment benefits presses some workers to quickly accept a poor
20Both educational and skills mismatch variables were included in the same model. When theyinclude these two variables separately, oversklling reduces job satisfaction by 30% and 28% for thecase of overeducation.
25

matched job, resulting in shorter unemployment duration, which is consistent
with the job search theory (Jovanovic, 1979).
� However, for the Italian case, Rose & Ordine (2010) argue that overeducation is
associated with a longer period of unemployment. Barros et al. (2011) find that
overeducation reduces the probability to find a job by around 10% in France.
More importantly, in Taiwan, Lin & Hsu (2013) find that the overeducated
graduates endure unemployment period for a 79% longer than graduates in a
matched job. They explain these findings as the fact that overeducated workers
may have lesser academic results or lower ability, and in the context of limited
job opportunities, employers seem to pay a strong attention to the schooling
results rather than only the educational level attainment. Hence, overeducated
workers struggle to find a decent job and also must be unemployed for a longer
period, which is aligned with the views from the job competition (Thurow, 1976)
and assignment models (Sattinger, 1993).
Moving to the dynamic case regarding the career mobility of overeducated
workers, the results are also blended:
� Sicherman & Galor (1990) and Sicherman (1991) have empirical supports for
their prediction on higher upward occupational mobility, within or across
firms, among the initially overeducated workers relatively to matched workers
in the United States. Robst (1995a) also shows that overeducated workers are
more likely to move to better paid jobs over time. For the Dutch case, Dekker
et al. (2002) find that career training and overeducation affect upward mobility
positively, suggesting that overeducation is only a temporary phenomenon
that dissolves after workers acquire job-specific skills or their performance is
fully revealed to employers.
� However, Sloane et al. (1999), using a British dataset, find that overeducated
workers change jobs often but no improvements of the match quality. They
explain this phenomenon with two reasons: 1- Perhaps, overeducated workers
have a greater propensity to quit the mismatched job in the hope for better
jobs but fail to find, and 2- Overeducated workers may have lower ability. Next,
26
Buchel & Mertens (2004), using a German data, show that overeducated workers
have worse career prospects than correctly matched workers, and Verhaest &
Schatteman (2010) indicate that more than 40% of graduates in Belgium remain
overeducated seven years after leaving school. These findings are thus in line
with the job competition (Thurow, 1976) and assignment models (Sattinger,
1993) that mismatches are a persistent problem.
There are relatively less researches on the impacts of horizontal mismatch,
yet based on the existing studies, the potential costs of horizontal mismatches appear
comparable to those of overeducation (Domadenik et al., 2013):
� In terms of earnings, Robst (2007b) finds that the horizontally mismatched
graduates earn around 10% less than well-matched in the United States. The
wage effects are smaller when workers accept the position for supply-side reasons
than demand-side reasons. For example, among male workers, the wage penalty
equals 7.9% if they accept a mismatched job owing to their change in career
interests, and 23.2% if due to the unavailability of jobs in their degree fields.
Nordin et al. (2010) and Tao & Hung (2014) also find negative impacts on wage
associated to field of study mismatch in Sweden and Taiwan, respectively. In
Sweden, being mismatched is associated with a 38% and 26% lower income
than being matched for men and women, respectively (Nordin et al., 2010).
In Taiwan, being horizontal mismatched earns 8.2% lower than being matched
(Tao & Hung, 2014). This is slightly lower than the impact of overeducation
that equals 8.3% in the same study (Tao & Hung, 2014).
However, Beduwe & Giret (2011) do not find such effects for the French case,
and Montt (2015) indicates that the cost on earnings is so small. Beduwe &
Giret (2011) argue that horizontal mismatch has no effects on salary because
the human capital acquired in one field might be transferable to another.
� Besides earnings, Wolbers (2003) and Beduwe & Giret (2011) find that field-
of-study mismatch makes workers more likely to quit or search for other jobs.
Beduwe & Giret (2011) also find the negative effects on job satisfaction among
27
vocational graduates in France, especially when it is accompanied by the over-
education.
Few number of studies also investigate the combined impact of horizontal and
vertical mismatches yet remain limited. For instance, in the United States, Robst
(2008) finds that overeducated workers but whose work and field of study are related
earn 2.4% less than well-matched workers. The wage loss increases up to 21.6% for
overeducated workers who report working in a job that is unrelated to their degree
field. Nevertheless, the combined effects are very similar to the effect of overeducation
for the French case owing to the absence of impacts from horizontal mismatches in
the study of Beduwe & Giret (2011).
2.3.2 Impacts at macroeconomics level
There exist various evidences that mismatches have negative impacts at micro-
economics level, especially on individual earnings, even though there are papers that
contradict those findings. Looking at the macroeconomics side, however, very little
work has looked at the effect of educational mismatches on macroeconomic indicators
(McGuinness et al., 2017).
Talking about the role of education at macroeconomics level, we can refer to
the endogenous growth theory that consider education as a factor to increase the
innovation and economic growth of an economy (Lucas, 1988 ; Romer, 1990).
Therefore, overeducation can perhaps generate positive impacts at macro-
economics level for some reasons:
� As predicted by the assignment model (Sattinger, 1993), overeducated workers
are at least more productive than their colleagues in the same jobs. It is thus
more profitable for firms to hire overeducated workers to increase productivity,
which is rather positive for economic growth.
� Similarly, as mentioned by Acemoglu (1999), when the skill composition of labor
force in an economy exceeds a critical threshold, firms are encouraged to create
high skilled jobs. Thus, a bulge of overeducated workers may indicate a stock of
28
high-skilled workers available in a country, which may attract more investments
in high value-added industries, which is good for an economy.
� Furthermore, high educated people seem to take care more about their health
(Ross & Wu, 1995), know how to tackle their life problems (Ross & Mirowsky,
2006) and are associated with lower crime (Hjalmarsson et al., 2015). Therefore,
overeducation might be good for societies and economic development.
However, the negative effects of overeducation may also exist at macro-
economics level for other reasons:
� The fact that the expectations of overeducated workers on the social position
are not fulfilled, will make them dissatisfied and lose their intellectual challenges
(Link et al., 1993). Then, this dissatisfaction, in turn, creates counterproductive
behaviors, such as high rates of absenteeism and turnover, which can harm firm
productivity and subsequently economic growth (Tsang & Levin, 1985).
� Additionally, the lack of pleasure in the job, may deteriorate the workers’ mental
health and make them depressed, thus all higher educated workers will not
necessarily have better health if they cannot use well their abilities in their jobs
(Kornhauser, 1965 ; Gal et al., 2008 ; Bracke et al., 2013 ; Artes et al., 2014).
Hence, this may also provoke negative effects on economic improvement.
� Skott & Auerbach (2005) develop a model in which a rise of the overeducated
persons would increase wage inequality. They argue that if the high educated
workers fail to find the high skilled jobs, they would compete for the low skilled
positions. As a result, they will be overeducated and earn less, while the low
educated workers will become unemployed. Then, the income inequality and
unemployment problems will rise, which is not good for economy.
Regarding the impacts of the horizontal mismatches, it seems to be rather
negative:
� First, the fact that graduates are employed in a job that does not match their
fields of education, may make them dissatisfied, which affects their efforts and
29
cooperation at working place, as the case of overeducated workers (Tarvid, 2012).
Furthermore, people who are graduated in specialized fields may not be able at
all to utilize their acquired skills in their mismatched jobs (Robst, 2008). These
problems could constraint the productivity in an economy, and thus negative
for economic growth.
� Second, the problem of horizontal mismatch may also indicate that the country
produces many graduates in the sectors that need them less, and little graduates
in the fields that strongly require them, which could be bad for the economy
(Cedefop, 2010).
The lack of consensus in the theoretical mechanisms on the role of overeducation
at macroeconomics level incites some researchers to conduct empirical analyses:
� Regarding the positive findings, we can refer to Kampelmann & Rycx (2012)
who find that the Belgium firms’ productivity increases on average by 3.5%
following a one unit increase in mean years of overeducation. This result is more
conforming to the ”human capital approach” in which overeducated workers
are more productive than matched workers in similar jobs, which is good for
economy. Similarly, Ramos et al. (2012) find that overeducation has a positive
impact on economic growth in nine European countries.21 They also argue that a
high number of overeducated workers is positive at the aggregated level because
those workers are more productive than their less qualified counterparts.
� In contrast, Tsang (1987) finds a negative effect of overeducation on the firms’
outputs through low job satisfaction, leading to counterproductive behaviors
in twenty two Bell companies in the United States. Indeed, he finds that one
additional unit in mean years of overeducation decreases the job satisfaction
by 3.3%, and one percent decrease in the value of the job satisfaction is asso-
ciated with a 2.5% decrease in the level of the firms’ output. Next, Guironnet
& Jaoul-Grammare (2009) find that a share increase of overeducated graduates
produces an unfavorable short-term effect on the economic growth for the French
21Those countries are Austria, France, Greece, Italy, Portugal, Romania, Slovenia, Spain andUnited Kingdom.
30
case between 1980 and 2002, owing to the underutilization of skills among the
most qualified workers. Then, conforming to the prediction of Skott & Auerbach
(2005), Budrıa & Moro-Egido (2008) find that mismatches contribute to enlarge
wage differences within education groups in Spain for the period 1994-2001.
Similar result is found by Slonimczyk (2009) who points out that a substantial
fraction of the increase in wage dispersion during the period 1973-2002 in the
United States is due to the increase in overeducation.
Despite various researches have been conducted to analyze educational mis-
matches in developed countries, only a little work has focused on developing countries
where mismatches can be perhaps driven by other factors and the impacts might
be also different.
31

3 Mismatches in developing countries and their
specificity
The literature has shed light on the theoretical and empirical mechanisms that
explain the determinants and impacts of educational mismatches, but mostly in the
context of developed countries. Studying the possible specificity of developing coun-
tries is, however, important.
Indeed, with more than 80% of people living22 and working in low and middle
income countries (ILO, 2016), it is crucial to understand the education-occupation
matching process over there. More importantly, despite a lower unemployment rate
compared to developed nations, many people in developing countries, including high
educated persons, have been working in vulnerable employments in which workers do
not fully utilize their human capital (Fields, 2010). Given that the costs of education-
job mismatches to the economy can be as significant as the costs of unemployment
(Teulings & Gautier, 2004), to understand the labor market distress in developing
countries, educational mismatches should be an indicator to strongly focus. Never-
theless, most of the existing data allowing for the measurement of mismatches are
generally only available for high income economies, which can be the reason why less
researches have been conducted in developing states (McGuinness et al., 2017).
However, some evidence has recently emerged for developing countries related
to the incidence, determinants and impacts of mismatches.
(i) Incidence
The rate of mismatches in developing economies seems to be higher than in
the developed labor markets (McGuinness et al., 2017).
For instance, using the statistical mean and mode measures, Quinn & Rubb
(2006) find that the rates of overeducation in 1991 in Mexico are 18% and 43%,
respectively. They compare their results and find that these rates are higher
than what found, within the same measures, in Portugal (11% and 26%) by
Kiker et al. (1997) and in Hong Kong (14% and 37%) by Ng (2001).23
22Source: http://www.prb.org/pdf13/2013-WPDS-infographic MED.pdf23Kiker et al. (1997) and Ng (2001) also analyze data in the same year 1991.
32

Another evidence is found in the study of Handel et al. (2016). Using the Skills
Toward Employment and Productivity (STEP) data and subjective approach,
Handel et al. (2016) find that the average incidence of overeducation across
eleven developing countries equals 36%. McGuinness et al. (2017) find that these
rates are much higher than those found in developed nations that approximately
equals 25% on average based on the subjective approach too (Figure 8). We also
notice that the rate of overeducation strongly differs between countries, ranging
from 22% in Macedonia to 70% in Vietnam (Figure 9). This might reflect the
difference between the educational level of attainment in each country and the
possibility that some labor markets are more efficient (Handel et al., 2016).
Figure 8: Compared average incidence of overeducation (worker-self-assessment) (%)
Source: Author’s graphic based on data in Table 5.2 of Handel et al. (2016)and Table 2 of McGuinness et al. (2017).
Figure 9: Incidence of overeducation (worker-self-assessment)in developing countries (%)
Source: Author’s graphic based on data in Table 5.2 of Handel et al. (2016).
33
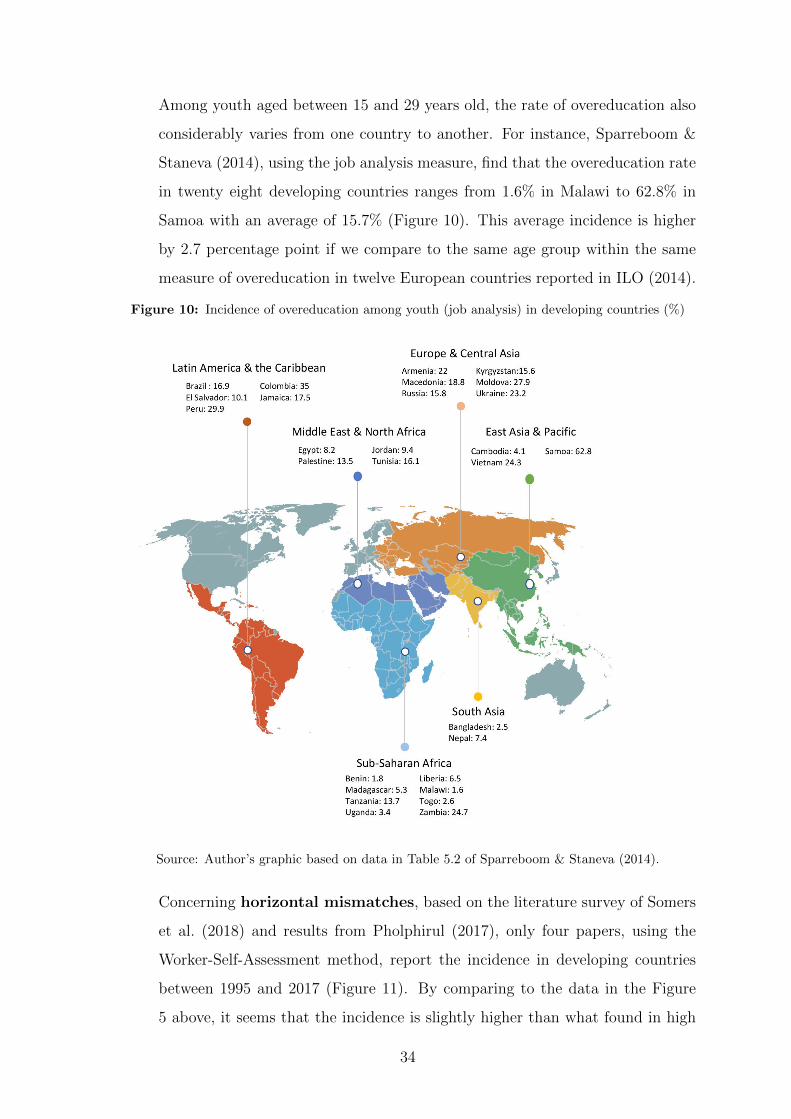
Among youth aged between 15 and 29 years old, the rate of overeducation also
considerably varies from one country to another. For instance, Sparreboom &
Staneva (2014), using the job analysis measure, find that the overeducation rate
in twenty eight developing countries ranges from 1.6% in Malawi to 62.8% in
Samoa with an average of 15.7% (Figure 10). This average incidence is higher
by 2.7 percentage point if we compare to the same age group within the same
measure of overeducation in twelve European countries reported in ILO (2014).
Figure 10: Incidence of overeducation among youth (job analysis) in developing countries (%)
Source: Author’s graphic based on data in Table 5.2 of Sparreboom & Staneva (2014).
Concerning horizontal mismatches, based on the literature survey of Somers
et al. (2018) and results from Pholphirul (2017), only four papers, using the
Worker-Self-Assessment method, report the incidence in developing countries
between 1995 and 2017 (Figure 11). By comparing to the data in the Figure
5 above, it seems that the incidence is slightly higher than what found in high
34

income economies on average (Figure 12).
Figure 11: Incidence of horizontal mismatches (worker-self-assessment)in developing countries (%)
Source: Author’s graphic using data in Table 2 of Somers et al. (2018)and the incidence in Thailand from Pholphirul (2017).
Figure 12: Compared average incidence of horizontal mismatches(worker-self-assessment) (%)
Source: Author’s calculation and graphic based on data in Figures 5 and 11.
Thus, overall, educational mismatches seem to be more prevalent and pervasive
in developing societies (Chua & Chun, 2016 ; McGuinness et al., 2017). Are
there specific factors that explain this higher rate?
(ii) Determinants of educational mismatches
First, based on the available studies, both supply and demand sides factors found
in developed economies, are also estimated to influence the risks of mismatches
in developing countries:
35

� From the supply side related factors, job search constraints play the
most crucial role in developing societies (Chua & Chun, 2016). Indeed, as
predicted by the job search theory (Jovanovic, 1979), a lack of information
in the labor market, a poor public transportation, credit constraints and
no unemployment insurance push workers to find a job as soon as possible,
resulting in poor education-job match outcomes (Chua & Chun, 2016).
Consequently, it is observed that workers with a poor social background
face higher risks of being mismatched because they have low reservation
wages (Chua & Chun, 2016). The same for Lim (2011) who finds that
Malaysian graduates with economically inactive father and from a large
family size are more likely to be overeducated.
Age is also found to be negatively correlated with mismatches in Thailand
(Pholphirul, 2017) like in high income economies, suggesting that young
workers might need to be more trained in their job-specific skills conforming
to the career mobility theory (Sicherman & Galor, 1990). Nevertheless,
Handel et al. (2016) do not find evidence in eleven countries that young
workers are more likely to be overeducated.
While individual preferences for other job attributes, such as less job
pressure, could lead workers to choose a mismatched job in developed coun-
tries (Robst, 2007b ; McGuinness & Sloane, 2011), Chua & Chun (2016)
do not find this evidence among six developing nations.24
� The demand side also has an effect. For example, Mehta et al. (2011) and
Habibi (2015) find that the weak demand for educated workers explains the
high rate of overeducation in Philippines and Iran. Handel et al. (2016)
reach the same conclusion.
However, it is strange to learn that women face lower risks of mismatches
(Filiztekin, 2011 ; Pholphirul, 2017) despite the discrimination against
women is large in the developing societies (Jayachandran, 2015). These
findings also contradict evidences in high income economies, yet Filiztekin
(2011) explains this result as the women decision to not accept mismatched
jobs and prefer to be housewives in traditional societies.
24Those countries are Armenia, China (Yunnan province), Georgia, Lao, Sri Lanka and Vietnam.
36

Apart from the factors that typically drive mismatches in developed nations,
there also exists two specific factors that may push mismatches in developing
countries to be more prevalent: 1- The inefficiency of education system,
and 2- the presence of large informal sector.
(a) Inefficiency of education system
Despite developing countries have made considerable progress in closing
the gap with developed nations in terms of school attainment, the skills
of students remains relatively low, generating concerns on the quality of
education (Hanushek & Woessmann, 2012).
The problem of education quality could increase the risks of mismatches
among many educated workers for two main reasons:
� First, the lack of adequate skills required in high-skilled jobs push
many high educated workers to have no choice besides working in a
lower position or in another study field.
� Second, the lack of skills among the labor force may discourage firms
to invest in high technology sectors, limiting high-skilled job creation
as mentioned by the model of Acemoglu (1999).
For example, the overeducation in Mexico is found to be affected by the
scarcity of education quality rather than a general abundance of educated
workers (Mehta et al., 2011). In other words, workers are overeducated but
not overskilled (Mehta et al., 2011). More alarming, in Egypt in September
2015, a group of university graduates set their PhD and MBA25 certificates
on fire to protest their inability to find suitable jobs despite these advanced
degrees. Habibi & El Hamidi (2016) argue that this fact is somewhat due
to the quality of Egyptian higher education.
Furthermore, many developing countries seem to be less responsive to
what the labor market needs. Indeed, it seems that higher education
institutions produce too many high educated workers in fields that have
less demands such as business-management and related fields, and little
in fields that have strong demands such as engineering (Salama, 2012 ;
25MBA: Master of Business Administration.
37

Hu, 2013 ; Madhur, 2014a ; Ra et al., 2015 ; Habibi & El Hamidi, 2016
; Habibi, 2017 ; Ferreyra, 2017). This creates intensive market tightness
in some disciplines, resulting in a high risk of mismatched among many
graduates from those fields of study.
(b) Informal sector
”Informal sector” is a term to describe the collection of firms, workers and
activities that operate outside the legal and regulatory systems (Loayza,
2016). The informal sector is a widespread phenomenon in the majority
of developing countries by producing about 35% of gross domestic product
(GDP) and employs 70% of the labor force in typical developing economies
(Loayza, 2016). The existence of this informal sector in developing coun-
tries is due to bureaucracy and corruption, combined with the incentive
to avoid the burden of taxation and complex regulation (Loayza, 2016).
A great size of informal sector may increase the risks of educational
mismatches among high educated persons for at least two related reasons:
� First, employment in informal sectors largely comprise jobs with low
skill requirements, and workers are trapped in unproductive activities
with poor career development (Herrera-Idarraga et al., 2015 ; Chua &
Chun, 2016).
� Second, firms in the informal sector face high capital costs because
of restricted access to formal credit institutions, which makes them
difficult to expand their activities, resulting in limited high-skilled job
creations (Loayza, 2016).
For example, Herrera-Idarraga et al. (2015), using micro-data for Colombia,
find that informal salary workers are more likely to be overeducated than
formal workers. Similarly, Handel et al. (2016) find that working in formal
jobs are associated with a better education-job match in their analysis on
eleven developing countries. In addition, workers in the informal sector
tend to have not only higher probabilities of overeducation, but also higher
risks of a horizontal mismatch than workers in the formal sector in Thailand
(Pholphirul, 2017).
38
Thus, the quality of education system and informal sector may contribute
to put graduates under higher risks of mismatches in developing economies, but
do mismatches also generate negative impacts in those countries?
(iii) Impacts of educational mismatches
Given the low educational attainment, a higher return to education in developing
countries is what we may expect for. Unfortunately, education-job mismatches
also impact individual outputs such as earnings and job satisfaction in a similar
way to what has been observed in high income countries.
For instance, Quinn & Rubb (2006), Filiztekin (2011) and Reis (2017) find that
the returns for overeducation are about a half of required education in Mexico,
Turkey and Brazil, respectively. Chua & Chun (2016) reach the same results
when they estimate on the STEP data concerning six developing countries.
These impacts are at the same magnitude to results in high income economies
mentioned above. Then, Herrera-Idarraga et al. (2015) investigate Colombia
and find that the overeducated workers in the informal sector suffer a larger
wage penalty compared to their counterparts in the formal sector.
Pholphirul (2017) focuses on both forms of mismatches and finds the negative
impacts of horizontal mismatches on workers’ incomes in Thailand but with a
weaker effect than vertical mismatches. Workers affected by overeducation have
a lower income than workers whose jobs fit with educational qualifications by
18.6%, while workers with horizontal mismatches have lower incomes by about
7.2%. These findings reveal that the negative impact of overeducation seems to
be higher than in developed countries if we compare to the average of 15.3%
calculated by McGuinness (2006), while the effect from horizontal mismatches
is lower if we compare to the study of Robst (2007b) in the United States (10%).
Negative effects of mismatches on the job satisfaction are also found among
graduates in Malaysia (Lim, 2011 ; Zakariya & Battu, 2013).
We notice that those developing countries in the existing studies relatively con-
cern more advanced economies than Cambodia, we propose therefore to extend the
research on the impacts of mismatches to this latter country that has just upgraded
39
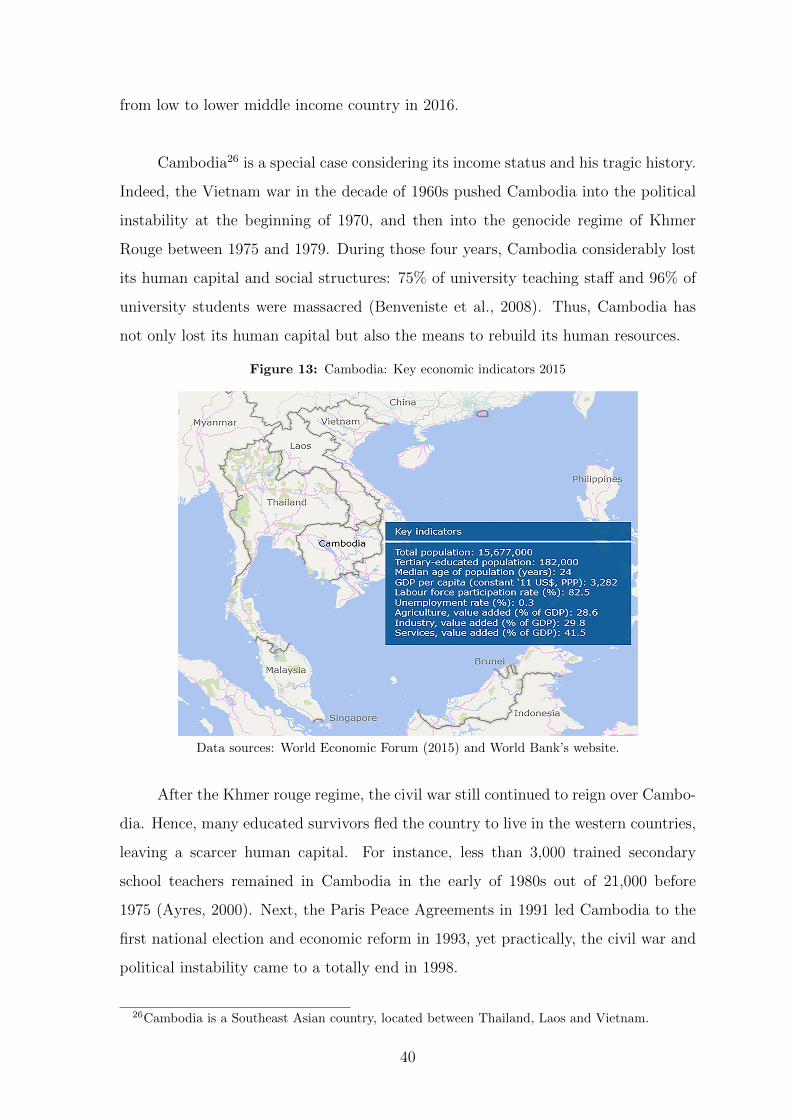
from low to lower middle income country in 2016.
Cambodia26 is a special case considering its income status and his tragic history.
Indeed, the Vietnam war in the decade of 1960s pushed Cambodia into the political
instability at the beginning of 1970, and then into the genocide regime of Khmer
Rouge between 1975 and 1979. During those four years, Cambodia considerably lost
its human capital and social structures: 75% of university teaching staff and 96% of
university students were massacred (Benveniste et al., 2008). Thus, Cambodia has
not only lost its human capital but also the means to rebuild its human resources.
Figure 13: Cambodia: Key economic indicators 2015
Data sources: World Economic Forum (2015) and World Bank’s website.
After the Khmer rouge regime, the civil war still continued to reign over Cambo-
dia. Hence, many educated survivors fled the country to live in the western countries,
leaving a scarcer human capital. For instance, less than 3,000 trained secondary
school teachers remained in Cambodia in the early of 1980s out of 21,000 before
1975 (Ayres, 2000). Next, the Paris Peace Agreements in 1991 led Cambodia to the
first national election and economic reform in 1993, yet practically, the civil war and
political instability came to a totally end in 1998.
26Cambodia is a Southeast Asian country, located between Thailand, Laos and Vietnam.
40

Since that time, Cambodia has been active to rebuild its education system, and
a strong investment in higher education has been observed in the decade of 2000s. In
fact, seeing increasing demands for high educated workers after economic reform and
with the privatization of higher education sector in 1997, investors started investing in
the education field (Chen et al., 2007). For example, the number of higher education
institutions (HEI) massively increased from fourteen (14) in 2000 to one hundred and
five (105) in 2014 (Un, 2015) (Figure 14). The number of the students enrolled in
tertiary education was also rapidly increased from twenty-thousand (20,000) students
in 2001 to two hundred and fifty thousand (250,000) in 2014 (Un, 2015) (Figure 15).
Figure 14: Number of HEI in Cambodia
Data source: DHE, MoEYS (2014) reported in Un (2015).
Figure 15: Number and ratio (%) of enrollment in tertiary education in Cambodia
Data sources: UNESCO’s and World Bank’s websites.Data links: https://data.worldbank.org/indicator/SE.TER.ENRR?locations=KH
http://data.uis.unesco.org/index.aspx?queryid=142
41

Nevertheless, there exist concerns about the inefficiency of the education
system due to corruption and weak governance (ADB and ILO, 2015). Furthermore,
the bureaucracy also plays a main role in the existence of a large informal sector
in Cambodia (EIC, 2006). These two problems could make graduates lack of ade-
quate skills required by the labor market on the one hand, and limit high-skilled jobs
creation, thus lack of demand for graduates in the market on the other hand.
(i) Inefficiency of education system in Cambodia
One of the biggest risks of corruption in education system is the message it sends
to students and educational staff that personal success comes, not through hard
work, but through favoritism and bribery (D. W. Chapman & Lindner, 2016).
Because of corruption, many private higher education institutions (HEI) in
Cambodia gained official recognition without following a clearly defined process
(Ford, 2015). Indeed, by international comparison, most HEI are very small with
narrow academic and resource bases (Mak, 2005). Additionally, the considerable
competition among those private institutions led to the lowering of fees, followed
by the reduced revenue, and coupled with inattention to support quality,
results in weak HEI and expressed in high graduates’ unemployment rate
(Ford, 2015).
According to the Cambodian labor force survey in 2012 (NIS, 2012), the rate
of unemployment among university graduates was 7.7% against 2.7% of people
with only secondary education. This figure is inverse to what happens in the
developed and also several developing countries where higher educated persons
face lower risks of unemployment (Figure 16). Thus, the privatization might
lead to an emphasis of knowledge as as a marketable commodity rather than a
social good (Lee, 2003).
42

Figure 16: Unemployment rate (%) by level of education in 2012*
*Unemployment rate in Indonesia is in 2013.
Data sources: NIS, 2012 for Cambodia and OECD’s website for other countries.
Concerns also exist regarding the quality of public higher education institu-
tions. The same to private institutions, most teachers do not focus on research
and several of them hold just a bachelor’s degree (40%) (D’Amico, 2010). Only
6% of lecturers hold PhD degree27 and about 85% of them never published any
papers (Chen et al., 2007). 90% of the lecturers never had technical discussion,
and even though there is a library at each university, books and study materials
are not up-to-date and inadequate (Chen et al., 2007).
Rewards and incentives are also insufficient to attract and retain qualified staff
(ADB, 2011). For instance, teachers are found to be paid just 60% of what
received by an average Cambodian worker with similar qualifications (Tandon
& Fukao, 2015). As a result, they teach many hours and do not have time
for interaction with students, nor for updating their teaching lessons. Further-
more, the lack of government funding is another factor making the teachers
and students lack of incentive to do researches, which contributes to poor
quality in higher education (Chen et al., 2007) (Figures 17 and 18).
27We do not know how many of them were graduated in Cambodia that could also raise a questionon the quality of education.
43
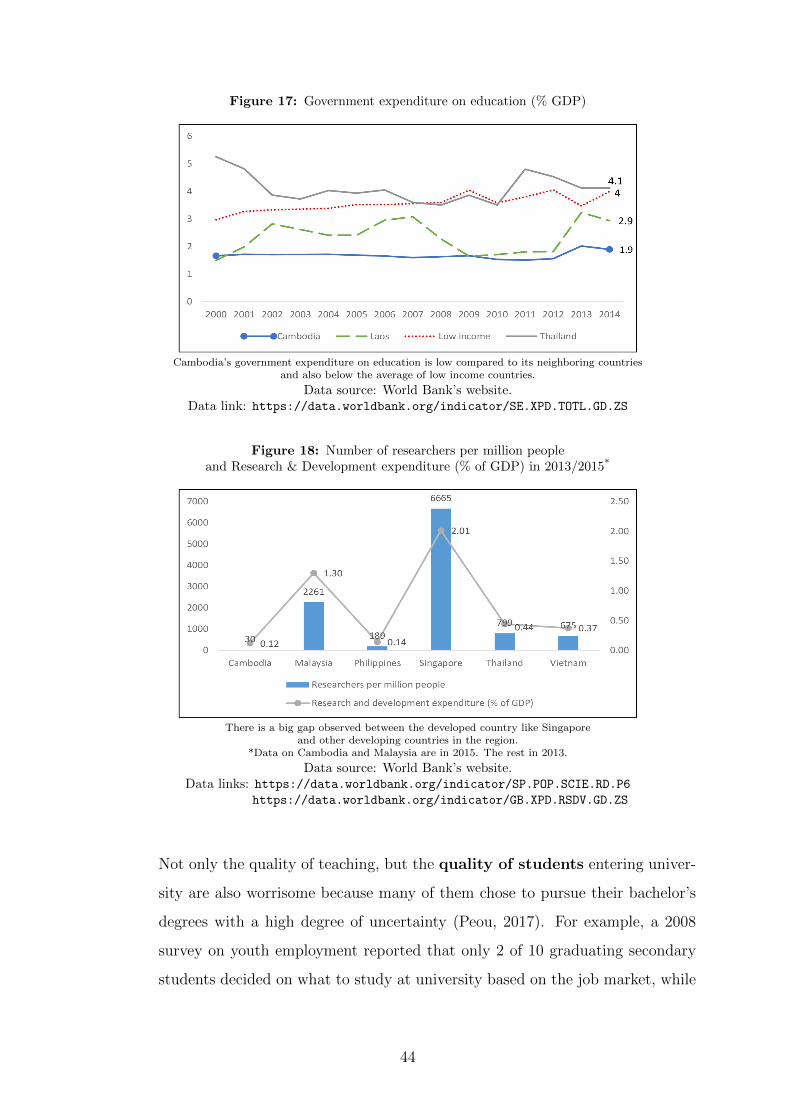
Figure 17: Government expenditure on education (% GDP)
Cambodia’s government expenditure on education is low compared to its neighboring countriesand also below the average of low income countries.
Data source: World Bank’s website.Data link: https://data.worldbank.org/indicator/SE.XPD.TOTL.GD.ZS
Figure 18: Number of researchers per million peopleand Research & Development expenditure (% of GDP) in 2013/2015*
There is a big gap observed between the developed country like Singaporeand other developing countries in the region.
*Data on Cambodia and Malaysia are in 2015. The rest in 2013.
Data source: World Bank’s website.Data links: https://data.worldbank.org/indicator/SP.POP.SCIE.RD.P6
https://data.worldbank.org/indicator/GB.XPD.RSDV.GD.ZS
Not only the quality of teaching, but the quality of students entering univer-
sity are also worrisome because many of them chose to pursue their bachelor’s
degrees with a high degree of uncertainty (Peou, 2017). For example, a 2008
survey on youth employment reported that only 2 of 10 graduating secondary
students decided on what to study at university based on the job market, while
44

7 of 10 followed their parents’ advice (Di Gropello, 2011).28 A recent survey also
shows that only about 30% of the students chose their major based on the mar-
ket demand (AUPP’s29 website, 2015).30 Lack of information seems to be one
of the main reasons to explain why less students consider the market demand
in their decisions as there is no reliable tracking of the employment outcomes
of recent university graduates (Di Gropello, 2011).
Furthermore, during the examinations, in several classes and schools since the
primary education, corruption exists as students can pay money to teachers in
order to work in groups, to cheat, to use phone or copy answers from other
students (Brehm, 2016). After the examination, it is also possible for students
to purchase higher grades.
To fight against this issue, the new Minister of Ministry of Education, appointed
in 2013, has done a reform in the education system since 2014, especially on the
national examination of high school terminal class. Note that before 2014, it
is widely recognized that many students pay their exam controllers to cheat
during this national examination, and as a result, more than 80% of students
passed the exam each year (ILO and ADB, 2015). However, in 2014, when
exam controllers did not accept the students’ money anymore thanks to the
reform, thus high risks of being fired, only 26% of students completed the
exam successfully.31 This indicates that before 2014, many students might be
not qualified to pursue higher education.
Despite the reform, more improvements are still required. Indeed, 73% of 220
employers think that university graduates do not have required skills in the
jobs they ask for (World Bank, 2012). Bruni et al. (2013) find a similar result
with 78% of 762 employers complain about the preparedness of newly hired
university graduates. Another report finds a less negative opinion with 34% of
45 employers are dissatisfied with the college graduates’ skills, but this figure is
28The author does not clearly indicate if it is possible that students make the decision based onboth the job market demands and parents’ advice.
29AUPP: American University of Phnom Penh.30Reference: http://www.aupp.edu.kh/2015/07/01/study-shows-60-of-cambodian-students
-choose-majors-based-on-personal-interest/31Due to a low number of students passed the exam, a second session was exceptionally allowed
for that year and which brought the total pass rate above 40%.
45

still higher than several countries in the region (Figure 19) (EMC, 2014).
Figure 19: Dissatisfaction of employers with the skills of college graduates (%)
*ASEAN, composed of ten member nations, stands for Association of South-East Asia Nations.That report does not include Brunei, Thailand and Vietnam in their analysis.
Data source: Author’s graphic based on data in the report of (EMC, 2014).
Concerns also exist regarding the inadequacy between supply and demand
for some fields of education: 50% are enrolled in business-management related
fields and only 3% in engineering fields, while Cambodia has been facing a rising
demand for engineers (Madhur, 2014a, p.1 ; D’Amico, 2010, p.7) (Figures 20
and 21).
Figure 20: Student enrollment by fields of education in Cambodia in 2011
Data source: Un (2015).
46

Figure 21: Evolution of Cambodia’s economic sectors, value added (% of GDP)
The industry sector in Cambodia has known an increased shareto the detriment of the agriculture sector.
Data source: World Bank’s website.Data links: https://data.worldbank.org/indicator/NV.AGR.TOTL.ZS?locations=KH
https://data.worldbank.org/indicator/NV.IND.TOTL.ZS?locations=KH
https://data.worldbank.org/indicator/NV.SRV.TETC.ZS?locations=KH
This horizontal mismatch seems to also occur in other countries in the region,
but Cambodia seems to face a more severe mismatch (Figures 22 and 23).
Figure 22: Graduates by fields of education (%) in Cambodiaand in some ASEAN countries in 2015*
*Data on Indonesia is in 2014.
Data source: UNESCO’s website.Data link: http://data.uis.unesco.org/index.aspx?queryid=163
47

Figure 23: Manufacturing sector (% of GDP) andGraduates in Engineering, Manufacturing & Construction (%) in 2015*
*Data on Indonesia is in 2014.
Data sources: World Bank and UNESCO’s websites.Data links: https://data.worldbank.org/indicator/NV.IND.MANF.ZS
http://data.uis.unesco.org/index.aspx?queryid=163
Besides the problems of the education efficiency, Cambodia also faces a great
size of informal sector, which may limit the high skilled jobs creation.
(ii) Important size of informal sector in Cambodia
In 2007, the informal economy represented 46% of Cambodian GDP (ADB and
ILO, 2015). In 2011, 99.8% of business establishments and 73% of employment
in Cambodia were accounted for by micro, small, and medium-sized enterprises
(MSMEs), and most of them (about 95%) are in the informal sector (ADB and
ILO, 2015).
Again, a high corruption burden and weak governance in Cambodia can be
linked to explain a major part of a substantial size of the informal economy
(EIC, 2006). In 2017, based on the transparency international index, Cambodia
scored only 21/100 and was ranked at 161/180, considered as one of the most
corrupt countries (Figure 23). In a survey of EIC (2006), business operators cite
many reasons why it is better to remain informal in Cambodia. In those reasons,
avoiding the government bureaucracy, which makes the cost of doing business
becoming prohibitive, is a very compelling reason. Business operators have no
incentives to apply for formal business status unless they intend to engage in
exporting and importing activities. According to the same survey, tax evasion
and a lack of trust in the transparency of the government’s tax management are
48
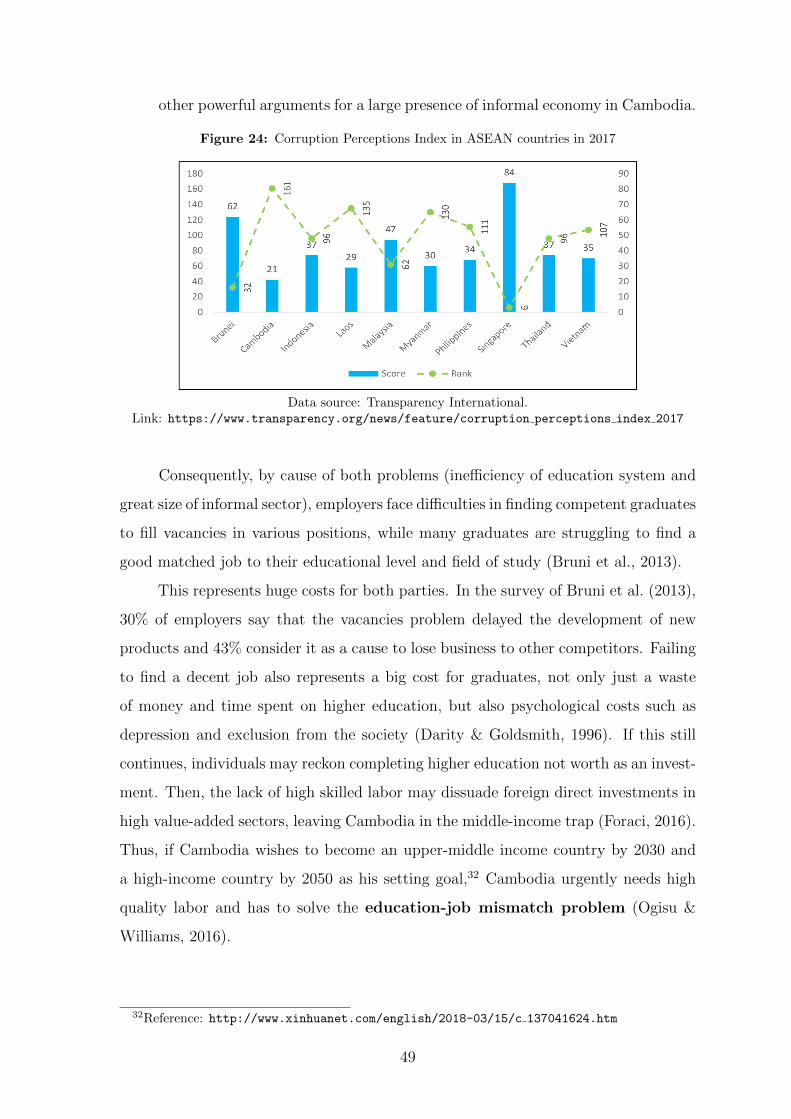
other powerful arguments for a large presence of informal economy in Cambodia.
Figure 24: Corruption Perceptions Index in ASEAN countries in 2017
Data source: Transparency International.Link: https://www.transparency.org/news/feature/corruption perceptions index 2017
Consequently, by cause of both problems (inefficiency of education system and
great size of informal sector), employers face difficulties in finding competent graduates
to fill vacancies in various positions, while many graduates are struggling to find a
good matched job to their educational level and field of study (Bruni et al., 2013).
This represents huge costs for both parties. In the survey of Bruni et al. (2013),
30% of employers say that the vacancies problem delayed the development of new
products and 43% consider it as a cause to lose business to other competitors. Failing
to find a decent job also represents a big cost for graduates, not only just a waste
of money and time spent on higher education, but also psychological costs such as
depression and exclusion from the society (Darity & Goldsmith, 1996). If this still
continues, individuals may reckon completing higher education not worth as an invest-
ment. Then, the lack of high skilled labor may dissuade foreign direct investments in
high value-added sectors, leaving Cambodia in the middle-income trap (Foraci, 2016).
Thus, if Cambodia wishes to become an upper-middle income country by 2030 and
a high-income country by 2050 as his setting goal,32 Cambodia urgently needs high
quality labor and has to solve the education-job mismatch problem (Ogisu &
Williams, 2016).
32Reference: http://www.xinhuanet.com/english/2018-03/15/c 137041624.htm
49

Despite some technical reports written by the World Bank, Asian Development
Bank (ADB) and International Labour Organization (ILO), have already found that
many graduates in Cambodia suffer educational mismatches, the impacts of these
mismatches on graduates’ outcomes in the labor market were not clearly quantified.
Those reports are descriptive researches based on interviews with stakeholders in
higher education sector. Overall, they argue that there has been existing an over-
supply of graduates in many fields except engineering and health sciences, but even
with oversupply, employers are still difficult to fill many positions due to the lack of
skills among graduates.
To understand deeper about this current issue, we need more accurate analyses
on the impacts of educational mismatches among graduates in Cambodia, which
is the main objective of this thesis.
50
4 Data, research questions and methods
Given a limited number of academic researches on the education-job mismatches
in developing countries, the objective of this thesis is to investigate the impacts of
educational mismatches in developing countries with a special focus on the
Cambodia’s case.
We propose three chapters: We begin with a theoretical and empirical analysis
in the chapter 1, and we continue with two other empirical chapters. However, to
realize our empirical tests, we confront a main challenge related to the lack of data
on educational mismatches.
Having found information regarding individual employment and educational
attainment in the report of ”Cambodian National Labor Force survey 2012”, we
requested for the data from the National Institute of Statistics (NIS), hopefully it
would be useful for our empirical analysis. Unfortunately, our request was rejected
because of some bureaucracy problems.33
Consequently, for the first two chapters of this thesis, we use two other surveys
on the employability of Cambodian graduates, in which the thesis’s author has been
involved for the second survey, but they are not national representative. Then, in
the third chapter, to open to more internationally, another data from the Integrated
Public Use Microdata Series International (IPUMSI) was employed for estimating the
rate of overeducation across many developing countries.
(A) Data description
� The first survey data, for the first chapter, was conducted in 2011 by the
University Research Center in Economics and Management (URCEM) and
led by the professor Jean-Jacques Paul, ex-project manager of the French
Department in economics and management at the Royal University of Law
and Economics (RULE). That data collection was financed by the French-
speaking University Agency, known as AUF. The database contains the
sample of 4,025 bachelor’s graduates in 2008, representative of nineteen
higher education institutions (HEI) in Phnom Penh, Capital of Cambodia.
33We were asked to find someone who has a high position in the government to guarantee that ouranalysis would not affect the government’s reputation.
51

� The second data, for the second chapter, was conducted in 2014 by the
thesis’s author on behalf of URCEM’s researcher. This data collection was
financed by the World Bank under the project ”Higher Education Quality
and Capacity Improvement Project (HEQCIP)”.34 The aim of this data
collection was to update labor market information such as employments
and wages from the previous survey, and also the awareness of Cambodian
graduates toward the ASEAN economic integration at the end of 2015.35
This second database contains a sample of 1,050 bachelor’s graduates in
2011, representative of eight HEI in Phnom Penh, in which four are public
and four are private institutions.36
Those interviewed individuals (in both waves of data) were graduated from
eight aggregated fields of study:37 1- Economics and Management, 2- En-
gineering and Architecture, 3- Information and Computer Technologies,
4- Sociology and Humanities, 5- Social sciences in English language, 6-
Tourism and Hospitality, 7- Law and Public Affairs and 8- Sciences.
We determine our sample size based on our time constraints and available
contact lists. Then, we use the quota method in which the number of inter-
viewed graduates is proportional to the number in our study population.
For example, if the percent of graduates who finished a bachelor’s degree
in Economics and Management accounted for 40% in our population, 40%
of students interviewed would be also graduated from this field. Then, if
25% of economics-management graduates come from the Royal University
of Law and Economics (RULE), 25% of interviewees in this field would be
also from the RULE. Next, we also divided graduates in this aggregated
field proportionally to each specific major of the field (e.g., from economics
development, business management, etc.).
34Our sub-project was rewarded among the best nine sub-projects out of all forty-five sub-projectsconducted by a total of twenty-four HEI under the HEQCIP project.
35The questionnaire is available in the Appendix: A.36We requested for graduates’ contact lists from twenty HEI, but only eight accepted. Other HEI
said that they did not register any contacts of their graduates, and some HEI did not reply us at all,despite several following-ups. We also contacted the Department of Higher Education for assistance,but we were asked for paying some fees. However, it was prohibited in the World Bank’s project topay public staff for any services. Thus, we could interview only graduates from eight HEI.
37A detail on study majors including in these aggregated fields is available in the Appendix: B.
52

After that, the interviewed graduates were randomly chosen from each
study field, and the interviews were conducted by phone, using the phone
numbers provided in the contact lists. Sometimes, owing to the changes of
graduates’ phone numbers, we needed to request the new phone numbers
from the fellows at the moment of the interview. To realize the interviews,
we employed twenty-five fourth year students of the French cooperation in
economics and management at RULE, who had been previously trained in
a subject related to the survey technique.
Before the final questionnaire was put into use, it was tested to determine
if the questions were properly worded and could be understood well by
both interviewers and interviewees. The questionnaire was re-examined
and revised before finalization. After collecting all questionnaire answers,
we also checked the reliability of responses, by randomly contacting some
interviewees to see if they were really contacted for interviews, for how
many questions and many minutes approximately.
These two surveys provide information regarding individual characteristics,
and graduates’ occupations that are classified following the International
Standard Classification of Occupations (ISCO) and what majors they were
graduated from. We can thus define which graduate is overeducated and
horizontal mismatched based on the job analysis (JA) measure.
� The third chapter, focusing more internationally on several developing
countries, uses the Integrated Public Use Microdata Series International
(IPUMSI).38 The IPUMSI data provides integrated series of census micro
data samples from many countries since 1960.
However, as other typical data, there is no information on education-job
mismatches, yet the obvious advantage of the IPUMSI samples is that
they classify homogeneously the key variables such as educational level
and occupations. Therefore, we can estimate the rate of overeducation
by using the job analysis or statistical analysis methods, in a comparable
way between different countries. Unfortunately, IPUMSI does not record
38Data source: https://international.ipums.org/international/
53

data on individual fields of education, making impossible to evaluate the
incidence of horizontal mismatch.
(B) Research questions and methods
Based on our research objective and available data, three research questions
were formulated, which constitutes three chapters of this thesis.
� Chapter 1 seeks to answer the question: ”What factors influence the
transition duration from school to work and do educational mis-
matches decrease unemployment duration?”
As we have seen in the section 2.3, the relation between mismatches and
unemployment duration is not clear. If education-job mismatches are only
driven by the search frictions in the labor market, the job search theory
(Jovanovic, 1979) predicts that mismatches can decrease unemployment
duration, and mismatches are a temporary phenomenon. However, if mis-
matches are also caused by the lack of job opportunities as mentioned by
the job competition model (Thurow, 1976), several graduates may face
higher risks of mismatches and longer unemployment duration.
In addition, the theoretical uncertainty is not resolved by empirical studies.
The analytic methods of this chapter are divided in two parts. First, the
theoretical model uses a job matching model to explain the mechanism
linking unemployment duration and educational mismatches. Second, the
empirical model uses an independent competing-risks regression, allowing
to test the theoretical predictions.
Having learned that unemployment duration is not a sole possible out-
put affected by mismatches, we propose to examine another output: The
individual earnings.
� Chapter 2 seeks thus to answer the question: Do education-job mis-
matches decrease wages?
Following the assignment model (Sattinger, 1993), working in a mismatched
job may not allow individuals to fully use their potential skills, and as a
result, they would earn lower wages.
54
Many empirical researches also find that mismatches have negative effects
on wages, but no consensus has been reached. Additionally, less researches
analyze in the context of developing countries and the combination effects
of vertical and horizontal mismatches. Furthermore, previous researches
did not consider yet the endogeneity of educational mismatches in the
combination of their two forms.
Thus, the empirical method used in this chapter is the ordered Heckman
selection model that considers the selection bias problem of educational
mismatches.
Given that the first two chapters analyze at microeconomics level among
graduates in Cambodia, we propose for the third chapter to switch the
level of analysis to more macroeconomics and more internationally with an
attention on thirty eight developing countries.
� Chapter 3 seeks to answer the question: What is the impact of over-
education on economic growth in developing countries?
The effects of overeducation on the economic growth are not evident. Over-
educated workers are more productive than their counterparts in the same
job (Sattinger, 1993). Additionally, a bulge of overeducated workers may
indicate a high human capital stock that may attract more foreign direct
investments (FDI) in high-technology sectors (Acemoglu, 1999). Therefore,
this is positive for economic growth. However, from the job satisfaction
approach, overeducated workers may possess counterproductive behaviors
(Tsang & Levin, 1985). This can lower the outputs and constraint the
development of firms, which is negative for economic growth.
Little empirical researches also analyze the impacts of overeducation on
economic growth but the results diverge as well.
To deal with unobserved heterogeneity between countries and endogenous
problem of overeducation, two-stage least squares regression with country
fixed-effects is estimated in this chapter.
55

The figure below presents the structure of this thesis:
Figure 25: Structure of the thesis
56

5 Thesis contributions
This thesis contributes to the literature by proposing several complements:
First, we contribute in terms of data on educational mismatches, which allows
to analyze their impacts at both microeconomics and macroeconomics level in
developing countries: 1- Two surveys concerning education-job mismatches among
graduates in Cambodia, allowing to examine the impacts of educational mismatches
on the individual unemployment duration and earnings, and 2- one database
with the estimation of overeducation rate in thirty-eight developing countries,
allowing to analyze the impacts of mismatches on their economic growth. Previous
researches did not investigate yet the impacts of education-job mismatches on a low
income country like Cambodia. In addition, no analysis exists neither regarding the
impacts of mismatches at macroeconomics level in developing countries.
Second, we propose both theoretical and empirical investigations in the
chapter 1. We also analyze education-job mismatches with their both forms (vertical
and horizontal forms) and their both dimensions (single and double mismatch)
in the chapters 1 and 2. Only a limited number of previous researches has examined
the impacts of mismatches from their both forms and dimensions. In addition, we
also take into account the endogenous problem of mismatches, and thus their
determinants, while the majority of researches supposes education-job mismatches
as exogenous.
Third, our thesis may attract educational policy makers in Cambodia to pay
more attention on the impacts of education-job mismatches among graduates in Cam-
bodia. This may incite them to consider appropriate policies to solve the problems.
This thesis may also draw attention of other Cambodian scholars to pursue researches
on education-job matching to support the coordination between the education system
and labor market in Cambodia. The third chapter that focuses on several developing
countries, might be an interest for other foreign scholars to conduct further researches
on this issue in other developing nations.
57
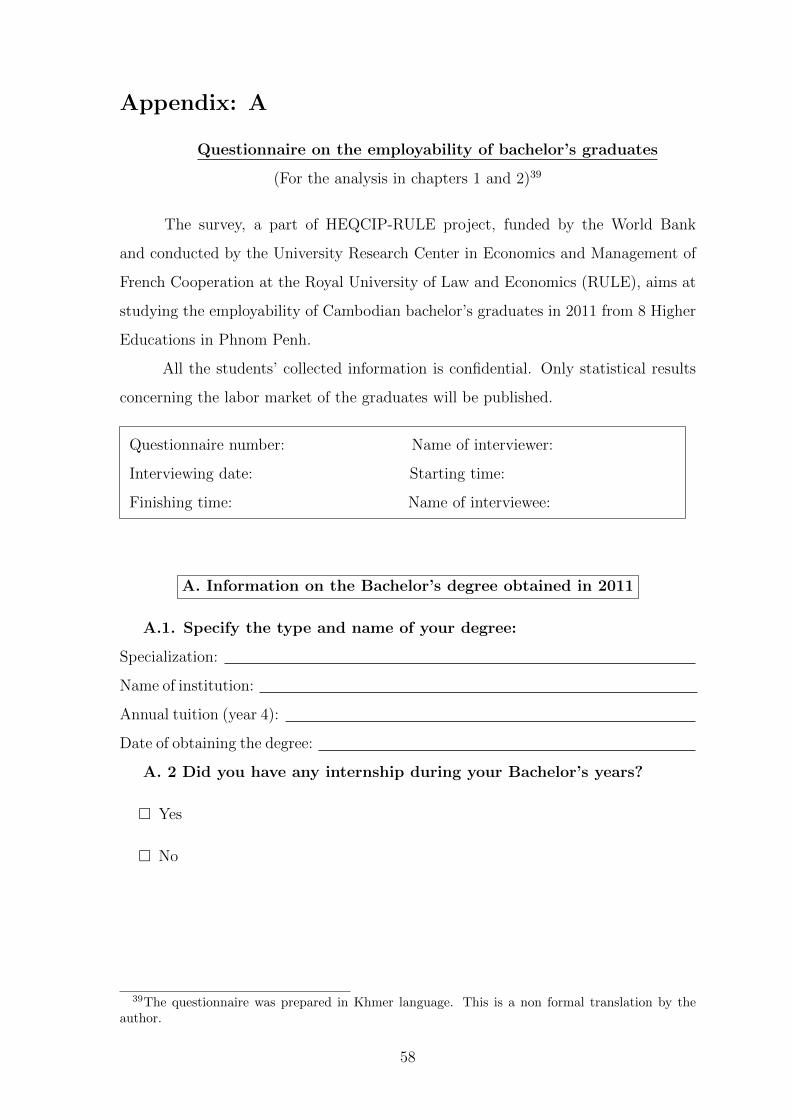
Appendix: A
Questionnaire on the employability of bachelor’s graduates
(For the analysis in chapters 1 and 2)39
The survey, a part of HEQCIP-RULE project, funded by the World Bank
and conducted by the University Research Center in Economics and Management of
French Cooperation at the Royal University of Law and Economics (RULE), aims at
studying the employability of Cambodian bachelor’s graduates in 2011 from 8 Higher
Educations in Phnom Penh.
All the students’ collected information is confidential. Only statistical results
concerning the labor market of the graduates will be published.
Questionnaire number: Name of interviewer:
Interviewing date: Starting time:
Finishing time: Name of interviewee:
A. Information on the Bachelor’s degree obtained in 2011
A.1. Specify the type and name of your degree:
Specialization:
Name of institution:
Annual tuition (year 4):
Date of obtaining the degree:
A. 2 Did you have any internship during your Bachelor’s years?
� Yes
� No
39The questionnaire was prepared in Khmer language. This is a non formal translation by theauthor.
58

B. Information on other training courses
B.1. In addition to the major skill you studied in the Part A, were you
enrolled in other courses? Include only course lasting at least 6 months.
� Yes
� No (Go to question C1)
B.2. Please provide information related to this course!
Specialization:
Level of study (Bachelor/Master/Short-course):
Name of institution:
Annual tuition:
B.3. For this supplementary education, what is your situation?
� You are still studying
� You finished it
� You abandoned it
C. Transition from studies to employment
C.1. Have you ever had a paid job before your graduation in 2011?
� Yes
� No (Go to question C.4)
C.2. If yes, please indicate your position and functions:
Position:
Functions:
C.3. Have you continued the job until now?
� Yes (Go to question C.7)
� No
59

C.4. After having finished your study in 2011, have you ever had a paid
job? Including independent job
� Yes
� No (Go to question H.1)
C.5. When did you start working after your graduation in 2011?
Date:
C.6. How many months did you spend to get this job?
Answer:
C.7. How did you find this job? (multiple choices possible)
� Newspapers � Internet
� I contacted the employer � I was contacted by the employer
� Through internship/job during study � Through family/friends
� Through the career forum � I run my own business
� Other, please specify:
D. Professional curriculum
D.1. How many employers in total have you worked for since your
graduation in 2011?
Include yourself if you are self-employed.
Include your current employer.
Number of employers:
D.2. How many months in total have you been employed since your
graduation in 2011?
Answer:
D.3. In the final year, have you ever participated in any training related
to your job?
� Yes! Number of hours per week:
� No
60
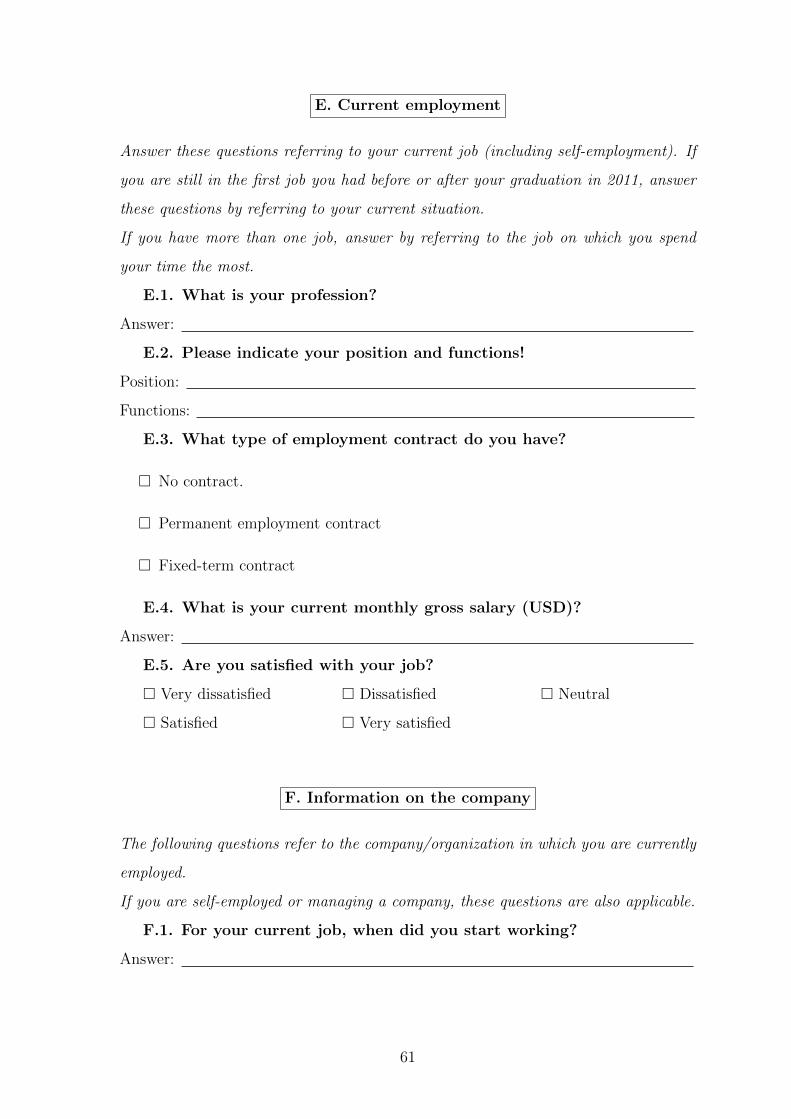
E. Current employment
Answer these questions referring to your current job (including self-employment). If
you are still in the first job you had before or after your graduation in 2011, answer
these questions by referring to your current situation.
If you have more than one job, answer by referring to the job on which you spend
your time the most.
E.1. What is your profession?
Answer:
E.2. Please indicate your position and functions!
Position:
Functions:
E.3. What type of employment contract do you have?
� No contract.
� Permanent employment contract
� Fixed-term contract
E.4. What is your current monthly gross salary (USD)?
Answer:
E.5. Are you satisfied with your job?
� Very dissatisfied � Dissatisfied � Neutral
� Satisfied � Very satisfied
F. Information on the company
The following questions refer to the company/organization in which you are currently
employed.
If you are self-employed or managing a company, these questions are also applicable.
F.1. For your current job, when did you start working?
Answer:
61

F.2. In which sector do you work?
� Public � Non Governmental Organization
� Private � Other, please precise:
F.3. Where is the location of your company?
City/province:
F.4. What is the total number of employees in your company?
� 1-9 � 10-49 � 50-99 � ≥ 100
G. Information on other jobs
G.1. Besides your main job, do you have other jobs?
� No (Go to question H1)
� Yes
First occupation:
Second occupation:
G.2. How many hours per week do you spend on these jobs?
Answer:
G.3. On average, how much do you earn from these supplement jobs?
Answer:
H. Evaluation on study program
H.1. If you could go back to the past, would you still choose the same
major and in the same HEI?
� Yes.
� No, I would choose another major, but in the same HEI.
� No, I would choose the same major, but in another HEI.
� No, I would choose another major and in another HEI.
� No, I would choose not to pursue my bachelor’s degree.
62

I. Information on funding of studies
I. 1 How did you finance your studies and your living during your bachelor’s
degree?
� Parents � Family � Self-finance
� Company’s fund � NGO’s fund � Scholarship
� Loan from banks or microfinance � Other, please precise:
J. Value and preferences
J. 1. Please indicate the importance you personally attach to these
following items and how they apply to your case.
If you are not currently employed, complete only column A.
Job characteristicsImportance for you Implication in the job
1 2 3 4 5 1 2 3 4 5
Work independently
Opportunities to learn new things
High salary
New challenges
Good perspectives in the career
Good social status
Opportunity to do useful things for commu-
nity
Reconciliation of work and family life
K. Knowledge and preparedness for ASEAN integration in 2015
K.1. Do you know the date of the ASEAN integration?
� Yes. Please precise the date:
� No
K.2. Do you know that after the integration, there will be free move-
ment of skilled workers in ASEAN?
� Yes.
� No.
63

K.3. What is your opinion on this mobility?
� I think that is good. (Skip K.5)
� I think that is not good. (Go to K.5)
� I think it can be both good and bad.
K.4 Why do you think it is good?
� Young Cambodians will have more opportunities to work abroad.
� Young Cambodians will be able to improve their skills through competition.
� Young Cambodians will learn and understand better the cultures of ASEAN.
� Other. Please precise:
K.5 Why do you think that is not good?
� Young Cambodians will encounter difficulties in finding a job.
� The inflows of foreigners and their cultures.
� Economy of Cambodia remains weak and so could not accept the integration.
� Other. Please precise:
K.6. Have you done anything to prepare yourself for the eventual chal-
lenge from this integration?
� Yes, I did.
� No, not at all. (Go to K.8)
K.7 What are your preparations?
� I am working harder on my studies and jobs.
� I try to understand more the cultures of ASEAN.
� I try to follow the information on the integration of ASEAN.
� I am improving more my English language.
64

� I learn other ASEAN languages.
� Other. Please precise.
K.8. Are you confident to challenge other young people from ASEAN?
Low self-confident High Self-Confident
� 1 � 2 � 3 � 4 � 5
L. Personal Information
L.1. Gender:
� Male
� Female
L.2. Birth year
Answer:
L.3. Where did you live while obtaining your high school diploma?
City/province:
L.4. Where do you live now?
City/province:
L.5. Whom did you stay with during the final year of your bachelor’s
degree?
� Alone � Spouse � Friends
� Parents � Pagoda � NGO
� Other, please specify:
L.6. Nowadays, whom do you live with?
� Alone � Spouse � Friends
� Parents � Pagoda � NGO
� Other, please specify:
L.7. What is the profession of your parents?
Mother:
Father:
L.7. What is the level of education of your parents?
Mother:
Father:
65
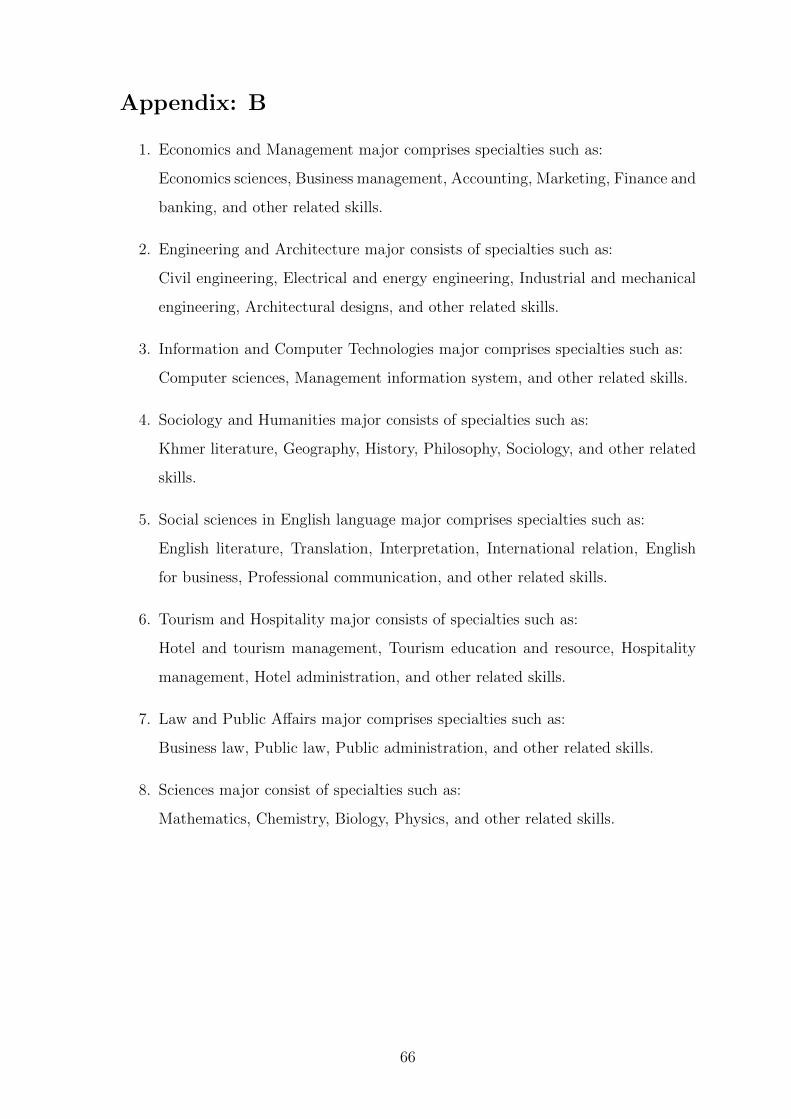
Appendix: B
1. Economics and Management major comprises specialties such as:
Economics sciences, Business management, Accounting, Marketing, Finance and
banking, and other related skills.
2. Engineering and Architecture major consists of specialties such as:
Civil engineering, Electrical and energy engineering, Industrial and mechanical
engineering, Architectural designs, and other related skills.
3. Information and Computer Technologies major comprises specialties such as:
Computer sciences, Management information system, and other related skills.
4. Sociology and Humanities major consists of specialties such as:
Khmer literature, Geography, History, Philosophy, Sociology, and other related
skills.
5. Social sciences in English language major comprises specialties such as:
English literature, Translation, Interpretation, International relation, English
for business, Professional communication, and other related skills.
6. Tourism and Hospitality major consists of specialties such as:
Hotel and tourism management, Tourism education and resource, Hospitality
management, Hotel administration, and other related skills.
7. Law and Public Affairs major comprises specialties such as:
Business law, Public law, Public administration, and other related skills.
8. Sciences major consist of specialties such as:
Mathematics, Chemistry, Biology, Physics, and other related skills.
66

Chapter I
Unemployment duration and educational
mismatches: A theoretical and empirical
investigation among graduates in Cambodia
Abstract
This article analyzes the relation between unemployment duration and education-
job mismatches (overeducation and horizontal mismatches). This study proposes a
job matching model to identify the theoretical mechanisms. An econometric analysis
using the independent competing-risks duration model on a survey of graduates from
Cambodian universities, allows testing the theoretical predictions. The results prove
that unemployment duration increases with educational mismatches. Reforms in the
Cambodian education system are thus required to decrease unemployment risks and
educational mismatches among university graduates.
Keywords: vertical and horizontal educational mismatches, unemployment duration,
job matching model, independent competing risks duration model.
JEL Codes: I23, J24, J64.
67
1 Introduction
In developed countries, education plays a key role against unemployment: The
higher educational levels, the lower risks of unemployment (Mincer, 1991). However,
in developing countries, this role is more questionable as unemployment risks can
be quite higher among well-educated job seekers because of the insufficient demand
for college graduates (Tansel & Tai, 2010). This excessive supply of graduates and
the inefficiency of education system also raise concerns of educational mismatches in
developing countries. Two types of educational mismatches can occur. First, over-
education, or vertical mismatch, refers to an excess of education, beyond the level
needed to perform a certain job (Hartog, 2000 ; McGuinness, 2006). Second, the hori-
zontal mismatch also exists and implies that people’s occupations do not match their
fields of education (Sloane, 2003 ; Robst, 2007a,b). The issues of high unemployment
risks or long unemployment duration and the concerns of educational mismatches
among high-educated persons would discourage people from investing in their own
human capital. As a result, this will have a negative impact on society and hinder
the capacity of developing economies to catch up developed nations. The analysis
of unemployment duration and educational mismatches among graduates represents
thus a critical research for developing countries.
Surprisingly, only little studies examine the relation between the unemployment
duration and educational mismatches in the previous literature. From the theoretical
perspective, some graduates prefer to leave unemployment as fast as possible, even
though the job requirements are mismatched to their education. First, according to
the job search theory, because of labor market frictions, in particular the imperfect
information, it takes time to find a suitable job (Jovanovic, 1979). Graduates who face
a financial constraint must tend to accept a job quickly although the job match quality
is poor. Another reason is found in the stepping stone hypothesis (Sicherman & Galor,
1990): Overeducation is an investment in work experience, which enhances promotion
opportunities. Hence, mismatches can decrease unemployment duration. However,
according to McCormick (1990), accepting a mismatched job can be a stronger nega-
tive signal to employers than unemployment. Thus, there are also graduates who
prefer to stay longer on unemployment to wait for a matched job. Nevertheless, these
68

graduates may still fail to find a better matched job if there is an excessive supply of
graduates in the labor market. In that situation, education-job mismatches can be
also associated with a longer unemployment duration. The uncertainty exists, and
this needs empirical investigations.
Cuesta (2005) uses a simultaneous equations’ procedure and finds that there
exist unobserved factors that increase unemployment duration and reduce probability
of being overeducated in the first job for Spanish youths. Pollmann-Schult & Buchel
(2005) apply a competing risk specification on the data of the West German Life
History Study and show that a shorter unemployment duration is associated with
higher rates of transition to overeducation. Thus, these two researches confirm that
education-job mismatches can shorten unemployment duration. Nevertheless, Rose
& Ordine (2010), using competing risks models applied to a survey carried out by
the Italian Institute for Vocational Training of Workers, find that overeducation is an
occurrence following long periods of unemployment. Barros et al. (2011) employ Cox
duration and prove that overeducation increases unemployment duration among the
graduates in France. Lin & Hsu (2013) implement censored regressions on the Tai-
wan’s Manpower Utilization Survey and find overeducation lengthens unemployment
duration as well. Hence, the link between unemployment duration and education-job
mismatches has not been resolved. Furthermore, previous literature focuses solely
on developed countries and overeducation, it is worth to extend this research into
developing countries and study educational mismatches in all their dimensions.
The objective of this article is accordingly to investigate the relation between
unemployment duration and educational mismatches among graduates in Cambodia
from both theoretical and empirical angles. First, the theoretical model uses the
job matching model to explain the mechanism that links unemployment duration
and educational mismatches. Second, the empirical analysis using the independent
competing risks regression, makes it possible to test the likelihood of the established
theoretical model.
Cambodia offers indeed an interesting case to illustrate the contextual issues re-
garding unemployment risks and educational mismatches among university graduates
in developing countries. The unemployment rate in Cambodia was only 0.2% in 2011
69

and 0.4% in 2014 (ILO’s website1), but according to two surveys conducted by Paul
(2011) and Sam (2014), the unemployment rate among university graduates was much
higher and reached 2.4% and 4.1%, respectively, even though they had left university
for three years. Between 2000 and 2014, the number of higher education institutions
(HEI) in Cambodia massively increased from fourteen (14) to one hundred and five
(105) (Un, 2015). This expansion raises questions about the quality of HEI because
73% of employers reported that university graduates did not have the right skills for
the jobs for which they were applying (World Bank, 2012, p.8). Furthermore, there
are high mismatches between the skills demanded by employers and the skills pro-
duced by the HEI. Indeed, between 2009 and 2014, almost 50% of total students were
being enrolled in management and related fields, and only around 3% were pursuing
engineering or mechanical degrees, while Cambodia rather needs engineers who can
fill construction and manufacturing jobs (D’Amico, 2010, p.7 ; Madhur, 2014a, p.1).
Without viable solutions for these problems, Cambodia’s economy could be stuck in
the middle income trap (Madhur, 2014b, p.3).
The paper is structured as follows: Section 2 defines the theoretical model.
Section 3 presents the database and descriptive statistics. Section 4 describes the
methods and discusses the results. Section 5 concludes.
1http://www.ilo.org/global/research/global-reports/weso/2016/lang--en/index.htm
70
2 Theoretical model framework
We propose to model the individual search behaviors to identify relation between
the unemployment duration and educational mismatches, based on the Diamond-
Mortensen-Pissarides job search model in a steady state environment (Pissarides,
2000, Chapter 1, p.1-23). Our model introduces the heterogeneity of jobs and also
supposes that educational mismatches are the result of search and matching process
of individuals and firms.
All persons are assumed to be first-time job seekers and are homogeneous in
terms of their human capital level (university graduates). Two types of jobs exist
and are noted by j (j = R or M). The first type matches the acquired education
of unemployed graduates and is represented by a letter R (for Right match), while
the second job is mismatched to their education and is represented by a letter M (for
Mismatch). The right matched job is more productive, hence it offers a higher wage,
but more difficulty can occur to find that type of job. On the contrary, the mismatched
job offers a lower wage but is less difficult to find. As a result, unemployed graduates
face a trade-off. They might prefer to quit unemployment as fast as possible, even
though the job is mismatched. They also might prefer to wait for a right matched
job, yet if they cannot find one after a long period, they still possibly fall into a
mismatched job.
2.1 Value function of a vacant and a filled job
The firm opens a job vacancy and searches for employees. The job’s output is a
constant: yj > 0. Since the job of type R is more productive than M , hence yR > yM .
When a job is vacant, the firm loses in terms of its activity at a cost yjcv > 0 per unit
time (cv is a coefficient constant for the cost of a vacant job).
Let m(u, v) = unv1−n be the matching function that gives the number of jobs
m formed at any moment in time as a function of the number of unemployed workers
u, and the number of vacant jobs v. All firms are small and the number of jobs is
determined by a profit maximization.
71

Let Vj and Jj the present-discounted value of a vacant job and a filled job,
respectively, r a discount rate, q(θ)2 the arrival rate of workers to a job, wj the wage
paid to workers, and δ an exogenous shock. Vj and Jj can be written as:
rVj = q(θ)(Jj − Vj)− yjcv (I.1)
rJj = yj − wj − δJj (I.2)
When the decision to create a vacant job is made, the firm must choose between
the two types of jobs. The condition for which a firm prefers the type R than M is:
VR > VM . Using the equations (1) and (2), we find that VR > VM only if:3
yR > yM +q(θ)(wR − wM)
q(θ)− cv(r + δ)(I.3)
2.2 Value function of unemployment and employment
During the job search, an unemployed graduate enjoys a return, noted b (e.g.,
unpaid leisure activities or home production). We assume that b is a constant and
independent of market returns. An unemployed graduate also suffers a constant cost
cs for searching a job. This cost may include the time or the money spent on the job
search.
Let U and W denote the present-discounted value of the expected income of
being unemployed and employed, respectively, θq(θ)4 the arrival rate of job offers, and
z = b− cs. Hence, U can be defined as:
rU = z + θq(θ)(W − U) (I.4)
We assume that α is the fraction of type R and (1 − α) is the fraction of
type M (with 0 < α <1
2). A graduate’s expected wage to earn we equals thus
αwR + (1−α)wM , with wj the expected wage associated to each type of job. He may
lose his job and becomes unemployed at the exogenous rate δ. Therefore, W can be
2q(θ) =m
vand θ =
v
urepresents the market tightness
3See Appendix: A4θq(θ) =
m
u=v
u
m
v
72

defined as:
rW = αwR + (1− α)wM + δ(U −W ) (I.5)
Using the equations (4) and (5), we can find the reservation wage of an unem-
ployed graduate, expressed by:5
w∗ = z +θq(θ)α
r + δ + θq(θ)H(wR) +
θq(θ)(1− α)
r + δ + θq(θ)H(wM) (I.6)
H(wR) and H(wM) represent respectively the distribution of wage offered from each
type of jobs, R and M , which is greater than or at least equals z.
Consider λR = θq(θ)α the arrival rate of job offers from the type R, λM =
θq(θ)(1 − α) the arrival rate of job offers from the type M , and [1 − Fj(w∗)] the
probability that the wage offered from each type of job is higher than or equals the
reservation wage, we can write the exit rate from unemployment (φj) to each type of
job as below:
φR = λR[1− FR(w∗)] (I.7)
φM = λM [1− FM(w∗)] (I.8)
From the equations (7) and (8), the exit rate from unemployment is defined as a
product of the arrival rate of job offers and the probability that the wage offered is
higher than or equals the reservation wage. The arrival rate of job offers from the
type R is lower than from the type M because it is more difficult to find the type
R. Nevertheless, the probability that the wage offered from R exceeds or equals the
reservation wage is higher than from M because the type R is more productive and
associated with higher wages. In what case, φR can be higher as well as lower than
φM . Our model thus leads to a theoretical indecision.
Table 1 provides a comparative static exercise of φR and φM according to two different
hypotheses.
5See Appendix: B
73
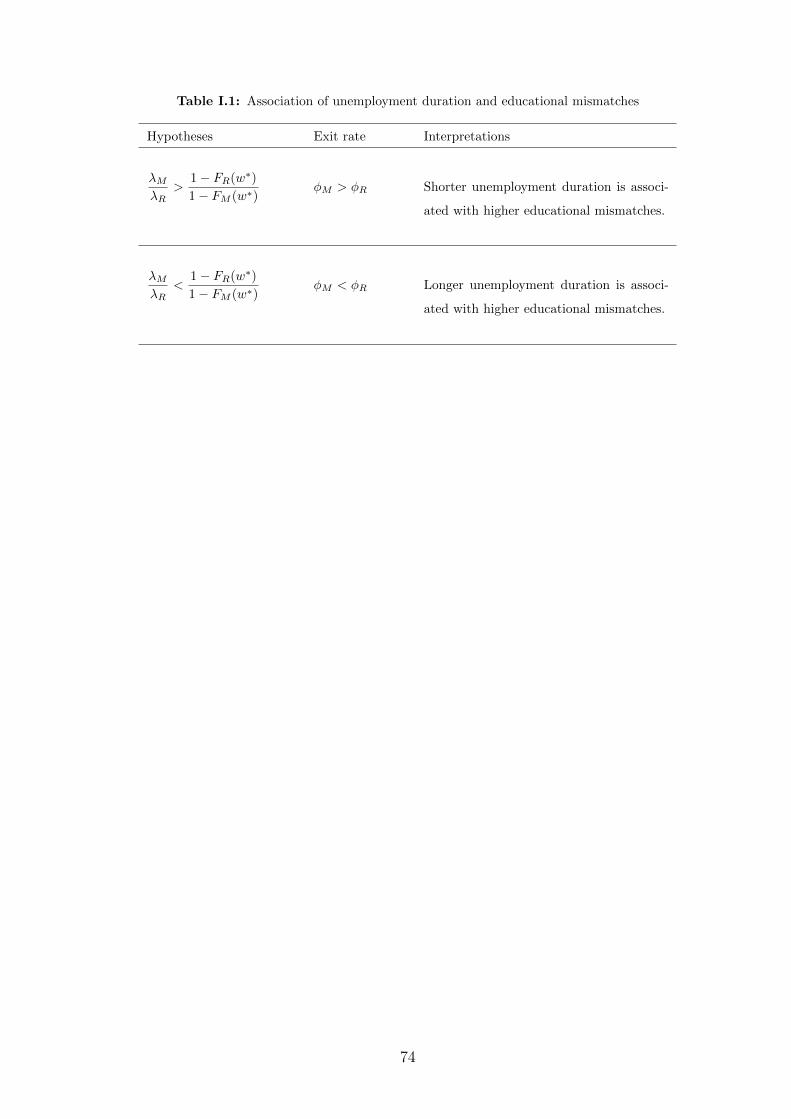
Table I.1: Association of unemployment duration and educational mismatches
Hypotheses Exit rate Interpretations
λMλR
>1− FR(w∗)
1− FM (w∗)φM > φR Shorter unemployment duration is associ-
ated with higher educational mismatches.
λMλR
<1− FR(w∗)
1− FM (w∗)φM < φR Longer unemployment duration is associ-
ated with higher educational mismatches.
74

3 Data and descriptive statistics
Since our model does not lead to an analytic solution, we propose to overcome
the uncertainty by estimating φR and φM with a reduced-form model from a survey
of graduates in Cambodia.
The University Research Center in Economics and Management at the Royal
University of Law and Economics in Cambodia conducted the survey that informs this
research by phone between January and April 2011, among Cambodian graduates who
had received their bachelor’s degrees in 2008, around 33 months after their graduation.
The 4,025 graduates6 are randomly selected and representative of nineteen HEI in
Phnom Penh, the capital of Cambodia. The current study excludes self-employed
people from the initial data set, because there is no detailed information available to
evaluate if they require a university degree for their business or not. Observations
that offered no information about the occupations or the duration of unemployment
also were dropped. The final sample thus contains 3,211 graduates. Note that our
final sample still represents the study population.7
This survey records the total unemployment spell that graduates had faced
since the graduation and if some graduates were still unemployed at the moment of
interview that we can code these observations as censored data. The survey also in-
forms us several observed graduates’ characteristics such as genre, age, marital status,
parents’ educational levels, birthplace, types of university, internship, and graduates’
preferences for different job characteristics. Furthermore, the sample provides infor-
mation about graduates’ fields of study and occupations allowing us thus to calculate
the incidence of educational mismatches.
To measure overeducation, job analysis (JA) method, which offers an objective
measure, is employed. The International Standard Classification of Occupations Code
(1-digit) published in 2012 (ISCO-08) and the International Standard Classification of
Education published in 1997 (ISCED-97) conform with this objective measure to help
define who is overeducated or not. Graduates working in jobs that require skill levels
of 3 or 4, which corresponds to the occupational levels 1 (managers), 2 (professionals),
6The average response rate was 80%, and the majority of no responses were due to the fact thatgraduates had changed their phone numbers, making interviewers impossible to contact them.
7By comparing the means and standard deviations of all variables used in our analysis before andafter the eliminations of those observations, we do not remark any important gaps to consider.
75
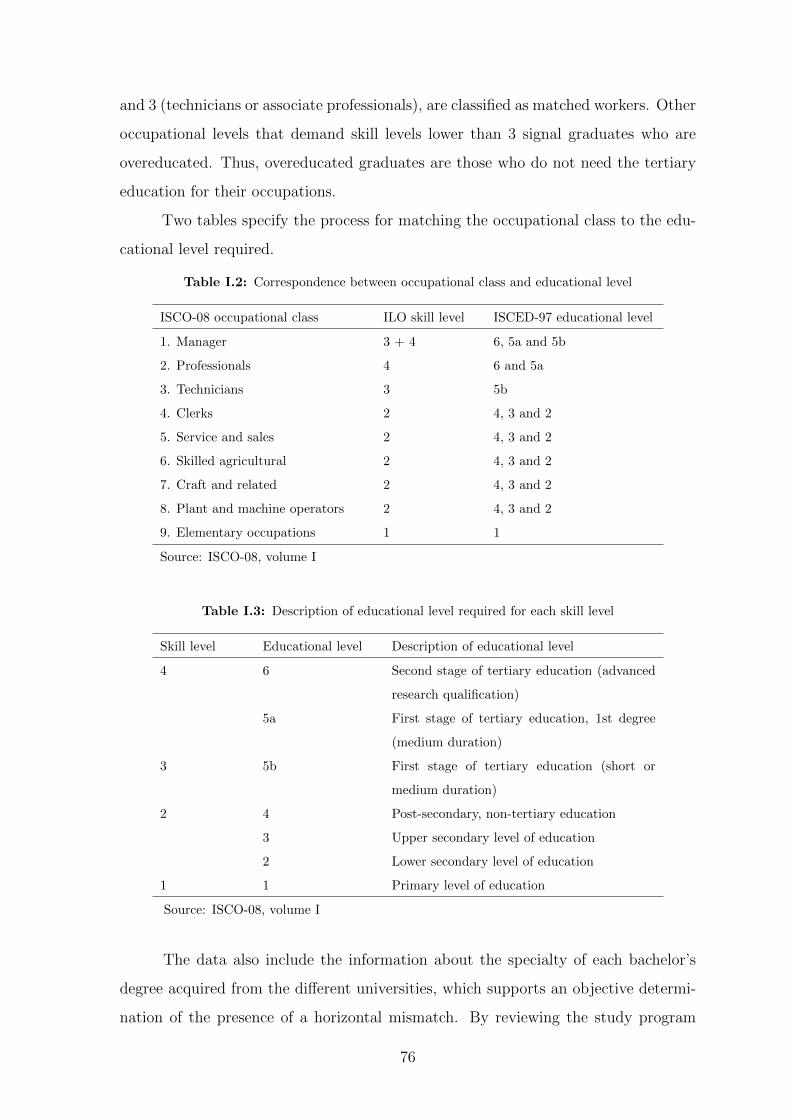
and 3 (technicians or associate professionals), are classified as matched workers. Other
occupational levels that demand skill levels lower than 3 signal graduates who are
overeducated. Thus, overeducated graduates are those who do not need the tertiary
education for their occupations.
Two tables specify the process for matching the occupational class to the edu-
cational level required.
Table I.2: Correspondence between occupational class and educational level
ISCO-08 occupational class ILO skill level ISCED-97 educational level
1. Manager 3 + 4 6, 5a and 5b
2. Professionals 4 6 and 5a
3. Technicians 3 5b
4. Clerks 2 4, 3 and 2
5. Service and sales 2 4, 3 and 2
6. Skilled agricultural 2 4, 3 and 2
7. Craft and related 2 4, 3 and 2
8. Plant and machine operators 2 4, 3 and 2
9. Elementary occupations 1 1
Source: ISCO-08, volume I
Table I.3: Description of educational level required for each skill level
Skill level Educational level Description of educational level
4 6 Second stage of tertiary education (advanced
research qualification)
5a First stage of tertiary education, 1st degree
(medium duration)
3 5b First stage of tertiary education (short or
medium duration)
2 4 Post-secondary, non-tertiary education
3 Upper secondary level of education
2 Lower secondary level of education
1 1 Primary level of education
Source: ISCO-08, volume I
The data also include the information about the specialty of each bachelor’s
degree acquired from the different universities, which supports an objective determi-
nation of the presence of a horizontal mismatch. By reviewing the study program
76

and job prospect of each specialty offered by each university, the author compares
these descriptions with each individual occupation to discern if each graduate’s job
corresponds with his or her field of study.8
Based on these objective measures, 35% and 33% of graduates are overedu-
cated and horizontally mismatched, respectively. Some graduates can also be double
mismatched, it is thus interesting to construct a variable that represents the overall
level of mismatch. This variable indicates that 32% and 18% of graduates are single
(either vertical or horizontal mismatches only) and double mismatched, respectively.
The incidence of educational mismatches for each category is provided in Table 4 with
the relation to unemployment duration.
Table I.4: Unemployment duration and educational mismatches
Unemployment duration (Days)
Variables Percentage Mean Std. Dev.
Overeducation 35.43% 42.33 129.74
Horizontal mismatch 33.25% 38.23 119.72
Overeducation only 16.96% 38.41 110.77
Horizontal mismatch only 14.78% 28.60 76.36
No mismatch 49.79% 34.67 102.33
Single mismatch 31.74% 33.84 96.37
Double mismatch 18.47% 45.93 145.00
Observations 3,1199 36.49 109.80
From Table 4, graduates without any mismatches and graduates with a single mis-
match have experienced a similar unemployment duration. Nevertheless, graduates
with a double mismatch is observed to have experienced the longest unemployment
duration on average. This may indicate that there are graduates who stay longer
on unemployment to search for a better job match quality but cannot find. These
observed statistics may support the second result in Table 1 of our theoretical model
(φM < φR) that a longer unemployment duration is associated with higher educational
mismatches.
Besides educational mismatches, there exists other observable factors that can
also influence the unemployment duration such as genre, age, marital status, fields
8The matching table can be found in the Appendix: C.9There are 92 censored observations that we cannot determine if they work in a mismatched job
or not because they still stay unemployed.
77
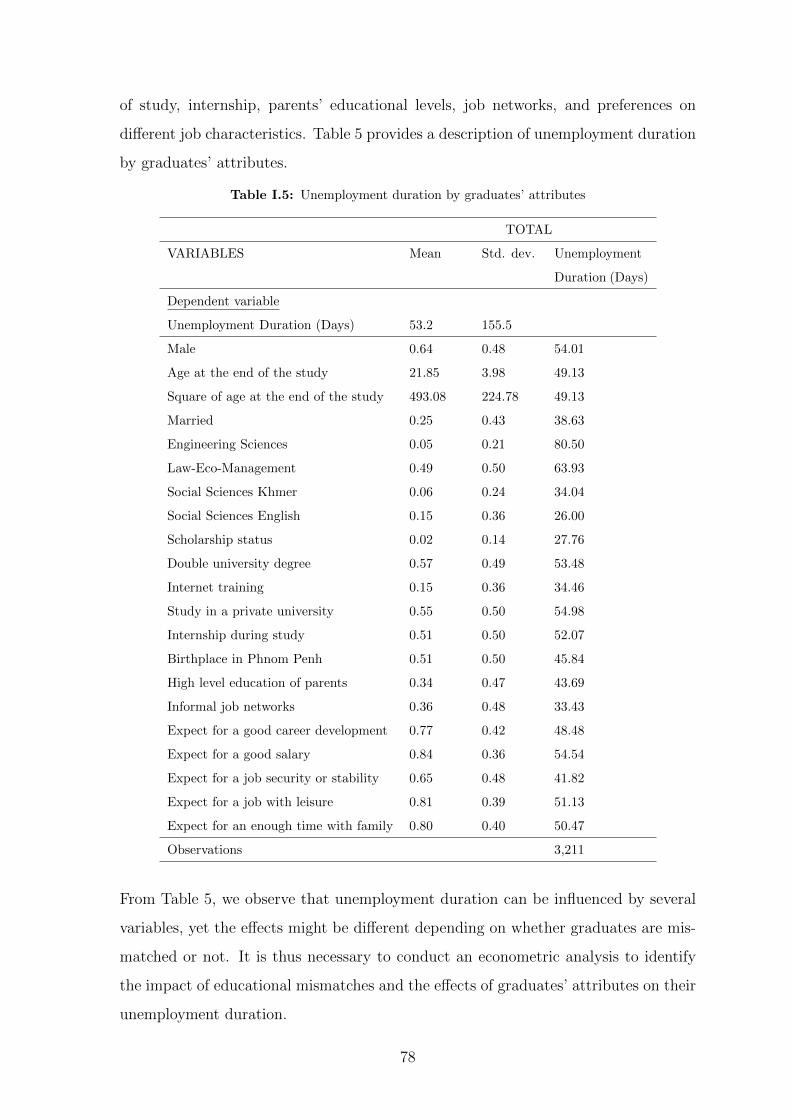
of study, internship, parents’ educational levels, job networks, and preferences on
different job characteristics. Table 5 provides a description of unemployment duration
by graduates’ attributes.
Table I.5: Unemployment duration by graduates’ attributes
TOTAL
VARIABLES Mean Std. dev. Unemployment
Duration (Days)
Dependent variable
Unemployment Duration (Days) 53.2 155.5
Male 0.64 0.48 54.01
Age at the end of the study 21.85 3.98 49.13
Square of age at the end of the study 493.08 224.78 49.13
Married 0.25 0.43 38.63
Engineering Sciences 0.05 0.21 80.50
Law-Eco-Management 0.49 0.50 63.93
Social Sciences Khmer 0.06 0.24 34.04
Social Sciences English 0.15 0.36 26.00
Scholarship status 0.02 0.14 27.76
Double university degree 0.57 0.49 53.48
Internet training 0.15 0.36 34.46
Study in a private university 0.55 0.50 54.98
Internship during study 0.51 0.50 52.07
Birthplace in Phnom Penh 0.51 0.50 45.84
High level education of parents 0.34 0.47 43.69
Informal job networks 0.36 0.48 33.43
Expect for a good career development 0.77 0.42 48.48
Expect for a good salary 0.84 0.36 54.54
Expect for a job security or stability 0.65 0.48 41.82
Expect for a job with leisure 0.81 0.39 51.13
Expect for an enough time with family 0.80 0.40 50.47
Observations 3,211
From Table 5, we observe that unemployment duration can be influenced by several
variables, yet the effects might be different depending on whether graduates are mis-
matched or not. It is thus necessary to conduct an econometric analysis to identify
the impact of educational mismatches and the effects of graduates’ attributes on their
unemployment duration.
78

4 Methods and results
The descriptive analysis shows that education-job mismatches and graduates’
attributes can affect unemployment duration. To identify these impacts, two econo-
metric methods are proposed. First, a single risk regression10 does not take into
account different types of job. Second, an independent competing risk regression
considers different job types. Four models are introduced: First, we divide jobs into
the matched and mismatched jobs (all forms of mismatches); second, we differentiate
between the transition to overeducation and to horizontal mismatch; third, we focus
on the transition to overeducation only and horizontal mismatch only; and fourth,
we analyze the overall level of mismatches (no mismatch, single mismatch and double
mismatch).
In time-to-event data, the underlying time scale is generally supposed to be
continuous and indexed by t ∈ R. With the presence of competing risks, graduates
are assumed to enter unemployment at time t = 0 and leave this unemployment
spell either to enter one among N types of jobs. Graduates are treated as censored
observations if they are still unemployed at the time of survey. Let T ∗k be the latent
duration associated with a transition from unemployment to work in a job of type k
(k = 1, 2, ..., N). We assume that the latent durations are independently distributed
conditionally on the observable covariates X.
(T ∗j q T ∗k ) | X, ∀ j 6= k, j, k = 1, 2, ..., N (I.9)
The rate of transition from unemployment to work in a job of type k at a moment in
time is supposed to have the following form with a proportional hazard specification:
hk(t|X) = hk,0(t)exp(Xβk) (I.10)
10The test of Schoenfeld residuals proves that the hazards are proportional; therefore, the Coxduration model fits our data well. However, this model does not consider the possible existenceof unobserved heterogeneity. We propose thus a Weibull regression that takes into account theunobserved heterogeneity but cannot allow for different competing risks. We observe that there is apresence of unobserved heterogeneity, yet we are not able to tell if this presence is due to the factthat we assume the hazards are not proportional, but it is false, or that we assume there are nocompeting risks, but it is also false.
79

where hk(t) is the subdistribution hazard or the instantaneous rate of transition from
unemployment to work in a job of type k, hk,0 is the baseline hazard of the sub-
distribution and left unspecified, X are observable covariates, and βk are unknown
coefficients. Table 6 presents the results.
80
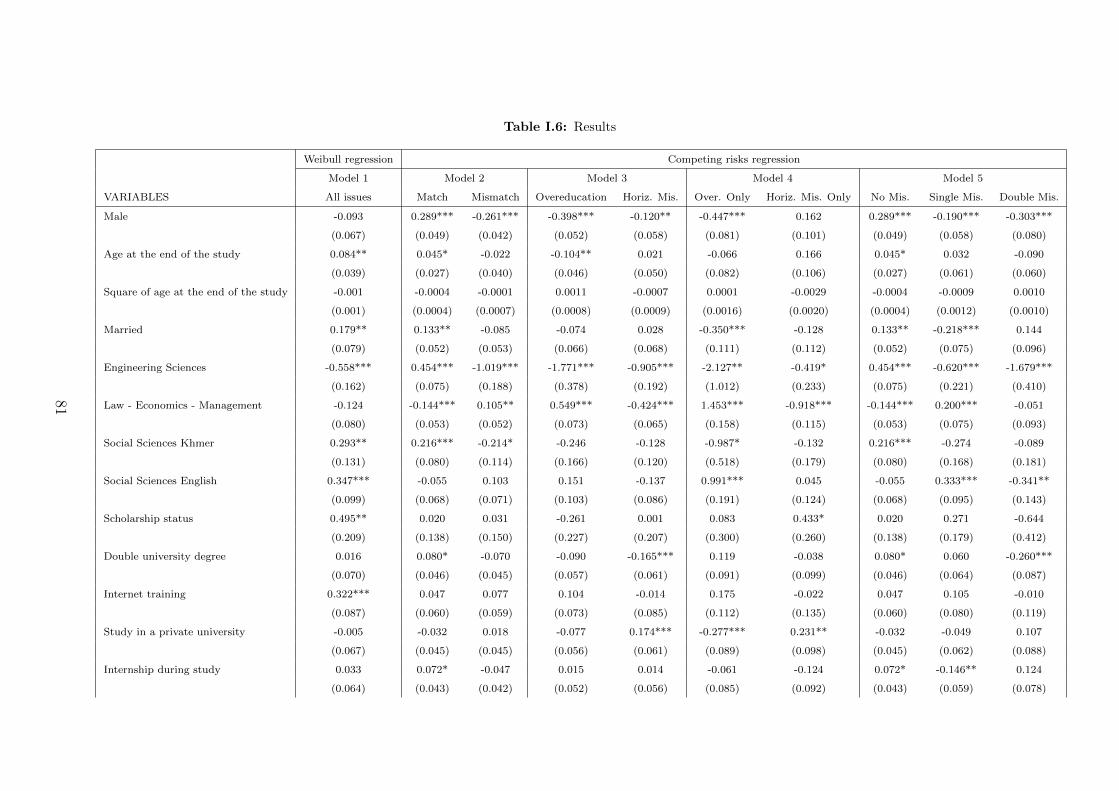
Table I.6: Results
Weibull regression Competing risks regression
Model 1 Model 2 Model 3 Model 4 Model 5
VARIABLES All issues Match Mismatch Overeducation Horiz. Mis. Over. Only Horiz. Mis. Only No Mis. Single Mis. Double Mis.
Male -0.093 0.289*** -0.261*** -0.398*** -0.120** -0.447*** 0.162 0.289*** -0.190*** -0.303***
(0.067) (0.049) (0.042) (0.052) (0.058) (0.081) (0.101) (0.049) (0.058) (0.080)
Age at the end of the study 0.084** 0.045* -0.022 -0.104** 0.021 -0.066 0.166 0.045* 0.032 -0.090
(0.039) (0.027) (0.040) (0.046) (0.050) (0.082) (0.106) (0.027) (0.061) (0.060)
Square of age at the end of the study -0.001 -0.0004 -0.0001 0.0011 -0.0007 0.0001 -0.0029 -0.0004 -0.0009 0.0010
(0.001) (0.0004) (0.0007) (0.0008) (0.0009) (0.0016) (0.0020) (0.0004) (0.0012) (0.0010)
Married 0.179** 0.133** -0.085 -0.074 0.028 -0.350*** -0.128 0.133** -0.218*** 0.144
(0.079) (0.052) (0.053) (0.066) (0.068) (0.111) (0.112) (0.052) (0.075) (0.096)
Engineering Sciences -0.558*** 0.454*** -1.019*** -1.771*** -0.905*** -2.127** -0.419* 0.454*** -0.620*** -1.679***
(0.162) (0.075) (0.188) (0.378) (0.192) (1.012) (0.233) (0.075) (0.221) (0.410)
Law - Economics - Management -0.124 -0.144*** 0.105** 0.549*** -0.424*** 1.453*** -0.918*** -0.144*** 0.200*** -0.051
(0.080) (0.053) (0.052) (0.073) (0.065) (0.158) (0.115) (0.053) (0.075) (0.093)
Social Sciences Khmer 0.293** 0.216*** -0.214* -0.246 -0.128 -0.987* -0.132 0.216*** -0.274 -0.089
(0.131) (0.080) (0.114) (0.166) (0.120) (0.518) (0.179) (0.080) (0.168) (0.181)
Social Sciences English 0.347*** -0.055 0.103 0.151 -0.137 0.991*** 0.045 -0.055 0.333*** -0.341**
(0.099) (0.068) (0.071) (0.103) (0.086) (0.191) (0.124) (0.068) (0.095) (0.143)
Scholarship status 0.495** 0.020 0.031 -0.261 0.001 0.083 0.433* 0.020 0.271 -0.644
(0.209) (0.138) (0.150) (0.227) (0.207) (0.300) (0.260) (0.138) (0.179) (0.412)
Double university degree 0.016 0.080* -0.070 -0.090 -0.165*** 0.119 -0.038 0.080* 0.060 -0.260***
(0.070) (0.046) (0.045) (0.057) (0.061) (0.091) (0.099) (0.046) (0.064) (0.087)
Internet training 0.322*** 0.047 0.077 0.104 -0.014 0.175 -0.022 0.047 0.105 -0.010
(0.087) (0.060) (0.059) (0.073) (0.085) (0.112) (0.135) (0.060) (0.080) (0.119)
Study in a private university -0.005 -0.032 0.018 -0.077 0.174*** -0.277*** 0.231** -0.032 -0.049 0.107
(0.067) (0.045) (0.045) (0.056) (0.061) (0.089) (0.098) (0.045) (0.062) (0.088)
Internship during study 0.033 0.072* -0.047 0.015 0.014 -0.061 -0.124 0.072* -0.146** 0.124
(0.064) (0.043) (0.042) (0.052) (0.056) (0.085) (0.092) (0.043) (0.059) (0.078)
81

Table I.6: Results-continued
Weibull regression Competing risks regression
Model 1 Model 2 Model 3 Model 4 Model 5
VARIABLES All issues Match Mismatch Overeducation Horiz. Mis. Over. Only Horiz. Mis. Only No Mis. Single Mis. Double Mis.
Birthplace in Phnom Penh 0.092 -0.063 0.078* 0.065 0.116** -0.016 0.077 -0.063 0.036 0.134*
(0.064) (0.042) (0.042) (0.052) (0.056) (0.083) (0.090) (0.042) (0.058) (0.079)
High level education of parents 0.148** 0.172*** -0.153*** -0.165*** -0.194*** -0.046 -0.094 0.172*** -0.073 -0.266***
(0.066) 0.043 (0.046) (0.057) (0.061) (0.087) (0.097) (0.043) (0.062) (0.088)
Informal job networks 0.374*** -0.114** 0.197*** 0.254*** 0.119** 0.268*** -0.016 -0.114** 0.157** 0.202**
(0.068) (0.046) (0.045) (0.057) (0.060) (0.091) (0.099) (0.046) (0.064) (0.085)
Expect for a good career development 0.278*** 0.053 -0.031 -0.040 -0.112 0.096 -0.036 0.053 0.055 -0.174*
(0.087) (0.054) (0.053) (0.067) (0.072) (0.112) (0.118) (0.054) (0.077) (0.102)
Expect for a good salary -0.275*** -0.122** 0.067 0.212** -0.032 0.278** -0.235** -0.122** 0.016 0.152
(0.091) (0.058) (0.062) (0.084) (0.079) (0.137) (0.118) (0.058) (0.085) (0.122)
Expect for a job security or stability 0.365*** 0.172*** -0.114** -0.171*** -0.033 -0.217** 0.051 0.172*** -0.112* -0.101
(0.076) (0.050) (0.048) (0.060) (0.065) (0.094) (0.106) (0.050) (0.066) (0.091)
Expect for a job with leisure 0.110 0.365*** -0.379*** -0.326* -0.401** -0.321 -0.507* 0.365*** -0.367** -0.308
(0.208) (0.110) (0.129) (0.166) (0.184) (0.273) (0.262) (0.110) (0.185) (0.270)
Expect for an enough time with family 0.163 -0.285*** 0.315** 0.338** 0.355* 0.169 0.215 -0.285*** 0.192 0.459*
(0.203) (0.103) (0.129) (0.165) (0.183) (0.267) (0.259) (0.103) (0.183) (0.268)
Constant -2.839***
(0.566)
ln p -0.443***
(0.010)
ln θ 0.609***
(0.024)
No. of Occurrence 3,119 1,566 1,533 1,105 1,037 529 461 1,566 990 576
No. of Censored observations 92 92 92 92 92 92 92 92 92 92
No. of Competing observations 0 1,553 1,566 2,014 2,082 2,590 2,658 1,553 2,129 2,543
No. of Total observations 3,211 3,211 3,211 3,211 3,211 3,211 3,211 3,211 3,211 3,211
*** p<0.01, ** p<0.05, * p<0.1. Notes: Robust standard errors are in brackets.
82

The competing risks duration models allows us to predict the effect of educational
mismatches on unemployment hazards (see Table 7).
Table I.7: Educational mismatches and unemployment hazards
Non parametric model: Competing risks duration models:
Educational mismatches Estimates of unemployment hazards Predicted unemployment hazards
Match 0.813 0.121
Mismatch 0.815 0.406
Overeducation 0.815 0.246
Horizontal mismatch 0.814 0.311
Overeducation only 0.815 0.214
Horizontal mismatch only 0.813 0.182
No mismatch 0.813 0.121
Single mismatch 0.814 0.215
Double mismatch 0.815 0.540
From the non parametric Kaplan Meier estimates, there is no relation between the un-
employment hazards and educational mismatches. Nevertheless, with the prediction
from the competing risks duration models, we clearly see that unemployment hazards
increase with educational mismatches. In other words, graduates who are educational
mismatched, stay longer on unemployment duration; hence a double penalty. This
result supports the second hypothesis of our theoretical model (φM < φR) where the
graduates prefer to wait for a right match job but fail to find, probably due to the
lack of demand for college graduates in Cambodia, and the inefficiency of education
system that fails to develop students’ professional skills required by the labor market.
Our results also show that the determinants of unemployment duration are
different according to the issues. For example, in the Model 1 of Table 6, genre has no
influence on the transition from school to work. Nevertheless, when we distinguish the
types of job, we can see that being a male has clearly an advantage in finding a job that
matches his level and field of education, and also reduces the risk of being mismatched
as also noted by McGoldrick & Robst (1996). These two effects are compensated each
other in the Model 1. The fact that women have lower opportunities than their male
counterparts in terms of finding a matched job, maybe because of the tendency of
women to rather select management and related majors that offer poorer employment
prospects in Cambodia. Based on the results found by Dolton & Vignoles (2000) and
83

Green & McIntosh (2007), graduates in more scientific majors such as engineering
are less prone to be mismatched. Indeed, despite graduates in engineering sciences
stay longer on unemployment due to the world economic crisis in 2008 that hits the
construction sector in Cambodia in 2008 and 2009, this degree does have a strong
impact on finding a well-suited job. Graduating from a private university appears to
face a higher incidence of horizontal mismatch, but surprisingly, it reduces the risk of
being overeducated when we consider the exit rate among graduates to overeducation
only. This might suggest that the educational quality of some private universities,
especially the big ones, is not really worse than public universities. Among graduates
who have completed an internship might profit this first professional experience as a
chance to get a proper job after their study. On the contrary, using an informal job
network increases the risk of being mismatched as also found by Meliciani & Radicchia
(2016), though it might help to find a job faster. Parents’ education plays a significant
role to assist their children getting a job faster and increases the graduates’ chance
of finding a right matched job. As Hansen & Mastekaasa (2006), Torche (2011), and
Capsada-Munsech (2015) suggest, educated parents are likely better informed and
share more knowledge with their children.
Regarding the preferences of graduates, we find that graduates who expect for
a good career development face lower risks of exit to a double mismatched job. In-
deed, graduates might believe that accepting a job that does not match both their
educational field and level is a strong negative signal to employers as well as being
unemployed, and this would limit their future career development, similar to what Mc-
Cormick (1990) and Pissarides (1992) suggest. Graduates expecting for job security or
stability rather transit to a right matched job and they are less overeducated. Indeed,
following the career mobility theory (Sicherman & Galor, 1990), a mismatched job is
likely unstable because most people who accept that type of job might consider it as
just a temporary job to move up later. Graduates who hope for a job with leisure also
tend to reject the mismatched jobs. This indicates that working in a job that does not
fit their competences can be more boring since their skills acquired at schools cannot
be well-used, and they have to learn new skills. Expectations for a high salary does
prolong the unemployment duration. This preference also increases the risk of being
overeducated but decreases the risk of horizontal mismatches. Graduates might con-
84

sider that accepting a job that is vertically mismatched is not a serious problem since
after years, they can challenge to be promoted to a higher position level (Sicherman &
Galor, 1990). On the other hand, accepting a job that is horizontally mismatched can
be a bad decision because the skills that they learned at school related to a particular
field might not be re-utilized at all in the future (Robst, 2007a), which can strongly
limit their career perspective or their future salary increase. Finally, graduates who
valorize their time for family tend to be more double mismatched. Perhaps, their
family tasks constraint them to have a limit of available occupational choices.
85

5 Conclusion
This article investigates if there exists a link between unemployment duration
and educational mismatches among university graduates in Cambodia. We use a sur-
vey, driven in nineteen Cambodian higher education institutions (HEI), that provides
precise insights into the jobs obtained by university graduates and supports measures
of potential mismatches between educational endowments and job characteristics.
The survey also informs the total unemployment duration that graduates had faced
since their graduation and other observed graduates’ attributes. Our research con-
tributes to literature on two main points. First, given the specific contextual issues
in developing countries, we analyze the case of Cambodia where the HEI have been
expanding widely and rapidly, but with an increasing trend of unemployment risks
and educational mismatches among university graduates. Second, we analyze from
both theoretical and empirical angles. In the theoretical part, we use the job matching
model to explain the mechanism linking unemployment duration and education-job
mismatches. In the empirical part, we use the independent competing risks duration
model by proposing several different configurations that capture educational mis-
matches in all their dimensions, especially the Model 5 that allows us finding that
unemployment duration increases with the level of mismatches.
Thus, the Cambodian education system needs to improve its quality to respond
to the labor market’s demands. This requires a close working relationship between
Ministries, HEI and the private sector. Each HEI needs to recruit qualified teachers
and update the teaching methodologies to improve the students’ professional skills,
including cross-cutting knowledge such as computer and English skills. Internships
should be set as compulsory because students can acquire practical experiences and
create their professional networks. Evaluations of different universities’ performance
in terms of students’ employability should be also developed to help families make
more informed educational choices based on the available opportunities in the labor
market, and the reporting evaluations would also provide valuable signals to the
government for consideration in their education policies. Financial incentives might be
an effective way to guide students toward the training courses that the companies need.
Finally, programs focused specially on young female students should be established,
to overcome the gender differences in the Cambodian labor market.
86

Appendix: A
From the equations (1) and (2), we can write:
Vj =q(θ)Jj − yjcr + q(θ)
(I.11)
Jj =yj − wjr + δ
(I.12)
Replacing (12) into (11), we get:
Vj =q(θ)(yj − wj)− yjcv(r + δ)
[r + q(θ)](r + δ)(I.13)
From the equation (13), we can write VR and VM ; then the condition for VR > VM
implies that:
q(θ)(yR − wR)− yRcv(r + δ) > q(θ)(yM − wM)− yMcv(r + δ) (I.14)
Solving this equation, we will get the equation (3).
Appendix: B
From the equations (4) and (5), we can write:
U =z + θq(θ)W
r + θq(θ)(I.15)
W =αwR + (1− α)wM + δU
r + δ(I.16)
Replacing (16) into (15), we will get:
rU =(r + δ)z + θq(θ)[αwR + (1− α)wM ]
r + δ + θq(θ)(I.17)
Next, replacing (15) into (16), we will get:
rW =δz + [r + θq(θ)][αwR + (1− α)wM ]
r + δ + θq(θ)(I.18)
87

From (17) and (18), we can write:
W − U =α(wR − z) + (1− α)(wM − z)
r + δ + θq(θ)(I.19)
Since rU is the reservation wage w∗ that an unemployed worker requires to give up
his job search, we can re-write the equation (4) as:
w∗ = z + θq(θ)(W − U) (I.20)
Hence the reservation wage can be determined with an integration of W − U from
(19):
w∗ = z + θq(θ)
∫ +∞
z
(W − U)dF (w) (I.21)
w∗ = z +θq(θ)α
r + δ + θq(θ)
∫ ∞z
(wR − z)dF (wR) +θq(θ)(1− α)
r + δ + θq(θ)
∫ ∞z
(wM − z)dF (wM)
(I.22)
Imposing that H(wR) =∫∞z
(wR− z)dF (wR); and H(wM) =∫∞z
(wM − z)dF (wM), we
can get the equation (6).
Appendix: C
Table I.8: Field of education and matching jobs
Field of education Matching jobs (ISCO-08 3-digit codes)
Economics and Management 112, 121, 122, 134, 143, 231, 232, 241, 242, 243, 262,
263, 264, 331, 332, 333, 334, 411, 412, 413, 421, 431,
432, 522
Engineering and Architecture 132, 214, 215, 216, 231, 232, 233, 311, 312, 313, 315, 515
Social sciences in English language 111, 112, 121, 122, 133, 134, 141, 143, 216, 231, 232,
233, 241, 242, 261, 262, 263, 264, 265, 334, 341, 343,
351, 352, 411, 412, 413, 511, 521, 522, 524
Sociology, Humanities and Arts 112, 216, 231, 232, 233, 234, 262, 263, 264, 265, 341, 511
Sciences 211, 212, 231, 232, 233, 311, 331, 421, 431
Information and Computer Technologies 112, 121, 133, 134, 231, 232, 233, 251, 252, 351, 352, 524
Tourism and Hospitality 112, 122, 134, 141, 231, 232, 243, 264, 341, 343, 441, 511
Law and Public Affairs 111, 121, 231, 232, 242, 261, 262, 263, 264, 334, 335, 341
Table source: Author’s estimation. The thesis’s author reviews the job prospect described for each
specialty in each university, then compares with individual occupation.
88

Chapter II
Overeducation and horizontal mismatch: A double
wage penalty for graduates in Cambodia?1
Abstract
This article analyzes the wage impact of the level of educational mismatches
(vertical and horizontal mismatches). To control for selection bias in the educational
mismatch process, this study applies an ordered selection Heckman model. The re-
sults of a survey of graduates from Cambodian universities confirm the need for a
selection correction and the presence of a double wage penalty when vertical and
horizontal mismatches both occur. Reforms in the Cambodian educational system
thus are required to decrease the propensity of educational mismatches and reinforce
incentives for education.
Keywords: overeducation, vertical and horizontal educational mismatches, wage dif-
ferentials, ordered Heckman model.
JEL Codes: I23, I26, J24, J31.
1This chapter is co-authored with my supervisor, Professor Mareva Sabatier.
89

1 Introduction
The average level of education has risen successively and considerably worldwide
during the past several decades (Barro & Lee, 2001 ; OECD, 2014). This increase in
educational levels has contributed significantly to economic growth, yet overeducation
also has emerged as a serious concern, particularly in developed countries. Overedu-
cation refers to an excess of education, beyond the level needed to perform a certain
job (Rumberger, 1981 ; Hartog, 2000 ; McGuinness, 2006). The mismatch can lead
to a troubling wage penalty for overeducated workers (Duncan & Hoffman, 1981 ;
Hartog & Oosterbeek, 1988 ; Groot & Van Den Brink, 2000 ; Hartog, 2000; Rubb,
2003 ; Battu & Sloane, 2004 ; McGuinness, 2006). This penalty is mainly explained
by a lower labour productivity and thus higher skill costs for firms.
This mismatch problem also may be expanding to developing countries, which is
somewhat surprising, considering the relatively low levels of educational attainment
and higher rate of returns to education in developing economies (OECD, 2014). Two
main factors may explain this education-occupation mismatch: Poor management of
the educational system, such that students do not graduate endowed with the actual
skills required by the labor market, and employment inequality resulting largely from
the substantial size of the informal sector in these economies. The wage penalty as-
sociated with overeducation in turn may discourage people from investing in their
own human capital, which likely will constraint the future economic growth and hin-
der developing economies’ ambitions to upgrade to more technology-based industrial
structures. Therefore, investigating the risk of a wage penalty due to overeducation
in developing countries represents a critical research need.
Previous research into educational mismatches in developing economies is quite
recent and scarce though: Quinn & Rubb (2006) study overeducation in Mexico;
Abbas (2008) investigates Pakistan; Mehta et al. (2011) consider four developing
countries, namely, the Philippines, Mexico, Thailand, and India; Filiztekin (2011)
studies Turkey; both Zakariya & Battu (2013) and Lim (2013) study the effect in
Malaysia; Herrera-Idarraga et al. (2015) investigate Colombia, Reis (2017) analyzes
Brazil; and Pholphirul (2017) examines Thailand. None of these investigations focus
on countries that appear poised to reach middle-income status though. For example,
90
in Cambodia, the gross domestic product (GDP) per capita was only 1.095 USD in
2014 (World Bank’s website2), and it has just graduated to a lower middle-income
status by 2016. This country thus offers an interesting case, particularly considering
its unique history and current status. During the Khmer Rouge regime, between
1975 and 1979, 75% of higher education lecturers, 96% of university students, and
67% of all primary and secondary school pupils were killed (Rany et al., 2012, p.230
; Benveniste et al., 2008, p.3). Since then, Cambodia has been struggling to rebuild
its educational system, and its achievement has been remarkable. Its illiteracy rate
declined from 37.2% to 21.6% between 1998 and 2008 (ILO & ADB, 2015, p.41), while
the percentage of the tertiary-age population enrolled in tertiary education increased
from 2.37% in 2001 to 15.9% in 2011 (UNESCO’s website3).
Concurrent with these notable achievements, concerns about overeducation
among university graduates have arisen, along with predictions that the mismatches
could constrain growth and development, which may leave the Cambodian economy
stuck in the middle-income trap. The main reason that Cambodian graduates fail
to find a job that matches their educational level is due to a learning gap, such that
73% of employers reported that university graduates did not have the right skills for
the jobs for which they were applying (World Bank, 2012, p.8). Unquestionably, the
education-job mismatches can diminish people’s motivation to invest in education.
As a result, the lack of human capital can create pitfalls for Cambodia, including
limits to foreign direct investment (FDI) inflows, and lower prospects of job creation
(Noorbakhsh et al., 2001). For the 300,000 to 400,000 Cambodian youths expected to
enter the labor market each year during the next decade (MoC & UNDP, 2014, p.15),
educational mismatches will foster their disillusionment with education, the society,
and their lifestyle. Therefore, without viable solutions, the costs of educational mis-
matches would be prominent (e.g., youth unemployment, underemployment, social
inequality, and potential social unrest). Improving the skills of this young workforce
in a way that matches the demand of labor market represents a substantial challenge
for Cambodia’s education system, but it also is an opportunity to invoke inclusive
economic growth based on the human capital and decent employment. Furthermore,
Cambodia needs to exploit the potential inherent in its large youth population before
2Data link: http://data.worldbank.org/indicator/NY.GDP.PCAP.CD?locations=KH3Data link: http://data.uis.unesco.org/?queryid=142
91

it is too late; the working age population (15-64 years) has increased rapidly, from
7.6 million in 2004 to 9.6 million in 2013 (ADB, 2014, p.36)4, yet the window during
which this demographic dividend will exist ultimately will close. The resolution of
human capital problems inherently involves a long-term process, so it is urgent to
consider educational mismatches carefully.
The objective of this article is accordingly to investigate if the educational mis-
matches generate a wage penalty for Cambodian university graduates. The research
also accounts for two methodological issues that have not been resolved fully in prior
literature pertaining to educational mismatches.
First, overeducation produces vertical mismatch, such that graduates possess a
level of education that is above the required level for their occupations. Another type
of mismatch also exists, namely, horizontal mismatch, which implies that people’s
occupations do not match their fields of education (Sloane, 2003 ; Robst, 2007a,b ;
Domadenik et al., 2013). The potential costs of horizontal mismatch appear compa-
rable to those of overeducation, so recent studies focus much more on this category in
developed countries (Domadenik et al., 2013). However, little research has addressed
the possibility of a double mismatch and its wage impacts. Robst (2008) considers
both mismatches and finds a stronger wage penalty among U.S. graduates subjected
to both mismatches. In Cambodia, the imbalance between the demand for and sup-
ply of graduates in particular fields provokes horizontal mismatches. Similar to other
developing countries, Cambodia needs engineers who can fill construction, infrastruc-
ture, and manufacturing jobs; specially, Cambodia would need about 35,000 engineers
and 46,000 technicians by 2018 (Madhur, 2014a, p.1). Yet the percentage of students
enrolled in engineering studies is marginal, such that only around 3% of all students
are pursuing engineering or mechanical degrees (D’Amico, 2010, p.7).
Second, education-job mismatches may be endogenous. According to Becker
(1964), educational choices involve a trade-off between the expected return to the
education and the costs of this investment. Thus, solving the endogeneity is neces-
sary to attain robust estimates. Previous research that has tried to deal with this
endogeneity do not account for the possible combination of vertical and horizontal
4Cambodia’s total population was 15.1 million in 2013 (World Bank’s website).
92

educational mismatches, and relies on different techniques, such as propensity score
matching (McGuinness, 2008), instrumental variables (Korpi & Tahlin, 2009), or fixed
effects (Dolton & Vignoles, 2000 ; Bauer, 2002 ; Dolton & Silles, 2008 ; Lindley &
McIntosh, 2009 ; Korpi & Tahlin, 2009 ; Tsai, 2010 ; Carroll & Tani, 2013). To extend
this line of research, the current study therefore adopts a different method, namely,
an ordered selection Heckman model, applied to a new database drawn from a survey
of the employability of Cambodian university graduates that was conducted in 2014
by the University Research Center in Economics and Management (URCEM) at the
Royal University of Law and Economics (RULE) in Cambodia.
93
2 Data and descriptive statistics
2.1 Measuring educational mismatches
The University Research Center in Economics and Management at the Royal
University of Law and Economics in Cambodia conducted the survey that informs this
research by phone between March and May 2014, among Cambodian graduates who
had received their bachelor’s degrees in 2011.5 The 1,050 observations are randomly
selected and representative of eight universities (four public four private) in Phnom
Penh, the capital of Cambodia. The current study excludes self-employed people from
the initial data set, because there are no detailed information available to evaluate
if they require a university degree for their business or not. Some observations that
offered no information on occupation or earnings also were dropped. The final sample
thus contains 624 university graduates, who are representative of the study population.
To measure the incidence of mismatches, we employ the job analysis (JA) that
is known as an objective measure. Based on the JA measure, each occupation clas-
sified by the International Standard Classification of Occupations Code (1-digit) is
assigned to the required level of education mentioned in the International Standard
Classification of Education (ISCED). For example, graduates working in the positions
classified as managers, professionals, and technicians/associate professionals, are con-
sidered as matched workers because these positions require tertiary education. Other
occupational levels such as clerical support workers and elementary occupations do
not require higher education. Consequently, graduates in these occupations will be
considered as overeducated.6
Based on this objective measure, 22.3% of graduates are overeducated. Women
tend to be more vertically mismatched though, such that 29.3% of female graduates
and 16.3% of male graduates are overeducated, as Table 1 indicates.
5This data collection is a part of the Higher Education Quality and Capacity Improvement Project(HEQCIP), with the financial and technical supports of the World Bank and the Department ofHigher Education (DHE) of the Ministry of Education, Youth and Sport (MoEYS) in Cambodia.
6Tables that specify the process of matching the occupational class to the educational level re-quired, are in the Appendix.
94
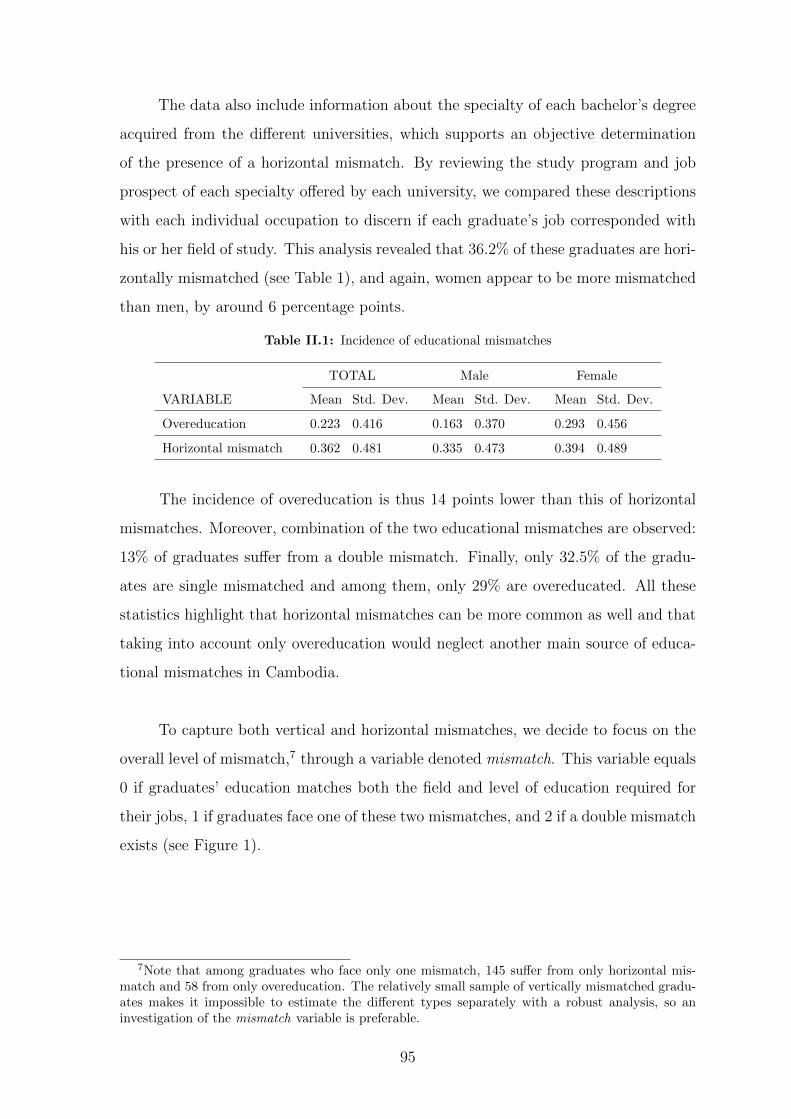
The data also include information about the specialty of each bachelor’s degree
acquired from the different universities, which supports an objective determination
of the presence of a horizontal mismatch. By reviewing the study program and job
prospect of each specialty offered by each university, we compared these descriptions
with each individual occupation to discern if each graduate’s job corresponded with
his or her field of study. This analysis revealed that 36.2% of these graduates are hori-
zontally mismatched (see Table 1), and again, women appear to be more mismatched
than men, by around 6 percentage points.
Table II.1: Incidence of educational mismatches
TOTAL Male Female
VARIABLE Mean Std. Dev. Mean Std. Dev. Mean Std. Dev.
Overeducation 0.223 0.416 0.163 0.370 0.293 0.456
Horizontal mismatch 0.362 0.481 0.335 0.473 0.394 0.489
The incidence of overeducation is thus 14 points lower than this of horizontal
mismatches. Moreover, combination of the two educational mismatches are observed:
13% of graduates suffer from a double mismatch. Finally, only 32.5% of the gradu-
ates are single mismatched and among them, only 29% are overeducated. All these
statistics highlight that horizontal mismatches can be more common as well and that
taking into account only overeducation would neglect another main source of educa-
tional mismatches in Cambodia.
To capture both vertical and horizontal mismatches, we decide to focus on the
overall level of mismatch,7 through a variable denoted mismatch. This variable equals
0 if graduates’ education matches both the field and level of education required for
their jobs, 1 if graduates face one of these two mismatches, and 2 if a double mismatch
exists (see Figure 1).
7Note that among graduates who face only one mismatch, 145 suffer from only horizontal mis-match and 58 from only overeducation. The relatively small sample of vertically mismatched gradu-ates makes it impossible to estimate the different types separately with a robust analysis, so aninvestigation of the mismatch variable is preferable.
95
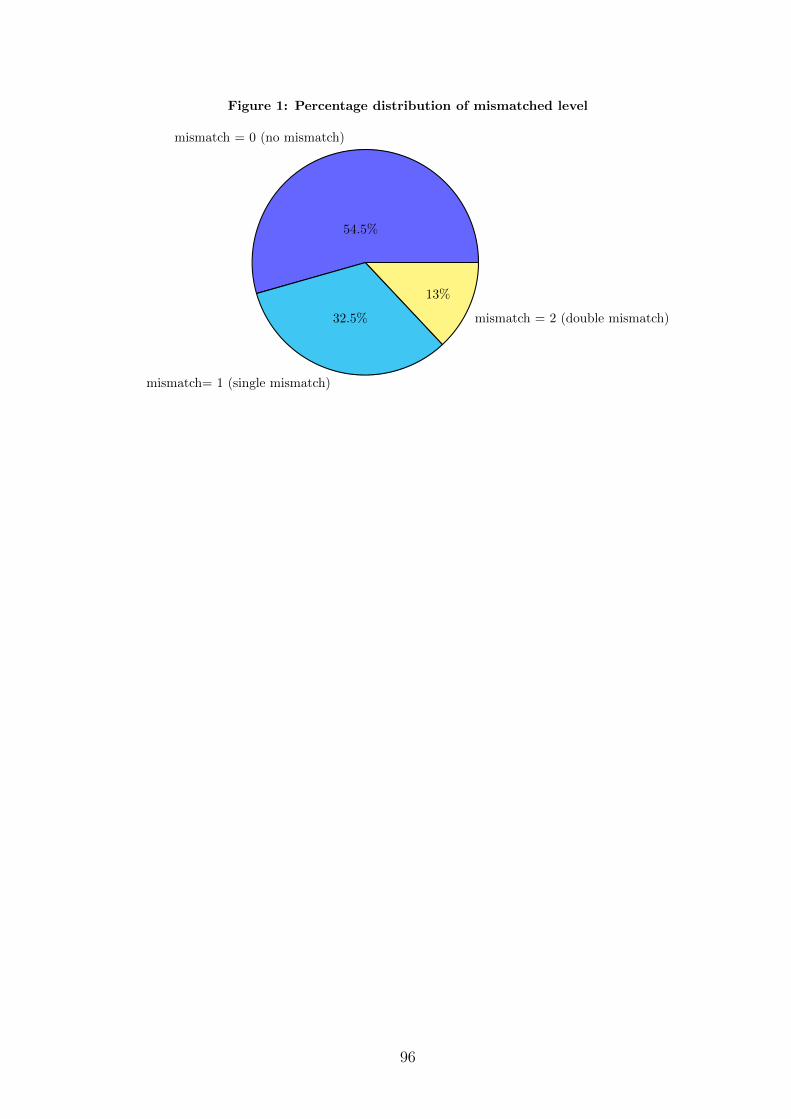
Figure 1: Percentage distribution of mismatched level
mismatch = 0 (no mismatch)
54.5%
mismatch= 1 (single mismatch)
32.5% mismatch = 2 (double mismatch)
13%
96

2.2 Descriptive statistics
Table 2 presents descriptive statistics for variables included in the analysis.8
Table II.2: Descriptive statistics
Level of Mismatch:
TOTAL No
Mismatch
Single
Mismatch
Double
Mismatch
VARIABLES Mean Std. dev. Observed
mean wage
Mean Mean Mean
Dependent variable
Salary (log) 5.78 0.52 5.86 5.75 5.50
Individual attributes
Male 0.54 0.50 5.82 0.60 0.47 0.44
Age at the end of study 23.54 2.31 5.93 23.46 23.78 23.31
Married 0.13 0.33 5.93 0.11 0.15 0.14
Sciences 0.19 0.39 5.98 0.25 0.12 0.09
Law-Eco-Management 0.58 0.49 5.66 0.53 0.61 0.70
Social Science Khmer 0.06 0.23 5.38 0.05 0.04 0.12
Social Science English 0.17 0.38 6.05 0.16 0.23 0.09
Double training 0.41 0.49 5.85 0.45 0.34 0.40
Internet training 0.33 0.47 5.77 0.38 0.29 0.27
High level education of parents 0.12 0.32 5.84 0.13 0.12 0.05
Studying in a private university 0.43 0.50 5.80 0.39 0.52 0.42
Educ parents x Private Univ 0.19 0.40 5.76 0.17 0.22 0.23
Being born in a developing area 0.80 0.40 5.79 0.82 0.77 0.78
Internship during the study 0.54 0.50 6.03 0.57 0.50 0.48
Firm and job characteristics
Experience 27.46 7.45 5.87
Working in the public sector 0.12 0.33 5.77
Permanent contract 0.21 0.41 5.84
Working in a small firm 0.35 0.48 5.82
Working outside Phnom Penh 0.19 0.40 5.83
Observations 624 340 203 81
8For continuous variables (age at the end of study and experience), observed mean wages areevaluated for the two last quartiles of each variable.
97

According to these statistics, graduates facing single or double mismatch earn, res-
pectively (logarithms), 1.9% and 6.1% less than graduates with no mismatch. The
wage penalty is thus observed, though these initial figures cannot reflect the true
impact of mismatches. For example, Table 2 suggests a strong link between the
level of mismatches and individual attributes, which influence wages. Gender and
marital status appear to have less influence on educational mismatches, but strong
differences emerge according to academic background characteristics. In line with
some previous research (e.g., Dolton & Vignoles, 2000 ; Morano, 2014), more scientific
(e.g., engineering) and specific (e.g., medicine, architecture) disciplines are less likely
to suffer the risk of mismatches. Graduates in the sciences represent 18% of the sample
but only 9% of those who suffer from a double mismatch. In terms of competencies,
skills in English and Internet use, as well as a double degree, seem to protect against
mismatches. Moreover, the type of university affects education mismatch frequencies.
Private institutions seem to favor mismatches, probably related to teaching quality,
as Robst (1995b) proposes for colleges. Finally, family characteristics, such as the
parents’ educational levels, limit educational mismatches. Competent instruction,
more expenditures on education, and greater attention to children’s education appear
to function as financial and technical supports that help children perform better from
their earliest experiences with school (Hansen & Mastekaasa, 2006 ; Torche, 2011 ;
Capsada-Munsech, 2015).
Thus, educational mismatches are not exogenous. Moreover, attributes that
link with mismatches seem to have an impact on wages (together with firms’ charac-
teristics). An econometric analysis could help estimate the real impact of education
mismatches on wages.
98
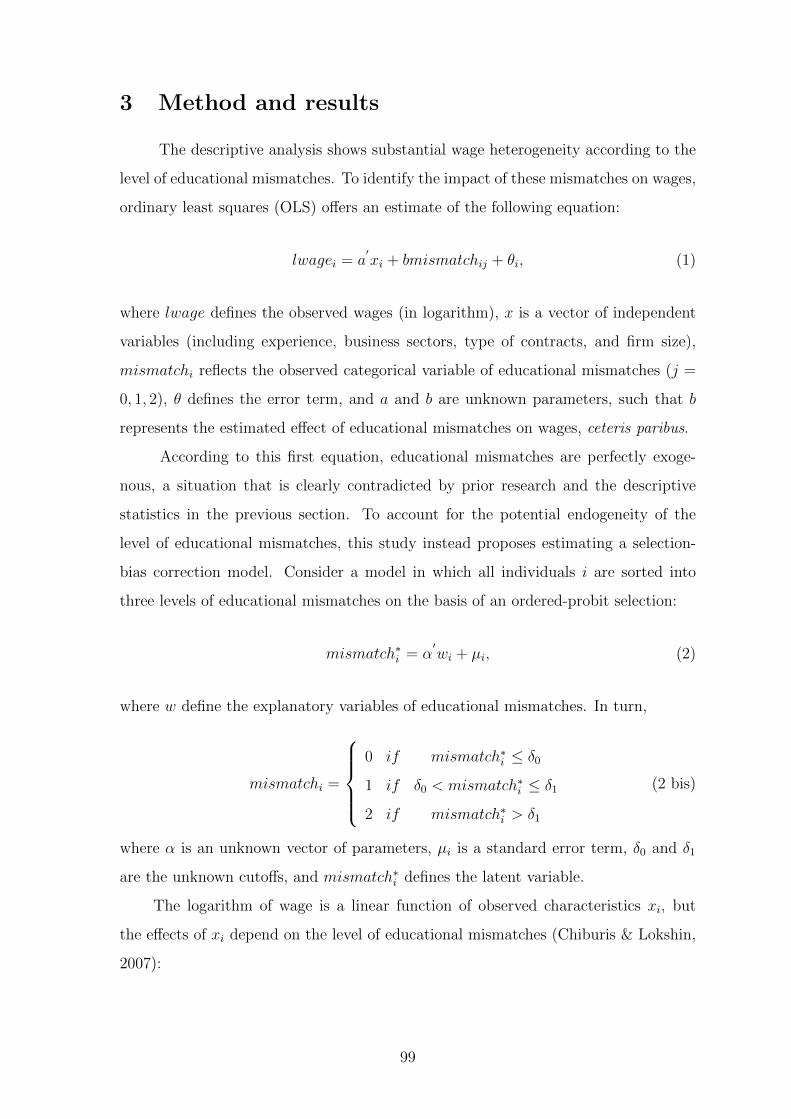
3 Method and results
The descriptive analysis shows substantial wage heterogeneity according to the
level of educational mismatches. To identify the impact of these mismatches on wages,
ordinary least squares (OLS) offers an estimate of the following equation:
lwagei = a′xi + bmismatchij + θi, (1)
where lwage defines the observed wages (in logarithm), x is a vector of independent
variables (including experience, business sectors, type of contracts, and firm size),
mismatchi reflects the observed categorical variable of educational mismatches (j =
0, 1, 2), θ defines the error term, and a and b are unknown parameters, such that b
represents the estimated effect of educational mismatches on wages, ceteris paribus.
According to this first equation, educational mismatches are perfectly exoge-
nous, a situation that is clearly contradicted by prior research and the descriptive
statistics in the previous section. To account for the potential endogeneity of the
level of educational mismatches, this study instead proposes estimating a selection-
bias correction model. Consider a model in which all individuals i are sorted into
three levels of educational mismatches on the basis of an ordered-probit selection:
mismatch∗i = α′wi + µi, (2)
where w define the explanatory variables of educational mismatches. In turn,
mismatchi =
0 if mismatch∗i ≤ δ0
1 if δ0 < mismatch∗i ≤ δ1
2 if mismatch∗i > δ1
(2 bis)
where α is an unknown vector of parameters, µi is a standard error term, δ0 and δ1
are the unknown cutoffs, and mismatch∗i defines the latent variable.
The logarithm of wage is a linear function of observed characteristics xi, but
the effects of xi depend on the level of educational mismatches (Chiburis & Lokshin,
2007):
99

lwagei =
β
′0xi + ε0i if mismatchi = 0
β′1xi + ε1i if mismatchi = 1
β′2xi + ε2i if mismatchi = 2
(3)
with:
εij → Φ2(0, σ2, ρj), (4)
where Φ2 is the bivariate normal distribution. Here, the ρj coefficients give the corre-
lation between the ordered level of educational mismatches and the wage equations.
If ρj = 0, the OLS estimate (model(1)) is unbiased, and there is no need to use a
selection-bias correction model.
This ordered Heckman model leads to predictions of the estimated wage, con-
ditional on the level of educational mismatches, as given by:
E[lwagei/mismatchi, wi, xi] = β′
jxi + ρjσjλij, (5)
where λij is the inverse Mills ratio (Heckman, 1979).
The estimate of the ordered Heckman model uses a Full Information Maximum
Likelihood (FIML) procedure, which maximizes the following likelihood function:
Llwageij =1
σj
Φ
α′wi + ρjti − δj√
1− ρ2j
− Φ
α′wi + ρjti − δj+1√
1− ρ2j
(6)
Table 3 summarizes the results of the OLS estimate and the ordered Heckman model.
100

Table II.3: Results
(1) (2) (3) (4) (5)
VARIABLES lsal (ols) mismatch lsal0 lsal1 lsal2
Male 0.024 -0.220** -0.046 -0.046 0.242**
(0.039) (0.102) (0.054) (0.109) (0.108)
Married 0.182*** 0.147 0.093 0.362*** 0.313*
(0.067) (0.142) (0.093) (0.140) (0.164)
Law - Economics - Management -0.273*** 0.561*** -0.233*** 0.236 -0.662***
(0.057) (0.148) (0.067) (0.185) (0.206)
Social Sciences English 0.065 0.470*** 0.055 0.538*** -0.222
(0.072) (0.170) (0.091) (0.185) (0.215)
Social Sciences Khmer -0.531*** 0.891*** -0.347** 0.073 -0.863***
(0.094) (0.270) (0.136) (0.294) (0.256)
Double training 0.082** -0.177* 0.023 -0.018 0.150
(0.039) (0.108) (0.053) (0.122) (0.110)
Experience 0.007*** 0.007** 0.006 0.012*
(0.002) (0.003) (0.004) (0.006)
Working in the public sector -0.026 -0.027 0.033 -0.489*
(0.057) (0.066) (0.126) (0.254)
Permanent contract 0.121** 0.149** 0.045 0.334*
(0.053) (0.065) (0.092) (0.182)
Fixed-term contract 0.160*** 0.202*** 0.185** 0.034
(0.045) (0.059) (0.077) (0.107)
Working in a small firm 0.081** 0.083* 0.054 0.120
(0.040) (0.050) (0.068) (0.115)
Working in a medium firm 0.036 0.037 0.067 -0.009
(0.063) (0.085) (0.104) (0.125)
Working outside Phnom Penh -0.085* -0.149*** -0.033 0.225*
(0.045) (0.057) (0.088) (0.123)
Mismatch=0 ref.
Mismatch=1 -0.074*
(0.041)
Mismatch=2 -0.223***
(0.059)
*** p<0.01, ** p<0.05, * p<0.1. Notes: Robust standard errors are in brackets.
101
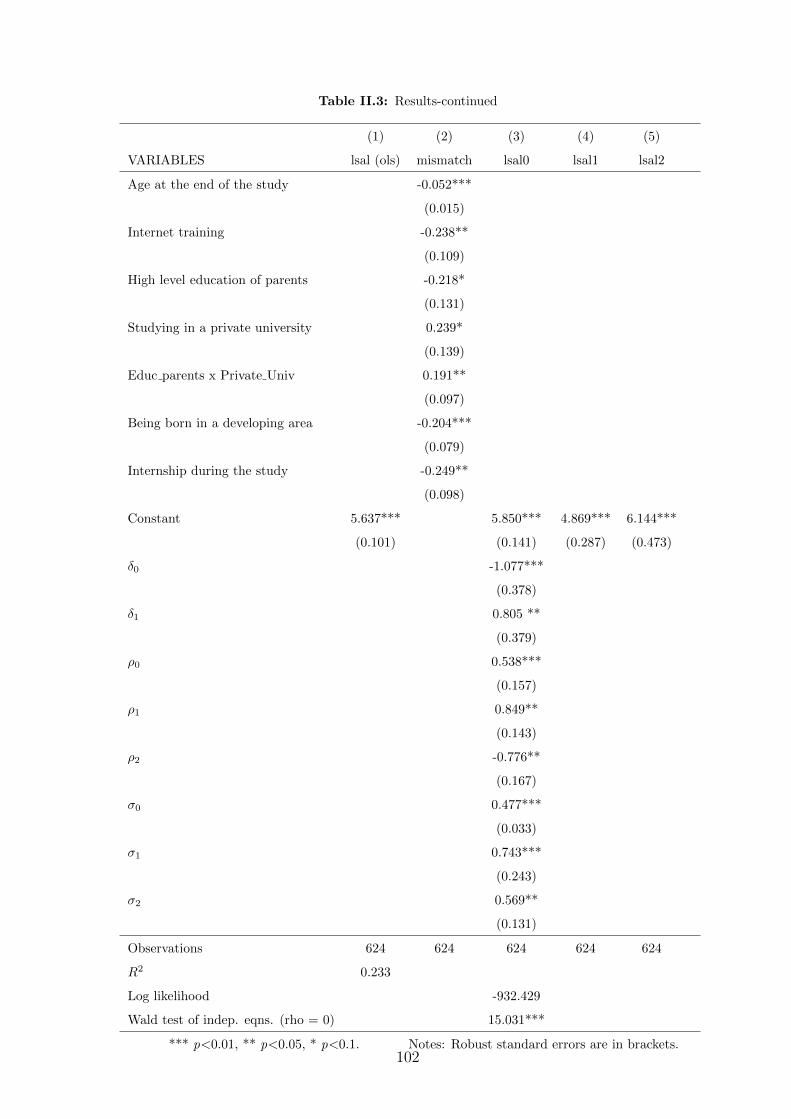
Table II.3: Results-continued
(1) (2) (3) (4) (5)
VARIABLES lsal (ols) mismatch lsal0 lsal1 lsal2
Age at the end of the study -0.052***
(0.015)
Internet training -0.238**
(0.109)
High level education of parents -0.218*
(0.131)
Studying in a private university 0.239*
(0.139)
Educ parents x Private Univ 0.191**
(0.097)
Being born in a developing area -0.204***
(0.079)
Internship during the study -0.249**
(0.098)
Constant 5.637*** 5.850*** 4.869*** 6.144***
(0.101) (0.141) (0.287) (0.473)
δ0 -1.077***
(0.378)
δ1 0.805 **
(0.379)
ρ0 0.538***
(0.157)
ρ1 0.849**
(0.143)
ρ2 -0.776**
(0.167)
σ0 0.477***
(0.033)
σ1 0.743***
(0.243)
σ2 0.569**
(0.131)
Observations 624 624 624 624 624
R2 0.233
Log likelihood -932.429
Wald test of indep. eqns. (rho = 0) 15.031***
*** p<0.01, ** p<0.05, * p<0.1. Notes: Robust standard errors are in brackets.102
The OLS estimate shows that a person who faces only horizontal or vertical mis-
matching suffers 7.7% (exp(−0.074)) lower wage on average. The wage penalty grows
three times more substantial, increasing to about 25% (exp(−0.223)), when both mis-
matches are observed (mismatch = 2). But selection bias can affect these estimates,
as stressed by Dolton & Vignoles (2000) and Dolton & Silles (2008) and suggested
by descriptive statistics. The ordered Heckman model indicates the existence of such
bias.
First, the level of educational mismatches strongly depends on several observed
attributes. In Cambodia, the propensity of high educational mismatches is much
higher for women, as also noted by McGoldrick & Robst (1996). Women have more
excess skills than their male counterparts, which may reflect the tendency of women
to select more literary or management majors that offer poorer employment prospects
(see infra). Gender stereotypes also may limit women’s access to well-suited, well-paid
jobs (Athey & Hautaluoma, 1994). In addition, individual skills affect the mismatch
risks and level. Graduates from non-scientific majors are more likely to suffer from
education-job mismatches, similar to findings by Green & McIntosh (2007) for the
United Kingdom and Tao & Hung (2014) in Taiwan. The Cambodian educational
system thus seems insufficiently adapted to the country’s labour market, with too
many people graduating in certain disciplines such as law, economics and manage-
ment, literature, and social sciences in the Khmer language. According to one pro-
jection, between 2009 and 2014, the relative supply of graduates in law, economics-
management, and related fields, was about 2.5 times greater than the demand for
graduates in these fields, while the supply of graduates in engineering fields was lower
than the demand (D’Amico, 2010, p.61). Regarding the allocation of genders by fields
of study, across the eight universities in this study, women are substantially under-
represented in engineering (8%), whereas they represent nearly half of the graduates
enrolled in economics-management and related fields (47%). Yet among graduates
with a double major, who have Internet skills, and who have completed an internship,
educational mismatches are scarcer. Having skills demanded by employers thus offers
improved employability and wage prospects. Parents’ education also influences the
level of educational mismatches: When students had parents who also had a uni-
versity degree, they were subjected to lower educational mismatches. As Hansen &
103

Mastekaasa (2006), Torche (2011), and Capsada-Munsech (2015) suggest, graduated
parents likely are better informed and share more knowledge with their children. Fi-
nally, studying in private universities leads to higher educational mismatches, even
after controlling for the link with the level of parents’ education. This result could be
interpreted as a signal of the lower quality of education provided by these institutions
in developing countries (Kwok, Chan, Heng, Kim, Neth, & Thon, 2010, p.41).
The results highlight that the correlation coefficients between the selection and
wage equations, ρj, are all significantly different from zero (Wald test). This result
conclusively indicates that the selection-correction model must be preferred over OLS
estimates.
For a robust estimate of the wage penalty according to the level of educational
mismatches, Table 4 provides the results of a calculation of the estimated wage, con-
ditional on the level of educational mismatches (see Equation 5).
Table II.4: Observed and estimated wages (logarithms)
Observed wage Predicted wage
Mismatch=0 5.860 5.820
Mismatch=1 5.750 5.769
Mismatch=2 5.501 5.602
The observed wage differential between people suffering from no mismatch and
those facing one or two mismatches is about 1.9% and 6.1%, respectively. But after
the selection bias correction, these wage differentials fall to 0.9% for one mismatch
and 3.7% when both horizontal and vertical mismatches occur. Selection effects thus
cause about a half of the observed wage differentials. This finding is not really sur-
prising; the current study results identify several variables that affect both the level
of educational mismatches and wages. Neglecting the selection process leads thus
to overestimates of the impact of mismatches on wages. For example, men have a
dual advantage: They are less likely to face educational mismatches and also earn
higher wages. Similarly, a degree in law, economics-management, literature, or social
sciences strongly increases the level of educational mismatches and decreases wages.
Accounting for the selection process in educational mismatches thus provides a more
accurate assessment of the real impact of wage determinants and level.
104

Nevertheless, even after controlling for the selection bias, the predicted wage
gaps remain positive and increasing with the level of educational mismatches. It is
thus essential to move beyond traditional measures of overeducation to study educa-
tional mismatches in all their dimensions and combinations (Robst, 2008 ; Nordin et
al., 2010 ; Tao & Hung, 2014). A double wage penalty exists for graduates from Cam-
bodian universities who face both vertical (overeducation) and horizontal mismatches.
105

4 Conclusion
This article investigates whether the level of educational mismatches is associ-
ated with lower wages in Cambodia, on the basis of an original survey of graduates
of Cambodian universities. This approach provides precise insights into the jobs ob-
tained by university graduates and supports measures of the potential mismatches
between educational endowments and job characteristics. A key contribution of this
paper thus is the methods provided for dealing with two critical methodological issues.
First, educational mismatches are dual in nature, involving both overeducation, or a
vertical mismatch, and a horizontal form. Second, educational mismatches cannot
be treated as exogenous, because educational choices clearly depend on the trade-off
that each student makes between the expected benefits and costs of an investment in
education.
To deal with both the double nature of educational mismatches (vertical and
horizontal) and their endogenous status, the current study used an ordered Heckman
selection model. The econometric results confirm that the level of educational mis-
matches significantly depends on individual attributes, parents’ education, and study
characteristics. After controlling for this selectivity process though, a wage penalty
persists for graduates who suffer from educational mismatches. This penalty even
worsened when vertical and horizontal mismatches were combined.
Therefore, this study highlights the need for a reform to the educational system
in Cambodia, including a refocus of the educational programs on the real needs of the
labor market, such that it helps students develop professional, Internet, and computer
skills, English capabilities, and access to internships. Informational campaigns could
be conducted to inform families about the real opportunities in the labor market,
by focusing on the least educated members of the population. Furthermore, evalua-
tions of different universities’ performance in terms of students’ employability could
be developed to help families make more informed educational choices. Financial
incentives might be an effective way to guide students toward the training courses
the hiring companies prefer. Finally, programs focused specially on young female
students should be established, to overcome the gender differences in the Cambodian
labor market.
106

Appendix
Table II.5: Correspondence between occupational class and educational level
ISCO-08 occupational class ILO skill level ISCED-97 educational level
1. Manager 3 + 4 6, 5a and 5b
2. Professionals 4 6 and 5a
3. Technicians 3 5b
4. Clerks 2 4, 3 and 2
5. Service and sales 2 4, 3 and 2
6. Skilled agricultural 2 4, 3 and 2
7. Craft and related 2 4, 3 and 2
8. Plant and machine operators 2 4, 3 and 2
9. Elementary occupations 1 1
Source: ISCO-08, volume I
Table II.6: Description of educational level required for each skill level
Skill level Educational level Description of educational level
4 6 Second stage of tertiary education (advanced
research qualification)
5a First stage of tertiary education, 1st degree
(medium duration)
3 5b First stage of tertiary education (short or
medium duration)
2 4 Post-secondary, non-tertiary education
3 Upper secondary level of education
2 Lower secondary level of education
1 1 Primary level of education
Source: ISCO-08, volume I
107

”This page is intentionally left blank.”
108

Chapter III
Overeducation among graduates in developing
countries: What impact on economic growth?
Abstract
This article analyzes the impact of graduates’ overeducation on economic growth
in thirty-eight developing countries. A combination of macro data from the World
Bank and micro data from the Integrated Public Use Microdata Series International
(IPUMSI) is employed. To deal with unobserved heterogeneity between countries and
endogeneity of overeducation, two-stage least squares regression with country fixed
effects is estimated. Results highlight that a high rate of overeducated graduates is
estimated to have a negative impact on economic growth at both short and medium
terms. The expansion of higher education sector in developing countries should be
realized with a deep attention on the education-job matching process among gradu-
ates.
Keywords: higher education, overeducation, economic growth, two-stage least square
with fixed-effects regressions.
JEL Codes: I23, I25, J24.
109

1 Introduction
The human capital theory (Becker, 1964) considers education as an investment
for a productivity enhancing and thus positively impacts individual earnings. At the
national level, the models of endogenous growth view human capital as a factor of
production that can increase the innovative capacity of the economy (Lucas, 1988 ;
Romer, 1990). Education may also facilitate the diffusion and transmission of know-
ledge needed to successfully implement new technologies devised by others (Nelson &
Phelps, 1966 ; Benhabib & Spiegel, 2005). Hence, from the theoretical point of view,
higher education may generate a strong positive effect on economic growth.
As more education, more growth, countries are incited to invest in education.
Consequently, a sharp increase in educational levels has been observed during the last
few decades all over the world (Barro & Lee, 2001 ; OECD, 2014). Nevertheless, the
positive impact of education on economic growth is very controversial from empirical
studies, in particular for higher education sector.
While Chatterji (1998), Wolff (2000), Gyimah-Brempong et al. (2005) and Hol-
land et al. (2013) find that higher education has a positive effect on economic growth,
Holmes (2013) finds that mass higher education does not lead to higher growth in
ninety one developed and developing countries during a period of forty years from
1966 to 2006. Hanushek (2013) also finds that the amount of tertiary education have
no impact on economic growth for either developed or developing countries, especially
when the quality of education is controlled.
The divergence between theoretical prediction and empirical studies on the role
of higher education in the economic growth could be also related to the education-job
matching process, particularly when the supply of highly educated workers is beyond
the demand, generating a phenomenon called overeducation (Ramos et al., 2012 ; Ku-
pets, 2015). Overeducation, or vertical educational mismatch, refers to an excess of
education, beyond the level needed to perform a certain job (Hartog, 2000 ; McGuin-
ness, 2006).
From the microeconomics’ perspective, two approaches differ on the effect of
overeducation. Researches in line with the ”human capital approach” find that over-
educated workers are more productive than their adequately educated colleagues in
110

the same jobs thanks to their more years of education, which is rather positive for
economic growth (Sattinger, 1993 ; Kampelmann & Rycx, 2012). Nevertheless, from
the ”job satisfaction approach”, overeducated workers are found to be less satisfied
that may reduce their work efforts/cooperation, and they are likely to quit their jobs
(Tsang & Levin, 1985 ; Wald, 2005 ; Blenkinsopp & Scurry, 2007 ; Tarvid, 2012).
This can incur additional hiring/training costs and constraint the firms’ development,
which can negatively affect economic growth (Mahy et al., 2015 ; McGuinness et al.,
2017).
From a strict macroeconomics’ point of view, educational mismatches represent
wasteful public investments and resources allocated to higher education sector, thus
risks of not training enough graduates for industries that extremely need them and
too much graduates for fields that do not have enough demands. Hence, it could have
an unfavorable effect on the countries’ gross domestic product (GDP) (Cedefop, 2010).
Up to now, little researches devote a special examination to a direct link between
overeducation and economic growth. First, focusing on the French case between 1980
and 2002 and employing the vector autoregression (VAR) model, Guironnet & Jaoul-
Grammare (2009) find that a share increase of overeducated workers of the higher
education produces an unfavorable short-term effect on the economic growth with a
significant threshold of 10%. In contrast, by using the ordinary least squares (OLS)
regression and panel data models, Ramos et al. (2012) find that overeducation has
a positive impact on economic growth in nine European countries.1 Hence, the link
between overeducation and economic growth is not clear. Furthermore, no studies
focused yet on developing countries where there seems to be an increasing trend of
overeducated graduates, and where resources for investment in education are severely
constrained and can ill afford to be wasted (Keese & Tan, 2013).
Given the inconclusiveness of the existing literature, the objective of this paper
is to investigate the impact of overeducation among tertiary graduates on economic
growth with a focus on developing countries where educational mismatches may be
also driven by factors other than those verified in developed countries.
1Those countries are Austria, France, Greece, Italy, Portugal, Romania, Slovenia, Spain andUnited Kingdom.
111

Indeed, while there still exists a significant shortage of high skilled workers2
reported by employers in several fields, the increase of higher education enrollment
in developing countries is, however, accompanied by an increase in educational mis-
matches among graduates (Ra et al., 2015). Thus, the higher education sector in
developing countries seems to face two problems: 1- A low quality of education
system and 2- an inadequate link between demand and supply of graduates
in some study fields (Reis, 2017).
First, regarding the quality of education in developing countries, some higher
education institutions (HEI) might have grown faster than qualified instructors, which
affects the quality of teaching (Dessus, 1999 ; D. Chapman & Chien, 2014). In 2011-
2012, for example, only 16% and 14% of university instructors hold doctoral degrees
in China and in Vietnam, respectively (D. Chapman & Chien, 2014). Furthermore,
in Cambodia for example, several HEI are driven by commercial interests and do not
focus on the quality of education (Kwok et al., 2010).
Second, in regard to the relation between supply and demand for graduates, a
severe mismatch may occur in some sectors. For instance, the country’s education
system has not produced enough graduates for nursing and high-tech manufacturing
in China (Ra et al., 2015), while excessive supply for finance and management majors
(Hu, 2013). This supply-demand inadequacy also exists in other countries like in
Egypt (Salama, 2012), Thailand EIC (2014), Cambodia (Madhur, 2014a) and Latin
American countries (Ferreyra, 2017). In fact, many students in developing nations,
for example in Thailand and Cambodia, do not have enough information of labor
market requirements, and they are more likely directed to simply attaining a degree
rather than acquiring skills important for their future careers (Pholphirul, 2017 ; Peou,
2017). In other words, the diploma disease3 coined by Dore (1976) is likely existing
over there.
2Skill shortages refer to unfilled or hard to fill vacancies that have arisen as a consequence of alack of qualified candidates for posts (McGuinness et al., 2017)
3Diploma disease refers to credential inflation. As a consequence of the belief that educationalcertificates are the key to obtaining the best-paid jobs, individuals come to strive for constantlyhigher credentials in order to obtain jobs that previously did not demand those certificates, andfor which their education does not in any case prepare them for those jobs and thus less likely totransform them into productive and innovative workers.
112

Due to these two problems, overeducated graduates might be not necessarily over-
skilled (Sattinger et al., 2012). Thus, if the analysis of overeducation in developing
countries seems at first sight not crucial given their still low educational attainments,
it is actually much more important because the negative effect of overeducation might
represent a risk of losing the potential growth as well as the capacity to catch up the
developed nations.
To analyze our research question, this article uses two sources of data, a macro
data from the World Bank to mainly calculate the economic growth and a micro
data from the Integrated Public Use Microdata Series International (IPUMSI) to
principally measure the incidence of overeducation. Then, we combine these two data
and get an unbalanced panel of thirty-eight developing countries between 1990 and
2011. Next, to deal with the unobserved heterogeneity between countries and the
endogenous problem of overeducation, two-stage least square (2SLS) regression with
fixed-effects is employed.
Therefore, this research contributes to the literature on two main points: 1-
Matching a micro and macro data, which allows to analyze the impact of over-
education on economic growth in developing countries, and 2- Dealing with the un-
observed heterogeneity between countries and endogeneity of overeducation that have
not been fully resolved in the prior literature.
The paper is structured as follows: Section 2 describes the database and how we
measure overeducation, section 3 focuses on descriptive statistics, section 4 presents
the method and results, and section 5 concludes.
113
2 Data
Our estimated model on the impact of overeducation on economic growth is
based on the growth models and the conceptual framework developed in OECD’s
and the World Bank’s report (2013) on the indicators of skills for employment and
productivity.4
Nevertheless, there is no database available for us to directly test the model and
analyze our research question. It is thus indispensable to construct a database by
collecting both macro and micro data and then match them together.
At macroeconomics level, the World Bank’s website permits us to extract data
on several key variables,5 but to complement the lack of data for some variables, in
particular the rate of overeducation among graduates, we need to employ a micro
data from the IPUMSI.6
The IPUMSI’s database provides integrated series of census micro data samples
from 1960 to the present day. Nevertheless, given that the share of tertiary graduates
has just started to increase in many developing countries from 1990s,7 we choose to
analyze the period between 1990 and 2011.8
The obvious advantage of using the IPUMSI’s samples lies in the fact that a
number of key variables such as educational level and occupations are recorded using
a homogeneous classification, allowing us to calculate the rate of overeducation and
other variables in a comparable way between different countries.
4The conceptual framework consists of five inter-related domains of indicators, including: con-textual factors which drive both the supply of and demand for skills (e.g, total population); skillacquisition which covers investments in skills (e.g, workforce with tertiary education); skill require-ments which measure the demand for skills in the labour market (e.g, share of high skilled jobs); thedegree of matching which captures how well skills obtained through education and training corres-pond to the skills required in the labour market (e.g, educational mismatch); and outcomes whichreflect the impact of skills on economic performance (e.g, economic growth).
5Data source: https://data.worldbank.org/indicator/.6Data source: https://international.ipums.org/international/7The increasing trend of tertiary education can be seen on https://ourworldindata.org/
tertiary-education/8Because one of our dependent variables is the economic growth between t0 and t5, we cannot
include the data after 2011 due to the unavailability of Gross Domestic Product (GDP) per capitaat t5.
114
The IPUMSI’s database contains sixty-three developing countries,9 but each
country presented is not observed at the same year and contains a different number
of observations. Thus, it is an unbalanced panel data that we will discuss and tackle
this issue in the method part.10
Given that samples from Argentina, Bangladesh, Columbia, Kenya and Ukraine
do not provide information on occupations, we are forced to exclude those countries
because we cannot calculate their rate of overeducation. Next, having learned that the
quality of census data in most sub-Saharan African countries, even in a big country
like Nigeria, often suffer from operational glitches that affect the credibility of the
results (Chandy,11 2015 ; Beguy,12 2016), we decide to exclude the countries from
that region. This leaves us with a sample of thirty-eight countries equaling seventy-
five observations.13
These countries are heterogeneous in terms of GDP, surface and geography. The
GDP per capita (PPP) is ranked from 904 USD in 1998 for Cambodia until 18,094
USD for Romania in 2011. In terms of surface, we have small countries like Saint
Lucia (617 km2) and Fiji (18,274 km2) to large countries like China (9.6 million km2)
and India (3.3 million km2). In terms of location, our sample is composed of sixteen
countries in Latin America & the Caribbean, nine countries in East-Asia & Pacific,
six countries in the Middle-East & North Africa, five countries in Europe & Central
Asia, and two countries in South Asia.
9The data is extracted in September 2017.10A country is classified as a developing country and which region it belongs to, is based on the
World Bank’s website. Reference:https://datahelpdesk.worldbank.org/knowledgebase/articles/906519-world-bank
-country-and-lending-groups11Laurence Chandy is currently the director of data, research and policy at the UNICEF:
https://www.brookings.edu/blog/africa-in-focus/2015/05/04/why-is-the-number-of
-poor-people-in-africa-increasing-when-africas-economies-are-growing/12Donatien Beguy is the head of statistics and surveys unit at the African population and health
research center:https://theconversation.com/poor-data-affects-africas-ability-to-make-the-right
-policy-decisions-6406413The full list of countries are available in the in the Table 8 of the Appendix: A.
115

2.1 Macro data
Several main variables can be found in the World Bank’s database.
First, we can extract data on our dependent variable: The growth of Gross Do-
mestic Product (GDP) per capita based on Purchasing Power Parity (PPP). Previous
researches on the impact of overeducation on economic growth have used two different
measures of economic growth: Short-term (t = 1) for Guironnet & Jaoul-Grammare
(2009) and medium-term (t = 5) for Ramos et al. (2012). We will employ thus two
measures, different in years-term: GDP per capita growth between 1- t0 and t1 and 2-
t0 and t5. This allows to observe the impact of overeducation more completely from
the short to medium terms.
Next, regarding the independent variables, the classical models view the quantity
of labor as an essential element to economic growth (Eltis, 2000). We employ therefore
the total population and labor force participation rate as proxies for the quantity of
labor. Then, the neoclassical growth model finds that there exists the convergence
effect between poor and rich countries (Barro & Sala-i Martin, 1992), so we introduce
the initial GDP per capita into our model. Afterward, the endogenous growth theory
recommends the role of education in stimulating economic growth (Lucas, 1988), and
some empirical evidences also find that education especially the quality of education
matters to economic growth (Hanushek & Woßmann, 2007). We use thus the pupils
to teacher ratio in primary school as a proxy for the quality of education14 because
several studies use class size to infer the effect of school quality on student outcomes
(Bernal et al., 2016). Infrastructure also plays a key role in supporting economic
growth (Barro, 1990), we employ thus the access to mobile phone as a proxy variable
for infrastructure.15
14This indicator is preferable than the pupils-teacher ratio in secondary school or in tertiary schoolbecause the typical school dropouts in developing countries would lower the pupils-teacher ratio athigher grades, thus using these last two indicators to represent the educational quality might be bias.
15The number of mobile phones is also used as a proxy for communication infrastructure in otherresearches such as Ismail & Mahyideen (2015).
116
2.2 Micro data
For missing variables at macroeconomics level, the IPUMSI database allows us
to overcome this problem.
Indeed, the OECD’s and the World Bank’s report (2013) have mentioned the
importance of skill requirement in the determination of how productive each country’s
economy is and also its potential economic growth. We calculate thus the shares of
high-skilled jobs16 as a proxy for the skill requirements in each country. Next, the skill
acquisition among the workforce is another key driver of economic growth because it
is a source of skills for meeting the skill requirement of employers, and more educated
workforce can also be more productive (Becker, 1964 ; Lucas, 1988). We calculate
then the percent of workforce with secondary and tertiary education as proxies for skill
acquisition. Lately, Wei & Zhang (2011) find that the sex-ratio imbalance stimulates
economic growth in China because men are more likely to take risks in their careers
(thus higher returns), are expected to get more supports from parents in access to
education, and gender inequality in the labor market that favor men to gain access
to managerial positions. We add therefore the male ratio in the workforce calculated
from the IPMUSI database as another independent variable.
Finally, our main independent variable is the rate of overeducation among the
tertiary graduates that measures how well the skill requirement and skill acquisition
match each other in each country or how the tertiary education acquired by graduates
is transformed into productive activities for economic growth enhancing (please refer
to the Box 1 below to see how we measure overeducation).
16We consider jobs as high-skilled jobs if those jobs need tertiary education. For the detaileddescription, please refer to the Tables 9 and 10 in the Appendix: B.
117

Table 1 summarizes the variables and sources of data used in this research:
Table III.1: Variables and data sources
Indicator domains Variables Data sources Nature of data
Outcome or dependent variable Economic growth
World Bank Macro data
Contextual factors
Total populationLabor force participation rateInitial GDP per capitaPupils-teacher ratioAccess to mobile phone
Male ratio in the Workforce
IPUMSI Micro dataSkill requirement Share of high-skilled jobs
Skill acquisition Workforce with secondary educationWorkforce with tertiary education
Matching Graduates’ overeducation rate
Table source: OECD’s and the World Bank’s report (2013)
Box 1: Overeducation indicators
Based on the IPUMSI data, two methods can be used to calculate the incidence of overeducation:
Job analysis (JA) and statistical method. Between these two measures, Hartog (2000) and Sloane (2003)
consider JA to be conceptually superior because the statistical measure possesses several drawbacks.
One of the main shortcomings of statistical measure lies in the fact that in case of excess supply of
graduates for a given occupation, it will underestimate the level of overeducation and will overestimate in
case of excess demand (Kiker et al., 1997 ; de Oliveira et al., 2000).
For example, suppose a country is facing an excess of tertiary graduates, and consequently, to avoid the
unemployment, many of them may accept to work as clerical support workers, an occupation that, however,
does not needs tertiary education. The statistical measure calculates the average (or mode) number of years
of education of all workers occupying the clerical position and then classifies a worker in this occupation as
overeducated if his/her number of years of study is above the average plus one or two standard deviations
(or alternatively above the modal value). Thus, if a high proportion of graduates work as clerical clerks, this
will raise the average years of education within this occupation. As a result, those graduates are likely not
deemed to be overeducated, which underestimates the true level of overeducation. Thus, the use of statistical
measure is often regarded as inferior and is only used when there is no available data to conduct the JA
method (Leuven et al., 2011).
In our data, we do observe that the incidence of overeducation based on statistical measure (using mode)
has a significant negative correlation (coefficient = -0.61) with the proportion of graduates in the workforce,
that is to say, a country having a high proportion of graduates is more likely to have a low incidence of
overeducation, and vice versa. This seems to be in line with the inconvenience of using statistical measure
mentioned by the literature above. Hence, we decide to only employ the JA measure.
118

Box 1: Overeducation indicators (continued)
The IPUMSI database classifies individual occupations following the International Standard Classi-
fication of Occupations Code (ISCO). Based on JA measure, each occupation is assigned to what level of
skill or education required classified in the International Standard Classification of Education (ISCED). For
example, the occupational levels 1 (managers), 2 (professionals) and 3 (technicians) classified in the ISCO
are assigned to educational levels 5 and 6 (first stage and second stage of tertiary education) in the ISCED.
Thus, if graduates are employed in those occupational levels, they are considered as matched workers because
those occupations need tertiary education. In contrast, if they are employed in occupational levels of ISCO
that require education lower than the levels 5 and 6 in ISCED, they are defined as overeducated.a
After defining which individual is overeducated, we calculate the proportion of graduates who are
overeducated in each country. Results highlight that the incidence of overeducation quite differs between
countries. For example in 2011, the rate of overeducation among graduates is found to be 17% in Romania
and 30% in Armenia. Within the same country, overeducation seems to increase over time, which gives us
more motivation to analyze its impact. For instance in Costa Rica, the overeducation rate was 12% in 2000
and increased to 23% in 2011. Between regions, the difference also pronounces: Overall, the rate ranked
from 17% in Europe & Central Asia to 33% in South Asia (Figure 1).b
aTables specifying the matching process between the occupational classes and the required educational levels, are in theAppendix: B.
bThe incidence of overeducation in each region is calculated by the sum of each country’s incidence and then is divided bythe number of countries in the region.
Figure III.1: Overeducation rate among tertiary graduates across regions
119
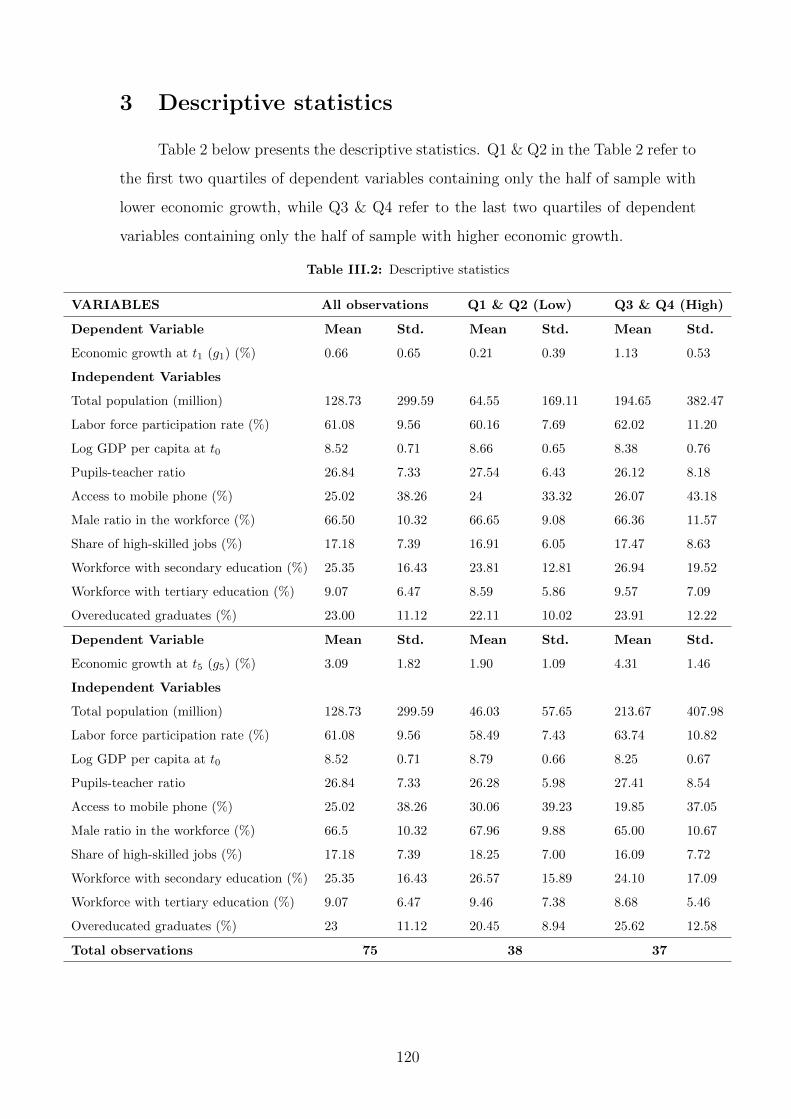
3 Descriptive statistics
Table 2 below presents the descriptive statistics. Q1 & Q2 in the Table 2 refer to
the first two quartiles of dependent variables containing only the half of sample with
lower economic growth, while Q3 & Q4 refer to the last two quartiles of dependent
variables containing only the half of sample with higher economic growth.
Table III.2: Descriptive statistics
VARIABLES All observations Q1 & Q2 (Low) Q3 & Q4 (High)
Dependent Variable Mean Std. Mean Std. Mean Std.
Economic growth at t1 (g1) (%) 0.66 0.65 0.21 0.39 1.13 0.53
Independent Variables
Total population (million) 128.73 299.59 64.55 169.11 194.65 382.47
Labor force participation rate (%) 61.08 9.56 60.16 7.69 62.02 11.20
Log GDP per capita at t0 8.52 0.71 8.66 0.65 8.38 0.76
Pupils-teacher ratio 26.84 7.33 27.54 6.43 26.12 8.18
Access to mobile phone (%) 25.02 38.26 24 33.32 26.07 43.18
Male ratio in the workforce (%) 66.50 10.32 66.65 9.08 66.36 11.57
Share of high-skilled jobs (%) 17.18 7.39 16.91 6.05 17.47 8.63
Workforce with secondary education (%) 25.35 16.43 23.81 12.81 26.94 19.52
Workforce with tertiary education (%) 9.07 6.47 8.59 5.86 9.57 7.09
Overeducated graduates (%) 23.00 11.12 22.11 10.02 23.91 12.22
Dependent Variable Mean Std. Mean Std. Mean Std.
Economic growth at t5 (g5) (%) 3.09 1.82 1.90 1.09 4.31 1.46
Independent Variables
Total population (million) 128.73 299.59 46.03 57.65 213.67 407.98
Labor force participation rate (%) 61.08 9.56 58.49 7.43 63.74 10.82
Log GDP per capita at t0 8.52 0.71 8.79 0.66 8.25 0.67
Pupils-teacher ratio 26.84 7.33 26.28 5.98 27.41 8.54
Access to mobile phone (%) 25.02 38.26 30.06 39.23 19.85 37.05
Male ratio in the workforce (%) 66.5 10.32 67.96 9.88 65.00 10.67
Share of high-skilled jobs (%) 17.18 7.39 18.25 7.00 16.09 7.72
Workforce with secondary education (%) 25.35 16.43 26.57 15.89 24.10 17.09
Workforce with tertiary education (%) 9.07 6.47 9.46 7.38 8.68 5.46
Overeducated graduates (%) 23 11.12 20.45 8.94 25.62 12.58
Total observations 75 38 37
120

According to the Table 2, economic growth seems to be linked to several factors.
First, population and labor force participation rate seem to yield positive impacts.
Next, less developing economies look to grow faster. Nevertheless, the relation with
other variables are not clearly observed. For example, the workforce with secondary or
tertiary education seem to be positive for economic growth at short term but negative
at medium term.
Regarding the effect of overeducation, the rate of overeducation might have a positive
effect. To make their relation more clearly, we create a scatter plot with a linear
regression line in the figure 2 below:
Figure III.2: Relation between overeducation and economic growth
Based on the figure 2, the relation between overeducation and economic growth seems
to be a bit perplex. At short term, overeducation seems to yield a positive effect. In
contrast, at medium term, it looks to have a negative impact.
121

The uncertainty of their relation may be due to two factors: 1- The influence
of other variables on the economic growth that we need to control for their effects,
and 2- overeducation might be endogenous as suggested by prior researches (Dolton
& Vignoles, 2000 ; Korpi & Tahlin, 2009). For example, the quality of education is
found to affect both economic growth (Hanushek, 2013) and overeducation (Charlot
& Decreuse, 2005). The existence of search friction in the labor market can also make
graduates take more time to find a matched job (Jovanovic, 1979). Therefore, a good
infrastructure that facilitates the communication as well as reduces the asymmetric
of information in an economy may affect not only the economic growth (Barro, 1990),
but also the overeducation rate (Chua & Chun, 2016).
It is thus necessary to conduct an econometric analysis to identify the real impact
of overeducation on economic growth.
122
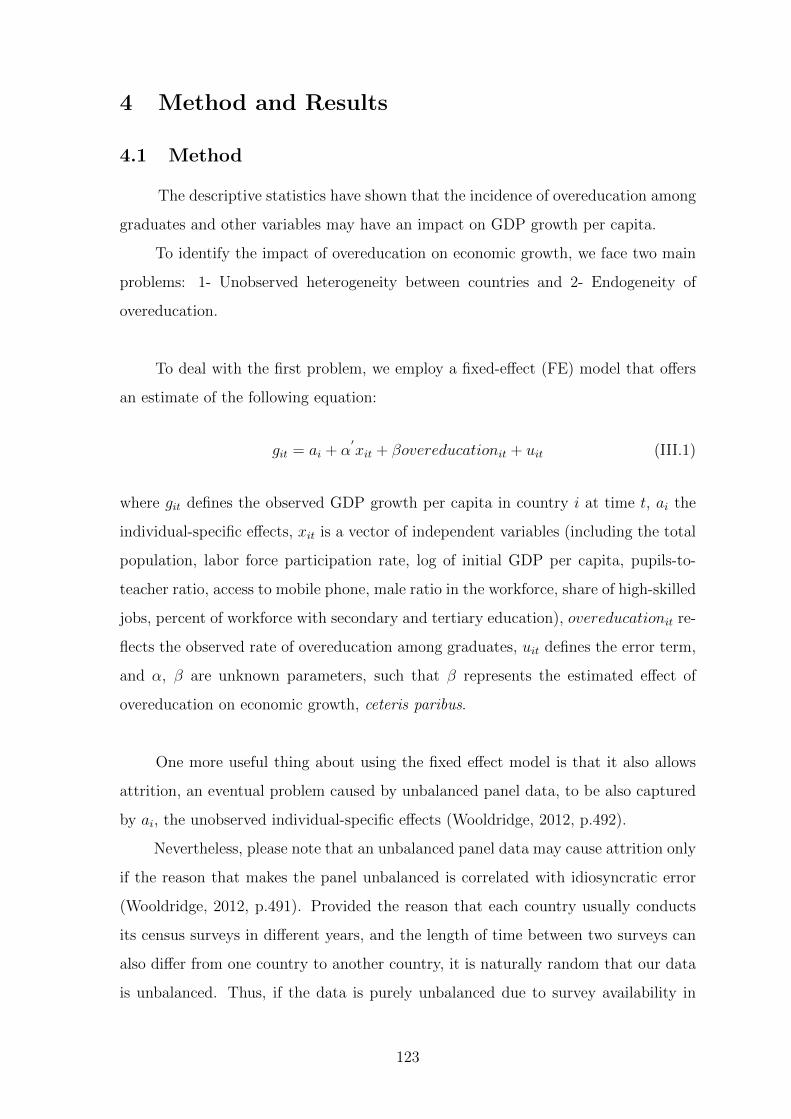
4 Method and Results
4.1 Method
The descriptive statistics have shown that the incidence of overeducation among
graduates and other variables may have an impact on GDP growth per capita.
To identify the impact of overeducation on economic growth, we face two main
problems: 1- Unobserved heterogeneity between countries and 2- Endogeneity of
overeducation.
To deal with the first problem, we employ a fixed-effect (FE) model that offers
an estimate of the following equation:
git = ai + α′xit + βovereducationit + uit (III.1)
where git defines the observed GDP growth per capita in country i at time t, ai the
individual-specific effects, xit is a vector of independent variables (including the total
population, labor force participation rate, log of initial GDP per capita, pupils-to-
teacher ratio, access to mobile phone, male ratio in the workforce, share of high-skilled
jobs, percent of workforce with secondary and tertiary education), overeducationit re-
flects the observed rate of overeducation among graduates, uit defines the error term,
and α, β are unknown parameters, such that β represents the estimated effect of
overeducation on economic growth, ceteris paribus.
One more useful thing about using the fixed effect model is that it also allows
attrition, an eventual problem caused by unbalanced panel data, to be also captured
by ai, the unobserved individual-specific effects (Wooldridge, 2012, p.492).
Nevertheless, please note that an unbalanced panel data may cause attrition only
if the reason that makes the panel unbalanced is correlated with idiosyncratic error
(Wooldridge, 2012, p.491). Provided the reason that each country usually conducts
its census surveys in different years, and the length of time between two surveys can
also differ from one country to another country, it is naturally random that our data
is unbalanced. Thus, if the data is purely unbalanced due to survey availability in
123

the relevant country, it should be not correlated with idiosyncratic errors (Chun et
al., 2017, p.11). Hence, unbalanced panel of this type should not cause attrition or
any serious problems (Wooldridge, 2012, p.491 ; Andress et al., 2013, p.177).
FE model supposes, however, that all variables are exogenous, but we have done
the Durbin test, and it shows that overeducation is not exogenous:
Table III.3: Test for endogeneity of overeducation
Short-term economic growth (g1) Medium-term economic growth (g5)
Hypothesis Durbin score P-value Durbin score P-value
H0: Overeducationis exogenous
15.446 0.0001 6.645 0.0099
Indeed, according to the Table 3, the p-value is highly significant, which rejects the
null hypothesis that overeducation is exogenous.17 To also deal with the problem of
endogeneity, 2SLS regression with FE is used in the Model 2.
To employ the 2SLS regression model, we need an instrumental variable that
has to fill two conditions: 1- instrument relevance and 2- instrument exogeneity
(Wooldridge, 2012, p.514). The relevance of instrument implies that it must be cor-
related with the endogenous variable. The exogeneity assumption requires that the
instrument must be exogenous (uncorrelated with the error term) and not a direct
cause of the dependent variable.
In advanced economies, they find that older graduates are less likely to be over-
educated because they have more experience, better relevant skill sets, and have more
opportunities for upward mobility (Morano, 2014 ; Kupets, 2015). Thus, graduates’
age can be correlated with overeducation. Next, we find no evidence that graduates’
age can directly impact economic growth. Hence, graduates’ age should be exogenous.
Therefore, the average of graduates’ age, calculated from the IPUMSI data, should
be eligible to be the instrumental variable.
17Reference: Stata manual at https://www.stata.com/manuals13/rivregresspostestimation.pdf
124
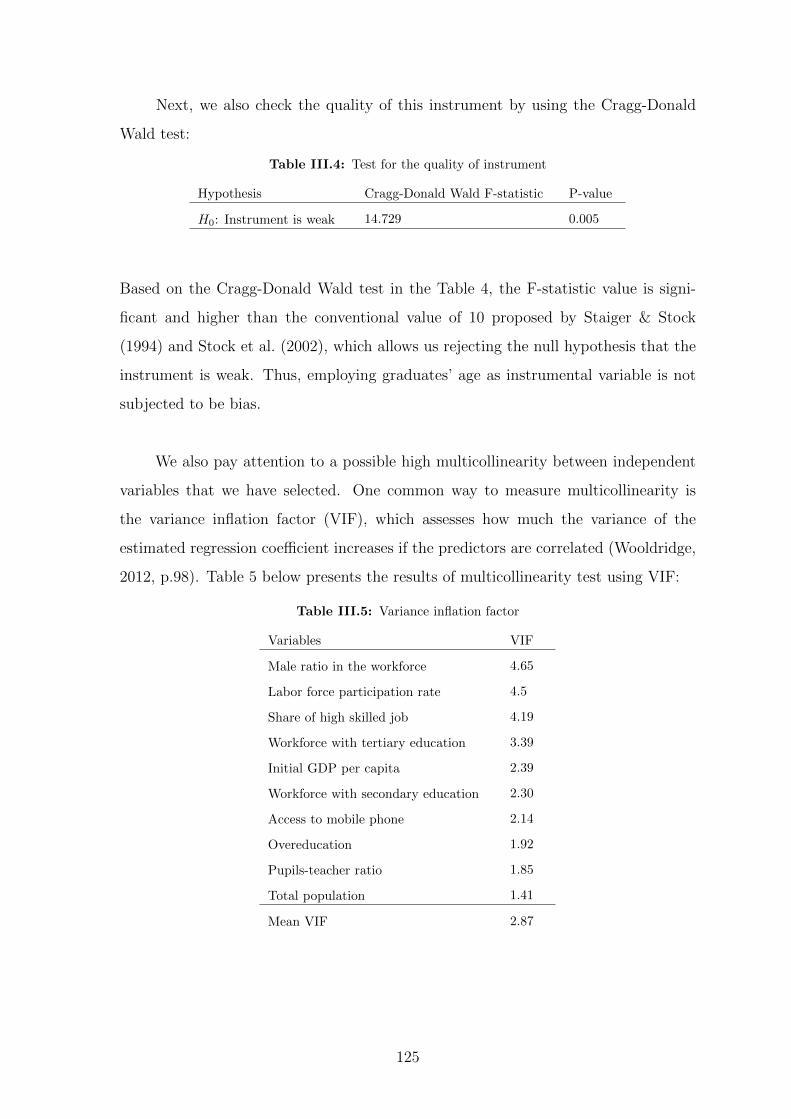
Next, we also check the quality of this instrument by using the Cragg-Donald
Wald test:
Table III.4: Test for the quality of instrument
Hypothesis Cragg-Donald Wald F-statistic P-value
H0: Instrument is weak 14.729 0.005
Based on the Cragg-Donald Wald test in the Table 4, the F-statistic value is signi-
ficant and higher than the conventional value of 10 proposed by Staiger & Stock
(1994) and Stock et al. (2002), which allows us rejecting the null hypothesis that the
instrument is weak. Thus, employing graduates’ age as instrumental variable is not
subjected to be bias.
We also pay attention to a possible high multicollinearity between independent
variables that we have selected. One common way to measure multicollinearity is
the variance inflation factor (VIF), which assesses how much the variance of the
estimated regression coefficient increases if the predictors are correlated (Wooldridge,
2012, p.98). Table 5 below presents the results of multicollinearity test using VIF:
Table III.5: Variance inflation factor
Variables VIF
Male ratio in the workforce 4.65
Labor force participation rate 4.5
Share of high skilled job 4.19
Workforce with tertiary education 3.39
Initial GDP per capita 2.39
Workforce with secondary education 2.30
Access to mobile phone 2.14
Overeducation 1.92
Pupils-teacher ratio 1.85
Total population 1.41
Mean VIF 2.87
125

Hair et al. (2009)[p.193] and Wooldridge (2012)[p.98] state that a VIF value smaller
than 10 is commonly acceptable in the literature, and thus the correlations between
independent variables should not cause serious problems.
According to the Table 5, the mean VIF value is only 2.87 and each variable possesses
a VIF value less than 5 in accordance with the conventional threshold (VIF < 10)
generally employed in the literature.
Finally, it is recommended to add a time variable in the panel data regression
(Damodar et al., 2004, p.643) because if there exists a negative (or positive) economic
shock in a given period, overeducation rate at that time could be high (or low) and
economic growth could be low (or high). To check the presence of time effects, we
conduct a Chi-squared test: .
Table III.6: Test for time effects
Hypothesis Chi-squared value P-value
H0: No effects of time variable 4373.18 0.000
The test result shows a significance of p-value, which leads to the rejection of null
hypothesis that there are no time fixed effects (Damodar et al., 2004, p.644). Thus,
a year dummy indicator is added as another control variable in the regression model.
126
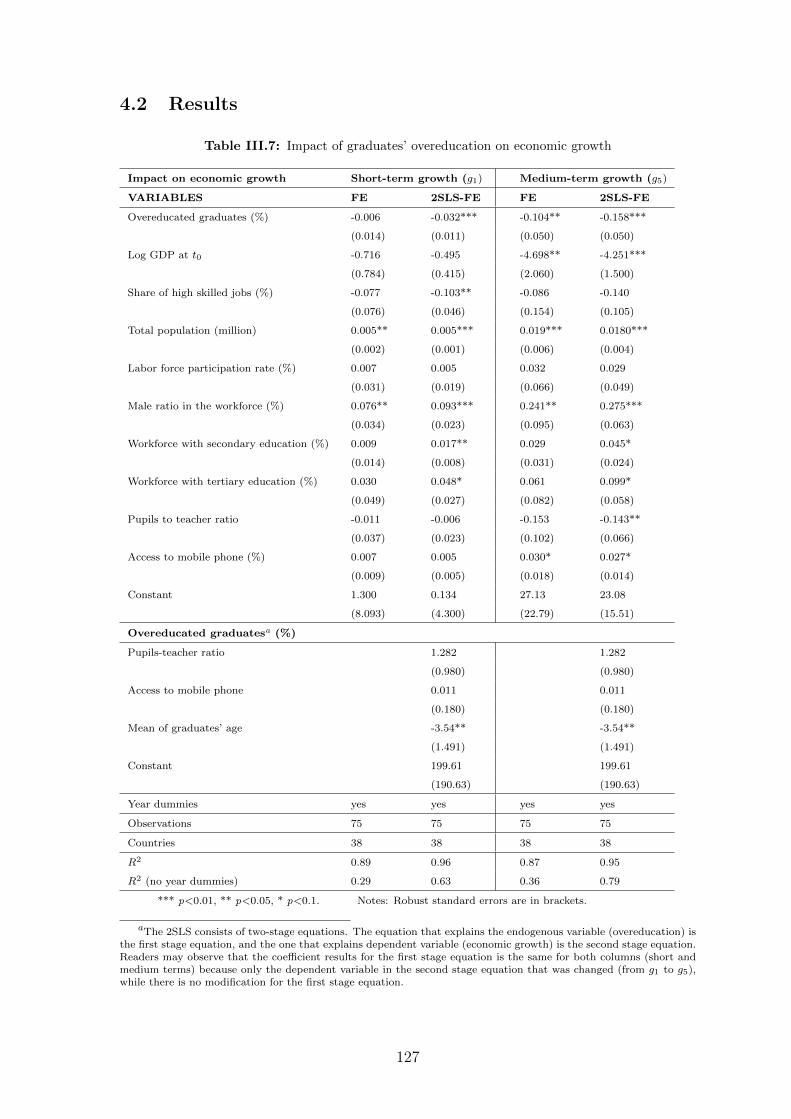
4.2 Results
Table III.7: Impact of graduates’ overeducation on economic growth
Impact on economic growth Short-term growth (g1) Medium-term growth (g5)
VARIABLES FE 2SLS-FE FE 2SLS-FE
Overeducated graduates (%) -0.006 -0.032*** -0.104** -0.158***
(0.014) (0.011) (0.050) (0.050)
Log GDP at t0 -0.716 -0.495 -4.698** -4.251***
(0.784) (0.415) (2.060) (1.500)
Share of high skilled jobs (%) -0.077 -0.103** -0.086 -0.140
(0.076) (0.046) (0.154) (0.105)
Total population (million) 0.005** 0.005*** 0.019*** 0.0180***
(0.002) (0.001) (0.006) (0.004)
Labor force participation rate (%) 0.007 0.005 0.032 0.029
(0.031) (0.019) (0.066) (0.049)
Male ratio in the workforce (%) 0.076** 0.093*** 0.241** 0.275***
(0.034) (0.023) (0.095) (0.063)
Workforce with secondary education (%) 0.009 0.017** 0.029 0.045*
(0.014) (0.008) (0.031) (0.024)
Workforce with tertiary education (%) 0.030 0.048* 0.061 0.099*
(0.049) (0.027) (0.082) (0.058)
Pupils to teacher ratio -0.011 -0.006 -0.153 -0.143**
(0.037) (0.023) (0.102) (0.066)
Access to mobile phone (%) 0.007 0.005 0.030* 0.027*
(0.009) (0.005) (0.018) (0.014)
Constant 1.300 0.134 27.13 23.08
(8.093) (4.300) (22.79) (15.51)
Overeducated graduatesa (%)
Pupils-teacher ratio 1.282 1.282
(0.980) (0.980)
Access to mobile phone 0.011 0.011
(0.180) (0.180)
Mean of graduates’ age -3.54** -3.54**
(1.491) (1.491)
Constant 199.61 199.61
(190.63) (190.63)
Year dummies yes yes yes yes
Observations 75 75 75 75
Countries 38 38 38 38
R2 0.89 0.96 0.87 0.95
R2 (no year dummies) 0.29 0.63 0.36 0.79
*** p<0.01, ** p<0.05, * p<0.1. Notes: Robust standard errors are in brackets.
aThe 2SLS consists of two-stage equations. The equation that explains the endogenous variable (overeducation) isthe first stage equation, and the one that explains dependent variable (economic growth) is the second stage equation.Readers may observe that the coefficient results for the first stage equation is the same for both columns (short andmedium terms) because only the dependent variable in the second stage equation that was changed (from g1 to g5),while there is no modification for the first stage equation.
127

According to the model 2SLS-FE in the Table 7, several contextual factors affect
the economic growth.
First, a high quantity of population, which may indicate a labor abundance, exerts a
positive impact on economic growth as suggested by the classical model (Eltis, 2000).
Then, we also note that the male ratio in the workforce does yield a positive impact
at both short and medium terms as found by Wei & Zhang (2011). Perhaps, the
gender inequality in developing countries, favoring males in education and access to
managerial positions, is systematically large in developing countries (Jayachandran,
2015), making men more productive and being able to contribute more to economic
growth. Reducing gender inequality in those countries should improve their economic
development (Hakura et al., 2016). Next, there exists the convergence effect between
poor and rich countries as estimated by the neoclassical model (Barro & Sala-i Mar-
tin, 1992), but only at medium term. An increase in pupils-teacher ratio, a proxy for
a lower quality of education, decreases the economic growth rate at medium term as
well, which emphasizes the importance of educational quality (Hanushek & Woßmann,
2007). Infrastructure, proxied by the access to mobile phone, positively influences the
medium term growth rate as suggested by the endogenous growth model of Barro
(1990).
Regarding the skill requirement, the share of high skilled jobs has a negative effect
at short term that is a bit surprising at first glance. Having learned, however, that
many high-skilled vacant jobs are unfilled or hard to fill at short-term, which can lead
to high costs at both company and country levels (BCG, 2016), the negative sign
of the share of high-skilled jobs can be comprehensible. Looking at another side to
the skill acquisition, the workforce with secondary and tertiary education do have
positive impacts for both short and medium terms. This also supports the human
capital theory of Becker (1964) and endogenous growth model of Lucas (1988) who
recommend that more educated people are more productive.
128

Finally, overeducation among graduates, the matching indicator between the skill
requirement and acquisition, is found to have a negative impact on economic growth.
Without taking into account the endogeneity of overeducation (Model FE), this mis-
match only significantly affects economic growth at medium term. After correction
for the endogenous problem (Model 2SLS-FE), overeducation affects the growth rate
at both short and medium terms, with also stronger effects. Thus, if we do not con-
sider the endogenous problem, we will underestimate the impact of overeducation.
We also note that at t = 1, the impact of overeducation is marginal. Perhaps, at
short-term, some overeducated graduates still feel optimistic to find a better matched
job in the future, and thus, their job satisfaction are not yet too low. However, at
medium-term of five years, they may feel more dissatisfied, which strongly impacts
their productivity.
The negative effect of overeducation might also indicate that overeducated graduates
in developing countries are perhaps not overskilled due to the possible lack of quality
in education and inadequacy problem between supply and demand for graduates in
some fields. Thus, the expansion of higher education might be not fully beneficial
to those countries if educational mismatches among graduates are not taken into
consideration.
129

5 Conclusion
Using a combination of the World Bank and IPUMSI data, this article analyzes
the impact of overeducated graduates’ incidence on economic growth with a focus
on thirty-eight developing countries. Job analysis is employed to measure the rate
of overeducation, and to deal with unobserved heterogeneity between countries and
endogeneity of overeducation, two-stage least square regression with country fixed-
effects is estimated on the economic growth at short-term (one year) and medium-term
(five years).
We find that higher rate of overeducated graduates lower the GDP growth per
capita with a stronger effect at medium-term and when the endogeneity of over-
education is taken into account. This result is therefore more conforming to the
”job satisfaction approach” than the ”human capital approach”. Indeed, many over-
educated graduates in developing countries might be not overskilled due to the quality
of education and the inadequacy between the supply and demand for graduates in
some economic sectors. This may also explain why some researches did not find signi-
ficant relationship between higher education and economic growth, especially when the
data contains developing countries. The main key contribution of this research is thus
to take into consideration the education-job matching that the theoretical prediction
and empirical literature on the link between tertiary education and economic growth
seemly ignore.
Perhaps, to exploit the potential benefits of higher education, developing coun-
tries should improve more the quality of their education system from the primary
school to tertiary education, such that students will graduate with the actual skills
that correspond to their educational level. At the same time, they need to strengthen
the links between the higher education sector and the labor market. The negative
impact from investing in higher education could discourage people, especially young
generations, to apply more effort on their human capital development, which could
make the situation worse in the future.
Given the limited available data, we cannot further analyze the effects of over-
education for specific regions and specific economic sectors. Future researches are
obviously needed to shed more light on this issue.
130

Appendix: A
Table III.8: Percentage of overeducated graduates by regions, countries and years
Year and incidence of overeducation among graduates
Region & Country Year % Overedu. Year % Overedu. Year % Overedu. Year % Overedu. Year % Overedu.
I Latin America & Caribbean 1990-1994 18% 1995-1999 18% 2000-2004 22% 2005-2009 26% 2010-2011 28%
1 Bolivia 1992 19% 2001 20%
2 Brazil 1991 19% 2000 19% 2010 28%
3 Costa Rica 2000 12% 2011 23%
4 Cuba 2002 10%
5 Dominican republic 2002 33% 2010 30%
6 El Savador 2007 18%
7 Ecuador 1990 12% 2001 30% 2010 30%
8 Haiti 2003 33%
9 Jamaica 1991 6% 2001 12%
10 Mexico 1990 32% 1995 19% 2000 31% 2010 34%
11 Nicaragua 1995 16% 2005 25%
12 Panama 1990 21% 2000 31% 2010 24%
13 Paraguay 1992 27% 2002 20%
14 Peru 1993 18% 2007 34%
15 Saint Lucia 1991 13%
16 Venezuela 1990 15% 2001 16%
II South Asia 1990-1994 26% 1995-1999 38% 2000-2004 36% 2005-2009 38% 2010-2011 n/a
1 India 1993 37% 1999 38% 2004 36% 2009 38%
2 Pakistan 1991 16%
131

Table III.8: Percentage of overeducated graduates by regions, countries and years (continued)
Year and incidence of overeducation among graduates
Region & Country Year % Overedu. Year % Overedu. Year % Overedu. Year % Overedu. Year % Overedu.
III Europe and Central Asia 1990-1994 12% 1995-1999 17% 2000-2004 17% 2005-2009 11% 2010-2011 24%
1 Armenia 2011 30%
2 Belarus 1999 9% 2009 11%
3 kyrgyzstan 1999 25%
4 Romania 1992 4% 2002 7% 2011 17%
5 Turkey 1990 20% 2000 28%
IV East Asia & Pacific 1990-1994 21% 1995-1999 27% 2000-2004 25% 2005-2009 33% 2010-2011 n/a
1 Cambodia 1998 43% 2008 51%
2 China 1990 10% 2000 29%
3 Fiji 1996 11% 2007 16%
4 Indonesia 1990 36% 1995 44% 2005 54%
5 Malaysia 1991 16% 2000 14%
6 Mongolia 2000 17%
7 Philippines 1990 29% 2000 41%
8 Thailand 1990 13% 2000 26%
9 Vietnam 1999 10% 2009 11%
V Middle East & North Africa 1990-1994 13% 1995-1999 24% 2000-2004 18% 2005-2009 19% 2010-2011 29%
1 Egypt 1996 7% 2006 16%
2 Iran 2006 22% 2011 29%
3 Iraq 1997 43%
4 Jordan 2004 7%
5 Morocco 1994 13% 2004 28%
6 Palestine 1997 24% 2007 20%
38 countries (75 observations) 1990-1994 19% 1995-1999 24% 2000-2004 23% 2005-2009 26% 2010-2011 27%
132

Appendix: B
Table III.9: Correspondence between occupational class and educational level
ISCO-08 occupational class ILO skill level ISCED-97 educational level
1. Manager 3 + 4 6, 5a and 5b
2. Professionals 4 6 and 5a
3. Technicians 3 5b
4. Clerks 2 4, 3 and 2
5. Service and sales 2 4, 3 and 2
6. Skilled agricultural 2 4, 3 and 2
7. Craft and related 2 4, 3 and 2
8. Plant and machine operators 2 4, 3 and 2
9. Elementary occupations 1 1
Source: ISCO-08, volume I
Table III.10: Description of educational level required for each skill level
Skill level Educational level Description of educational level
4 6 Second stage of tertiary education (ad-
vanced research qualification)
5a First stage of tertiary education, 1st degree
(medium duration)
3 5b First stage of tertiary education (short or
medium duration)
2 4 Post-secondary, non-tertiary education
3 Upper secondary level of education
2 Lower secondary level of education
1 1 Primary level of education
Source: ISCO-08, volume I
133

”This page is intentionally left blank.”
134
General Conclusion
Our thesis analyzes the impacts of education-job mismatches (overeducation,
horizontal mismatch and their combination) in the context of developing economies.
We answer to three research questions within three chapters. The first two chapters
are analyzed at microeconomics level with a special attention to the case of Cam-
bodia, a country that has just upgraded from low income to lower middle income
status at mid-2016. The last chapter is analyzed at macroeconomics level concerning
thirty-eight developing countries. Results from these three chapters allow us drawing
conclusions and some recommendations.
Chapter 1 examines if mismatches decrease or increase unemployment duration
among graduates in Cambodia.
Based on the job search theory (Jovanovic, 1979), accepting a mismatched job
can decrease unemployment duration. Nevertheless, in the context of a limited job
opportunity, the higher risks of mismatches can be associated with a longer duration
of unemployment, especially among the less competent workers (Thurow, 1976). This
theoretical uncertainty is not resolved either in the empirical literature.
Hence, this chapter is divided in two parts: The first part establishes a theo-
retical model linking educational mismatches and unemployment duration, and the
second part tests the theoretical prediction by using independent-competing risks
regression applied on a survey data from nineteen HEI in Cambodia.
The regression results highlight that the risks of mismatches increase unem-
ployment duration. This evidence is thus consistent with researches that find the
overeducation is associated with a longer period of unemployment in developed coun-
tries (Rose & Ordine, 2010 ; Barros et al., 2011 ; Lin & Hsu, 2013). Yet, we contribute
to these studies on at least two main points: 1- We analyze the case of a developing
country, and 2- we define mismatches from both types (overeducation and horizontal
135

mismatch) and from both dimensions (single and double mismatch).
Based on this finding, it seems that the higher education sector in Cambodia
has been facing two problems: 1- The quality of education is low and 2- the inade-
quacy between supply and demand for graduates in some sectors. These problems can
make several graduates not having the corresponding skills to what required by the
labor market, and consequently they can face higher risks of mismatches and longer
duration of unemployment.
Chapter 2 investigates if educational mismatches decrease graduates’ wages
in Cambodia.
There is a theoretical consensus on negative impacts of mismatches on wages.
For instance, the assignment model (Sattinger, 1993) mentions that working in a
mismatched job would limit the full utilization of worker’s potential skills, and con-
sequently, mismatched workers would earn less than matched workers of the same
education. Nevertheless, the consensus is not reached in the empirical studies, with
less researches in developing countries, and more importantly, the endogeneity of
education-job mismatches in the combination of their two forms is not yet considered.
Thus, to take into account this endogeneity problem, this chapter employs
an ordered Heckman selection model applied on a survey data from eight HEI in
Cambodia.
The regression results confirm that the wage penalties exist and increase with
the level of mismatches. This is consistent with most of previous studies either in
developed or developing countries, especially the study of Robst (2008) who also finds
a much stronger penalty when graduates in United States suffer both vertical and
horizontal mismatches. Yet, we mainly contribute to the literature by: 1- Analyzing
the combination effects of vertical and horizontal mismatches in a country that has
just upgraded to a lower-middle income status, and 2- Taking into account the possible
endogeneity of this combination.
This negative impact highlight that Cambodia should reconsider the expansion
of the higher education system, by finding ways to improve the quality and make the
educational programs answer better to the needs of the labor market.
136

Precisely, several actions are needed to be conducted in Cambodia for all levels.
(i) The possible actions at the individual level can be:
� Encouragement of students towards engineering and medical sciences that
have been facing a lack of graduates. For instance, the government can
provide more scholarships and other incentives to students in these fields.
� Promoting job opportunities for different study fields to better inform the
students and their parents on the career perspectives.
� Improving students’ knowledge since primary schools, especially on the
math, English, computer and Internet knowledge.
� Internship should be compulsory at high schools and universities, so that
students can acquire professional experiences and information in the labor
market, and learn about their potentiality and career preferences.
(ii) At the organizational level, several actions are also needed:
� The government must be vigorous in the accreditation process by strictly
evaluating the quality and objective of training programs provided by an
education institution, if they correspond to what the labor market needs
or not.
� The government should develop a culture of evaluating the performance
of each HEI and disseminate the results. This will push all universities
to compete more in terms of quality, and will also help students in their
decision to select a major and an HEI.
� Lecturers and educational staff should be more trained to improve their
teaching and research capacities.
� The government needs to strongly fight against corruption and builds more
infrastructure, especially in the rural areas. The corruption and the lack
of infrastructure disturb the investment facilities in Cambodia, and as a
result, high skilled jobs are created at a lower rate than their potentiality.
137

Chapter 3 switches the analysis to more international and macroeconomics
level. This chapter aims at examining the impacts of overeducation among graduates
on economic growth in thirty-eight developing countries.
The ”human capital approach” mentions that overeducated graduates are more
productive than their matched counterparts in the same job (Sattinger, 1993), which
is good for economic growth. However, the ”job satisfaction approach” underlines
a possible counterproductive behavior (Tsang & Levin, 1985), which is bad for the
growth outcome. Little empirical researches exist in advanced countries and their
results also diverge.
Thus, this chapter contributes to the literature on two main points. First, we
match two sources of data: 1- The IPUMSI database to estimate the rate of overeduca-
tion and 2- the World Bank database to calculate economic growths. The combination
of these data allows to analyze the effects of overeducation at macroeconomics level
in the context of developing countries. Second, we treat the unobserved heterogeneity
between countries and especially the endogeneity of overeducation by employing the
two-stages least-square regression with country fixed-effects.
The findings indicate that overeducation exerts negative impacts on economic
growth at both short and medium terms. This evidence is thus rather in line with
the ”job satisfaction approach” than the ”human capital approach”.
The negative influence of overeducation on the economic growth stresses the
importance for developing countries to focus more on the quality in education and to
improve the matching efficiency of the skills provided by the higher education sector
and the skills required by employers.
As other researches, this thesis also faces some limits:
(i) Limits related to data
� The data for the first two chapters on the Cambodia’s case are not national
representative: This needs another broader survey at national level.
� Those data are not dynamic, thus it is needed to establish a panel data to
measure the long term effects.
138

� There is no data regarding the informal sector, thus it is needed to develop
a specific study to take into account the trajectory of people having worked
in the informal economy.
� There is no data allowing to determine the overskilling phenomenon. Even
though overeducation and overskilling are correlated, it might be more
interesting to analyze both issues at the same time. Thus, the next survey
should also contain questions that support the estimation of overskilling.
� There is no available data to measure the incidence of horizontal mis-
matches at macroeconomics level in the third chapter, while the effects of
horizontal mismatches could be also important.
(ii) Limits owing to geography
� There is only one country at microeconomics level, thus a strong specificity:
This needs to enlarge the geographical zone, for example, a study regarding
the Asian context.
(iii) Limits concerning methods
� We take into account the selection bias but only for observable variables:
It is possible that there exists unobserved heterogeneity such as individual
preferences, motivation, beliefs and mimetic behaviors. With panel data,
it would be possible to isolate those individual fixed effects.
� We do not consider the regional/local effects. With more precise data on
the location of workers’ residents, it would be possible to employ spatial
econometric to take into account those effects.
These limits indicate that further researches are needed, especially when there
are more available data. Hence, it is recommended that developing countries should
collect more data and make it available for public users. This would allow for more
accurate analysis regarding this education-job matching issue.
139

”This page is intentionally left blank.”
140

References
Abbas, Q. (2008). Over-education and under-education and their effects on earn-
ings: Evidence from Pakistan, 1998–2004. SAARC Journal of Human Resource
Development , 4 , 109–125.
Acemoglu, D. (1999). Changes in unemployment and wage inequality: An alternative
theory and some evidence. American economic review , 89 (5), 1259–1278.
Allen, J., & Van der Velden, R. (2001). Educational mismatches versus skill mis-
matches: Effects on wages, job satisfaction, and on-the-job search. Oxford economic
papers , 53 (3), 434–452.
Altonji, J. G., & Blank, R. M. (1999). Race and gender in the labor market. Handbook
of labor economics , 3 , 3143–3259.
Amador, L., Nicolas, A., & Vila, L. (2008). Education and competence mismatches:
Job satisfaction consequences for workers. XVI Jornadas ASEPUMA–IV Encuentro
International Rect@ Vol Actas 16 Issue 1 , 105 .
Andress, H.-J., Golsch, K., & Schmidt, A. W. (2013). Applied panel data analysis for
economic and social surveys. Springer Science & Business Media.
Artes, J., del Mar Salinas-Jimenez, M., & Salinas-Jimenez, J. (2014). Small fish in
a big pond or big fish in a small pond? The effects of educational mismatch on
subjective well-being. Social indicators research, 119 (2), 771–789.
Asian Development Bank (ADB). (2011). Improving Instructional Quality: Focus on
Faculty Development (Tech. Rep.).
Asian Development Bank (ADB). (2014). Cambodia: Diversifying beyond garments
and tourism. (Tech. Rep.).
141
Asian Development Bank (ADB) and International Labour Organisation (ILO).
(2015). Cambodia: Addressing the skills gap: Employment diagnostic study (Tech.
Rep.).
Athey, T. R., & Hautaluoma, J. E. (1994). Effects of applicant overeducation, job
status, and job gender stereotype on employment decisions. Journal of Social Psy-
chology , 134 (4), 439–452.
Ayres, D. M. (2000). Anatomy of a crisis: Education, development, and the state in
Cambodia, 1953-1998. University of Hawaii Press.
Barone, C., & Ortiz, L. (2011). Overeducation among European university graduates:
A comparative analysis of its incidence and the importance of higher education
differentiation. Higher Education, 61 (3), 325–337.
Barro, R. J. (1990). Government spending in a simple model of endogenous growth.
Journal of political Economy , 98 (5), 103–125.
Barro, R. J., & Lee, J.-W. (2001). International data on educational attainment:
Updates and implications. Oxford Economic Papers , 53 (3), 541–563.
Barro, R. J., & Sala-i Martin, X. (1992). Convergence. Journal of political Economy ,
100 (2), 223–251.
Barros, C. P., Guironnet, J.-P., & Peypoch, N. (2011). How to quickly get a job?
The transition from higher education to French labour market by a survival model.
Applied Economics , 43 (4), 439–448.
Battu, H., Belfield, C. R., & Sloane, P. J. (1999). Overeducation among graduates:
A cohort view. Education economics , 7 (1), 21–38.
Battu, H., & Sloane, P. J. (2004). Over-education and ethnic minorities in Britain.
The Manchester School , 72 (4), 535–559.
Bauer, T. K. (2002). Educational mismatch and wages: A panel analysis. Economics
of Education Review , 21 (3), 221–229.
Becker, G. S. (1964). Human capital: A theoretical and empirical analysis, with special
reference to education.
142

Beduwe, C., & Giret, J.-F. (2011). Mismatch of vocational graduates: What penalty
on French labour market? Journal of vocational behavior , 78 (1), 68–79.
Benhabib, J., & Spiegel, M. M. (2005). Human capital and technology diffusion.
Handbook of economic growth, 1 , 935–966.
Benveniste, L., Marshall, J., & Araujo, M. C. (2008). Teaching in Cambodia (Tech.
Rep.).
Bernal, P., Mittag, N., & Qureshi, J. A. (2016). Estimating effects of school quality
using multiple proxies. Labour Economics , 39 , 1–10.
Blenkinsopp, J., & Scurry, T. (2007). Hey gringo!: The HR challenge of graduates in
non-graduate occupations. Personnel Review , 36 (4), 623–637.
Bracke, P., Pattyn, E., & dem Knesebeck, O. (2013). Overeducation and depressive
symptoms: Diminishing mental health returns to education. Sociology of health &
illness , 35 (8), 1242–1259.
Brehm, W. C. (2016). The structures and agents enabling educational corruption
in Cambodia. In The political economy of schooling in Cambodia (pp. 99–119).
Springer.
Bruni, M., Luch, L., & Kuoch, S. (2013). Skills shortages and skills gaps in the Cam-
bodian labour market: Evidence from employer skills needs survey (Tech. Rep.).
Buchel, F., & Mertens, A. (2004). Overeducation, undereducation, and the theory of
career mobility. Applied Economics , 36 (8), 803–816.
Budrıa, S., & Moro-Egido, A. I. (2008). Education, educational mismatch, and wage
inequality: Evidence for Spain. Economics of Education Review , 27 (3), 332–341.
Capsada-Munsech, Q. (2015). The role of social origin and field of study on graduates
overeducation: The case of Italy. Higher Education, 69 (5), 779–807.
Capsada-Munsech, Q. (2017). Overeducation: Concept, theories, and empirical evi-
dence. Sociology Compass , 11 (10).
143
Carroll, D., & Tani, M. (2013). Over-education of recent higher education graduates:
New Australian panel evidence. Economics of Education Review , 32 , 207–218.
Carroll, D., & Tani, M. (2015). Job search as a determinant of graduate over-
education: Evidence from Australia. Education Economics , 23 (5), 631–644.
Centre for the Development of Vocational Training (Cedefop), E. (2010). The skill
matching challenge: Analysing skill mismatch and policy implications. Office for
Official Publications of the European Communities, Luxembourg.
Chapman, D., & Chien, C.-L. (2014). Higher education in Asia: Expanding out,
expanding up (Tech. Rep.).
Chapman, D. W., & Lindner, S. (2016). Degrees of integrity: The threat of corruption
in higher education. Studies in Higher Education, 41 (2), 247–268.
Charlot, O., & Decreuse, B. (2005). Self-selection in education with matching frictions.
Labour Economics , 12 (2), 251–267.
Chatterji, M. (1998). Tertiary education and economic growth. Regional Studies ,
32 (4), 349–354.
Chen, C.-Y., Sok, P., & Sok, K. (2007). Benchmarking potential factors leading to
education quality: A study of Cambodian higher education. Quality Assurance in
Education, 15 (2), 128–148.
Chevalier, A., & Lindley, J. (2009). Overeducation and the skills of UK graduates.
Journal of the Royal Statistical Society: Series A (Statistics in Society), 172 (2),
307–337.
Chiburis, R., & Lokshin, M. (2007). Maximum likelihood and two-step estimation of
an ordered-probit selection model. The Stata Journal , 7 (2), 167–182.
Chua, K., & Chun, N. (2016). In search of a better match: Qualification mismatches
in developing Asia. ADB Working Papers Series .
Chun, N., Hasan, R., Rahman, M. H., & Ulubasoglu, M. A. (2017). The role of
middle class in economic development: What do cross-country data show? Review
of Development Economics , 21 (2), 404–424.
144
Cohn, E., & Khan, S. P. (1995). The wage effects of overschooling revisited. Labour
Economics , 2 (1), 67–76.
Congregado, E., Iglesias, J., Millan, J. M., & Roman, C. (2016). Incidence, effects,
dynamics and routes out of overqualification in Europe: A comprehensive analysis
distinguishing by employment status. Applied Economics , 48 (5), 411–445.
Croce, G., & Ghignoni, E. (2012). Demand and supply of skilled labour and overedu-
cation in Europe: A country-level analysis. Comparative Economic Studies , 54 (2),
413–439.
Cuesta, M. B. (2005). Youth labour market integration in Spain: Search time, job
duration and skill mismatch. Spanish Economic Review , 7 (3), 191–208.
D’Amico, S. (2010). Higher education and skills for the labor market in Cambodia
(Tech. Rep.). HRINC.
Damodar, N., et al. (2004). Basic econometrics. The Mc-Graw Hill.
Darity, W. J., & Goldsmith, A. H. (1996). Social psychology, unemployment, and
macroeconomics. Journal of Economic Perspectives , 10 (1), 121–140.
Davia, M. A., McGuinness, S., & O’Connell, P. J. (2017). Determinants of regional
differences in rates of overeducation in Europe. Social science research, 63 , 67–80.
Dekker, R., De Grip, A., & Heijke, H. (2002). The effects of training and overedu-
cation on career mobility in a segmented labour market. International Journal of
Manpower , 23 (2), 106–125.
de Oliveira, M. M., Santos, M. C., & Kiker, B. F. (2000). The role of human capital
and technological change in overeducation. Economics of Education Review , 19 (2),
199–206.
Dessus, S. (1999). Human capital and growth: The recovered role of education systems.
The World Bank.
Diem, A. (2015). Overeducation among graduates from universities of applied sci-
ences: Determinants and consequences. Journal of Economic & Financial Studies ,
3 (02), 63–77.
145

Di Gropello, E. (2011). Putting higher education to work: Skills and research for
growth in East Asia. World Bank Publications.
Di Pietro, G. (2002). Technological change, labor markets, and low-skill, low-
technology traps. Technological forecasting and social change, 69 (9), 885–895.
Dolton, P., & Silles, M. A. (2008). The effects of over-education on earnings in the
graduate labour market. Economics of Education Review , 27 (2), 125–139.
Dolton, P., & Vignoles, A. (2000). The incidence and effects of overeducation in the
UK graduate labour market. Economics of Education Review , 19 (2), 179–198.
Domadenik, P., Farcnik, D., & Pastore, F. (2013). Horizontal mismatch in the labour
market of graduates: The role of signalling. IZA Discussion Paper(7527), 1–24.
Dore, R. (1976). The diploma disease. Education, qualification and development.
ERIC.
Dougherty, C. R. (1985). Manpower forecasting and manpower-development planning
in the United Kingdom. Forecasting Skilled Manpower Needs: The Experience of
Eleven Countries. Paris: UNESCO (International Institute for Educational Stud-
ies).
Duncan, G. J., & Hoffman, S. D. (1981). The incidence and wage effects of overedu-
cation. Economics of Education Review , 1 (1), 75–86.
Economic Institue of Cambodia (EIC) and International Labour Organization (ILO).
(2006). Decent Work in the Informal economy in Cambodia: A literature review
(Tech. Rep.).
Economic Intelligent Center (EIC). (2014). Bridging Thailand’s Labor Gap (Tech.
Rep.).
Eltis, W. (2000). The classical theory of economic growth. In The classical theory of
economic growth (pp. 310–338). Springer.
Emerging Markets Consulting (EMC). (2014). Survey of ASEAN employers on skills
and competitiveness (Tech. Rep.).
146
European Commission. (2015). Measuring Skills Mismatch [Report].
Eurostat. (2016). Statistical approaches to the measurement of skills (Tech. Rep.).
Farooq, S. (2011). Mismatch between education and occupation: A case study of
Pakistani graduates. The Pakistan Development Review , 531–552.
Ferreyra, M. M. (2017). At a Crossroads: Higher Education in Latin America
and the Caribbean. Retrieved 2018-04-05, from http://blogs.worldbank.org/
education/crossroads-higher-education-latin-america-and-caribbean
Fields, G. S. (2010). Labor market analysis for developing countries. Working Paper,
Cornell University ILR School(157), 1–17.
Filiztekin, A. (2011). Education-occupation mismatch in Turkish labor market.
MPRA Paper(35123), 1–20.
Fleming, C. M., & Kler, P. (2008). I’m too clever for this job: A bivariate probit
analysis on overeducation and job satisfaction in Australia. Applied Economics ,
40 (9), 1123–1138.
Flisi, S., Goglio, V., Meroni, E. C., Rodrigues, M., & Vera-Toscano, E. (2017). Mea-
suring occupational mismatch: Overeducation and overskill in Europe-Evidence
from PIAAC. Social Indicators Research, 131 (3), 1211–1249.
Foraci, M. (2016). Better education and economic opportunities: Towards a life
well-valued. Retrieved 2018-04-06, from http://www.kh.undp.org/content/
cambodia/en/home/presscenter/articles/2016/07/12/better-education
-and-economic-opportunities-towards-a-life-well-valued0.html
Ford, D. (2015). Cambodian accreditation: An uncertain beginning. International
Higher Education(33), 12–14.
Frank, R. H. (1978). Why women earn less: The theory and estimation of differential
overqualification. The American Economic Review , 68 (3), 360–373.
Freeman, R. (1976). The overeducated American. Academic press.
147

Gal, G., Kaplan, G., Gross, R., & Levav, I. (2008). Status inconsistency and common
mental disorders in the Israel-based world mental health survey. Social psychiatry
and psychiatric epidemiology , 43 (12), 999–1003.
Green, F., & McIntosh, S. (2007). Is there a genuine under-utilization of skills amongst
the over-qualified? Applied Economics , 39 (4), 427–439.
Green, F., & Zhu, Y. (2010). Overqualification, job dissatisfaction, and increasing
dispersion in the returns to graduate education. Oxford Economic Papers , 62 (4),
740–763.
Groot, W., & Van Den Brink, H. M. (2000). Overeducation in the labor market: A
meta-analysis. Economics of Education Review , 19 (2), 149–158.
Guironnet, J.-P., & Jaoul-Grammare, M. (2009). Does over-education influence
French economic growth? Economics Bulletin, 29 (2), 1190–1200.
Gyimah-Brempong, K., Wilson, M., et al. (2005). Human capital and economic
growth: Is Africa different? Journal of African Development , 7 (1), 73–109.
Habibi, N. (2015). Irans overeducation crisis: Causes and ramifications. Waltham,
MA: Brandeis University, Crown Center for Middle Eastern Studies .
Habibi, N. (2017). Higher education policies and overeducation in Turkey. European
Journal of Higher Education, 7 (4), 440–449.
Habibi, N., & El Hamidi, F. (2016). Why are Egyptian youth burning their university
diplomas? The overeducation crisis in Egypt.
Hagedorn, M., & Manovskii, I. (2013). Job selection and wages over the business
cycle. The American Economic Review , 103 (2), 771–803.
Hair, J. F., Black, W. C., Babin, B. J., Anderson, R. E., & Tatham, R. L. (2009).
Multivariate data analysis. Prentice hall Upper Saddle River, NJ.
Hakura, M. D. S., Hussain, M. M., Newiak, M. M., Thakoor, V., & Yang, M. F.
(2016). Inequality, gender gaps and economic growth: Comparative evidence for
Sub-Saharan Africa. International Monetary Fund.
148

Handel, M. J., Valerio, A., & Sanchez Puerta, M. L. (2016). Accounting for mismatch
in low-and middle-income countries. Washington, DC: World Bank.
Hansen, M. N., & Mastekaasa, A. (2006). Social origins and academic performance
at university. European Sociological Review , 22 (3), 277–291.
Hanushek, E. A. (2013). Economic growth in developing countries: The role of human
capital. Economics of Education Review , 37 , 204–212.
Hanushek, E. A., & Woessmann, L. (2012). Schooling, educational achievement, and
the Latin American growth puzzle. Journal of Development Economics , 99 (2),
497–512.
Hanushek, E. A., & Woßmann, L. (2007). The role of education quality for economic
growth. The World Bank.
Hartog, J. (2000). Over-education and earnings: Where are we, where should we go?
Economics of Education Review , 19 (2), 131–147.
Hartog, J., & Oosterbeek, H. (1988). Education, allocation and earnings in the
Netherlands: Overschooling? Economics of Education Review , 7 (2), 185–194.
Heckman, J. J. (1979). Sample selection bias as a specification error. Economet-
rica(47), 153–161.
Herrera-Idarraga, P., Lopez-Bazo, E., & Motellon, E. (2015). Double penalty in re-
turns to education: Informality and educational mismatch in the Colombian labour
market. Journal of Development Studies , 51 (12), 1683–1701.
Hjalmarsson, R., Holmlund, H., & Lindquist, M. J. (2015). The effect of education
on criminal convictions and incarceration: Causal evidence from micro-data. The
Economic Journal , 125 (587), 1290–1326.
Holland, D., Liadze, I., Rienzo, C., & Wilkinson, D. (2013). The relationship between
graduates and economic growth across countries. BIS research paper , 110 .
Holmes, C. (2013). Has the expansion of higher education led to greater economic
growth? National Institute Economic Review , 224 (1), R29–R47.
149
Hu, Y. (2013). Oversupply of college graduates? Structural mismatch! Retrieved
2018-04-05, from https://piie.com/blogs/china-economic-watch/oversupply
-college-graduates-structural-mismatch
International Labour Office. (2016). Key Indicators of the Labour Market Ninth
edition (Report). International Labour Organization.
International Labour Office, Department of Statistics. (1984). Employment planning
(Report). International Labour Organization.
International Labour Office, Department of Statistics. (2014). Skill mismatch in
Europe: Statistics brief (Report). International Labour Organization.
Ismail, N. W., & Mahyideen, J. M. (2015). The impact of infrastructure on trade and
economic growth in selected economies in Asia. ADB Working Papers Series .
Jayachandran, S. (2015). The roots of gender inequality in developing countries.
Economics , 7 (1), 63–88.
Jovanovic, B. (1979). Job matching and the theory of turnover. Journal of political
economy , 87 (5, Part 1), 972–990.
Kampelmann, S., & Rycx, F. (2012). The impact of educational mismatch on firm
productivity: Evidence from linked panel data. Economics of Education Review ,
31 (6), 918–931.
Keese, M., & Tan, J. P. (2013). Indicators of skills for employment and productivity:
A conceptual framework and approach for low income countries. A report for the
Human Resource development pillar of the G20 multi action plan on development.
OCDE.
Kiker, B. F., Santos, M. C., & De Oliveira, M. M. (1997). Overeducation and
undereducation: Evidence for Portugal. Economics of Education Review , 16 (2),
111–125.
Kornhauser, A. (1965). Mental health of the industrial worker: A Detroit study.
Korpi, T., & Tahlin, M. (2009). Educational mismatch, wages, and wage growth:
Overeducation in Sweden, 1974–2000. Labour Economics , 16 (2), 183–193.
150
Kupets, O. (2015). Skill mismatch and overeducation in transition economies. IZA
World of Labor(224).
Kwok, K.-W., Chan, S., Heng, C., Kim, S., Neth, B., Thon, V., . . . Nhem, S. (2010).
Scoping study: Research capacities of Cambodia’s universities (Tech. Rep.).
Lee, M. N. (2003). The academic profession in Malaysia and Singapore: Between
bureaucratic and corporate cultures. In The decline of the guru (pp. 135–165).
Springer.
Leuven, E., Oosterbeek, H., et al. (2011). Overeducation and mismatch in the labor
market. Handbook of the Economics of Education, 4 , 283–326.
Lim, H.-E. (2011). The determinants of individual unemployment duration: The case
of Malaysian graduates. 2nd International Conference on Business and Economic
Research, 2620–2639.
Lim, H.-E. (2013). Overeducation and happiness in the Malaysian graduate labour
market. International Journal of Business and Society , 14 (1), 93.
Lin, Y.-L., & Hsu, C.-J. (2013). The effects of over-education on unemployment du-
ration: Evidence from Taiwan. Journal of Emerging Issues in Economics, Finance
and Banking , 1 (5), 430–443.
Lindley, J., & McIntosh, S. (2009). A panel data analysis of the incidence and impact
of over-education. Sheffield Economic Research Paper Series(2008009), 1–40.
Link, B. G., Lennon, M. C., & Dohrenwend, B. P. (1993). Socioeconomic status
and depression: The role of occupations involving direction, control, and planning.
American Journal of Sociology , 98 (6), 1351–1387.
Loayza, N. V. (2016). Informality in the process of development and growth. The
World Economy , 39 (12), 1856–1916.
Lucas, R. (1988). On the mechanics of economic development. Journal of Monetary
Economics , 22 , 3–42.
Madhur, S. (2014a). Cambodia’s skill gap: An anatomy of issues and policy options.
CDRI Working Paper Series(98), 1–37.
151

Madhur, S. (2014b). Cambodia tomorrow: Development research priorities for a
middle income country. CDRI Working Paper Series(01), 1–12.
Mahy, B., Rycx, F., & Vermeylen, G. (2015). Educational mismatch and firm pro-
ductivity: Do skills, technology and uncertainty matter? De Economist , 163 (2),
233–262.
Mak, N. (2005). A current update of higher education in Southeast Asian countries:
The case of Cambodia. In Regional Seminar on Higher Education in Southeast
Asian Countries: A Current Update.
Maltarich, M. A., Reilly, G., & Nyberg, A. J. (2011). Objective and subjective
overqualification: Distinctions, relationships, and a place for each in the literature.
Industrial and Organizational Psychology , 4 (2), 236–239.
McCormick, B. (1990). A theory of signalling during job search, employment effi-
ciency, and stigmatised jobs. The Review of Economic Studies , 57 (2), 299–313.
McGoldrick, K., & Robst, J. (1996). Gender differences in overeducation: A test
of the theory of differential overqualification. American Economic Review , 86 (2),
280–284.
McGuinness, S. (2006). Overeducation in the labour market. Journal of Economic
Surveys , 20 (3), 387–418.
McGuinness, S. (2008). How biased are the estimated wage impacts of overeducation?
A propensity score matching approach. Applied Economics Letters , 15 (2), 145–149.
McGuinness, S., McGinnity, F., & O’Connell, P. J. (2009). Changing returns to
education during a boom? The case of Ireland. Labour , 23 , 197–221.
McGuinness, S., & Pouliakas, K. (2017). Deconstructing Theories of Overeducation
in Europe: A wage decomposition approach. In Skill mismatch in labor markets
(pp. 81–127). Emerald Publishing Limited.
McGuinness, S., Pouliakas, K., & Redmond, P. (2017). How useful is the concept of
skills mismatch? (Tech. Rep.).
152

McGuinness, S., & Sloane, P. J. (2011). Labour market mismatch among UK grad-
uates: An analysis using REFLEX data. Economics of Education Review , 30 (1),
130–145.
Mehta, A., Felipe, J., Quising, P., & Camingue, S. (2011). Overeducation in devel-
oping economies: How can we test for it, and what does it mean? Economics of
Education Review , 30 (6), 1334–1347.
Meliciani, V., & Radicchia, D. (2016). Informal networks, spatial mobility and overe-
ducation in the Italian labour market. The Annals of Regional Science, 56 (2),
513–535.
Mincer, J. (1974). Schooling, experience, and earnings (human behavior and social
institutions no. 2). ERIC.
Mincer, J. (1991). Education and unemployment (Tech. Rep.). National bureau of
economic research.
Ministry of Commerce (MoC) and the United Nations Development Pro-
gramme (UNDP) in Cambodia. (2014). Cambodia’s diagnostic trade integration
strategy and trade swap roadmap 2014-2018 (Tech. Rep.).
Montenegro, C. E., & Patrinos, H. A. (2014). Comparable estimates of returns to
schooling around the world (Tech. Rep.).
Montt, G. (2015). The causes and consequences of field-of-study mismatch (Tech.
Rep.).
Morano, C. P. (2014). The determinants of overeducation: Evidence from the Italian
labour market. Investigaciones de Economıa de la Educacion, 9 , 681–698.
National Institute of Statistics (NIS) of Cambodia. (2012). Cambodia Labour Force
and Child Labour Survey (Tech. Rep.).
Nelson, R. R., & Phelps, E. S. (1966). Investment in humans, technological diffusion,
and economic growth. The American economic review , 56 (1/2), 69–75.
Ng, Y. C. (2001). Overeducation and undereducation and their effect on earnings:
Evidence from Hong Kong, 1986–1996. Pacific Economic Review , 6 (3), 401–418.
153

Noorbakhsh, F., Paloni, A., & Youssef, A. (2001). Human capital and FDI inflows to
developing countries: New empirical evidence. World development , 29 (9), 1593–
1610.
Nordin, M., Persson, I., & Rooth, D.-O. (2010). Education–occupation mismatch: Is
there an income penalty? Economics of Education Review , 29 (6), 1047–1059.
OECD. (n.d.). Unemployment rates by education level. https://data.oecd.org/
unemp/unemployment-rates-by-education-level.htm. (Accessed 29.01.18)
Ogisu, T., & Williams, J. H. (2016). The backstory of education in Cambodia. In
The political economy of schooling in Cambodia (pp. 15–34). Springer.
Organisation for Economic Co-operation and Development (OECD). (2014). Educa-
tion at a glance 2014: OECD indicators (Tech. Rep.).
Ortiz, L., & Kucel, A. (2008). Do fields of study matter for over-education? The cases
of Spain and Germany. International Journal of Comparative Sociology , 49 (4-5),
305–327.
Paul, J.-J. (2011). The employability of bachelor’s graduates from the universities of
Phnom Penh (Tech. Rep.).
Peiro, J. M., Agut, S., & Grau, R. (2010). The relationship between overeducation
and job satisfaction among young Spanish workers: The role of salary, contract of
employment, and work experience. Journal of Applied Social Psychology , 40 (3),
666–689.
Peou, C. (2017). On Cambodian higher education and skills mismatch: Young
people choosing university majors in a context of risk and uncertainty. Journal of
Education and Work , 30 (1), 26–38.
Pholphirul, P. (2017). Educational mismatches and labor market outcomes: Evidence
from both vertical and horizontal mismatches in Thailand. Education+ Training ,
59 (5), 534–546.
Pissarides, C. A. (1992). Loss of skill during unemployment and the persistence of
employment shocks. The Quarterly Journal of Economics , 1371–1391.
154

Pissarides, C. A. (1994). Search unemployment with on-the-job search. The Review
of Economic Studies , 61 (3), 457–475.
Pissarides, C. A. (2000). Equilibrium unemployment theory, chapter 1. MIT press.
Pollmann-Schult, M., & Buchel, F. (2005). Unemployment benefits, unemployment
duration and subsequent job quality evidence from West Germany. Acta Sociolog-
ica, 48 (1), 21–39.
Pouliakas, K., et al. (2012). The skill mismatch challenge in Europe. Employment
and social developments in Europe, 351–394.
Pritchett, L. (2006). Does learning to add up add up? The returns to schooling in
aggregate data. Handbook of the Economics of Education, 1 , 635–695.
Quinn, M. A., & Rubb, S. (2006). Mexico’s labor market: The importance of
education-occupation matching on wages and productivity in developing countries.
Economics of Education Review , 25 (2), 147–156.
Quintini, G. (2011a). Over-qualified or under-skilled: A review of existing literature
(Tech. Rep. No. 121).
Quintini, G. (2011b). Right for the job: Over-qualified or under-skilled? (Tech. Rep.
No. 120).
Ra, S., Chin, B., & Liu, A. (2015). Challenges and opportunities for skills development
in Asia: Changing supply, demand, and mismatches (Tech. Rep.).
Ramos, R., Surinach, J., & Artıs, M. (2012). Regional economic growth and human
capital: The role of over-education. Regional Studies , 46 (10), 1389–1400.
Rany, S., Zain, A. N. M., & Jamil, H. (2012). Cambodia’s higher education develop-
ment in historical perspectives (1863-2012). International Journal of Learning and
Development , 2 (2), 224–241.
Reis, M. C. (2017). Educational mismatch and labor earnings in Brazil. International
Journal of Manpower , 38 (2), 180–197.
155

Restrepo, P. (2015). Skill mismatch and structural unemployment. Massachusetts
Institute of Technology Job Market Paper , 1–94.
Robst, J. (1995a). Career mobility, job match, and overeducation. Eastern economic
journal , 21 (4), 539–550.
Robst, J. (1995b). College quality and overeducation. Economics of Education
Review , 14 (3), 221–228.
Robst, J. (2007a). Education and job match: The relatedness of college major and
work. Economics of Education Review , 26 (4), 397–407.
Robst, J. (2007b). Education, college major, and job match: Gender differences in
reasons for mismatch. Education Economics , 15 (2), 159–175.
Robst, J. (2008). Overeducation and college major: Expanding the definition of
mismatch between schooling and jobs. The Manchester School , 76 (4), 349–368.
Romer, P. (1990). Human capital and growth: Theory and evidence. NBER Working
Paper(3173).
Rose, G., & Ordine, P. (2010). Overeducation and unemployment spells duration.
Procedia-Social and Behavioral Sciences , 9 , 427–438.
Ross, C. E., & Mirowsky, J. (2006). Sex differences in the effect of education on
depression: Resource multiplication or resource substitution? Social science and
medicine, 63 (5), 1400–1413.
Ross, C. E., & Wu, C.-l. (1995). The links between education and health. American
sociological review , 719–745.
Rubb, S. (2003). Overeducation in the labor market: A comment and re-analysis of
a meta-analysis. Economics of Education Review , 22 (6), 621–629.
Rumberger, R. W. (1981). The rising incidence of overeducation in the US labor
market. Economics of Education Review , 1 (3), 293–314.
Sala, G., et al. (2011). Approaches to skills mismatch in the labour market: A
literature review. Papers: revista de sociologia, 96 (4), 1025–1045.
156

Salama, A. E. (2012). Addressing the Challenges of the Education/Skills and Jobs
Mismatch. Retrieved 2018-04-05, from http://www.un.org/en/ecosoc/julyhls/
pdf12/un presentation-dr amr salama.pdf
Sam, V. (2014). Free flow of skilled labor in ASEAN: A risk for Cambodian graduates?
(Tech. Rep.).
Sanchez-Sanchez, N., & McGuinness, S. (2015). Decomposing the impacts of overedu-
cation and overskilling on earnings and job satisfaction: An analysis using REFLEX
data. Education Economics , 23 (4), 419–432.
Sattinger, M. (1993). Assignment models of the distribution of earnings. Journal of
economic literature, 31 (2), 831–880.
Sattinger, M., et al. (2012). Qualitative mismatches. Foundations and Trends in
Microeconomics , 8 (1–2), 1–168.
Schumpeter, J. A. (2010 [1942]). Capitalism, socialism and democracy. Routledge.
Sicherman, N. (1991). Overeducation in the labor market. Journal of labor Economics ,
101–122.
Sicherman, N., & Galor, O. (1990). A theory of career mobility. Journal of political
economy , 169–192.
Skott, P., & Auerbach, P. (2005). Wage inequality and skill asymmetries. Interactions
in analytical political economy: theory, policy and applications, Armonk, New York .
Sloane, P. J. (2003). Much ado about nothing? What does the overeducation litera-
ture really tell us? Overeducation in Europe, 11–45.
Sloane, P. J. (2014). Overeducation, skill mismatches, and labor market outcomes
for college graduates. IZA World of Labor .
Sloane, P. J., Battu, H., & Seaman, P. T. (1999). Overeducation, undereducation
and the British labour market. Applied Economics , 31 (11), 1437–1453.
Slonimczyk, F. (2009). Skill mismatch and wage inequality in the US. University of
Massachusetts Amherst.
157

Somers, M., Cabus, S., Groot, W., & Maassen van den Brink, H. (2018). Horizon-
tal Mismatch between Employment and the Field of Education: Evidence from a
Systematic Literature Review. Journal of Economic Surveys .
Sparreboom, T., & Staneva, A. (2014). Is education the solution to decent work for
youth in developing economies. Work4Youth Publication Series , 23 .
Spence, M. (1973). Job market signaling. Quarterly Journal of Economics , 88 ,
355–374.
Staiger, D. O., & Stock, J. H. (1994). Instrumental variables regression with weak
instruments. National Bureau of Economic Research Cambridge, Mass., USA.
Stock, J. H., Wright, J. H., & Yogo, M. (2002). A survey of weak instruments
and weak identification in generalized method of moments. Journal of Business &
Economic Statistics , 20 (4), 518–529.
Tandon, P., & Fukao, T. (2015). Educating the next generation: Improving teacher
quality in Cambodia. World Bank Publications.
Tansel, A., & Tai, H. M. (2010). Hazard analysis of unemployment duration by gender
in a developing country: The case of Turkey. Labour , 24 (4), 501–530.
Tao, H.-L., & Hung, C.-Y. (2014). Vertical and horizontal educational mismatches of
female graduates in Taiwan. Asian Economic Journal , 28 (2), 181–199.
Tarvid, A. (2012). Effects of the field of higher education on the prevalence of
over-education in European countries. Education: Evaluation, Reform and Policy ,
167–184.
Teulings, C. N., & Gautier, P. A. (2004). The right man for the job. The Review of
Economic Studies , 71 (2), 553–580.
The Boston Consulting Group (BCG) and Deutsche Investitions Entwicklungsge-
sellschaft (DEG). (2016). Bridging the skills gaps in developing countries (Tech.
Rep.). National Bureau of Economic Research.
Thurow, L. C. (1976). Generating inequality. Macmillan London.
158

Torche, F. (2011). Is a college degree still the great equalizer? Intergenerational mo-
bility across levels of schooling in the United States. American Journal of Sociology ,
117 (3), 763–807.
Tsai, Y. (2010). Returns to overeducation: A longitudinal analysis of the US labor
market. Economics of Education Review , 29 (4), 606–617.
Tsang, M. C. (1987). The impact of underutilization of education on productivity:
A case study of the US bell companies. Economics of Education Review , 6 (3),
239–254.
Tsang, M. C., & Levin, H. M. (1985). The economics of overeducation. Economics
of Education Review , 4 (2), 93–104.
Tzannatos, Z., Diwan, I., Ahad, J. A., et al. (2016). Rates of return to education
in twenty two Arab countries: An update and comparison between MENA and the
rest of the World. Cairo: ERF. Working Paper(1007).
Un, L. (2015). Cambodian Higher Education Vision 2030. http://www.ehef.asia/
images/Cambodia/presentations/Dr Un Leang MoEYS.pdf.
Verdugo, R. R., & Verdugo, N. T. (1989). The impact of surplus schooling on earnings:
Some additional findings. Journal of Human Resources , 629–643.
Verhaest, D., & Omey, E. (2006). The impact of overeducation and its measurement.
Social Indicators Research, 77 (3), 419–448.
Verhaest, D., & Schatteman, T. (2010). Overeducation in the early career: An
analysis using sequence techniques.
Verhaest, D., & Van der Velden, R. (2012). Cross-country differences in graduate
overeducation. European Sociological Review , 29 (3), 642–653.
Verhofstadt, E., Omey, E., et al. (2003). The impact of education on job satisfaction
in the first job. Faculteit Economie En Bedrijfskunde Working Paper .
Vessman, L., & Hanushek, E. (2007). The role of education quality in economic
growth (part I). Educational Studies(2), 86–116.
159

Wald, S. (2005). The impact of overqualification on job search. International Journal
of Manpower , 26 (2), 140–156.
Wei, S.-J., & Zhang, X. (2011). Sex ratios, entrepreneurship, and economic growth in
the people’s republic of China (Tech. Rep.). National Bureau of Economic Research.
Witte, J. C., & Kalleberg, A. L. (1995). Matching training and jobs: The fit between
vocational education and employment in the German labour market. European
Sociological Review , 11 (3), 293–317.
Wolbers, M. H. (2003). Job mismatches and their labour-market effects among school-
leavers in Europe. European Sociological Review , 19 (3), 249–266.
Wolff, E. (2000). Productivity convergence and education: Evidence from OECD
countries. September, Draft, http://professormurmann. net/nelsonfest/wolffp.
doc(Eriflim Tarihi: 11.02. 2007).
Wooldridge, J. M. (2012). Introductory econometrics: A modern approach. 5.ed.
Nelson Education.
World Bank. (2012). Matching aspirations: Skills for implementing Cambodia’s growth
strategy (Tech. Rep. No. 67349-KH).
World Bank website. (n.d.). Population, total. http://data.worldbank.org/
indicator/SP.POP.TOTL?locations=KH. (Accessed 12.02.16)
World Economic Forum. (2015). The Human Capital Report 2015 (Tech. Rep.).
Zakariya, Z., & Battu, H. (2013). The effects of overeducation on multiple job
satisfaction towards enhancing individuals’ well-being in Malaysia. Business and
Management Quarterly Review , 4 , 38–51.
160
Related Documents