Impacts of climate Impacts of climate change on Australian change on Australian marine life marine life Dr Martina Doblin, Senior Research Fellow University of Technology Sydney A presentation prepared for the NSW A presentation prepared for the NSW Department of Education and Department of Education and Training, August 2009 Training, August 2009

Impacts of climate change on Australian marine life Dr Martina Doblin, Senior Research Fellow University of Technology Sydney A presentation prepared for.
Jan 01, 2016
Welcome message from author
This document is posted to help you gain knowledge. Please leave a comment to let me know what you think about it! Share it to your friends and learn new things together.
Transcript
Impacts of climate change on Impacts of climate change on Australian marine lifeAustralian marine life
Dr Martina Doblin, Senior Research FellowUniversity of Technology Sydney
A presentation prepared for the NSW Department of A presentation prepared for the NSW Department of Education and Training, August 2009 Education and Training, August 2009
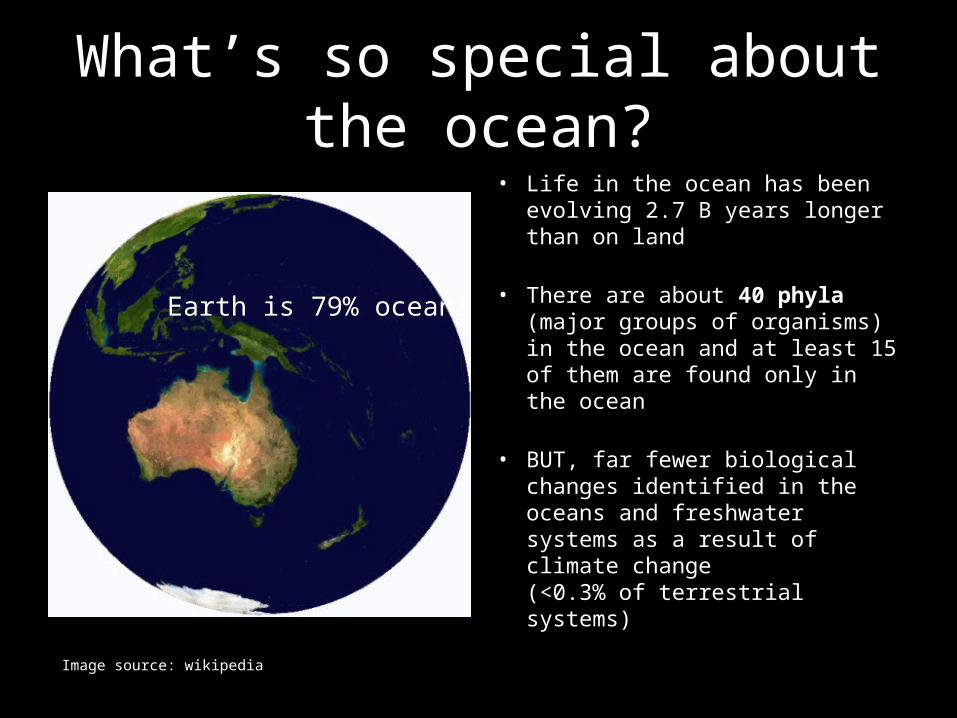
What’s so special about the ocean?What’s so special about the ocean?• Life in the ocean has been Life in the ocean has been
evolving 2.7 B years longer than evolving 2.7 B years longer than on landon land
• There are about There are about 40 phyla40 phyla (major (major groups of organisms) in the ocean groups of organisms) in the ocean and at least 15 of them are found and at least 15 of them are found only in the ocean only in the ocean
• BUT, far fewer biological changes BUT, far fewer biological changes identified in the oceans and identified in the oceans and freshwater systems as a result of freshwater systems as a result of climate change climate change (<0.3% of terrestrial systems)(<0.3% of terrestrial systems)
Image source: wikipedia
Earth is 79% ocean!
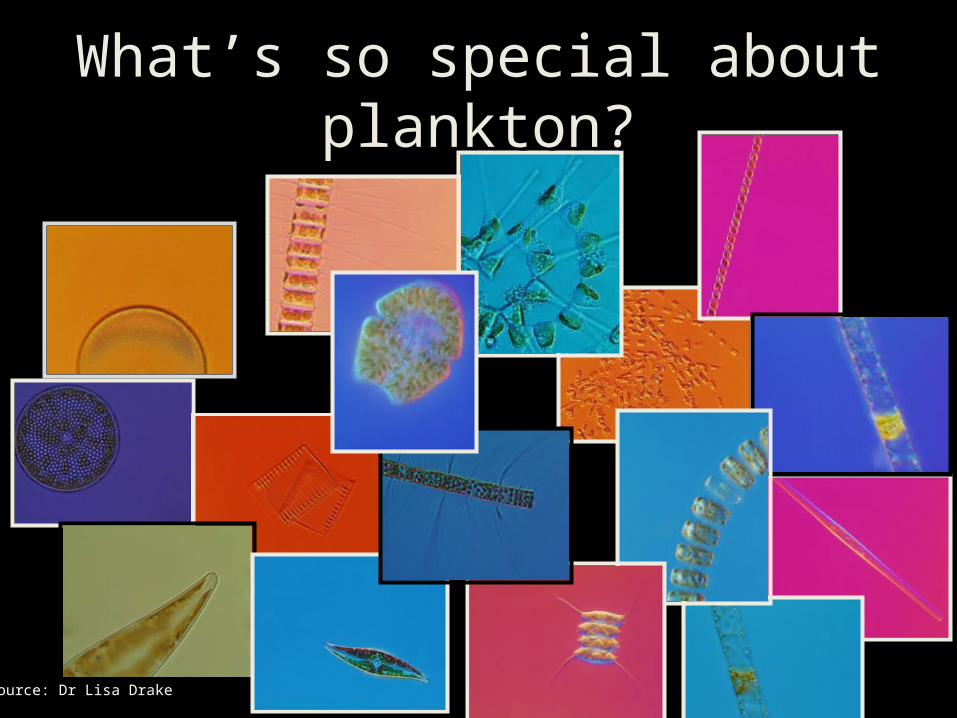
What’s so special about plankton?What’s so special about plankton?
Source: Dr Lisa Drake
ASPAB 2007, Warrnambool
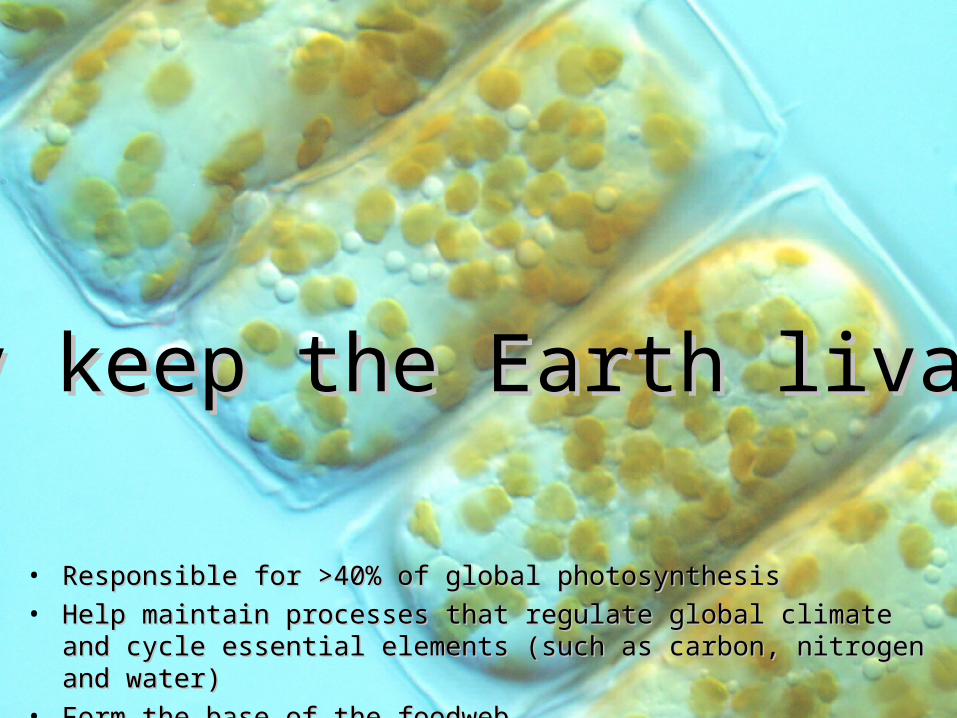
• Responsible for >40% of global photosynthesisResponsible for >40% of global photosynthesis• Help maintain processes that regulate global climate and cycle essential Help maintain processes that regulate global climate and cycle essential
elements (such as carbon, nitrogen and water) elements (such as carbon, nitrogen and water) • Form the base of the foodwebForm the base of the foodweb
They keep the Earth livable!They keep the Earth livable!
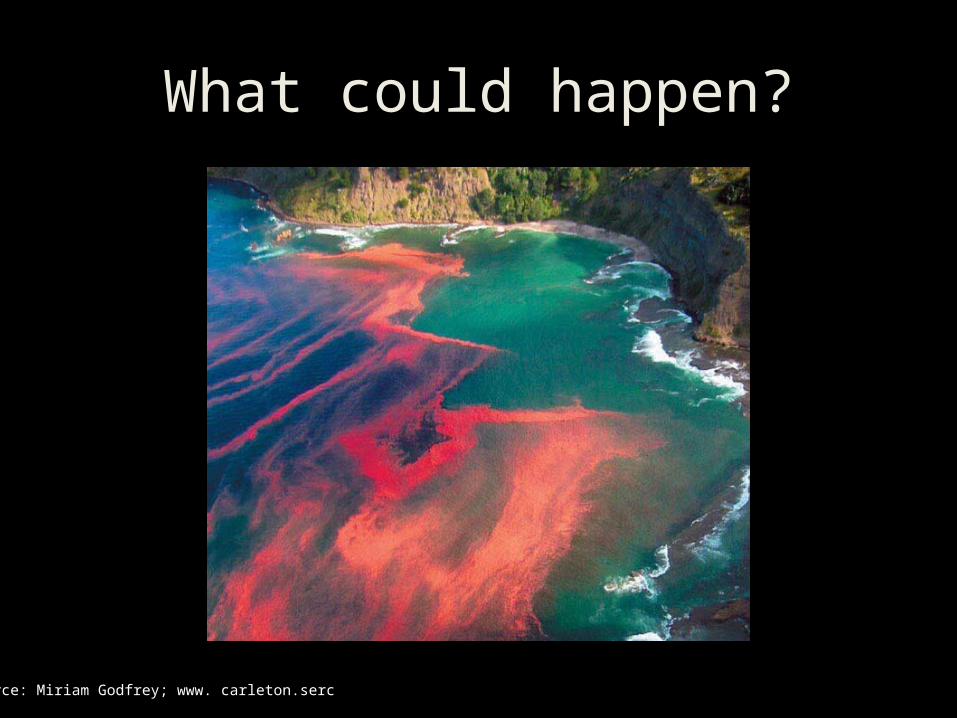
What could happen?
Photo: Miriam GodfreySource: Miriam Godfrey; www. carleton.serc
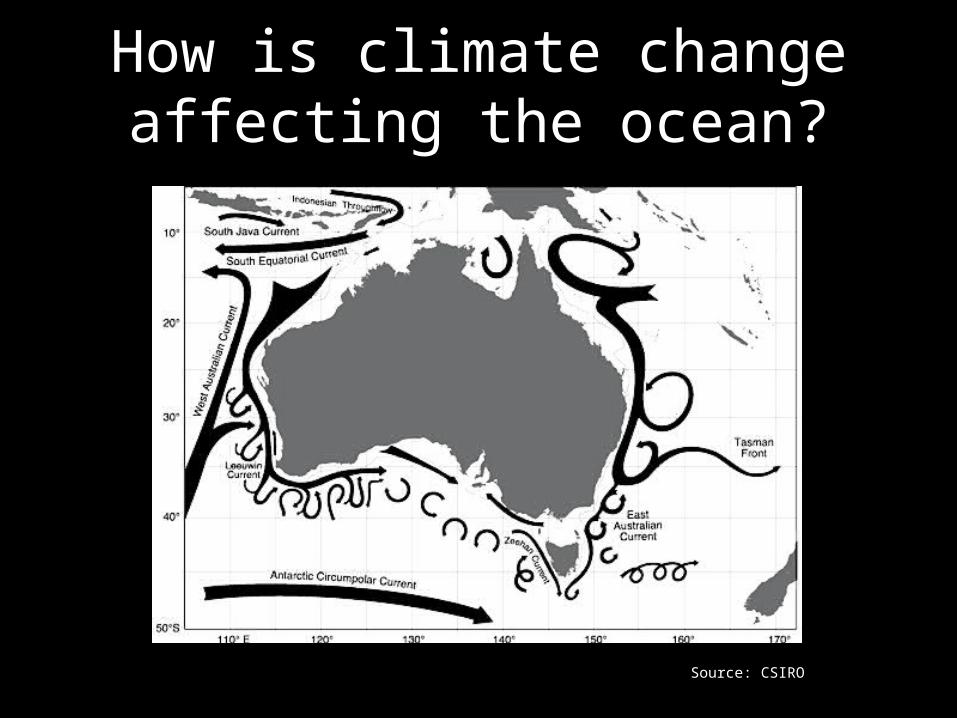
How is climate change affecting How is climate change affecting the ocean?the ocean?
Source: CSIRO
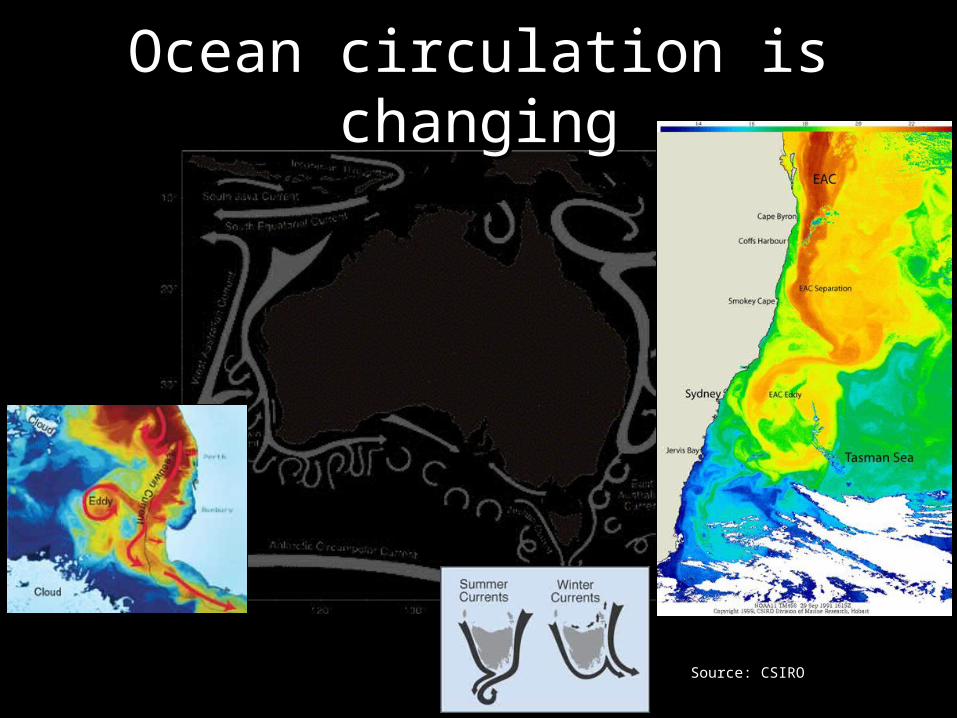
Ocean circulation is changingOcean circulation is changing
Source: CSIRO
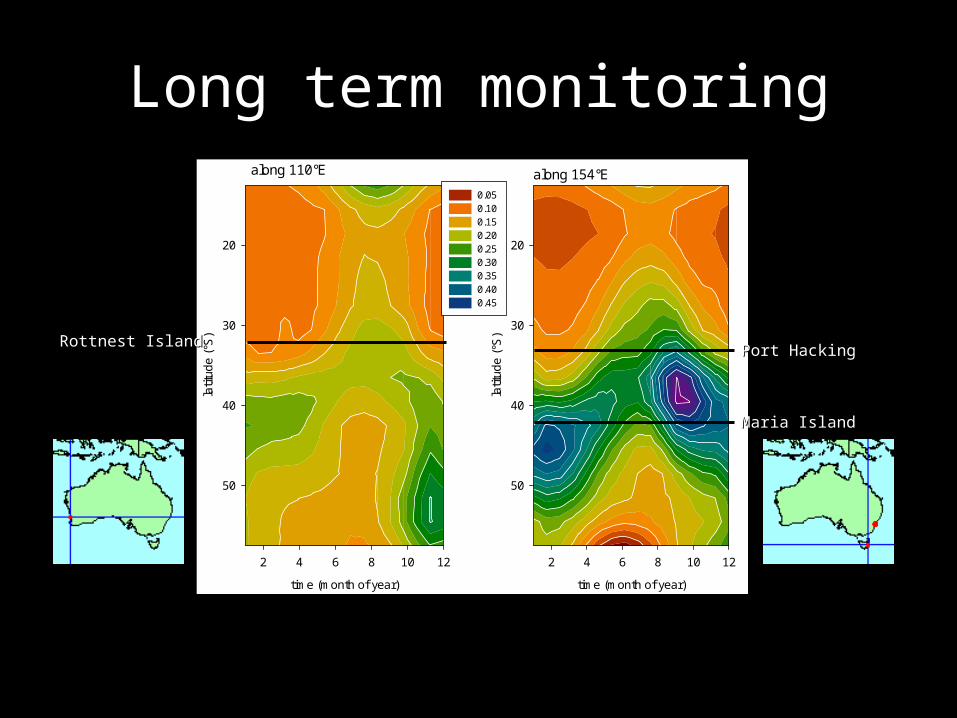
Long term monitoringLong term monitoringalong 110°E
time (month of year)
2 4 6 8 10 12
latit
ud
e (
°S)
20
30
40
50
0.05 0.10 0.15 0.20 0.25 0.30 0.35 0.40 0.45
along 154°E
time (month of year)
2 4 6 8 10 12
latit
ud
e (
°S)
20
30
40
50
Rottnest IslandRottnest IslandPort HackingPort Hacking
Maria IslandMaria Island
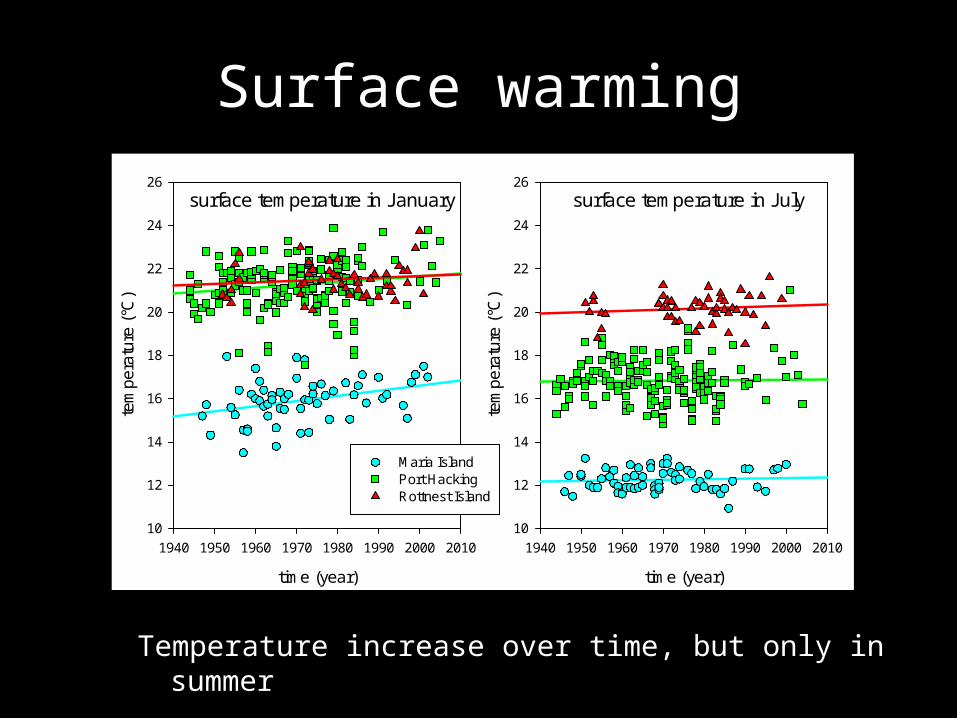
Surface warmingSurface warming
Temperature increase over time, but only in summerTemperature increase over time, but only in summer
surface temperature in January
time (year)
1940 1950 1960 1970 1980 1990 2000 2010
tem
pe
ratu
re (
°C)
10
12
14
16
18
20
22
24
26
Maria IslandPort HackingRottnest Island
surface temperature in July
time (year)
1940 1950 1960 1970 1980 1990 2000 2010
tem
pe
ratu
re (
°C)
10
12
14
16
18
20
22
24
26
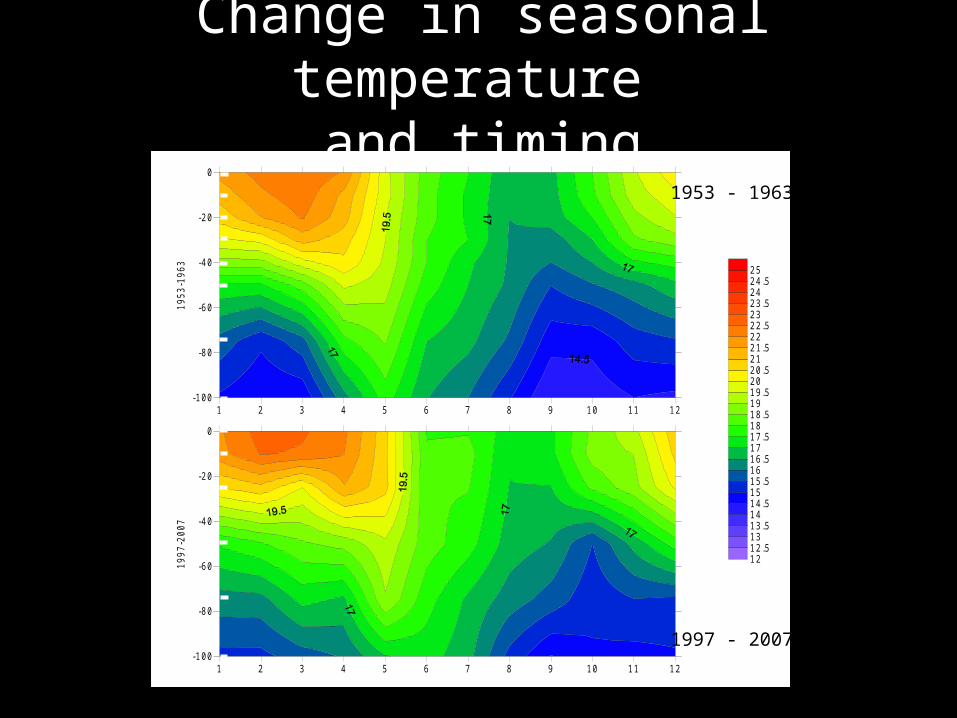
Change in seasonal temperature Change in seasonal temperature and timingand timing
1 2 3 4 5 6 7 8 9 10 11 12-100
-80
-60
-40
-20
01
95
3-1
963
1212.51313.51414.51515.51616.51717.51818.51919.52020.52121.52222.52323.52424.525
1 2 3 4 5 6 7 8 9 10 11 12-100
-80
-60
-40
-20
0
1997
-20
07
1953 - 1963
1997 - 2007
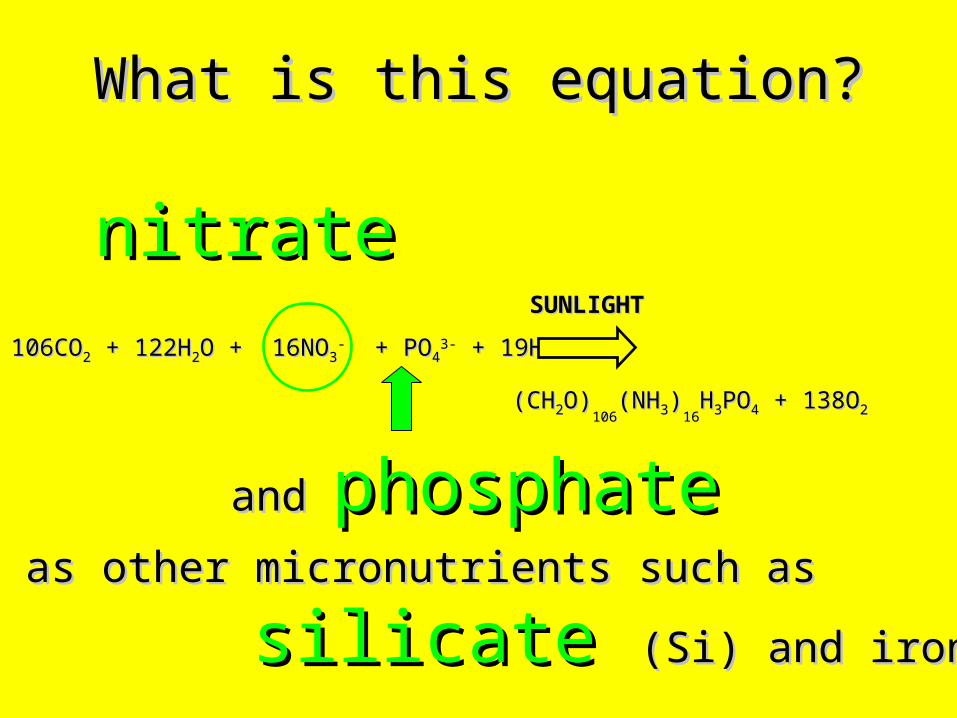
What is this equation?What is this equation?
106CO106CO22 + 122H + 122H22O + 16NOO + 16NO33-- + PO + PO44
3-3- + 19H + 19H++
as well as other micronutrients such asas well as other micronutrients such as
silicate silicate (Si) and iron (Fe)(Si) and iron (Fe)
and and phosphatephosphate
nitratenitrate
(CH(CH22O)O)106106
(NH(NH33))1616HH33POPO44 + 138O + 138O22
SUNLIGHTSUNLIGHT
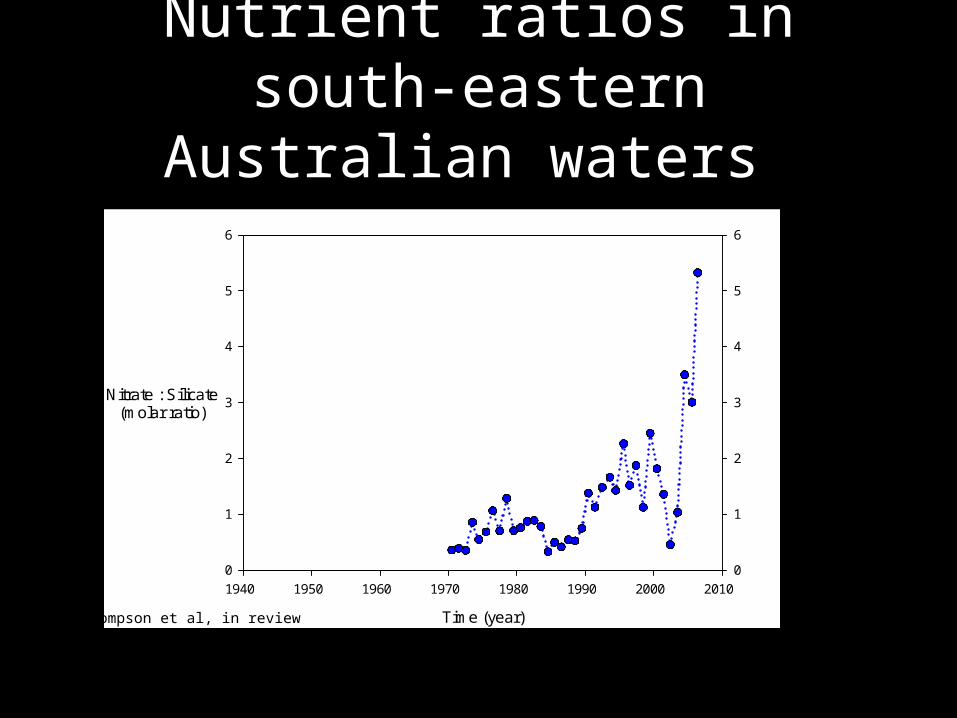
Time (year)
1940 1950 1960 1970 1980 1990 2000 2010
Nitrate : Silicate(molar ratio)
0
1
2
3
4
5
6
0
1
2
3
4
5
6
Nutrient ratios in south-eastern Nutrient ratios in south-eastern Australian waters Australian waters
Thompson et al, in review
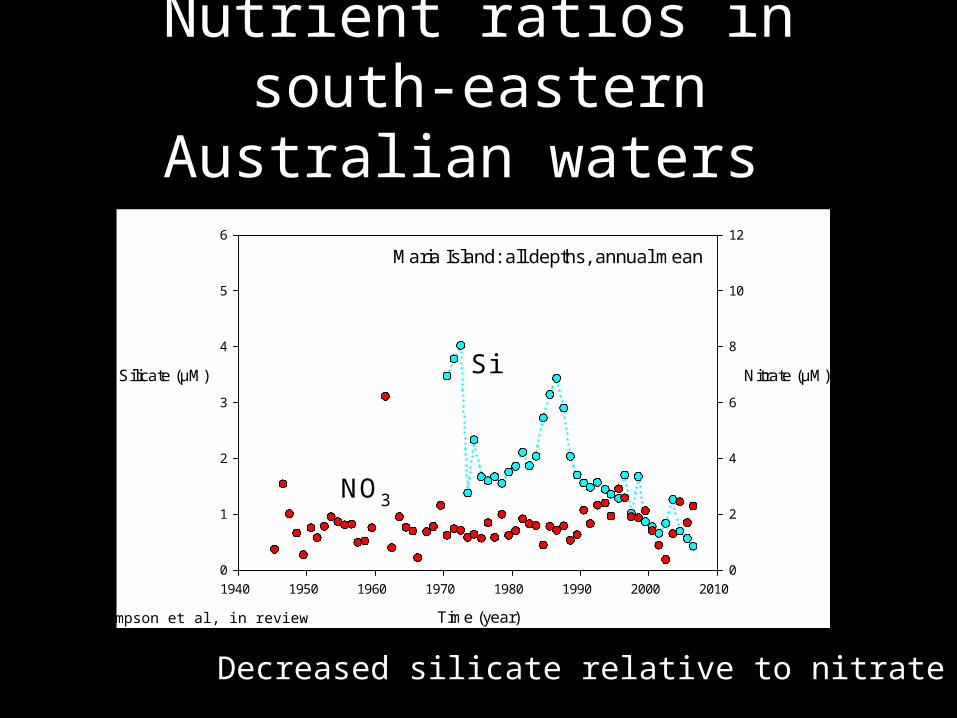
Maria Island: all depths, annual mean
Time (year)
1940 1950 1960 1970 1980 1990 2000 2010
Silicate (µM)
0
1
2
3
4
5
6
Nitrate (µM)
0
2
4
6
8
10
12
Si
NO3
Nutrient ratios in south-eastern Nutrient ratios in south-eastern Australian waters Australian waters
Decreased silicate relative to nitrateDecreased silicate relative to nitrate
Thompson et al, in review
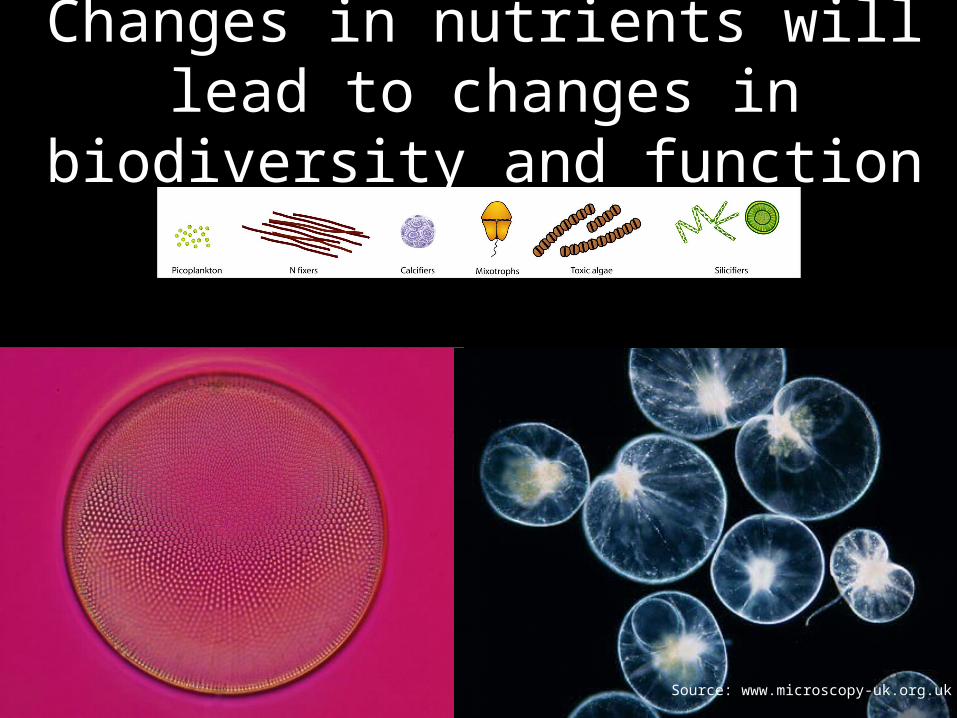
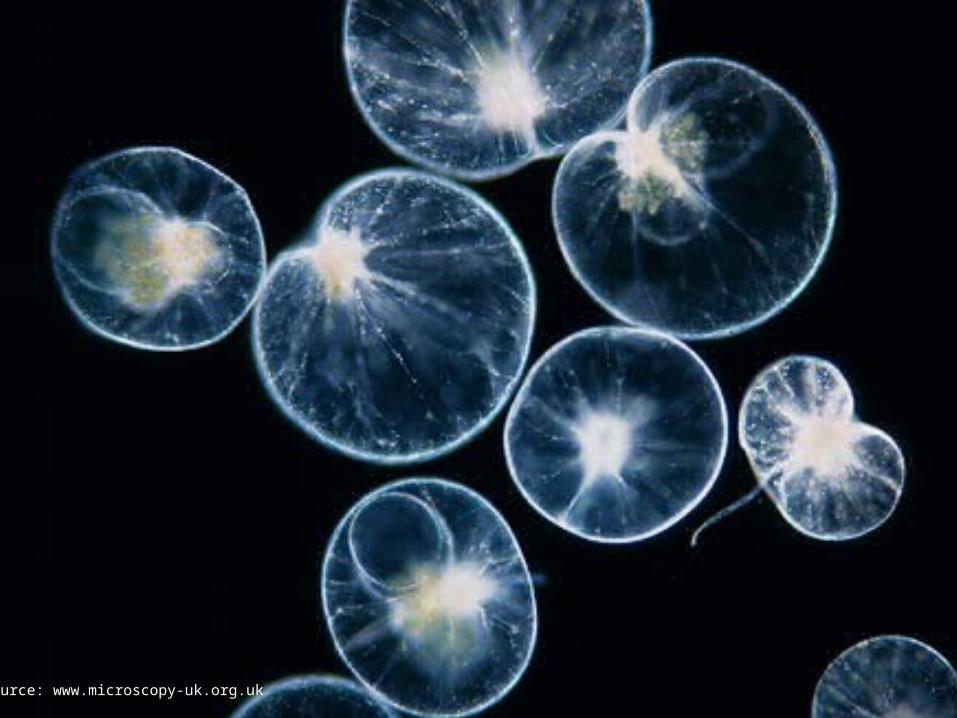
Changes in nutrients will lead to Changes in nutrients will lead to changes in biodiversity and functionchanges in biodiversity and function
Source: www.microscopy-uk.org.uk
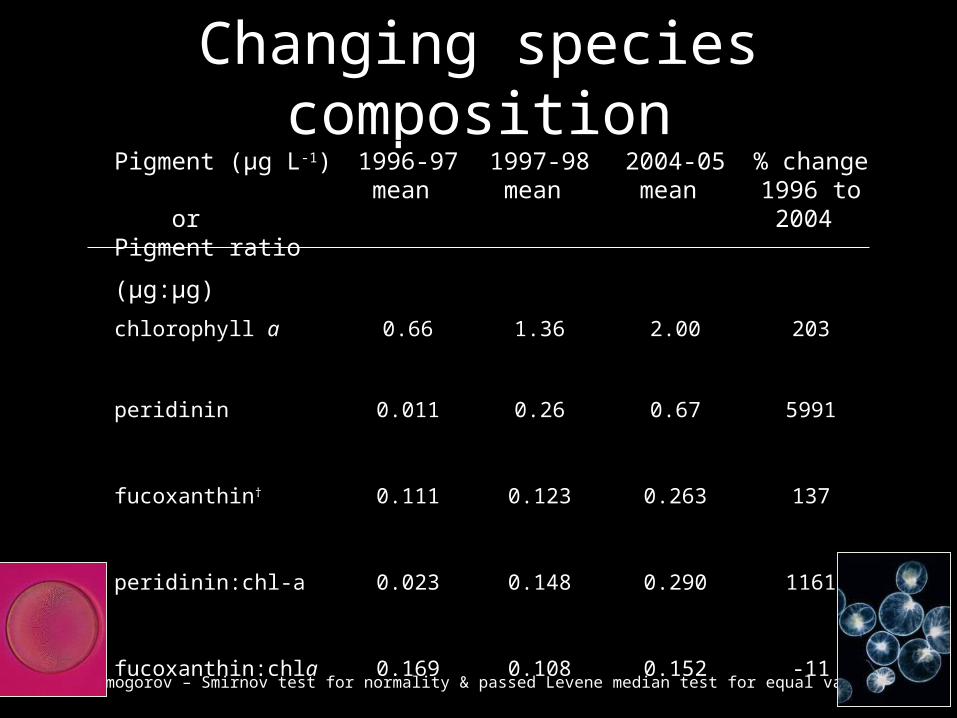
Changing species compositionChanging species compositionPigment (µg LPigment (µg L-1-1) ) or or Pigment ratio Pigment ratio
(µg:µg)(µg:µg)
1996-97 1996-97 meanmean
1997-98 1997-98 meanmean
2004-05 2004-05 meanmean
% % change change 1996 to 1996 to 20042004
chlorophyll chlorophyll aa 0.660.66 1.361.36 2.002.00 203203
peridininperidinin 0.0110.011 0.260.26 0.670.67 59915991
fucoxanthinfucoxanthin†† 0.1110.111 0.1230.123 0.2630.263 137137
peridinin:chl-aperidinin:chl-a 0.0230.023 0.1480.148 0.2900.290 11611161
fucoxanthin:chlfucoxanthin:chlaa 0.1690.169 0.1080.108 0.1520.152 -11-11
† failed Kolmogorov – Smirnov test for normality & passed Levene median test for equal variance.
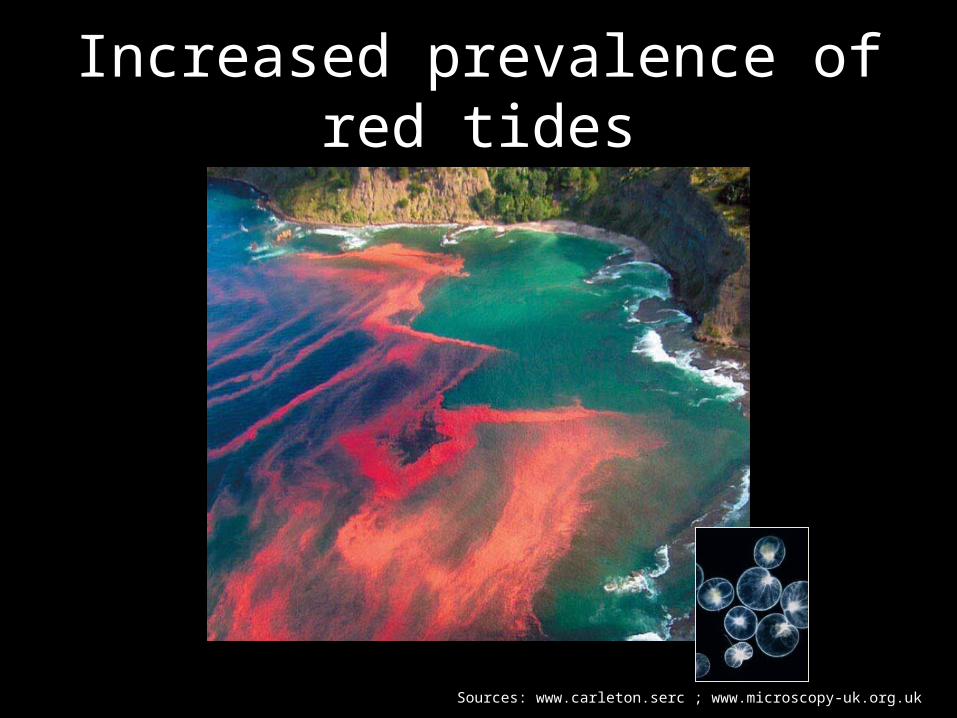
Increased prevalence of red tidesIncreased prevalence of red tides
Sources: www.carleton.serc ; www.microscopy-uk.org.uk
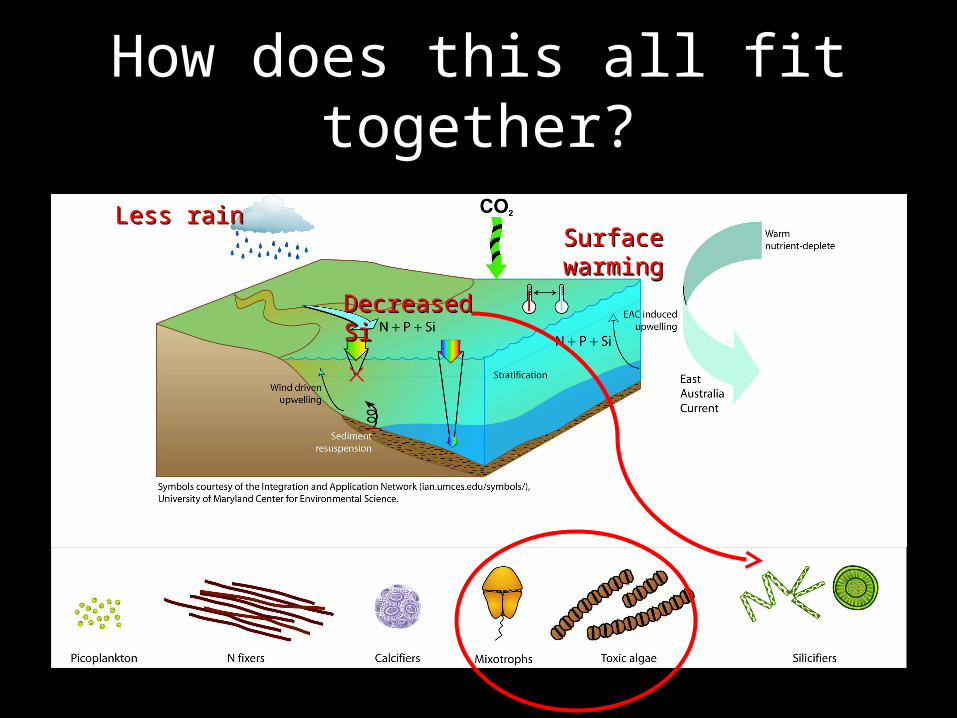
How does this all fit together?How does this all fit together?
Less rainLess rain
Decreased SiDecreased Si
SurfaceSurfacewarmingwarming
SummarySummary
• Evidence of:Evidence of: - surface warming - surface warming - extended autumn season - extended autumn season - altered nutrient ratios in south-eastern Australia - altered nutrient ratios in south-eastern Australia
(decreased availability of Si)(decreased availability of Si) - changes in abundance and species composition of - changes in abundance and species composition of phytoplankton phytoplankton
• Functioning of the ocean will change Functioning of the ocean will change with many cascading effectswith many cascading effects
including those on surfers, swimmers, seafood eatersincluding those on surfers, swimmers, seafood eaters
Basically, this will impact you!
Thanks
- Peter Ralph, University of Technology, Sydney- Tim Ingleton, NSW Dept. of Environment and Climate Change- David Kuo, University of Technology, Sydney research intern - Tim Pritchard, NSW Dept. of Environment and Climate Change- Monitoring teams
ASPAB 2007, WarrnamboolSource: www.microscopy-uk.org.uk
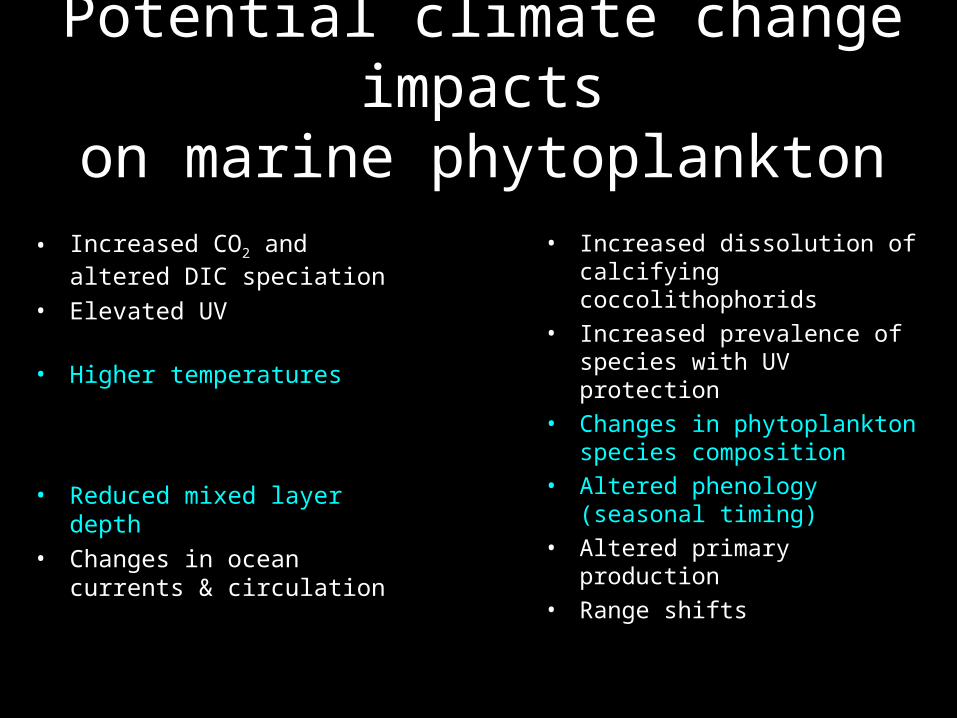
Potential climate change impactsPotential climate change impactson marine phytoplanktonon marine phytoplankton
• Increased COIncreased CO22 and altered DIC and altered DIC speciationspeciation
• Elevated UVElevated UV
• Higher temperaturesHigher temperatures
• Reduced mixed layer depthReduced mixed layer depth• Changes in ocean currents & Changes in ocean currents &
circulationcirculation
• Increased dissolution of calcifying Increased dissolution of calcifying coccolithophoridscoccolithophorids
• Increased prevalence of species Increased prevalence of species with UV protectionwith UV protection
• Changes in phytoplankton species Changes in phytoplankton species compositioncomposition
• Altered phenology (seasonal Altered phenology (seasonal timing)timing)
• Altered primary productionAltered primary production• Range shiftsRange shifts
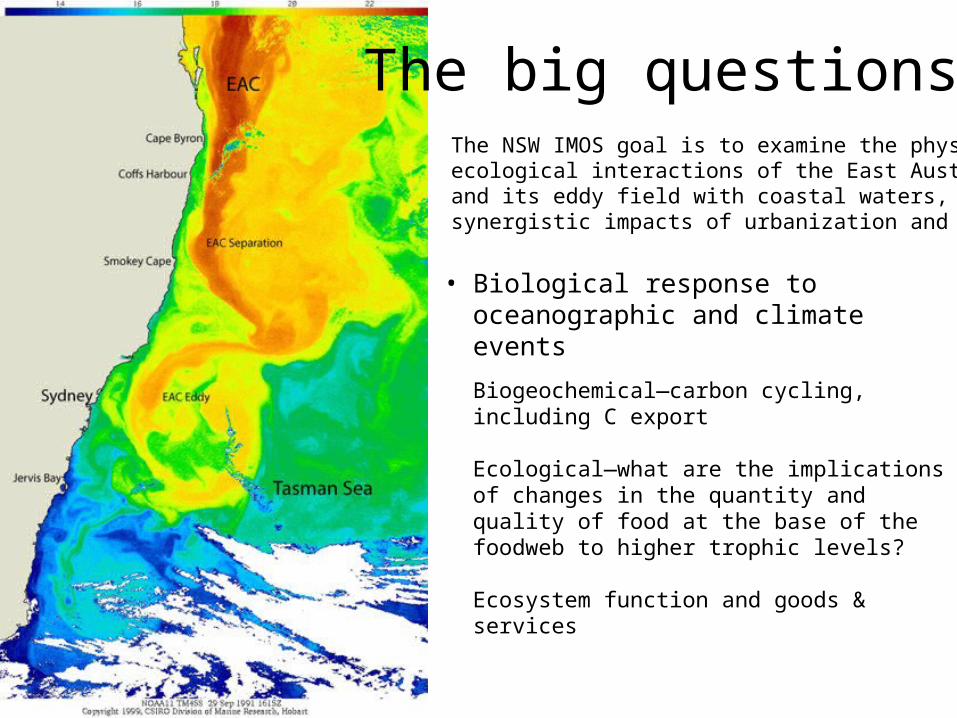
The big questions
• Biological response to oceanographic and climate events
Biogeochemical—carbon cycling, including C export
Ecological—what are the implications of changes in the quantity and quality of food at the base of the foodweb to higher trophic levels?
Ecosystem function and goods & services
The NSW IMOS goal is to examine the physical and ecological interactions of the East Australian Current and its eddy field with coastal waters, to assess the synergistic impacts of urbanization and climate change.
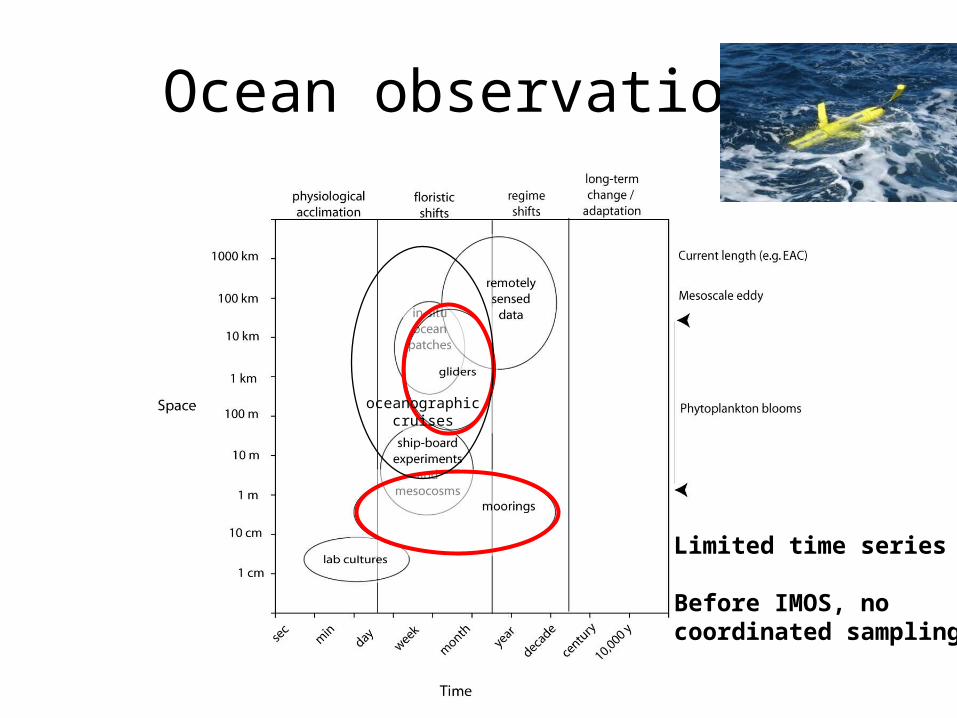
Ocean observations
oceanographiccruises
Limited time series
Before IMOS, no coordinated sampling
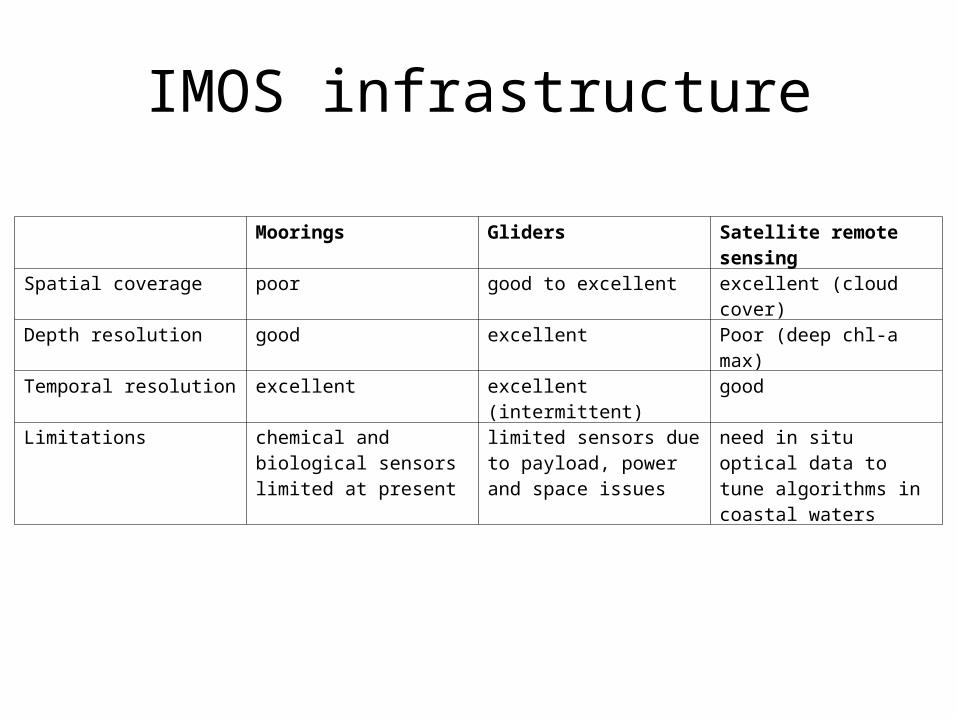
IMOS infrastructure
Moorings Gliders Satellite remote sensing Spatial coverage poor good to excellent excellent (cloud cover)Depth resolution good excellent Poor (deep chl-a max)Temporal resolution excellent excellent (intermittent) goodLimitations chemical and biological
sensors limited at presentlimited sensors due to payload, power and space issues
need in situ optical data to tune algorithms in coastal waters
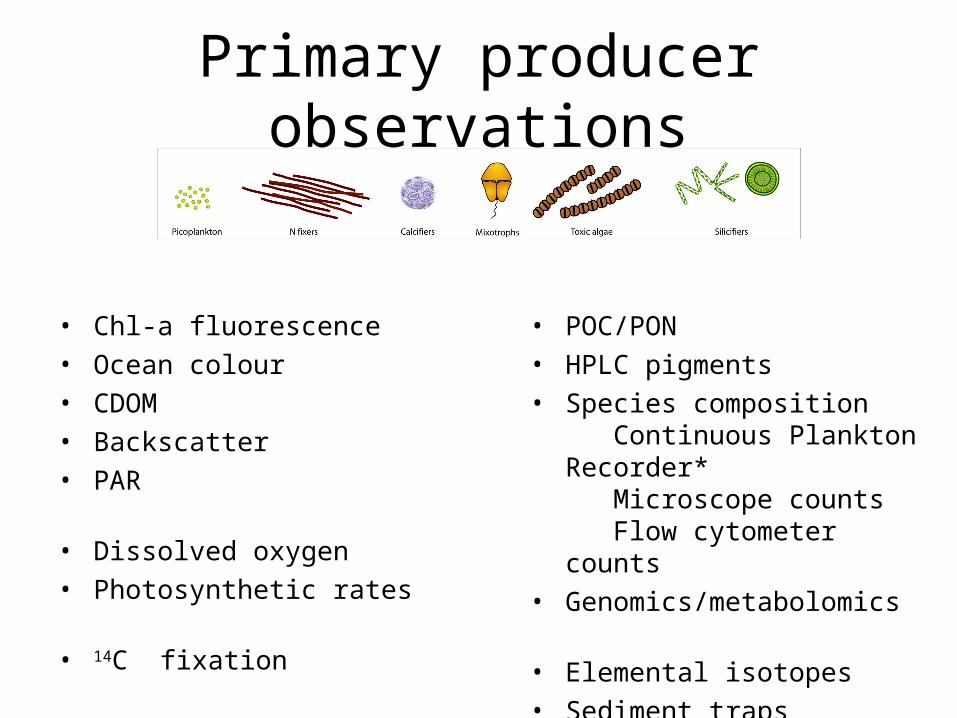
Primary producer observations
• Chl-a fluorescence• Ocean colour• CDOM• Backscatter• PAR
• Dissolved oxygen• Photosynthetic rates
• 14C fixation
• POC/PON• HPLC pigments• Species composition
Continuous Plankton Recorder* Microscope counts Flow cytometer counts
• Genomics/metabolomics
• Elemental isotopes • Sediment traps
In vivo fluorescence
• Fluorescence estimates chlorophyll-a without pigment extraction (Lorenzen 1966)—highly sensitive and used over a wide range of spatial and temporal scales to be a universal indicator of phytoplankton biomass
• Fluorescence yield is variable and dependent on light, cellular nutrient status, temperature, confounded by CDOMcan introduce significant errors
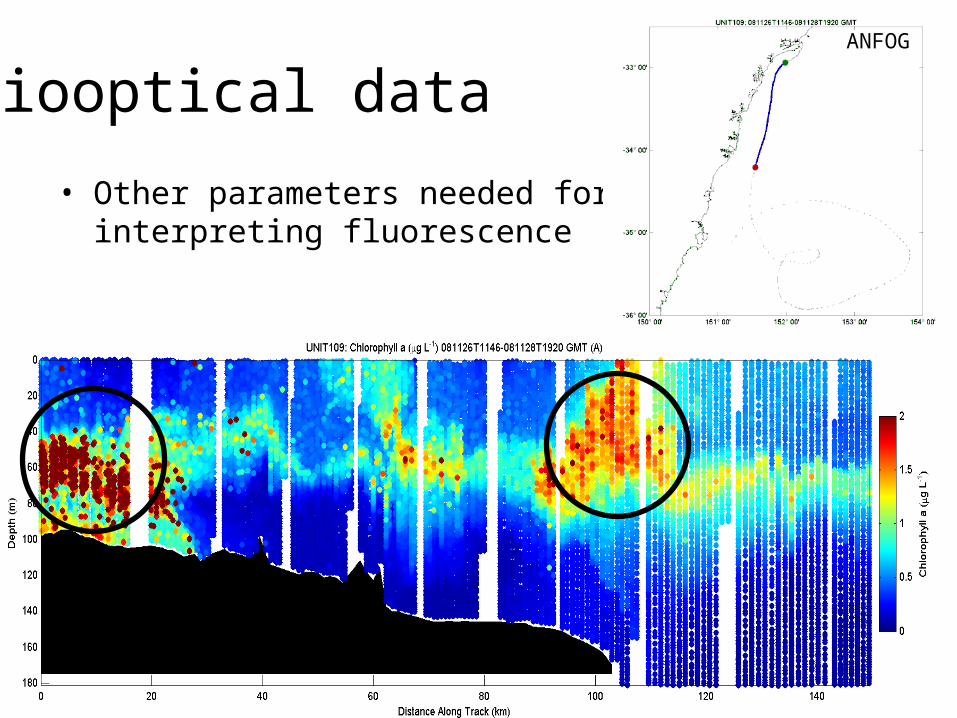
• Other parameters needed forinterpreting fluorescence
Biooptical dataANFOG
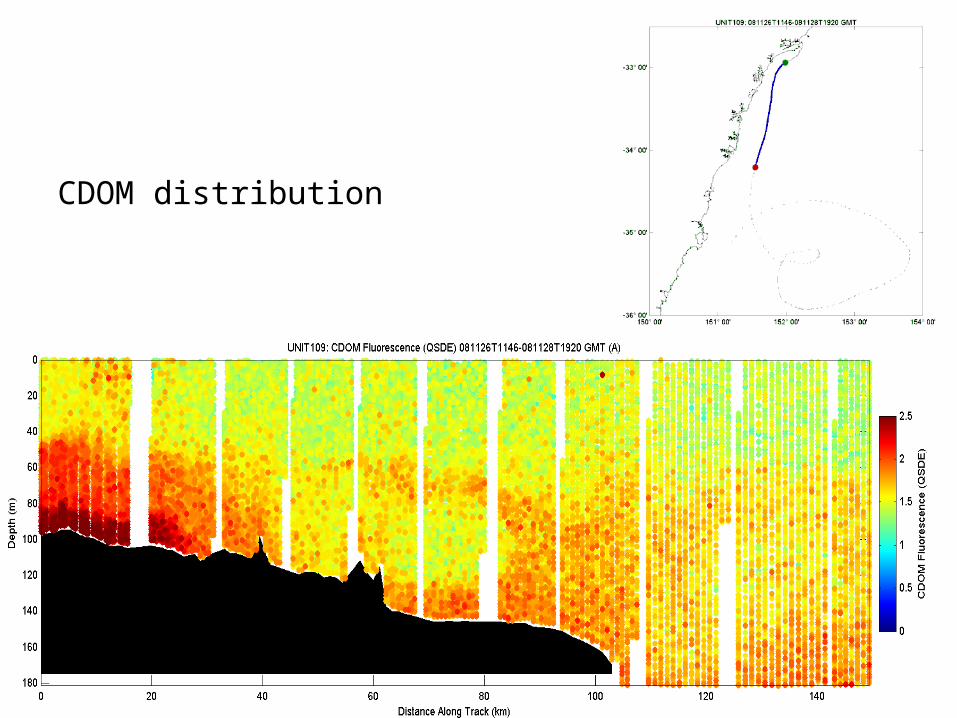
CDOM distribution
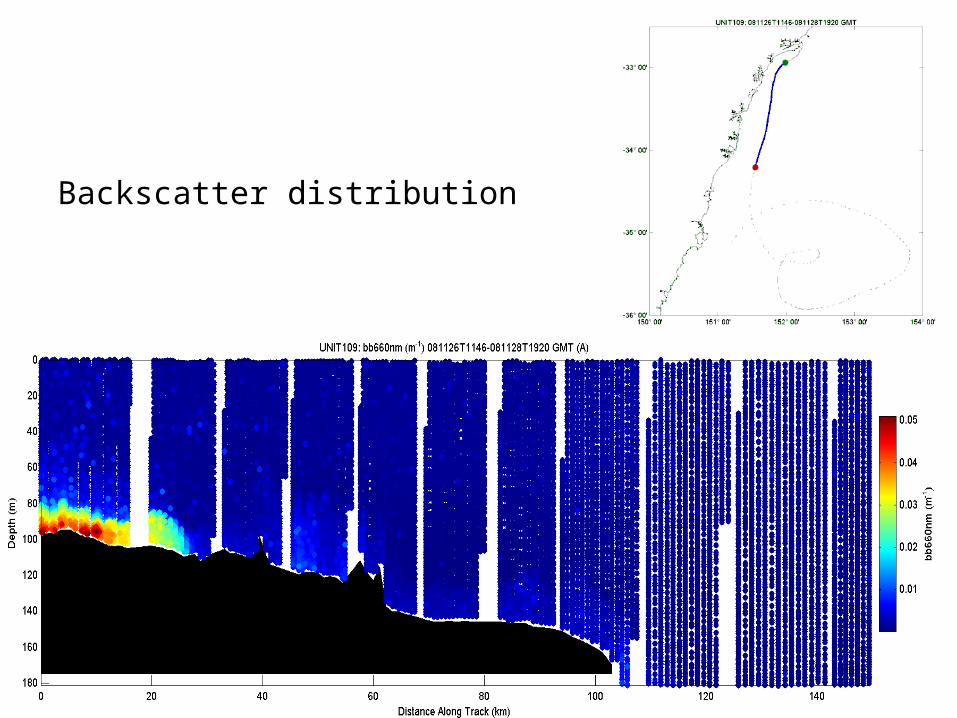
Backscatter distribution
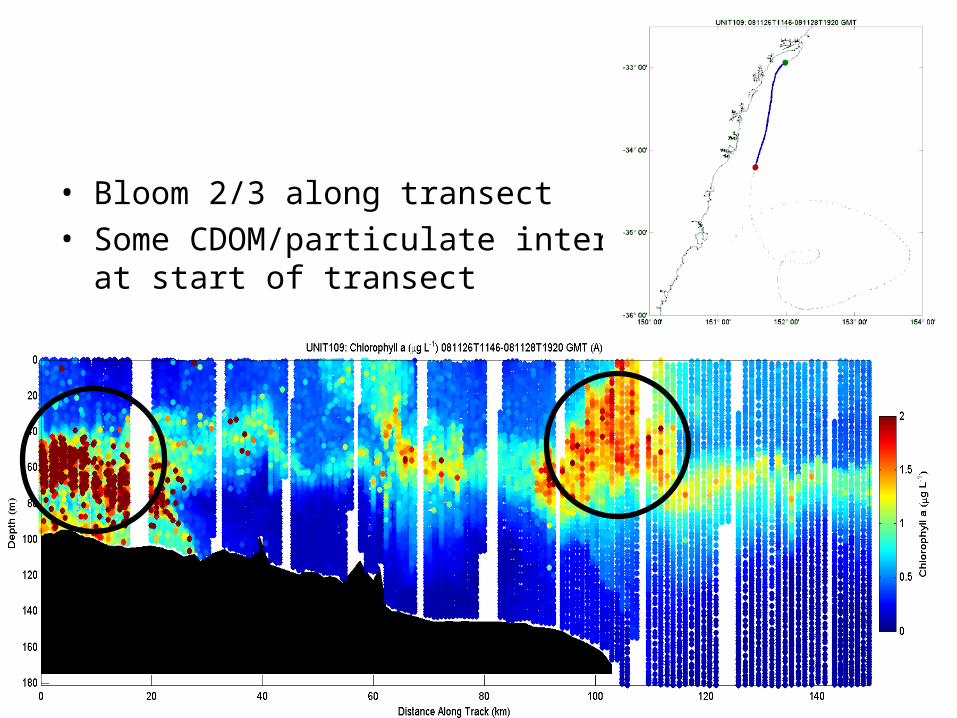
• Bloom 2/3 along transect• Some CDOM/particulate interference
at start of transect
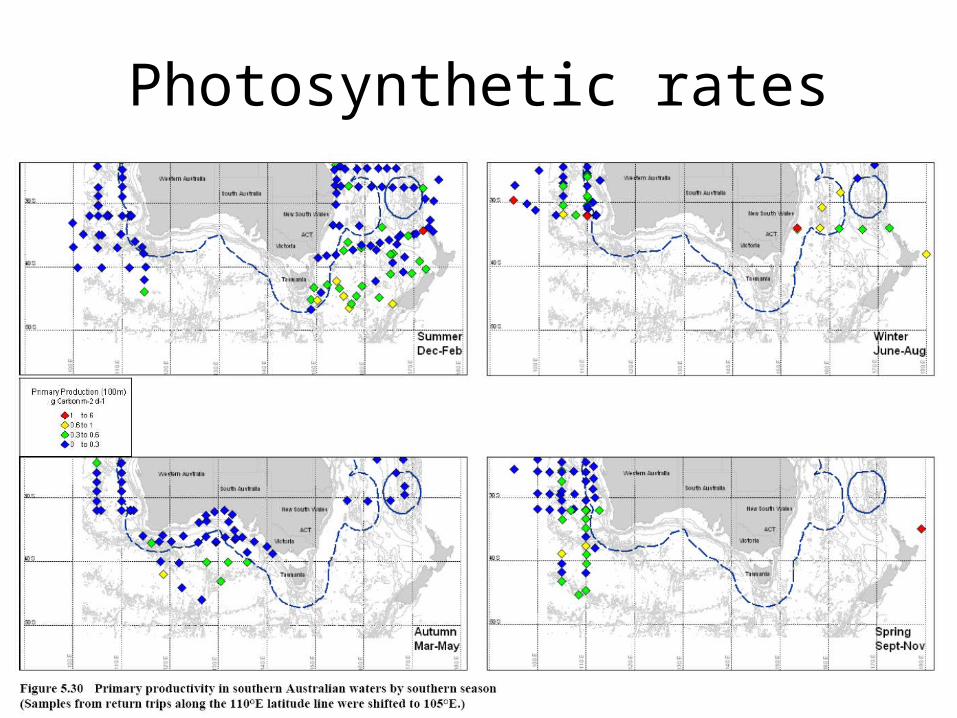
Photosynthetic rates
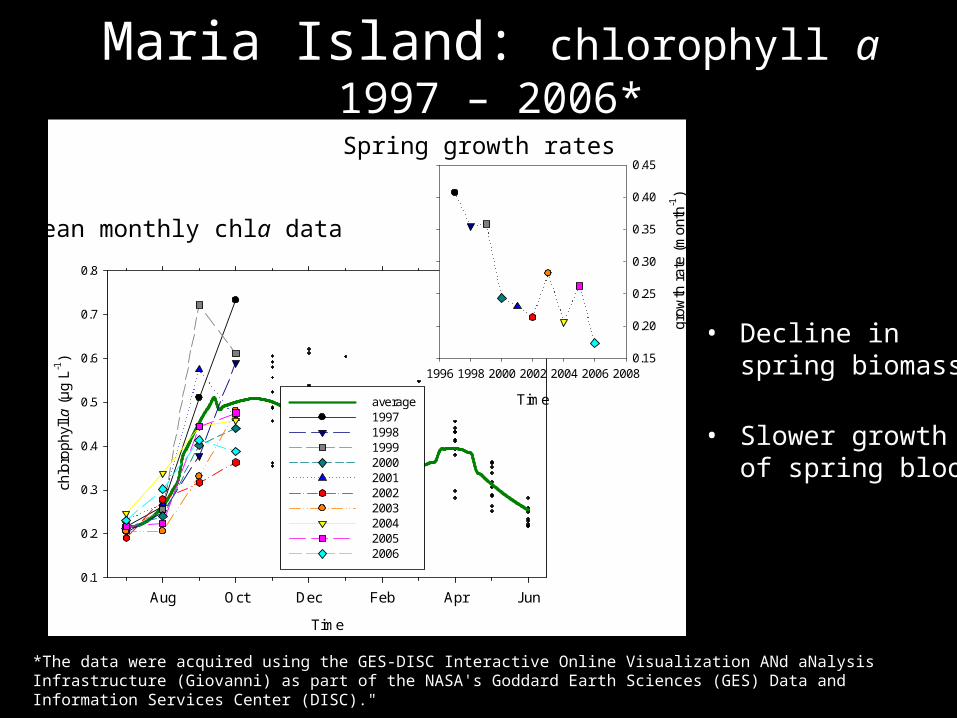
Maria Island: Maria Island: chlorophyll chlorophyll a a 1997 – 2006*1997 – 2006*
• Decline in spring Decline in spring biomass biomass
• Slower growth of Slower growth of spring bloomspring bloom
Time
Aug Oct Dec Feb Apr Jun
chlo
roph
yll a
(µ
g L-1
)
0.1
0.2
0.3
0.4
0.5
0.6
0.7
0.8
average1997199819992000 20012002 2003 20042005 2006
Time
1996 1998 2000 2002 2004 2006 2008
grow
th r
ate
(mo
nth-1
)
0.15
0.20
0.25
0.30
0.35
0.40
0.45
Mean monthly chla data
Spring growth rates
*The data were acquired using the GES-DISC Interactive Online Visualization ANd aNalysis Infrastructure (Giovanni) as part of the NASA's Goddard Earth Sciences (GES) Data and Information Services Center (DISC)."
ASPAB 2007, Warrnambool
Implications and future researchImplications and future research• Implications include: Implications include:
- temporal mismatch between trophic levels causing a - temporal mismatch between trophic levels causing a change in synchrony of primary, secondary and change in synchrony of primary, secondary and tertiary production tertiary production - changing species composition alters food quality for - changing species composition alters food quality for higher trophic levels, potentially leading to less fish higher trophic levels, potentially leading to less fish production production
• Challenge is to not only describe patterns, but to make Challenge is to not only describe patterns, but to make predictions and test hypotheses about cascading foodweb predictions and test hypotheses about cascading foodweb effectseffects
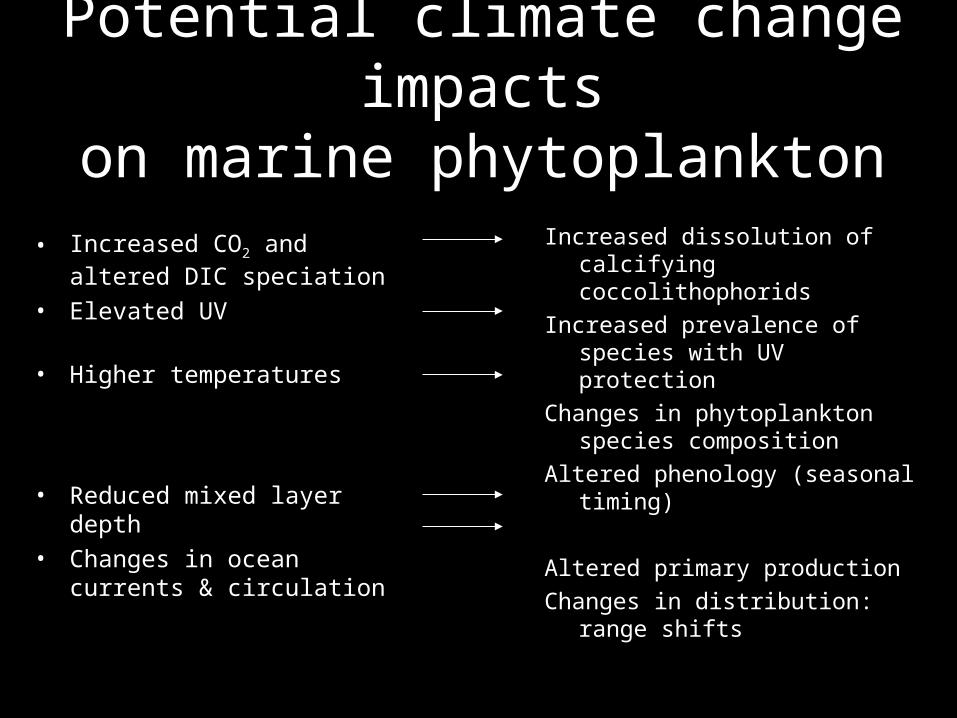
Potential climate change impactsPotential climate change impactson marine phytoplanktonon marine phytoplankton
• Increased COIncreased CO22 and altered DIC and altered DIC speciationspeciation
• Elevated UVElevated UV
• Higher temperaturesHigher temperatures
• Reduced mixed layer depthReduced mixed layer depth• Changes in ocean currents & Changes in ocean currents &
circulationcirculation
Increased dissolution of calcifying Increased dissolution of calcifying coccolithophoridscoccolithophorids
Increased prevalence of species with Increased prevalence of species with UV protectionUV protection
Changes in phytoplankton species Changes in phytoplankton species compositioncomposition
Altered phenology (seasonal timing)Altered phenology (seasonal timing)
Altered primary productionAltered primary productionChanges in distribution: range shiftsChanges in distribution: range shifts
Related Documents