Impacts of climate change from 2000 to 2050 on wildfire activity and carbonaceous aerosol concentrations in the western United States D. V. Spracklen, 1,2 L. J. Mickley, 1 J. A. Logan, 1 R. C. Hudman, 1,3 R. Yevich, 1 M. D. Flannigan, 4 and A. L. Westerling 5 Received 9 August 2008; revised 26 March 2009; accepted 18 June 2009; published 20 October 2009. [1] We investigate the impact of climate change on wildfire activity and carbonaceous aerosol concentrations in the western United States. We regress observed area burned onto observed meteorological fields and fire indices from the Canadian Fire Weather Index system and find that May–October mean temperature and fuel moisture explain 24–57% of the variance in annual area burned in this region. Applying meteorological fields calculated by a general circulation model (GCM) to our regression model, we show that increases in temperature cause annual mean area burned in the western United States to increase by 54% by the 2050s relative to the present day. Changes in area burned are ecosystem dependent, with the forests of the Pacific Northwest and Rocky Mountains experiencing the greatest increases of 78 and 175%, respectively. Increased area burned results in near doubling of wildfire carbonaceous aerosol emissions by midcentury. Using a chemical transport model driven by meteorology from the same GCM, we calculate that climate change will increase summertime organic carbon (OC) aerosol concentrations over the western United States by 40% and elemental carbon (EC) concentrations by 20% from 2000 to 2050. Most of this increase (75% for OC and 95% for EC) is caused by larger wildfire emissions with the rest caused by changes in meteorology and for OC by increased monoterpene emissions in a warmer climate. Such an increase in carbonaceous aerosol would have important consequences for western U.S. air quality and visibility. Citation: Spracklen, D. V., L. J. Mickley, J. A. Logan, R. C. Hudman, R. Yevich, M. D. Flannigan, and A. L. Westerling (2009), Impacts of climate change from 2000 to 2050 on wildfire activity and carbonaceous aerosol concentrations in the western United States, J. Geophys. Res., 114, D20301, doi:10.1029/2008JD010966. 1. Introduction [2] Emissions from wildfires in North America can have important consequences for air quality both regionally [McMeeking et al., 2005, 2006; McKenzie et al., 2006; Hodzic et al., 2007; Park et al., 2007; Spracklen et al., 2007; Jaffe et al., 2008b, 2008a; Pfister et al., 2008] and at sites thousands of kilometers from the fire [Wotowa and Trainer, 2000; DeBell et al., 2004; Jaffe et al., 2004; Lapina et al., 2006; Val Martin et al., 2006; Duck et al., 2007; Lewis et al., 2007]. Wildfire activity in North America is largely controlled by temperature and precipitation [e.g., Balling et al., 1992; Gedalof et al., 2005] which are in turn partly driven by large-scale ocean circulation patterns [e.g., Skinner et al., 1999; Duffy et al., 2005; Skinner et al., 2006]. Climate change therefore has the potential to influence the frequency, severity, and extent of wildfires [e.g., Flannigan et al., 2005]. In this study we use stepwise linear regression to evaluate relationships between the area burned by wild- fires and variables chosen from observed meteorology and standard fire indices. We apply these relationships to mete- orological fields calculated by a general circulation model (GCM) for 2000–2050 to determine the effect of changing climate on future area burned. Finally, we use a global chemistry model, driven by the GCM, to assess the impact of wildfires in a future climate on carbonaceous aerosols in the western United States. [3] Records of wildfire show increasing area burned in Canada [Stocks et al., 2002; Gillett et al., 2004; Kasischke and Turetsky, 2006], Alaska [Kasischke and Turetsky, 2006], and the western United States [Westerling et al., 2006] over the past few decades. In the western United States the annual area burned by large forest wildfires (>400 ha) during 1987 to 2003 was more than 6 times that during 1970 to 1986 [Westerling et al., 2006]. Wildfire behavior is modified by climate, forest management, and JOURNAL OF GEOPHYSICAL RESEARCH, VOL. 114, D20301, doi:10.1029/2008JD010966, 2009 Click Here for Full Article 1 School of Engineering and Applied Sciences, Harvard University, Cambridge, Massachusetts, USA. 2 Now at Institute for Atmospheric Science, School of Earth and Environment, University of Leeds, Leeds, UK. 3 Now at Department of Chemistry, University of California, Berkeley, California, USA. 4 Great Lakes Forestry Centre, Canadian Forest Service, Sault Ste. Marie, Ontario, Canada. 5 Sierra Nevada Research Institute, University of California, Merced, California, USA. Copyright 2009 by the American Geophysical Union. 0148-0227/09/2008JD010966$09.00 D20301 1 of 17

Welcome message from author
This document is posted to help you gain knowledge. Please leave a comment to let me know what you think about it! Share it to your friends and learn new things together.
Transcript

Impacts of climate change from 2000 to 2050
on wildfire activity and carbonaceous aerosol
concentrations in the western United States
D. V. Spracklen,1,2 L. J. Mickley,1 J. A. Logan,1 R. C. Hudman,1,3 R. Yevich,1
M. D. Flannigan,4 and A. L. Westerling5
Received 9 August 2008; revised 26 March 2009; accepted 18 June 2009; published 20 October 2009.
[1] We investigate the impact of climate change on wildfire activity and carbonaceousaerosol concentrations in the western United States. We regress observed area burned ontoobserved meteorological fields and fire indices from the Canadian Fire Weather Indexsystem and find that May–October mean temperature and fuel moisture explain 24–57%of the variance in annual area burned in this region. Applying meteorological fieldscalculated by a general circulation model (GCM) to our regression model, we show thatincreases in temperature cause annual mean area burned in the western United States toincrease by 54% by the 2050s relative to the present day. Changes in area burned areecosystem dependent, with the forests of the Pacific Northwest and Rocky Mountainsexperiencing the greatest increases of 78 and 175%, respectively. Increased area burnedresults in near doubling of wildfire carbonaceous aerosol emissions by midcentury. Usinga chemical transport model driven by meteorology from the same GCM, we calculatethat climate change will increase summertime organic carbon (OC) aerosol concentrationsover the western United States by 40% and elemental carbon (EC) concentrations by 20%from 2000 to 2050. Most of this increase (75% for OC and 95% for EC) is caused bylarger wildfire emissions with the rest caused by changes in meteorology and for OC byincreased monoterpene emissions in a warmer climate. Such an increase in carbonaceousaerosol would have important consequences for western U.S. air quality and visibility.
Citation: Spracklen, D. V., L. J. Mickley, J. A. Logan, R. C. Hudman, R. Yevich, M. D. Flannigan, and A. L. Westerling (2009),
Impacts of climate change from 2000 to 2050 on wildfire activity and carbonaceous aerosol concentrations in the western United
States, J. Geophys. Res., 114, D20301, doi:10.1029/2008JD010966.
1. Introduction
[2] Emissions from wildfires in North America can haveimportant consequences for air quality both regionally[McMeeking et al., 2005, 2006; McKenzie et al., 2006;Hodzic et al., 2007; Park et al., 2007; Spracklen et al.,2007; Jaffe et al., 2008b, 2008a; Pfister et al., 2008] and atsites thousands of kilometers from the fire [Wotowa andTrainer, 2000; DeBell et al., 2004; Jaffe et al., 2004; Lapinaet al., 2006; Val Martin et al., 2006; Duck et al., 2007;Lewis et al., 2007]. Wildfire activity in North America islargely controlled by temperature and precipitation [e.g.,
Balling et al., 1992; Gedalof et al., 2005] which are in turnpartly driven by large-scale ocean circulation patterns [e.g.,Skinner et al., 1999; Duffy et al., 2005; Skinner et al., 2006].Climate change therefore has the potential to influence thefrequency, severity, and extent of wildfires [e.g., Flanniganet al., 2005]. In this study we use stepwise linear regressionto evaluate relationships between the area burned by wild-fires and variables chosen from observed meteorology andstandard fire indices. We apply these relationships to mete-orological fields calculated by a general circulation model(GCM) for 2000–2050 to determine the effect of changingclimate on future area burned. Finally, we use a globalchemistry model, driven by the GCM, to assess the impactof wildfires in a future climate on carbonaceous aerosols inthe western United States.[3] Records of wildfire show increasing area burned in
Canada [Stocks et al., 2002; Gillett et al., 2004; Kasischkeand Turetsky, 2006], Alaska [Kasischke and Turetsky,2006], and the western United States [Westerling et al.,2006] over the past few decades. In the western UnitedStates the annual area burned by large forest wildfires(>400 ha) during 1987 to 2003 was more than 6 times thatduring 1970 to 1986 [Westerling et al., 2006]. Wildfirebehavior is modified by climate, forest management, and
JOURNAL OF GEOPHYSICAL RESEARCH, VOL. 114, D20301, doi:10.1029/2008JD010966, 2009ClickHere
for
FullArticle
1School of Engineering and Applied Sciences, Harvard University,Cambridge, Massachusetts, USA.
2Now at Institute for Atmospheric Science, School of Earth andEnvironment, University of Leeds, Leeds, UK.
3Now at Department of Chemistry, University of California, Berkeley,California, USA.
4Great Lakes Forestry Centre, Canadian Forest Service, Sault Ste.Marie, Ontario, Canada.
5Sierra Nevada Research Institute, University of California, Merced,California, USA.
Copyright 2009 by the American Geophysical Union.0148-0227/09/2008JD010966$09.00
D20301 1 of 17

fire suppression [Allen et al., 2002; Noss et al., 2006], andunderstanding the reasons for changing wildfire is furthercomplicated by changes in fire reporting over the period ofrecord. However, recent changes in climate were likely themain drivers for increases in area burned both in the westernUnited States [Westerling et al., 2006] and Canada [Gillettet al., 2004; Kasischke and Turetsky, 2006; Girardin, 2007].For the western United States, Westerling et al. [2006]showed that the observed increase in wildfire has beendriven largely by earlier spring snowmelt and increasingspring and summertime temperatures; mean March–Augusttemperatures for 1987–2003 were 0.87 K warmer thanthose in 1970–1986.[4] Several studies have estimated the impacts of future
climate change on wildfire. Flannigan and Van Wagner[1991] used three different GCMs to predict on average a46% increase in seasonal severity rating (SSR, a measure offire weather) across Canada under a 2 � CO2 scenario.Similar results were found by Flannigan et al. [2000] whoused two GCMs to predict a 10–50% increase in SSRacross much of North America under the same scenario.Longer future fire seasons in Canada were predicted byStocks et al. [1998] and Wotton and Flannigan [1993].Increased future fire danger has also been predicted forRussia [Stocks et al., 1998], the western United States[Brown et al., 2004; Westerling and Bryant, 2008], andthe European Mediterranean area [Moriondo et al., 2006].Westerling and Bryant [2008] predict a 10–35% increase inlarge fire risk by midcentury in California and Nevada,depending on the greenhouse gas emissions scenario andGCM used. Large regional variation in future wildfires ispredicted by Regional Climate Models (RCMs), includingdecreased fire danger in parts of eastern Canada due toincreased precipitation [Bergeron and Flannigan, 1995;Flannigan et al., 2001].
[5] Many of the above studies predict changes in fireindices, but estimates of emissions from fires requirepredictions of area burned. Flannigan et al. [2005] inves-tigated relationships between climate and the areas of firesin Canada. Stepwise linear regression was used to derive thebest predictors of area burned, chosen from meteorologicalvariables (surface temperature, rainfall, wind speed, andrelative humidity) and calculated values of forest fuelmoisture from the Canadian Fire Weather Index (FWI)System. Temperature and fuel moisture explained between36 and 64% of the variance in monthly area burned depend-ing on the ecosystem. The Canadian and Hadley CentreGCMs were used to predict increases in area burned of 74–118% under a 3 � CO2 scenario. RCMs have also beenused to study wildfire area burned in limited regions ofCanada. For the boreal forests of Alberta, Tymstra et al.[2007] used an RCM to predict a 13% increase in areaburned in a 2 � CO2 scenario and a 30% increase in a 3 �CO2 scenario. Most of these studies did not account for anyfuture changes in ignition sources. Price and Rind [1994]used empirical lightning and fire models along with theGoddard Institute for Space Studies (GISS) GCM to predictthat more intense convection under a 2 � CO2 scenarioleads to increased lightning and a 78% increase in areaburned in the United States.[6] Despite these efforts to predict the effect of future
climate on wildfires, there have not been studies of theimpact of these future wildfires on air quality. In this paperwe predict how wildfires in the western United States willrespond to changes in climate between the present day and2050 and evaluate the impacts on aerosol air quality (seeFigure 1). We apply the technique of Flannigan et al.[2005] to the western United States, building regressionsbetween observed wildfire area burned [Westerling et al.,2003] and observed climate. Projections of future climate,calculated by the GISS GCM, are used to predict changes in
Figure 1. Schematic of our approach to modeling the impact climate change on future wildfires andcarbonaceous aerosol concentrations.
D20301 SPRACKLEN ET AL.: CLIMATE CHANGE, WILDFIRE AND AEROSOL
2 of 17
D20301

wildfire area burned. We use the GEOS-Chem chemicaltransport model (CTM) driven by meteorology from theGISS model to quantify the impact of changing wildfire oncarbonaceous aerosol concentrations.
2. Predicting Wildfire Emissions for 2000–2050
[7] Here we describe our prediction of future wildfireemissions of carbonaceous aerosol in the western UnitedStates, defined as the domain 31�–49�N, 125�–100�W(from the Pacific Coast to eastern Colorado and from theMexican border to the Canadian border).
2.1. Area Burned Predictions
[8] We extend the approach of Flannigan et al. [2005] tothe western United States, building regressions of observedarea burned with surface meteorological data and outputfrom the FWI model. Observed area burned was taken fromthe database of Westerling et al. [2003]. They used reportsfrom various agencies in the United States that provided thearea burned on federal land, and the start and end date ofindividual fires, from 1980 to 2000. This database has beenextended to 2004. Westerling et al. [2003] assumed that thefires burn entirely in the month during which they started
Figure 2. Ecosystems in the western United States. (left) Bailey et al. [1994] ecosystem classesprojected onto a 1� by 1� grid. (right) Aggregated ecosystems that are used in this analysis: PacificNorthwest, Californian Coastal Shrub, Desert Southwest, Nevada Mountains/Semidesert, RockyMountains Forest, and Eastern Rocky Mountains/Great Plains.
D20301 SPRACKLEN ET AL.: CLIMATE CHANGE, WILDFIRE AND AEROSOL
3 of 17
D20301

(end dates are often unreliable), and the areas were aggre-gated on a grid of 1� � 1�. Because the gridded databaseused only the start date of each fire, it may not accuratelyreflect the seasonal dependence of each fire season. Inaddition, the wildfire time series is relatively short, and ifthere are only a few extreme events, it is difficult to fit withthe least squares approach used here. For these reasons wechose to predict annual area burned.[9] Area burned was binned according to the ecological
stratification of Bailey et al. [1994]. This system defines18 ecoprovinces in the western United States. These eco-systems were further aggregated to produce six ecoregionswith similar vegetation and climate, as shown in Figure 2.We tested our regressions with the original 18 ecosystems,but found we could better fit area burned for the largerecoregions, as did Flannigan et al. [2005] for Canada. Thisis probably caused by meteorological factors that influencearea burned operating at synoptic scales, and larger spatialunits providing some statistical smoothing of noisy data forarea burned. Littell et al. [2009] find strong relationships(R2 of between 0.31 and 0.87) at the original ecoprovincelevel, potentially because they also include the PalmerDrought Severity Index and antecedent meteorologicalvariables within their regressions, and because they firstextracted the principal components of the times series ofmeteorological data before fitting the area burned data. Thecoarse spatial resolution of the global climate model limitsthe scale at which we can make future projections of climateand so area burned. For this reason we use the six aggre-gated ecoregions (Pacific Northwest, California CoastalShrub, Desert Southwest, Nevada Mountains/Semidesert,Rocky Mountains Forest, and Eastern Rocky Mountains/Great Plains) for the rest of this work.[10] We obtained from the USDA Forest Service data for
four meteorological variables important to wildfire frequencyand required as input to the FWI model: daily 12.00 localstandard time temperature, relative humidity, wind speed,and 24-h accumulated rainfall (available at http://fam.nwcg.gov/fam-web/weatherfirecd/). Meteorologicalstations were selected if they reported data for at least twothirds of the 1980–2004 time period and if the altitude ofthe station was within 500 m of the mean altitude of allstations within that ecoregion. Table 1 shows the number ofstations selected for each ecoregion. Temperature and rela-tive humidity values at each station were adjusted to themean elevation of the stations. For temperature the adjust-ment is based on the U.S. Standard Atmosphere lapse rateof �6.5 K/km. Relative humidity was then recalculatedusing the adjusted temperature. For 1980–2004 we calcu-lated a daily value for each meteorological variable andeach ecoregion as an average across the selected meteoro-logical stations for each ecoregion.[11] The calculated daily values of the four meteoro-
logical variables were used as input to the Canadian FWISystem [Van Wagner, 1987]. The model calculates daily fuelmoisture codes and fire severity indices using these fourvariables to track changes in forest fuel moisture. A sche-matic of this model is shown in Figure 3. The fuel moisturecodes describe the moisture content of three distinct fuellayers in the forest floor. The Fine Fuel Moisture Code(FFMC) represents surface fuel litter and changes rapidlywith short-term changes in atmospheric moisture (time lagT
able
1.Wildfire
AreaBurned
RegressionsforAggregated
Ecoregionsin
theWestern
United
Statesa
Ecoregion
BaileyEcosystem
Classes
bMeanElevation(m
)Number
ofMet
Stations
R2
PredictedAreaBurned/hac
Pacific
Northwest
M261,242,M
242
1040
94
52%
=�3.1�
106+9.4�
104T+1.7�
103DC
CalifornianCoastalShrub
262,M
262,261
635
32
24%
=�3.6�
106+3.4�
104Tmax+2.6�
104FFMC
DesertSouthwest
322,321,M
313,313
1600
61
49%
=�1.64�
106+6.3�
104T+296DCmax
NevadaMountains/Sem
idesert
341,M
341,342
1740
22
37%
=3.9�
105+1.2�
104FWI m
ax�1.4�
106Rain
RockyMountainsForest
M331,M
332,M
333
1760
60
48%
=�6.55�
106+3.2�
105T+5.3�
103BUI m
ax
Eastern
RockyMountains/Great
Plains
331,315
1300
857%
=�3.6�
105+3.4�
104DSR
aFrom
Bailey
etal.[1994]ecosystem
classes.
bDescriptionofBaileyecosystem
sappears
inFigure
1.Foreach
ecoregionthenumber
ofmeteorological
stationsandthemeanelevationofthestationsabovesealevel
isshown.
cPredictorsarechosenfrom
maxim
um
andmeandaily
May
throughOctober
values
ofmeteorologicalvariablesandcomponentsoftheCanadianFireWeather
Index
System
(see
Figure
3):T(�C),Tem
perature;DC,
DroughtCode;
FFMC,FineFuel
Moisture
Code;
FWI,FireWeather
Index;Rain,accumulated24-h
rainfall(m
m);BUI,Build-upIndex;DSR,Daily
SeverityRating.
D20301 SPRACKLEN ET AL.: CLIMATE CHANGE, WILDFIRE AND AEROSOL
4 of 17
D20301

of 2/3 day). The Duff Moisture Code (DMC) representsloosely compacted organic layers (time lag of 15 days) andthe Drought Code (DC) represents deep layers of compactedfuel and reacts to seasonal droughts (time lag of 52 days).The fire severity ratings combine information from the fuelmoisture codes to give an indication of the fire danger orrate of fire spread. The Build-up Index (BUI) combinesDMC and DC and is an indication of the availability of fuelfor consumption. The potential rate of spread of a fire iscalculated by combining wind speed and FFMC to give theInitial Spread Index (ISI). The ISI and BUI are combined togive the Fire Weather Index (FWI) which is commonly usedas a general index of fire danger. The Daily Severity Rating(DSR) is an exponential function of the FWI and gives anindication of the difficulty of fire control.[12] Linear forward stepwise regression was used for each
of the six ecoregions with annual area burned as thepredictand. For predictors we used the maximum and meanof the daily May to October values of temperature, relativehumidity, and wind speed and the seven output fields fromthe FWI model (described in section 2.1). In addition weused May to October mean daily rainfall and total May toOctober rainfall. This gives 22 potential predictors. We usedthe same test for significance as Flannigan et al. [2005];terms were accepted only if they met a significance level(p value) of 0.15. The predictor with the highest correlationcoefficient was added to the regression first. Predictors werethen added in the order that maximized the correlationcoefficient, until the correlation coefficient did not increaseby a preselected amount (typically 2%), or until a predictorwas selected that resulted in a nonphysical (counterintuitive)relationship between area burned and fuel moisture. Ingeneral, two predictors were selected for each ecoregion.We tested our method using both area burned and naturallogarithm of area burned. We found similar correlationcoefficients with the two predictands. For the rest of thiswork, prediction of linear area burned was used.
[13] Figure 4 shows a comparison of observed andpredicted annual area burned in the Pacific Northwest andRocky Mountains Forest ecoregions. The observationsshow large interannual variability in area burned, with arange of 7500 ha/a to 440,000 ha/a in the Pacific Northwestand 4800 ha/a to 1.45 million ha/a in the Rocky MountainsForest. In the Pacific Northwest the regression explains 52%of this interannual variability. The chosen predictors for thisregion are mean drought code and mean temperature, whichcorrelate with area burned with R2 of 46 and 43%, respec-tively. The greatest observed area burned occurred in 1987and 2002 coincident with high DC and T. Predicted areaburned is also maximum during these 2 years but is under-estimated by about 40%. In the Rocky Mountains Forest theregression explains 47% of the variability in annual areaburned. The best predictors for this region are meantemperature and maximum Build-up Index, which correlatewith area burned with R2 of 42 and 40%, respectively. Theregression underpredicts the largest fire year in 1988 byabout 60%, but other large fires years (e.g., 2000 and 2001)are well predicted.[14] Table 1 shows the best predictors and the explained
variance for the six ecoregions in the western United States.The regressions explain 24–57% (mean 45%) of variance inannual area burned. Our relationships are weaker thanrecent work by Littell et al. [2009] who found 33–87%(mean 64%) for the reasons discussed earlier in this section.The explained variance in our work is generally greater inforest dominated ecosystems (48–52%) than in shrub andgrass dominated ecosystems (24 – 49%). The lowerexplained variance in these ecosystems is likely due to theimportance of the previous year’s climate for fire activity inthese areas [Westerling et al., 2002; Westerling and Bryant,2008; Littell et al., 2009] which we do not take into accountwith our method. However, as we show in section 2.3, theseshrub and grass dominated ecosystems have limited impacton regional particulate air quality because of low fuel loads.
Figure 3. Schematic of the Canadian Fire Weather Index (FWI) System.
D20301 SPRACKLEN ET AL.: CLIMATE CHANGE, WILDFIRE AND AEROSOL
5 of 17
D20301

[15] Best predictors of area burned are ecosystem depen-dent but generally include temperature and fuel moisturecodes (FFMC or DC). Temperature is the most commonlychosen predictor in the western United States, as has beenfound previously in Canada [Flannigan et al., 2005]. Hightemperatures are associated with clear skies, persistentstagnation, and dry fuel: conditions that favor wildfireoccurrence.
2.2. Simulation of Future Area Burned
[16] To calculate future area burned, we archived dailymean temperature, relative humidity, and local noon windspeed as well as 24-h accumulated rainfall from the GISSsimulation for 2000–2050. We used the ‘‘q flux’’ version ofthe GISS GCM 3 [Rind et al., 2007], which has a horizontalresolution of 4� � 5� and 23 vertical sigma levels betweenthe surface and 0.002 hPa. In the q flux version, ocean heattransport fluxes are kept fixed while ocean temperatures andocean ice respond to changes in climate. Observed concen-trations of well-mixed greenhouse gases, ozone, and aero-sols were used for the model spin-up between 1950 and2000, starting from a climate equilibrium [Hansen et al.,2002]. For 2001 to 2055 we used concentrations of well-mixed greenhouse gases from the IPCC SRES A1B scenario,with CO2 calculated using the Bern-CC model [Houghton,2001]. Under this scenario, CO2 mixing ratios reach
522 ppm by 2050. We assumed no changes in ozone oraerosols from 2001 to 2055 for the purpose of calculatingclimate change. This model predicts global mean Julytemperatures to increase by 1.8�C from 2000 to 2050.[17] Because the GISS GCMs tend to have a warm
continental bias [Schmidt et al., 2006], we scaled tempera-ture as well as the other fields to match observations bymultiplying the GISS output by the ratio of mean observedto mean GISS values in each model grid square for May toOctober of 1990–2000. The adjusted GISS meteorologywas used as input for the FWI model to calculate daily fuelmoisture parameters. The regressions developed in section2.1 were then applied to GISS and FWI output to predictecosystem specific annual area burned.[18] Figure 5 shows the simulated changes between 2000
and 2050 in mean May through October noon values of thefour meteorological variables over the western UnitedStates; we compare the means for 1996–2005 and for2046–2055. Temperatures increase across the westernUnited States by 1–3�C, with the largest increases in thePacific Northwest and Nevada Mountains/Semidesertecoregions. The projected change in temperature over thewestern United States is large, 1.5–1.8 times the standarddeviation in May–October mean temperature, even though2049 has a mean temperature below the 1996–2006 mean.Precipitation and relative humidity increase by 7% and less
Figure 4. Observed (Westerling et al. [2003], filled squares) and predicted (stepwise linear regression,filled triangles) annual area burned between 1980 and 2004 in (a) Pacific Northwest and (b) RockyMountains Forest ecoregions (see Figure 2 for locations). Also shown are the predictors chosen by theregression (mean or maximum of the daily values for May to October): mean temperature (T, filledcircles), and indices from the Canadian FWI System (see Figure 3, open circles): mean Drought Code(DC) and maximum Build-up Index (BUImax).
D20301 SPRACKLEN ET AL.: CLIMATE CHANGE, WILDFIRE AND AEROSOL
6 of 17
D20301

than 2%, respectively, across the western United States withthe greatest increases in the Eastern Rocky Mountains/GreatPlains and Desert Southwest ecoregions. Mean wind speedsare projected to decrease slightly throughout the westernUnited States. These climate projections lie within the rangereported by the Intergovernmental Panel on Climate Change[Seager et al., 2007; Christensen et al., 2007], giving usconfidence that the climate projections from the GISSmodel are robust.[19] We applied the adjusted GCM meteorology to our
area burned regression model to predict annual ecoregionarea burned from 1996 to 2055. Table 2 shows the averageobserved area burned for 1980 to 2004 and average calcu-lated area burned for a 10-year period in the present day(1996 to 2005) and in the future (2046 to 2055) for each of
the six ecoregions. Average area burned in the present day iscalculated with a normalized mean bias (NMB = 100% �PN
i¼1 (Pi � Oi)/PN
i¼1Oi, where Pi is the predicted areaburned during year i and Oi is the observed area burnedduring year i and N is the number of years in the analysis) of+10% to �25% depending on the region. Figure 5e showssimulated annual area burned for 1996–2005, and Figure 5fshows the ratio of area burned in 2046–2055 to that in1996–2005.[20] Total area burned across the western United States is
projected to increase by 54% for 2046–2055 relative to1996–2005. This projected increase is significant (student’st test p = 0.03). Area burned is predicted to increase in allregions except the Eastern Rocky Mountains/Great Plainswhere the change is not significant. Statistically significant
Figure 5. Simulated 1996–2055 change in May–October local noon meteorology from the GISS GCMand IPCC A1B emissions scenario. Values are the difference between 10-year means for 2046–2055 and1996–2005. (a) Surface temperature, (b) relative humidity, (c) wind speed, (d) 24-h accumulated rainfall.Also shown is the wildfire area burned predicted by our regression equations and GCM meteorology for(e) present day (1996–2005) and (f) ratio of predicted area burned 2046–2055:1996–2005.
D20301 SPRACKLEN ET AL.: CLIMATE CHANGE, WILDFIRE AND AEROSOL
7 of 17
D20301

(p < 0.05) increases in area burned are projected for theRocky Mountains Forest (78%), Pacific NorthwestForest (175%), and Desert Southwest (43%) ecoregions(see Table 2). In these ecoregions, area burned by mid-century is predicted to increase by more than one standarddeviation. We used our regression equations (Table 1) alongwith the predicted changes in meteorological and FWIparameters to quantify the contributions of the differentpredictors to the change in predicted area burned (see Table 3).Simulated increases in temperature (Figure 5) are responsiblefor more than 80% of the predicted increase in area burned inthese ecoregions.[21] For most of the west, temperature plays the main role
in driving future changes in area burned. However, thesmall (but insignificant) reduction in area burned in theGreat Plains/Eastern Rocky Mountains is due to increasedprecipitation simulated by the GCM. In the NevadaMountains/Semidesert and to a lesser extent in the Desert Southwestecoregions the impact of increasing temperature is partlyoffset by increasing precipitation; there is no significantchange in area burned in the former region and a 43%increase in the Desert Southwest ecoregion.[22] Figure 6 shows the interannual variability in pre-
dicted area burned and in the predictors used to calculatearea burned in the Pacific Northwest and Rocky MountainsForest ecoregions. Interannual variability in predicted areaburned is similar to that in observed area burned. We fit thepredicted trend in area burned for each ecoregion during theperiod 1980 to 2004 using linear regression and found thatthe Pacific Northwest, Desert Southwest, and RockyMountains Forest ecoregions have significant positivetrends, as shown in Table 2.
2.3. Production of Wildfire Emissions
[23] To calculate emissions from wildfires, we took thefollowing steps. We first converted annual area burned tomonthly area burned by using the average observed sea-sonal variability of wildfire in each ecoregion in 1980–2004. We assumed that the seasonality of wildfire remainsthe same in the future and that the emissions of wildfires areconstant across a month. Calculated ecoregion area burnedwas mapped onto a 1� � 1� grid using the observed areaburned data to constrain the typical spatial extent of fireswithin each ecoregion. Figure 7 shows the fraction of 1�� 1�grid squares that contain 70% of observed annual area burnedin any 1 year in each of the six ecoregions. We repeated thisprocedure for 60, 80, and 90% of area burned, but changingthis had little impact on our results. For all ecoregions, 70%of area burned in a particular year occurs in 5–25% of theecoregion. To match this observed behavior, we place 70%of projected area burned in 10% of 1� � 1� grid squares ineach ecoregion. We locate these grid squares randomlywithin each ecoregion. The remaining 30% of area burnedwas averaged across the remaining 90% of grid squareswithin the ecoregion. To check for bias introduced by therandom placement of wildfires within each ecoregion, wecreated a 100-member ensemble of simulations of yearlybiomass consumption, each with a different randomly chosenset of wildfire locations. Our results showed only a 1% one-sigma variation in total biomass consumption over thesimulation period.
Table
2.Annual
MeanObserved
(1980–2004)andSim
ulatedAreaBurned
±1sbyEcoregionin
theWestern
United
Statesa
Ecoregion
AreaBurned/105ha
Ratio
(F)/(PD)
Standardized
Departure
bSlopec
±1s(ha/yr)
pValueforSlope
Observed
Predicted
1980–2004
1996–2005(PD)
2046–2055(F)
Pacific
Northwest
1.08±0.39
1.08±0.70
1.92±0.79
1.78
1.23
1440±470
<0.01
CalifornianCoastalShrub
0.59±0.17
0.60±0.43
0.84±0.31
1.38
0.61
320±310
0.15
DesertSouthwest
0.74±0.14
0.81±0.22
1.16±0.18
1.43
1.42
690±160
<0.01
NevadaMountains/Sem
idesert
2.84±0.71
3.04±1.03
3.14±0.67
1.03
0.13
�140±590
0.41
RockyMountainsForest
2.07±0.71
1.53±1.52
4.19±1.76
2.75
1.44
5010±1220
<0.01
Eastern
RockyMountains/Great
Plains
0.78±0.26
0.55±0.85
0.50±0.67
0.91
�0.07
�400±540
0.23
aPD,PresentDay;F,Future.
bThestandardized
departure
istheabsolute
change[F-PD]divided
bythestandarddeviation[s
(1996–2055)]in
predictedarea
burned.
cThetrendin
predictedarea
burned
(1996–2055)isfitted
usinglinearregressionandtheslopeofthebestfitlineisreported.
D20301 SPRACKLEN ET AL.: CLIMATE CHANGE, WILDFIRE AND AEROSOL
8 of 17
D20301

[24] Fuel consumption was calculated from a detaileddatabase of fuel loading (i.e., available fuel) for the UnitedStates developed by the U.S. Forest Service, the FuelCharacteristic Classification System (FCCS) (http://www.fs.fed.us/pnw/fera/fccs/), and the fraction of fuel load-
ing that is burned as a function of fire severity for differentcategories of fuel. We assume that fires burn with 25% high,25% medium, and 25% low severity, and that 25% of thearea is unburned, on the basis of an analysis of the largestwildfires in 2002 in the lower 48 states [Randall, 2004]. The
Table 3. Present-Day (1996–2005) and Future (2046–2055) May–October Values of Predictors Simulated Using the GISS GCM and
FWI System and Used to Calculate Area Burneda
Ecoregion
Simulated Mean
Standardized Departureb p Valuec Percent Contributiond1996–2005 2046–2055
Pacific NorthwestDC 595 605 0.2 0.7 10T/�C 24.9 26.9 1.7 <0.01 90
Californian Coastal ShrubTmax/�C 37.7 39.2 1.1 <0.01 95FFMC 90.4 90.5 0.1 0.90 5
Desert SouthwestT/�C 26.5 27.9 1.7 <0.01 108DC 590 566 �0.5 0.24 �8
Nevada Mountains/SemidesertFWImax 92.1 95.0 0.3 0.38 180Rain/mm/d 0.54 0.56 0.1 0.85 �80
Rocky Mountains ForestT/oC 18.8 20.4 1.8 <0.01 80BUImax 153 176 0.6 0.23 20
Great PlainsDSR 5.9 5.7 �0.1 0.38 100aSee Table 1. Definition of predictors is in footnote of Table 1.bStandardized departure is the future minus present-day simulated means divided by the standard deviation for each predictor.cStudent’s t test calculated from the difference between the present-day and future simulated means.dThe percentage contribution to the change in area burned is calculated for each predictor using the regressions in Table 1 and the change in predictor
reported here.
Figure 6. Annual area burned and May–October values of predictors used in regression equations for(a) Pacific Northwest and (b) Rocky Mountains Forest ecoregions between 1980 and 2055. Observedarea burned (dotted black line) and predicted area burned (solid black line). Temperature (filledcircles) and indices from the Canadian FWI System (see Figure 3, open circles) are calculated using theGISS GCM.
D20301 SPRACKLEN ET AL.: CLIMATE CHANGE, WILDFIRE AND AEROSOL
9 of 17
D20301

FCCS gives the fuel loadings for many fuel beds withresolution of 1 km � 1 km [McKenzie et al., 2007; Ottmaret al., 2007; Riccardi et al., 2007]. The loading for each fuelbed is given for various size categories of fuels thatcorrespond to time-lag fuel categories commonly used infire behavior modeling in the United States. Fuel consump-tion was calculated from fuel loadings by adopting thefraction of fuel that is burned in low-severity, medium-severity, and high-severity fires in six classes of fuel givenin Table 4. The fractions in Table 4 are used by the U.S.Geological Survey to derive the severity of a burn usingfield observations of fractional consumption after the fire
(http://frames.nbii.gov/ffi/docs/Composite_Burn_Index.pdf). We matched the FCCS fuel categories to the fuelclasses of the Composite Burn Index in Table 4 as follows:(1) litter/light fuels: FCCS categories of litter and woodyfuels <7.6 cm in diameter, (2) medium fuel: FCCS woodyfuels 7.6–20.3 cm in diameter, and (3) heavy fuel: FCCSwoody fuel >20.3 cm in diameter. Fuel consumption wascalculated for each 1 km2 grid, weighted by severity, andthen an average formed for each 1� � 1� grid, the resolutionof our area burned product. Average fuel consumption isshown in Figure 8a.[25] Emissions of carbonaceous aerosol from wildfires
were calculated using the predicted 1� � 1� wildfire areaburned maps combined with the 1� � 1� fuel consumptionproduct and emission factors from Andreae and Merlet[2001]. We assume that fuel loadings and fire severity donot change between present day and 2050, so that theemissions of carbonaceous aerosol per unit area burned donot change over the simulation period. That is, the simulatedchange in wildfire emissions is driven solely by changes towildfire area burned. A database of monthly biomassconsumption on the 1� � 1� grid is available on request.[26] We find that wildfires in the Pacific Northwest and
Rocky Mountains Forest ecoregions dominate present-daybiomass consumption by fires in the western United States,accounting for 30 and 43%, respectively, of the totalconsumption for 1980–2004 using the observed areaburned from Westerling et al. [2003] with updates (seeTable 5). Wildfire in these two ecoregions will thereforehave the largest potential impact on regional air quality. TheNevada Mountains/Semidesert ecoregion has the greatestarea burned, 35% of the total for 1980–2004 (Table 2), butaccounts for only 7% of the total biomass consumptionbecause of low fuel loads. Similarly, the Californian CoastalShrub andDesert Southwest with 16% of area burned accountfor only 6% of total biomass consumption. Figures 8b and 8ccontrast the different spatial distributions of area burned andfuel consumption in the western United States.[27] The calculated annual mean dry biomass consump-
tion based on observed area burned is 14.2 Tg for 1980–2004. Predicted mean dry biomass consumption in thewestern United States, averaged over the 100-memberensemble of simulations, increases from �13.8 Tg/a for1996–2005 to �26.4 Tg/a for 2046–2055, an increase of�90% (see Table 5). This increase is statistically significant(p < 0.01). The linear trend in biomass consumption is0.23 ± 0.07 Tg/yr. Figure 9 shows the trend in predicteddry biomass consumption by wildfire in the westernUnited States for 1996–2055 plotted as the standardizeddeparture from the mean for 1996–2005 (Standardizeddeparturei = [Pi� P(1996–2005)]/standard deviation(P1996–2005),
Table 4. Fractional Fuel Consumption as a Function of Fire Severity
Burn Severity Litter and Light Fuelsa Medium Fuelsb Heavy Fuelsc Duffd Grass Shrub Canopy
Low 0.5 0.2 0.1 0.0 0.3 0.2 0.05Medium 1.0 0.4 0.25 0.5 0.8 0.7 0.5High 1.0 0.6 0.4 1.0 1.0 1.0 0.95aWoody fuels <7.6 cm in diameter.bWoody fuels 7.6–20.3 cm in diameter.cWoody fuels >20.3 cm in diameter.dDepth of duff was converted to fuel loading in western forest ecosystems using a density of 1.63 kg/m2/cm depth [van
Wagtendonk et al., 1998].
Figure 7. Fraction of 1� � 1� grid squares (solid symbolsshow the mean and error bars one standard deviation) withineach ecoregion that contain 70% of observed area burned inany year calculated for the period 1980–2004. Ecoregionsare as follows: PNW, Pacific Northwest; CCS, CalifornianCoastal Shrub; DSW, Desert Southwest; NMS, NevadaMountains/Semidesert; RMF, Rocky Mountains Forest andERM, Eastern Rocky Mountains/Great Plains.
D20301 SPRACKLEN ET AL.: CLIMATE CHANGE, WILDFIRE AND AEROSOL
10 of 17
D20301

where Pi is the biomass consumption in year i). A low fireyear in 2046–2055 (except for 2049) is about one standarddeviation above the 1996–2005 mean and is equivalent to ahigh fire year during 1996–2005.[28] The projected increase in future area burned may
result in a decrease in the fire return interval, and thus adecrease in the average stand age and in the mean fuel load,with implications for our projected future emissions fromwildfires. A maximum reduction in fuel burned can beestimated by assuming that there is no recovery of vegeta-tion after a wildfire; that is, the fuel loading is zero if thesame area reburns, with random placement of fires withineach ecozone each year. When we make this assumption ourprojected biomass consumption in the western United Statesin 2046–2055 is 18% less than when we assume constantfuel consumption. This is obviously an unrealistic scenariobut gives a plausible estimate of the maximum reduction infuel consumption caused by an increase in area burned over50 years. For the rest of this work we assume that fuel loadsdo not vary over the simulation period.
3. Simulations of Atmospheric EC and OC
[29] We use our simulated wildfire emissions along with aglobal chemistry model to calculate the changes in aerosolair quality over the western United States.
3.1. Model Description
[30] We predict atmospheric carbonaceous aerosol con-centrations using the GEOS-Chem global 3-D model oftropospheric chemistry [Bey et al., 2001; Park et al., 2003]driven by meteorological fields from the NASA/GISSGCM. The interface between the GEOS-Chem CTM andthe GISS GCM is described by Wu et al. [2007, 2008] andvalidated for gas phase species by Wu et al. [2007] and foraerosols by Liao et al. [2007]. We described the GISSmodel version used in this work in section 2.2.[31] Meteorological output from the GISS GCM was
archived with 6-h resolution (3 h for surface quantitiesand mixing depths) and used as input to the CTM. We usedGEOS-Chem model version v7.04.01 (see http://www-as.harvard.edu/chemistry/trop/geos) with the same spatialresolution as the GCM, 4� � 5�.[32] The model treats EC and OC with a hydrophobic and
hydrophilic fraction for each (giving four advected tracers).Combustion sources emit hydrophobic aerosol whichbecome hydrophilic with an e-folding time of 1.2 days[Cooke et al., 1999; Chin et al., 2002]. We assumed that80% of EC and 50% of OC emitted from primary sourcesare hydrophobic [Cooke et al., 1999; Chin et al., 2002;Chung and Seinfeld, 2002]. Anthropogenic emissions of OCover the United States are from Cooke et al. [1999] with the
Figure 8. (a) Mean dry biomass consumption per unit area burned (see section 2.3 for details) andannual mean (b) observed area burned [Westerling et al., 2003] and (c) dry biomass consumption for theperiod 1980–2004. Color scale saturates at respective values.
D20301 SPRACKLEN ET AL.: CLIMATE CHANGE, WILDFIRE AND AEROSOL
11 of 17
D20301

correction factor from Park et al. [2003]. Biofuel OCemissions are from Yevich and Logan [2003] and fromPark et al. [2003] for the United States. In the westernUnited States, we used fire emissions calculated asdescribed in section 2.3, using one member of the ensembleof simulations with random placement of fires within eachecoregion. Outside of the western United States we usedclimatological biomass burning emissions derived fromLobert et al. [1999] with seasonality from Duncan et al.[2003]. We assumed that wildfire emissions are constantacross each month. Biomass burning emissions wereemitted into the boundary layer. The model includessecondary organic aerosol (SOA) formation from biogenicterpenes. Emissions of monoterpenes were calculated usingGuenther et al. [1995] and vary according to temperatureand solar radiation. We did not account for the effects ofchanging CO2 concentrations on vegetation [e.g., Constableet al., 1999] or changing land cover [Sanderson et al., 2003]on biogenic monoterpene emissions. We assumed a 10%carbon yield of hydrophilic OC from terpenes [Chin et al.,2002]. We do not account for the formation of SOA fromisoprene which over the western United Stated may con-tribute a similar amount of SOA to that from monoterpenes[Liao et al., 2007]. A global evaluation of GEOS-Chem ECand OC is given by Chin et al. [2002], and a more detailedevaluation over the United States can be found in the workof Park et al. [2003].
3.2. Impact of Future Wildfires on CarbonaceousAerosol Concentrations
[33] The short lifetime of EC and OC results in concen-trations over the western United States being dominated byemissions from the United States. In the work of Spracklenet al. [2007] we showed that interannual variability inwestern United States wildfire emissions controls much ofthe observed interannual variability in summertime atmo-spheric OC concentrations. Park et al. [2003] showed thattrans-Pacific transport from natural and anthropogenicAsian sources contributes only 2% of the United StatesOC burden. Here we make a first prediction of the impactsof climate change on future carbonaceous aerosol concen-trations in the western United States resulting from a changein the area of western United States fires, assuming thatwildfires outside the western United States remain constant.To isolate the impacts of changes in fires resulting fromchanges in climate, we maintained anthropogenic emissionsof EC and OC from fossil fuel and biofuel sources at theirpresent-day values.
[34] We performed two 5-year simulations for the presentday (1996–2000) and for the mid-21st century (2046–2050). Each model run was initialized with a 1-year spin-up. Figure 10 shows simulated summertime OC and ECconcentrations in the western United States for these twotime periods. Summertime mean concentrations of OCover the western United States increase from 1.4 mg m�3
to 2.1 mg m�3 over 50 years (an increase of 40%) whereasEC increases from 0.18 mg m�3 to 0.21 mg m�3 (18%). Thesmaller fractional increase in EC concentrations is a resultof EC in the western United States being more dominatedby fossil fuel emissions than is OC [Spracklen et al., 2007].The maximum increase in carbonaceous aerosol concen-trations occurs over the northwest United States (Oregon,Washington, Idaho, western Montana, and northernCalifornia, United States) where absolute OC increases 1–4 mg m�3(15–70%) andECaerosol increases 0.05–0.2mgm�3
(10–70%). These large increases in carbonaceous aerosolare caused by the large increase in area burned simulatedfor the Pacific Northwest and Rocky Mountains Forestecoregions (Table 2). The smaller increases in carbonaceousaerosol in the southwest (southern California, Arizona, andNew Mexico) reflect the smaller predicted increases inwildfires in these areas.[35] This projected change in aerosol concentrations is
caused by a combination of different effects includingchanges in wildfire emissions, atmospheric transport, wet
Figure 9. Predicted annual dry biomass consumption bywildfires in the western United States between 1996 and2055 using meteorology from the GISS GCM combinedwith our wildfire regressions (see Table 1). We show resultsas a z score, or standardized departure (the number ofstandard deviations away from the 1996–2005 mean).
Table 5. Annual Mean Dry Biomass Consumption by Wildfire in the Western United States
Ecoregion
Annual Mean Biomass Consumption/Tg
p ValueaObserved Simulated
1980–2004 1996–2005 2046–2055
Pacific Northwest 4.23 6.33 11.31 0.04California Coastal Shrub 0.46 0.61 0.82 0.36Desert Southwest 0.39 0.30 0.42 0.05Nevada Mountains/Semidesert 1.02 1.43 1.48 0.66Rocky Mountains Forest 6.06 4.19 11.51 <0.01Eastern Rocky Mountains/Great Plains 2.07 0.97 0.88 0.88Western U.S. Total 14.2 13.8 26.4 0.01
aStudent’s t test p value calculated from the difference between the present-day and future simulated means.
D20301 SPRACKLEN ET AL.: CLIMATE CHANGE, WILDFIRE AND AEROSOL
12 of 17
D20301
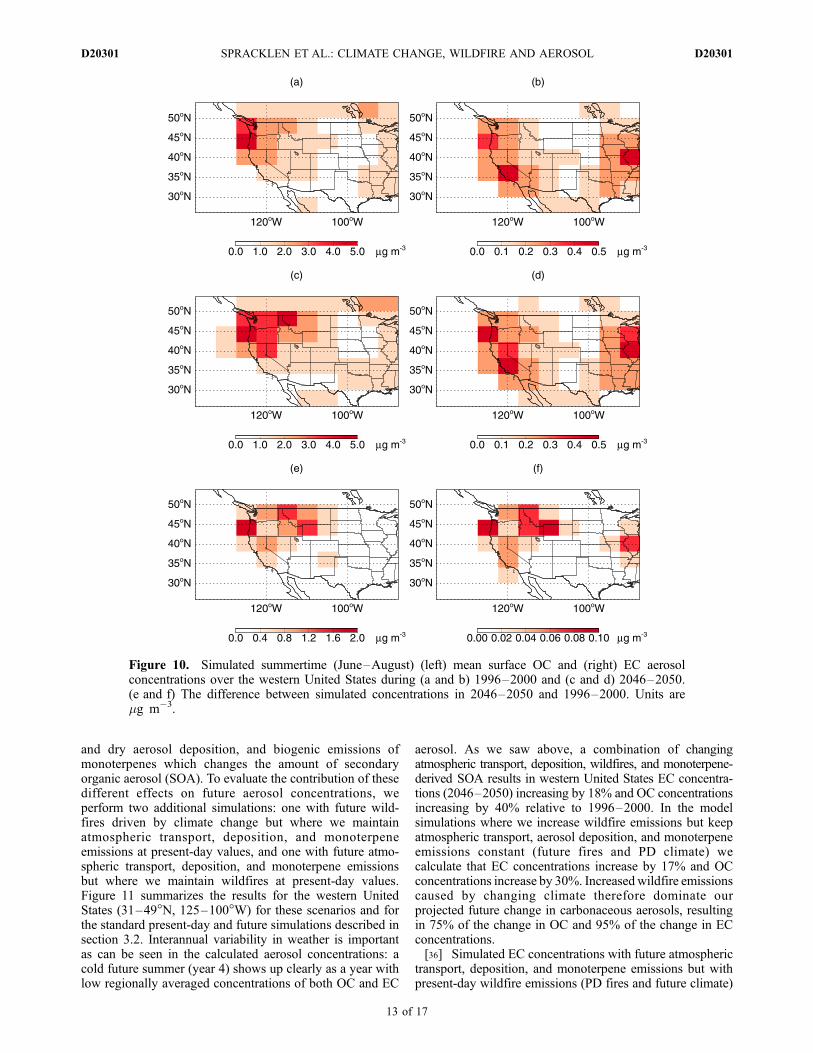
and dry aerosol deposition, and biogenic emissions ofmonoterpenes which changes the amount of secondaryorganic aerosol (SOA). To evaluate the contribution of thesedifferent effects on future aerosol concentrations, weperform two additional simulations: one with future wild-fires driven by climate change but where we maintainatmospheric transport, deposition, and monoterpeneemissions at present-day values, and one with future atmo-spheric transport, deposition, and monoterpene emissionsbut where we maintain wildfires at present-day values.Figure 11 summarizes the results for the western UnitedStates (31–49�N, 125–100�W) for these scenarios and forthe standard present-day and future simulations described insection 3.2. Interannual variability in weather is importantas can be seen in the calculated aerosol concentrations: acold future summer (year 4) shows up clearly as a year withlow regionally averaged concentrations of both OC and EC
aerosol. As we saw above, a combination of changingatmospheric transport, deposition, wildfires, and monoterpene-derived SOA results in western United States EC concentra-tions (2046–2050) increasing by 18% and OC concentrationsincreasing by 40% relative to 1996–2000. In the modelsimulations where we increase wildfire emissions but keepatmospheric transport, aerosol deposition, and monoterpeneemissions constant (future fires and PD climate) wecalculate that EC concentrations increase by 17% and OCconcentrations increase by 30%. Increasedwildfire emissionscaused by changing climate therefore dominate ourprojected future change in carbonaceous aerosols, resultingin 75% of the change in OC and 95% of the change in ECconcentrations.[36] Simulated EC concentrations with future atmospheric
transport, deposition, and monoterpene emissions but withpresent-day wildfire emissions (PD fires and future climate)
Figure 10. Simulated summertime (June–August) (left) mean surface OC and (right) EC aerosolconcentrations over the western United States during (a and b) 1996–2000 and (c and d) 2046–2050.(e and f) The difference between simulated concentrations in 2046–2050 and 1996–2000. Units aremg m�3.
D20301 SPRACKLEN ET AL.: CLIMATE CHANGE, WILDFIRE AND AEROSOL
13 of 17
D20301

increase by only 3%. Using the same GISS model, Wu et al.[2008] calculated a 5% decrease in afternoon mixing depthsover the northwest in the future climate, which wouldincrease EC concentrations. However, this effect is offsetby increasing precipitation in this region which will increaseaerosol wet deposition and reduce EC concentrations. Con-centrations of OC in the future climate, but with present-daywildfires, are 14% greater than present day. Most of thischange (80%) is caused by increasing temperature drivingincreased monoterpene emissions and SOA formation, withthe remainder caused by changing atmospheric transportand aerosol deposition. The temperatures projected by theGISS model combined with the Guenther et al. [1995]biogenic emissions algorithm predict a 20% increase inmonoterpene emissions in the United States by 2050.Biogenic emissions of isoprene may also change in thefuture resulting in an additional change to SOA that is notconsidered here. However, the projected future change inisoprene emissions is currently uncertain [Heald et al.,2009].
4. Discussion and Conclusions
[37] We have quantified for the first time the effect ofchanging wildfire activity in a warming climate oncarbonaceous aerosol concentrations in the western United
States in future decades. We used stepwise linear regressionto derive relationships between observed meteorology andobserved wildfire area burned for 1980–2004. Our regres-sions are ecosystem dependent, with temperature and fuelmoisture explaining 24–57% of the variance in annual areaburned. Our focus is on the prediction of wildfire in forestdominated ecosystems that contribute most substantially tocarbonaceous aerosol emissions because of their greater fuelloads. Our approach works well for these ecosystems wherethe meteorology of the particular fire season has thedominant control on fire, but less well for shrub and grassdominated ecosystems where fuel loads, and hence wildfire,is strongly influenced by the previous year’s precipitation[Littell et al., 2009].[38] Following the IPCC A1B greenhouse gas scenario,
the GISS GCM predicts a 2 K increase in summertimetemperature and a �7% increase in summertime precipita-tion by midcentury in the western United States. Thesepredicted changes in climate increase projected area burnedin the western United States in 2046–2055 by 54% relativeto 1996–2005. Predicted changes to area burned varyregionally, from no change to an increase of 175%, becauseof regional changes in simulated climate combined withvarying ecosystem response to a changing climate. Thelargest increases in area burned are projected for the PacificNorthwest (78%) and Rocky Mountains Forest (175%)ecoregions where wildfire appears to depend most stronglyon temperature. This is consistent with the change inwildfire activity observed in the western United States overthe past few decades; sixty percent of the observed increasein large (>400 ha) forest fire area burned that occurredbetween 1970–1986 and 1987–2003 was located in thenorthern Rockies, and 18% in the Sierra Nevada, Cascades,and coast ranges of Oregon and California [Westerling etal., 2006]. Our method projects little change in area burnedby 2050 for the Nevada Mountains/Semidesert and EasternRockyMountains/Great Plains ecoregions because simulatedincreases in precipitation compensate for increases intemperature in these regions.[39] We use the GEOS-ChemCTM, driven by meteorology
from the GISS GCM, to predict changes in carbonaceousaerosol concentrations over the western United States. Wepredict that mean summertime OC concentrations in 2046–2050 increase by 40% (from 1.5 to 2.1 mg m�3), and ECconcentrations increase by 18% (from 0.18 to 0.22 mg m�3)relative to 1996–2000. The largest projected increases arein the northwest United States, colocated with the greatestincreases in wildfire. Most of the increase in carbonaceousaerosol concentrations (95% for EC and 75% for OC) iscaused by increases in wildfire emissions, which are pre-dicted to increase by 90%. Changes in meteorology thatoccur between present day and midcentury contribute about5–10% of the predicted change in carbonaceous aerosolconcentrations. For OC, the remainder of the change (20%)is caused by the predicted increase in monoterpene emis-sions, due to rising temperature, and the resulting increasein secondary organic aerosol formation which has beenpreviously predicted [Heald et al., 2008].[40] In common with previous studies of future wildfires,
there are limitations in this study. We did not account forchanges to vegetation, ignition, the length of fire season, orhuman activity on future area burned. Future wildfires may
Figure 11. Simulated summertime average (June–August)surface concentrations of (a) OC and (b) EC in the westernUnited States (31�–49�N, 125�–100�W) for (1) present-day wildfires (1996–2000) and present-day climate(circles), (2) present-day wildfires but with future (2046–2050) climate (upward triangles), (3) future wildfiresbut with present-day climate (diamonds), and (4) futurewildfires and future climate (downward triangles).
D20301 SPRACKLEN ET AL.: CLIMATE CHANGE, WILDFIRE AND AEROSOL
14 of 17
D20301

be modified by changes in the distribution of vegetationcaused either by direct anthropogenic land-use change or byclimate change. In this paper, we considered a 50-yeartimescale over which vegetation will not change substan-tially, unless it is driven by wildfire [McKenzie et al., 2004]or pest outbreaks [Logan et al., 2003; Hicke et al., 2006].Changes to wildfire due to changes in lightning frequency[Price and Rind, 1994] and change to anthropogenic igni-tion [Wotton et al., 2003] are also not considered here. Alonger wildfire season is possible in a future climate, and anearlier start to the wildfire season has already been observedin the western United States [Westerling et al., 2006]. Wepredict annual area burned and do not explore possiblechanges in the length of the fire season. Consequently, wefocused on the air quality impact of wildfires in summer(June–August). This is the period of greatest wildfireactivity and also the period when air quality degradationfrom wildfires is at its worst. However, longer wildfireseasons in the future may extend the negative impacts on airquality further into the spring and autumn.[41] We assume that fuel consumption per unit area
burned does not change over our simulation period. Inreality, both fuel loads and fire severity may change,altering future fuel consumption. Increased wildfire areaburned may drive reduced fire return intervals, vegetationstand age, and fuel consumption per unit area burned[Fellows and Goulden, 2008]. We estimated the maximumreduction in fuel consumption this effect can have byassuming no recovery of vegetation after a wildfire, suchthat areas that reburn over the period 1996–2055 result inno fuel consumption. With this assumption we calculate thatbiomass consumption in the western United States in 2046–2055 is 18% less than when we assume constant fuelconsumption. Changes in vegetation caused by climatechange, anthropogenic activity, or pest outbreaks willfurther affect fuel loads. Fuel consumption is also impactedby potential changes in fire severity. Climate change(increased temperature and wind speeds and reduced fuelmoisture) may drive increases in fire severity, and henceincreases in biomass consumption per unit area. A recentstudy has made the first projections of future wildfireemissions accounting for both changes in area burned andfire severity. Amiro et al. [2009] find that changes inwildfire biomass consumption from forest floor fuels inthe Canadian boreal forest region are dominated by changesin area burned which are projected to increase by 93% undera 3 � CO2 scenario. Under the same scenario, changes infire severity are projected to increase biomass consumptionby 0–18%, depending on the ecosystem. The impact ofchanging climate on fire severity in the western UnitedStates, where the forest types differ from those studiedby Amiro et al. [2009], is currently not known. Thesecombined changes in fuel loads and fire severity will likelyhave important impacts on future biomass consumption,either amplifying or suppressing the projected change inwildfire emissions calculated in this work.[42] The vertical extent of wildfire emissions is a further
uncertainty in our projected future aerosol concentrations.There is evidence that some fraction of wildfire emissionsare injected above the boundary layer [Leung et al., 2007;Mazzoni et al., 2007; Kahn et al., 2007]. How this injectionheight will vary in the future with potential changes in fire
severity and changes in atmospheric stability is alsouncertain. In this study we have assumed wildfire emissionsare injected into the boundary layer, and we do not considerany future change.[43] This study has explored the role of future climate
change on wildfire in the western United States. In thiswork we have evaluated the impacts of future climatechange on wildfire area burned and carbonaceous aerosolconcentrations over the western United States. We have notbeen able to account for the full set of variables andprocesses which are likely to control future wildfire emis-sions. In particular, future studies need to account forpotential changes in vegetation, fuel loading (within thesame vegetation type), fire severity, and fire ignition under achanging climate. In addition, it is important to explore thepotential uncertainty associated with climate model projec-tions, anthropogenic greenhouse gas emission scenarios,and fire prediction tools. Our predicted increase in wildfirehas potential implications for ecology, carbon balance, landmanagement, and fire suppression in western forests. In thiswork we focussed on the impacts of changing wildfire oncarbonaceous aerosol concentrations. We predict summer-time mean OC concentrations across the western UnitedStates to increase by 40% and EC concentrations to increaseby 20% by midcentury relative to present day. This increasewill have negative impacts on atmospheric visibility andhuman health. Carbonaceous aerosol currently accounts for40% of fine aerosol mass in the western United States[Malm et al., 2004]. Assuming other aerosol componentsremain unchanged, carbonaceous aerosol will account for�50% of fine aerosol mass by midcentury. Future work isrequired to extend this study to the boreal forests of NorthAmerica and Siberia, expand the impact to other atmosphericspecies such as ozone, and to study the potential climatefeedbacks of increased wildfire [Randerson et al., 2006].
[44] Acknowledgments. This work was funded by the NationalAeronautics and Space Administration (NASA-MAP grant NNG06GB48G)and STAR Research Assistance agreement RD-83227501-0 awarded by theU.S. Environmental Protection Agency (EPA). This publication has not beenformally reviewed by the EPA. The views expressed in this document aresolely those of the authors, and the EPA does not endorse any products orcommercial services mentioned in this publication.
ReferencesAllen, C., M. Savage, D. Falk, K. Suckling, T. Swetnam, T. Schulke,P. Stacey, P. Morgan, M. Hoffman, and J. Klingel (2002), Ecologicalrestoration of southwestern ponderosa pine ecosystems: A broadperspective, Ecol. Appl., 12(5), 1418–1433.
Amiro, B. D., A. Cantin, M. D. Flannigan, and W. de Groot (2009), Futureemissions from Canadian boreal forest fires, Can. J. For. Res., 39, 383–395.
Andreae, M., and P. Merlet (2001), Emission of trace gases and aerosolsfrom biomass burning, Global Biogeochem. Cycles, 15, 955–956.
Bailey, R., P. Avers, T. King, and W. McNab (1994), Ecoregions and sub-regions of the United States (map), technical report, USDA For. Serv.,Washington, D. C.
Balling, R., G. Meyer, and S. Wells (1992), Relation of surface climate andburned area in Yellowstone National Park, Agricul. For. Meteorol., 60(3–4),285–293.
Bergeron, Y.-P., and M. Flannigan (1995), Predicting the effects of climatechange on fire frequency in the southeastern Canada boreal forest, WaterAir Soil Pollut., 82, 437–444.
Bey, I., D. Jacob, R. Yantosca, J. Logan, B. Field, A. Fiore, Q. Li,H. Liu, L. Mickley, and M. Schultz (2001), Global modeling of tropo-spheric chemistry with assimilated meteorology: Model description andevaluation, J. Geophys. Res., 106, 23,073–23,096.
D20301 SPRACKLEN ET AL.: CLIMATE CHANGE, WILDFIRE AND AEROSOL
15 of 17
D20301

Brown, T., B. Hall, and A. Westerling (2004), The impact of twenty-firstcentury climate change on wildland fire danger in the western UnitedStates: An applications perspective, Clim. Change, 62(1–3), 365–388.
Chin, M., P. Ginoux, S. Kinne, O. Torres, B. Holben, B. Duncan, R. Martin,J. Logan, A. Higurashi, and T. Nakajima (2002), Tropospheric aerosoloptical thickness from the GOCART model and comparisons withsatellite and sunphotometer measurements, J. Atmos. Sci., 59, 461–483.
Christensen, J., et al. (2007), Regional climate projections, in ClimateChange 2007: The Physical Science Basis. Contribution of WorkingGroup I to the Fourth Assessment Report of the Intergovernmental Panelon Climate Change, edited by S. Solomon et al., pp. 890 – 891,Cambridge Univ. Press, Cambridge, U. K.
Chung, S., and J. Seinfeld (2002), Global distribution and climate forcing ofcarbonaceous aerosols, J. Geophys. Res., 107(D19), 4407, doi:10.1029/2001JD001397.
Constable, J., A. Guenther, D. Schimel, and R. Monson (1999), Modelingchanges in VOC emission in response to climate change in the continentalUnited States, Global Change Biol., 5, 791–806.
Cooke, W., C. Liousse, H. Cachier, and J. Feichter (1999), Construction ofa 1� � 1� fossil fuel emission data set for carbonaceous aerosol andimplementation and radiative impact in the ECHAM-4 model, J. Geo-phys. Res., 104, 22,137–22,162.
DeBell, L., R. Talbot, J. Dibb, J. Munger, E. Fischer, and S. Frolking (2004),A major regional air pollution event in the northeastern United Statescaused by extensive forest fires in Quebec, J. Geophys. Res., 109,D19305, doi:10.1029/2004JD004840.
Duck, T., et al. (2007), Transport of forest fire emissions from Alaska andthe Yukon Territory to Nova Scotia during summer 2004, J. Geophys.Res., 112, D10S44, doi:10.1029/2006JD007716.
Duffy, P., J. Walsh, J. Graham, D. Mann, and T. Rupp (2005), Impacts oflarge-scale atmospheric-ocean variability on Alaskan fire season severity,Ecol. Appl., 15(4), 1317–1330.
Duncan, B., R. Martin, A. Staudt, R. Yevich, and J. Logan (2003), Inter-annual and seasonal variability of biomass burning emissions constrainedby satellite observations, J. Geophys. Res., 108(D2), 4100, doi:10.1029/2002JD002378.
Fellows, A., and M. Goulden (2008), Has fire suppression increased theamount of carbon stored in western U.S. forests?, Geophys. Res. Lett., 35,L12404, doi:10.1029/2008GL033965.
Flannigan, M., and C. Van Wagner (1991), Climate change and wildfire inCanada, Can. J. For. Res., 21(1), 66–72.
Flannigan, M., B. Stocks, and B. Wotton (2000), Climate change and forestfires, Sci. Total Environ., 262(3), 221–229.
Flannigan, M., I. Campbell, M. Wotton, C. Carcaillet, P. Richard, andY. Bergeron (2001), Future fire in Canada’s boreal forest: Paleoecologyresults and general circulation model: Regional climate model simulations,Can. J. For. Res., 31(5), 854–864.
Flannigan, M., K. Logan, B. Amiro, W. Skinner, and B. Stocks (2005),Future area burned in Canada, Clim. Change, 72(1–2), 1–16.
Gedalof, Z., D. Peterson, and N. Mantua (2005), Atmospheric, climatic, andecological controls on extreme wildfire years in the northwestern UnitedStates, Ecol. Appl., 15, 154–174.
Gillett, N., A. Weaver, F. Zwiers, and M. Flannigan (2004), Detecting theeffect of climate change on Canadian forest fires, Geophys. Res. Lett., 31,L18211, doi:10.1029/2004GL020876.
Girardin, M. (2007), Interannual to decadal changes in area burned inCanada from 1781 to 1982 and the relationship to Northern Hemisphereland temperatures, Global Ecol. Biogeogr., 16(5), 557–566.
Guenther, A., et al. (1995), A global model of natural volatile organiccompound emission, J. Geophys. Res., 100(D5), 8873–8892.
Hansen, J., et al. (2002), Climate forcing in Goddard Institure for SpaceStudies SI2000 simulations, J. Geophys. Res., 107(D18), 4347,doi:10.1029/2001JD001143.
Heald, C., et al. (2008), Predicted change in global secondary organicaerosol concentrations in response to future climate, emissions, and landuse change, J. Geophys. Res., 113, D05211, doi:10.1029/2007JD009092.
Heald, C. L., M. J. Wilkinson, R. K. Monson, C. A. Alo, G. Wang, andA. Guenther (2009), Response of isoprene emission to ambient CO2
changes and implications for global budgets, Global Change Biol.,15(4), 1127–1140.
Hicke, J., J. Logan, J. Powell, and D. Ojima (2006), Changing temperaturesinfluence suitability for modeled mountain pine beetle (Dendroctonusponderosae) outbreaks in the western United States, J. Geophys. Res.,111, G02019, doi:10.1029/2005JG000101.
Hodzic, A., S. Madronich, S. Massie, L. Menut, and C. Wiedinmyer (2007),Wildfire particulate matter in Europe during summer 2003: Meso-scalemodeling of smoke emissions, transport and radiative effects, Atmos.Chem. Phys., 7, 4043–4064.
Houghton, J. (Ed.) (2001), Climate Change 2001: The Scientific Basis,Cambridge Univ. Press, Cambridge, U. K.
Jaffe, D., I. Bertschi, L. Jaegle, P. Novelli, J. Reid, H. Tanimoto,R. Vingarzan, and D. Westphal (2004), Long-range transport of Siberianbiomass burning emissions and impact on surface ozone in western NorthAmerica, Geophys. Res. Lett., 31, L16106, doi:10.1029/2004GL020093.
Jaffe, D., D. Chand, W. Hafner, A. Westerling, and D. Spracklen (2008a),Influence of fires on O3 Concentrations in the western U.S., Environ. Sci.Technol., 42(16), 5885–5891.
Jaffe, D., W. Hafner, D. Chand, A. Westerling, and D. Spracklen (2008b),Interannual variations in PM2.5 due to wildfires in the western UnitedStates, Environ. Sci. Technol., 42(8), 2812–2818.
Kahn, R., W.-H. Li, C. Moroney, D. Diner, J. Martonchik, andE. Fishbein (2007), Aerosol source plume physical characteristics fromspace-based multiangle imaging, J. Geophys. Res., 112, D11205,doi:10.1029/2006JD007647.
Kasischke, E., and M. Turetsky (2006), Recent changes in the fire regimeacross the North American boreal region: Spatial and temporal patterns ofburning across Canada and Alaska, Geophys. Res. Lett., 33, L09703,doi:10.1029/2006GL025677.
Lapina, K., R. Honrath, R. Owen, M. Martin, and G. Pfister (2006),Evidence of significant large-scale impacts of boreal fires on ozone levelsin the midlatitude Northern Hemisphere free troposphere, Geophys. Res.Lett., 33, L10815, doi:10.1029/2006GL025878.
Leung, F.-Y., J. Logan, R. Park, E. Hyer, E. Kasischke, D. Streets, andL. Yurganov (2007), Impacts of enhanced biomass burning in theboreal forests in 1998 on tropospheric chemistry and the sensitivityof model results to the injection height of emissions, J. Geophys. Res.,112, D10313, doi:10.1029/2006JD008132.
Lewis, A., et al. (2007), Chemical composition observed over the mid-Atlantic and the detection of pollution signatures far from source regions,J. Geophys. Res., 112, D10S39, doi:10.1029/2006JD007584.
Liao, H., D. Henze, J. Seinfeld, S. Wu, and L. Mickley (2007), Biogenicsecondary organic aerosol over the United States: Comparison ofclimatological simulations with observations, J. Geophys. Res., 112,D06201, doi:10.1029/2006JD007813.
Littell, J. S., D. McKenzie, D. L. Peterson, and A. L. Westerling (2009),Climate and ecoprovince fire area burned in western U.S. ecoprovinces,1916–2003, Ecol. Appl., 19(4), 1003–1021.
Lobert, J., W. Keene, J. Logan, and R. Yevich (1999), Global chlorineemissions from biomass burning: The reactive chlorine emissions inventory,J. Geophys. Res., 104, 8373–8390.
Logan, J., J. Regniere, and J. Powell (2003), Assessing the impacts ofglobal warming on forest pest dynamics, Frontiers Ecol. Environ.,1(3), 130–137.
Malm, W., B. Schichtel, M. Pitchford, L. Ashbaugh, and R. Eldred (2004),Spatial and monthly trends in speciated fine particle concentration in theUnited States, J. Geophys. Res. , 109, D03306, doi:10.1029/2003JD003739.
Mazzoni, D., J. Logan, D. Diner, R. Kahn, L. Tong, and Q. Li (2007), Adata-mining approach to associating MISR smoke plume heights withMODIS fire measurements, Remote Sens. Environ., 107(1–2), 138–148.
McKenzie, D., Z. Gedalof, D. Peterson, and P. Mote (2004), Climaticchange, wildfire, and conservation, Conserv. Biol., 18(4), 890–902.
McKenzie, D., S. O’Neill, N. Larkin, and R. Norheim (2006), Integratingmodels to predict regional haze from wildland fire, Ecol. Modell., 199,278–288.
McKenzie, D., C. Raymond, L.-K. Kellogg, R. Norheim, A. Andreu,A. Bayard, K. Kopper, and E. Elman (2007), Mapping fuels atmultiple scales: landscape application of the Fuel CharacteristicClassification System, Can. J. For. Res., 37, 2421–2437.
McMeeking, G., S. Kreidenweis, C. Carrico, T. Lee, J. Collett, andW. Malm (2005), Observations of smoke-influenced aerosol duringthe Yosemite Aerosol Characterization Study: Size distributions andchemical composition, J. Geophys. Res., 110, D09206, doi:10.1029/2004JD005389.
McMeeking, G., et al. (2006), Smoke-impacted regional haze in Californiaduring the summer of 2002, Agricul. For. Meteorol., 137(1–2), 25–42.
Moriondo, M., P. Good, R. Durao, M. Bindi, C. Giannakopoulos, andJ. Corte-Real (2006), Potential impact of climate change on fire riskin the Mediterranean area, Clim. Res., 31(1), 85–95.
Noss, R., J. Franklin, W. Baker, T. Schoennagel, and P. Moyle (2006),Managing fire-prone forests in the western United States, Frontiers Ecol.Environ., 4(9), 481–487.
Ottmar, R., D. Sandberg, C. Riccardi, and S. Prichard (2007), An overviewof the fuel characteristic classification system: Quantifying, classifying,and creating fuelbeds for resource planning, Can. J. For. Res., 37(12),2383–2393.
Park, R., D. Jacob, M. Chin, and R. Martin (2003), Sources of carbonaceousaerosols over the United States and implications for natural visibility,J. Geophys. Res., 108(D12), 4355, doi:10.1029/2002JD003190.
D20301 SPRACKLEN ET AL.: CLIMATE CHANGE, WILDFIRE AND AEROSOL
16 of 17
D20301
Park, R., D. Jacob, and J. Logan (2007), Fire and biofuel contributions toannual mean aerosol mass concentrations in the United States, Atmos.Environ., 41, 7389–7400.
Pfister, G., C. Wiedinmyer, and L. Emmons (2008), Impacts of the fall2007 California wildfires on surface ozone: Integrating local observationswith global model simulations, Geophys. Res. Lett., 35, L19814,doi:10.1029/2008GL034747.
Price, C., and D. Rind (1994), The impact of a 2-X-CO2 climate on lightning-caused fires, J. Clim., 7(10), 1484–1494.
Randall, D. (2004), Strawman-approach for technical refinement of largefires and fire complexes for wrap phase 1 fire emissions inventory, Tech.Rep. 178-6, Air Sci. Inc., Portland, Or.
Randerson, J., et al. (2006), The impact of boreal forest fire on climatewarming, Science, 314(5802), 1130–1132.
Riccardi, C., R. Ottmar, D. Sandberg, A. Andreu, E. Elman, K. Kopper, andJ. Long (2007), The fuelbed: A key element of the fuel characteristicclassification system, Can. J. For. Res., 37(12), 2394–2412.
Rind, D., J. Lerner, J. Jonas, and C. McLinden (2007), Effects of resolutionand model physics on tracer transports in the NASA Goddard Institute forSpace Studies general circulation models, J. Geophys. Res., 112, D05302,doi:10.1029/2006JD007801.
Sanderson, M., C. Jones, W. Collins, C. Johnson, and R. Derwent (2003),Effect of climate change on isoprene emissions and surface ozone levels,Geophys. Res. Lett., 30(18), 1936, doi:10.1029/2003GL017642.
Schmidt, G., et al. (2006), Present-day atmospheric simulations using GISSModelE: Comparison to in-situ, satellite and reanalysis data, J. Clim., 19,doi:10.1175/JCLI3612.1.
Seager, R., et al. (2007), Simulated changes in temperature are generallymore consistent between different climate model simulations thanchanges in precipitation or wind speed, Science , 316(1181),doi:10.1126/science.1139601.
Skinner, W., B. Stocks, D. Martell, B. Bonsal, and A. Shabbar (1999), Theassociation between circulation anomalies in the mid-troposphere andarea burned by wildland fire in Canada, Theoret. Appl. Climatol., 63,89–105.
Skinner, W., A. Shabbar, M. Flannigan, and K. Logan (2006), Large forestfires in Canada and the relationship to global sea surface temperatures,J. Geophys. Res., 111, D14106, doi:10.1029/2005JD006738.
Spracklen, D., J. Logan, L. Mickley, R. Park, R. Yevich, A. Westerling, andD. Jaffe (2007), Wildfires drive interannual variability of organic carbonaerosol in the western U.S. in summer, Geophys. Res. Lett., 34, L16816,doi:10.1029/2007GL030037.
Stocks, B., et al. (1998), Climate change and forest fire potential in Russianand Canadian boreal forests, Clim. Change, 38(1), 1–13.
Stocks, B., et al. (2002), Large forest fires in Canada, 1959–1997,J. Geophys. Res., 107, 8149, doi:10.1029/2001JD000484, [printed108(D1), 2003].
Tymstra, C., M. Flannigan, O. Armitage, and K. Logan (2007), Impact ofclimate change on area burned in Alberta’s boreal forest, Int. J. WildlandFire, 16(2), 153–160.
Val Martin, M., R. Honrath, R. Owen, G. Pfister, P. Fialho, andF. Barate (2006), Significant enhancements of nitrogen oxides, blackcarbon, and ozone in the North Atlantic lower free troposphere resultingfrom North American boreal wildfires, J. Geophys. Res., 111, D23S60,doi:10.1029/2006JD007530.
Van Wagner, C. (1987), The development and structure of the CanadianForest Fire weather index system, Tech. Rep. 35, Can. For. Serv., Ottawa,Ont., Canada.
van Wagtendonk, J., J. Benedict, and W. Sydoriak (1998), Fuel bedcharacteristics of Sierra Nevada conifers, W. J. Appl. For., 13, 73–84.
Westerling, A., and B. Bryant (2008), Climate change and wildfire inCalifornia, Clim. Change, 87, S231–S249.
Westerling, A., A. Gershunov, D. Cayan, and T. Barnett (2002), Long leadstatistical forecasts of area burned in western U.S. wildfires by ecosystemprovince, Int. J. Wildland Fire, 11(3,4), 257–266.
Westerling, A., A. Gershunov, T. Brown, D. Cayan, and M. Dettinger(2003), Climate and wildfire in the western United States, Bull. Am.Meteorol. Soc., 84(5), 595–604.
Westerling, A., H. Hidalgo, D. Cayan, and T. Swetnam (2006), Warmingand earlier spring increases western U.S. forest wildfire activity, Science,313(5789), 940–943.
Wotowa, G., and M. Trainer (2000), The influence of Canadian forest fireson pollutant concentrations in the United States, Science, 288, 324–328.
Wotton, B., and M. Flannigan (1993), Length of the fire season in achanging climate, For. Chronicle, 69(2), 187–192.
Wotton, B., D. Martell, and K. Logan (2003), Climate change and people-caused forest fire occurrence in Ontario, Clim. Change, 60, 275.
Wu, S., L.Mickley, D. Jacob, J. Logan, R. Yantosca, and D. Rind (2007),Whyare there large differences betweenmodels in global budgets of troposphericozone, J. Geophys. Res., 112, D05302, doi:10.1029/2006JD007801.
Wu, S., L. J. Mickley, E. M. Leibensperger, D. J. Jacob, D. Rind, andD. G. Streets (2008), Effects of 2000–2050 global change on ozone airquality in the United States, J. Geophys. Res., 113, D06302, doi:10.1029/2007JD008917.
Yevich, R., and J. Logan (2003), An assessment of biofuel use and burningof agricultural waste in the developing world, Global Biogeochem.Cycles, 17(4), 1095, doi:10.1029/2002GB001952.
�����������������������M. D. Flannigan, Great Lakes Forestry Centre, Canadian Forest Service,
1219 Queen Street East, Sault Ste. Marie, ON P6A 2E5, Canada.R. C. Hudman, Department of Chemistry, University of California,
Berkeley, CA 94720-1460, USA.J. A. Logan, L. J. Mickley, and R. Yevich, School of Engineering and
Applied Sciences, Harvard University, 109A Pierce Hall, 29 Oxford Street,Cambridge, MA 02138, USA.D. V. Spracklen, Institute for Atmospheric Science, School of Earth and
Environment, University of Leeds, Leeds LS2 9JT, UK. ([email protected])A. Westerling, Sierra Nevada Research Institute, University of California,
5200 North Lake Road, Merced, CA 95343, USA.
D20301 SPRACKLEN ET AL.: CLIMATE CHANGE, WILDFIRE AND AEROSOL
17 of 17
D20301
Related Documents


![Airborne measurements of carbonaceous aerosol soluble in ... · recently been used to quantify carbonaceous aerosol online from aircraft [Bahreini et al., 2003]. These methods provide](https://static.cupdf.com/doc/110x72/5f12744e800d890f890d626f/airborne-measurements-of-carbonaceous-aerosol-soluble-in-recently-been-used.jpg)


