Impacts of an emission based private car taxation policy – First year ex-post analysis Fionn Rogan a,b , Emer Dennehy a,b,c , Hannah Daly a,b , Martin Howley c , Brian P. Ó Gallachóir a,b,⇑ a Sustainable Energy Research Group, Department of Civil and Environmental Engineering, University College Cork, Cork, Ireland b Environmental Research Institute, University College Cork, Cork, Ireland c Sustainable Energy Ireland, Energy Policy Statistical Support Unit, Building 2100, Cork Airport Business Park, Co. Cork, Ireland article info Article history: Received 23 February 2010 Received in revised form 3 March 2011 Accepted 29 March 2011 Available online xxxx Keywords: Transport energy Private car CO 2 emissions reduction Climate change policy Ex-post analysis Ireland abstract This paper assesses the impacts of a targeted policy designed to influence car purchasing trends towards lower CO 2 emitting vehicles. Vehicle registration tax and annual motor tax rates in Ireland changed in July 2008 from being based on engine size to emissions per- formance of cars. This paper provides a one year ex-post analysis of the first year of the tax change, tracking the change in purchasing trends arising from the measure related to spe- cific CO 2 emissions, engine size and fuel, and the implications for car prices, CO 2 emissions abatement, and revenue gathered. While engine efficiency improvements had been offset by purchasing trends towards larger and generally less efficient cars in the past, with the average MJ/km remaining constant from 2000 to 2007, this analysis shows that in the first year of the new taxation system the average specific emissions of new cars fell by 13% to 145 g/km. This was brought about, not by a reduction in engine size, but rather through a significant shift to diesel cars. Despite an unexpected reduction in car sales due to a reces- sion in 2008, the policy measure has had a larger than anticipated impact on CO 2 emis- sions, calculated to be 5.9 ktCO 2 in the first year of the measure. The strong price signal did however result in a 33% reduction in tax revenue from VRT, in financial terms amount- ing to a drop of €166 million compared to a baseline situation. Ó 2011 Elsevier Ltd. All rights reserved. 1. Introduction Private car transport is a key component of rising transport energy demand, accounting for 46% within the European Un- ion (EC, 2008). Technological improvements have led to a rise in vehicles’ fuel economy, but trends towards heavier and lar- ger engine sized cars has offset these benefits (Ó Gallachóir et al., 2009; Van den Brink and Van Wee, 2001). Fiscal policies have sought to counter these trends and internalise the negative externalities associated with increasing energy use and emissions from cars by incentivising the purchase of lower emitting cars (Mandell, 2009). This paper analyses one such policy introduced in Ireland in 2008 which targeted car purchasing trends by changing the vehicle registration tax (VRT) and annual motor tax (AMT) system in order to ensure that the efficiency gains achieved by private car manufacturers are not offset by purchasing trends. Private car taxation changed from being based on the engine size of cars (in terms of swept volume inside the cylinders, in cm 3 [cubic centimetres, cc]) to the CO 2 performance of cars (in terms of specific CO 2 emissions, g/km). The paper builds on and extends previous analysis (Ó Gallachóir et al., 2009) that showed the rationale for the policy, namely the failure of efficiency improvements to lead to an improvement in the weighted average performance of new cars entering the Irish private car fleet. 0965-8564/$ - see front matter Ó 2011 Elsevier Ltd. All rights reserved. doi:10.1016/j.tra.2011.03.007 ⇑ Corresponding author at: Sustainable Energy Research Group, Department of Civil and Environmental Engineering, University College Cork, Cork, Ireland. Tel.: +353 21 4903037; fax: +353 21 4276648. E-mail address: [email protected] (B.P. Ó Gallachóir). Transportation Research Part A xxx (2011) xxx–xxx Contents lists available at ScienceDirect Transportation Research Part A journal homepage: www.elsevier.com/locate/tra Please cite this article in press as: Rogan, F., et al. Impacts of an emission based private car taxation policy – First year ex-post analysis. Transport. Res. Part A (2011), doi:10.1016/j.tra.2011.03.007

Welcome message from author
This document is posted to help you gain knowledge. Please leave a comment to let me know what you think about it! Share it to your friends and learn new things together.
Transcript
Transportation Research Part A xxx (2011) xxx–xxx
Contents lists available at ScienceDirect
Transportation Research Part A
journal homepage: www.elsevier .com/locate / t ra
Impacts of an emission based private car taxation policy – First yearex-post analysis
Fionn Rogan a,b, Emer Dennehy a,b,c, Hannah Daly a,b, Martin Howley c, Brian P. Ó Gallachóir a,b,⇑a Sustainable Energy Research Group, Department of Civil and Environmental Engineering, University College Cork, Cork, Irelandb Environmental Research Institute, University College Cork, Cork, Irelandc Sustainable Energy Ireland, Energy Policy Statistical Support Unit, Building 2100, Cork Airport Business Park, Co. Cork, Ireland
a r t i c l e i n f o
Article history:Received 23 February 2010Received in revised form 3 March 2011Accepted 29 March 2011Available online xxxx
Keywords:Transport energyPrivate carCO2 emissions reductionClimate change policyEx-post analysisIreland
0965-8564/$ - see front matter � 2011 Elsevier Ltddoi:10.1016/j.tra.2011.03.007
⇑ Corresponding author at: Sustainable Energy RIreland. Tel.: +353 21 4903037; fax: +353 21 42766
E-mail address: [email protected] (B.P. Ó Gall
Please cite this article in press as: Rogan, F., eTransport. Res. Part A (2011), doi:10.1016/j.tr
a b s t r a c t
This paper assesses the impacts of a targeted policy designed to influence car purchasingtrends towards lower CO2 emitting vehicles. Vehicle registration tax and annual motortax rates in Ireland changed in July 2008 from being based on engine size to emissions per-formance of cars. This paper provides a one year ex-post analysis of the first year of the taxchange, tracking the change in purchasing trends arising from the measure related to spe-cific CO2 emissions, engine size and fuel, and the implications for car prices, CO2 emissionsabatement, and revenue gathered. While engine efficiency improvements had been offsetby purchasing trends towards larger and generally less efficient cars in the past, with theaverage MJ/km remaining constant from 2000 to 2007, this analysis shows that in the firstyear of the new taxation system the average specific emissions of new cars fell by 13% to145 g/km. This was brought about, not by a reduction in engine size, but rather through asignificant shift to diesel cars. Despite an unexpected reduction in car sales due to a reces-sion in 2008, the policy measure has had a larger than anticipated impact on CO2 emis-sions, calculated to be 5.9 ktCO2 in the first year of the measure. The strong price signaldid however result in a 33% reduction in tax revenue from VRT, in financial terms amount-ing to a drop of €166 million compared to a baseline situation.
� 2011 Elsevier Ltd. All rights reserved.
1. Introduction
Private car transport is a key component of rising transport energy demand, accounting for 46% within the European Un-ion (EC, 2008). Technological improvements have led to a rise in vehicles’ fuel economy, but trends towards heavier and lar-ger engine sized cars has offset these benefits (Ó Gallachóir et al., 2009; Van den Brink and Van Wee, 2001). Fiscal policieshave sought to counter these trends and internalise the negative externalities associated with increasing energy use andemissions from cars by incentivising the purchase of lower emitting cars (Mandell, 2009).
This paper analyses one such policy introduced in Ireland in 2008 which targeted car purchasing trends by changing thevehicle registration tax (VRT) and annual motor tax (AMT) system in order to ensure that the efficiency gains achieved byprivate car manufacturers are not offset by purchasing trends. Private car taxation changed from being based on the enginesize of cars (in terms of swept volume inside the cylinders, in cm3 [cubic centimetres, cc]) to the CO2 performance of cars (interms of specific CO2 emissions, g/km). The paper builds on and extends previous analysis (Ó Gallachóir et al., 2009) thatshowed the rationale for the policy, namely the failure of efficiency improvements to lead to an improvement in theweighted average performance of new cars entering the Irish private car fleet.
. All rights reserved.
esearch Group, Department of Civil and Environmental Engineering, University College Cork, Cork,48.achóir).
t al. Impacts of an emission based private car taxation policy – First year ex-post analysis.a.2011.03.007
2 F. Rogan et al. / Transportation Research Part A xxx (2011) xxx–xxx
The paper provides a one year ex-post analysis of the first full year of the policy change, tracking the change in purchasingtrends arising from the measure, in terms of specific CO2 emissions, engine size and fuel, and the implications of thesechanges for car prices, CO2 emissions abatement, and revenue gathered. To date, there have been a number of studies thathave outlined possible policy responses to the transport energy challenge (Poudenx, 2008; Stanley et al., 2009) and otherstudies that have discussed or modelled the impact of specific policy types such as vehicle miles travelled (Moore et al.,2010) or fuel efficiency standards (Shiau et al., 2009). However, only a few studies have been specifically ex-post (Sterner,2007) and none have assessed a car taxation policy aimed at reducing emissions. Furthermore, since Ireland is not a car man-ufacturing country, it has had to focus its transportation policies on the consumer side rather than on the manufacturingside. While this policy is therefore most relevant to other non car-manufacturing countries, it is relevant to any countrywhere consumers purchase automobiles and where there is a need to address rising transport energy and emissions.
Transport related energy demand in Ireland has risen steeply in the past number of years. Between 1990 and 2007, therewas a 182% (6.3% per annum) growth in energy-related CO2 emissions from the transport sector (Howley et al., 2008), withtransport accounting for 36% of energy-related CO2 emissions in 2007 and 47% of greenhouse gas (GHG) emissions in thenon-emissions trading (non-ETS) sectors (Howley et al., 2009a). From 1990 to 2007, the stock of cars more than doubledto over 2.4 million (Howley et al., 2007). In 2007, private car transport accounted for 60% of road transport and 43% of alltransport energy excluding fuel tourism.1 Despite this increase, private car ownership in 2007 was 545 per thousand adults,which remains below the EU average (592 in 2007 for EU-15) suggesting there is further scope for continued growth. Arisingfrom EU Decision 406-2009 on non-ETS GHG emissions effort sharing, Ireland must reduce non-ETS GHG emissions by 20% be-low 2005 levels by 2020. In the two year period between 2005 and 2007, transport energy-related emissions in Ireland grew by13%, indicating the scale of the challenge.
This paper is organized as follows: Section 2 outlines the background to this paper, providing the context for and detail ofthe policy change. Section 2 also reviews the use of ex-post analysis, providing a basis for its application in this paper. Sec-tion 3 describes the methodology used: how data sets were combined and how the impacts of the policy measure werequantified. Section 4 presents the results, tracking both the changes in purchasing trends arising from the new policy andthe impacts of these changes. Section 4 also discusses the level of uncertainty in the results. Section 5 presents the conclu-sions of the paper.
2. Background
2.1. Emissions-based car taxation policy
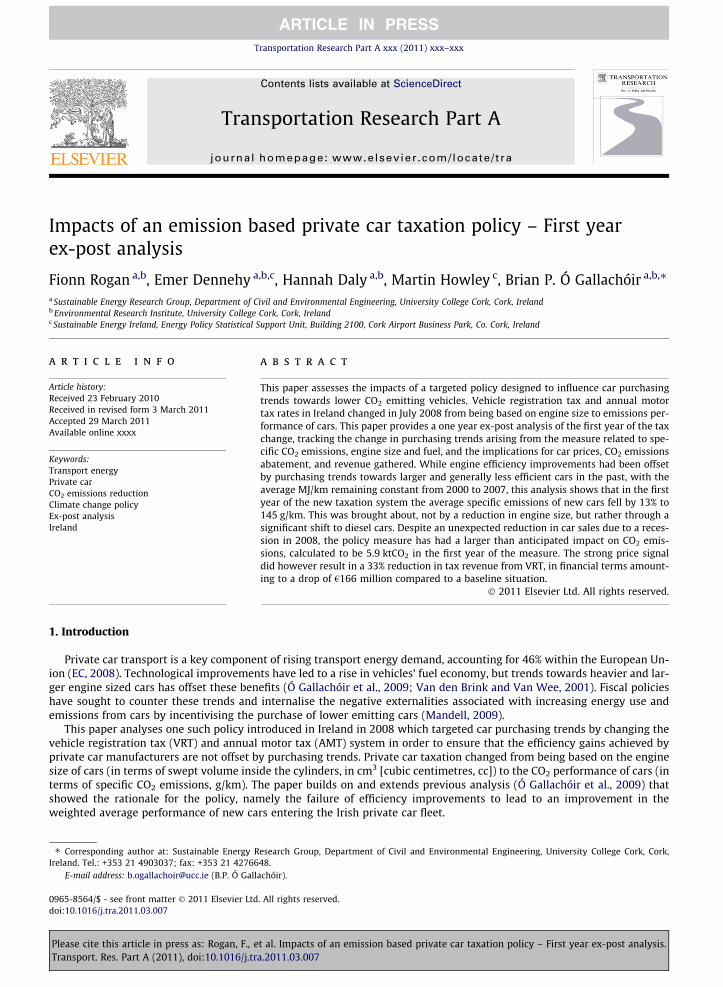
As outlined in Ó Gallachóir et al. (2009), car purchasing trends in Ireland offset technological efficiency improvementsover the period 2000–2007. Fig. 1 shows the average specific energy consumption of new private cars in Ireland, which re-mained flat for the 2000–2007 period. Also shown in Fig. 1 is the European target specified in Regulation 443-2009 to achieveaverage specific emissions of 130 g/km for new cars by 2012. This revised target was put in place after a review of existing EUlegislation concluded that the previous target of 120 g/km could not be achieved without additional policy (EC, 2007).
In December 2007,2 the Irish government announced that vehicle registration tax (VRT) and annual motor tax (AMT) were tochange with effect from 1st July 2008. New cars registered between 1 January 2008 and 30 June 2008 would have their motortax charged on the basis of engine size but if it was beneficial for these cars to switch to the CO2 based system, this would beeffected on the first renewal of motor tax after 1st July 2008 (DEHLG, 2010).
The new system would be based on specific CO2 emissions rather than engine size. This type of policy is one of the threemain pillars of policy that can focus on reducing energy related emissions, the other two being the labelling guidelines andconsumer information campaigns and the voluntary commitments of the European, Japanese and Korean associations ofauto manufacturers (Frondel et al., 2010). The impact of the new VRT and AMT policy in Ireland has attracted internationalinterest from the EU ODYSSEE network (Howley et al., 2009b) and the International Energy Agency (Howley and Gallachóir,2009).
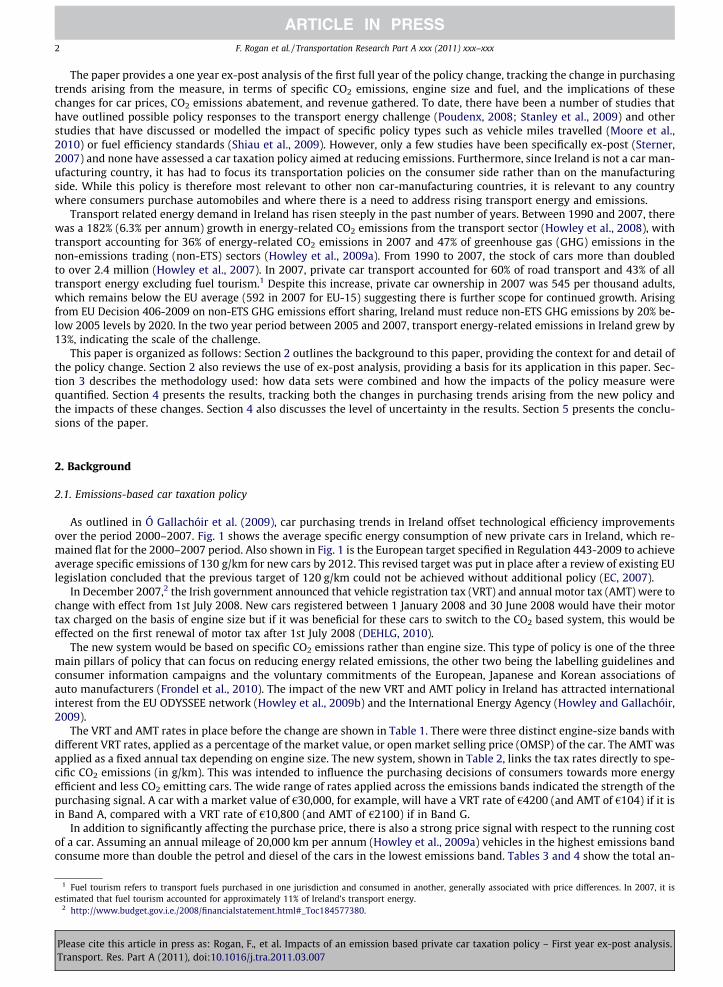
The VRT and AMT rates in place before the change are shown in Table 1. There were three distinct engine-size bands withdifferent VRT rates, applied as a percentage of the market value, or open market selling price (OMSP) of the car. The AMT wasapplied as a fixed annual tax depending on engine size. The new system, shown in Table 2, links the tax rates directly to spe-cific CO2 emissions (in g/km). This was intended to influence the purchasing decisions of consumers towards more energyefficient and less CO2 emitting cars. The wide range of rates applied across the emissions bands indicated the strength of thepurchasing signal. A car with a market value of €30,000, for example, will have a VRT rate of €4200 (and AMT of €104) if it isin Band A, compared with a VRT rate of €10,800 (and AMT of €2100) if in Band G.
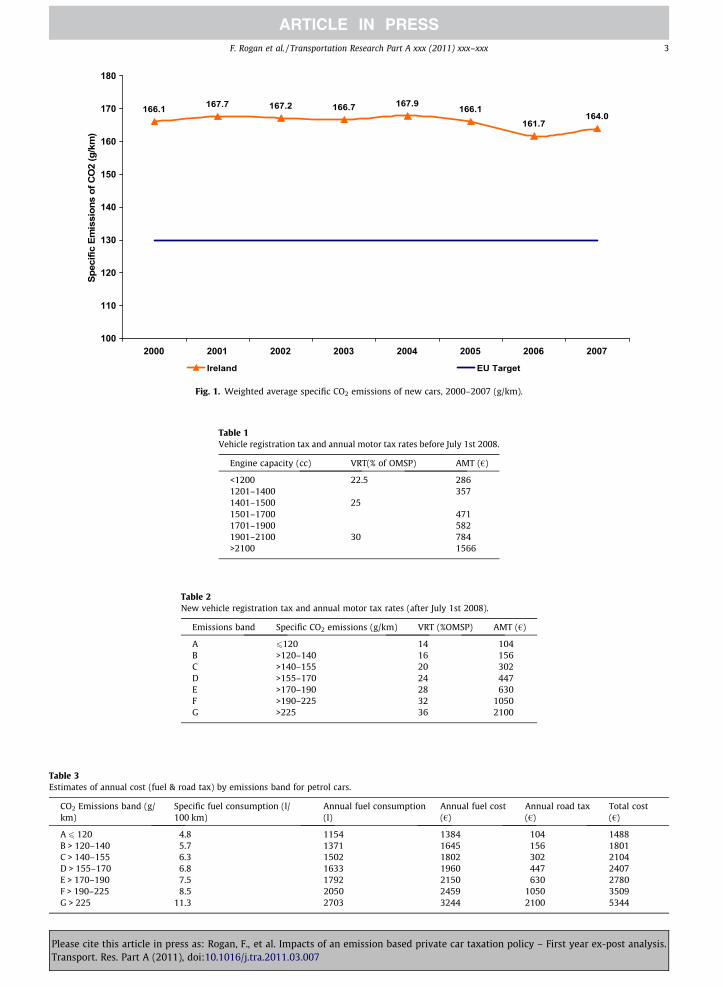
In addition to significantly affecting the purchase price, there is also a strong price signal with respect to the running costof a car. Assuming an annual mileage of 20,000 km per annum (Howley et al., 2009a) vehicles in the highest emissions bandconsume more than double the petrol and diesel of the cars in the lowest emissions band. Tables 3 and 4 show the total an-
1 Fuel tourism refers to transport fuels purchased in one jurisdiction and consumed in another, generally associated with price differences. In 2007, it isestimated that fuel tourism accounted for approximately 11% of Ireland’s transport energy.
2 http://www.budget.gov.i.e./2008/financialstatement.html#_Toc184577380.
Please cite this article in press as: Rogan, F., et al. Impacts of an emission based private car taxation policy – First year ex-post analysis.Transport. Res. Part A (2011), doi:10.1016/j.tra.2011.03.007
166.1 167.7 167.2 166.7 167.9 166.1161.7
164.0
100
110
120
130
140
150
160
170
180
2000 2001 2002 2003 2004 2005 2006 2007
Spec
ific
Emis
sion
s of
CO
2 (g
/km
)
Ireland EU Target
Fig. 1. Weighted average specific CO2 emissions of new cars, 2000–2007 (g/km).
Table 1Vehicle registration tax and annual motor tax rates before July 1st 2008.
Engine capacity (cc) VRT(% of OMSP) AMT (€)
<1200 22.5 2861201–1400 3571401–1500 251501–1700 4711701–1900 5821901–2100 30 784>2100 1566
Table 2New vehicle registration tax and annual motor tax rates (after July 1st 2008).
Emissions band Specific CO2 emissions (g/km) VRT (%OMSP) AMT (€)
A 6120 14 104B >120–140 16 156C >140–155 20 302D >155–170 24 447E >170–190 28 630F >190–225 32 1050G >225 36 2100
Table 3Estimates of annual cost (fuel & road tax) by emissions band for petrol cars.
CO2 Emissions band (g/km)
Specific fuel consumption (l/100 km)
Annual fuel consumption(l)
Annual fuel cost(€)
Annual road tax(€)
Total cost(€)
A 6 120 4.8 1154 1384 104 1488B > 120–140 5.7 1371 1645 156 1801C > 140–155 6.3 1502 1802 302 2104D > 155–170 6.8 1633 1960 447 2407E > 170–190 7.5 1792 2150 630 2780F > 190–225 8.5 2050 2459 1050 3509G > 225 11.3 2703 3244 2100 5344
F. Rogan et al. / Transportation Research Part A xxx (2011) xxx–xxx 3
Please cite this article in press as: Rogan, F., et al. Impacts of an emission based private car taxation policy – First year ex-post analysis.Transport. Res. Part A (2011), doi:10.1016/j.tra.2011.03.007
Table 4Estimates of annual cost (fuel & road tax) by emissions band for diesel cars.
CO2 Emissions band (g/km)
Specific fuel consumption (l/100 km)
Annual fuel consumption(l)
Annual fuel cost(€)
Annual motor tax(€)
Total cost(€)
A 6 120 4.5 1074 1127 104 1231B > 120–140 5.0 1200 1260 156 1416C > 140–155 5.6 1351 1418 302 1720D > 155–170 6.1 1468 1542 447 1989E > 170–190 6.9 1647 1729 630 2359F > 190–225 7.9 1891 1985 1050 3035G > 225 9.9 2386 2505 2100 4605
4 F. Rogan et al. / Transportation Research Part A xxx (2011) xxx–xxx
nual running cost (the fuel cost and the AMT) of petrol and diesel cars respectively in each emissions band. The annual cost ofcars in a G emissions band are calculated to be almost four times of cars in an A emissions band, assuming the same distancetravelled. Within each emissions band, the difference in running costs between petrol and diesel varies by between €257 inemissions band A to €739 in emissions band G. There is a much more significant difference between emissions bands, varyingfrom €313 to €3856 for petrol and €185 to €3374 for diesel. Indeed, going from band F to band G increases annual runningcosts, based on 20,000 km per annum, by approximately €1500.
2.2. Ex-post analyses
The aim of this paper is to evaluate the effects of the change in car tax outlined in Section 2.1 using ex-post analysis. Acomprehensive ex-post analysis is an essential feature of any successful energy–efficiency improvement programme andshould include evaluation, measurement and verification criteria. Since the 1970s for example, the US state of Californiahas kept energy demand static whilst energy demand in other US states has grown (Chang, 2006). Crucial to California’s suc-cess in stabilizing energy demand with energy–efficiency policies and demand-side-management is the rigorous infrastruc-ture of measurement and evaluation, for utility companies, which has developed over the years (Reynolds et al., 2009). TheInternational Performance Measurement and Verification Protocol (IPMVP) has grown, from its origins in 1994 in the USDepartment of Energy, to become an internationally recognised standard for energy efficiency programmes (Efficiency–Val-uation–Organization, 2007). It is a robust methodology mostly used for industrial and commercial energy efficiency projects.However, its use is far from universal (Hita et al., 2009) and it is to the detriment of transport energy efficiency policy mea-sures that there is no equivalent standardised measurement and evaluation methodology.
EU Directive 2006/32/EC on energy end-use efficiency (the Energy Services Directive, ESD) required each EU memberstate to prepare a national energy efficiency action plan (NEEAP) detailing policy measures to achieve a 9% reduction in en-ergy consumption from 2008 to 2016. Over this nine year period, each member state is required to submit two further NEE-APs reporting on the progress achieved in the relevant time period. The ESD stated a preference for a bottom-up, measure-specific approach to the evaluation of energy efficiency programmes (CEC, 2006). While this should pave the way for a surgein ex-post analyses, in its review of all Member State NEEAPs in 2009, Energy Efficiency Watch concluded that there was stillmuch work to be done: ‘‘The subject of monitoring and evaluation is another field that Member States should seek to im-prove for the second round of NEEAPs [in 2011]’’ (Schule et al., 2009). As EU energy efficiency targets grow more and moreambitious (20% energy savings by 2020), the importance of robust ex-post analysis correspondingly grows; this point hasalso been made with respect to Ireland in particular (Hull et al., 2009). This paper builds on the small body of ex-post anal-yses of different transport policies (Poudenx, 2008; Sterner, 2007).
3. Methodology
3.1. Monitoring the change
In order to quantify the effect of the tax change, total new car CO2 emissions were calculated for the first full year after thetax change and compared with a counterfactual scenario. Total emissions were calculated using an emissions-disaggregatedprofile of new cars. Since 2001, detailed data on new car sales has been made available by Ireland’s Vehicle Registration Unit(VRU), allowing the authors to assess car purchasing trends before and after the VRT and AMT changes took place in July2008. As well as monitoring sales volumes, this data was used to profile the fleet by engine size band, by average engine size,by specific CO2 emissions (g/km), by specific fuel use (l/100 km) and by specific energy consumption (MJ/km) by fuel used.
The new car database from the VRU was linked with a database containing the average specific emissions of cars disag-gregated by engine size and emissions band. Test data on each car model’s specific CO2 emissions have been recorded onvehicle registrations since 2008. However, prior to 2008 the specific emissions were obtained by linking the vehicle typeto the emissions provided by the UK Vehicle Certification Agency (VCA) based on tests carried out in accordance with EUDirective 93/116/EC. The authors calculated the average annual mileage of private cars based on the odometer readings from
Please cite this article in press as: Rogan, F., et al. Impacts of an emission based private car taxation policy – First year ex-post analysis.Transport. Res. Part A (2011), doi:10.1016/j.tra.2011.03.007
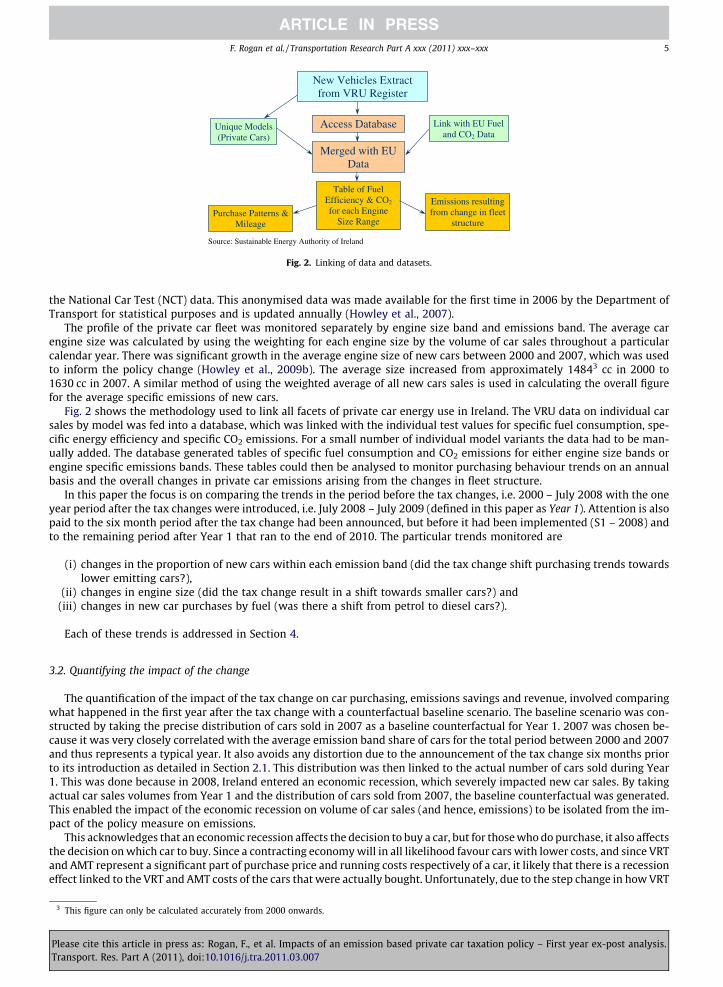
Source: Sustainable Energy Authority of Ireland
Unique Models (Private Cars)
Link with EU Fuel and CO2 Data
Table of Fuel Efficiency & CO2
for each Engine Size Range
Merged with EU Data
Access Database
New Vehicles Extract from VRU Register
Purchase Patterns & Mileage
Emissions resulting from change in fleet
structure
Fig. 2. Linking of data and datasets.
F. Rogan et al. / Transportation Research Part A xxx (2011) xxx–xxx 5
the National Car Test (NCT) data. This anonymised data was made available for the first time in 2006 by the Department ofTransport for statistical purposes and is updated annually (Howley et al., 2007).
The profile of the private car fleet was monitored separately by engine size band and emissions band. The average carengine size was calculated by using the weighting for each engine size by the volume of car sales throughout a particularcalendar year. There was significant growth in the average engine size of new cars between 2000 and 2007, which was usedto inform the policy change (Howley et al., 2009b). The average size increased from approximately 14843 cc in 2000 to1630 cc in 2007. A similar method of using the weighted average of all new cars sales is used in calculating the overall figurefor the average specific emissions of new cars.
Fig. 2 shows the methodology used to link all facets of private car energy use in Ireland. The VRU data on individual carsales by model was fed into a database, which was linked with the individual test values for specific fuel consumption, spe-cific energy efficiency and specific CO2 emissions. For a small number of individual model variants the data had to be man-ually added. The database generated tables of specific fuel consumption and CO2 emissions for either engine size bands orengine specific emissions bands. These tables could then be analysed to monitor purchasing behaviour trends on an annualbasis and the overall changes in private car emissions arising from the changes in fleet structure.
In this paper the focus is on comparing the trends in the period before the tax changes, i.e. 2000 – July 2008 with the oneyear period after the tax changes were introduced, i.e. July 2008 – July 2009 (defined in this paper as Year 1). Attention is alsopaid to the six month period after the tax change had been announced, but before it had been implemented (S1 – 2008) andto the remaining period after Year 1 that ran to the end of 2010. The particular trends monitored are
(i) changes in the proportion of new cars within each emission band (did the tax change shift purchasing trends towardslower emitting cars?),
(ii) changes in engine size (did the tax change result in a shift towards smaller cars?) and(iii) changes in new car purchases by fuel (was there a shift from petrol to diesel cars?).
Each of these trends is addressed in Section 4.
3.2. Quantifying the impact of the change
The quantification of the impact of the tax change on car purchasing, emissions savings and revenue, involved comparingwhat happened in the first year after the tax change with a counterfactual baseline scenario. The baseline scenario was con-structed by taking the precise distribution of cars sold in 2007 as a baseline counterfactual for Year 1. 2007 was chosen be-cause it was very closely correlated with the average emission band share of cars for the total period between 2000 and 2007and thus represents a typical year. It also avoids any distortion due to the announcement of the tax change six months priorto its introduction as detailed in Section 2.1. This distribution was then linked to the actual number of cars sold during Year1. This was done because in 2008, Ireland entered an economic recession, which severely impacted new car sales. By takingactual car sales volumes from Year 1 and the distribution of cars sold from 2007, the baseline counterfactual was generated.This enabled the impact of the economic recession on volume of car sales (and hence, emissions) to be isolated from the im-pact of the policy measure on emissions.
This acknowledges that an economic recession affects the decision to buy a car, but for those who do purchase, it also affectsthe decision on which car to buy. Since a contracting economy will in all likelihood favour cars with lower costs, and since VRTand AMT represent a significant part of purchase price and running costs respectively of a car, it likely that there is a recessioneffect linked to the VRT and AMT costs of the cars that were actually bought. Unfortunately, due to the step change in how VRT
3 This figure can only be calculated accurately from 2000 onwards.
Please cite this article in press as: Rogan, F., et al. Impacts of an emission based private car taxation policy – First year ex-post analysis.Transport. Res. Part A (2011), doi:10.1016/j.tra.2011.03.007
6 F. Rogan et al. / Transportation Research Part A xxx (2011) xxx–xxx
and AMT are calculated (from engine size to CO2 g/km), it is not possible to establish a baseline that would relate car purchasechoice to the VRT and AMT cost of emissions, because the latter was not a direct factor in purchase decision prior to the intro-duction of the new policy on 1st July 2008. For this reason, it has been excluded from the analysis.
In January 2010, a scrappage scheme was introduced in Ireland, which allowed motorists to trade in cars registered in orbefore 2000 for a new car in emissions band A or B for a €1500 allowance. This has stimulated purchasing of lower emittingcars even more, but also complicates the analysis of the tax change beyond 2009. The analysis of car purchasing is extendedto the end of 2010 to indicate the trajectory of new car trends but the quantification of emissions savings and revenue loss isconfined to Year 1.
The quantification of the impact of the change provided in Section 4 incorporates this counterfactual methodology and isfocussed into three parts: the effect on weighted average CO2 emissions, the quantification of CO2 emissions, savings, and theimpact on revenue. Finally, uncertainty analysis is described.
4. Results and discussion
4.1. Changes in purchasing trends
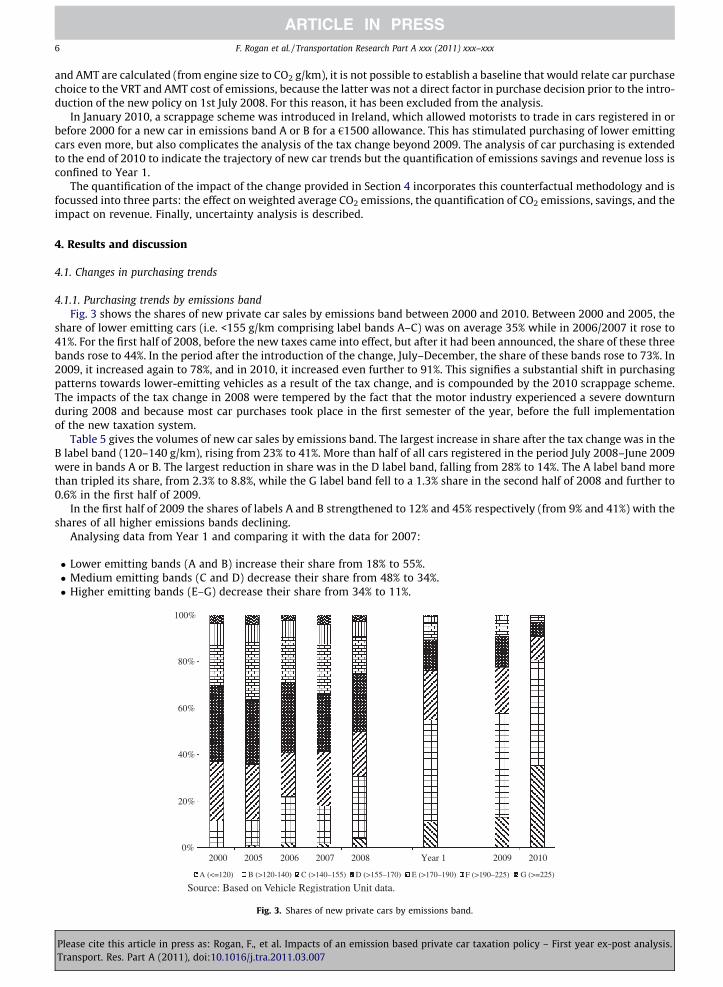
4.1.1. Purchasing trends by emissions bandFig. 3 shows the shares of new private car sales by emissions band between 2000 and 2010. Between 2000 and 2005, the
share of lower emitting cars (i.e. <155 g/km comprising label bands A–C) was on average 35% while in 2006/2007 it rose to41%. For the first half of 2008, before the new taxes came into effect, but after it had been announced, the share of these threebands rose to 44%. In the period after the introduction of the change, July–December, the share of these bands rose to 73%. In2009, it increased again to 78%, and in 2010, it increased even further to 91%. This signifies a substantial shift in purchasingpatterns towards lower-emitting vehicles as a result of the tax change, and is compounded by the 2010 scrappage scheme.The impacts of the tax change in 2008 were tempered by the fact that the motor industry experienced a severe downturnduring 2008 and because most car purchases took place in the first semester of the year, before the full implementationof the new taxation system.
Table 5 gives the volumes of new car sales by emissions band. The largest increase in share after the tax change was in theB label band (120–140 g/km), rising from 23% to 41%. More than half of all cars registered in the period July 2008–June 2009were in bands A or B. The largest reduction in share was in the D label band, falling from 28% to 14%. The A label band morethan tripled its share, from 2.3% to 8.8%, while the G label band fell to a 1.3% share in the second half of 2008 and further to0.6% in the first half of 2009.
In the first half of 2009 the shares of labels A and B strengthened to 12% and 45% respectively (from 9% and 41%) with theshares of all higher emissions bands declining.
Analysing data from Year 1 and comparing it with the data for 2007:
� Lower emitting bands (A and B) increase their share from 18% to 55%.� Medium emitting bands (C and D) decrease their share from 48% to 34%.� Higher emitting bands (E–G) decrease their share from 34% to 11%.
0%
20%
40%
60%
80%
100%
2000 2005 2006 2007 2008 Year 1 2009 2010
A (<=120) B (>120-140) C (>140–155) D (>155–170) E (>170–190) F (>190–225) G (>=225)
Source: Based on Vehicle Registration Unit data.
Fig. 3. Shares of new private cars by emissions band.
Please cite this article in press as: Rogan, F., et al. Impacts of an emission based private car taxation policy – First year ex-post analysis.Transport. Res. Part A (2011), doi:10.1016/j.tra.2011.03.007
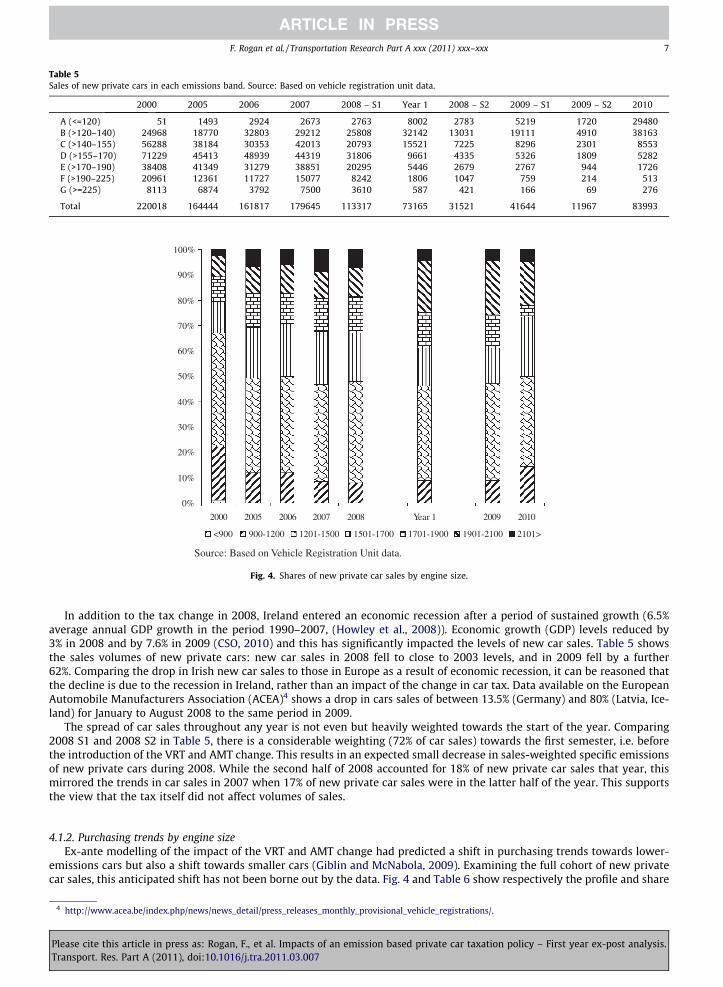
Table 5Sales of new private cars in each emissions band. Source: Based on vehicle registration unit data.
2000 2005 2006 2007 2008 – S1 Year 1 2008 – S2 2009 – S1 2009 – S2 2010
A (<=120) 51 1493 2924 2673 2763 8002 2783 5219 1720 29480B (>120–140) 24968 18770 32803 29212 25808 32142 13031 19111 4910 38163C (>140–155) 56288 38184 30353 42013 20793 15521 7225 8296 2301 8553D (>155–170) 71229 45413 48939 44319 31806 9661 4335 5326 1809 5282E (>170–190) 38408 41349 31279 38851 20295 5446 2679 2767 944 1726F (>190–225) 20961 12361 11727 15077 8242 1806 1047 759 214 513G (>=225) 8113 6874 3792 7500 3610 587 421 166 69 276
Total 220018 164444 161817 179645 113317 73165 31521 41644 11967 83993
0%
10%
20%
30%
40%
50%
60%
70%
80%
90%
100%
2000 2005 2006 2007 2008 Year 1 2009 2010
<900 900-1200 1201-1500 1501-1700 1701-1900 1901-2100 2101>
Source: Based on Vehicle Registration Unit data.
Fig. 4. Shares of new private car sales by engine size.
F. Rogan et al. / Transportation Research Part A xxx (2011) xxx–xxx 7
In addition to the tax change in 2008, Ireland entered an economic recession after a period of sustained growth (6.5%average annual GDP growth in the period 1990–2007, (Howley et al., 2008)). Economic growth (GDP) levels reduced by3% in 2008 and by 7.6% in 2009 (CSO, 2010) and this has significantly impacted the levels of new car sales. Table 5 showsthe sales volumes of new private cars: new car sales in 2008 fell to close to 2003 levels, and in 2009 fell by a further62%. Comparing the drop in Irish new car sales to those in Europe as a result of economic recession, it can be reasoned thatthe decline is due to the recession in Ireland, rather than an impact of the change in car tax. Data available on the EuropeanAutomobile Manufacturers Association (ACEA)4 shows a drop in cars sales of between 13.5% (Germany) and 80% (Latvia, Ice-land) for January to August 2008 to the same period in 2009.
The spread of car sales throughout any year is not even but heavily weighted towards the start of the year. Comparing2008 S1 and 2008 S2 in Table 5, there is a considerable weighting (72% of car sales) towards the first semester, i.e. beforethe introduction of the VRT and AMT change. This results in an expected small decrease in sales-weighted specific emissionsof new private cars during 2008. While the second half of 2008 accounted for 18% of new private car sales that year, thismirrored the trends in car sales in 2007 when 17% of new private car sales were in the latter half of the year. This supportsthe view that the tax itself did not affect volumes of sales.
4.1.2. Purchasing trends by engine sizeEx-ante modelling of the impact of the VRT and AMT change had predicted a shift in purchasing trends towards lower-
emissions cars but also a shift towards smaller cars (Giblin and McNabola, 2009). Examining the full cohort of new privatecar sales, this anticipated shift has not been borne out by the data. Fig. 4 and Table 6 show respectively the profile and share
4 http://www.acea.be/index.php/news/news_detail/press_releases_monthly_provisional_vehicle_registrations/.
Please cite this article in press as: Rogan, F., et al. Impacts of an emission based private car taxation policy – First year ex-post analysis.Transport. Res. Part A (2011), doi:10.1016/j.tra.2011.03.007
Table 6Shares of new private cars by engine size, 2000–2010. Source: Based on vehicle registration unit data.
Engine size 2000 (%) 2005 (%) 2006 (%) 2007 (%) 2008 – S1 (%) Year 1 (%) 2008 – S2 (%) 2009 – S1 (%) 2009 – S2 (%) 2010 (%)
<1200 22.1 12.0 11.8 8.4 7.7 8.8 8.8 8.7 8.8 14.51201–1500 45.0 37.3 38.0 38.5 41.6 37.3 33.1 40.4 31.1 35.31501–1700 12.2 20.0 21.0 20.8 19.9 15.2 17.9 13.1 18.1 23.61701–1900 10.0 13.4 11.8 13.2 13.8 14.2 16.2 12.8 12.8 4.41901–2100 8.2 10.6 11.3 10.4 9.2 20.1 19.1 20.9 23.2 17.22101> 2.5 6.7 6.1 8.8 7.7 4.4 4.8 4.1 5.9 4.9
8 F. Rogan et al. / Transportation Research Part A xxx (2011) xxx–xxx
of new private cars by engine-size bands from 2000 to 2010. Cars with engines larger than 1700 cc increased their share ofnew private car sales from 21% in the year 2000 to 28% in 2005. By the year 2007, cars in this size band represented 32% ofnew car sales. During the first year after the tax change, cars larger than 1700 cc accounted for 38% of new private car salesindicating the tax change did not result in a shift in purchasing trend towards smaller cars. In 2010, the share of these carsdecreased to 27%, which may be attributable to the scrappage scheme.
Looking at the individual engine size bands more closely, the shares of new cars in the two smallest bands, i.e. less than1500 cc, has been falling from 67% in 2000 to 47% in 2007. The share of these cars rose slightly in early 2008 to 49% but fell to42% after July. The bands that increased their share after July were:
less than 1200 cc, with an increase of 1.1%1701–1900 cc, with an increase of 3.4%1901–2100 cc band, with an increase of 9.9%
4.1.3. Purchasing trends by fuel typeWhile the tax change did not result in a change in purchasing trends towards smaller cars, the evidence does point
strongly to a shift towards diesel–fuelled cars. Ireland differs to the rest of Europe in that historically, it has had a low per-centage of diesel cars, as detailed in Table 7.
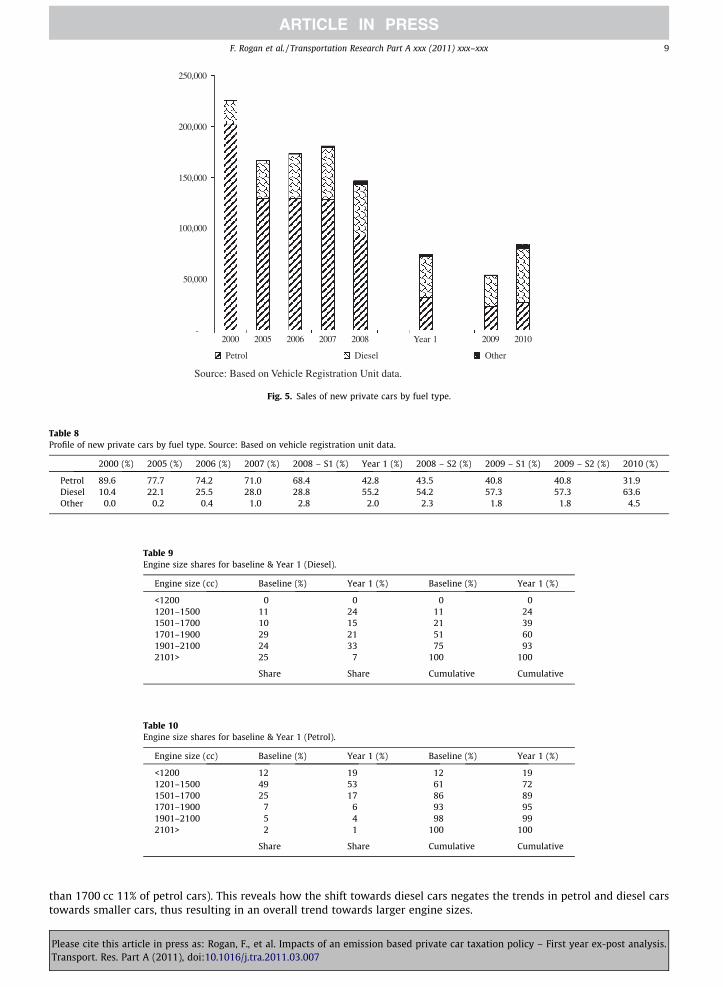
With reference to Fig. 5 and Table 8, it can be seen that the share of diesel cars in new private car sales has increased from10% in 2000 to 27% in 2007. During the first half of 2008, the share was 28%; after July, it increased to 54% of sales. In 2009,the share of diesel in new private cars increased further to 56% and in 2010 increased further to 64%. After a seven year per-iod with a slow purchasing trend towards diesel, the tax change resulted in a doubling of the share of diesel cars from 27% in2007 to 55% in Year 1. ‘Other fuels’ shown in Table 8 comprise mostly hybrid electric vehicles and ethanol vehicles. The ratioof petrol and diesel cars has been changing over time but the step change in 2008 that continued into 2009 is a direct resultof the new taxation scheme.
While Table 6 suggested no trend towards smaller cars as a result of the tax change, it is also interesting to compare thetrends in engine size separately for petrol and diesel cars since July 2008. Tables 9 and 10 show the trends in diesel and pet-rol cars respectively in terms of the individual and cumulative shares of cars sold by engine band in Year 1 and comparesthem with 2007 shares (‘Baseline’). The ‘cumulative’ columns for the Baseline and Year 1 scenarios suggest the policy causeda trend in diesel cars towards smaller cars. Cars less than 1700 cc accounted for 39% of diesel sales in Year 1, compared with21% in the Baseline scenario. The largest engine size band (>2100 cc) in Year 1 accounted for just 7% of sales in Year 1 com-pared with 25% in the Baseline. Sales in the 1901–2100 cc engine size band however run counter to this trend, representing33% of new diesel car sales in Year 1 compared with 24% in the Baseline. This is the diesel engine size category with the larg-est share in Year 1. However, diesel cars remain well spread across all engine sizes (except < 1200 cc).
By contrast, petrol cars have become more concentrated into a single category: 1201–1500 cc, as shown in Table 10,accounting for more than half of all new petrol car sales in Year 1. There is a clear purchasing trend in petrol car sales to-wards smaller engine sizes. The results shown in Tables 9 and 10 appear to contradict the trend towards larger cars dem-onstrated in Table 6. The reason for this is that Tables 9 and 10 are related to trends for individual fuels and do notreveal the significant shift in purchasing trends between fuels towards diesel cars. Comparing the last column in Tables 9and 10 does show that diesel cars in Year 1 were considerably larger than petrol cars in Year 1 (61% of diesel cars were larger
Table 7Shares of diesel fuelled private cars. Source: Association of European CarManufacturers (ACEA)
Country 2000 (%) 2007 (%)
Ireland 10 27UK 14 40Germany 30 48France 49 74Western Europe 32 52
Please cite this article in press as: Rogan, F., et al. Impacts of an emission based private car taxation policy – First year ex-post analysis.Transport. Res. Part A (2011), doi:10.1016/j.tra.2011.03.007
-
50,000
100,000
150,000
200,000
250,000
2000 2005 2006 2007 2008 Year 1 2009 2010
Petrol Diesel Other
Source: Based on Vehicle Registration Unit data.
Fig. 5. Sales of new private cars by fuel type.
Table 8Profile of new private cars by fuel type. Source: Based on vehicle registration unit data.
2000 (%) 2005 (%) 2006 (%) 2007 (%) 2008 – S1 (%) Year 1 (%) 2008 – S2 (%) 2009 – S1 (%) 2009 – S2 (%) 2010 (%)
Petrol 89.6 77.7 74.2 71.0 68.4 42.8 43.5 40.8 40.8 31.9Diesel 10.4 22.1 25.5 28.0 28.8 55.2 54.2 57.3 57.3 63.6Other 0.0 0.2 0.4 1.0 2.8 2.0 2.3 1.8 1.8 4.5
Table 9Engine size shares for baseline & Year 1 (Diesel).
Engine size (cc) Baseline (%) Year 1 (%) Baseline (%) Year 1 (%)
<1200 0 0 0 01201–1500 11 24 11 241501–1700 10 15 21 391701–1900 29 21 51 601901–2100 24 33 75 932101> 25 7 100 100
Share Share Cumulative Cumulative
Table 10Engine size shares for baseline & Year 1 (Petrol).
Engine size (cc) Baseline (%) Year 1 (%) Baseline (%) Year 1 (%)
<1200 12 19 12 191201–1500 49 53 61 721501–1700 25 17 86 891701–1900 7 6 93 951901–2100 5 4 98 992101> 2 1 100 100
Share Share Cumulative Cumulative
F. Rogan et al. / Transportation Research Part A xxx (2011) xxx–xxx 9
than 1700 cc 11% of petrol cars). This reveals how the shift towards diesel cars negates the trends in petrol and diesel carstowards smaller cars, thus resulting in an overall trend towards larger engine sizes.
Please cite this article in press as: Rogan, F., et al. Impacts of an emission based private car taxation policy – First year ex-post analysis.Transport. Res. Part A (2011), doi:10.1016/j.tra.2011.03.007
10 F. Rogan et al. / Transportation Research Part A xxx (2011) xxx–xxx
4.2. Average specific CO2 emissions
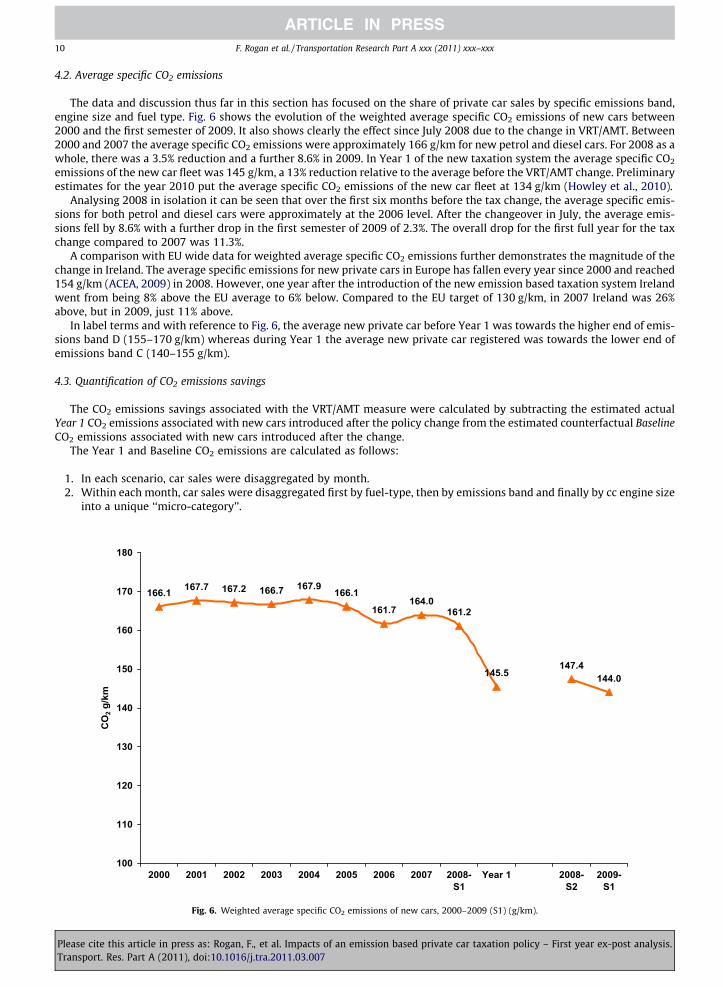
The data and discussion thus far in this section has focused on the share of private car sales by specific emissions band,engine size and fuel type. Fig. 6 shows the evolution of the weighted average specific CO2 emissions of new cars between2000 and the first semester of 2009. It also shows clearly the effect since July 2008 due to the change in VRT/AMT. Between2000 and 2007 the average specific CO2 emissions were approximately 166 g/km for new petrol and diesel cars. For 2008 as awhole, there was a 3.5% reduction and a further 8.6% in 2009. In Year 1 of the new taxation system the average specific CO2
emissions of the new car fleet was 145 g/km, a 13% reduction relative to the average before the VRT/AMT change. Preliminaryestimates for the year 2010 put the average specific CO2 emissions of the new car fleet at 134 g/km (Howley et al., 2010).
Analysing 2008 in isolation it can be seen that over the first six months before the tax change, the average specific emis-sions for both petrol and diesel cars were approximately at the 2006 level. After the changeover in July, the average emis-sions fell by 8.6% with a further drop in the first semester of 2009 of 2.3%. The overall drop for the first full year for the taxchange compared to 2007 was 11.3%.
A comparison with EU wide data for weighted average specific CO2 emissions further demonstrates the magnitude of thechange in Ireland. The average specific emissions for new private cars in Europe has fallen every year since 2000 and reached154 g/km (ACEA, 2009) in 2008. However, one year after the introduction of the new emission based taxation system Irelandwent from being 8% above the EU average to 6% below. Compared to the EU target of 130 g/km, in 2007 Ireland was 26%above, but in 2009, just 11% above.
In label terms and with reference to Fig. 6, the average new private car before Year 1 was towards the higher end of emis-sions band D (155–170 g/km) whereas during Year 1 the average new private car registered was towards the lower end ofemissions band C (140–155 g/km).
4.3. Quantification of CO2 emissions savings
The CO2 emissions savings associated with the VRT/AMT measure were calculated by subtracting the estimated actualYear 1 CO2 emissions associated with new cars introduced after the policy change from the estimated counterfactual BaselineCO2 emissions associated with new cars introduced after the change.
The Year 1 and Baseline CO2 emissions are calculated as follows:
1. In each scenario, car sales were disaggregated by month.2. Within each month, car sales were disaggregated first by fuel-type, then by emissions band and finally by cc engine size
into a unique ‘‘micro-category’’.
166.1 167.7 167.2 166.7 167.9 166.1
161.7164.0
161.2
145.5147.4
144.0
100
110
120
130
140
150
160
170
180
2000 2001 2002 2003 2004 2005 2006 2007 2008-S1
Year 1 2008-S2
2009-S1
CO
2 g/k
m
Fig. 6. Weighted average specific CO2 emissions of new cars, 2000–2009 (S1) (g/km).
Please cite this article in press as: Rogan, F., et al. Impacts of an emission based private car taxation policy – First year ex-post analysis.Transport. Res. Part A (2011), doi:10.1016/j.tra.2011.03.007
F. Rogan et al. / Transportation Research Part A xxx (2011) xxx–xxx 11
3. Using vehicle manufacturer test values for g/km of CO2, the linked data-sets calculated an average g/km for each unique‘‘micro-category’’.
4. An on-the-road factor for petrol (1.06) and diesel (1.13) was used (Daly and Ó Gallachóir, 2011) with the average test g/km value to reflect how actual driving behaviour, traffic congestion and road conditions deviate from the testconditions.
5. Average annual mileages for cars were obtained from NCT database: the data was disaggregated by fuel and by ccengine size.
6. Total car sales, average g/km for each ‘‘micro-category’’ and average annual kilometres for each ‘‘micro category’’ werecombined.
7. Total CO2 emissions for the Baseline and Year 1 were calculated.
This methodology was first used to quantify the CO2 emissions for the first six months of 2008 – this was to investigatethe announcement effect and as to whether or not it was positive or negative. This could lead to two conflicting outcomes:either incentivizing the purchase of lower CO2 emitting cars due to the future potential savings comparing lower CO2 AMT toengine size AMT or enabling a ‘‘must-end-soon’’ fire sale of higher emitting cars in order that they avoid future punitive AMTcosts. The calculations show that compared to the baseline situation, there was a net reduction in CO2 emissions of 5.3 kt forthe first six months of 2008.
The CO2 savings for Year 1 associated with this measure were calculated to be 5.9 ktCO2. To take into account the impactof the measure on purchasing trends for imported second hand cars is expected to increase this saving. This compares withthe target savings in the revised National Climate Change Strategy 2007 – 2012 (DEHLG, 2007a) of 54 kt, the total savings tobe achieved by 2020. This suggests that nearly 11% of the target was delivered in the first year during a recession and that thetax measure is likely to have a significantly greater impact by the year 2020. Despite an unexpected reduction in car sales,the measure has had a much larger than expected impact on reducing CO2 emissions.
During Year 1, lower emitting cars (A–C) had higher CO2 emissions than the counterfactual scenario because of the in-creased volume of cars in these bands. However, the reduction in CO2 emissions in the higher emitting bands was larger thanthe increase in the lower emitting bands, as detailed in Table 11.
Table 11 shows the change in total CO2 emissions in the Year 1 scenario compared with the Baseline scenario. Total dieselemissions grew significantly: diesel cars in emissions band B emitted 54.8 kt more than in the Baseline scenario. Due to theshift in purchasing trends of petrol cars towards lower emitting cars, the first two petrol bands also showed a growth inemissions. The reductions in emissions in the higher petrol bands countered this, leading to the overall 5.9 kt reduction.In addition, due to the shift to diesel cars, there was an overall increase in diesel CO2 emissions of 61.7 kt in Year 1, comparedwith a corresponding 68.9 kt reduction for petrol cars.
4.4. Economic evaluation of VRT change
The CO2 VRT & AMT emissions band system operates by financially incentivising the purchase of lower emitting cars.While its stated goal was to reduce CO2 emissions, the new system was also designed with the goal of remaining ‘‘reve-nue-neutral’’. To test if this has occurred, two approaches were used to economically evaluate the VRT component of thenew policy-measure:
1. Calculate the share of cars with increased or decreased VRT during Year 1.2. Estimate the VRT revenue impact (€s) for Year 1.
For cars changing from the old VRT rate to the new VRT rate, the matrix in Table 12 shows the resulting percentage in-crease or decrease in revenue (€s). For example, the VRT associated with a large (>1900 cc engine size band) car before thepolicy change would have been 30% of the OMSP but if it had low specific emissions (A emissions Band), the VRT rate wouldhave been 14% after the policy change. This means the VRT for this car is 53% less since the policy change. Conversely a small
Table 11CO2 emissions savings (kt) for new private cars in Year 1.
CO2 Emissions band (g/km) Diesel Petrol Total
A 6 120 17.2 1.8 19.5B > 120–140 54.8 8.3 64.0C > 140–155 15.1 �11.4 3.7D > 155–170 0.2 �23.2 �23.0E > 170–190 �4.6 �31.3 �35.6F > 190–225 �9.6 �9.6 �19.3G > 225 �11.5 �3.6 �15.3
Total 61.7 �68.9 �5.9
Please cite this article in press as: Rogan, F., et al. Impacts of an emission based private car taxation policy – First year ex-post analysis.Transport. Res. Part A (2011), doi:10.1016/j.tra.2011.03.007
Table 12Change in VRT (€s) for new & old VRT systems.
New A (%) B (%) C (%) D (%) E (%) F (%) G (%)
Old VRT Rate 14 16 18 20 24 32 36<1400 cc 22.5% �38 �29 �11 +7 +24 +42 +601400–1900 cc 25% �44 �36 �20 �4 +12 +28 +44>1900 cc 30% �53 �47 �33 �20 �7 +7 +20
12 F. Rogan et al. / Transportation Research Part A xxx (2011) xxx–xxx
(<1400 cc engine size band) car with high specific emissions (G emissions band) would have seen its VRT change from 22.5%of the OMSP to 36%, a VRT increase of 60%.
The tax change provided a very definite and strong pricing signal towards lower emitting vehicles. A similar emissionsbased taxation system was introduced in the United Kingdom for cars purchased after the 1st of March 2001. This systemwas criticised for not giving a strong enough signal to impact on consumer purchase behaviour (Government-Publications,2009).
The matrix of VRT costs under the new and old system was applied separately to Actual and Baseline car sales in Year 1.Focussing on the Baseline alone, there is a clear indication from Table 13 that even without a shift in purchasing trends, thechange in VRT was not going to be revenue-neutral and that there could be a consumer shift in favour of diesel cars.
For actual Year 1 sales, with the shift in purchasing trends included, the results were much more dramatic. Under the newVRT system 14% of cars paid more and 86% of cars paid less. For petrol cars, 26% paid more and 74% paid less; for diesel cars,only 4% paid more and 96% paid less. When the results are analysed according to the magnitude of the saving, as shown inTable 14 they are even more in favour of diesel: 70% of diesel cars made a saving of over 30% whereas only 8% of petrol carsmade such a saving.
It has been reported (McAleer, 2009) that VRT revenue for the first half of 2009 was down by €597 million compared tosame period in 2008. However, this includes a 63% fall in car sales. To isolate the impact of the new VRT & AMT policy-mea-sure on VRT revenue, the impact of the recession on this fall in car sales must be excluded.
The VRT returns for the Baseline and Year 1 were estimated as follows:
1. For each emissions band, a per car figure of average VRT (€s) was calculated from revenue return tables for S1 – 2009.2. From this, a figure for average Open Market Selling Price (OMSP) per car within each emissions band was calculated.3. This OMSP figure was applied to the private car sales figures to calculate revenue (€s) for counterfactual and Year 1 under
the new VRT system and the old VRT system.
Excluded from the analysis were hybrid electric vehicles and flexible fuel vehicles. Both are eligible for VRT relief of up to€2500 depending on the age of the car in respect of certain series production vehicles until 31 December 2010 (DEHLG,2007b). For the first half of 2009, the difference between actual revenue (€205 million) and revenue according to the abovemethodology (€184 million) was 11%; this is the margin of error in the following calculations.
For the Baseline scenario, there is a difference of only 1% between new and old VRT revenue returns; this in spite of 57% ofcars paying less under the new VRT system. However, for Year 1 there is a 21% difference between new and old VRT revenuereturns. The difference between Baseline under the old VRT system and Year 1 under the new VRT system is 33%. Excluding
Table 13Economic impact of new VRT system on baseline car sales.
Paying more (%) Paying less (%)
All fuels 43 57Petrol 50 50Diesel 26 74
Table 14Share of savings per fuel for Year 1.
Magnitude of saving (%) Diesel PetrolCumulative share (%) Cumulative share (%)
>50 3 0>40 22 0>30 70 8>20 91 48>10 95 64
>0 96 74
Please cite this article in press as: Rogan, F., et al. Impacts of an emission based private car taxation policy – First year ex-post analysis.Transport. Res. Part A (2011), doi:10.1016/j.tra.2011.03.007
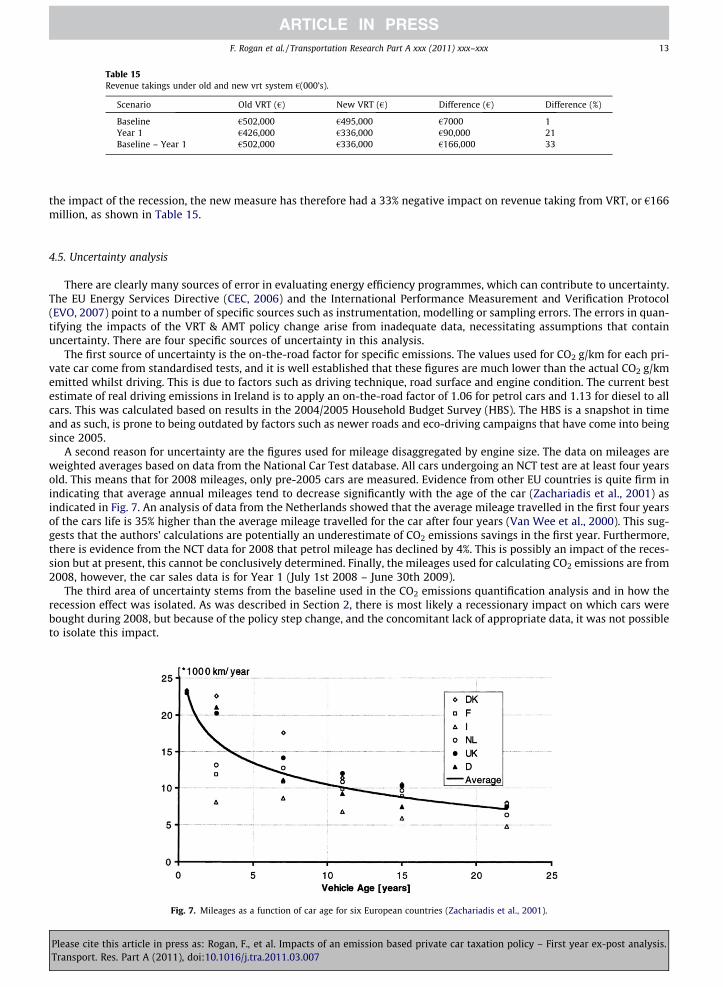
Table 15Revenue takings under old and new vrt system €(000’s).
Scenario Old VRT (€) New VRT (€) Difference (€) Difference (%)
Baseline €502,000 €495,000 €7000 1Year 1 €426,000 €336,000 €90,000 21Baseline – Year 1 €502,000 €336,000 €166,000 33
F. Rogan et al. / Transportation Research Part A xxx (2011) xxx–xxx 13
the impact of the recession, the new measure has therefore had a 33% negative impact on revenue taking from VRT, or €166million, as shown in Table 15.
4.5. Uncertainty analysis
There are clearly many sources of error in evaluating energy efficiency programmes, which can contribute to uncertainty.The EU Energy Services Directive (CEC, 2006) and the International Performance Measurement and Verification Protocol(EVO, 2007) point to a number of specific sources such as instrumentation, modelling or sampling errors. The errors in quan-tifying the impacts of the VRT & AMT policy change arise from inadequate data, necessitating assumptions that containuncertainty. There are four specific sources of uncertainty in this analysis.
The first source of uncertainty is the on-the-road factor for specific emissions. The values used for CO2 g/km for each pri-vate car come from standardised tests, and it is well established that these figures are much lower than the actual CO2 g/kmemitted whilst driving. This is due to factors such as driving technique, road surface and engine condition. The current bestestimate of real driving emissions in Ireland is to apply an on-the-road factor of 1.06 for petrol cars and 1.13 for diesel to allcars. This was calculated based on results in the 2004/2005 Household Budget Survey (HBS). The HBS is a snapshot in timeand as such, is prone to being outdated by factors such as newer roads and eco-driving campaigns that have come into beingsince 2005.
A second reason for uncertainty are the figures used for mileage disaggregated by engine size. The data on mileages areweighted averages based on data from the National Car Test database. All cars undergoing an NCT test are at least four yearsold. This means that for 2008 mileages, only pre-2005 cars are measured. Evidence from other EU countries is quite firm inindicating that average annual mileages tend to decrease significantly with the age of the car (Zachariadis et al., 2001) asindicated in Fig. 7. An analysis of data from the Netherlands showed that the average mileage travelled in the first four yearsof the cars life is 35% higher than the average mileage travelled for the car after four years (Van Wee et al., 2000). This sug-gests that the authors’ calculations are potentially an underestimate of CO2 emissions savings in the first year. Furthermore,there is evidence from the NCT data for 2008 that petrol mileage has declined by 4%. This is possibly an impact of the reces-sion but at present, this cannot be conclusively determined. Finally, the mileages used for calculating CO2 emissions are from2008, however, the car sales data is for Year 1 (July 1st 2008 – June 30th 2009).
The third area of uncertainty stems from the baseline used in the CO2 emissions quantification analysis and in how therecession effect was isolated. As was described in Section 2, there is most likely a recessionary impact on which cars werebought during 2008, but because of the policy step change, and the concomitant lack of appropriate data, it was not possibleto isolate this impact.
Fig. 7. Mileages as a function of car age for six European countries (Zachariadis et al., 2001).
Please cite this article in press as: Rogan, F., et al. Impacts of an emission based private car taxation policy – First year ex-post analysis.Transport. Res. Part A (2011), doi:10.1016/j.tra.2011.03.007
14 F. Rogan et al. / Transportation Research Part A xxx (2011) xxx–xxx
The final area of uncertainty comes from a multiplication of two averages. In the final calculation of total CO2 emissionsfor Year 1, the average CO2 g/km by ‘‘micro-category’’ is multiplied by average mileage by ‘‘micro-category’’. Multiplicationof these two averages accounts for an error of ±1–2%.
5. Conclusions
This ex-post analysis has identified significant changes in private car purchasing patterns since the introduction of the cartax policy change in Ireland, which led to greater than expected emissions savings and significant revenue loss. The analysisof car purchasing to the end of 2010 indicates the trajectory of new car trends but the quantification of emissions savings andrevenue loss has been confined to Year 1. This analysis removed the recession effect in order to focus on the impacts of thepolicy change alone. The methodology applied in this paper can be readily applied to other countries, as much of the dataused is available in other jurisdictions. It is very important that such analyses are undertaken in order to demonstrate theimpacts of policies in a quantitative manner.
The VRT/AMT policy change acted as a strong price signal and consumer response was greater than anticipated. The re-sponse was interesting in a number of ways in that there was not a switch to smaller engine sizes but a fuel switch towardsdiesel. While the policy was very effective in terms of emissions reductions, it did not achieve the revenue neutral goal,allowing for the recession effect on VRT/AMT revenues. There is clearly scope through careful adjustments to the emissionstax bands to achieve a more balanced outcome with respect to CO2 emissions savings on the one hand and revenue intake onthe other.
The policy brought Ireland below the EU average for specific CO2 emissions. It also moved Ireland to within 11% of the EUtarget of 130 g/km by 2012. Although this ex-post analysis is only the first year, the early signs are that this policy has beenparticularly effective. This should help raise the profile of this type of policy, particularly when studies that seek to find pol-icy solutions to the transport energy challenge, fail to include a car tax policy that drives lower emissions (Poudenx, 2008;Stanley et al., 2009).
Acknowledgement
The authors are grateful to Neil Cammish for his data-mining work and advice on all aspects of the analysis.
References
ACEA, 2009. European Car Manufacturer Association (ACEA) Industry report. <www.acea.be/statistics>.CEC, 2006. Directive 2006/32/EC of the European Parliament and of Council of 5th April 2006 on Energy End-Use Efficiency and Energy Services. ed
Communities, C.o.t.E., BrusselsChang, 2006. California’s Sustainable Energy Policies Provide A Model For The Nation. Published by Natural Resources Defense Council. <http://
docs.nrdc.org/air/files/air_06033101a.pdf>.CSO, 2010. National Income and Expenditure. Central Statistics Office, Ireland, 1–16.Daly, H., Ó Gallachóir, B.P., 2011. Modelling private car energy demand using a technological car stock model. Transportation Research Part D: Transport and
Environment 16, 93–101.DEHLG, 2007a. National Climate Change Strategy 2007–2012. Published by the Department of Environment, Heritage and Local Government.DEHLG, 2007b. Vehicle Labelling. Published by the Department of Environment, Heritage and Local Government. <http://www.environ.ie/en/Environment/
Atmosphere/ClimateChange/VehicleLabelling>.DEHLG, 2010. Motor Tax – General Information.EC, 2007. Results of the Review of the Community Strategy to Reduce CO2 Emissions from Passenger cars and Light-Commercial Vehicles, 1–11.EC, 2008. European Energy and Transport Trends to 2030 – Update 2007.Efficiency–Valuation–Organization, 2007. International Performance Measurement and Verification Protocol, vol. 1. Published by Efficiency Valuation
Organization: April 2007, Washington, USA. <www.evo-world.org>.EVO, 2007. International Performance Measurement and Verification Protocol, vol. 1. Published by Efficiency Valuation Organization: April 2007,
Washington, USA. <www.evo-world.org>.Frondel, M., Schmidt, C.M., Vance, C., 2010. A regression on climate policy: The European Commission’s legislation to reduce CO2 emissions from
automobiles. Transportation Research Part A, 1–9.Giblin, S., McNabola, A., 2009. Modelling the impacts of a carbon emission-differentiated vehicle tax system on CO2 emissions intensity from new vehicle
purchases in Ireland. Energy Policy 37, 1404–1411.Government-Publications, 2009. House of Commons, Environmental Audit Committee (Tenth report of session 2007–2008) Vehicle Excise Duty as an
Environmental Tax.Hita, I., Dupont, M., Romon, X., 2009. How can IPMVP be ‘‘Adopted’’ in a European Country where M&V Methods are not so Widespread (France)? Illustration
through the presentation of 2 case-studies. ECEEE 2009 Summer Study.Howley, M., O’Leary, F., Ó Gallachóir, B.P., 2007 Energy in Transport 2007 Report. Report published by Sustainable Energy Ireland.Howley, M., Ó Gallachóir, B.P., Dennehy, E., 2008. Energy in Ireland 2008 Report. Report published by Sustainable Energy Ireland.Howley, M., Ó Gallachóir, B.P., 2009. Data Gaps and Barriers – Experience from Ireland. In: Proceedings of IEA Workshop on Data, Analysis and Policy: The
Three Faces of Energy Efficiency Indicators, Paris.Howley, M., Dennehy, E., Ó Gallachóir, B.P., 2009a. Energy in Transport 2009 Report. Report published by Sustainable Energy Ireland.Howley, M., Ó Gallachóir, B.P., Dennehy, E., 2009b. The greening of the vehicle registration tax (VRT) and the annual motor system in Ireland. In: Proc.
ODYSSEE Workshop May 18–19, 2009, Paris, France.Howley, M., Dennehy, E., Ó Gallachóir, B.P., 2010. Energy in Ireland 2010 Report. Report published by Sustainable Energy Ireland.Hull, D., Ó Gallachóir, B.P., Walker, N., 2009. Development of a modelling framework in response to new European energy–efficiency regulatory obligations:
The Irish experience. Energy Policy 37, 5363–5375.Mandell, S., 2009. Policies towards a more efficient car fleet. Energy Policy 37, 5184–5191.McAleer, M., 2009. State VRT falls by €597m <http://www.irishtimes.com/newspaper/motors/2009/0722/1224251061499.html> Irish Times.Moore, A.T., Staley Jr., S.R., R.W.P., 2010. The role of VMT reduction in meeting climate change policy goals. Transportation Research Part A 44, 565–574.
Please cite this article in press as: Rogan, F., et al. Impacts of an emission based private car taxation policy – First year ex-post analysis.Transport. Res. Part A (2011), doi:10.1016/j.tra.2011.03.007
F. Rogan et al. / Transportation Research Part A xxx (2011) xxx–xxx 15
Ó Gallachóir, B.P., Howley, M., Cunningham, S., Bazilian, M., 2009. How private car purchasing trends offset efficiency gains and the successful energy policyresponse. Energy Policy 37, 3790–3802.
Poudenx, P., 2008. The effect of transportation policies on energy consumption and greenhouse gas emission from urban passenger transportation.Transportation Research Part A, 1–9.
Reynolds, D., Johnson, K., Cullen, G., 2009. Best Practices For Developing Cost-Effective Evaluation, Measurement, And Verification Plans: Lessons LearnedFrom 12 Northern California Municipal Utilities. ECEEE 2009 Summer Study. <http://www.eceee.org/summer_study/>, Nice, France.
Energy Efficiency Watch, 2009. Final Report on the Evaluation of National Energy Efficiency Action Plans. <http://www.energy-efficiency-watch.org/fileadmin/eew_documents/Documents/Results/EEW_-_Final_Report_July_2009.pdf>.
Shiau, C.-S.N., Michalek, J.J., Hendrickson, C.T., 2009. A structural analysis of vehicle design responses to corporate average fuel economy policy.Transportation Research Part A 43, 814–828.
Schüle, R., Arens, C., Breuer, T., Fülöp, O., Höfele, V., Rudolph,F., Becker, D., Jaeger, J., Jaworski, P., Kleßmann, C., 2009. Energy Efficiency Watch Final Report onthe Evaluation of National Energy Efficiency Action Plans. <http://www.energy-efficiency-watch.org/fileadmin/eew_documents/Documents/Results/EEW_-_Final_Report_July_2009.pdf>.
Stanley, J.K., Hensher, D.A., Loader, C., 2009. Road transport and climate change: stepping off the greenhouse gas. Transportation Research Part A 1–11.Sterner, T., 2007. Fuel taxes: an important instrument for climate policy. Energy Policy 1–9.Van den Brink, R.M.M., Van Wee, B., 2001. Why has car-fleet specific fuel consumption not shown any decrease since 1990? Quantitative analysis of Dutch
passenger car-fleet specific fuel consumption. Transportation Research Part D: Transport and Environment 6, 75–93.Van Wee, B., Moll, H.C., Dirks, J., 2000. Environmental impact of scrapping old cars. Transportation Research Part D: Transport and Environment 5, 137–143.Zachariadis, T., Ntziachristos, L., Samaras, Z., 2001. The effect of age and technological change on motor vehicle emissions. Transportation Research Part D:
Transport and Environment 6, 221–227.
Please cite this article in press as: Rogan, F., et al. Impacts of an emission based private car taxation policy – First year ex-post analysis.Transport. Res. Part A (2011), doi:10.1016/j.tra.2011.03.007
Related Documents


![Estimation of CO2 emission reduction and economic impacts of ICT ...€¦ · 2 emission reduction and economic impacts of ICT services using AIM/CGE [Japan] Machiko Shinozuka, Xiaoxi](https://static.cupdf.com/doc/110x72/5f0da3287e708231d43b5735/estimation-of-co2-emission-reduction-and-economic-impacts-of-ict-2-emission.jpg)


