ESB National Grid Page 1 February 2004 Impact of Wind Power Generation In Ireland on the Operation of Conventional Plant and the Economic Implications ESB National Grid February 2004

Welcome message from author
This document is posted to help you gain knowledge. Please leave a comment to let me know what you think about it! Share it to your friends and learn new things together.
Transcript

ESB National Grid Page 1 February 2004
Impact of Wind Power Generation
In Ireland
on the
Operation of Conventional Plant
and the
Economic Implications
ESB National Grid
February 2004

ESB National Grid Page 2 February 2004
DISCLAIMER
This Report contains general and technical information, which is subject to change from time to time without notice. Whilst it strives to ensure as high a level of accuracy as possible, ESBNG makes no warranties or representations of any kind with respect to: (a) the content of this document (including without limitation its quality, accuracy, and completeness), or (b) the content of any other document [or website] referred to [or accessed by means of a hypertext link through this document]. Use of this document and the information it contains is solely at the User's own risk. ESBNG does not accept liability for any loss or damage arising from use of this document or reliance on the information it contains.
COPYRIGHT NOTICE All rights reserved. This entire publication is subject to the laws of copyright. This publication may not be reproduced or transmitted in any form or by any means, electronic or manual, including photocopying without the prior written permission of the TSO

ESB National Grid Page 3 February 2004
Table of Contents 1. Introduction............................................................................................................... 4
1.1 Background......................................................................................................... 4 1.2 Objective ............................................................................................................. 4 1.3 Study Context and Boundaries............................................................................ 5
2. Scenarios .................................................................................................................... 6 2.1 Introduction......................................................................................................... 6 2.2 Wind Capacities Analysed.................................................................................. 6 2.3 System Description ............................................................................................. 7
3. Analysis of Wind Power Series ................................................................................ 9 3.1 Sources of Wind Power Data.............................................................................. 9 3.2 Analysis of Wind Power Time Series................................................................. 9 3.3 Conclusion ........................................................................................................ 14
4. Programs and Methodology................................................................................. 15 4.1 Programs ........................................................................................................... 15 4.2 Modelling of Wind Power ............................................................................. 16 4.3 Methodology – Technical Analysis .................................................................. 16
5. Technical Results .................................................................................................... 18 5.1 Introduction....................................................................................................... 18 5.2 Start-ups ............................................................................................................ 19 5.3 Ramping duty.................................................................................................... 20 5.4 Capacity Factor ................................................................................................. 22
6. Capacity Credit ....................................................................................................... 24 7. Financial Analysis .................................................................................................. 26
7.1 Introduction....................................................................................................... 26 7.2 Fuel Cost Savings ............................................................................................. 26 7.3 Capital Cost for Extra Capacity ........................................................................ 28 7.4 Total Generation Cost - Bid Prices ................................................................... 29 7.5 Gas Prices.......................................................................................................... 30 7.6 Results............................................................................................................... 30 7.7 Indifference Price.............................................................................................. 31 7.8 Summary ........................................................................................................... 32
8. Emissions ................................................................................................................. 33 9. Conclusions.............................................................................................................. 36
Appendix 1 - Current Status of WPG Connections .................................................... 37 Appendix 2 - Plant Portfolio ........................................................................................ 38 Appendix 3 - Operations Profile for a single CCGT ................................................... 39 Appendix 4 - Electrical Output and Fuel Inputs .......................................................... 40 Appendix 5 - Investment Costs Estimates ................................................................. 41 Appendix 6 - Indicative Bid Prices.............................................................................. 42

ESB National Grid Page 4 February 2004
1. Introduction
1.1 Background The EU has set down indicative targets for the production of electricity from renewable sources for all member countries. The EU targets imply that, on average, across all member states, 22% of Europe’s electricity needs should be produced from renewable sources. To meet Ireland’s target, 13.2% of the primary electricity needs should come from renewable sources by 2010. ESB National Grid seeks to facilitate this move towards greater renewable energy usage. Given Ireland’s large wind resource, the increasing technical and commercial experience which has been gained within the industry and the level of interest in Wind Powered Generation (WPG), it is clear that more of our electricity needs will be met by WPG in the future. At the time of publication there is 210 MW of WPG connected to the network, with a further 598 MW with signed connection offers. In addition, 900 MW of applications have been made, giving a potential total of approximately 1700 MW1.
1.2 Objective The primary purpose of this study is to analyse and quantify the impact of increasing levels of Wind Powered Generation (WPG) on the Ireland’s generation system in general and more specifically on the operation of conventional plant. It has long been the accepted wisdom that the integration of WPG within the Irish system would impact on overall generation operation and costs. However the exact nature and scale of these impacts have not previously been quantified as detailed modeling of both WPG2 and conventional plant is required. This report seeks to quantify and explain, for the first time, some of these impacts, subject to a given set of input assumptions. These impacts are incurred by the system’s thermal plant, and are of two kinds: technical and financial. The impact on Emissions – of CO2 in particular – is also discussed. Relatively large capacities of WPG are considered, from 500 MW to 3500 MW, corresponding to wind energy penetrations in the order of 5% to 30%. It is important to stress at the outset that the study placed no limitations on wind power production. Electricity from wind was regarded as a ‘must take’ contract. This was done in such a manner that both system generation adequacy and operational integrity were maintained.
1 See Appendix 1 for details. 2 Measured data for both off-shore and diverse on-shore sites has only been available since 2002.

ESB National Grid Page 5 February 2004
The objective of this work was to anticipate some aspects of the future benefits and limitations of WPG, so as to inform industry participants and policy makers. It is hoped that the identification, and quantification, of the issues will allow the potential benefit of Ireland’s wind energy resource to be more optimally harnessed with due respect for the technical and financial implications.
1.3 Study Context and Boundaries. The study focused on the Republic of Ireland only. The costs/savings documented in this report refer to the financial implications, in terms of reduced or increased generation costs, of integrating WPG within a conventional generation system. It does not consider the cost of redesigning the conventional system to facilitate WPG. The study does not address transmission issues. Neither does it address concerns arising in the short term (from milliseconds to one hour), in relation to such areas as system stability, frequency regulation, fault ride-through capability, minute to minute load following, and reserve provision. Such issues are being actively considered by ESB National Grid and various industry participants in other forums. Other impacts of wind, such as increased fuel diversity, have not been commented on, as this report focuses on issues which may not have been previously understood or fully quantified. In this regard the study is a typical generation planning analysis, carried out from a strategic system perspective, and considering only generation units and the demand imposed on them. Modelling was to a time interval of one hour.

ESB National Grid Page 6 February 2004
2. Scenarios
2.1 Introduction To examine the effects of wind on the power system and on other conventional thermal plant in particular, two future systems were considered. The first looks at the medium term when the system peak winter demand will be 5000MW. According to the latest Generation Adequacy Report (2004-2010) a peak demand of 5000MW is forecast to occur in the period 2007-2010. The 6500MW peak is selected to represent the system in the long term and based on current projections such a peak will not occur until the next decade at the earliest. Such a long term view is of particular interest to establish long term policy with regard to the development for wind. As this is a strategic study the exact year in which these levels of demand pertain are not critical to the matters under consideration.
2.2 Wind Capacities Analysed For each of these systems a range of estimates for installed wind capacity is studied. The figures are selected to encompass a broad range of possible values so that a complete picture of the impact of wind on the system in both the medium and long-term may be built up. Figure 1 shows the data for the wind scenarios studied. Listed is the capacity, the energy from Wind Powered Generation (WPG) and the Wind Energy Penetration (WEP). Throughout this report the term ‘wind penetration’ refers to the amount of energy provided by WPG as a percentage of the total energy requirement, rather than the fraction of the total installed capacity which WPG represents.
Capacity Energy Wind Energy Capacity Energy Wind Energy Penetration Penetration
(MW) (TWh) (%) (MW) (TWh) (%)
0 0.0 0.0 0 0.0 0.0500 1.5 5.2 1500 4.5 11.71000 3.0 10.5 2500 7.5 19.61500 4.6 15.7 3500 10.5 27.4
'5000 MW peak' System '6500 MW peak' System
Figure 1

ESB National Grid Page 7 February 2004
The WEP expresses the energy from wind as a percentage from the total system demand. This is a useful parameter as targets for wind and renewable energy are commonly stated in terms of WEP. For example the EU Directive on the Promotion of Electricity from Renewable Energy (2001) has established a target for renewable energy at 13.2% of gross electricity consumption for Ireland. The target for the EU as a whole is some 22%. Allowing for our existing large-scale hydro stations and projections of other renewable sources – small hydro, biomass and landfill – these EU targets require wind energy to provide approximately 10% to achieve the ROI target and approximately 19% to match the EU target.
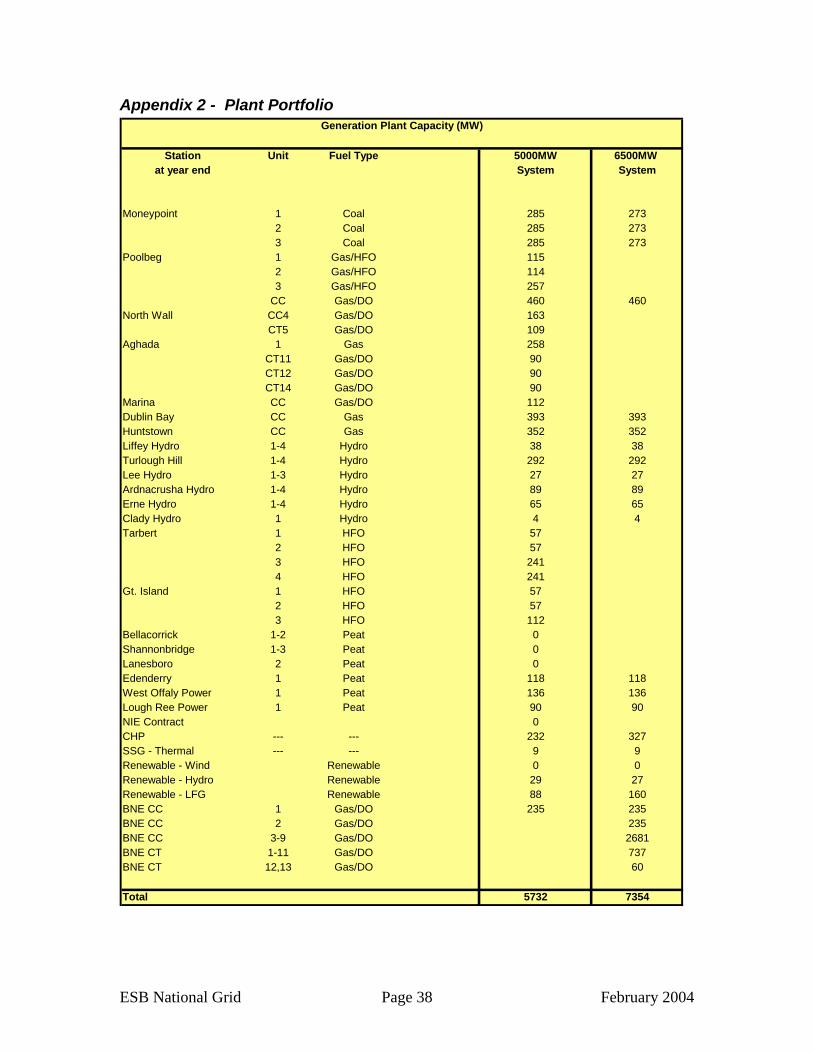
2.3 System Description The plant comprising each of the two systems is detailed in Appendix 2. The ‘5000MW peak’ system comprises the existing3 conventional plant with various levels of wind generation added. For the base study there is no wind plant on the system. As the various amounts of wind are introduced into the studies, plant will be dropped to maintain the system at the criterion level of adequacy. This is discussed in more detail in section 6. Figure 2 shows the relative amounts of energy from wind and non-wind sources for the ‘5000MW peak’ system: Figure 2 The ‘6500MW peak’ system was used to simulate the long term implications of increasing levels of WPG . It has been assumed that the older ESB thermal plant with the exception of Poolbeg Combined Cycle (CC) and Moneypoint has been replaced and augmented by a mixture of CC and Combustion Turbine (CT) units. (The Moneypoint units were assumed to be retro-fitted with Flue Gas Desulphurisation (FGD)). As above, the intended aim is to maintain system adequacy and again some of these units are omitted as increased amounts of wind are introduced into the studies. 3 Additional plant consisting of one 235MW Combined Cycle unit is added to maintain generation adequacy.
Wind / Non-Wind Energy1500MW Wind
84.3% 15.7%
Wind
Non-Wind '5000MW peak' System
Wind / Non-Wind Energy1000MW Wind
89.5% 10.5%
'5000MW peak' System
Wind / Non-Wind Energy500MW Wind
5.2%94.8%
'5000MW peak' System

ESB National Grid Page 8 February 2004
The relative amounts of energy from wind and non-wind sources considered in these studies for the ‘6500MW peak’ system is illustrated in Figure 3: Figure 3
Wind / Non-Wind Energy3500MW Wind
72.6%27.4%
Wind
Non-Wind '6500MW peak' System
Wind / Non-Wind Energy2500MW Wind
80.4%
19.6%
'6500MW peak' System
Wind / Non-Wind Energy1500MW Wind
11.7%88.3%
'6500MW peak' System
ESB National Grid Page 9 February 2004
3. Analysis of Wind Power Series
3.1 Sources of Wind Power Data The validity of the wind power time series used was considered to be of fundamental importance to the reliability of the whole study. Initially it was thought that for off-shore data the best that could be done was to obtain a time series of wind speeds from Met Éireann, and then commission a wind power laboratory such as ECN in The Netherlands, or UCD, to estimate the corresponding power output time series from a wind farm situated in the range 50 to 100 km from the Met station. However it was decided to approach an off-shore East Coast wind farm developer for assistance. This developer agreed to provide a power output time series for calendar 2001, based on wind speed measurements taken on-site for Phase 1 (60 MW) of their proposed development. The time resolution was 30 minutes, and the wind farm output time series allowed, inter alia, for farm layout and wake effects. This was very satisfactory, and clearly much superior to extrapolation from wind speed measurements taken up to 100 km away. The capacity factor of the proposed wind farm for 2001 was in excess of 35%. For on-shore WPG metered data of power output from 18 existing wind farms for the same times through calendar 2001 was available. The time resolution here was 15 minutes, but this was aggregated so as to match the off-shore data. The overall capacity factor of the 18 on-shore wind farms for 2001 was 33.4%.
3.2 Analysis of Wind Power Time Series Extensive analysis was carried out on the wind power time series to ensure its validity. Figure 4 shows a histogram of the yearly frequency of downward power fluctuations for the proposed off-shore wind farm, scaled to a size of 250 MW. The time resolution is 30 minutes. The frequency distribution is as expected. Because of the large number of fluctuations in the interval 0 to 10 MW these are omitted. There are large numbers of small fluctuations, which gradually decrease as the size of the downward power fluctuations increases. Figure 5 shows a histogram of the yearly frequency of upward power fluctuations for the same wind farm. It will be observed that this is remarkably similar to the histogram of downward power fluctuations. This is characteristic of wind farm power fluctuations, and served to confirm the validity of the data. For this reason only downward power fluctuations will be shown from now on.

ESB National Grid Page 10 February 2004
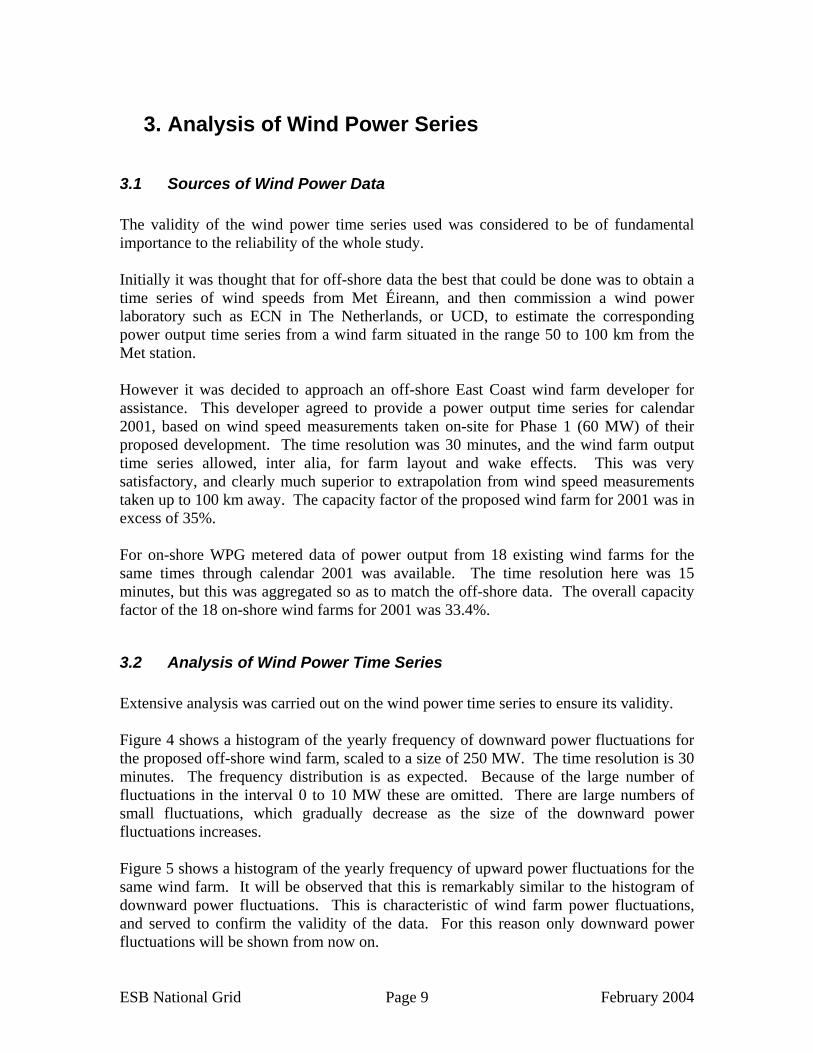
Figure 4 Figure 5 Figure 6 shows a histogram of the yearly frequency of downward power fluctuations for a 15 MW wind farm in County Donegal, scaled to a size of 250 MW. The time resolution is 30 minutes. The frequency distribution is as expected. Because of the large number of fluctuations in the interval 0 to 10 MW these are omitted. There are large numbers of small fluctuations, which gradually decrease as the size of the downward power fluctuations increases. Figure 7 shows a histogram of the same kind for a 15 MW wind farm in County Kerry, again scaled to a size of 250 MW. The time resolution is 30 minutes as before. The frequency distribution is as anticipated. Because of the large number of fluctuations in
0
200
400
600
800
1000
1200
1400
1600Ye
arly
Fre
quen
cy
20 40 60 80 100 120 140 160 180 200 220 240
Downward Power Fluctuations (MW)
Off-shore Data250 MW Capacity
30 mins
0
200
400
600
800
1000
1200
1400
1600
Year
ly F
requ
ency
20 40 60 80 100 120 140 160 180 200 220 240
Upward Power Fluctuations (MW)
Off-shore Data250 MW Capacity
30 mins
ESB National Grid Page 11 February 2004
the interval 0 to 10 MW these are omitted. Both these on-shore wind farms have fluctuation frequency distributions quite similar to each other, and to that of the off-shore wind farm. It is perhaps worth noting that the full outputs (250 MW) of these three wind farms are never lost in full during a 30-minute time interval. This is more likely to be because this full output was never achieved, rather than that the time interval is not sufficiently long to capture this. In fact analyses over a 24-hour time interval confirmed this. Figure 6 Figure 7
0
200
400
600
800
1000
1200
1400
1600
1800
Year
ly F
requ
ency
20 40 60 80 100 120 140 160 180 200 220 240
Downward Power Fluctuations (MW)
Donegal Windfarm250 MW Capacity
30 mins
0
200
400
600
800
1000
1200
1400
1600
1800
Yea
rly F
requ
ency
20 40 60 80 100 120 140 160 180 200 220 240
Downward Power Fluctuations (MW)
Kerry Windfarm250 MW Capacity
30 mins
ESB National Grid Page 12 February 2004
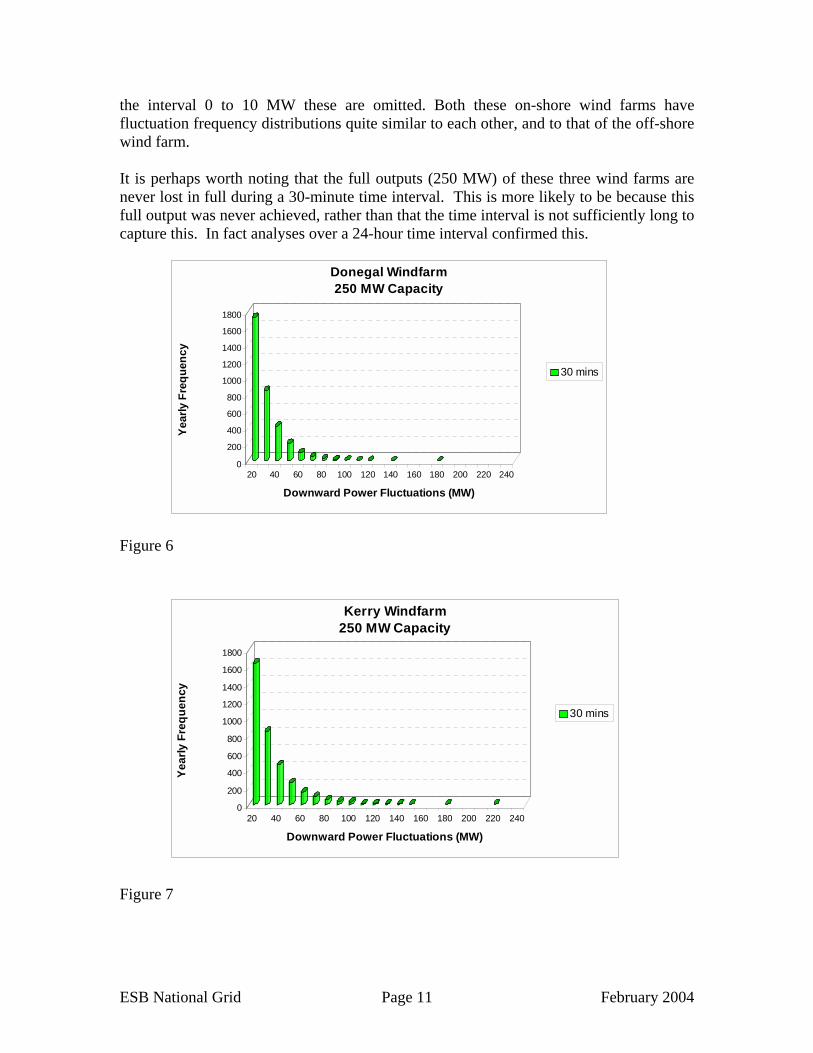
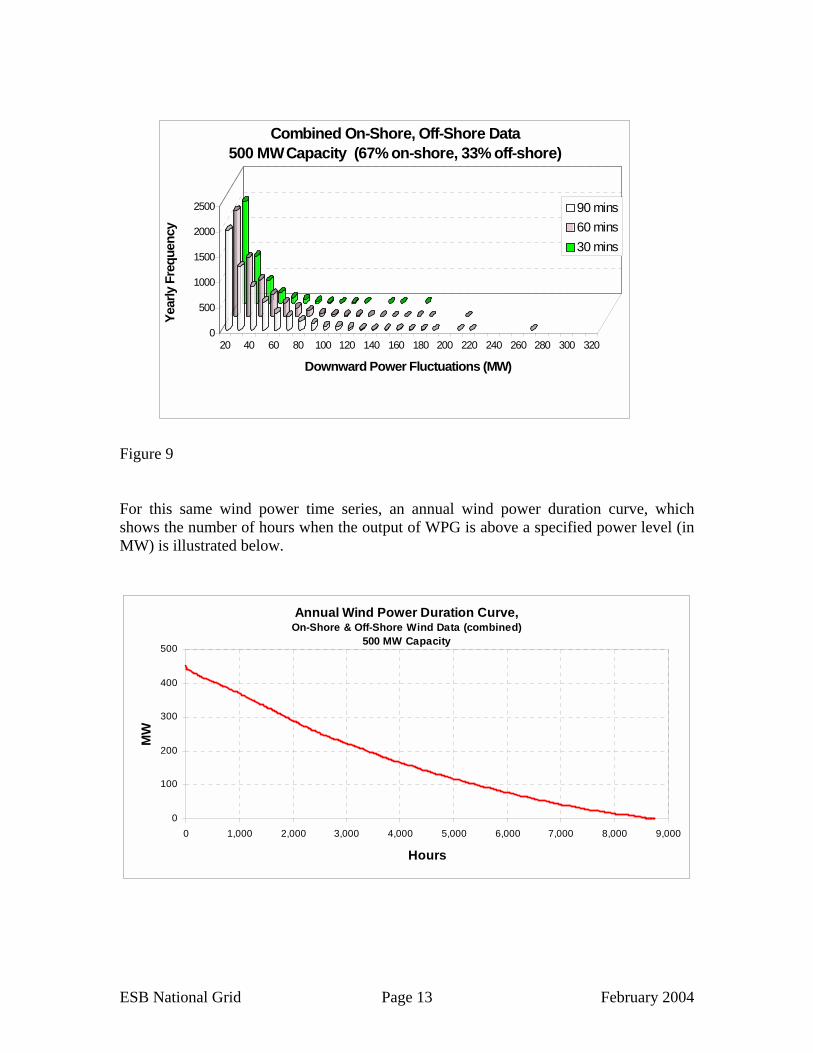
Figure 8 Figure 8 is a yearly frequency fluctuation histogram for all eighteen (18) on-shore wind farms, scaled for comparison to a size of 250 MW. The distribution here is much more compact than for on-shore or off-shore single wind farms. This is due to siting diversity, with the wind farms located from Kerry to Donegal. In this regard locating relatively small on-shore wind farms in the south and south-east of the country would be beneficial in reducing the intermittency of wind power as seen by system generation. The opposite effect would result from the construction of a very large wind farm on a single site, whether on-shore or off-shore. Further investigations were carried out on the effect of the time interval on the fluctuation frequency histogram, and nothing untoward was found. The final decision to be made was in relation to the on-shore/off-shore split in relation to combining the on-shore and off-shore wind power time series. It was decided following analyses to proceed on the basis of a 67% on-shore and 33% off-shore combination. This has the advantage of being in line with the source capacities involved, viz. 120 MW on-shore and 60 MW off-shore. Furthermore to increase off-shore capacity any further could be considered too speculative on the basis of actual construction to date. The capacity factor of the composite wind data for calendar 2001 was 34.7%. Figure 9 shows the yearly fluctuation frequency distribution for the combined wind power time series. Modelling will be to a time interval of one hour, and the frequency distributions for 30 minutes and 90 minutes are as expected. The combined frequency distribution is the anticipated compromise between the composite on-shore distribution and the single off-shore distribution.
0
200
400
600
800
1000
1200Ye
arly
Fre
quen
cy
20 40 60 80 100 120 140 160 180 200 220 240
Downward Power Fluctuations (MW)
Composite On-shore Data250 MW Capacity
30 mins
ESB National Grid Page 13 February 2004
Figure 9 For this same wind power time series, an annual wind power duration curve, which shows the number of hours when the output of WPG is above a specified power level (in MW) is illustrated below.
Annual Wind Power Duration Curve,On-Shore & Off-Shore Wind Data (combined)
500 MW Capacity
0
100
200
300
400
500
0 1,000 2,000 3,000 4,000 5,000 6,000 7,000 8,000 9,000
Hours
MW
0
500
1000
1500
2000
2500
Year
ly F
requ
ency
20 40 60 80 100 120 140 160 180 200 220 240 260 280 300 320
Downward Power Fluctuations (MW)
Combined On-Shore, Off-Shore Data500 MW Capacity (67% on-shore, 33% off-shore)
90 mins60 mins30 mins

ESB National Grid Page 14 February 2004
3.3 Conclusion The WPG model used in these simulation studies assumes diverse wind farm locations, and includes the impact of off-shore wind capacity. This assumption will lessen the adverse impact of WPG on conventional plant, as the aggregate output of such dispersed WPG is less volatile and intermittent than if it was all located within a single region and subject to similar, or more homogeneous, wind conditions.

ESB National Grid Page 15 February 2004
4. Programs and Methodology
4.1 Programs Two computer programs were used in the analyses: CREEP and PROMOD. The former is used to determine the ‘adequacy’ of the generation system. The latter performs simulations on the operation of the system. Both these programs are now briefly described. CREEP The program name is an acronym for Capacity Requirement Evaluation by Exact Probability. CREEP uses an analytical procedure to determine future generation capacity requirements. It is the program used in preparing Generation Adequacy Reports, published by ESB NG. CREEP requires that the capacity (MW), scheduled outage duration (weeks) and forced outage probability (%) of each generation unit on the system be specified. A demand model must also be specified, comprising the estimated total demand at every hour of the future year to be studied. The program then calculates the Loss of Load Expectation (LOLE) for the year under study for the specified generation plant aggregate and hourly demand profile. The standard LOLE accepted for generation adequacy on the ROI system is 8 hours per year. Iteration may be required to adjust the generation plant aggregate until the LOLE is acceptably close to the standard, given the discrete sizes in which generation units are commercially available. PROMOD This is an hourly Monte Carlo generation production simulation program, used to determine system performance and cost. It is a complex and very powerful tool for system analysis, with separate commitment and dispatch algorithms. The commitment process refers to the selection of a number of generators, from the total portfolio, which are to be used to meet customer demand. The decision as to when these generators should come on or off line is also part of the commitment process. So, for example, additional generation is committed on Monday mornings in order to meet higher weekday (than weekend) demand. The dispatch process refers to the decisions taken on the loading of individual generation units. Thus the contribution from each on-line, or committed, unit towards meeting customer demand is determined by the dispatch decision.
ESB National Grid Page 16 February 2004
The Monte Carlo element of the program relates to the treatment of the forced outages of generation units and to the duration of their outages. These outages occur randomly during the year, yet conform to the specified forced outage probability values. The duration of each outage varies randomly about a mean outage time, which is specified in advance. This element of the program adds greatly to the realism of the simulation. Full technical performance characteristics and operational cost details of each generation unit on the system must be specified. An hourly system demand profile, as in CREEP, is also required. The program output provides complete details of the operation of each generation unit. These are aggregated into system totals. A wide range of output reports is available, from system summaries to hour by hour information on individual generators.
4.2 Modelling of Wind Power For the purpose of these studies it was assumed that the output of WPG could be predicted with a high degree of accuracy. This is a slightly optimistic assumption, which reduces the impact on conventional plant. However the option of assuming little or no forecasting ability was thought to be unrealistic given the current level of research and development activity in this area. In CREEP, wind power is modelled as negative demand. The hourly wind profile is subtracted from the original hourly demand profile, and computation of the LOLE is based on the decremented demand profile. Modelling of wind power in this manner was found to be quite satisfactory in CREEP. An alternative approach was devised for use in PROMOD. The hourly wind power profile was modelled as three components. One component was a 24-hour average, seen by the commitment algorithm, as a forecast of wind power would be. Then there were two varying components, corresponding to variations above and below the 24-hour average. These components were not seen by the commitment algorithm, but only by the dispatch algorithm. The sum of the three components of course equalled the total wind power output at each hour. Features in PROMOD enabled the hourly wind power series to be modelled easily in this way. It is an original approach, and simulates the real-life situation in a realistic manner.
4.3 Methodology – Technical Analysis In each of the two future generation systems described in section 2 above, all existing WPG was removed in establishing the reference system. In this way there is a clear-cut comparison between a reference system excluding all WPG and systems including the different levels of WPG referred to earlier.

ESB National Grid Page 17 February 2004
The reference system was first of all checked for standard system generation adequacy using CREEP. Then as increasing levels of WPG were added to the reference system, existing thermal plant was removed so as to maintain standard system adequacy. In the case of the ‘5000MW peak’ System, the oldest and smallest plant was removed first. In the case of the ‘6500MW peak’ System, where all the thermal plant was relatively new, an appropriate mix of CCGTs and OCGTs was removed as required. PROMOD studies were then carried out on each reference system, and on the corresponding systems with three different levels of WPG added. All four systems for each scenario were validly comparable, in that each met the system generation adequacy criterion. Thus the technical and financial impact of the different levels of WPG could be assessed. Information on primary energy diversity and emissions of CO2 were also obtained. The technical results are described in section 5, capacity requirements in section 6 and the financial results are presented in section 7. Section 8 quantifies the impact of WPG on CO2 emissions, and examines some of the economic issues.

ESB National Grid Page 18 February 2004
5. Technical Results
5.1 Introduction The electrical output from Wind Powered Generation (WPG) is intermittent in nature. Unlike conventional plant the output is not necessarily related to customer demand. Maximum wind production may occur during low customer demand periods and conversely at times of peak demand there may be little or no WPG. As WPG may be subject to priority dispatch (and has a very low variable production cost) this analysis assumes that the electricity produced by wind is always accepted onto the system and that the output of WPG is curtailed by wind conditions alone. As a consequence the output required from the other sources of electricity is more volatile in nature. This report examines three measures of performance that display the increasing operational duty on thermal plant as a result of a rising WPG. The three parameters examined are ; Start-ups. A large amount of energy is required to start-up large thermally powered units. For example a large oil fired unit can consume 3000 GJ of energy during the start-up process, and if a typical price for oil is 350 cents/GJ a single start up would cost €10,500. The start-up process is also a quite onerous on the mechanical integrity of the unit. Even for peaking units such as open cycle gas turbines it is quite common to determine the allowable period between maintenance outages by specifying a maximum permissible number of start-ups. From our detailed hourly unit commitment and dispatch studies the number of start-ups required per annum, as WPG is increases, has been determined. Ramping duty. The ability to pick up or reduce load on a generation unit is limited by the thermal and mechanical stresses imposed on the unit during the process of changing load levels. It is normal for manufacturers to specify a maximum permissible ramp-up and ramp down rate in terms of MW per minute. Ramp up rates in the range of 1 to 10 MW per minute and ramp-down rates in the range from 1 to 15 MW per minute are typical performance levels for thermal units. As there are limits to the ramp rate on individual units a number of units must act in unison in order to maintain the demand supply balance during periods when either the demand or supply of electricity is changing rapidly. For this study the impact of increasing levels of WPG on the ramping duty of units was quantified by determining the ‘Average Hourly MW Change’ for a unit over a period of one year. The higher the Average Hourly MW Change the more onerous the ramping duty and hence the greater the mechanical and thermal stresses being imposed on the thermal units. Capacity Factor. The capacity factor of a unit is a measure of the annual energy that the unit produces compare to the maximum possible production level. Therefore for a unit to have a 100% capacity factor it must operate at its full output for every hour of the year, while a 50% capacity factor can be achieved, for example, by either running at half load for every hour of the year or running at full load for only half the hours of the year.
ESB National Grid Page 19 February 2004
Capacity factor is therefore a measure of the utilisation of a unit. Typically the most economic base-load units will have a capacity factor in the range of 75 to 90 % largely curtailed by the necessity to maintain the unit. Mid-merit units tend to operate in the range from 20 to 75 % while low-merit (peaking) units tend to operate at capacity factors below 20%. Units with a high capacity factor can generally charge a lower price per unit of energy produced (MWhr) as they are recovering their costs over a large volume of output. At the other extreme peaking units, with a low capacity factor, may need to charge a very high price per unit of output in order to recover their costs over a much lower volume. The analysis looks at two system sizes and at three wind energy penetrations in each system. The three measures of thermal plant performance are plotted for the three main categories of thermal generation plant: high-merit or base-load units, mid-merit units and low-merit units. The impact of increasing amounts of wind is continuous in nature and it is possible to build up a broad picture of the continuously demanding impact on conventional generation plant by this method.
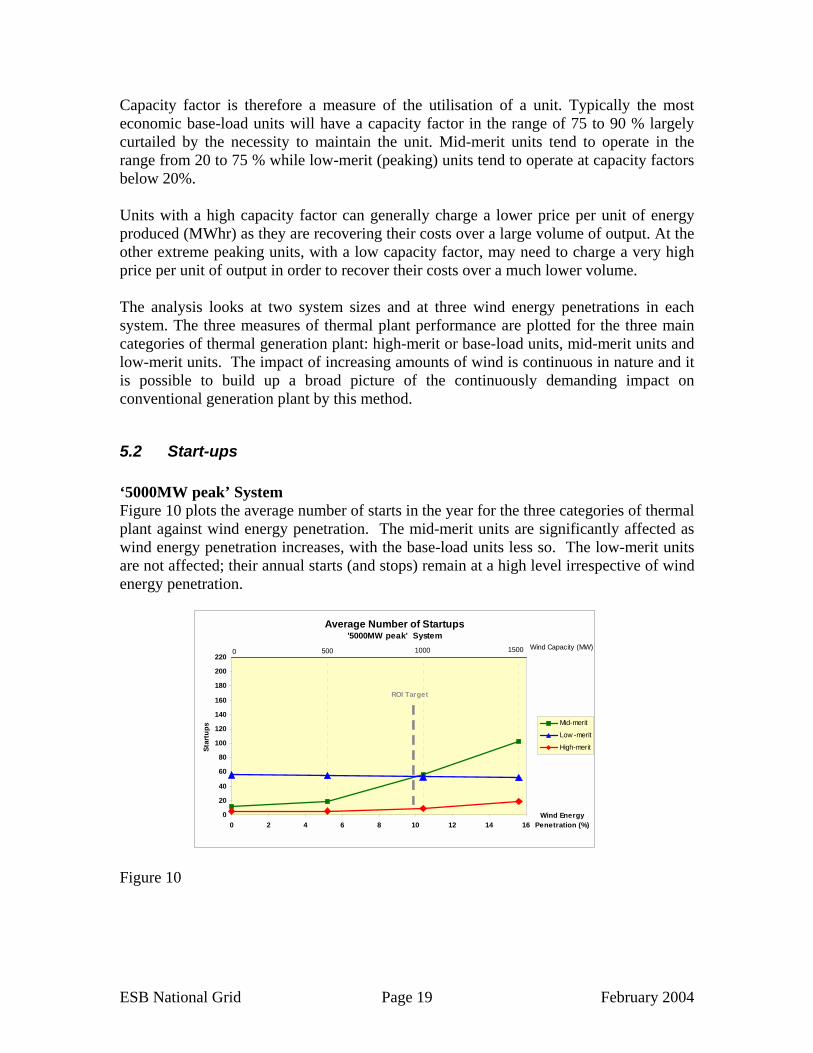
5.2 Start-ups ‘5000MW peak’ System Figure 10 plots the average number of starts in the year for the three categories of thermal plant against wind energy penetration. The mid-merit units are significantly affected as wind energy penetration increases, with the base-load units less so. The low-merit units are not affected; their annual starts (and stops) remain at a high level irrespective of wind energy penetration. Figure 10
Average Number of Startups'5000MW peak' System
Wind Capacity (MW)150010005000
0
20
40
60
80
100
120
140
160
180
200
220
0 2 4 6 8 10 12 14 16Wind Energy
Penetration (%)
Star
tups
Mid-merit
Low -merit
High-merit
ROI Target
ESB National Grid Page 20 February 2004
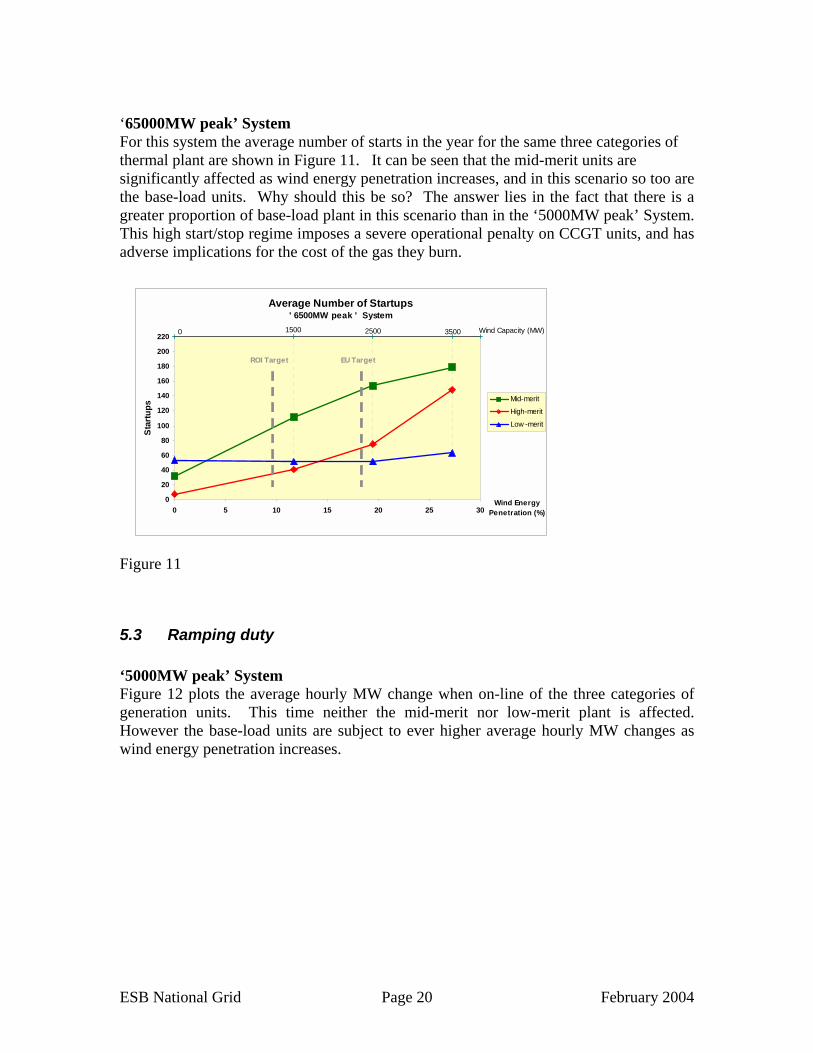
‘65000MW peak’ System For this system the average number of starts in the year for the same three categories of thermal plant are shown in Figure 11. It can be seen that the mid-merit units are significantly affected as wind energy penetration increases, and in this scenario so too are the base-load units. Why should this be so? The answer lies in the fact that there is a greater proportion of base-load plant in this scenario than in the ‘5000MW peak’ System. This high start/stop regime imposes a severe operational penalty on CCGT units, and has adverse implications for the cost of the gas they burn. Figure 11
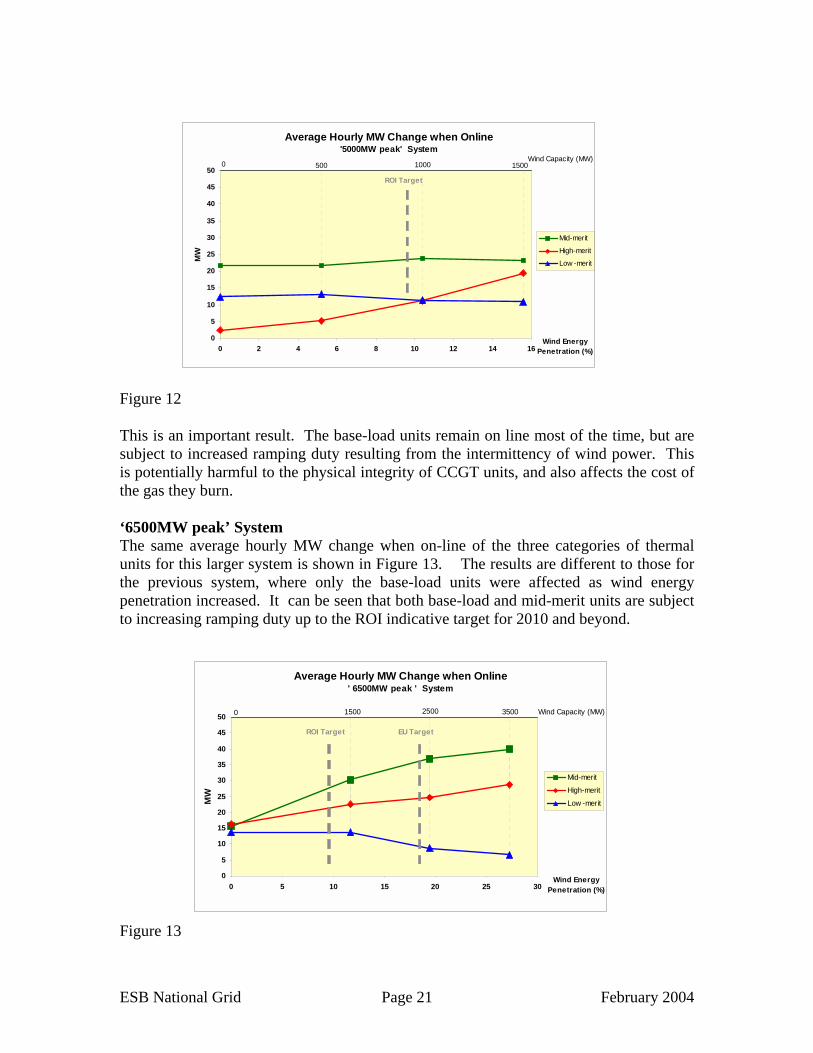
5.3 Ramping duty ‘5000MW peak’ System Figure 12 plots the average hourly MW change when on-line of the three categories of generation units. This time neither the mid-merit nor low-merit plant is affected. However the base-load units are subject to ever higher average hourly MW changes as wind energy penetration increases.
Average Number of Startups' 6500MW peak ' System
Wind Capacity (MW)3500250015000
0
20
40
60
80
100
120
140
160
180
200
220
0 5 10 15 20 25 30Wind Energy
Penetration (%)
Sta
rtup
s Mid-merit
High-merit
Low -merit
ROI Target EU Target
ESB National Grid Page 21 February 2004
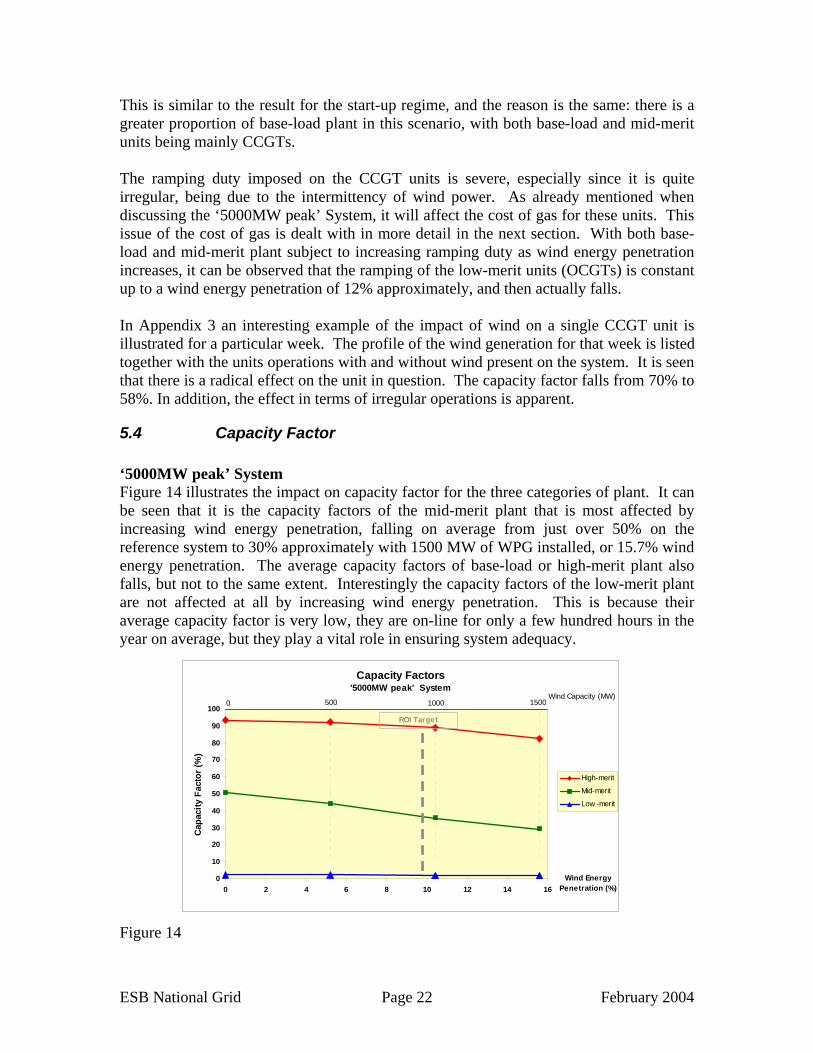
Figure 12 This is an important result. The base-load units remain on line most of the time, but are subject to increased ramping duty resulting from the intermittency of wind power. This is potentially harmful to the physical integrity of CCGT units, and also affects the cost of the gas they burn. ‘6500MW peak’ System The same average hourly MW change when on-line of the three categories of thermal units for this larger system is shown in Figure 13. The results are different to those for the previous system, where only the base-load units were affected as wind energy penetration increased. It can be seen that both base-load and mid-merit units are subject to increasing ramping duty up to the ROI indicative target for 2010 and beyond. Figure 13
Average Hourly MW Change when Online' 6500MW peak ' System
Wind Capacity (MW)3500250015000
0
5
10
15
20
25
30
35
40
45
50
0 5 10 15 20 25 30Wind Energy
Penetration (%)
MW
Mid-merit
High-merit
Low -merit
ROI Target EU Target
Average Hourly MW Change when Online'5000MW peak' System
500 1000Wind Capacity (MW)
15000
0
5
10
15
20
25
30
35
40
45
50
0 2 4 6 8 10 12 14 16Wind Energy
Penetration (%)
MW
Mid-merit
High-merit
Low -merit
ROI Target
ESB National Grid Page 22 February 2004
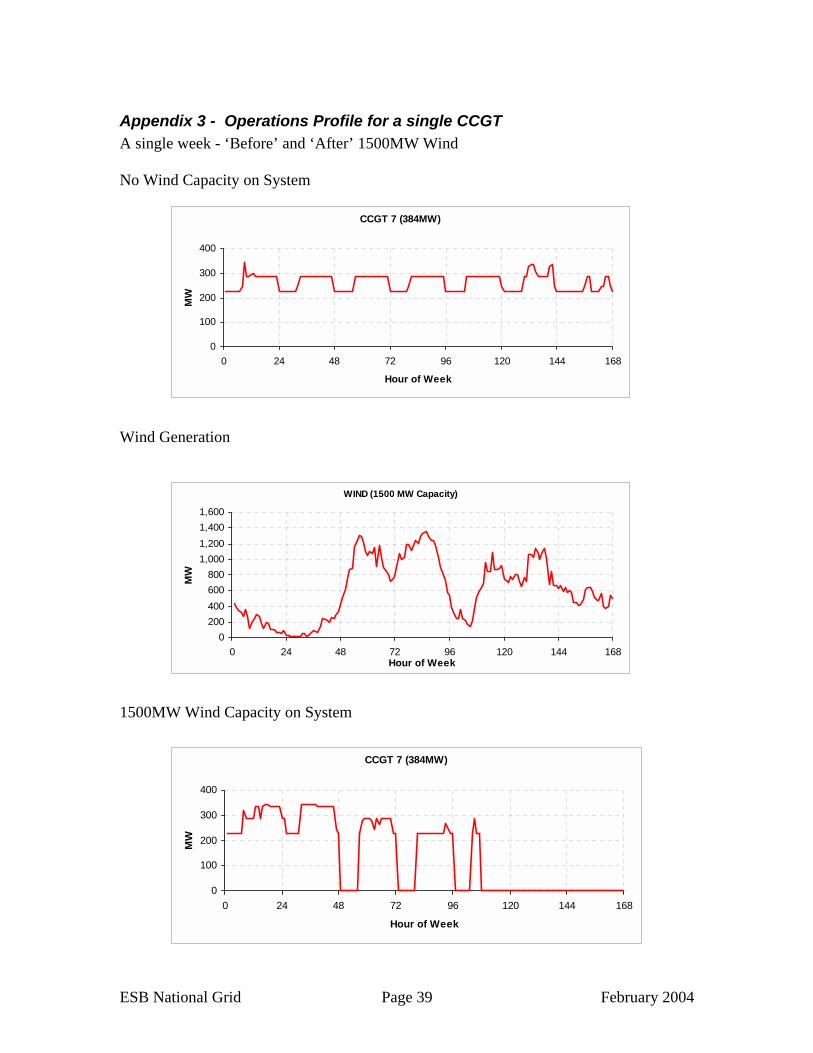
This is similar to the result for the start-up regime, and the reason is the same: there is a greater proportion of base-load plant in this scenario, with both base-load and mid-merit units being mainly CCGTs. The ramping duty imposed on the CCGT units is severe, especially since it is quite irregular, being due to the intermittency of wind power. As already mentioned when discussing the ‘5000MW peak’ System, it will affect the cost of gas for these units. This issue of the cost of gas is dealt with in more detail in the next section. With both base-load and mid-merit plant subject to increasing ramping duty as wind energy penetration increases, it can be observed that the ramping of the low-merit units (OCGTs) is constant up to a wind energy penetration of 12% approximately, and then actually falls. In Appendix 3 an interesting example of the impact of wind on a single CCGT unit is illustrated for a particular week. The profile of the wind generation for that week is listed together with the units operations with and without wind present on the system. It is seen that there is a radical effect on the unit in question. The capacity factor falls from 70% to 58%. In addition, the effect in terms of irregular operations is apparent.
5.4 Capacity Factor ‘5000MW peak’ System Figure 14 illustrates the impact on capacity factor for the three categories of plant. It can be seen that it is the capacity factors of the mid-merit plant that is most affected by increasing wind energy penetration, falling on average from just over 50% on the reference system to 30% approximately with 1500 MW of WPG installed, or 15.7% wind energy penetration. The average capacity factors of base-load or high-merit plant also falls, but not to the same extent. Interestingly the capacity factors of the low-merit plant are not affected at all by increasing wind energy penetration. This is because their average capacity factor is very low, they are on-line for only a few hundred hours in the year on average, but they play a vital role in ensuring system adequacy. Figure 14
Capacity Factors'5000MW peak' System
Wind Capacity (MW)500 1000 15000
0
10
20
30
40
50
60
70
80
90
100
0 2 4 6 8 10 12 14 16Wind Energy
Penetration (%)
Cap
acity
Fac
tor (
%)
High-merit
Mid-merit
Low -merit
ROI Target
ESB National Grid Page 23 February 2004
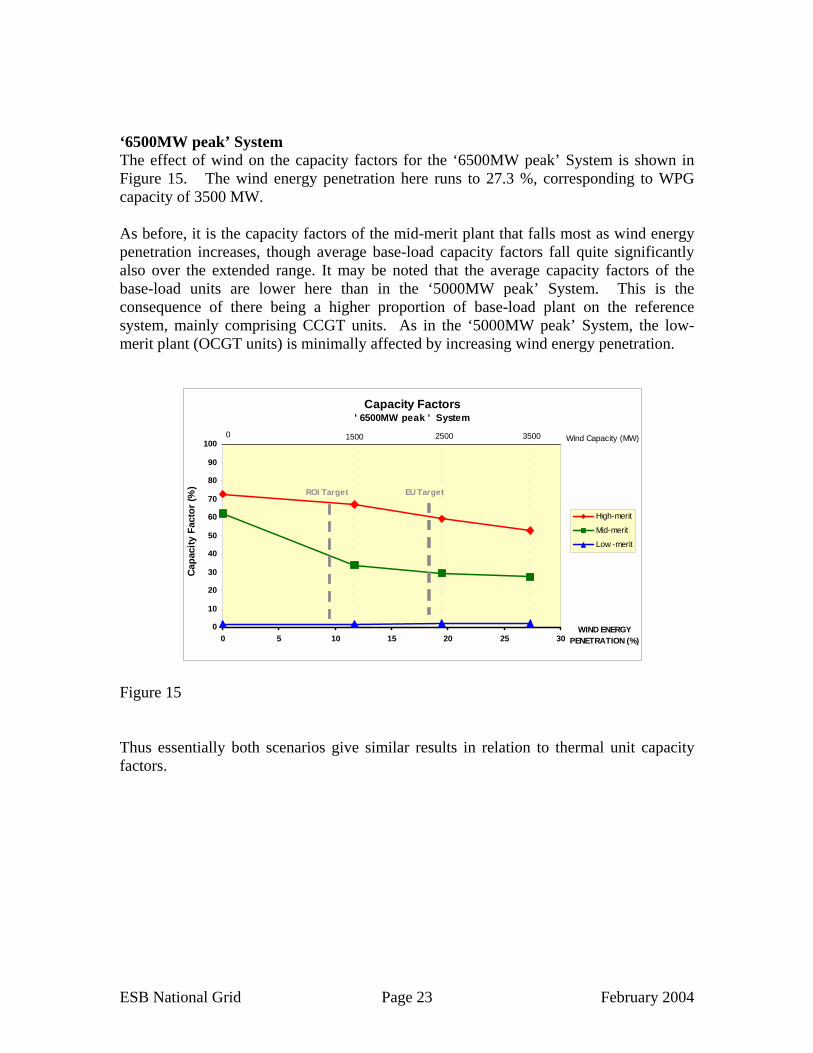
‘6500MW peak’ System The effect of wind on the capacity factors for the ‘6500MW peak’ System is shown in Figure 15. The wind energy penetration here runs to 27.3 %, corresponding to WPG capacity of 3500 MW. As before, it is the capacity factors of the mid-merit plant that falls most as wind energy penetration increases, though average base-load capacity factors fall quite significantly also over the extended range. It may be noted that the average capacity factors of the base-load units are lower here than in the ‘5000MW peak’ System. This is the consequence of there being a higher proportion of base-load plant on the reference system, mainly comprising CCGT units. As in the ‘5000MW peak’ System, the low-merit plant (OCGT units) is minimally affected by increasing wind energy penetration. Figure 15 Thus essentially both scenarios give similar results in relation to thermal unit capacity factors.
Capacity Factors' 6500MW peak ' System
0 1500 2500 3500 Wind Capacity (MW)
0
10
20
30
40
50
60
70
80
90
100
0 5 10 15 20 25 30WIND ENERGY
PENETRATION (%)
Cap
acity
Fac
tor (
%)
High-merit
Mid-merit
Low -merit
ROI Target EU Target
ESB National Grid Page 24 February 2004
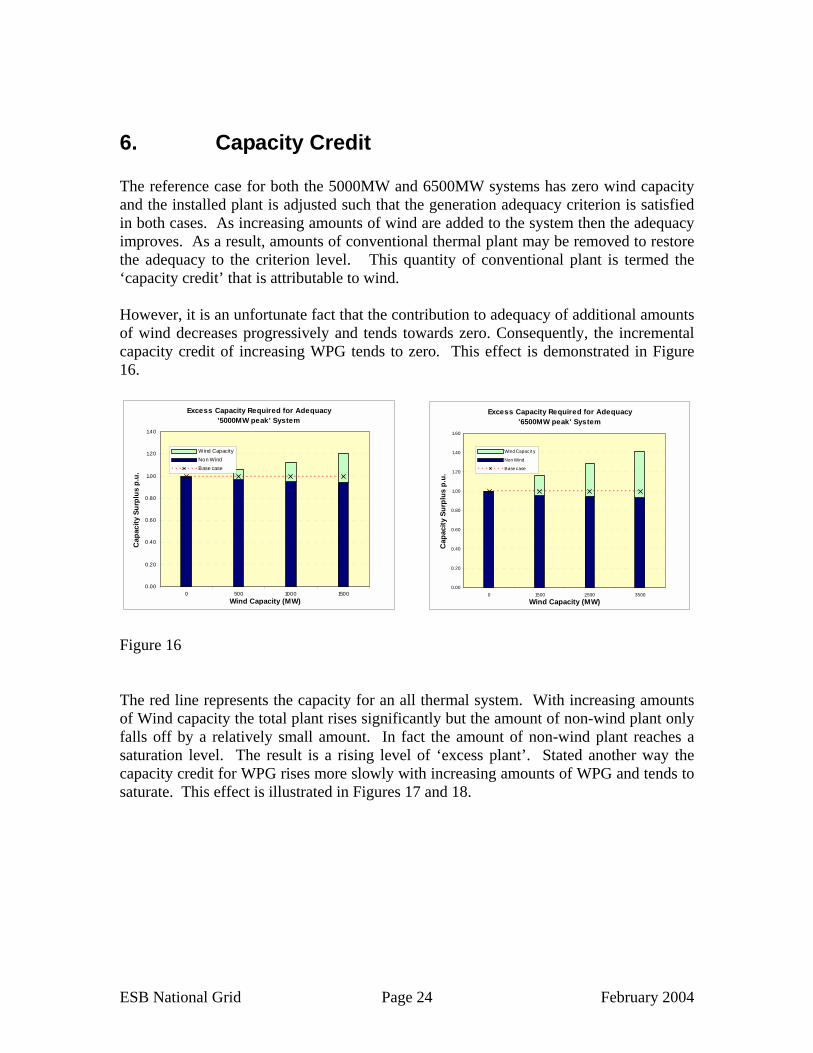
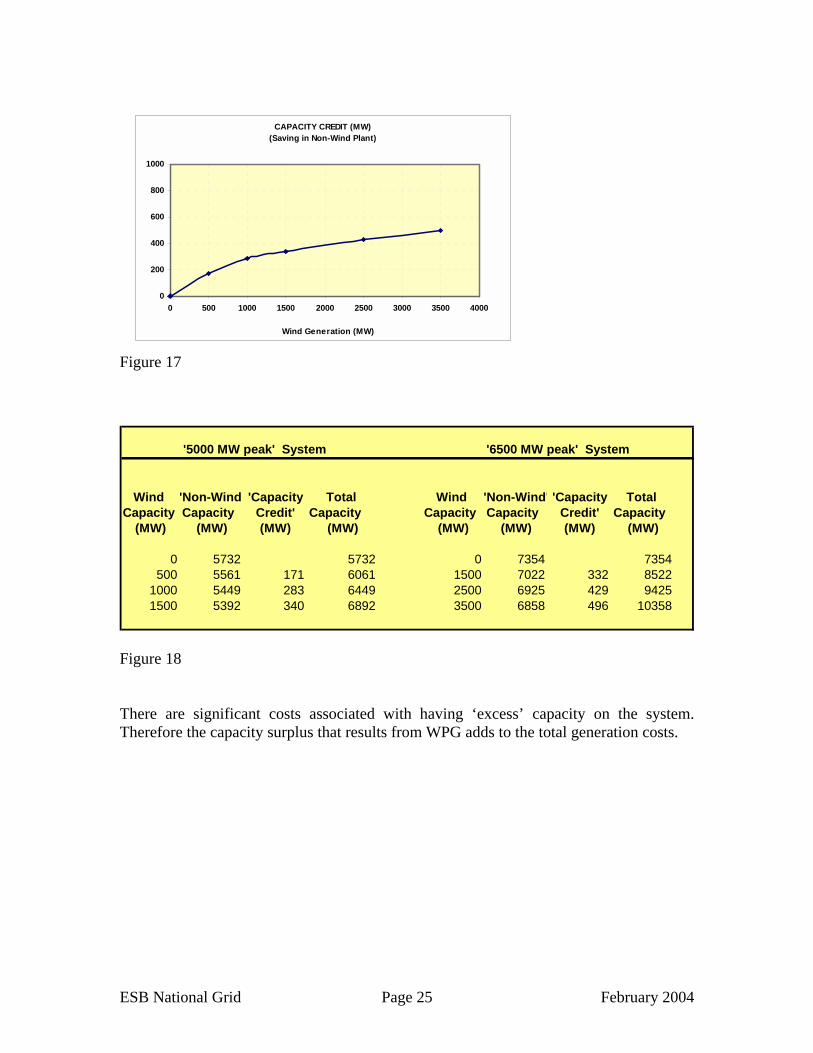
6. Capacity Credit The reference case for both the 5000MW and 6500MW systems has zero wind capacity and the installed plant is adjusted such that the generation adequacy criterion is satisfied in both cases. As increasing amounts of wind are added to the system then the adequacy improves. As a result, amounts of conventional thermal plant may be removed to restore the adequacy to the criterion level. This quantity of conventional plant is termed the ‘capacity credit’ that is attributable to wind. However, it is an unfortunate fact that the contribution to adequacy of additional amounts of wind decreases progressively and tends towards zero. Consequently, the incremental capacity credit of increasing WPG tends to zero. This effect is demonstrated in Figure 16. Figure 16 The red line represents the capacity for an all thermal system. With increasing amounts of Wind capacity the total plant rises significantly but the amount of non-wind plant only falls off by a relatively small amount. In fact the amount of non-wind plant reaches a saturation level. The result is a rising level of ‘excess plant’. Stated another way the capacity credit for WPG rises more slowly with increasing amounts of WPG and tends to saturate. This effect is illustrated in Figures 17 and 18.
Excess Capacity Required for Adequacy'5000MW peak' System
0.00
0.20
0.40
0.60
0.80
1.00
1.20
1.40
0 500 1000 1500Wind Capacity (MW)
Cap
acity
Sur
plus
p.u
.
Wind CapacityNon WindBase case
Excess Capacity Required for Adequacy'6500MW peak' System
0.00
0.20
0.40
0.60
0.80
1.00
1.20
1.40
1.60
0 1500 2500 3500
Wind Capacity (MW)
Cap
acity
Sur
plus
p.u
.Wind Capacit y
Non Wind
Base case
ESB National Grid Page 25 February 2004
Figure 17
Wind 'Non-Wind' 'Capacity Total Wind 'Non-Wind' 'Capacity Total Capacity Capacity Credit' Capacity Capacity Capacity Credit' Capacity
(MW) (MW) (MW) (MW) (MW) (MW) (MW) (MW)
0 5732 5732 0 7354 7354500 5561 171 6061 1500 7022 332 8522
1000 5449 283 6449 2500 6925 429 94251500 5392 340 6892 3500 6858 496 10358
'5000 MW peak' System '6500 MW peak' System
Figure 18 There are significant costs associated with having ‘excess’ capacity on the system. Therefore the capacity surplus that results from WPG adds to the total generation costs.
CAPACITY CREDIT (MW)(Saving in Non-Wind Plant)
0
200
400
600
800
1000
0 500 1000 1500 2000 2500 3000 3500 4000
Wind Generation (MW)

ESB National Grid Page 26 February 2004
7. Financial Analysis
7.1 Introduction In the preceding section the key technical impacts of increasing levels of wind energy penetration on the system’s thermal plant have been presented. In this section the associated financial implications will be addressed. All costs quoted are in real terms in money values as at the end of 2002. The savings in fuel costs for thermal plant arising from the installation of wind are presented. Following this a simple consideration is made of the additional capital costs attributable to increased wind capacity on the system. It should be noted that the study focused on the costs associated with integrating WPG into a conventional generation system. It does not examine the costs associated with re-designing the system to accommodate WPG.
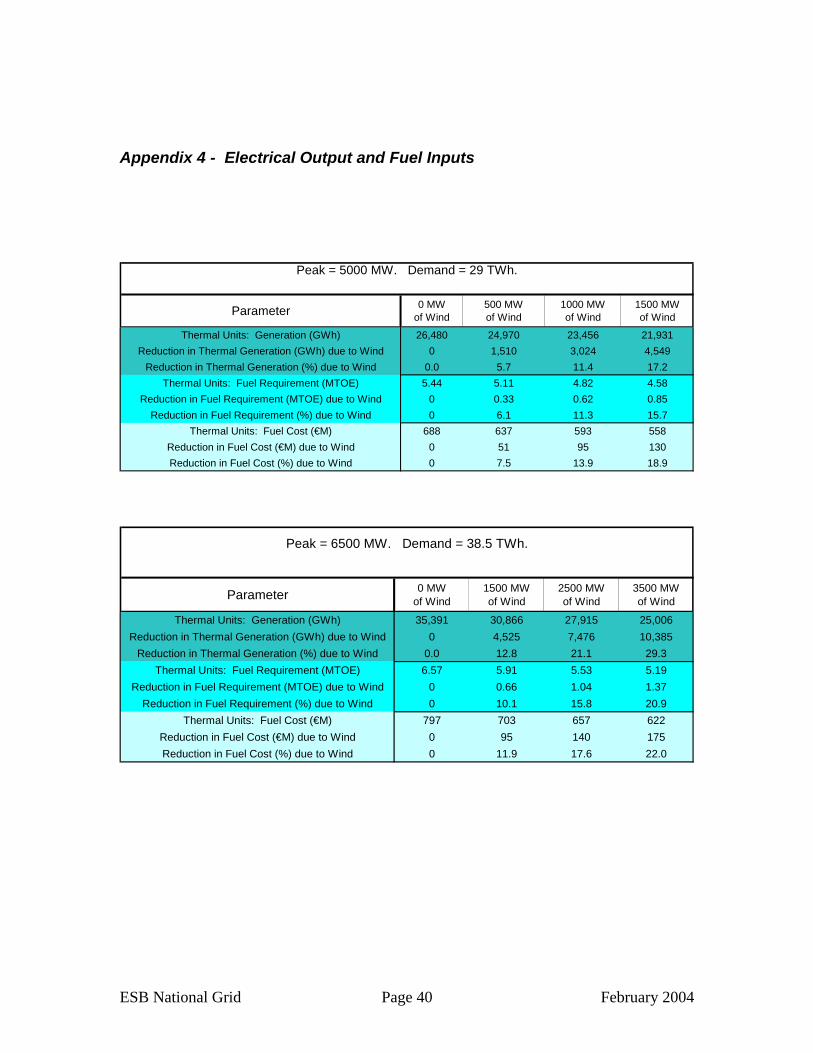
7.2 Fuel Cost Savings The variable production cost of wind is virtually zero and so with increasing wind penetration the total system fuel cost would be expected to fall. However, the adverse impact on thermal plant which was documented in Section 5 causes increased costs. This happens because of a variety of factors such as increased start-ups and lower capacity factor. If plant is operating at lower capacity factors then it may be operating less efficiently. In these studies the energy from Wind plant is proportional to the amount of wind capacity on the system essentially. This replaces an equivalent amount of energy from Thermal plant. It might be expected that this would reduce the fuel costs of the thermal plant in proportion to the reduction in their output. But because of the adverse impact of wind on their operations the fuel costs do not decrease in proportion to the decrease in output. The details are listed in Figure 19 and in Appendix 4.

ESB National Grid Page 27 February 2004
'5000MW peak' System '6500MW peak' System
Wind Capacity (MW) 0 500 1000 1500 Wind Capacity (MW) 0 1500 2500 3500
Thermal Units Thermal Units
Output (GWh) 26,480 24,970 23,456 21,931 Output (GWh) 35,391 30,866 27,915 25,006Reduction (GWh) --- 1,510 3,024 4,549 Reduction (GWh) --- 4,525 7,476 10,385
Reduction (%) --- 5.7 11.4 17.2 Reduction (%) --- 12.8 21.1 29.3
Total (€M) 688 637 593 558 Total (€M) 797 703 657 622Reduction (€M) --- 51 95 130 Reduction (€M) --- 95 140 175Reduction (%) --- 7.5 13.9 18.9 Reduction (%) --- 11.9 17.6 22.0
Ener
gy
Ener
gyC
ost
Cos
t
Figure 19 We look first at the figures for the ‘6500MW peak’ System. When wind capacity increases from 1500MW to 3500MW the energy from wind increases proportionately with a corresponding reduction in energy from the Thermal units [a factor of 2.3 (= 29.3/12.8)]. However, the fuel costs for the thermal plant reduce at a lesser rate [a factor of 1.8 (= 22.0/11.9)]. This is because of increased costs and less efficient operation of these units. In fact, the rate of reduction in thermal fuel cost saving reduces with increasing wind energy penetration as illustrated in Figure 20, giving diminishing marginal returns. Figure 20 In the ‘5000MW peak’ System, this effect is less pronounced. When wind capacity increases by a factor of 3 (=1500/500) the energy from wind increases proportionately as does the reduction in energy from the thermal units. The thermal fuel costs reduce by nearly the same rate - a factor of 2.5. The reason that costs reduce more rapidly in this ‘5000MW peak’ System is that this system is similar to the present system and contains a number of old inefficient units. Thus when wind capacity increases some of the older more inefficient units are removed from the system. This causes the total system to increase in efficiency. In contrast, in the ‘6500MW peak’ system all these inefficient units are presumed to have been retired. As a result when units are omitted with the
Reduction (%) in Cost of Thermal Generation'6500MW peak' System
Pro-rata Reduction
0
5
10
15
20
25
30
35
40
0 1,000 2,000 3,000 4,000
Reduction (%) in Cost of Thermal Generation'5000MW peak' System
Pro-rata Reduction
0
5
10
15
20
25
0 500 1,000 1,500 2,000
ESB National Grid Page 28 February 2004
installation of increasing amounts of wind the overall system does not increase in the same way. The simulation studies capture the reduction in efficiency associated with this disturbance to plant operation, but they do not factor in any additional maintenance time or costs that may be associated with this more onerous regime.
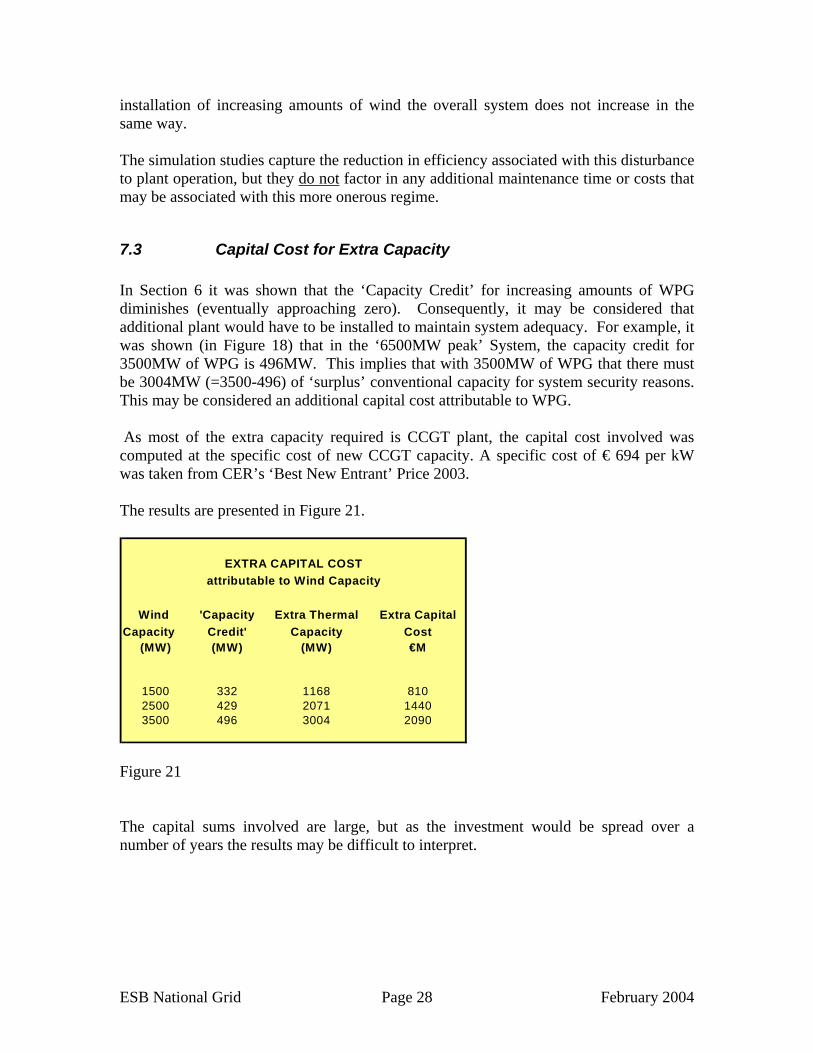
7.3 Capital Cost for Extra Capacity In Section 6 it was shown that the ‘Capacity Credit’ for increasing amounts of WPG diminishes (eventually approaching zero). Consequently, it may be considered that additional plant would have to be installed to maintain system adequacy. For example, it was shown (in Figure 18) that in the ‘6500MW peak’ System, the capacity credit for 3500MW of WPG is 496MW. This implies that with 3500MW of WPG that there must be 3004MW (=3500-496) of ‘surplus’ conventional capacity for system security reasons. This may be considered an additional capital cost attributable to WPG. As most of the extra capacity required is CCGT plant, the capital cost involved was computed at the specific cost of new CCGT capacity. A specific cost of € 694 per kW was taken from CER’s ‘Best New Entrant’ Price 2003. The results are presented in Figure 21.
Wind 'Capacity Extra Thermal Extra CapitalCapacity Credit' Capacity Cost
(MW) (MW) (MW) €M
1500 332 1168 8102500 429 2071 14403500 496 3004 2090
EXTRA CAPITAL COSTattributable to Wind Capacity
Figure 21 The capital sums involved are large, but as the investment would be spread over a number of years the results may be difficult to interpret.

ESB National Grid Page 29 February 2004
7.4 Total Generation Cost - Bid Prices To determine a more meaningful estimate of the financial cost of wind energy it was decided to develop bid prices for the different categories of plant on the projected ‘6500MW peak’ reference system, where all the relevant generation plant can be assumed to be as new. Consequently, it was possible to compare plant on a similar basis where the objective will be to cover fixed and variable costs with an operating margin. This was not be possible for the ‘5000MW peak’ system as full generation costs for the current plant portfolio, where units range from some that have been in service for more than 30 years to some that have just been commissioned, are not available to ESB National Grid. The bid prices allowed for:
• Recovery of capital investment over 15 years, providing a real rate of return of 7.32% per annum – (as for Best New Entrant).
• Fuel costs • Fixed and variable O & M costs
Our analysis is based on the premise that all generation, which is required on the system to maintain the supply demand balance, deserves to recover its full costs (capital and fuel) and thus be economically viable in the long term. In the case of Moneypoint, the only investment considered was that involved in retro-fitting Flue Gas Desulphurisation (FGD) equipment. The net output of the units was reduced as appropriate, and so too were the efficiency values over the operating range. Fixed and variable O & M costs were increased as appropriate. The bid price developed for wind energy allowed only for capital investment and fixed and variable O & M costs. The composite bid price allowed for differing on-shore and of-shore investment costs, and used the combined capacity factor of 34.5% per annum. A bid price for wind energy of € 63.3 / MWh was obtained. This is satisfactorily in line with the most recent support mechanism, Alternative Energy Requirement (AER VI), prices. Wind energy was regarded as a ‘must take’ contract, and thus was dispatched without limitation. All the Capital Costs assumed including those for CCGT plant and CT plant are detailed in Appendix 5. Since the capacity factors with the bid prices were not known in advance, iteration was required with PROMOD (see Section 4.1). However convergence was not too difficult to attain, since the bid prices did not change the merit order.

ESB National Grid Page 30 February 2004
7.5 Gas Prices The price to assign to the gas used in the CCGT plant was clear-cut in the reference case, since there was a definite distinction between base-load and mid-merit units. Gas price projections had been obtained from ILEX, a major UK consulting firm. It would be impracticable to compute the cost of swing for every capacity factor. The consulting firm provided a base-load gas price for CCGTs with capacity factors in excess of 60%, and a mid-merit gas price for CCGT units with lower capacity factors. In the WPG cases, however, the position with regard to the price of gas used in CCGTs was far more complex. Gas is a real-time commodity, and gas trading must be concluded on a daily basis. As described above in sub-section 5.4, the capacity factors of all CCGTs in these cases with WPG were lowered, and in addition the CCGT units were subject to irregular loading and start/stop regimes. These factors will give rise to gas balancing problems, such that gas balancing charges are likely to rise. The design of the gas network will have to cater for maximum through-put when there is no wind power in winter and CCGT and OCGT plant will be running near full load. On average, however, gas through-put will be lower. Accordingly gas network cost per unit will increase. There will be increased use of ‘swing’ gas, which will reduce ‘flat’ gas contracts, and increase gas costs. To estimate the actual cost of gas for all CCGTs on the system would be an impracticable exercise. Accordingly, because of the strategic nature of this study, and the complexity of the gas trading issue, it was decided to use mid-merit gas prices in all CCGTs for the three WPG cases. Mid-merit gas prices were in the order of 12% higher than base-load prices. It is very probable that gas would cost more than this at the 10% wind energy penetration level, and would increase further as wind energy penetration is increased. So the financial results obtained should be seen as indicative limiting values. This is true in another respect also, which has been adverted to in sub-section 5.3 above. No financial cost has been put on the extra ‘wear and tear’ on thermal plant caused by the intermittency of wind.
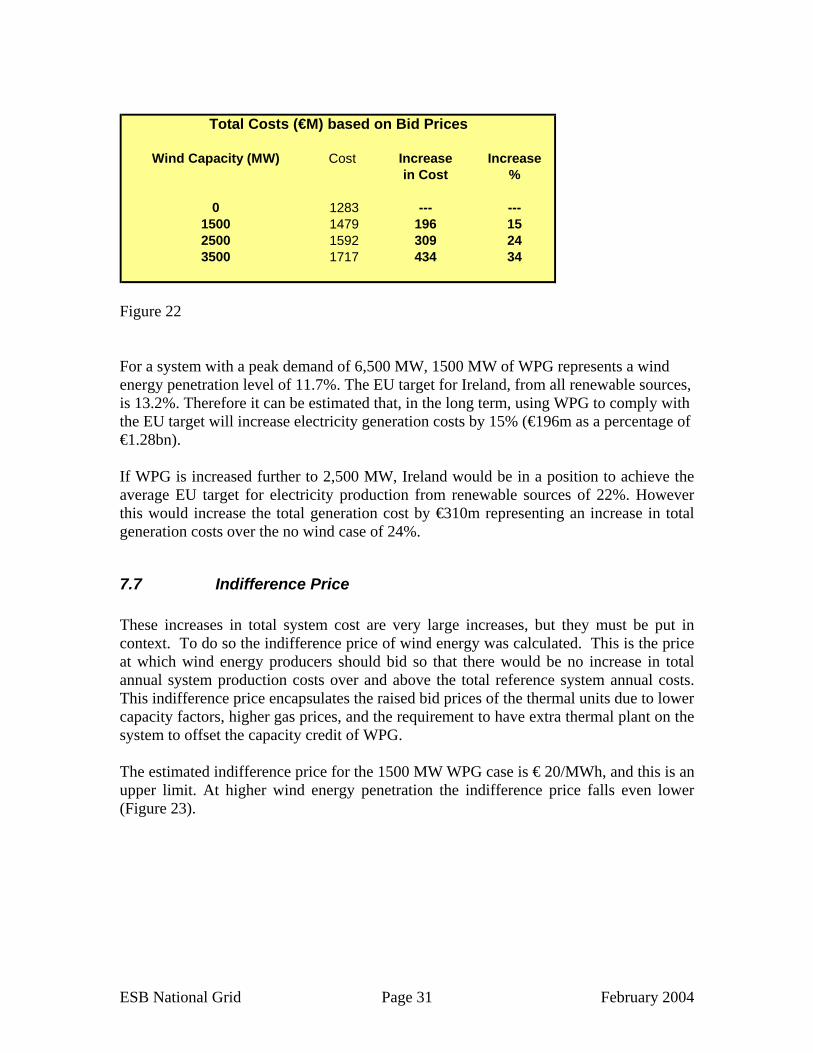
7.6 Results Iteration continued until the bid prices were sufficient to meet the objective outlined above. The resulting total annual system costs allows the additional cost in the three WPG cases to be computed. The results are tabulated in Figure 22. (Details of the bid prices are set out in Appendix 6).
ESB National Grid Page 31 February 2004
Wind Capacity (MW) Cost Increase Increasein Cost %
0 1283 --- ---1500 1479 196 152500 1592 309 243500 1717 434 34
Total Costs (€M) based on Bid Prices
Figure 22 For a system with a peak demand of 6,500 MW, 1500 MW of WPG represents a wind energy penetration level of 11.7%. The EU target for Ireland, from all renewable sources, is 13.2%. Therefore it can be estimated that, in the long term, using WPG to comply with the EU target will increase electricity generation costs by 15% (€196m as a percentage of €1.28bn). If WPG is increased further to 2,500 MW, Ireland would be in a position to achieve the average EU target for electricity production from renewable sources of 22%. However this would increase the total generation cost by €310m representing an increase in total generation costs over the no wind case of 24%.
7.7 Indifference Price These increases in total system cost are very large increases, but they must be put in context. To do so the indifference price of wind energy was calculated. This is the price at which wind energy producers should bid so that there would be no increase in total annual system production costs over and above the total reference system annual costs. This indifference price encapsulates the raised bid prices of the thermal units due to lower capacity factors, higher gas prices, and the requirement to have extra thermal plant on the system to offset the capacity credit of WPG. The estimated indifference price for the 1500 MW WPG case is € 20/MWh, and this is an upper limit. At higher wind energy penetration the indifference price falls even lower (Figure 23).

ESB National Grid Page 32 February 2004
Wind Capacity (MW) Price€/MWh
0 ---1500 202500 <203500 <20
Indifference Price of Wind (€/MWh)
Figure 23 Alternatively, if the increase in annual production costs is spread over the total demand the following values result (see Figure 24). The increase in cost is € 5.1 per MWh for the 1500 MW WPG case, and this increases for higher levels of wind penetration.
Wind Capacity (MW) Penalty€/MWh
0 ---1500 5.12500 >8.03500 >11.3
Increase in Cost (€/MWh)
Figure 24
7.8 Summary It is only when analysed from a total system perspective that the true financial cost of wind energy on the ROI electrical system can be properly determined. The term ‘financial’ is used as some of the economic implications (i.e. externalities) have not been factored into this study. This total system analysis has captured the effects of the capacity credit of WPG, the impacts of wind energy on the thermal plant of the system, and some of the effect of the increased cost of gas used in CCGT generation units. All results obtained from a total system analysis apply in general only to the specific system being studied, and the results from this analysis of the ROI electrical system are no exception.
ESB National Grid Page 33 February 2004
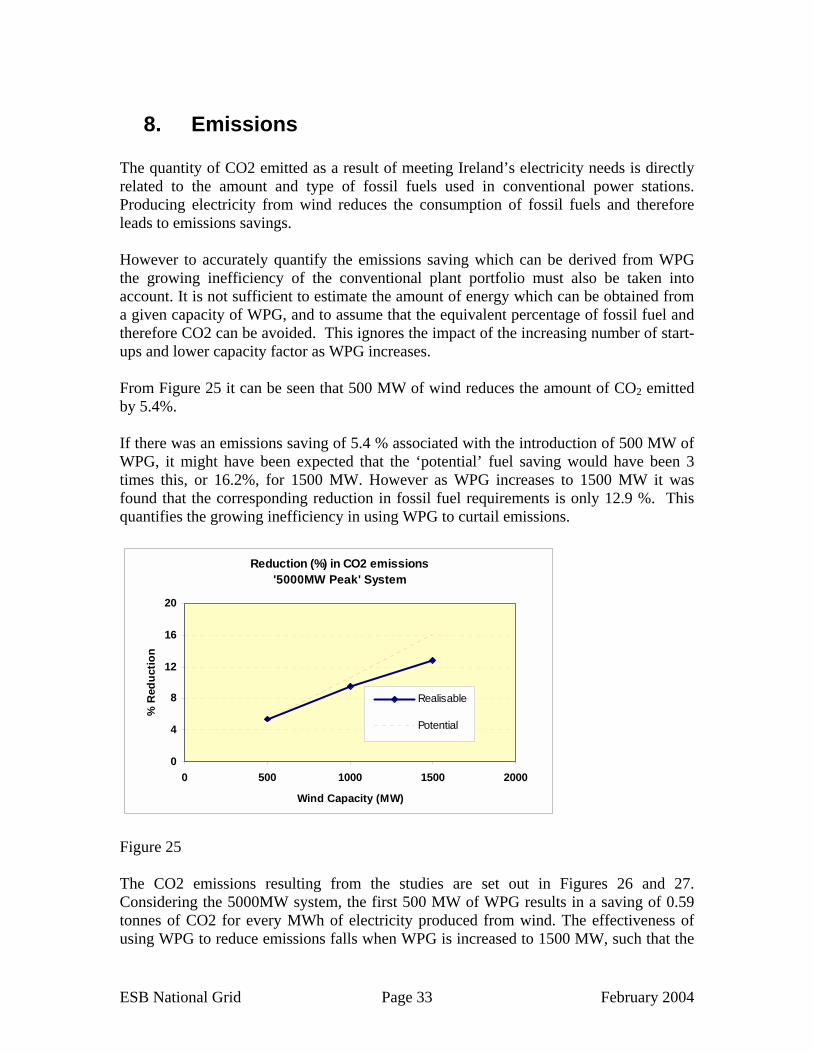
8. Emissions The quantity of CO2 emitted as a result of meeting Ireland’s electricity needs is directly related to the amount and type of fossil fuels used in conventional power stations. Producing electricity from wind reduces the consumption of fossil fuels and therefore leads to emissions savings. However to accurately quantify the emissions saving which can be derived from WPG the growing inefficiency of the conventional plant portfolio must also be taken into account. It is not sufficient to estimate the amount of energy which can be obtained from a given capacity of WPG, and to assume that the equivalent percentage of fossil fuel and therefore CO2 can be avoided. This ignores the impact of the increasing number of start-ups and lower capacity factor as WPG increases. From Figure 25 it can be seen that 500 MW of wind reduces the amount of CO2 emitted by 5.4%. If there was an emissions saving of 5.4 % associated with the introduction of 500 MW of WPG, it might have been expected that the ‘potential’ fuel saving would have been 3 times this, or 16.2%, for 1500 MW. However as WPG increases to 1500 MW it was found that the corresponding reduction in fossil fuel requirements is only 12.9 %. This quantifies the growing inefficiency in using WPG to curtail emissions.
Reduction (%) in CO2 emissions'5000MW Peak' System
0
4
8
12
16
20
0 500 1000 1500 2000
Wind Capacity (MW)
% R
educ
tion
Realisable
Potential
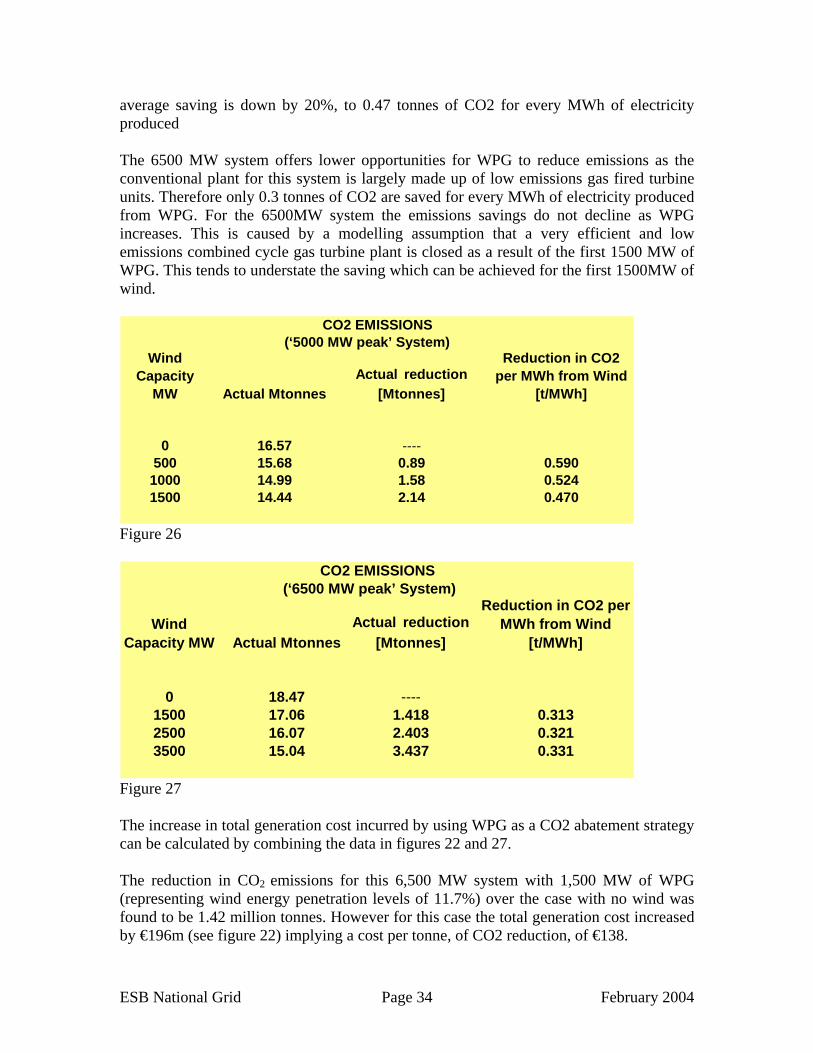
Figure 25 The CO2 emissions resulting from the studies are set out in Figures 26 and 27. Considering the 5000MW system, the first 500 MW of WPG results in a saving of 0.59 tonnes of CO2 for every MWh of electricity produced from wind. The effectiveness of using WPG to reduce emissions falls when WPG is increased to 1500 MW, such that the
ESB National Grid Page 34 February 2004
average saving is down by 20%, to 0.47 tonnes of CO2 for every MWh of electricity produced The 6500 MW system offers lower opportunities for WPG to reduce emissions as the conventional plant for this system is largely made up of low emissions gas fired turbine units. Therefore only 0.3 tonnes of CO2 are saved for every MWh of electricity produced from WPG. For the 6500MW system the emissions savings do not decline as WPG increases. This is caused by a modelling assumption that a very efficient and low emissions combined cycle gas turbine plant is closed as a result of the first 1500 MW of WPG. This tends to understate the saving which can be achieved for the first 1500MW of wind.
0 16.57 ----500 15.68 0.89 0.5901000 14.99 1.58 0.5241500 14.44 2.14 0.470
Reduction in CO2 per MWh from Wind
[t/MWh]
Wind Capacity
MWActual reduction
[Mtonnes]Actual Mtonnes
(‘5000 MW peak’ System)CO2 EMISSIONS
Figure 26
0 18.47 ----1500 17.06 1.418 0.3132500 16.07 2.403 0.3213500 15.04 3.437 0.331
Wind Capacity MW
Reduction in CO2 per MWh from Wind
[t/MWh]Actual reduction
[Mtonnes]
CO2 EMISSIONS
Actual Mtonnes
(‘6500 MW peak’ System)
Figure 27 The increase in total generation cost incurred by using WPG as a CO2 abatement strategy can be calculated by combining the data in figures 22 and 27. The reduction in CO2 emissions for this 6,500 MW system with 1,500 MW of WPG (representing wind energy penetration levels of 11.7%) over the case with no wind was found to be 1.42 million tonnes. However for this case the total generation cost increased by €196m (see figure 22) implying a cost per tonne, of CO2 reduction, of €138.

ESB National Grid Page 35 February 2004
One of the key economic considerations for Ireland is the cost of meeting carbon emission reduction targets set by the Government in response to EU and Kyoto protocol obligations. Measures which encourage a reduction in consumption (carbon taxes), substitution with non or low carbon technologies (renewables), purchase of emissions quotas (economic reduction of carbon emissions elsewhere), all constitute feasible policy options. In choosing between these options, it is important that a minimum cost objective be adopted in the context of maintaining Ireland’s economic competitiveness. The carbon reduction costs implicit in the wind penetration levels considered in this study appear high in comparison, for example, to current estimates for the trading price of carbon allocations.

ESB National Grid Page 36 February 2004
9. Conclusions This section summarises the broad conclusions of the study. Diversity of siting of wind farms has been confirmed to be effective in reducing the intermittency of wind powered generation (WPG). In this regard locating relatively small on-shore wind farms in the south and south-east of the country would be beneficial in reducing the intermittency of wind power as seen by system generation. The opposite effect would result from the construction of a very large wind farm on a single site, whether on-shore or off-shore. The capacity credit of WPG capacity has been confirmed to be considerably less than that of conventional thermal plant, and declines incrementally to saturation. Therefore as WPG increases additional or ‘surplus’ generation capacity is required if security of supply is to be maintained. There are significant costs associated with having ‘excess’ capacity on the system. Therefore the capacity surplus that results from WPG adds to the total generation costs. The effect of WPG on the thermal plant on the system has been quantified. Mid-merit and high-merit plant are the categories most affected. Low-merit plant (OCGTs) is minimally affected. If high levels of WPG are to be accommodated in the future, existing plant may need to be modified and new plant selected so that they can cope with this type of operation. The adverse effect of wind on thermal plant increases as the wind energy penetration rises. Plant operates less efficiently and with increasing volatility. There is a financial premium to be paid for WPG. We estimate that for a system with a peak of 6,500MW, and a generation portfolio comprising of combined and open cycle gas turbines, and no WPG, that the total annual generation costs would be €1.28bn. When WPG is increased to 1,500MW the total generation costs increases by €196m per annum to €1.48bn. For a system with a peak demand of 6,500 MW, 1500 MW of WPG represents a wind energy penetration level of 11.7%. The EU target for Ireland, from all renewable sources, is 13.2%. Therefore it can be estimated that, in the long term, using WPG to comply with the EU target will increase electricity generation costs by 15% (€196m as a percentage of €1.28bn). This translates to a CO2 abatement cost in excess of €120/tonne. The cost of CO2 abatement arising from using large levels of wind energy penetration appears high relative to other alternatives.

ESB National Grid Page 37 February 2004
Appendix 1 - Current Status of WPG Connections WPG Connections Stage in connection process. Total [MW]Connected 210Signed Connection Offers 598Sub total 808Live Offers 21 A further 900 MW of applications have been received.
ESB National Grid Page 38 February 2004
Appendix 2 - Plant Portfolio
Station Unit Fuel Type 5000MW 6500MW at year end System System
Moneypoint 1 Coal 285 2732 Coal 285 2733 Coal 285 273
Poolbeg 1 Gas/HFO 1152 Gas/HFO 1143 Gas/HFO 257
CC Gas/DO 460 460North Wall CC4 Gas/DO 163
CT5 Gas/DO 109Aghada 1 Gas 258
CT11 Gas/DO 90CT12 Gas/DO 90CT14 Gas/DO 90
Marina CC Gas/DO 112Dublin Bay CC Gas 393 393Huntstown CC Gas 352 352Liffey Hydro 1-4 Hydro 38 38Turlough Hill 1-4 Hydro 292 292Lee Hydro 1-3 Hydro 27 27Ardnacrusha Hydro 1-4 Hydro 89 89Erne Hydro 1-4 Hydro 65 65Clady Hydro 1 Hydro 4 4Tarbert 1 HFO 57
2 HFO 573 HFO 2414 HFO 241
Gt. Island 1 HFO 572 HFO 573 HFO 112
Bellacorrick 1-2 Peat 0Shannonbridge 1-3 Peat 0Lanesboro 2 Peat 0Edenderry 1 Peat 118 118West Offaly Power 1 Peat 136 136Lough Ree Power 1 Peat 90 90NIE Contract 0CHP --- --- 232 327SSG - Thermal --- --- 9 9Renewable - Wind Renewable 0 0Renewable - Hydro Renewable 29 27Renewable - LFG Renewable 88 160BNE CC 1 Gas/DO 235 235BNE CC 2 Gas/DO 235BNE CC 3-9 Gas/DO 2681BNE CT 1-11 Gas/DO 737BNE CT 12,13 Gas/DO 60
Total 5732 7354
Generation Plant Capacity (MW)
ESB National Grid Page 39 February 2004
Appendix 3 - Operations Profile for a single CCGT A single week - ‘Before’ and ‘After’ 1500MW Wind No Wind Capacity on System Wind Generation 1500MW Wind Capacity on System
CCGT 7 (384MW)
0
100
200
300
400
0 24 48 72 96 120 144 168
Hour of Week
MW
WIND (1500 MW Capacity)
0200400600800
1,0001,2001,4001,600
0 24 48 72 96 120 144 168Hour of Week
MW
CCGT 7 (384MW)
0
100
200
300
400
0 24 48 72 96 120 144 168
Hour of Week
MW
ESB National Grid Page 40 February 2004
Appendix 4 - Electrical Output and Fuel Inputs
Parameter 0 MW of Wind
500 MW of Wind
1000 MW of Wind
1500 MW of Wind
Thermal Units: Generation (GWh) 26,480 24,970 23,456 21,931Reduction in Thermal Generation (GWh) due to Wind 0 1,510 3,024 4,549
Reduction in Thermal Generation (%) due to Wind 0.0 5.7 11.4 17.2Thermal Units: Fuel Requirement (MTOE) 5.44 5.11 4.82 4.58
Reduction in Fuel Requirement (MTOE) due to Wind 0 0.33 0.62 0.85Reduction in Fuel Requirement (%) due to Wind 0 6.1 11.3 15.7
Thermal Units: Fuel Cost (€M) 688 637 593 558Reduction in Fuel Cost (€M) due to Wind 0 51 95 130Reduction in Fuel Cost (%) due to Wind 0 7.5 13.9 18.9
Peak = 5000 MW. Demand = 29 TWh.
Parameter 0 MW of Wind
1500 MW of Wind
2500 MW of Wind
3500 MW of Wind
Thermal Units: Generation (GWh) 35,391 30,866 27,915 25,006Reduction in Thermal Generation (GWh) due to Wind 0 4,525 7,476 10,385
Reduction in Thermal Generation (%) due to Wind 0.0 12.8 21.1 29.3Thermal Units: Fuel Requirement (MTOE) 6.57 5.91 5.53 5.19
Reduction in Fuel Requirement (MTOE) due to Wind 0 0.66 1.04 1.37Reduction in Fuel Requirement (%) due to Wind 0 10.1 15.8 20.9
Thermal Units: Fuel Cost (€M) 797 703 657 622Reduction in Fuel Cost (€M) due to Wind 0 95 140 175Reduction in Fuel Cost (%) due to Wind 0 11.9 17.6 22.0
Peak = 6500 MW. Demand = 38.5 TWh.
ESB National Grid Page 41 February 2004
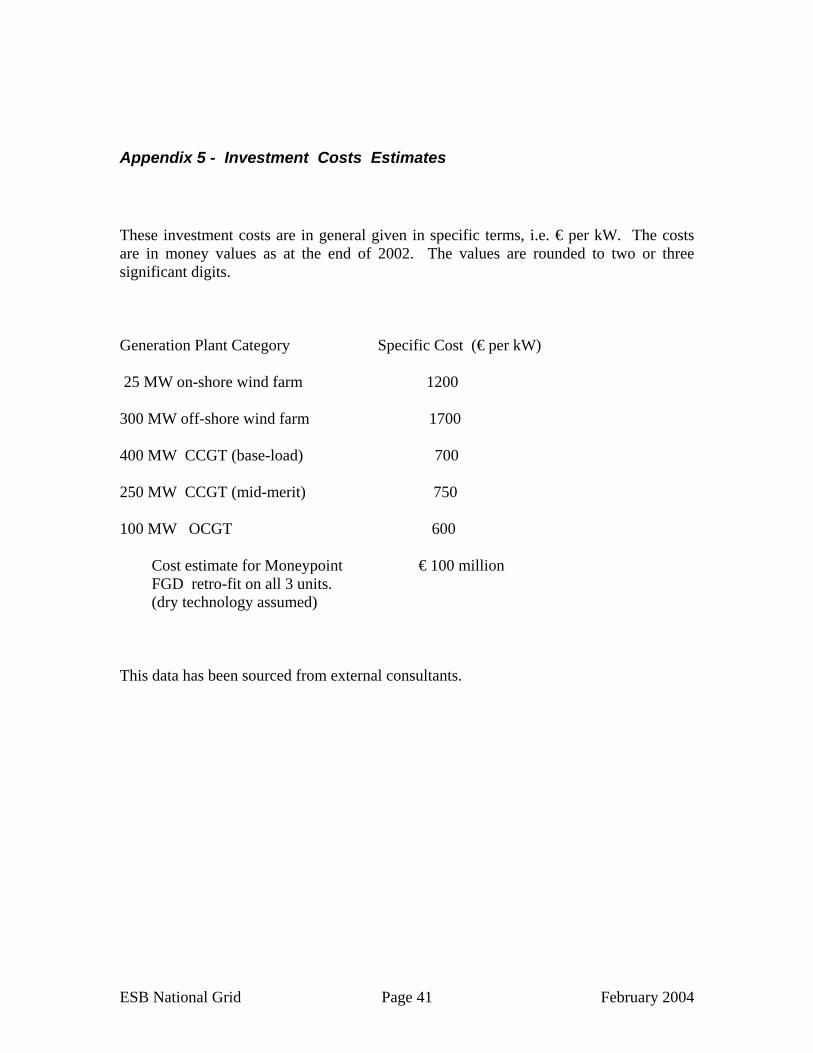
Appendix 5 - Investment Costs Estimates These investment costs are in general given in specific terms, i.e. € per kW. The costs are in money values as at the end of 2002. The values are rounded to two or three significant digits. Generation Plant Category Specific Cost (€ per kW) 25 MW on-shore wind farm 1200 300 MW off-shore wind farm 1700 400 MW CCGT (base-load) 700 250 MW CCGT (mid-merit) 750 100 MW OCGT 600 Cost estimate for Moneypoint € 100 million FGD retro-fit on all 3 units. (dry technology assumed) This data has been sourced from external consultants.
ESB National Grid Page 42 February 2004
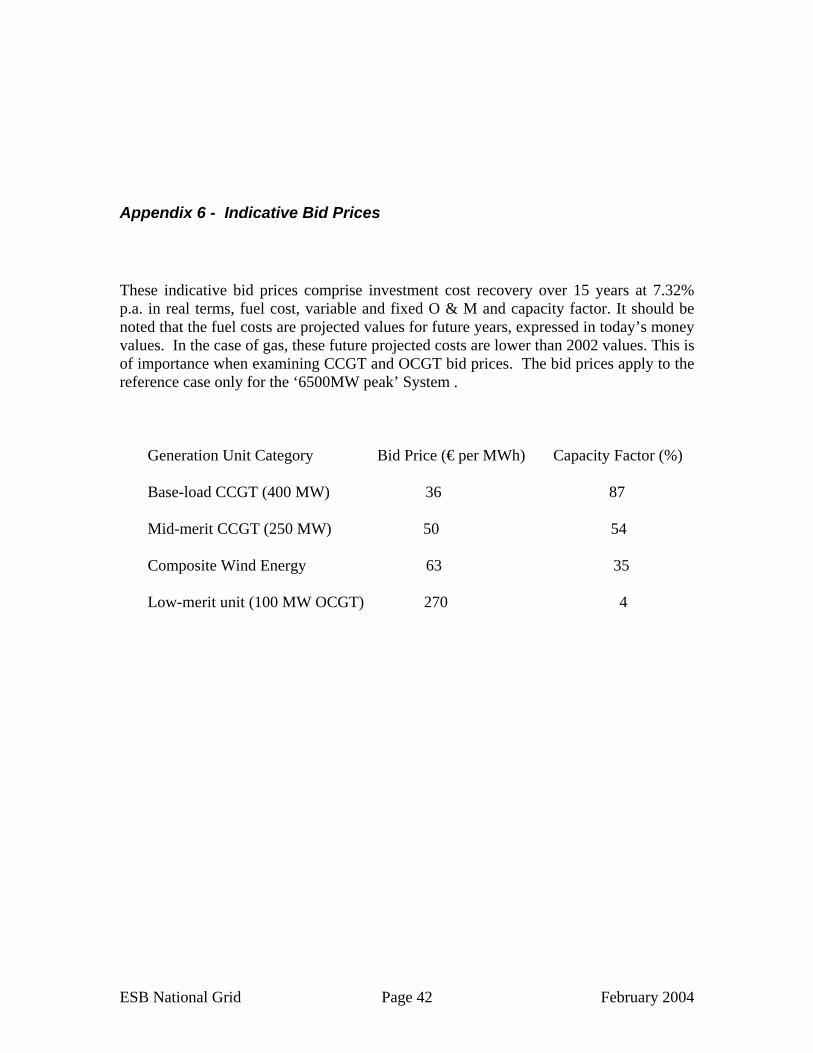
Appendix 6 - Indicative Bid Prices These indicative bid prices comprise investment cost recovery over 15 years at 7.32% p.a. in real terms, fuel cost, variable and fixed O & M and capacity factor. It should be noted that the fuel costs are projected values for future years, expressed in today’s money values. In the case of gas, these future projected costs are lower than 2002 values. This is of importance when examining CCGT and OCGT bid prices. The bid prices apply to the reference case only for the ‘6500MW peak’ System . Generation Unit Category Bid Price (€ per MWh) Capacity Factor (%) Base-load CCGT (400 MW) 36 87 Mid-merit CCGT (250 MW) 50 54 Composite Wind Energy 63 35 Low-merit unit (100 MW OCGT) 270 4
Related Documents