Impact of the debt crises on Africa* A presentation at the DSA Annual Conference 2012, London, Nov. 3, 2012 Vinaye Ancharaz International Center for Trade and Sustainable Development (ICTSD) *This presentation is based on a paper written when the author was at the African Development Bank.

Impact of the debt crises on Africa* A presentation at the DSA Annual Conference 2012, London, Nov. 3, 2012 Vinaye Ancharaz International Center for Trade.
Dec 27, 2015
Welcome message from author
This document is posted to help you gain knowledge. Please leave a comment to let me know what you think about it! Share it to your friends and learn new things together.
Transcript
Impact of the debt crises on Africa*
A presentation at the DSA Annual Conference 2012, London, Nov. 3, 2012
Vinaye AncharazInternational Center for Trade and Sustainable Development
(ICTSD)
*This presentation is based on a paper written when the author was at the African Development Bank.
Context Channels of transmission• Trade• Liquidity• Sovereign risk• FDI and remittances• Portfolio flows and market volatility
Policy space
Outline
Context
EU Euro area USA
2.1 2.0
2.4
1.61.4
1.8
-0.2-0.4
2.2
0.50.2
2.1
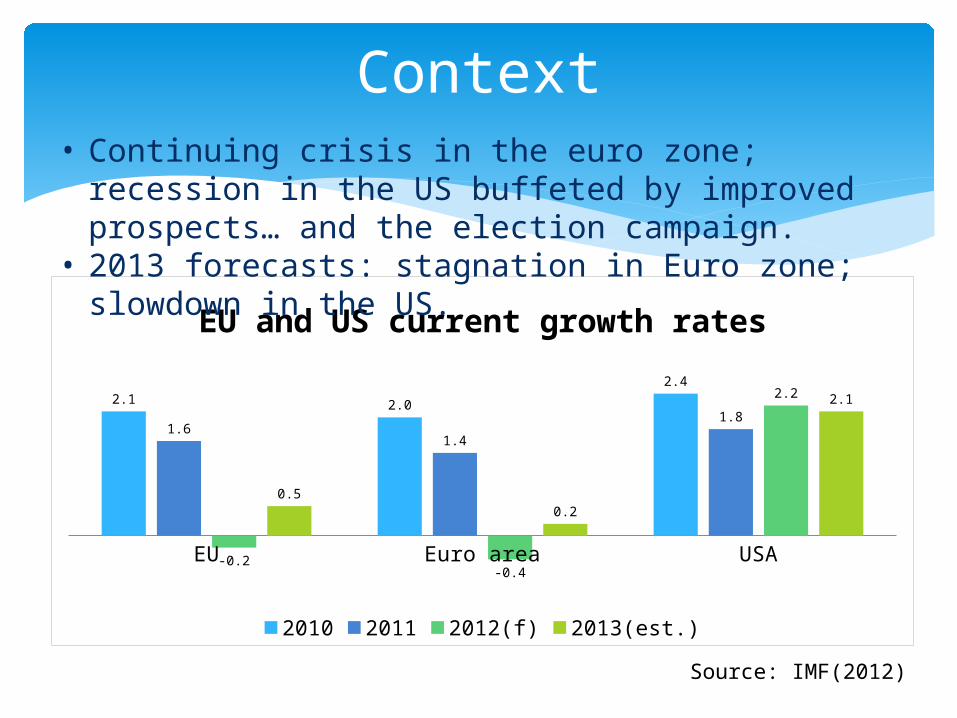
EU and US current growth rates
2010 2011 2012(f) 2013(est.)
• Continuing crisis in the euro zone; recession in the US buffeted by improved prospects… and the election campaign.
• 2013 forecasts: stagnation in Euro zone; slowdown in the US.
Source: IMF(2012)
Context/2
Africa SSA NA
5.05.3
4.5
3.4
5.0
0.5
4.5
5.3
3.1
4.8
5.4
4.0
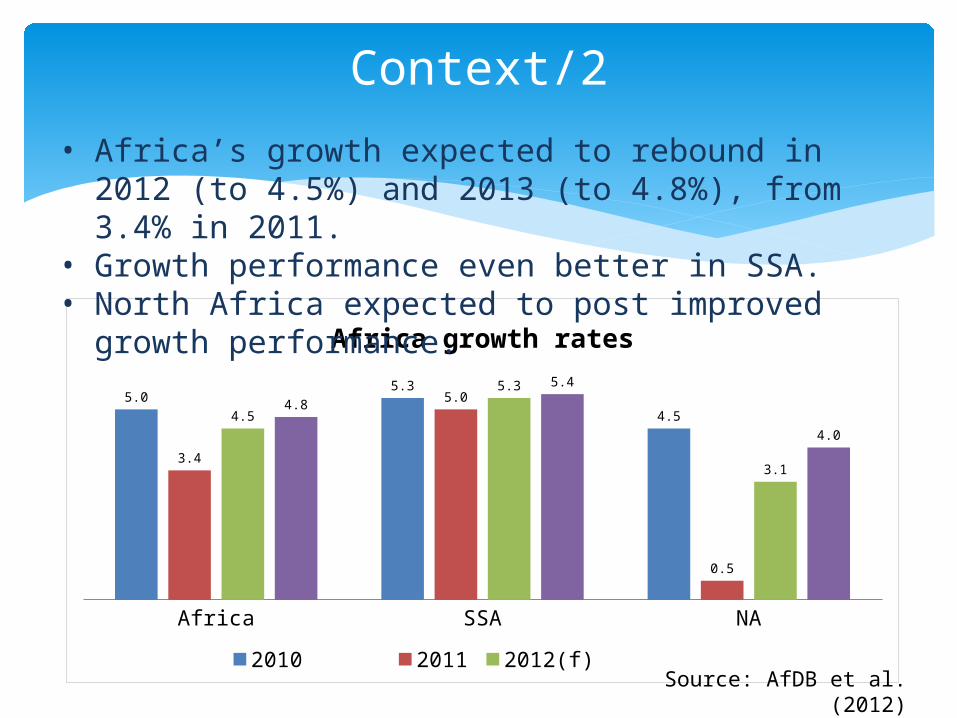
Africa growth rates
2010 2011 2012(f) 2013(est.)
• Africa’s growth expected to rebound in 2012 (to 4.5%) and 2013 (to 4.8%), from 3.4% in 2011.
• Growth performance even better in SSA.• North Africa expected to post improved growth performance.
Source: AfDB et al. (2012)
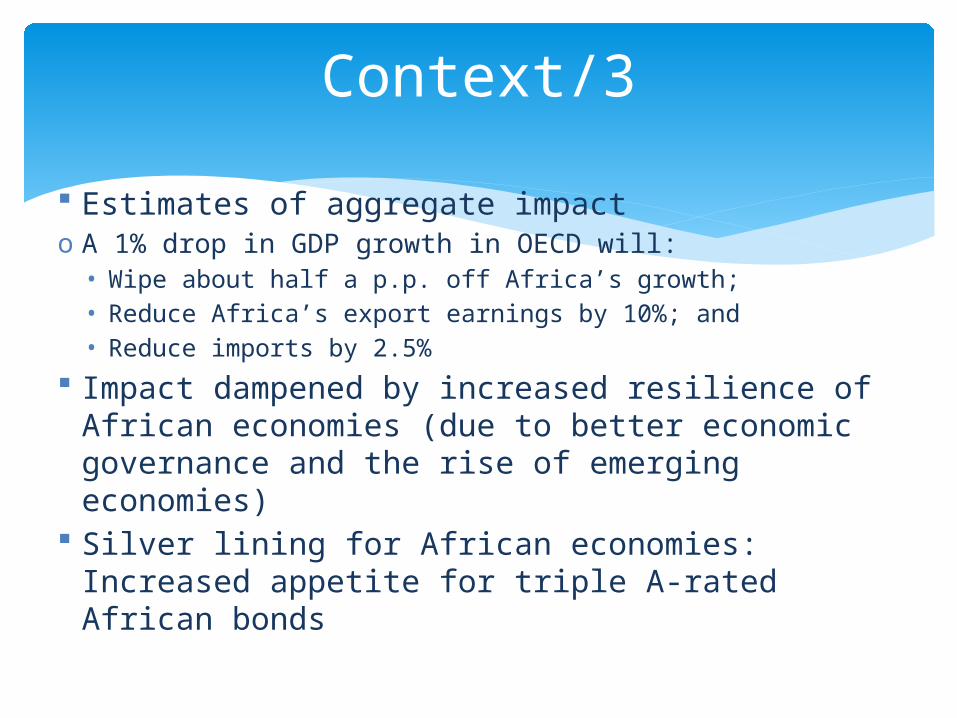
Estimates of aggregate impact o A 1% drop in GDP growth in OECD will: • Wipe about half a p.p. off Africa’s growth;• Reduce Africa’s export earnings by 10%; and• Reduce imports by 2.5%
Impact dampened by increased resilience of African economies (due to better economic governance and the rise of emerging economies)
Silver lining for African economies: Increased appetite for triple A-rated African bonds
Context/3

Trade – most important dimension of impact on African economies.
Slower economic growth in OECD Lower demand for Africa’s exports
2008-09 financial crisis: Africa’s total trade contracted 20.6%.
Trade contraction varied across countries and regions according to:• Concentration of export basket• Export market diversification
Channels of transmission: Trade

Trade/2• Africa – least diversified
region in terms of market access.
• 15 African send half or more of their exports to Europe.
• Small island economies, in addition, are highly dependent on European tourists.
• US – main market for oil exports from Chad, Gabon, Angola and Nigeria, and for Lesotho’s garments.
• Regionally, NA most dependent on European markets.
Source: AfDB (2011)
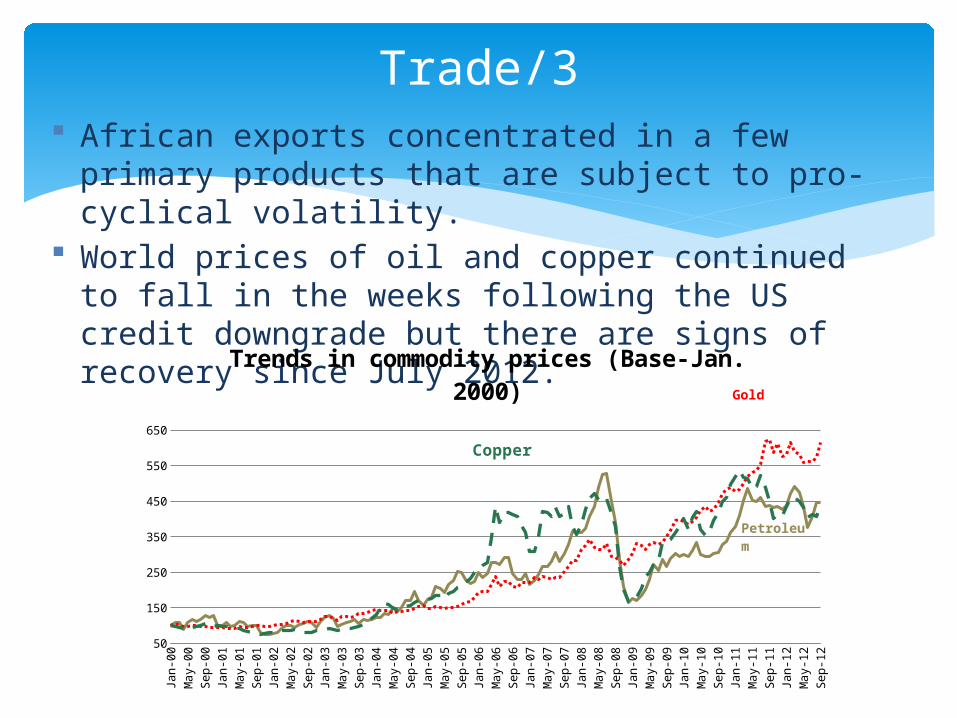
African exports concentrated in a few primary products that are subject to pro-cyclical volatility.
World prices of oil and copper continued to fall in the weeks following the US credit downgrade but there are signs of recovery since July 2012.
Trade/3
Jan-00
Sep-00
May-01
Jan-02
Sep-02
May-03
Jan-04
Sep-04
May-05
Jan-06
Sep-06
May-07
Jan-08
Sep-08
May-09
Jan-10
Sep-10
May-11
Jan-12
Sep-12
50
150
250
350
450
550
650
Trends in commodity prices (Base-Jan. 2000) Gold
Petroleum
Copper
Jan-00
Sep-00
May-01
Jan-02
Sep-02
May-03
Jan-04
Sep-04
May-05
Jan-06
Sep-06
May-07
Jan-08
Sep-08
May-09
Jan-10
Sep-10
May-11
Jan-12
Sep-12
0
100
200
300
400
500
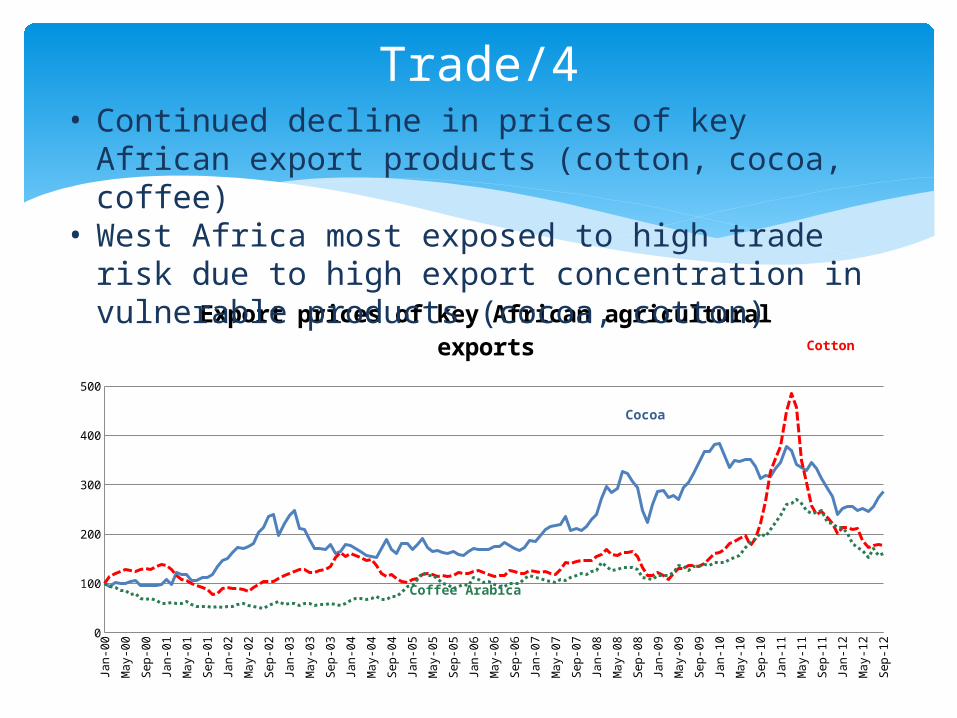
Export prices of key African agricultural exports
Coffee Arabica
Cotton
Cocoa
Trade/4• Continued decline in prices of key African export products
(cotton, cocoa, coffee)• West Africa most exposed to high trade risk due to high
export concentration in vulnerable products (cocoa, cotton)
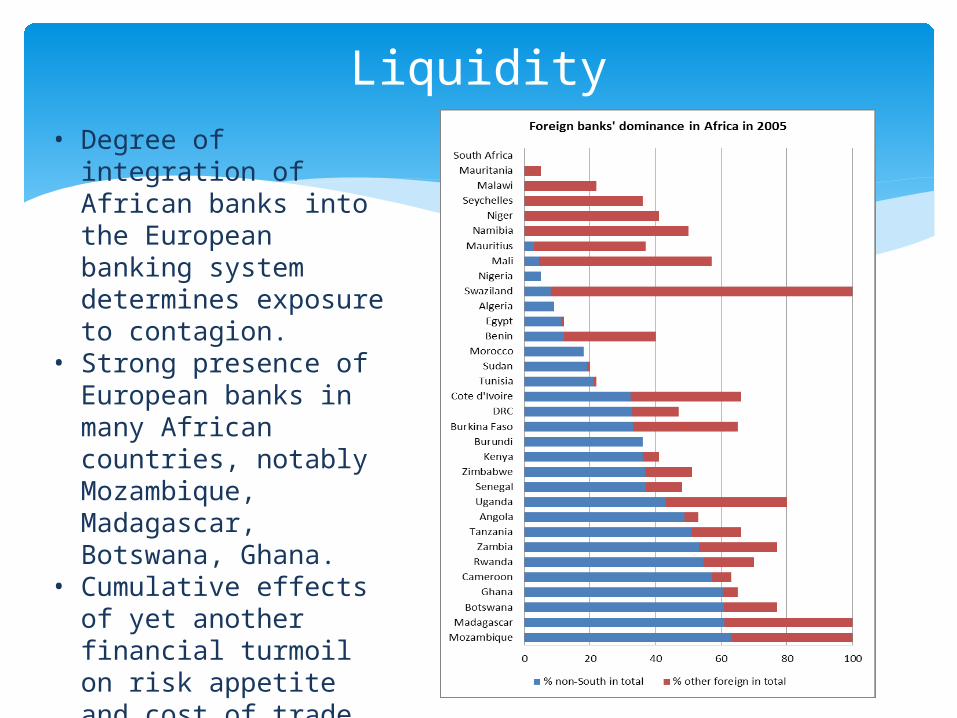
Liquidity• Degree of integration of
African banks into the European banking system determines exposure to contagion.
• Strong presence of European banks in many African countries, notably Mozambique, Madagascar, Botswana, Ghana.
• Cumulative effects of yet another financial turmoil on risk appetite and cost of trade finance.
Three potential sources of sovereign risk:• Contraction in ODA flows• Decline in trade-related tax revenues• Higher cost of borrowing in global credit market
Sovereign risk
2000 2001 2002 2003 2004 2005 2006 2007 2008 2009 2010 2011(e)
2012(f)10
20
30
40
50
60
70
80
Billi
on U
S D
olla
rs
FDI
ODA
Remittances
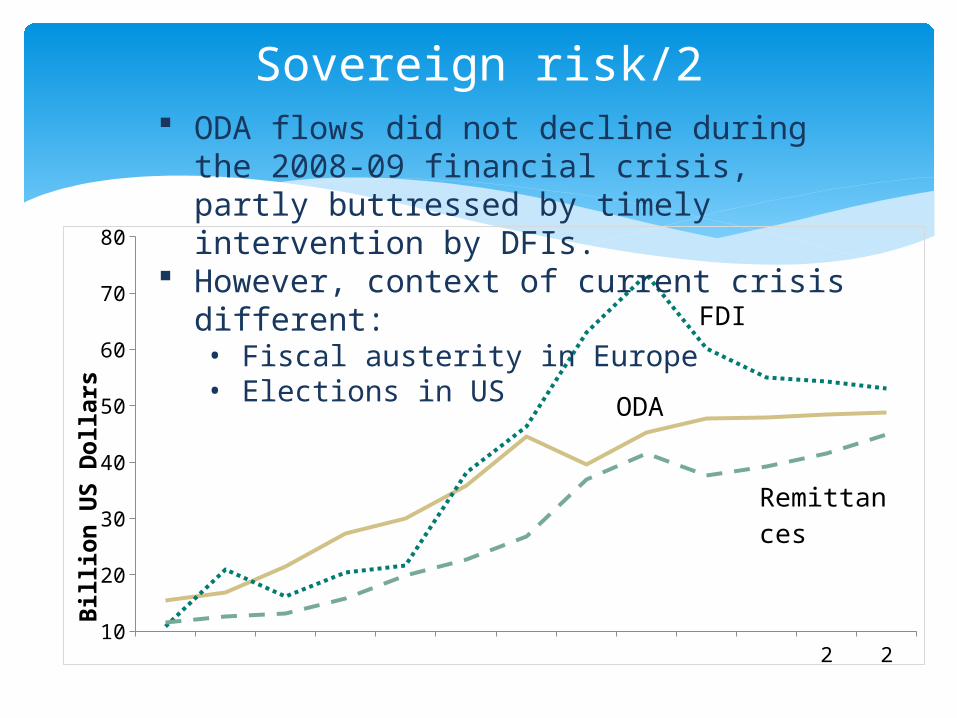
Sovereign risk/2 ODA flows did not decline during the 2008-09
financial crisis, partly buttressed by timely intervention by DFIs.
However, context of current crisis different:• Fiscal austerity in Europe• Elections in US
Tariff revenue will fall as African trade flows subside. • Swaziland, Lesotho, Uganda, Gambia and Liberia, where trade taxes
represent over 40% of current revenue are most vulnerable. • But other countries (Togo, Tanzania, CI, Madagascar, Ethiopia) are also
at risk. Declining demand for commodities can wipe off a significant chunk
of government revenue and compromise fiscal – and social – stability. Africa’s oil and mineral exporters (notably, Libya and Angola) most exposed.
Higher borrowing costs for frontier economies Impact of increased debt service charges on:• Heavily indebted countries (Zimbabwe, CI, Guinea, Cape Verde, Sudan);• Countries where external debt servicing consumes a significant share of
government budgets (Liberia, Uganda, Zimbabwe, Sudan)
Sovereign risk/3
Decline in FDI since 2008, expected to continue this year and into 2013.
Africa’s biggest recipients of FDI likely to be the biggest losers:• NA (35%)• Natural-resource-rich countries (Angola, Rep. of Congo, Nigeria, SA)
Emerging economies offer no relief. Remittances have proved resilient so far (reaching USD40
billion, or 2.6% of GDP, in 2010. • But a deepening of the debt crisis could reduce remittance flows to
Africa. • The biggest recipient most vulnerable to a drying up of remittances.
FDI and remittances
Significant degree of market volatility across Europe and beyond.
Due to their high level of integration, stock markets of SA, Nigeria and Egypt are most exposed to contagion.
Lessons from the 2008-09 financial crisis:• Markets in Nigeria, Egypt and SA plunged more than 50%• Frontier markets experienced sharp reversals in portfolio flows when
portfolio investment declined from USD 6.9 billion in 2007 to negative USD 6.2 billion in 2008.
Sharp fluctuations in euro eroding export earnings (e.g., Kenya’s horticulture).
Weakening of the exchange rate worsened by recent speculative attacks, especially in East Africa.
Portfolio flows and market volatility
What should African countries do? Stay the course on reforms… within an inclusive
growth framework. Promote intra-Africa trade: regulatory environment,
transport infrastructure, policy impetus. Boost domestic resource mobilization. Maximize the unique window of opportunity from
natural resources… but seek to diversify both products and markets over the long term.
Policy space

Look East?Africa’s growing engagement with emerging economies – a boon or bane?
Policy space/2
Brazil China India Russia0
2
4
6
8
10
12
BRIC growth rates
2010 2011 2012(f) 2013(e)

Related Documents