Authors: C.P. Baldé and R. Kuehr Developed in partnership with: IMPACT OF THE COVID19 PANDEMIC ON E-WASTE THE FIRST THREE QUARTERS OF 2020

Welcome message from author
This document is posted to help you gain knowledge. Please leave a comment to let me know what you think about it! Share it to your friends and learn new things together.
Transcript

Authors: C.P. Baldé and R. Kuehr
Developed in partnership with:
IMPACT OF THE COVID19 PANDEMIC ON E-WASTE THE FIRST THREE QUARTERS OF 2020

For enquiries, please contact the corresponding author C.P. Baldé via [email protected].
Please cite this publication as: Baldé C.P., Kuehr R., Impact of the COVID-19 Pandemic on E-waste in the First Three Quarters of 2020. United Nations University (UNU)/United Nations Institute for Training and Research (UNITAR) – co-hosting the SCYCLE Programme, Bonn (Germany), 2021.
United Nations University (UNU) is an autonomous component of the UN General Assembly dedicated to generating and transferring knowledge and strengthening capacities relevant to global issues of human securit y, development, and welfare. The University operates through a worldwide network of research and training centres and programmes, coordinated by the UNU Centre in Tokyo. www.unu.edu
The United Nations Institute for Training and Research (UNITAR) is a dedicated training arm of the United Nations, with a mission of developing the individual, institutional, and organisational capacity of countries and other United Nations stakeholders through high-quality learning solutions and related knowledge products and services as a means for enhancing global decision-making and providing support at the country level in overcoming global challenges.www.unitar.org
CONTACT INFORMATION
The SCYCLE Programme, now in transition from UNU to UNITAR, envisions enabling societies to reduce the environmental load from production, use, and disposal of ubiquitous goods, especially electrical and electronic equipment, to sustainable levels by means of independent, comprehensive, and practical research and training, providing more thorough fact bases for policy development and decision-making. SCYCLE leads the global e-waste research and trainings, and it advances sustainable e-waste management strategies based on life-cycle thinking. For detailed information on SCYCLE and its projects, including its research and training activities, please visit www.scycle.info.
Disclaimer:The designations employed and the presentation of the material in this publication do not imply the expression of any opinion whatsoever on the part of the United Nations University (UNU)/United Nations Institute for Training and Research (UNITAR) concerning the legal status of any country, territory, city, or area, or of its authorities, or concerning delimitation of its frontiers or boundaries. Trademark names and symbols are used in an editorial fashion with no intention of infringement of trademark or copyright laws. Moreover, the views expressed in this publication are those of the authors and do not necessarily represent those of UNU/UNITAR, nor does the citing of
2Impact of the COVID-19 Pandemic on E-waste in the First Three Quarters of 2020
trade names, companies, schemes, or commercial processes constitute endorsement. We regret any errors or omissions that may have unwittingly been made.
© Maps, photos, and illustrations as specified. This publication is licensed by the United Nations University/United Nations Institute for Training and Research under a Creative Commons Attribution Noncommercial-Share Alike 3.0 IGO License. Please take the time to learn more about Creative Commons.
© UNU/UNITAR 2021. Your fair use and other rights are in no way a�ected by the above.
Developed in partnership with: UN Environment Programme (UNEP).

3Impact of the COVID-19 Pandemic on E-waste in the First Three Quarters of 2020
“A reduction of 4.9 million metric tonnes (Mt) in waste of electronic and electrical equipment (e-waste) generated in the future due to the COVID-19 pandemic.”
“The impact of the COVID-19 pandemic has been analysed by creating a ‘business as usual’ scenario.“
IntroductionWithout doubt, the COVID-19 pandemic is affecting human lives in many ways and is highlighting the interrelations between our environmental and societal systems. The measures taken to control the spread of the virus across society lead to a decline of economic growth, restrictions of people’s mobility, and a further need of digitisation and confinement in homes. Many expect that the digitisation and increase of time spent at home results in an increase in
SUMMARYHome offices, homeschooling, online hang-outs with friends, online shopping, movie streaming, gaming nights, etc. – today’s living under COVID-19 lockdowns seems impossible without the latest gadgets. Therefore, many experts foresee a sizable increase in the consumption of electrical and electronic equipment and a simultaneous increase in disposal, partly as a result of the house-cleaning in the first lockdowns in 2020. However, the statistics show a surprising development from a global perspective:
Lower consumption of electronic and electrical equipment in the first three quarters of 2020 led to a reduction of 4.9 million metric tonnes (Mt) in waste of electronic and electrical equipment (e-waste) generated in the future due to the COVID-19 pandemic, especially in the first and second quarter of 2020. The reductions were 30 percent in low- and middle-income countries and only 5 percent in high-income countries. This inequality has a large social side effect: whereas the population in low- and middle-income countries is continuously growing the gap of having access to modern communication technologies and other electronics, the so-called digital divide is increasing. With that, the ability to adapt to digitisation and earn a living or simply to own and benefit from electronics is decreasing in some parts of the world. The reduction, most likely temporary, leads to less e-waste in regions where mismanagement of e-waste leads to large environmental and health damage. It is desirable that this breathing space is used to improve e-waste management in many parts of the world.
consumption of electronic and electrical equipment under COVID-19, knowing that businesses are switching to home offices, providing their staff with laptops and other office equipment for home use. Schools and universities are forced to resort to homeschooling and online synchronous/asynchronous instructional methods, and schools and students have more IT equipment needs than before. Furthermore, the more time we spend at home can also mean that near-broken electronic equipment could be replaced by new equipment or that other convenient household equipment is bought, causing a shift in expenditures. This study researches the impact of COVID-19 on waste of electronic and electrical equipment, or e-waste.
There are already indications that COVID-19 has brought about more global inequality, as half a billion people are now under-employed or out of work due to COVID-19, affecting women twice as detrimentally as men. The workers in low-income countries suffer most, losing 23% of their working hours and causing social disasters, as people fall into debt, skip meals, and keep their children home from school [1].
The impact of COVID-19 on the environment and environment-related health is less-researched and understood thus far. Some scholars see positive effects due to improvement of outdoor air quality during lockdowns [2], resulting from reduced travel. However, it is very difficult to
disentangle any independent effects of air pollution from effects of other causes of the disease outbreaks and to understand its long-term impact [3]. A more direct impact of COVID-19 may exist for waste management. There is research suggesting the increase of waste across countries observing social distancing measures by staying at home. The intensification of single-use products and panic-buying have increased production and consumption, hence thwarting efforts toward reducing plastic pollution [4]. The IFC estimates similar effects, as well as an increase of 40% of medical waste through, e.g., vaccine injections, masks, and other protective equipment [5]. For the total of municipal solid waste, preliminary findings suggest that COVID-19 coincides with a drop of municipal solid waste collection in Europe [6]. However, comprehensive quantitative studies with global coverage are currently lacking.
Methodology for Studying the Effect of the COVID-19 Pandemic on E-waste The effect of the COVID-19 pandemic on e-waste has been researched by analysing the monthly trade statistics representing a representative sample of the entire spectrum of e-waste categories. The trade statistics had a complete time series for the period of January 2018 to October 2020 for 50 countries, having good geographic representation of several global regions. The results of the sample have been extrapolated to all electronic products and grouped into six broader e-waste categories for all countries. The impact of COVID-19 has been researched by comparing the trade statistics against a “business as usual” scenario, based on monthly data of 2018 and 2019, and has been corrected for seasonal fluctuations. More information on the methodology can be found in ANNEX 1. The data reported was for 2018, 2019, and the first three quarters of 2020.

4Impact of the COVID-19 Pandemic on E-waste in the First Three Quarters of 2020
GLOBAL E-WASTE GENERATED IN 201953.6 Mt
Value of raw materials in e-waste
Documented to be collected and recycled in an
environmentally sound manner by depolluting it and recycling
the valuable materials
CONTAINING BOTH VALUABLE MATERIALS
E-WASTE IS A FAST-GROWING AND TOXIC WASTE STREAM
Gold
for instance:
Plastic
AND TOXIC SUBSTANCES
Greenhouse gas emissions
NORTHERN AFRICA AND WESTERN ASIA
3.9 Mt
AUSTRALIA AND NEW ZEALAND
0.7 Mt
LATIN AMERICA AND THE CARIBBEAN
5.4 Mt
EASTERN AND SOUTHEAST ASIA
22.1 Mt
SUB-SAHARAN AFRICA
1.6 Mt
E-WASTE GENERATION IN 2019 IN VARIOUS REGIONS OF THE WORLD
THE VAST MAJORITY OF E-WASTE IS UNKNOWN AND IS MANAGED IN SUBSTANDARD WAYS, DEPENDING ON THE E-WASTE AND A COUNTRY’S WASTE MANAGEMENT INFRASTRUCTURE
In high-income countries, e-waste that is not recycled is often mixed with other recyclable waste streams (without removal of hazardous substances) and valuable materials, such as gold and palladium.
In middle- and low-income countries, e-waste management infrastructure is not yet developed or is entirely absent and inadequate for managing the e-waste that is locally generated and illegally imported. Thus, it is mostly managed inappropriately by the informal sector in open burning and acid baths, which are polluting the environment and cause a loss of valuable resources. Moreover, such pollution causes severe health e�ects to workers, as well as to children who often also live, work, and play on such sites.
E-waste, often regarded as a reusable good, is also exported to other low-income countries.
for instance:
Undocumented to be collected and recycled in an
environmentally sound manner by depolluting it and recycling
the valuable materials
57 Billion USD
Brominated Flame Retardants (BFR)
MercuryLead
EUROPE AND NORTH AMERICA
19.7 Mt
CENTRAL ASIA
0.2 Mt
THE FACTS AND ENVIRONMENTAL ASPECTS OF E-WASTE, TAKEN FROM THE GLOBAL E-WASTE MONITOR [7]

5Impact of the COVID-19 Pandemic on E-waste in the First Three Quarters of 2020
-10% -9% -8% -7% -6% -5% -4% -3% -2% -1% 0%
TEMPERATURE EXCHANGE EQUIPMENT(For instance: refrigerators, freezers, and air conditioners)
SCREENS AND MONITORS(For instance: laptops, flat-panel monitors, and televisions)
LAMPS AND SMALL EQUIPMENT(For instance: microwaves, vacuum cleaners, power tools, other small household items and lamps [fluorescent and LED])
LARGE EQUIPMENT(For instance: washing machines, and electrical ovens)
SMALL IT AND TELECOMMUNICATION EQUIPMENT(For instance: cell phones, game consoles, desktops, printers)
-1.1 -1.5 -1.7 -0.06-0.5
Figure 1. Decrease in consumption due to COVID-19 in first three quarters of 2020 (in percentage)
Figure 2. Decrease in consumption due to COVID-19 in first three quarters of 2020 (in mass, billion kg Mt)
In the first three quarters of 2020, the decrease of the weight of electronic and electrical products consumed, compared to a “business as usual” scenario, reduced by 6.4 percent in weight, or by 4.9 million metric tonnes (Mt).
The smallest reduction is found in small IT and telecommunication equipment, which decreased by only 1.4%, or 0.06 Mt, thus to 60 million kg of e-waste. All other categories – screens and monitors, large equipment, temperature exchange equipment, small equipment, and lamps – decreased by 6-8%.
In absolute weight, the largest decrease in consumption was found in large equipment, which decreased by 1.7 Mt. The decrease is understood to have been caused by less consumption of heavy items. The second largest decrease is in small equipment and lamps, which are lighter in weight but sold in higher unit quantities.
Consumption of game consoles, cell phones, electrical ovens and laptops increased due to COVID-19 adding 0.3 Mt to the consumption of electronic and electrical equipment, and hence future e-waste generation. The increase is solely caused by high-income countries.
A contrary trend has been observed for game consoles, cell phones, electrical ovens, and laptops, which are several particular products that show a global increase as compared to the “business as usual” scenario. The increase in consumption is 0.3 Mt, which fuels the e-waste generation of the future for such products. This increase is less than the reductions in consumption for the other categories. The increase in consumption was only observed for high-income countries. Low- and middle-income countries show declining consumption for those products, too.
GLOBAL IMPACT OF COVID-19 PANDEMIC ON E-WASTE
-35% -30% -25% -20% -15% -10% -5% 0% 5%
GLOBAL
SUB-SAHARAN AFRICA
CENTRAL ASIA
EUROPE AND NORTH AMERICA
EASTERN AND SOUTHEAST ASIA
AUSTRALIA AND NEW ZEALAND
NORTHERN AFRICA AND WESTERN ASIA
LATIN AMERICA AND THE CARIBBEAN
6Impact of the COVID-19 Pandemic on E-waste in the First Three Quarters of 2020
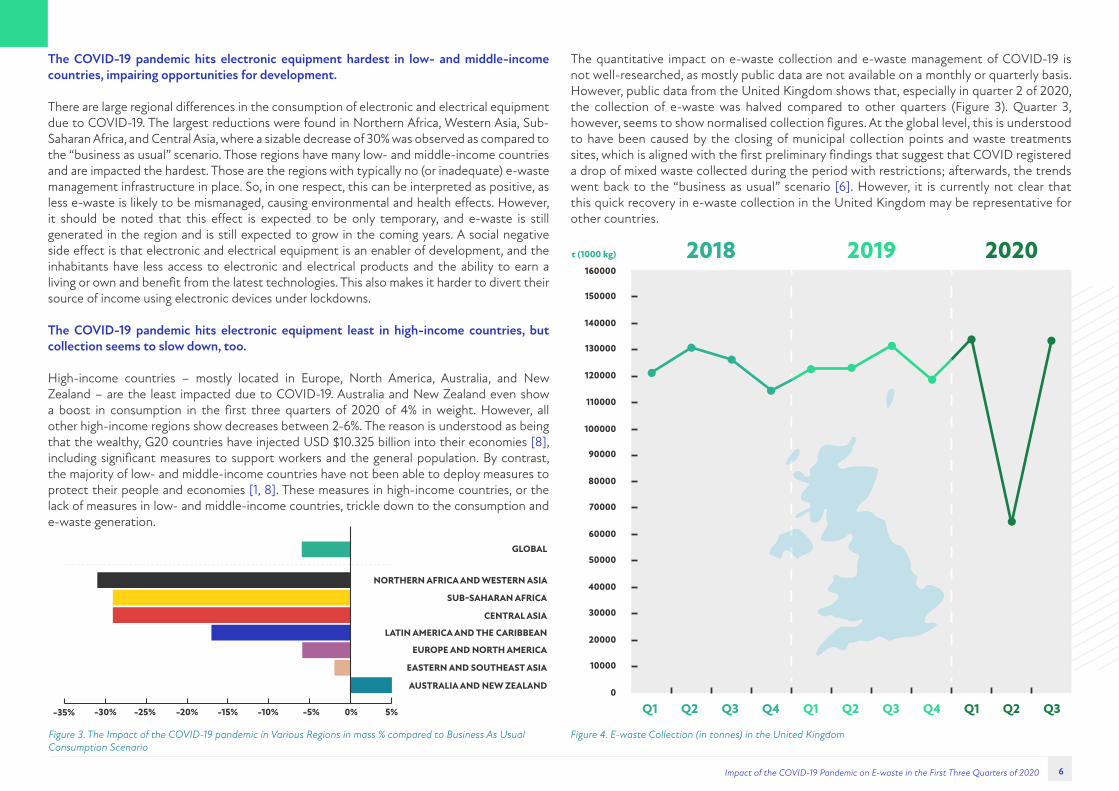
The COVID-19 pandemic hits electronic equipment hardest in low- and middle-income countries, impairing opportunities for development.
There are large regional di�erences in the consumption of electronic and electrical equipment due to COVID-19. The largest reductions were found in Northern Africa, Western Asia, Sub-Saharan Africa, and Central Asia, where a sizable decrease of 30% was observed as compared to the “business as usual” scenario. Those regions have many low- and middle-income countries and are impacted the hardest. Those are the regions with typically no (or inadequate) e-waste management infrastructure in place. So, in one respect, this can be interpreted as positive, as less e-waste is likely to be mismanaged, causing environmental and health e�ects. However, it should be noted that this e�ect is expected to be only temporary, and e-waste is still generated in the region and is still expected to grow in the coming years. A social negative side e�ect is that electronic and electrical equipment is an enabler of development, and the inhabitants have less access to electronic and electrical products and the ability to earn a living or own and benefit from the latest technologies. This also makes it harder to divert their source of income using electronic devices under lockdowns.
The COVID-19 pandemic hits electronic equipment least in high-income countries, but collection seems to slow down, too.
High-income countries – mostly located in Europe, North America, Australia, and New Zealand – are the least impacted due to COVID-19. Australia and New Zealand even show a boost in consumption in the first three quarters of 2020 of 4% in weight. However, all other high-income regions show decreases between 2-6%. The reason is understood as being that the wealthy, G20 countries have injected USD $10.325 billion into their economies [8], including significant measures to support workers and the general population. By contrast, the majority of low- and middle-income countries have not been able to deploy measures to protect their people and economies [1, 8]. These measures in high-income countries, or the lack of measures in low- and middle-income countries, trickle down to the consumption and e-waste generation.
The quantitative impact on e-waste collection and e-waste management of COVID-19 is not well-researched, as mostly public data are not available on a monthly or quarterly basis. However, public data from the United Kingdom shows that, especially in quarter 2 of 2020, the collection of e-waste was halved compared to other quarters (Figure 3). Quarter 3, however, seems to show normalised collection figures. At the global level, this is understood to have been caused by the closing of municipal collection points and waste treatments sites, which is aligned with the first preliminary findings that suggest that COVID registered a drop of mixed waste collected during the period with restrictions; afterwards, the trends went back to the “business as usual” scenario [6]. However, it is currently not clear that this quick recovery in e-waste collection in the United Kingdom may be representative for other countries.
Figure 3. The Impact of the COVID-19 pandemic in Various Regions in mass % compared to Business As Usual Consumption Scenario
0
20000
40000
60000
80000
100000
120000
140000
160000
10000
30000
50000
70000
90000
110000
130000
150000
Q3 Q4Q2Q1 Q3 Q4Q2Q1 Q1 Q3Q2
2018 2019 2020t (1000 kg)
Figure 4. E-waste Collection (in tonnes) in the United Kingdom

02550
75100
125
Q4Q3Q2Q1
LATIN AMERICA AND THE CARIBBEAN
EUROPE AND NORTH AMERICA
02550
75100
125
Q4Q3Q2Q1
02550
75100
125
Q4Q3Q2Q1
NORTHERN AFRICA AND WESTERN ASIA
SUB-SAHARAN AFRICA
02550
75100
125
Q4Q3Q2Q1
AUSTRALIA AND NEW ZEALAND
02550
75100
125
Q4Q3Q2Q1
02550
75100
125
Q4Q3Q2Q1
CENTRAL ASIA
02550
75100
125
Q4Q3Q2Q1
EASTERN AND SOUTHEAST ASIA
2018
2019
2020
GLOBAL
02550
75100
125
Q4Q3Q2Q1*
*Q1 2018 is indexed to 100
Impact is largest in the first and second quarter of 2020 and seems to have rebounded in quarter 3 in high-income countries. The e�ect in low- and middle-income countries endures in the third quarter of 2020.
At a global level, the consumption of electronic and electrical equipment fluctuates between quarters but steadily increases between 2018 and 2019. The consumption was significantly lower in quarter 1 and quarter 2 of 2020, as compared to the same quarter in 2019.
THE GLOBAL CONSUMPTION OF ELECTRONIC AND ELECTRICAL EQUIPMENT
7Impact of the COVID-19 Pandemic on E-waste in the First Three Quarters of 2020
A modest decline might already be observed in the fourth quarter of 2019, but this is less obvious and uncertain. The third quarter of 2020, however, shows a significant recovery of consumption in comparison to the previous quarter and the same quarter a year ago. However, the increase in quarter 3 is still smaller than the “business as usual” growth in the first three quarters. Thus, there is still a net-negative impact due to the COVID-19 pandemic for the first three quarters of 2020. In addition, the quarterly trends and recovery in the third quarter are very di�erent among the di�erent regions in the world.

8Impact of the COVID-19 Pandemic on E-waste in the First Three Quarters of 2020
THE CONSUMPTION OF ELECTRONIC AND ELECTRICAL EQUIPMENT - PER REGIONNorthern Africa and Western Asia Four countries had complete datasets in the analysis (Armenia, Israel, Egypt, and Azerbaijan), and from them, an upward trend in consumption has been observed, with minor fluctuations, from 2018 to 2019. All three quarters of 2020 show a decline in consumption compared to the previous quarters and to the same quarters a year earlier.
Sub-Saharan AfricaThree countries had complete datasets in the analysis (South Africa, Mauritius, and Zambia). From them, a fluctuating but upward trend in consumption could be concluded from 2018 to 2019. All three quarters of 2020 show a decline in consumption compared to the previous trend, especially quarter 2, when the consumption was roughly 40% lower. The third quarter of 2020 shows an increase compared to the previous quarter, but the levels are not the same as in the pre-COVID-19 time.
Eastern and Southeast Asia Five countries and Hong Kong had complete datasets in the analysis (China, Hong Kong SAR, Japan, Maldives, India, and Pakistan). From them, a mildly fluctuating but upward trend in consumption could be concluded from 2018 until the third quarter of 2019. The fourth quarter of 2019 until the first two quarters of 2020 show a decreasing amount of consumption. The third quarter of 2020 shows an increase in consumption. However, overall, the increase in quarter 3 is still smaller than the “business as usual” growth in the first three quarters.
Central AsiaOnly one country had complete datasets in the analysis (Kyrgyzstan). From them, a fluctuating but upward trend in consumption was observed from 2018 through 2019. The first three quarters of 2020, however, show a decreasing amount of consumption compared to the previous years. The third quarter of 2020 is higher than the second quarter, but does not yet reach the levels of pre-COVID-19 times.
Europe and North America These regions had the best coverage in terms of data (22 countries of EU-27, Switzerland, Serbia, Norway, Canada, TFYR of Macedonia, United Kingdom, the United States of America, Belarus, and Iceland). From the data, a mildly fluctuating but upward trend in consumption was observed from 2018 through 2019. However, the first two quarters of 2020 show a decreasing amount of consumption as compared to the previous years. The third quarter of 2020 is higher than the second quarter and is even higher than quarter 3 of 2019. Thus, there is a rebound effect taking place. However, overall, the increase in quarter 3 is still smaller
than the “business as usual” growth in the first two quarters, and consumption of the first three quarters together does not yet reach the levels of pre-COVID-19 times.
Australia and New Zealand This region is comprised of two countries, both having data. The consumption fluctuated from 2018 through 2019, with peaks in the fourth quarters. The overall consumption showed a slightly decreasing trend from 2018 to 2019. However, the first two quarters of 2020 show a decreasing amount of consumption as compared to the previous years. The third quarter of 2020 is remarkably higher than the second quarter. This suggests that a rebound effect taking place. Overall, the increase in quarter 3 is larger than the declines compared to the “business as usual” scenario, bringing the consumption levels of the first three quarters of 2020 back to those of 2018. Latin America and the Caribbean This region had data from four countries (Belize, El Salvador, Mexico, Antigua and Barbuda). From them, it could be concluded that consumption data fluctuated from 2018 through 2019. However, the first two quarters of 2020 show a decreasing amount of consumption as compared to the previous years. The third quarter of 2020 is higher than the second quarter, but does not reach yet pre-COVID-19 consumption levels.
The SCYCLE Programme, currently co-hosted by UNU and UNITAR, will further research the COVID-19-related impacts on e-waste and will dedicate a special chapter to this challenge in the next Global E-waste Monitor, which we expect to publish in late 2022.

9Impact of the COVID-19 Pandemic on E-waste in the First Three Quarters of 2020
REFERENCES[1] Shelter from the storm, The global need for universal social protection in times of COVID-19, ISBN 978-1-78748-704-8, OXFAM, December 2020, Oxford, United Kingdom.
[2] Dobson R, Semple S, Changes in outdoor air pollution due to COVID-19 lockdowns di�er by pollutant: evidence from Scotland, Occupational and Environmental Medicine 2020;77:798-800.
[3] Brunekreef, B, et al., Air pollution and COVID-19. Including elements of air pollution in rural areas, indoor air pollution and vulnerability and resilience aspects of our society against respiratory disease, social inequality stemming from air pollution, study for the committee on Environment, Public Health and Food Safety, Policy Department for Economic, Scientific and Quality of Life Policies, European Parliament, Luxembourg, 2021. [4] Sarkodie, S.A., Owusu, P.A. Impact of COVID-19 pandemic on waste management. Environ Dev Sustain (2020). doi.org/10.1007/s10668-020-00956-y.
[5] R. Sinha, J. Michelsen, E. Akcura, and L. Njie, International Finance Corporation (IFC).
[6]www.acrplus.org/en/news/acr-news/2593-first-preliminary-findings-from-the-survey-on-the-impact-of-covid-19-on-waste-systems.
[7] Forti V., Baldé C.P., Kuehr R., Bel G. The Global E-waste Monitor 2020: Quantities, flows and the circular economy potential. United Nations University (UNU)/United Nations Institute for Training and Research (UNITAR) – co-hosted SCYCLE Programme, International Telecommunication Union (ITU) & International Solid Waste Association (ISWA), Bonn/Geneva/Rotterdam.
[8] Summary of Country Fiscal Measures in Response to the COVID-19 Pandemic.www.imf.org/en/Topics/imf-and-covid19/~/media/Files/Topics/COVID/FM-Database/FiscalMeasures-DatabaseJanUpdate-For-Publication-030221.ashx.
https://www.acrplus.org/en/news/acr-news/2593-first-preliminary-findings-from-the-survey-on-the-impa
https://www.acrplus.org/en/news/acr-news/2593-first-preliminary-findings-from-the-survey-on-the-impa

10Impact of the COVID-19 Pandemic on E-waste in the First Three Quarters of 2020
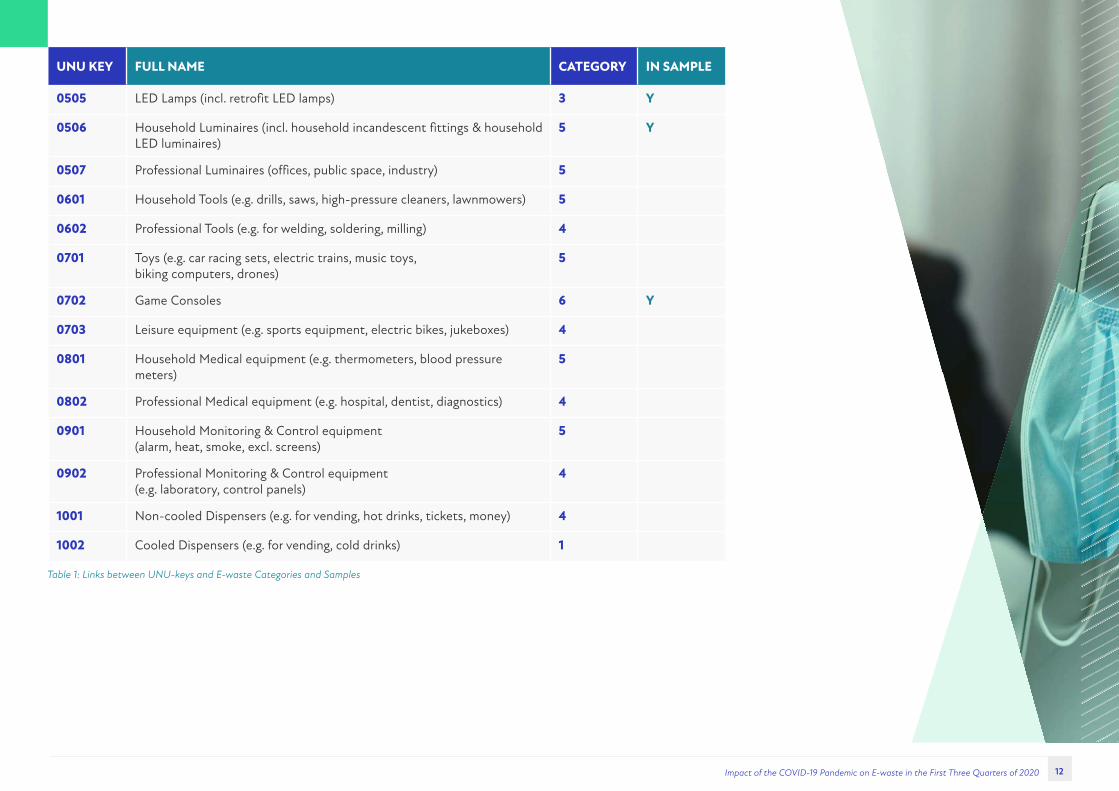
ANNEX 1: METHODOLOGYE-WASTE STATISTICSThe weight of electronic and electrical equipment placed on the market is determined by using the apparent consumption methodology. These weights were obtained for 2018 and 2019 per UNU-KEY per country from internal datasets from the Global E-waste Monitor 2020 [7]. The effect of the COVID-19 pandemic was determined for 18 UNU-KEYs (see Table 1).
The sample was comprised of the following weight percentages of global consumption and is regarded to be representative:• 66% of the weight of the total consumption• 70% for temperature exchange equipment (category 1) • 100% for screens and monitors (category 2)• 42% lamps (category 3) and small equipment (category 5)• 77% for large equipment (category 4)• 64% for small IT and telecommunication equipment
(category 6)
The sample has been extrapolated to all UNU-KEYs by considering similar developments per region and by linking specific UNU-KEYs in the sample with other UNU-KEYs within the same category.
Then, the monthly trade statistics were downloaded from the United Nations Statistics Division website in early February 2021 for all importing countries in the world for 2018, 2019, and 2020 (October 2020), separately for each country for the 40 HS codes, which are linked to the 18 UNU-KEYs in the sample. The weight in kg and monetary value were downloaded from the imports. There were 50 countries that had a complete time series for all HS codes. The data from the other countries were not analysed, as they were not complete.
Table 1: Links between UNU-keys and E-waste Categories and Samples
UNU KEY FULL NAME CATEGORY IN SAMPLE
0001 Central Heating (household-installed) 4
0002 Photovoltaic Panels (incl. inverters) 4
0101 Professional Heating & Ventilation (excl. cooling equipment) 4
0102 Dishwashers 4 Y
0103 Kitchen equipment (e.g. large furnaces, ovens, cooking equipment) 4 Y
0104 Washing Machines (incl. combined dryers) 4 Y
0105 Dryers (wash dryers, centrifuges) 4
0106 Household Heating & Ventilation (e.g. hoods, ventilators, space heaters) 4
0108 Fridges (incl. combi-fridges) 1 Y
0109 Freezers 1
0111 Air Conditioners (household-installed and portable) 1 Y
0112 Other Cooling equipment (e.g. dehumidifiers, heat pump dryers) 1
0113 Professional Cooling equipment (e.g. large air conditioners, cooling displays)
1
0114 Microwaves (incl. combined, excl. grills) 5 Y
0201 Other small household equipment (e.g. small ventilators, irons, clocks, adapters)
5
0202 Equipment for food preparation (e.g. toaster, grills, food processing, frying pans)
5 Y
0203 Small household equipment for hot water preparation (e.g. coffee, tea, water cookers)
5
0204 Vacuum Cleaners (excl. professional) 5 Y
0205 Personal Care equipment (e.g. toothbrushes, hairdryers, razors) 5

11Impact of the COVID-19 Pandemic on E-waste in the First Three Quarters of 2020
Table 1: Links between UNU-keys and E-waste Categories and Samples
UNU KEY FULL NAME CATEGORY IN SAMPLE
0301 Small IT equipment (e.g. routers, mice, keyboards, external drives & accessories)
6
0302 Desktop PCs (excl. monitors, accessories) 6 Y
0303 Laptops (incl. tablets) 2 Y
0304 Printers (e.g. scanners, multi-functionals, faxes) 6 Y
0305 Telecommunication equipment (e.g. [cordless] phones, answering machines)
6
0306 Mobile Phones (incl. smartphones, pagers) 6 Y
0307 Professional IT equipment (e.g. servers, routers, data storage, copiers) 4
0308 Cathode Ray Tube Monitors 2
0309 Flat Display Panel Monitors (LCD, LED) 2 Y
0401 Small Consumer Electronics (e.g. headphones, remote controls) 5
0402 Portable Audio & Video (e.g. MP3, e-readers, car navigation) 5
0403 Music Instruments, Radio, Hi-Fi (incl. audio sets) 5
0404 Video (e.g. Video recorders, DVD, Blu-Ray, set-top boxes) and projectors 5
0405 Speakers 5 Y
0406 Cameras (e.g. camcorders, photo & digital still cameras) 5
0407 Cathode Ray Tube TVs 2
0408 Flat Display Panel TVs (LCD, LED, Plasma) 2 Y
0501 Small lighting equipment (excl. LED & incandescent) 3
0502 Compact Fluorescent Lamps (incl. retrofit & non-retrofit) 3
0503 Straight Tube Fluorescent Lamps 3
0504 Special Lamps (e.g. professional mercury, high- and low-pressure sodium) 3
Then, the data were analysed on reporting mistakes and data gaps. Data gaps and reporting mistakes were fixed using trends within the same country, or by using monetary data of the comtrade statistics, by conversion of prices. The weight in kg of the dataset could then be analysed. The observed trends of those countries were extrapolated to the regional trends in that region.
The impact of the COVID-19 pandemic has been analysed by creating a “business as usual” scenario. The “business as usual” scenario was determined by extrapolating the 2018-2019 trend to 2020 per region, per UNU-KEY. There was no data in the comtrade data for the fourth quarter of 2020; those data were taken as constant as the fourth quarter in 2019. Those trends were then used to compute the consumption in 2020. The difference between the observed consumption in 2020 was attributed to the impact of COVID-19. If the impact of COVID-19 was negative, less electronic products were consumed, resulting in less e-waste in the future. If the impact of COVID-19 was positive, it leads to more e-waste in the future.
“The impact of the COVID-19 pandemic has been analysed by creating a ‘business as usual’ scenario.“
12Impact of the COVID-19 Pandemic on E-waste in the First Three Quarters of 2020
UNU KEY FULL NAME CATEGORY IN SAMPLE
0505 LED Lamps (incl. retrofit LED lamps) 3 Y
0506 Household Luminaires (incl. household incandescent fittings & household LED luminaires)
5 Y
0507 Professional Luminaires (o�ces, public space, industry) 5
0601 Household Tools (e.g. drills, saws, high-pressure cleaners, lawnmowers) 5
0602 Professional Tools (e.g. for welding, soldering, milling) 4
0701 Toys (e.g. car racing sets, electric trains, music toys, biking computers, drones)
5
0702 Game Consoles 6 Y
0703 Leisure equipment (e.g. sports equipment, electric bikes, jukeboxes) 4
0801 Household Medical equipment (e.g. thermometers, blood pressure meters)
5
0802 Professional Medical equipment (e.g. hospital, dentist, diagnostics) 4
0901 Household Monitoring & Control equipment (alarm, heat, smoke, excl. screens)
5
0902 Professional Monitoring & Control equipment(e.g. laboratory, control panels)
4
1001 Non-cooled Dispensers (e.g. for vending, hot drinks, tickets, money) 4
1002 Cooled Dispensers (e.g. for vending, cold drinks) 1
Table 1: Links between UNU-keys and E-waste Categories and Samples

Related Documents