Impact of Physics on Power Plant Impact of Physics on Power Plant Design and Economics Design and Economics David Ward Culham Science Centre This work was jointly funded by the UK EPSRC and by EURATOM

Welcome message from author
This document is posted to help you gain knowledge. Please leave a comment to let me know what you think about it! Share it to your friends and learn new things together.
Transcript

Impact of Physics on Power PlantImpact of Physics on Power PlantDesign and EconomicsDesign and Economics
David Ward
Culham Science Centre
This work was jointly funded by the UK EPSRC and by EURATOM
OutlineOutline
Setting the sceneCost of electricity from fusionMaterials requirementsFinal remarks

Why Do We Study Economics of Fusion?Why Do We Study Economics of Fusion?
Fusion has major resource, environment and safetybenefits as a new energy source. We must also check itcan have a market share by looking at costs andcomparing with energy markets.
Commonly Expressed False ViewsCommonly Expressed False Views
“We don’t know the details of a fusion power plant sowe cannot say anything about the cost”
“We can evaluate a detailed conceptual design andderive a precise cost of electricity”

Setting the SceneSetting the Scene
World electricity marketFuture marketsDiscountingTechnological learning
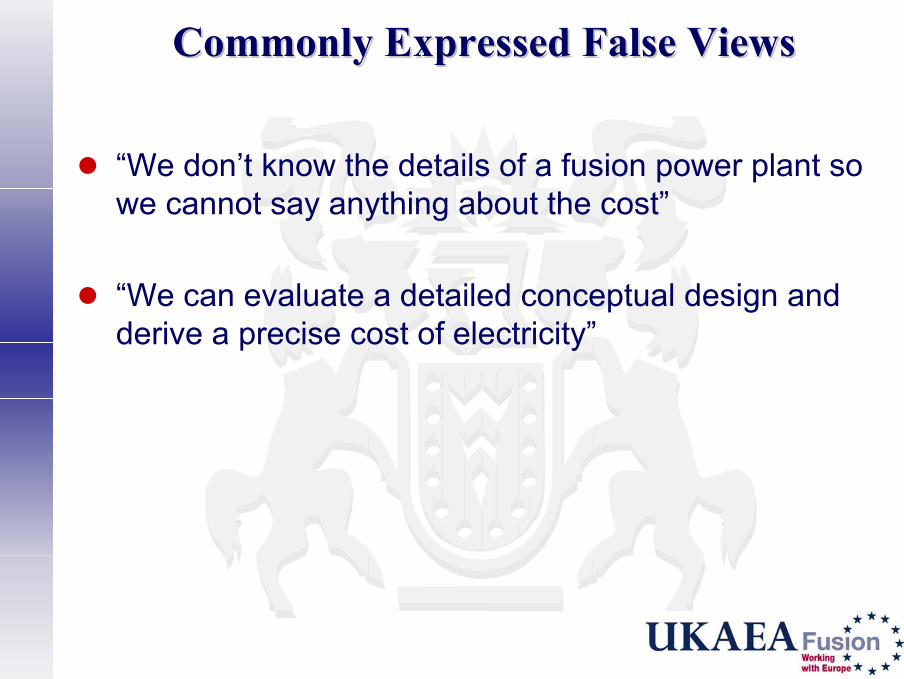
Large Variation inLarge Variation inWorld-Wide Electricity PricesWorld-Wide Electricity Prices
0
2
4
6
8
10
Japa
nIta
lyPortu
gal
Austria
Denmark
German
y UKNetherl
ands
Irelan
dSpain
Belgium
FinlandGree
ceFra
nce US
Canada
Sweden
Penc
e/kW
h
UK Energy Sector Indicators 1999, DTI
Variations due to different technologies, different pricesof raw materials and labour, different market conditions...
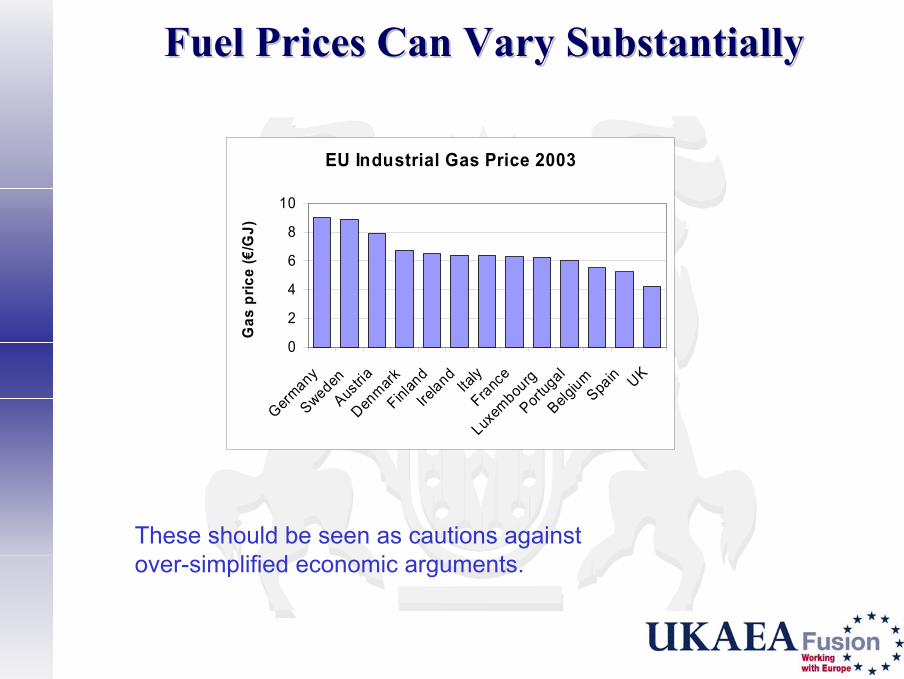
Fuel Prices Can Vary SubstantiallyFuel Prices Can Vary Substantially
EU Industrial Gas Price 2003
0
2
4
6
8
10
Germany
SwedenAus
triaDen
markFinl
and
IrelandIta
lyFranc
e
Luxem
bourg
Portug
alBelg
iumSpa
in UKG
as p
rice
(€/G
J)
These should be seen as cautions againstover-simplified economic arguments.

UK Electricity CostsUK Electricity Costs(Royal Academy of Engineering)(Royal Academy of Engineering)
Bars show increase if CO2 cost £30/tonneRange is 2-7 p/kWh or 3-11€cents/kWh
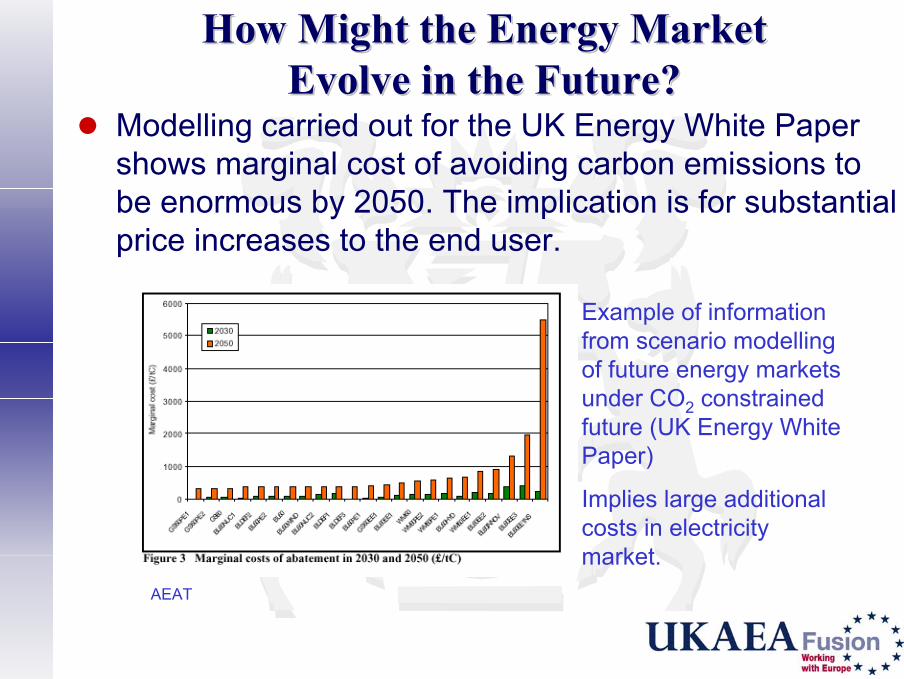
How Might the Energy MarketHow Might the Energy MarketEvolve in the Future?Evolve in the Future?
Modelling carried out for the UK Energy White Papershows marginal cost of avoiding carbon emissions tobe enormous by 2050. The implication is for substantialprice increases to the end user.
Example of informationfrom scenario modellingof future energy marketsunder CO2 constrainedfuture (UK Energy WhitePaper)
Implies large additionalcosts in electricitymarket.
AEAT
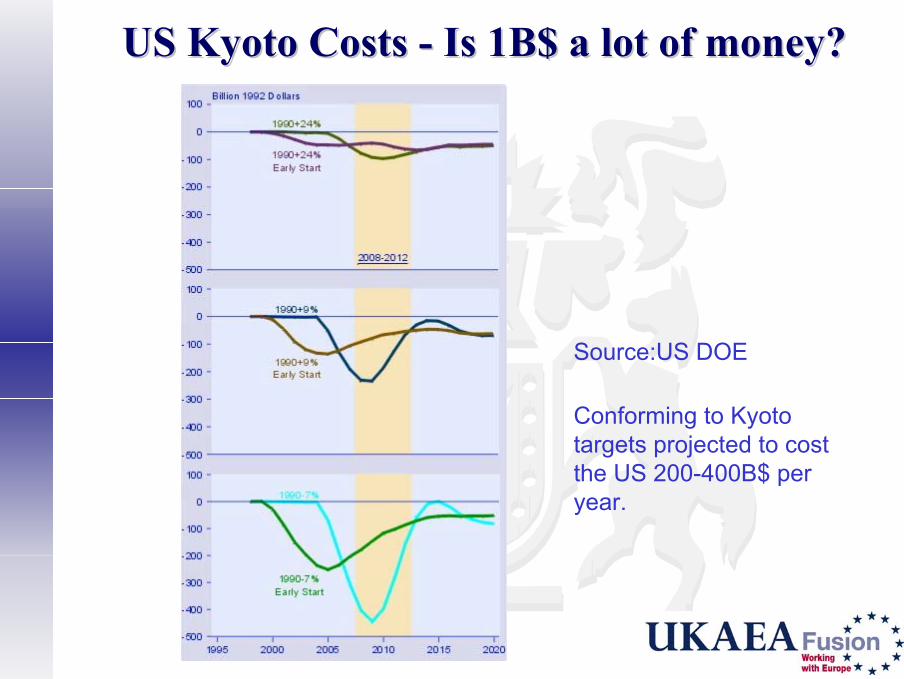
US Kyoto Costs - Is 1B$ a lot of money?US Kyoto Costs - Is 1B$ a lot of money?
Source:US DOE
Conforming to Kyototargets projected to costthe US 200-400B$ peryear.
DiscountingDiscountingDiscounting is a crucial part of an economic analysisIt captures the fact that individuals or society preferbenefits now rather than in the future; the discount ratetells us how much they prefer them. “How much wouldyou pay today to earn 1€ next year?” Nothing to do withinflation.The discount rate captures catastrophic risk, pureimpatience, the reducing value of benefits as theaverage standard of living increases etc.For public funding, discount rates of around 5% real aretypical (UK 3.5%). For private funding, discount rates of10% or above are typical.Long term discount rates are lower than short term.

LevelisedLevelised Cost of Electricity Approach (IEA) Cost of Electricity Approach (IEA)IEA approach recommended for international comparisons.All future expenditures and incomes determined, capital, O&M,replacements, fuel and decommissioning charge, electricity sales.All discounted to present day (date of first operation)Equate discounted costs to discounted incomes.All calculations in real terms.
– C capital, OM operation and maintenance, F fuel, R replaceable componentcosts, D decommissioning and waste costs, E annual generation of electricity, rdiscount rate
∑∑
−
−
+
+++++=
tt
t
tt
ttttt
rErDRFOMC
coe)1(
)1)((

Technological Learning Reduces CostsTechnological Learning Reduces CostsThrough ExperienceThrough Experience
Shell Renewables
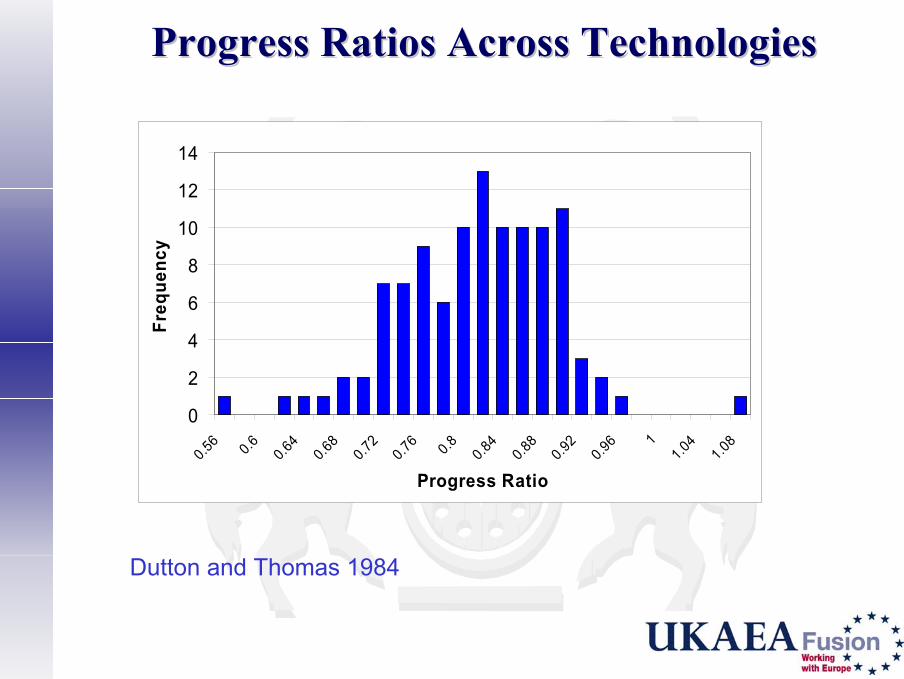
Progress Ratios Across TechnologiesProgress Ratios Across Technologies
Dutton and Thomas 1984
0
2
4
6
8
10
12
14
0.56 0.6 0.64
0.68
0.72
0.76 0.8
0.84 0.88
0.92
0.96 1
1.04
1.08
Progress Ratio
Freq
uenc
y

Cost of Electricity from FusionCost of Electricity from Fusion
System studiesCost breakdownITER-based exampleGeneral studySpecific design points (EU Power Plant ConceptualStudy)
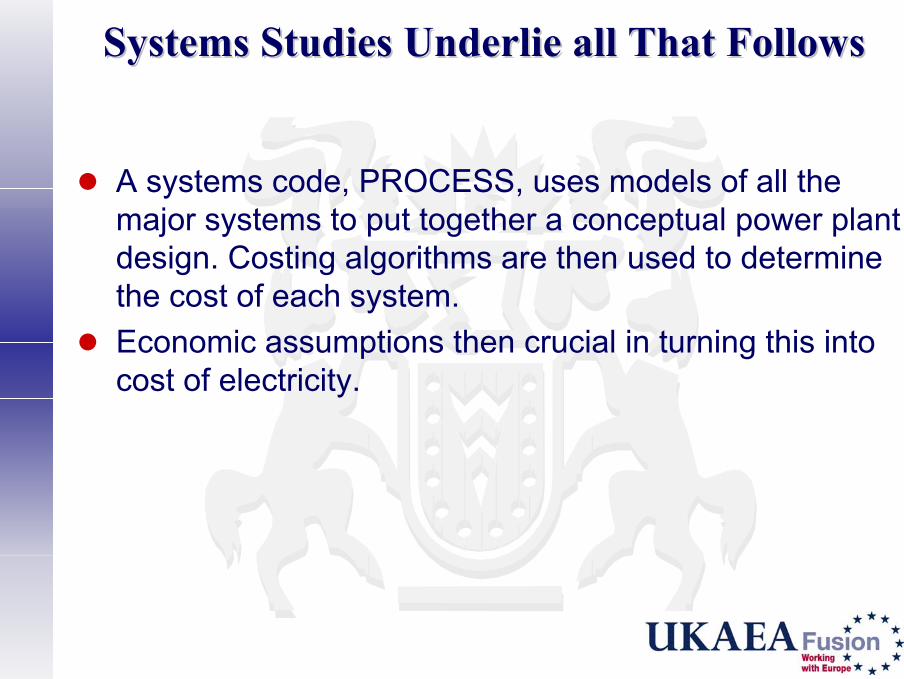
Systems Studies Underlie all That FollowsSystems Studies Underlie all That Follows
A systems code, PROCESS, uses models of all themajor systems to put together a conceptual power plantdesign. Costing algorithms are then used to determinethe cost of each system.Economic assumptions then crucial in turning this intocost of electricity.

Specific Cost of One-Off DevicesSpecific Cost of One-Off Devices
1
10
100
1000
10000
1.00E+02 1.00E+04 1.00E+06 1.00E+08 1.00E+10
Fusion Power (W)
Capi
tal C
ost p
er W
($/W
p ) CMODCOMPASS
DIIIDJET
ITER
ITER98
Power Plant
Power which would be produced if non-DTdevices were to use DT
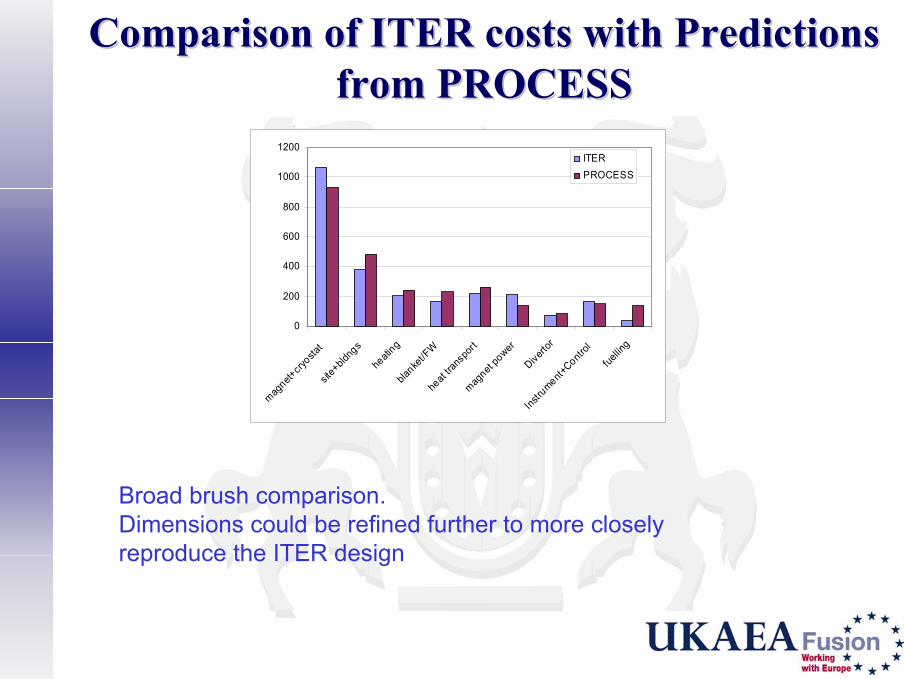
Comparison of ITER costs with PredictionsComparison of ITER costs with Predictionsfrom PROCESSfrom PROCESS
0
200
400
600
800
1000
1200
magnet+
cryosta
tsit
e+bld
ngs
heati
ngbla
nket/F
Whe
at tra
nspo
rtmag
net po
werDive
rtor
Instru
ment+Contr
olfue
lling
ITERPROCESS
Broad brush comparison.Dimensions could be refined further to more closelyreproduce the ITER design
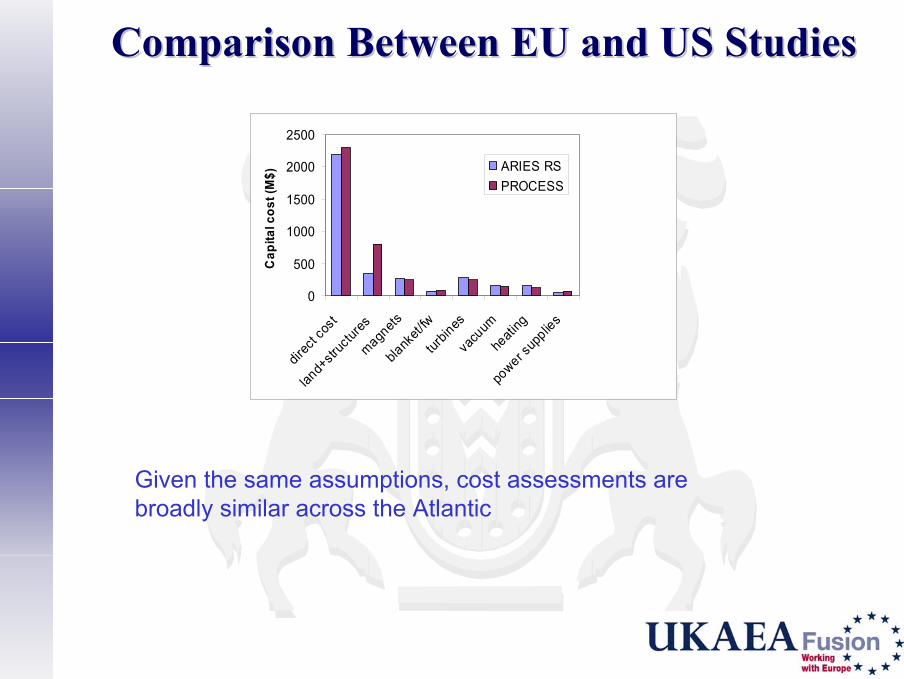
Comparison Between EU and US StudiesComparison Between EU and US Studies
0
500
1000
1500
2000
2500
direc
t cos
t
land+
struc
tures
magnets
blank
et/fw
turbin
esva
cuum
heati
ng
power s
upplie
s
Cap
ital c
ost (
M$) ARIES RSPROCESS
Given the same assumptions, cost assessments arebroadly similar across the Atlantic

Contributions to Cost of ElectricityContributions to Cost of Electricity
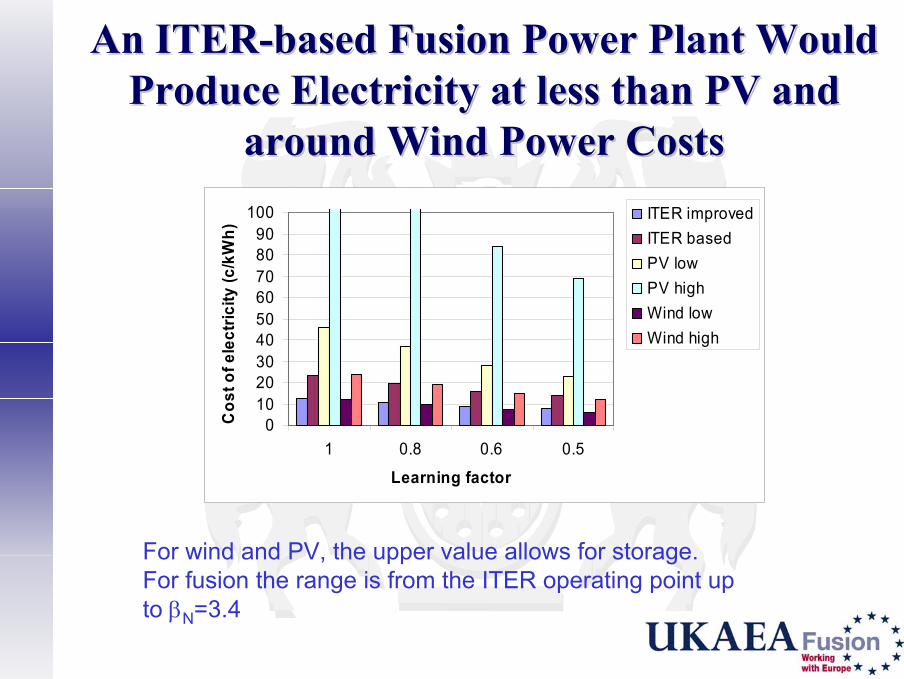
An ITER-based Fusion Power Plant WouldAn ITER-based Fusion Power Plant WouldProduce Electricity at less than PV andProduce Electricity at less than PV and
around Wind Power Costsaround Wind Power Costs
For wind and PV, the upper value allows for storage.For fusion the range is from the ITER operating point upto βN=3.4
0102030405060708090
100
1 0.8 0.6 0.5
Learning factor
Cos
t of e
lect
ricity
(c/k
Wh)
ITER improvedITER basedPV lowPV highWind lowWind high
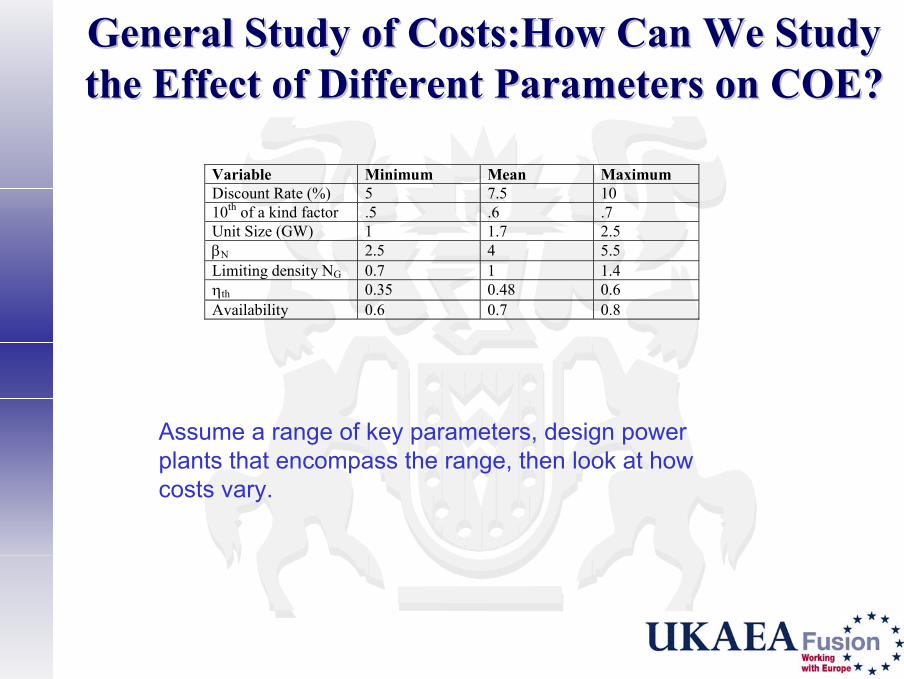
General Study of Costs:How Can We StudyGeneral Study of Costs:How Can We Studythe Effect of Different Parameters on COE?the Effect of Different Parameters on COE?
Variable Minimum Mean MaximumDiscount Rate (%) 5 7.5 1010th of a kind factor .5 .6 .7Unit Size (GW) 1 1.7 2.5βN 2.5 4 5.5Limiting density NG 0.7 1 1.4ηth 0.35 0.48 0.6Availability 0.6 0.7 0.8
Assume a range of key parameters, design powerplants that encompass the range, then look at howcosts vary.
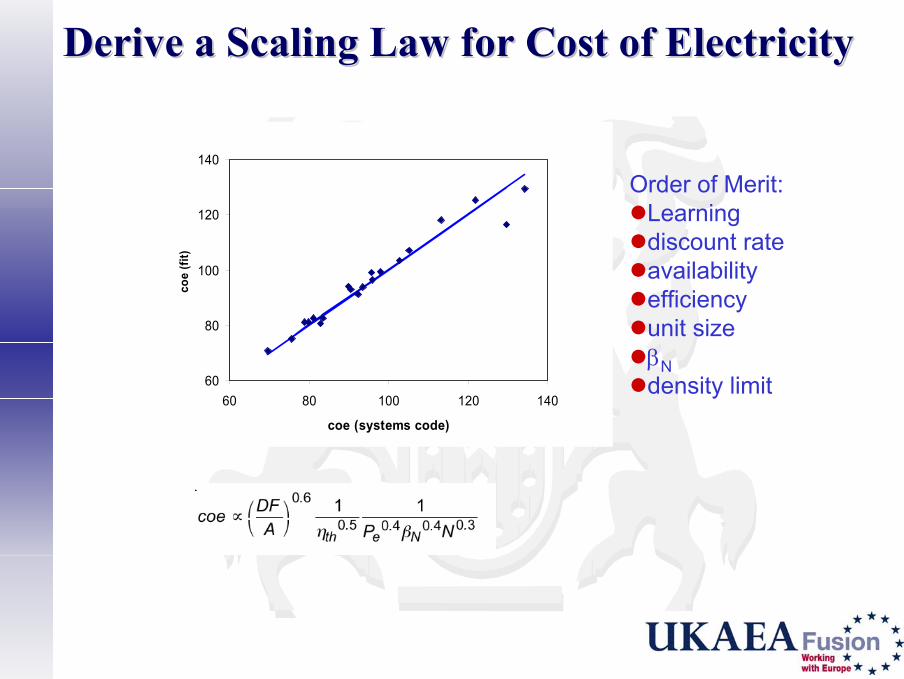
Derive a Scaling Law for Cost of ElectricityDerive a Scaling Law for Cost of Electricity
60
80
100
120
140
60 80 100 120 140
coe (systems code)
coe
(fit)
Order of Merit:Learningdiscount rateavailabilityefficiencyunit sizeβNdensity limit

Power Plant Conceptual Study:Power Plant Conceptual Study:Specific Studies of Costs:Specific Studies of Costs:
-8
-6
-4
-2
0
2
4
6
8
0 2 4 6 8 10 12 14
ABC
D
ITER
Power Plant Conceptual Study will be discussed in moredetail in later talks

Plant Model TechnologiesPlant Model Technologies
A: Water cooled, steel plant (efficiency 35%)B: helium cooled pebble bed (efficiency >40%)C: Dual cooled (He and LiPb) steel with SiC/SiC insertsD: SiC/SiC LiPb cooled. (efficiency >50%)These will be described in much more detail in talksthroughout the Course.
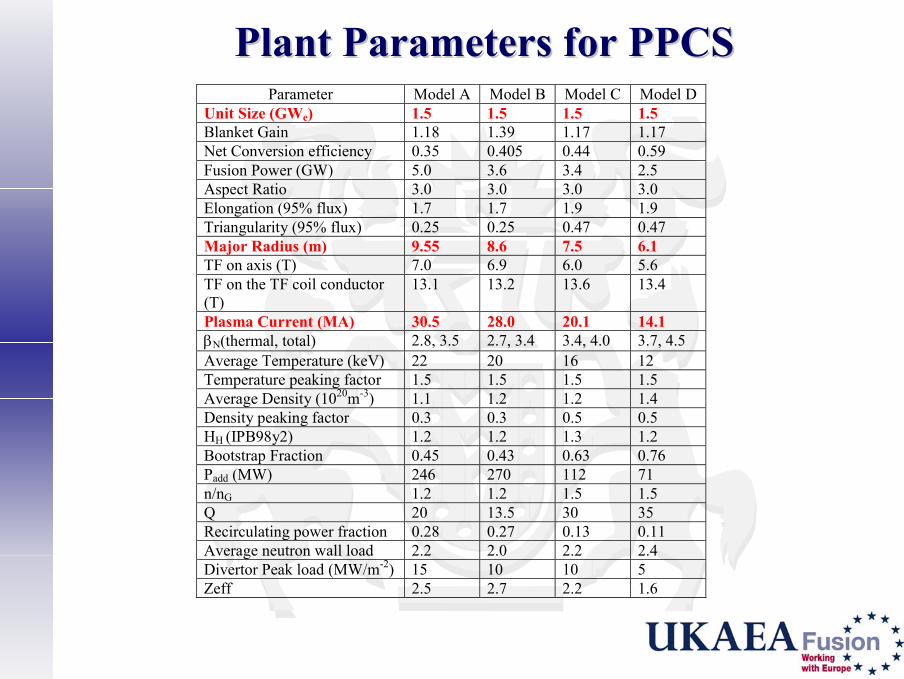
Plant Parameters for PPCSPlant Parameters for PPCSParameter Model A Model B Model C Model D
Unit Size (GWe) 1.5 1.5 1.5 1.5Blanket Gain 1.18 1.39 1.17 1.17Net Conversion efficiency 0.35 0.405 0.44 0.59Fusion Power (GW) 5.0 3.6 3.4 2.5Aspect Ratio 3.0 3.0 3.0 3.0Elongation (95% flux) 1.7 1.7 1.9 1.9Triangularity (95% flux) 0.25 0.25 0.47 0.47Major Radius (m) 9.55 8.6 7.5 6.1TF on axis (T) 7.0 6.9 6.0 5.6TF on the TF coil conductor(T)
13.1 13.2 13.6 13.4
Plasma Current (MA) 30.5 28.0 20.1 14.1βN(thermal, total) 2.8, 3.5 2.7, 3.4 3.4, 4.0 3.7, 4.5Average Temperature (keV) 22 20 16 12Temperature peaking factor 1.5 1.5 1.5 1.5Average Density (1020m-3) 1.1 1.2 1.2 1.4Density peaking factor 0.3 0.3 0.5 0.5HH (IPB98y2) 1.2 1.2 1.3 1.2Bootstrap Fraction 0.45 0.43 0.63 0.76Padd (MW) 246 270 112 71n/nG 1.2 1.2 1.5 1.5Q 20 13.5 30 35Recirculating power fraction 0.28 0.27 0.13 0.11Average neutron wall load 2.2 2.0 2.2 2.4Divertor Peak load (MW/m-2) 15 10 10 5Zeff 2.5 2.7 2.2 1.6

Example of Interesting PhysicsExample of Interesting Physics
0
50
100
150
200
250
0 5 10 15 20 25
Divertor Heat Load Limit (MW/m2)
Cur
rent
Driv
e Po
wer
(MW
)
To protect the divertor, must radiate power away
More radiation implies a need for higher confinement
The associated higher plasma current needs highercurrent drive power
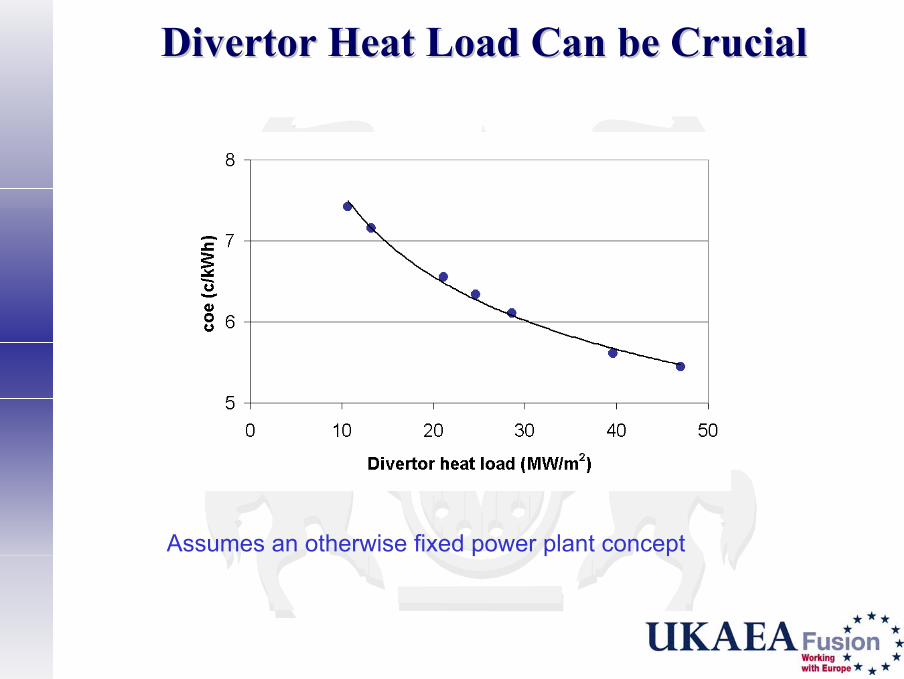
Divertor Heat Load Can be CrucialDivertor Heat Load Can be Crucial
Assumes an otherwise fixed power plant concept

Where Do the Main Costs Lie?Where Do the Main Costs Lie?Model B:– Specific capital costs 5.3$/W (65% learning) 4.6$/W (50%
learning)
– Target set at start of PPCS was 2.5-6$/W so Model B lies in themiddle/upper area of this range.
Magnets 33%Site and buildings 22%Heating 11%First wall/Blanket 5.5%Divertor 2.5%

Cost of Electricity (Cost of Electricity (€€ 2000) 2000)Model B:10th of a kind– 8.1 €cents/kWh (50% learning)– 9.6 €cents/kWh (65% learning)
– Divertor replacement costs are substantial.
Capital 70%Divertor replacement 11%O+M 10%Blanket/FW replacement 6%Decommissioning 0.6%

Specific Compared to General Cost StudySpecific Compared to General Cost Study
IAEA Conference Sorrento 2000
0
20
40
60
80
100
0 20 40 60 80 100coe(scaling)
coe

Learning Factor Important Part ofLearning Factor Important Part ofCost of ElectricityCost of Electricity
Variation of coe with Learning - Models A-D
02468
10121416
0 0.5 1 1.5Learning Factor
coe
(€ce
nts/
kWh)
coeA(€)coeB(€)coeC(€)coeD(€)
This assumes learning effects only applied to fusion-specific components. Early generations 5-10c/kWhMature technology 3-6c/kWh

Materials RequirementsMaterials Requirements
BlanketDivertor

BlanketBlanket
FZK DC Blanket(PPCS Model C)
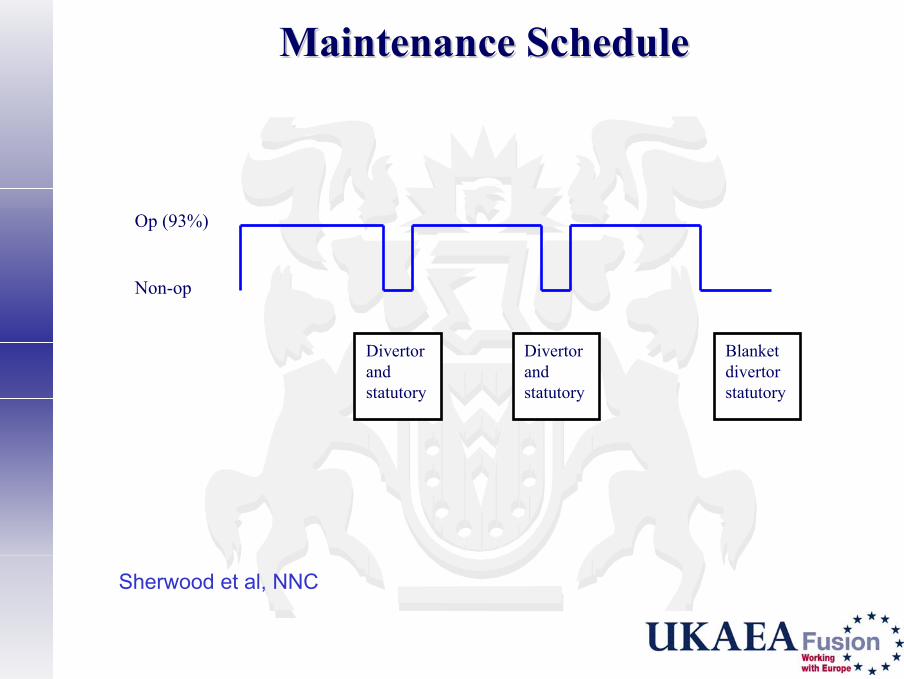
Maintenance ScheduleMaintenance Schedule
Divertorandstatutory
Divertorandstatutory
Blanketdivertorstatutory
Op (93%)
Non-op
Sherwood et al, NNC

What are the Demands of the Blanket?What are the Demands of the Blanket?
Blanket
0.6
0.7
0.8
0.9
0 5 10 15 20 25
Blanket fluence (MWa/m2)
Avai
labi
lity
6
8
10
12
Cos
t of e
lect
ricity
(c
/kW
h)
availcoe
<5MWa/m2 is not enough, 10-20 desirable(1MWa/m2 equivalent to 10 dpa)If materials could only tolerate 5MWa/m2, whatcould be done? Reduce replacement time.

DivertorDivertor
FZK Model CTungsten andEurofer
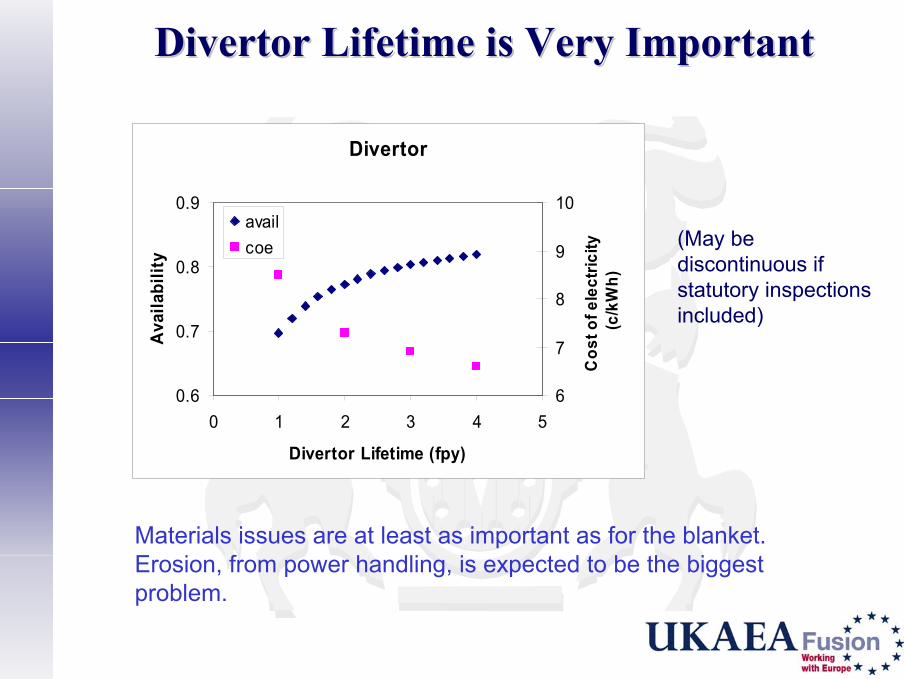
Divertor Lifetime is Very ImportantDivertor Lifetime is Very Important
Divertor
0.6
0.7
0.8
0.9
0 1 2 3 4 5
Divertor Lifetime (fpy)
Avai
labi
lity
6
7
8
9
10
Cos
t of e
lect
ricity
(c
/kW
h)
availcoe
Materials issues are at least as important as for the blanket.Erosion, from power handling, is expected to be the biggestproblem.
(May bediscontinuous ifstatutory inspectionsincluded)
Final RemarksFinal Remarks
External costsComparison with cost projections

External CostsExternal CostsExternal costs are those not paid directly by theconsumer.Particular examples are health effects due toatmospheric pollution, accidents during construction oroperation etc.Fusion expected to perform well because of lowatmospheric emissions.

External Costs of Electricity GenerationExternal Costs of Electricity Generation
Cabal et al EPS (1999)
Although implied precision is misleading, fusion belongs to thegroup of technologies with low external costs.
0
1
2
3
4
5
6
7
coal
lignit
e oil gas
biomas
sph
otovo
ltaics
wind
fusion
Exte
rnal
Cos
ts (€
cen
ts/k
Wh)
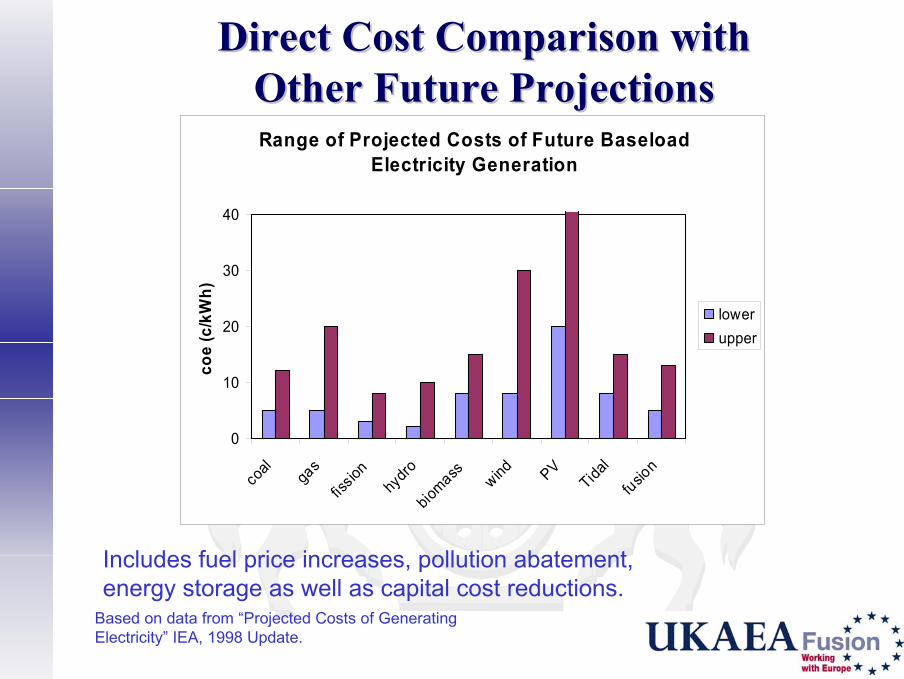
Direct Cost Comparison withDirect Cost Comparison withOther Future ProjectionsOther Future ProjectionsRange of Projected Costs of Future Baseload
Electricity Generation
0
10
20
30
40
coal gas
fissio
n
hydro
biomass wind PV
Tidal
fusion
coe
(c/k
Wh)
lowerupper
Includes fuel price increases, pollution abatement,energy storage as well as capital cost reductions.
Based on data from “Projected Costs of GeneratingElectricity” IEA, 1998 Update.
ConclusionsConclusionsIF THEY WORK RELIABLY even early generationfusion power plants are likely to be cost competitive insome nations, even without pollution constraintsimposed on other systems.With learning effects, more developed fusion plantscould be cost competitive world-wide, even withoutpollution constraints.With pollution constraints already being introduced, theeconomics look even better.This still requires a lot of work, especially in makingreliable plants with high availability (materials in divertorand blanket/first wall).Let’s get on with it!

Economist February 5 2004Economist February 5 2004
“the discount rate over three decades... would probablymake it uneconomic”THERE IS NO TRUTH IN THIS AT ALL.Total lifetime cost of ITER represents one day of spendin the energy market.Energy market is presently €2-3 trillion per year,growing at around 2%. If fusion could capture 10% ofthat future market, the discounted benefit would be 100times larger than the development cost.If fusion is successfully introduced into the market atalmost any level, the discounted benefits will far exceedthe costs.
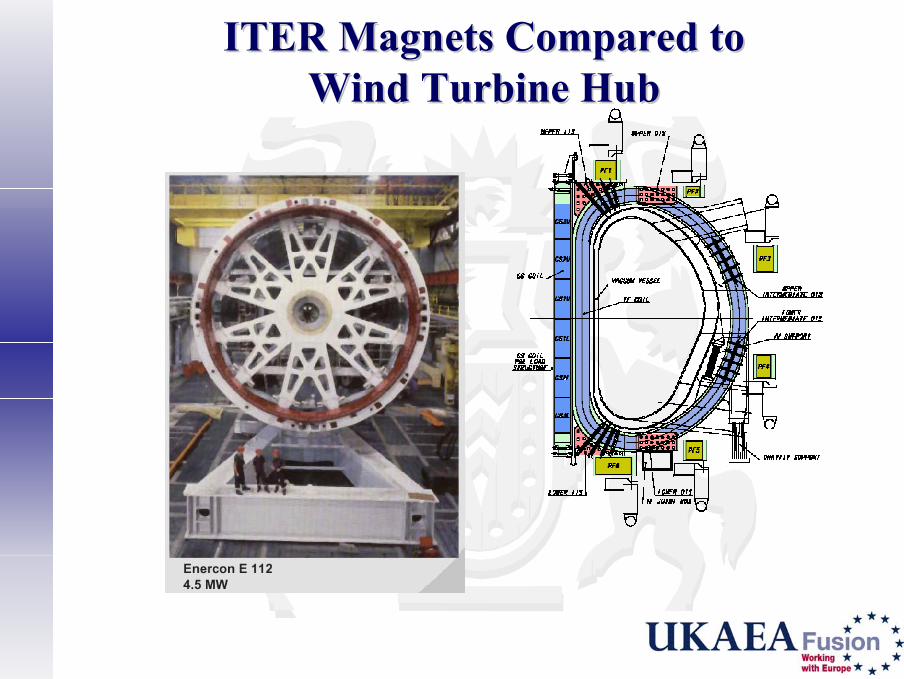
ITER Magnets Compared toITER Magnets Compared toWind Turbine HubWind Turbine Hub
Related Documents