IMPACT OF MICROFINANCE ON POVERTY REDUCTION IN ETHIOPIA: The cases of three branches of Specialized Financial and Promotional Institution (SFPI) By: ABEBE TIRUNEH REGIONAL AND LOCAL DEVELOPMENT STUDIES (RLDS) ADDIS ABABA UNIVERSITY ADDIS ABABA ETHIOPIA January 2006

Welcome message from author
This document is posted to help you gain knowledge. Please leave a comment to let me know what you think about it! Share it to your friends and learn new things together.
Transcript
IMPACT OF MICROFINANCE ON POVERTY
REDUCTION IN ETHIOPIA:
The cases of three branches of Specialized Financial and
Promotional Institution (SFPI)
By: ABEBE TIRUNEH
REGIONAL AND LOCAL DEVELOPMENT STUDIES (RLDS)
ADDIS ABABA UNIVERSITY
ADDIS ABABA
ETHIOPIA
January 2006
THE IMPACT OF MICROFINANCE ON POVERTY
REDUCTION:
The Cases of three branches of Specialized Financial and
Promotional Institution (SFPI)
By: ABEBE TIRUNEH
A Thesis Submitted to the School of Graduate Studies of Addis Ababa University in Partial
Fulfillment of the Requirements for the Degree of Master of Arts in Regional and Local
Development Studies (RLDS).
ADDIS ABABA UNIVERSTIY
SCHOOL OF GRAGUATE STUDIES
REGIONAL AND LOCAL DEVELOPEMTN STUDIES
Approved by Board of examiners:
1.
Chairman Signature
2.
Advisor Signature
3.
Internal examiner Signature
4.
External Examiner Signature
January 2006
Declaration
“This thesis is my original work and has not been presented for a degree in any other university,
and that all sources of material used for the thesis have been duly acknowledged”
Name: Abebe Tiruneh
Signature:
Confirmed by Advisor:
Name: Dr. Wolday Amha
Signature:
Place and date of submission: Addis Ababa University, January 2006.
i
ACKNOWLEDGEMENT
God and many people have helped me to accomplish the research work on time and in successful
manner. I am great full to all who supported me to complete the research paper. I especially
thank my advisor Dr. Wolday Amha for his willingness to help me and provide technical
support, relevant materials, and constructive advices and comments.
I am indebted to my family Abeba Kassuhun, Hilena Abebe and Melkamu Tiruneh who gave
me the necessary materials and taking responsibilities to facilitate my work. I would like to thank
Dr. Mengistu Bayih for his support in editing the research paper.
I would like to thank AEMFI staff members, SFPI management and staff members, branch
managers, and all branch staff members for their unreserved cooperation. Last but not least I
would like to acknowledge my institution, The House of People’s Representatives of Federal
Democratic Republic of Ethiopia for sponsoring my graduate studies.
ii
TABLE OF CONTENTS
Content pages Acknowledgement……………………………………………………………………… i
Table of content………………………………………………………………………...........ii
List of tables …………………………………………………………………………… iv
List of figures…………………………………………………………………………. v
List of annexes………………………………………………………………………... vi
Abbreviations and acronyms…………………………………………………………. vii
Abstract………………………………………………………………………………. viii
CHAPTER ONE INTRODUCTION………………………………………………………………… 1
1.1 . Background………………………………………………………………………… 1
1.2 . Problem statement………………………………………………………………….. 5
1.3 . General objectives…………………………………………………………………... 7
1.4 . Specific objectives…………………………………………………………………. 8
1.5 . Hypothesis………………………………………………………………………….. 8
1.6 . Significance of the study…………………………………………………………… 9
1.7 . Limitation of the study……………………………………………………………... 9
1.8 . Organization of the paper………………………………………………………… 10
1.9 . Conceptual framework…………………………………………………………… 10
CHAPTER TWO REVIEW OF LITERATURE……………………………………………… 13
2.1. Poverty………………………………………………………………………………. 13
2.1.1. Concepts and definitions of poverty…………………………………… 13
2.1.2. Measures of poverty…………………………………………………… 14
2.1.3. The vicious circle of poverty………………………………………… 15
2.1.4. Situation of poverty in Ethiopia………………………………………… 17
2.1.5. Poverty Reduction………………………………………………………… 18
2.2. The emergence of microfinance…………………………………………………….. 22
2.3. Microfinance institutions in Ethiopia……………………………………………… 25
2.4. Impact from case studies in microfinance industry……………………………… 29
CHAPTER THREE METHODOLOGY………………………………………………………………. 36
3.1. Data collection……………………………………………………………………… 36
3.2. Sample design……………………………………………………………………… 37
3.3. Data analysis………………………………………………………………………… 39
CHAPTER FOUR RESEARCH FINDINGS………………………………………………………… 39
4.1. Operational performance of SFPI………………………………………………… 39
iii
4.1.1. Establishment…………………………………………………………… 39
4.1.2. Governance……………………………………………………………… 40
4.1.3. Human resource………………………………………………………… 42
4.1.4. Financial resource………………………………………………………… 42
4.1.5. Service delivery…………………………………………………………… 43
i
4.1.5.1. Financial services........................................................................................ 43
4.1.5.2. Non-financial services…………………………………………………… 48
4.2. Client characteristics, loan and saving history and loan usage ………… 48
4.2.1. Demographic characteristics of respondents……………………………. 48
4.2.2. Loan and saving history of SFPI clients………………………………………53
4.2.3 Loan usage……………………………………………………………………. 55
4.3 Impact at the household level……………………………………………… 59
4.3.1 Household income and saving………………………………………… 59
4.3.2 House ownership and improvements………………………………… 61
4.3.3 Household asset ownership…………………………………… 62
4.3.4 Household expenditure………………………………………………… 63
4.3.5 Household diet……………………………………………………… 65
4.3.6 Household access to education ………………………………………. 66
4.3.7 Household health and access to medical facilities…………………… 68
4.3.8 Empowerment of women …………………………………… 69
4.4 Impact at the enterprise level……………………………………………… 71
4.5 Non- financial services…………………………………………………… 72
4.5.1 Training ………………………………………………………………….. 72
4.5.2 Monitoring and supervision……………………………………………… 73
4.6 Clients perception………………………………………………………… 74
4.6.1 Incoming clients…………………………………………………………. 74
4.6.2 Active clients…………………………………………………………… 76
CHAPTER FIVE
CONCLUSION AND RECOMMENDATIONS…………………………… 79
5.1 Conclusion …………………………………………………………………… 79
5.2 Recommendations ……………………………………………………………… 81
References ……………………………………………………………………… 82
Annexes …………………………………………………………………………… 88
iv
LIST OF TABLES
Tables page
Table: 3. 1. Settlement of respondents and their composition-------------------------------39
Table: 4.1. Personnel expansion of SFPI since its establishment --------------------------42
Table: 4.2. Number of active clients, loan disbursement and dropout rates-------------- 44
Table: 4.3 Trends of savings and withdrawals of SFPI------------------------------------- 47
Table: 4.4. Respondents’ location-------------------------------------------------------------- 49
Table: 4.5. Profile of respondents---------------------------------------------------------------50
Table: 4.6. Demographic characteristics of respondents-------------------------------------51
Table: 4.7. Distribution of respondents by their marital status, education -----------------
and occupation-------------------------------------------------------------------- 53
Table: 4.8. Respondent loan history------------------------------------------------------------ 54
Table: 4.9. Respondents saving --------------------------------------------------------- 54
Table: 4.10. Lending methodology and controlling mechanism------------------------------ 55
Table: 4.11. Clients’ loan usage------------------------------------------------------------------- 56
Table: 4.12. Loan repayment status--------------------------------------------------------------- 57
Table: 4.13. Access to credit other than SFPI----------------------------------------------------57
Table: 4.14. Clients’ opinion about interest rate, term of loan and repayment period---- - 58
Table: 4.15. Change of household income before and after the loan--------------------------60
Table: 4.16. House ownership and housing improvements------------------------------------ 62
Table: 4.17. Households’ asset ownership before and after the loan------------------------- 63
Table: 4.18. Households’ expenditure of active clients and incoming clients-------------- 64
Table: 4.19. Households diet condition----------------------------------------------------------- 65
Table: 4.20. Households’ educational access---------------------------------------------------- 67
Table: 4.21. Health status of households--------------------------------------------------------- 69
Table: 4.22. Empowerment of married women in decision-making-------------------------- 70
Table: 4.23. Impact on enterprises---------------------------------------------------------------- 72
v
Table: 4.24. Clients’ training----------------------------------------------------------------------- 73
Table: 4.25. Supervision of clients---------------------------------------------------------------- 74
Table: 4.26. Reasons for not being a member of SFPI responses from incoming clients--75
Table: 4.27 Clients’ satisfaction in the service of SFPI----------------------------------------76
Table: 4.28. Frequency and percentage distribution of likes, dislikes and
Suggestions of interviewed active clients and focus group participants-------78
LIST OF FIGURES
Figure: 1.1 Relationship between independent and dependent variables--------------------12
Figure: 2.1 Relationship between vicious circle components---------------------------------16
Figure: 4.1 Organizational structure of SFPI----------------------------------------------------41
LIST OF ANNEXES
Annex: 1. Questionnaire--------------------------------------------------------------------------88
Annex: 2. Checklist for focus group discussion----------------------------------------------118
Annex: 3. Checklist for key informant interview for AEMFI officials-------------------119
Annex: 4. Checklist for key informant interview for SFPI officials-----------------------120
Annex: 5. Microfinance institutions outreach ----------------------------------------------- 121
Annex: 6. Microfinance proclamation No .40/1996-----------------------------------------122
vi
ABBREVIATIONS AND ACRONYMS
ACSI - Amhara Credit and Savings Institution
ADCSI – Addis Credit and Savings Institution
AEMFI – Association of Ethiopian Microfinance Institutions
AIMS – Assessing the Impact of Micro-enterprise Services
ASA – Association for Social Advancement
BGSC – Bussa Gonofa Share Company
CCC – Casa Campesina Cyambe
CGAP – Consultants Group to Assist the Poor
CSA – Central Statistical Authority
DECSI – Dedebit Credit and Savings Institution
EU – European Union
GDP – Gross Domestic Product
IDA – International Development Association
IFAD – International Fund for Agricultural Development
IMF – International Monetary Fund
MDG – Millennium Development Goal
MFI – Microfinance Institutions
MoFED – Ministry of Finance and Economic Development
MSC – Meklit Share Company
NBE - National Bank of Ethiopia
NGO – Non-Governmental Organizations
OCSSCO – Oromia Credit and Savings Share Company
OMFI- Omo Microfinance Institute

vii
PEACE- Poverty Eradication and Community Empowerment
RLDS – Regional and Local Development Studies
SDPRP- Sustainable Development and Poverty Reduction Program
SEEP – Small Enterprise Education and Promotion
SFPI – Specialized Financial and Promotional Institute
SML – Share Microfinance Limited
SPSS – Statistical Package for Social Science
SUM – Special Unit for Microfinance
UK – United Kingdom
UN – United Nation
UNDP – United Nation Development Program
USAID – United States Agency for International Development
USD – United States dollar
WB – World Bank
WDR – World Development Report
viii
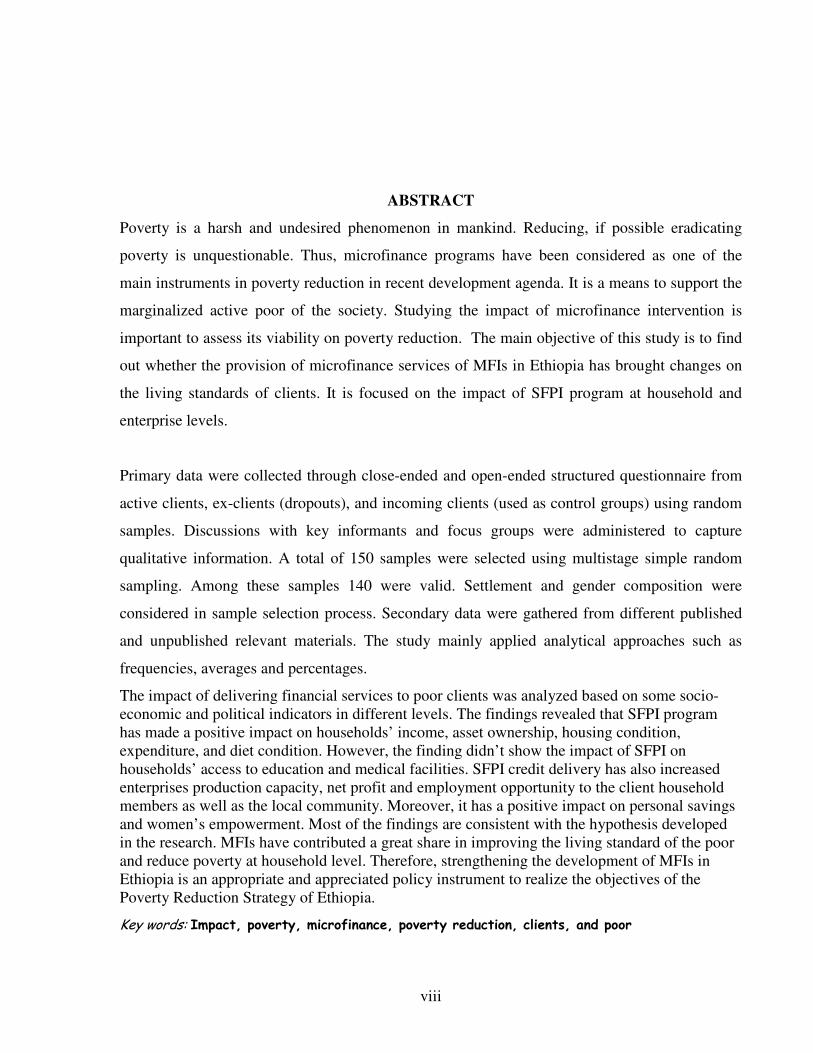
ABSTRACT
Poverty is a harsh and undesired phenomenon in mankind. Reducing, if possible eradicating
poverty is unquestionable. Thus, microfinance programs have been considered as one of the
main instruments in poverty reduction in recent development agenda. It is a means to support the
marginalized active poor of the society. Studying the impact of microfinance intervention is
important to assess its viability on poverty reduction. The main objective of this study is to find
out whether the provision of microfinance services of MFIs in Ethiopia has brought changes on
the living standards of clients. It is focused on the impact of SFPI program at household and
enterprise levels.
Primary data were collected through close-ended and open-ended structured questionnaire from
active clients, ex-clients (dropouts), and incoming clients (used as control groups) using random
samples. Discussions with key informants and focus groups were administered to capture
qualitative information. A total of 150 samples were selected using multistage simple random
sampling. Among these samples 140 were valid. Settlement and gender composition were
considered in sample selection process. Secondary data were gathered from different published
and unpublished relevant materials. The study mainly applied analytical approaches such as
frequencies, averages and percentages.
The impact of delivering financial services to poor clients was analyzed based on some socio-
economic and political indicators in different levels. The findings revealed that SFPI program
has made a positive impact on households’ income, asset ownership, housing condition,
expenditure, and diet condition. However, the finding didn’t show the impact of SFPI on
households’ access to education and medical facilities. SFPI credit delivery has also increased
enterprises production capacity, net profit and employment opportunity to the client household
members as well as the local community. Moreover, it has a positive impact on personal savings
and women’s empowerment. Most of the findings are consistent with the hypothesis developed
in the research. MFIs have contributed a great share in improving the living standard of the poor
and reduce poverty at household level. Therefore, strengthening the development of MFIs in
Ethiopia is an appropriate and appreciated policy instrument to realize the objectives of the
Poverty Reduction Strategy of Ethiopia.
Key words: Impact, poverty, microfinance, poverty reduction, clients, and poor
1
CHAPTER ONE
1. INTRODUCTION
1.1. Background
Poverty is a broad, multifaceted and multidimensional concept that involves the economical,
social, political and environmental well-being of the people (WB, 2002). It is difficult to provide
a single absolute and standardized definition of poverty rather than defining it in relative terms.
Different authors provide different definitions for the concept of poverty. But the widely used
definition of poverty is indicated in the World Bank Development Report (1990) as follows:
An inability to attain a minimum standard of living, poverty means a shortage of
having enough to eat, a low life expectancy, a higher rate of infant mortality, low
educational standard, enrollment and opportunities, poor drinking water,
inadequate health care, unfit housing conditions and lack of active participation in
decision making process.
Poverty remains a global problem of huge proportions, which needs a great attention to reduce it.
It haunts the lives of billions of people around the world. Of the worlds’ 6 billion people 2.8
billion live on less than 2 US dollar a day and 1.2 billion on less than 1 US dollar a day (WDR,
2000/2001).
Attacking persistent poverty in low and middle-income countries is the greatest single challenge
facing the global development community as the world moves forward in to 21st century (ibid).
However, poverty is not a primary concern in highly industrialized countries (Bigsten, et al
1999). But it is a strategic issue in developing countries. Poverty is mostly the manifestation of
developing countries in Africa, Latin America and Asia.
Ethiopia is one of the developing countries facing severe poverty. Ethiopia is located in the horn
of Africa with a total surface area of 1.016 million square kilometers (CSA, 1997). The
population of Ethiopia is estimated to be 73 million with the average population growth rate of
2
about 2.4 percent (CIA, 2005). It is one of the poorest countries in the world. As estimated by
the World Bank the per capita income of Ethiopia is USD 110. It ranks 169 out of 175 countries
in terms of the over all Human Development Index (UNDP, 2003). The country's economy is
predominantly based on agriculture, which accounts for about 50% of GDP, 85% of exports and
85% of employment of the country (IFAD, 2001).
Poverty and food insecurity are the main challenges and fundamental issues of economic and
social development in Ethiopia (Gebrehiowot, 2002). It is estimated that in Ethiopia 44 percent
of the population is living below absolute poverty line (Wolday, 2003). Poverty in this country is
a manifestation of complex factors.
Like other Sub-Saharan Africa countries, the socio-economic condition of the country is
characterized by low growth rate of income, saving, investment, inadequate social services, high
population growth and high unemployment rate. Unbalanced growth rate of population with
economic growth is both the causes and consequences of poverty in Ethiopia. This high
population growth also causes the natural resource degradation of the country. The country's
economy is unable to create employment opportunities for the fast growing labor force (Tsehay
and Mengistu, 2002). Poverty in Ethiopia is also caused by various factors such as high
population growth, high unemployment, low level of literacy, environmental degradation,
drought, limited access to resources, health and education services and others (Wolday, 2003).
Lack of access to financial services is also among the causes of poverty in Ethiopia.
Provision of financial services is one of the important economic inputs in the effort to reduce
poverty and empower economically marginalized segments of the society. These marginalized
poor people have limited access to financial services from the formal financial institutions
especially in developing countries. Because formal financial system has inadequate geographical
outreach, lack of adequate management system, lack of skilled manpower, high risk perception
and inadequate collateral, poor people found it difficult to obtain adequate amount of credit and
were charged high rates of interest by monopolistic moneylenders.
From the 1950s, governments and international aid donors extended subsidized credit allocations
to small farmers of developing countries. Development of financial institutions such as the
Agricultural Development Banks, were responsible for the delivery of cheap subsidized credit to
3
poor farmers. These institutions supervised the uses to which loans were put and repayment
schedules were based on the expected income flow from the investment. Returns were often
overestimated. As the result, loans were often not repaid. Therefore, the credibility and financial
viability of these subsidized credit schemes were weakened and were unable to sustain their
lending programs. Thus, credit provision for the poor was transitory and limited (Johnson and
Rogaly, 1997, Tesfaye W.G, 2003).
Microfinance institution programs gained a worldwide acceptance and popularity since 1980s in
providing financial services to the poor. Recent developments in the design of microfinance
schemes have come out with innovative features which resulted in reduced costs and risks of
making loans to poor and isolated people and made financial services available to people who
were previously excluded. Microfinance intervention may increase income, consumption, saving,
investment, employment opportunities, better access to nutrition, health care and education.
Ethiopia has a favorable macro policy environment and regulatory framework to promote
sustainable microfinance development (Wolday, 2003). The government of Ethiopia supports
microfinance institutions as one of the means of addressing the poorest segment of the society to
reduce poverty. To this end, the government created a conducive environment for the
development of microfinance institutions by issuing proclamation No. 40/1996(the microfinance
law).
Following the issuance of the proclamation, the National Bank of Ethiopia, the licensing and
supervising agency for Microfinance Institutions, issued implementation guide lines within
which microfinance institutions are allowed to operate. It also issued a dead line within which
different saving and credit programs operated by NGOs in the country are required to be either
licensed as Microfinance Institutions or discontinue operating their credit programs. In
accordance with this, some of them were transformed to licensed Microfinance Institutions and
most of them were terminated.
This legal and regulatory framework has assisted in increasing the number of microfinance
institutions to twenty-six, as of November 2005. These different microfinance institutions
together formed an association under the name of Association of Ethiopian Microfinance
Institutions (AEMFI) in 1999 to share their experiences so as to improve the services they render
to their clients and provide advocacy services. AEMFI was initially registered as non-profit and
4
non-governmental organization by the request of four MFIs such as DECSI, ACSI, OCSSCO
and OMFI.
Currently, AEMFI expanded its activities beyond experience sharing and advocacy. It includes
training, research, financial performance monitoring and promotion. The vision of AEMFI is to
reduce the level of poverty through the efficient and sustainable delivery of financial services by
MFIs to the poor in Ethiopia. On the other hand its mission is to serve and develop a sustainable
institutional structure of microfinance industry in Ethiopia by promoting best practice in the
industry, serving as the forum for debate and dialogue, facilitating sharing of experience and
information; and creating an enabling environment for the industry (AEMFI, 2005).
Specialized Financial and Promotional Institution (here after SFPI) is one of the microfinance
institutions in Ethiopia established in accordance with proclamation No. 40/1996. It is registered
as a share company by liability on November 25, 1997. It started operations in the second half of
the 1998. It is an active member of AEMFI.
The shareholders of SFPI are composed of governmental organizations, non-governmental
organizations and the private sector. The seven shareholders in SFPI are commercial Bank of
Ethiopia, Dashen Bank, Agri-service Ethiopia, Projynist Ethiopia, Addis Ababa Women
Entrepreneurs Association, and Ethiopian National Association for the Blinds and Ato Hailu
Wondafrash. Among these, the largest share is owned by commercial Bank of Ethiopia. SFPI is
administered by board of directors, which are composed of five members elected by the General
Assembly. The General Assembly of the shareholders is the highest governing body of the
institution.
The institution has a mandate to operate at federal level both in the urban and rural context. Its
head office is located in Addis Ababa. Its operation is running in four branches. Each branch has
both urban and rural clients. The branches are named as Sholla branch, Cherkos branch, Merkato
branch and Debrezeit branch. The first three branches are located in Addis Ababa and the fourth
branch is located in Oromia Region (Debrezeit), about 45 kilometers from Addis Ababa.
As indicated in the institution's document, the vision of SFPI is to see poor people especially
women, to be fully accessed to institutional credit for self employment, to reduce poverty both in
5
urban and rural Ethiopia, and to promote emergence of self reliant and business minded
generation. The institution's mission is working towards the socio-economic empowerment of
the active poor both in urban and rural Ethiopia by assisting them in creating and running viable
business through provision of financial and non- financial services.
The institution has five objectives, indicated as follows:
1. Inculcate work ethics and business culture in the minds of its clients
2. Facilitate the creation and the expansion of micro-enterprises by providing financial and
non-financial support services such as credit, training in business practices and related
technical advice
3. Inculcate saving habit among its target people
4. Enhance the entrepreneurial ability to its target population through training.
5. Promote the transition of successful micro-enterprises from the informal to the formal
sector
On the basis of these objectives, SFPI targets poor individuals who shall organize themselves
into groups of three to five members, who may come up with production oriented and viable
project ideas, and cooperatives with legal entity. More attention is given to the poor female-
headed households. In 2004 sixty percent of the clients of SFPI are females.
The main activities performed by SFPI are carryout microfinancing activities both in urban and
rural Ethiopia, promoting savings, mobilize resources from various sources, promotional
counseling and training services and plough back profits generated from operation.
The study tries to assess the impact of microfinance institutions on poverty reduction by taking a
case study of Specialized Financial and Promotional Institution. It is conducted by assessing the
clients who are participating in the program; dropouts from the program and potential clients in
the near future.
1.2. Problem statement
Developing countries are working to create their own national poverty reduction strategies based
on local needs and priorities. UNDP advocates for the nationally owned solutions and helps to
ensure their effectiveness by creating innovative pilot projects, connect countries to global best
6
practices and resources, promote the role of women in development and bring governments, civil
society and donors together to coordinate their efforts (UNDP, 2003). The development of
microfinance programs gained a worldwide acceptance and popularity since 1980s in providing
financial services to the poor. It is one way of the antipoverty instrument of the development
programs. Numerous institutions in many parts of the developing world have been providing
micro-credit and recovering their loans. The Grameen Bank’s group lending methodology
became widely adopted by institutions in many parts of the world (Robinson, 2001). Relative to
the experience of other developing countries, microfinance development in its institutionalized
form is a recent phenomenon in Ethiopia.
Lack of financial resources is one of the major problems facing poor households. Formal
financial institutions are inefficient and inaccessible in providing credit facilities to the poor
(Assefa et al., 2005). Thus, developing an alternative mechanism for providing financial services
to the poor households became critical. In realizing this, the Ethiopian government has created
the legal and regulatory framework for the establishment of microfinance institutions.
The main objective of almost all microfinance institutions in Ethiopia is to deliver financial
services to the poor. Microfinance became one of the important tools of reaching the poor who
had very limited access to the formal financial sector. The provision of financial services to the
poor has increased through microfinance institutions in a short period of time in Ethiopia
(Wolday, 2003). However, Ethiopian microfinance institutions are faced with many problems.
Some of these are low outreach, limited funding alternatives, limited financial products, lack of
research to understand client needs and weak internal control system (Wolday, 2001).
There is a high-unmet demand. SFPI has shown a promising growth in its operation and
outreach. However, it is still providing financial services to a very limited number of clients.
The Ethiopian MFIs should focus on the responsiveness of their financial products to the needs
of their clients. This in other ways means that, MFIs should know client’s needs by conducting
a market research or needs survey and produce products that fulfill the needs of clients. These
types of market assessments may help MFIs to collect information, which makes them
financially and operationally sustainable (Wolday, 2003). It also assists MFIs to build strong
capacity to meet the fast growing demand of credit by the poor.
7
This study tries to examine how SFPI achieves its goal, in sustainable way to make a difference
in the livelihood of the poor given the above challenges. Attempts are made to understand the
client needs and assess the impact of microfinance intervention on poverty reduction at the
household and enterprise levels.
One of the issues raised by researchers is that, it has not been sufficiently or critically evaluated
in relation to its impact (Meehan, 1999). Impact assessment can be used to improve services,
increasing impact on poverty and microfinance institution efficiency, to promote good client
service and accountability and to provide accountability to donors and other external
stakeholders (SEEP, 2001). If the intervention is intended to reduce poverty, it is important to
know the degree to which poor people use existing services and on what terms they used. And
then an intervening organization makes an informed decision on whether their work is likely to
augment or displace existing poor financial services (Johnson and Rogaly, 1997). The results of
few case studies indicated that access to finance could reduce poverty. However, comprehensive
impact assessment research has not yet been conducted to prove it.
Very limited researches towards improving the financial sector have been observed (wolday,
2003). Even these limited researches are more concentrated on institutional sustainability rather
than client impact or sustainability. Thus, studying the impact of microfinance intervention is
important to fill this gap.
SFPI has not undertaken an impact assessment study to understand or evaluate whether or not its
interventions leads to change by comparing the conditions without the intervention. This
particular study attempted to assess the impact of microfinance intervention on poverty reduction
by taking a case study of SFPI. Some indicators of poverty, which are used to assess impact in
this study, include change in asset ownership, income level and expenditure, housing, education
and health condition, and empowerment. The justification of selecting SFPI, as a case study is
that, it focused on the marginalized poor people especially the poor women and its geographic
coverage included both urban and rural clients
1.3. General objective
8
The general objective of this study is to assess the impact of microfinance services on poverty
reduction at household and enterprise levels by increasing income, creating job opportunity and
enhancing empowerment.
1.4. Specific objectives
The study has the following specific objectives.
1. To examine the nature of loan and loan repayment capacity of the poor.
2. To assess the nature and change of income and wealth as a result of the delivery of
financial services.
3. To compare the living standard and expenditure of the people before and after receiving
the loan.
4. To examine the impact of microfinance on employment and production capacity of
enterprises before and after the loan.
5. To assess the impact of microfinance services on empowering women clients.
6. To evaluate the trend of saving mobilization before and after the program.
7. To study the impact of credit and saving services on improving asset ownership,
education and health care.
8. To assess the clients’ image towards SFI financial and non-financial service provision.
1.5. Hypothesis
In order to conduct impact assessment and to address the main objective of the study, this
particular study has the following hypotheses:
� The provision of microfinance services such as credit and saving has a positive impact on clients
� at household and enterprise levels.
� At the enterprise level:
• Increasing profit
• Increasing production
• Increasing fund availability
• Increasing employment opportunity
� A the household level:
• Increasing income
9
• Increasing consumption
• Increasing housing ownership and improvements
• Increasing assets ownership
• Increasing food security
• Increasing access to education and health care
• Increasing savings
• Enhancing empowerment
1.6 Significance of the study
Institutional Microfinance is lately emerging phenomenon which had not been given due
attention in earlier development paradigm, particularly in Ethiopia. As a result, very limited
studies have been undertaken in this area. The document in the Association of Ethiopian
Microfinance Institution revealed that Ethiopian microfinance institutions are facing a number of
challenges. Among these, lack of research to understand clients' needs is a vital problem. This
case study has attempted to address the lacuna of research on the impact of microfinancing
programs at enterprise and household levels and its role in combating poverty. This study will
contribute in filling the information gap by assessing the socio- economic impact of SFPI
operations in Addis Ababa and Oromia region at a household and enterprise level. It also adds a
body of knowledge in the area.
1.7. Limitation of the study
This study is limited to the households who are participating in SFPI microfinancing program. It
only focuses on one MFI and very limited sample size. Therefore, it may not have a strong
scientific justification and representative ness to generalize about the impact of MFIs on
reducing poverty in the entire country.
The other limitation of the study is time and financial constraint. Because the study is time and
finance bounded as compared to the wideness and intensiveness of the work. There is also the
problem of getting reliable information from respondents. Due to absence of a baseline survey
before the implementation of the program, respondents may not recall the situations before
taking loans properly.
10
Despite the above limitations, the samples selected from SFPI are considered representative
enough. It is believed that, the random samples helps to make reasonable analysis and conclusion
on assessing the impact of microfinance services on poverty reduction in both urban and rural
areas.
1.8. Organization of the paper
This research paper is organized into five chapters. The first chapter deals with background,
statement of the problem, and objectives of the study, hypothesis, significance, limitation and
conceptual framework of the study. The second chapter focuses on pertinent literatures and
relevant empirical case studies to the research. Whereas chapter three describes the research
methodologies applied in the study. Chapter four focused on the major findings of the study.
Chapter five is the conclusion and recommendation part of the study.
1.9. Conceptual framework
Impact assessment can be used to improve services, increasing impact on reducing poverty and
microfinance institution's efficiency, to promote the delivery of good client services and
accountability, and to provide accountability to donors and other external shareholders.
Microfinance impact analysis is the process by which one determines the effect of microfinance
on the living standard of the poor as an intervention (SEEP, 2001).
According to Yaron (1997), there are two major schools of thought that are prominent in impact
assessment of microfinance. The first one focuses purely on changes in the organization and its
operations. In this approach, generally, two key variables of institutional outreach and
institutional sustainability are focused on. In other words, the main focus for the impact
assessment in this approach is the performance of the institution in extending the credit. The
assumption is that if both outreach and sustainability have been enhanced, then the intervention
is judged to have a positive impact as it has widened the financial market in sustainable fashion.
This, in turn, is based on the assumption that such institutional impact extends the choices of
people looking for credit and saving services and that extension of choice ultimately leads to
improved micro enterprise performance and household economic security.
The second approach, which is currently gaining prominence and is applied for this impact
assessment, is the one, which focuses on clients needs rather than on the organizations delivering
the financial services. It should answer the questions, such as who are users of the services? How
11
are the various groups using the services? And how does the intervention affect the life of the
beneficiaries?
The impact assessment methodology applied in this case are the ones developed by USAID's
AIMS project that seeks to assess impact at household, enterprise, individual, and community
levels. This approach is believed to produce a fuller picture of overall impacts of microfinance
activities.
The rationale for using household and enterprises as units of impact assessment is that for an
organization aiming at providing financial services to alleviate poverty, its end result is fully
measurable only in direct relationship to the lives of human beings. Human beings are part of the
household, the society or the community in which they live. These elements would, in one way
or the other, influence the actions or activities of the clients. In other words, the impact of the
credit may occur as a result of the composition of the household, the quality of the decision-
making within the household to any economic activity of the household (Tsehay and Mengistu,
2002).
At the household level, impact may be measured by net increase in household income, asset
accumulation and labor productivity. At the enterprise level, it is measured by changes in
enterprise income, employment, profit and volume of production.
The result of this kind of assessment would enable the organizations to take appropriate
decisions to build on their strengths and strive to concentrate on areas of clients' needs that call
for much improvement (Tsehay and Mengistu, 2002). The aim of SFPI is to reduce poverty by
targeting poor people to improve the clients' welfare and standard of living. Therefore, this study
applies the second approach which focuses on clients’ needs to assess the impact of SFPI on the
living standard of the clients.
The study attempts to measure the impact that occurs at household level and enterprise level use
it as a conceptual framework. The impact can be assessed by specific indicators such as increase
in household income and expenditure (consumption), change in the enterprises income,
improvement of employment and production, and empowerment of women.
12
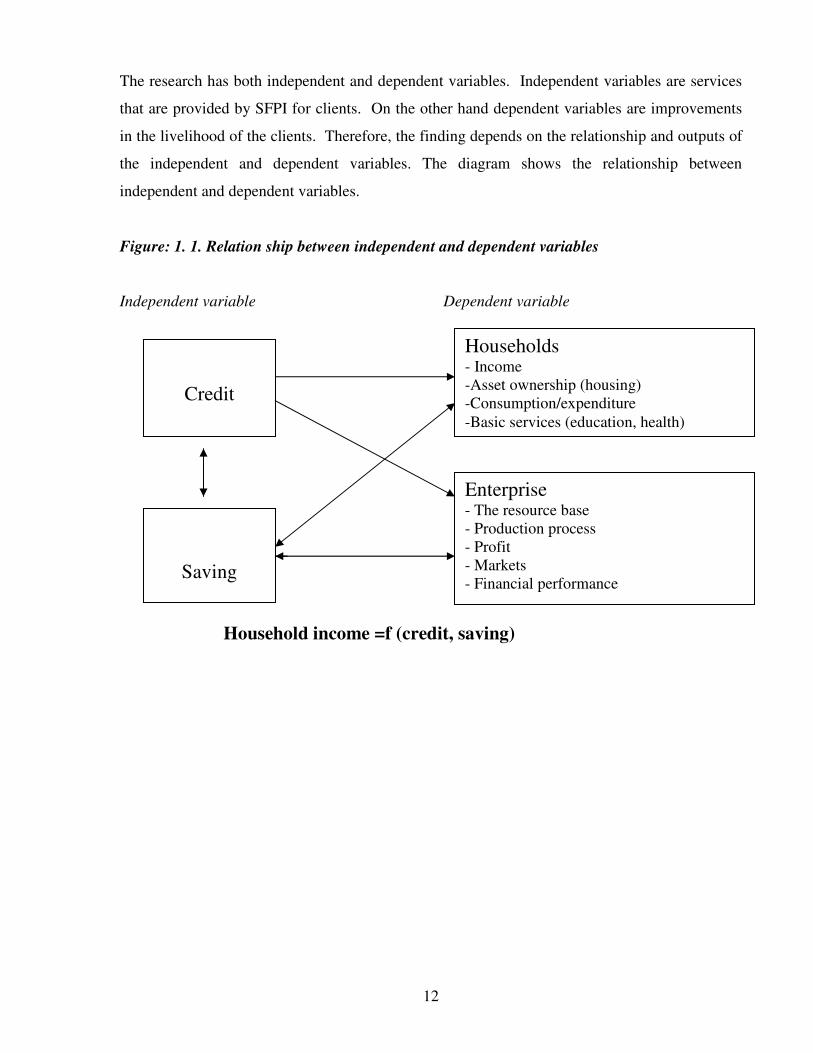
The research has both independent and dependent variables. Independent variables are services
that are provided by SFPI for clients. On the other hand dependent variables are improvements
in the livelihood of the clients. Therefore, the finding depends on the relationship and outputs of
the independent and dependent variables. The diagram shows the relationship between
independent and dependent variables.
Figure: 1. 1. Relation ship between independent and dependent variables
Independent variable Dependent variable
Household income =f (credit, saving)
Credit
Households - Income
-Asset ownership (housing)
-Consumption/expenditure
-Basic services (education, health)
Enterprise - The resource base
- Production process
- Profit
- Markets
- Financial performance
Saving
13
CHAPTER TWO
REVIEW OF LITERATURE
2.1. Poverty
2.1.1. Concepts and definitions of poverty
Before assessing the impact of any institution on poverty, it is important to understand the
concept of poverty and its relative definitions. The world is characterized by the division of
‘haves’ and ‘have nots’. The haves lead a luxurious life while the have-nots suffer from lack of
decent, healthful and productive life (Todaro, 1997).
There is no clear consensus among development experts and policy makers on how to define
measure and eradicate poverty (Meehan, 1999). Accordingly, there is no a single absolute and
standardized definition of poverty rather than defining it in relative terms. Different people view
and define it in different ways.
Traditionally poverty was understood primarily as material deprivation, as living with low
income and low consumption characterized by poor nutrition and poor living conditions. This is
commonly known as income poverty. It is associated with the low health and educational levels
that are either the cause or the result of low income said to be human poverty. Many researchers
define poverty on the basis of income level instead of using its broader definition, which includes
well being. However, Hulme and Mosley, 1996 consider the definition as inadequate and
incomplete.
A classical definition of poverty sees it as the inability to attain a minimal standard of living
measure in terms of basic consumption needs or the income required for satisfying them (WB,
1990). Poverty is thus characterized by the failure of individuals, households or entire
communities to command sufficient resources to satisfy their basic needs. The inability to attain
minimal standards of consumption to meet basic physiological criteria is often termed as
absolute poverty or deprivation. It is most directly expressed as not having enough to eat or
malnutrition. In absolute sense the poor are materially deprived to the extent that their survival is
14
at stake. In relative terms, they are also deprived in relation to other social groups whose
situation is less constraining.
Attimir (1982) defined the concept of poverty as a situation of poor health facilities, low level of
education, malnutrition and lack of participation in decision-making process. He elaborated it as
follows:
Poverty is a situational syndrome in which the following are combined: under
consumption, malnutrition, precarious housing conditions, low educational level, bad
sanitary conditions, either unstable participation in the production system or restriction
to its more primitive strata, attitudes of discouragement and anomie, little participation
in the mechanisms of social integration and possibly adherence to a particular scale of
values different to some extent from that held by the rest of the society.
Similar definitions and descriptions have also been providing by many institutions and authors.
World Bank in its report (1990) defines poverty as the inability to attain a minimum standard of
living. Poverty means a shortage of having enough to eat, a low life expectancy, a high rate of
infant mortality, low educational standard, low enrolment and opportunities, poor drinking water,
inadequate health care, unfit housing conditions and lack of active participation in a decision
making process. Poverty does not only mean lack of material needs but also vulnerability and
powerlessness. Power and participation dimension is argued to be independent with the income
level and asset ownership dimension (Holcombe, 1995).
According to the World Bank report (2002), the dimension of poverty is classified as at least in
four dimensions. These are: lack of income, low level of achievement in education and health,
vulnerability to risks and some sort of insecurity and voiceless ness. The broad and widely used
definition of poverty is developed by the World Bank, which incorporates the economic, social,
political and environmental situations of the people. The broader definition of poverty as the
multidimensional phenomena leads to a clearer understanding of its causes and to formulate a
more comprehensive policy aimed at poverty reduction.
2.1.2. Measures of poverty
15
It is not easy to measure poverty like that of its definitions. Thus, measures of poverty are
different in different countries. Conventionally, the income or expenditure level that can sustain
a minimum standard of living measures it. Poverty can be commonly measured by constructing a
line called poverty line. The cross cutting level which is constructed from monetary estimates of
minimum needs is said to be poverty line (Getahun, 1999). Poverty line is also defined as a
threshold level of per capita income or consumption level below which an individual is labeled
to be poor (WB, 1991). The poverty line represents a minimum level of economic participation
in a given society at a given point in time. People below this threshold is said to be poor. Poverty
line can be estimated in two different approaches. These approaches are absolute poverty and
relative poverty.
Absolute poverty refers to a condition in which people barely exist. In such situation, the
availability of the next meal will be a matter of life or death. It is a critical condition in which
people live on aid, food relief or their own meager returns from squatter farming, prostitution,
scavenging on refuse tips and so on (Todaro, 1997). It tends to identify those who are starving
without any comparison made with others.
To allow for international comparison the world Bank has established an international poverty
line of 1US dollar a day per person in 1985 purchasing power parity (PPP) prices which is
equivalent to 1.08 dollar a day per person in 1993 PPP prices. According to this measure the
portion of extremely poor people in the worlds population (people living on less than 1 dollar a
day) fell between 1990 and 1999 from 29 percent to 23 percent respectively. Developing
countries have the highest percentages of population living below the poverty line. The highest
incidence of poverty is observed in sub-Saharan Africa, with almost half of its population living
below the poverty line (1 dollar).
The relative poverty implies that one has less than what others have. It tends to identify with
comparison made with others. It tends to identify with comparison of the circumstances one
group of people or an entire economy with another one. It refers to a relative income differential
of distribution. It may not be a situation of an entanglement in between life and death as of the
case in absolute poverty. It exists when the subjects under consideration are “poor” in relation to
others (Todaro, 1997).
16
2.1.3. The vicious circle of poverty
Poor people live without fundamental freedoms of action and choice that the better off take for
granted. The poor often lack adequate food, shelter, education, health and deprivations that keep
them from leading the kind of life that everyone values. They also face extreme vulnerability to
ill health, economic dislocation and natural disasters. Moreover, they are exposed to ill treatment
by institutions of the state and society, and powerless to influence key decisions affecting their
lives (WDR, 200/2001).
Poor people everywhere continue to suffer from unacceptably low social conditions and lack of
access to services. Economists assume that peoples’ willingness to save for future consumption
grow with their incomes. In poor countries most incomes are mostly spent to meet current needs
rather than transferring to future needs. It tends to lower national saving rates.
In combination with the small size of poor countries’ economies, lower saving rates account for a
much smaller pool of savings available for desperately needed domestic investment in both
physical capital and human capital. For example, Sub-Saharan Africa consistently has the lowest
saving rate and the smallest pool of saving. High-income countries' pool of saving was about
three times as large as all the savings of developing countries combined (WDR, 2001).
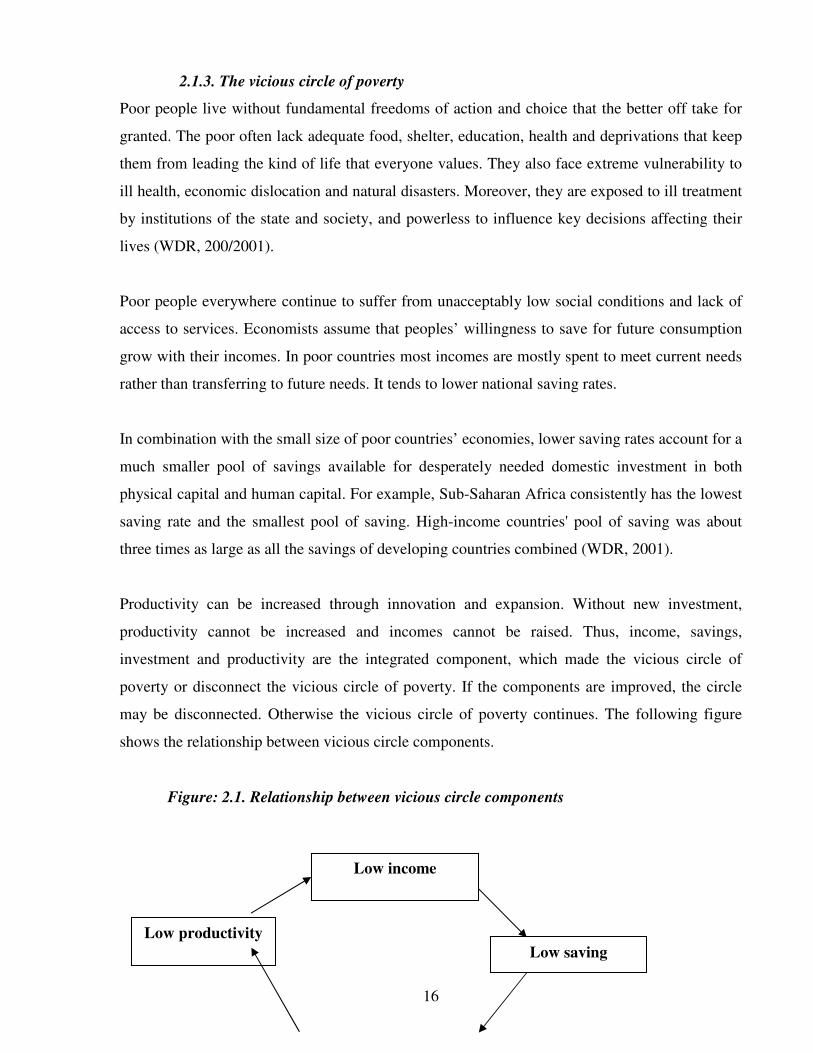
Productivity can be increased through innovation and expansion. Without new investment,
productivity cannot be increased and incomes cannot be raised. Thus, income, savings,
investment and productivity are the integrated component, which made the vicious circle of
poverty or disconnect the vicious circle of poverty. If the components are improved, the circle
may be disconnected. Otherwise the vicious circle of poverty continues. The following figure
shows the relationship between vicious circle components.
Figure: 2.1. Relationship between vicious circle components
Low income
Low productivity
Low saving
17
Source: World Bank Report, 2004
The poor in Ethiopia have low income that leads to low saving and in turn leads to low
investment. Without new investment, productivity may not be improved and this will result in
low income. Access to institutional credit that contributes to an increase in investment and
disconnects the vicious circle of poverty is very limited in Ethiopia. The majority of the poor get
access to financial services through the informal channels (wolday, 2003).
2.1.4. Situation of poverty in Ethiopia
Poverty is mostly the manifestation of developing countries like Africa, Asia and Latin America.
Ethiopia is among the developing countries in the world facing severe poverty. It ranks 169th
out
of 175 countries (UNDP, 2003). The World Bank estimated that the per capita income of the
country is less than USD 110. Poverty remains a threat to the political, economical and social
stability of the country.
The majority of people in Ethiopia are living in rural areas where poverty is more widespread
than in urban areas. About 45 percent of the rural populations are below the nationally defined
poverty line, while it is 37 percent for urban population. Poverty is also deeper and severer in
rural areas than in urban areas. On average, the income of the rural poor is 12.1 percent far from
the poverty line, while it is 10.1 percent for the urban poor (Tassew, 2004). Similarly MoFED
(2002b) estimated the poverty incidence of 45.4 percent and 36.9 percent, depth of 12 percent
and 10 percent, and severity of 4.6 percent and 3.9 percent for rural and urban Ethiopia
respectively.
Extreme poverty manifests itself in terms of various social, cultural and economic indicators,
such as backward and dominantly rural population, high illiteracy rates, repressed women, high
fertility rates, high dependency ratios, overcrowded housing system, unsafe drinking water,
widespread of HIV/AIDS, drought etc. Most of the poor are women, children, the elderly, small-
scale farmers and unskilled workers. These people lack the financial capacity to meet the
minimum standards of living (AEMFI, 2005). Generally the socio-economic situation of the
Low investment
18
country is characterized by low growth of income, inadequate social services, high population
growth rate, economic inefficiency and high unemployment rate (Wolday, 2003; Tsehay and
Mengistu, 2002).
2.1.5. Poverty Reduction
The problem of poverty is more deep-rooted with several interlocked characteristics in
developing countries. Poverty alleviation has remained a very complex and critical concern
among third world countries for a long time. It has been at the top of the agenda for policy
makers and development workers. Thus, a large number of governmental and non-governmental
organizations and international funding agencies all over the world have been engaged in
attacking poverty using several strategies and instruments (Rao and Bavaiah, 2005).
The approach to reduce poverty has evolved over the past 50 years in response to understanding
of the complexity of development. In the 1950’s and 1960’s, many scholars considered large
investments in physical capital and infrastructure as the primary means of development. In the
1970’s the shift of emphasis grew that physical capital was not enough for development but also
health and education were important not only in their own right but also to promote growth in the
incomes of poor people. In 1980’s another shift of emphasis was developed on improving
economic management and allowing greater role for market forces, promoting labor-intensive
growth through economic openness and investment in infrastructure, and providing basic
services to poor people in health and education (WB, 2001). In 1990’s the paradigm shift moved
towards improving governance and institutions to address poverty. A strategy was designed to
attack poverty in three ways. These are promoting opportunity, facilitating empowerment and
enhancing security (ibid).
The overall economic growth and equity are crucial in the effort of reducing poverty. In this
situation the role of the state is greater to support the build up of human, land and infrastructure
assets that poor people own or to which they have access. Strengthening the participation of the
society, particularly the poor, in political process and in decision making, removing the social
and instructional barriers that resulted from distinctions of gender, ethnicity and social status and
also establishing sound and responsive institutions are important to bring the overall growth and
benefit to the poor. Reducing vulnerability to either natural or man-made hazards enhances the
well-being of the people and encourages investment. This can be done by building the assets of
19
poor people, diversifying household activities and providing a range of insurance mechanisms
(ibid).
The multidimensional nature of poverty leads to greater complexity in poverty reduction. Thus,
there is no universal blue print instrument in poverty reduction. Developing countries need to
prepare their own policies to reduce poverty on the basis of national priorities and local realties.
Their choice may depend on the economic, political, social, structural and cultural context of the
countries. But action at national and local levels may not be enough for rapid poverty reduction.
International cooperation is required to ensure gains to poor countries and to poor people within
developing world through debt relief, material as well as technical assistance, loan and providing
market opportunities.
Even if developing countries have coherent and effective homegrown policies in poverty
reduction, rich countries and international organizations have an important role in promoting
global financial and environmental stability, lowering market barriers to the products and
services of poor countries.
Simultaneous actions to expand opportunity, empowerment and security can create a new and
dynamic change. If the developing world and the international community work together by
combining real resources, experience, knowledge and imagination, there will be a rapid progress
in poverty reduction in new millennium (WB, 2001).
The world development report reviewed seven themes for change, which needs urgent priority
for poor people around the world. They are change from:
• Material poverty to adequate assets and livelihoods
• Isolation and poor infrastructure to access to services
• Illness and incapability to health, information and education access
• Unequal and troubled gender relations to equity and harmony
• Fear and lack of protection to peace and security
• Exclusion and impotence to inclusion, organization and empowerment
• Corruption and abuse to honesty and fair treatment
20
Poverty reduction strategies are the outcomes of the insights and lessons drawn from the
liberalization drive of structural adjustment programs experienced by the IMF, the world bank
and the world community at large during the 1980’s and 1990’s. In this approach, growth has
never sufficiently trickled down to reduce poverty reduction. The two institutions reached to an
agreement that country owned poverty reduction strategies be the basis for World Bank and IMF
concessional lending and guide the use of resources freed by debt relief under the enhanced
HIPIC initiative. This was the genesis of poverty reduction strategy at the global level (MOFED,
2002). World leaders agreed to a set of time-bound and measurable goals and targets for
combating poverty and hunger, disease, illiteracy, environmental degradation and gender
inequality. This is called millennium Development Goals (MDG).
The Millennium Development Goals endorsed by all members of the United Nations set out
eight specific crosscutting and interrelated goals that are essential to reduce poverty. The first
seven goals focused on the duties of poor countries to meet the goals. The eighth goal is aimed at
the rich countries and their commitment to respond to developing countries political and
economic reforms with increased economic assistance, lowered import barriers and the deduction
or elimination of unsustainable debt (UNDP, 2003).
The main precondition for achieving the millennium goals is sufficiently fast and equitable
economic growth in developing countries to provide the material resources for reducing all kinds
of poverty including human poverty.
The governments of developing countries are the most important actors in the development
process. No amount of foreign aid can be effective in any country where the government is
corrupt or fails to implement good policies. Formulating comprehensive national development
priorities and coordinating their achievement is a crucial task that can never be entrusted to the
private sector or to any foreign aid providers (WB, 2003).
Ethiopia is one of the developing countries, which is faced with a complex, deep, broad and
structural problem of poverty. The proportion of the population below the poverty line is
estimated at around 44 percent. Thus, poverty reduction has become the central development
agenda in Ethiopia like of other developing countries (Assefa, 2004).
21
Several reforms are undertaken in social, political and economical aspects to reduce poverty in
the country. Ethiopia’s development policies, strategies and programs adopted since 1992/93
have been concerned with how to bring sustainable and equitable development and then reduce
poverty. With the above objectives, Ethiopia has formulated a Sustainable Development and
Poverty Reduction Strategy Program (SDPRP) in 2002.
The program produced the basic framework for achieving fast and sustainable development and
reduces poverty. The focus is on some selected key social and economic sectors. The main
sectors on which development efforts would concentrate and which are considered as priority
areas are agricultural and rural development, infrastructural development (road, water,
telecommunication, electric power), and education and health sectors (MOFED, 2002).
Women and men have different access to critical economic resources and varying power to make
choices that affect their lives. This leads to unequal roles and responsibilities of women and men.
The government of Ethiopia has recognized that any development effort ignoring or limiting the
participation of women cannot be successful. Thus, the government of Ethiopia committed to
reduce poverty in addressing gender dimensions and targeting poor people.
The government of Ethiopia has taken encouraging steps by privatizing the nationalized
institutions and facilitating the establishment of new organizations. One of the outcomes is the
liberalization of the financial sector and the establishment of legal framework that allows the
emergence of microfinance institutions to serve poor households (Tsegaye, 2005). The
government tries to solve the problem of financial access to the poor by promoting the
microfinance institutions. The government believes that microfinance institutions are one of the
instruments in poverty reduction.
The delivery of financial services has been viewed as one of the antipoverty tools of the
development programs because of creating employment opportunities by increasing their income
and consumption and then reducing poverty. Improving financial access to the poor also
facilitates economic growth by easing liquidity constraints in production, by providing capital to
start up new production. Therefore, the introduction of microfinance will have a significant
effect in reducing poverty at macro and micro levels (Wolday, 2003).
22
2.2 .The emergence of microfinance
The challenge of reducing poverty and improving living conditions for the poorest population is
a formidable one. The betterment of poor people requires an effort that spans all sectors of the
economy and may not be easy to achieve through economic growth alone. Improved access to
financial services helps poor people by enabling payment transactions then bring them into the
formal sector. Financial services enable poor people to use profitable business opportunities and
raise earnings (Kumar, 2005; Wolday, 2003). But financial markets often serve poor people
badly. Since poor people often have insufficient traditional forms of collateral to offer, they are
often excluded from financial markets. The formal financial institutions were relevant to extend
credit facilities to the poor for fear that loans would not be repaid. Poor borrowers faced high
transaction costs when they sought loans from formal financial institutions. The costs included
time, travel and paperwork involved in obtaining credit.
From the 1950’s governments and international aid donors delivered subsidized credit to small
farmers in rural areas of many developing countries. It was assumed that poor people found great
difficulty in obtaining adequate volumes of credit and were charged high rates of interest by
monopolistic moneylenders. Development finance institutions, such as Agricultural
Development Banks were responsible for the delivery of cheap credit to poor farmers. These
institutions attempted to supervise the uses to which loans were put and repayment schedules
were based on the expected income flow from the investment returns, which were often
overestimated. As the result, loans were often not repaid. The credibility and viability of these
subsided credit schemes were further weakened. Fluctuating whims of governments and donors,
together with poor investment decisions and low repayment rates made many of development
finance institutions unable to sustain their lending programs (Johnson and Rogaly, 1997; Hailu,
2005).
Donors and other resource suppliers criticized the model of subsidized credit. They recommend
that the model should shift from government intervention subsidy to market based solutions.
Policy makers were reminded that credit should be described as debt and that the over-supply of
23
subsidized credit without realistic assessment of people’s ability to repay could result in
impoverishment for borrowers (ibid).
According to Robinson (2001), there are two known approaches in microfinance development.
These are poverty lending approach and financial system approach. Both approaches share the
goal of making financial services available to poor people throughout the world.
The poverty lending approach focuses on reducing poverty through credit and other services
provided by institutions that are funded by donors and government subsidies and other
concessional funds. A primary goal of this approach is to reach the poor especially the poorest of
the poor with credit. Saving is not a significant part of this approach. But mandatory saving is a
precondition for receiving the loan. The emphasis is on micro- credit, not microfinance.
The poverty lending approach was first realized in Grameen bank in Bangladesh. It has wide
outreach to poor borrowers. But the approach has required large amount of continuing subsidies
and does not meet poor people’s demand for saving services. Due to these it has not proven a
globally affordable model (Robinson, 2001).
With the failure of credit institutions to address the grassroots (households’) financial needs, the
situation demanded an innovative approach to address the lower segment of the population. The
new approach should correct the drawbacks of the old approach (Hailu, 2005). This is a financial
system approach.
The financial system approach focuses on commercial financial intermediation among poor
borrowers and savers; and also emphasis is given to institutional self-sufficiency. The approach
targets lending to the economically active poor people, i.e. people with the ability to use small
loans and the willingness to repay and to voluntary save mobilization. Bank Rakyat (Indonesian's
micro-banking system) and Banco Sol (salvia’s banking system) are models of profitable
microfinance institutions (Robinson, 2001).
Appropriate targeting of policies is needed to strengthen financial access for those groups where
services are most needed. The new paradigm was introduced as loans are made available in small
amounts at market rates, with low level of formality and limited requirements of collateral
24
repayment is undertaken frequently and rates of repayment in many microfinance ventures are
cited to be high. Many microfinance ventures also offer deposit-taking services. In this context,
microfinance is defined as “the delivery of such services by financial institutions, which are
small in size and informal in nature,” (Kumar, 2005).
Many associate microfinance with the provision of small loans to the poor. Both the products
(loans) and the market (the poor) fall within the preview of microfinance but they are more of its
origins than its present and future. Today microfinance has grown to cover a broader range of
products and services, from credits and savings, to insurance and money transfers. Today many
agree in the definition of microfinance as provision of financial services to those excluded from
the formal financial system in broader terms (SUM, 2002).
According to Joan Parker (2000), microfinance refers to the delivery of financial services such as
credits, savings, insurance and other services to clients who are without access to the services of
formal sector, financial institutions on sustainable basis. This is the widely used definition of
microfinance.
Microfinance programs which focused on the delivery of financial services to the poor gained a
worldwide acceptance and popularity since 1980’s.The developments in the 1980’s represented
as a turning point in the history of microfinance development. As cited by Robinson (1995)
worldwide survey of 206 microfinance institutions that are opened in or before 1992 found that,
only 7 percent had been in operation before 1960; and 48 percent had been founded between
1980 and 1989. Microfinance provided large-scale outreach and profitability in 1980’s for the
first time. In 1990’s it began develop as an industry (Robison, 2001).
A number of microfinance institutions were created in the 1990's. Some donor agencies have
provided strong support for the shift from donor-driven micro-credit programs to self-sufficient
microfinance institutions, and have initiated and coordinated the dissemination of best practices
in microfinance on regional and global scale (ibid).
Recent studies recognize that poor and low-income people slip from one poverty category to
another as the opportunities and risks change. These studies helped shed light on the levels of
poverty at which more poor people are reached by today’s successful microfinance intuitions. It
25
is being considered as a preferred vehicle for extending access to the poorest in many countries
(Kumar, 2005). The survey conducted at the end of 2002 by Credit Summit Campaign cited in
Wolday (2005) revealed that more than 67.6 million clients around the globe have been
benefited, of which about 41.6 million are the poorest. According to the Micro-credit Summit
estimate at the end of 2005, microfinance institutions are reaching to 100 million poorest people
in the world. The UN declared 2005 as a year of micro-credit to bring the microfinance into
forefront and integrate with the formal financial system.
2.3. Microfinance Institutions in Ethiopia
Financial development plays a central role in poverty reduction (Narayana, 2005). Microfinance
is attractive and has been accepted as an important tool to help poor in improving the livelihoods,
reducing vulnerability and fostering social as well as economic empowerment (Lousie, 2002).
The delivery of financial services have been accepted as one of the poverty reduction tools in the
development paradigm; because it helps the poor to increase income, improve educational and
health status, improve housing condition, empowers the poor, provides confidence and social
esteem if it is realized appropriately (Wolday, 2003). It is believed that poor households lack
access to adequate financial services for efficient inter-temporal transfers of resources and risk
coping. Without some financial support, these households do not have many prospects for
increasing their productivity and living standard in sustainable way. Because formal financial
sector do not have interest in lending to poor households due to lack of viable collateral and high
transaction costs (Assefa et al., 2005).
Lately, microfinance programs received increased attention from the international financial
institutions such as World Bank, various bodies of the UN, donor agencies and IMF. IMF
focused on encouraging the creation of sound financial systems in developing countries
(Gebrehiot, 2005). Microfinance programs aiming at providing financial services to individuals
who are excluded from the formal financial sector have been launched in many developing
countries. In Ethiopia, lack of finance is one of the fundamental problems impeding production,
productivity and income of rural and urban households.
Microfinance development in Ethiopia in institutionalized form is a recent phenomenon. But it
has a long history in different forms. Government efforts of delivering credit to accelerate socio-
26
economic development in Ethiopia may date back to the immediate post Italian occupation
period with the establishment of the Ministry of Agriculture in 1943 and Agricultural Bank of
Ethiopian in 1945.The main objective of the Bank was to assist small land holders whose farms
had been devastated during the Italian occupation through loans to purchase agricultural inputs
and repaired houses (Assefa et al, 2005).
During the Derg regime, a large share of credit was given to the state sector and marginalizing
the private sector and the poor. Due to this, the private sector including the poor was forced to
depend on self-financing and non-institutional credit. During the 1986-90 the share of domestic
credit to the private sector and cooperatives averaged 4.7 and 1.1 percent respectively and the
rest going to the government and public sector (WB, 1991). NGOs have been delivering relief
and development services like emergency food, health, education and water in Ethiopia since
1970’s. NGOs delivered micro-credit service to the poor as part of their poverty alleviation
programs (Wolday, 2001).
Assefa et al., (2005) and Wolday (2003) indicated that many NGOs were involved in the
provision of microfinance services particularly in rural area. Moreover, the credit delivered by
NGOs faced many problems because of bad credit culture; which includes charging interest rates
that do not reflect true costs, lack of sound lending and collection policies and procedures, credit
was delivered without verifying borrower integrity and skill, lending based on NGO staff needs
rather than felt needs of borrowers, loan terms were not based on repayment capacity, lack of
collection efforts by the staff and providing loan outside the target group (to staff friends,
relatives and the like).
The donor or NGO driven micro-credit programs were commonly used in many developing
countries and are still in practice in some countries. The approach is known as poverty lending
approach that is supply-driven rather than demand driven and focused mostly on credit. On the
other hand, this approach disregarded the domestic saving mobilization. As the approach
changed from subsidized to market based principles, governments and NGOs considered
microfinance as the integral part of the financial system and they recognize the importance of
both credit and savings services (Ledgerwood, 1999).
27
In 1990, an agreement was signed between the Ethiopian government and International
Development Association (IDA) for a Market Towns Development Project with the objective of
tackling poverty through employment creation and income enhancement by providing credit
(Meehan, 1999). But the operation was for the first time undertaken after 1994 in regulated form
(Tsehay and Mengistu, 2002). Most of the borrowers were women during the time.
Wolday (2003) indicated that financial schemes of NGOs and institutions that do not follow
sound, sustainable financial principles and facilitate real economic growth might cause more
harm than benefit. The study recommended that the government should develop national
standards for NGO credit programs. Thus, the government took the initiative to establish the
regulatory framework in order to facilitate sound development of the microfinance industry.
Following this, the government of Ethiopia launched a Proclamation No. 40/1996 which requires
all existing microfinance providers to register as either a microfinance institution, a saving and
credit cooperative or an agricultural cooperative before the deadline of April 1999 (Proc. No
40/1996). It also provides a power to the National Bank of Ethiopia as the licensing and
supervising authority.
The majority of the NGOs in Ethiopia were terminated the delivery of financial services
following the issuance of proclamation No. 40/1996 (Wolday, 2003). Recently, microfinance
institutions are emerging rapidly in the country based on the new approach and in line with the
new microfinance law. Currently, there are twenty-six microfinance institutions in Ethiopia.
Almost all microfinance institutions have a common objective; poverty reduction through
provision of credit and saving services using group based lending methodology (Meehan, 1999;
Assefa et al., 2005; Tsehay and Mengistu, 2002).
Microfinance institutions in Ethiopia are allowed to mobilize saving deposits from their clients
and the public. Most MFIs have been trying to reach both in urban and rural areas (Tsehay and
Mengistu, 2002). The performance of microfinance industry in Ethiopia appears impressive
measured in terms of their rural presence, outreach of their services and repayment and
sustainability. The achievement is not only in supplying financial services for the poor but also in
realizing and strengthening lending and payback systems (financial system development that
serves the poor) of the country.
28
The twenty-six microfinance institutions in operation delivered an outstanding loan of 1.48
million birr to 1.2 million active clients and mobilized savings of about 501.3 million birr. The
average loan size was 1,232 birr (Tsegaye, 2005). Although the interest rates of most MFIs in
Ethiopia were relatively lower than other Sub-Saharan Countries, the many MFIs are
operationally efficient (Wolday, 2003). The 2003 report of AEMFI revealed that the gross
savings rate was about 69 percent and the average repayment rate of the industry was 96 percent.
The average personnel of Ethiopian MFIs are about 233 ranging from 22 personnel (Meklit
microfinance) to 1479 personnel (ACSI). Moreover, its average assets employed are about 55.3
million birr ranging from 2.47 million to 29 million birr. The largest market share is taken by
ACSI (41%), DECSI (37%) and OCSSCO (12%) (Tsegaye, 2005).
In spite of the encouraging development, millions of poor in Ethiopia suffer from lack of savings
and limit access to working and investment capital to start income generating activities. The
potential demand for credit in Ethiopia is high. For instance, at the households’ level, 9 million
poor households in Ethiopia need credit. This demand remains largely unmet with the existing
capacity and structure of financial institutions in Ethiopia (Degefe, 2004).
The twenty MFIs meet less than 9 percent of the demand for financial services of the active poor.
This indicates that there is a significant unmet demand for microfinance services in Ethiopia. The
loan products in Ethiopia are very limited. All microfinance institutions deliver the same types of
loan products to their clients copying from each other. The lending methodologies and lending
products are supply-driven instead of being demand-driven. The MFIs have not attempted to
involve themselves in market study and new financial product development. All MFIs focused
on increasing repayment and client outreach (Wolday, 2002).
Some MFIs in Ethiopia have not reached in their operational self- sufficiency and financial self-
sufficiency. The average operational and financial self- sufficiency of microfinance institutions
in Ethiopia is 104 percent and 77 percent compared to African MFIs 111.1 percent and 93.7
percent respectively (Tsegaye, 2005).
Forming an association called Association of Ethiopian Microfinance Institutions (AEMFI)
networks the Ethiopian MFIs. Four microfinance institutions such as DECSI, ACSI, OCCSSCO
29
and OMFI for registration first formally request this association and then the Ministry of Justice
legally registers it as non-profit and non-governmental organization. AEMFI plays an important
role for the development of microfinance industry in Ethiopia by promoting best practices in the
industry, serving as a forum for debate and dialogue, facilitating sharing of experience and
information, and creating an enabling environment for the industry. Currently all 26 MFIs are
registered as a member of AEMFI (Haftu, 2005; AEMFI, 2005).
2.4. Impact from case studies in microfinance industry
Poverty reduction has been a concern of developing countries through emerging microfinance
industry. The idea of poverty reduction through MF has generated enormous enthusiasms among
donors and N G Os as an instrument for reducing poverty in a sustainable manner. The results of
few case studies have indicated that access to finance can reduce poverty. But comprehensive
research has not yet been conducted whether provision of microfinance services to the poor can
surely reduce poverty. Some of the case studies conducted to measure the impact of
microfinance institutions on poverty in developing countries are reviewed in this section.
Scholars argue on MF services on its negative impacts. Although micro-credit has claimed more
and more of the aid budget, it may not always be the best way to help the poorest and the fervor
for micro-credit may siphon funds from other projects that might help the poor more
(Hulme,2000).
Sometimes even when repayment rates are higher, it may be painful to the clients making them
pay from other sources such as sales of their limited assets. It increases indebtedness risks for
poor people because it makes them remain trapped in the vicious circle of poverty. However, it
does not mean that MF is worthless but the question is whether MF is better than some other
development projects for the poor as whole. More over, provision of micro-credit can be one tool
to reduce poverty but not the only one. There are at least four negative externalities that should
be considered in MF development. These are, facilitating de-industrialization, facilitating trade
deficits and import dependency, facilitating the destruction of social capital and facilitating one-
dimensional response to poverty reduction and local economic development (Bateman, 2003).
Some studies concerning the role of MF in poverty reduction by the Grameen Bank indicated
that borrowers have been initially successful but in the long run face a downturn terms of
30
ownership of asset and level of income, 69% of dropouts resulted from inability to pay their
installments due to loss in income generating activity, repayment of microcredit is being made
from other source s and the older groups and branches of MFIs have higher loan default rate and
larger percentage of ineffective groups(Johnson and Rogaly,1997).
The study analyzed by Hulme and Mosley comparing the households which had received credit
and households which had not received credit and revealed that the better-off the borrower, the
greater the increase in income from a micro-enterprise lean. Borrowers who already have assets
and skills are able to make better use of credit. The poorest are less able to take risks or use
credit to increase their income.
Some of the poorest borrowers interviewed become worse off as a result of micro-enterprise
credit, which exposed these vulnerable people to high risks. Business failure was more likely to
provoke a livelihood crisis than it was for borrowers with a more secure asset base. Specific
crises included bankruptcy, forced seizure of assets and unofficial pledging of assets to other
members of a borrowing group. There have been reports of suicide following peer-group
pressure to repay failed loans (Hulme and Mosley, 1996). Other evidences suggested that self-
selected groups for peer-monitoring have not been inclusive of the poorest people select those
with whom they want to form a group on the basis of their own knowledge of the likelihood that
people will make timely payment of loan and savings installments.
On the other side there are some evidences that show the positive impact of microfinance on the
households’ income and quality of life in millions of poor people in developing countries of
Asia, Latin America and Africa. A study conducted by Rao and Bavaiah (2005) on the impact of
microfinance on household income and employment in India indicates that the impact of the
program on poverty reduction has been very encouraging. The findings revealed that 76.8
percent of Share Microfinance Limited (SML’s) mature clients have experienced significant
reduction in their poverty and 37 percent of the mature clients who were below the poverty line
have come out of poverty line and now they are on the category of the non-poor. 80 percent of
the mature clients responded that SML intervention increased their income. Microfinance helped
the poor women beneficiaries to enter into new economic activities and increase their income
significantly. The study revealed that SML contributes 58 to 90 percent of their total income.
31
The impact study carried out on Casa Campesina Cayambe (CCC) in Ecuador revealed that
many members who received the loan from CCC financial institution have improved milk
products and raised income (Johnson and Rogaly, 1997). Robinson (2001) in her study
concluded that households and enterprises could benefit from microfinance institutions when
voluntary savings are locally mobilized. Micro-enterprises can self-finance in full or in part their
working capital needs as well as save toward investment needs. Saving accounts provide
security, legal recognition of the asset and returns, and improve household financial
management. Moreover it creates an opportunity for women to become economically
empowered. The evidence revealed that women have got the opportunity to hold their savings in
their own name for the first time.
Christopher Dunford (2000) cited in Rao and Bavaiah (2005) concluded that MFIs have an
important role in integrating microfinance with overall operations especially with education and
health. The credit and education components reinforce each other by addressing the informal as
well as the economic obstacles to health and nutrition. The other study in Judith, et al. (1999)
analyzed as loan growth is important to financial sustainability and a proxy for positive impact. It
revealed that, on overage, loan size increased steadily although at a rate lower than the original
village bank model projections.
Johnson and Rogaly (1997) studied the impact of microfinance intervention in Union Regional
de Apoyo Campesino (URAC) an MFI in Mexico and concluded that URAC’s flexible savings
facilities are appreciated by its members and used to support a wide range of livelihood needs
including food purchases, emergency health care, and insurance for periods of unemployment.
Thus, the services have demonstrated their usefulness and relevance to members and enabled
them both to protect and improve their livelihoods.
Another impact study in Ladywood Credit Union (LCU) in UK, revealed that the financial
service provided by LCU is useful for the thrift, preventing indebtedness through savings and
providing a means of building security against uneven cash needs, providing people with a
means of being in control of their own finances, and living within their income. LCU users who
live on benefits or very low incomes tend to save in irregular small amounts. Those people who
are benefited from the credit union are very positive about the service, stressing in particular the
understanding approach of staff, the flexibility, the chance it provides to save in small amounts,
32
the low rate of interest on loans, and the greater sense of control it offers them in difficult
circumstances (ibid).
Rutherford (2003) studied the money management behavior of low-income Bangladesh
households indicated that respondents were found to be active managers of their financial
resources and he concluded that as both MFIs and poor households would benefit if MFIs
achieved a better understanding of current and potential demand for financial services by the
poor and failure products and delivery systems.
Ruben and Clercx (2003) concluded that credit provision performs critical functions for
reinforcing the resilience of rural livelihoods in less-favored areas. Provision of rural credit and
savings services created the favorable conditions for adopting the Quezungual Agro-forestry
system and contributed to higher and more stable cereal yields and reduced labor demands in
agriculture. Thus, access to rural finance reinforces food security and enables the income
diversification as a precondition for subsequent in-depth investment.
The impact study conducted on Action Aid Agricultural loan provision in Gambia revealed that
among 30 respondents who took the loan, the 29 reported that the loan received increased
production, improved yield, more food, less need to borrow from else where, and reduced length
of the hungry season (Johnson and Rogaly, 1997).
Anton Simanowitz (2000) in his study on impact information from dropout clients in South
Africa concluded that dropouts provide valuable sources of information for program
improvement relating to both the performance of the MFI in relation to client needs and how to
MFI’s relate to client livelihoods and external conditions. Ana Marr (2003) concluded that
microfinance failed to solve the original problems of information asymmetries between
borrowers and lenders in its pursuit of financial sustainability. This failure destroys the social
fabrics of communities, creating more poverty and excluding the poorest and most vulnerable
from any given group (Rao and Bavaiah, 2005 citation).
Meehan (1999) in her study on the impact of credit provision by DESCI in Tigray region
revealed that the majority of respondents (83 percent) reported that an initial increase in
households' income due to credit services. But it has fallen to 52 percent after five years. The
33
incremental income is mainly used for basic household food supply, clothing and education of
children 80 percent, 60 percent and 40 percent respectively. The provision of credit in response
to demand and the impact of credit access and usage has resulted in increasing household income
and decreasing poverty levels in the study area is depend on continued access to credit. She also,
concluded that the expansion of business opportunities and strategic planning for clients’
economic activities could contribute to the scale and sustainability of the impact of loans on
poverty levels.
Likewise, Asmelash (2003) indicated that the overall household income of frequent clients has
increased than the overall household income of the new clients in both urban and rural areas in
12 months. The result suggested that DECSI has a positive impact on diversification of income
sources for clients. The frequent borrowers have a better housing condition and increased asset
ownership, improved ability to pay educational and medical expenses than non-participants. In
the same token frequent borrowers have better diet improvement, job opportunity creation and
participation in decision- making (empowerment) than the non-participants. Similar conclusion
has made in micro-credit income diversification case study in central Tigray conducted by
Tassew (2005). In general the findings revealed that microfinance intervention has a positive
impact on the livelihoods of the households. Thus, it has an impact in poverty reduction.
Alex Borchgrevilk et al. (2005) conducted a study on the impact of credit on marginalized
groups such as young households, rural landless households, and urban house-renting households
by taking a case study of DECSI in Tigray regional state. The study targeted more on extremely
marginalized groups of female-headed households. They concluded that DECSI’s program has a
positive impact on the livelihoods on its clients compared to non-clients. The clients have greater
improvements in terms of their assets, income, consumption, food security, less vulnerability to
shocks, and social and political empowerments.
Padma and Getachew (2005) conducted a study on women economic empowerment and
microfinance by reviewing Awassa women clients. The finding revealed that 83 percent of
respondents reported that credit was a very supporting tool to their business. The majority of
clients built up some additional rooms for the purpose of living and business. They have better
asset ownership, better educational expense and participation in decision-making. There is a
34
positive influence of microfinance in asset formation, increasing income and employment
generation, in business improvements, and increasing decision-making process.
Tsehay and Mengistu (2002) revealed that over 74 percent of frequent borrowers have been able
to expand their business. Over 94 percent and 70 percent of frequent borrowers sent their
children to school and improve their diet respectively. They have also better asset ownership,
both economic, and social empowerment than the non-participants. They have also better asset
ownership, both economic, and social empowerment than the non-participants. They concluded
that the credit and saving intervention has some positive impact that made a difference on the
socio-economic empowerment of the women clients.
Haileselassie’s study (2005) on financial sustainability of microfinance institutions by taking a
case study of SFPI and PEACE revealed that outreach, financial self-sustainability and
institutional building are the main indicators of microfinance performance. His findings indicated
that MFI’s have achieved extensive outreach in providing financial services to the urban and
rural poor. Saving mobilization was significantly increased and at the same time repayment rate
was very high in both institutions (98 percent and 99.6 percent of SFPI and PEACE
respectively). The trend of financial performance showed that there is a good and steady progress
towards reaching operational self-sufficiency. But both institutions are still subsidized. It is
possible to say that the performance of the institution affects the impact of the intervention in
poverty reduction.
Another impact study on SFPI conducted by Jimbed consult P.L.C (2001) concluded that at the
individual level personal income and savings have shown improvements. Additionally household
income and welfare has been increased. It can be evidenced by the study that most of school-
aged children are in school and there is an improvement in household diet as a result of the
microfinance services of SFPI. The microfinance intervention has also an impact at the enterprise
level by enterprise expansion, addition of new products, improving quality of products,
improving management skills, and cost reduction. However, improvements in net worth have
been insignificant. Most of the improvements observed are achieved over a short period than
long period. The survey indicated that most of one-year and two-year clients have better
improvements than third-year respondents. In general the study concluded that SFPI’s credit
program has positive impacts on its target clients.
35
As reviewed in some case studies on impact of microfinance interventions, MFIs have a positive
impact on the livelihood of the marginalized poor. But the depth of impact is different in
different countries and different MFIs because of several factors. Some of the factors can be size
of the financial service provided, institutional performance, information availability,
accessibility, infrastructure availability, awareness of the clients, approach or methodology,
environment and others.
However, in conclusion governments and donors should know whether the poor gain more from
small loans compared to other alternatives such as health care, education, agriculture, food aid
etc. Most measures of the impact of microfinance institutions fail to control for what would have
happened in their absence. The net contribution or impact of microfinance to poverty reduction
should be properly and more accurately measured.
36
CHAPTER THREE
METHODOLOGY
3.1. Data collection
The study was conducted in Addis Ababa and its surrounding areas in Oromia Regional State in
three branches of SFPI (merkato branch, cherkos branch and debrezeit branch). The study used
both primary and secondary sources of data. The primary sources of data is obtained from direct
observation, structured and unstructured questionnaires, focus group discussions and
interviewing the concerned parties such as Association of Ethiopian Microfinance Institution and
management staff and employees of SFPI at the main office and at each branch.
Direct observation is made in merkato branch, cherkos branch and debrezeit branch. This method
helped the researcher to observe the real impact of SFPI intervention on poor clients. Structured
questionnaires were used to collect information from households on various aspects of impact
dimensions. Before applying it, the questionnaire was tested for its validity by using pilot survey.
Two branch managers, staff members, enumerators, supervisors and some respondents are
involved in pilot testing. The questionnaire was refined and finalized after incorporating the
inputs of the pilot survey.
The interviews were administered on randomly selected active clients and incoming clients to
answer questions regarding their situation before they took the loan based on their memory and
after taking the loan. The questionnaire was prepared in English language. The respondents
should know and told about the research objectives in the language, which they can understand.
Most respondents in the survey speak Amharic. Therefore, the questionnaire was translated into
Amharic. This enabled the enumerators and respondents to easily understand the questions,
express their ideas comfortably and reduce communication barriers. The interview enabled the
researcher to capture and ascertain both subjective and objective facts. Thus, face-to-face
interview were important in order to increase probability of response rate and flexibility in
extracting more qualitative and quantitative information. Three supervisors and five enumerators
were trained to collect relevant data from sample households and enterprises. A training manual
37
was prepared to train enumerators. The enumerators were given a one-day training on the
training manual, which focused on the objectives of the study on how to approach a respondent,
how to record the responses, and on detailed contents of the questionnaire.
Conducting focus group discussions was important to assess the satisfaction or dissatisfaction of
clients in service provision and disclose their problems, comments and provide some
recommendations. This also strengthened the reliability of the finding. The focus group
discussions were conducted in both urban and rural households. A total of five focus group
discussions, of which, three in urban and the other two in rural areas were conducted. Each group
discussion had seven to ten participants. To reduce the risk of biased ness, male and female
clients had separate group discussions. Among five group discussions one female and two male
group discussions were conducted in urban areas and the remaining one female and one male
group discussions were conducted in rural areas.
Discussions with key informants such as some clients of SFPI, employees and branch managers,
SFPI officials, and AEMFI officials were conducted to collect qualitative information.
Secondary data were obtained from documents, reports, journals, proceedings, bulletins, Internet,
periodicals, various books and other relevant materials.
3.2. Sample Design
A case study design is used in the study. Case study design helps to examine the detail features
of the institution. The study has used two groups of samples namely, experimental group and
control group. Control group was used to avoid the problem of intervening variables (variables
that are affecting the output of the research other than independent variables). This control group
is randomly selected from the list of people who are in the training phase, which would be clients
of the SFPI in the near future or incoming clients. Experimental groups are randomly selected
from the list of SFPI active clients and ex-clients (dropouts). The sample frame of the study is
the entire people found in the list of SFPI microfinance institution.
Probability sampling technique or simple random sampling is used in the study. Probability
sampling ensures sampling units a known, non-zero and equal chance of being included and
hence representative ness. In this technique sampling units are stratified depending on the branch
category or grouping of the institution. Determining the appropriate sample size is important in
38
research undertaking. Thus, sample size depends on the total number of population, the level of
confidence and the maximum deviation from true population that can be tolerated in the study.
Depending on this, there are various sample size estimation methods. Among these the method
or model used to determine the desired sample size with the population of above 10,000 and
sample size of above 30 is formulated as:
n ==== z2pq
d2
where: n = sample size (when population is greater than 10,000)
z = the standard normal deviation usually set at 1.96
which corresponds to the 95 percent confidence interval
p = proportion in the target population estimated to have a
particular characteristics
q =1-p
d = degree of accuracy usually set at 0.05 or occasionally at 0.01.
SFPI has four branches (shola, merkato, cherkos and debrezeit) and a head office operating in
both urban and rural areas. Two stage sample design procedures were employed for the survey.
The first stage is the selection of sample branches of the SFPI. The four branches have almost
similar characteristics. Therefore, each branch has equal chance to be selected. From four
branches three branches (merkato, cherkos and debrezeit) were randomly selected. The second
stage is selection of sample respondents from the selected branches.
The study is focused on selecting samples from each area equally. To manage the research
within the given time and limited budget, a total of 150 samples were selected using random
sampling. Among these samples, 75 were selected from urban clients and 75 were selected from
rural clients. From the total sample size, 100 samples were used as experimental group and 50
were used as control group. Experimental groups were composed of active clients (clients in the
pipeline) and ex-clients (dropouts), while control groups were composed of clients in the training
or incoming clients (clients ready to get service from SFPI in the near future but not in the pipe
line at present). From 150 samples, 75 were male and the remaining 75 were female. The sample
sizes are shown in table 3. 1.
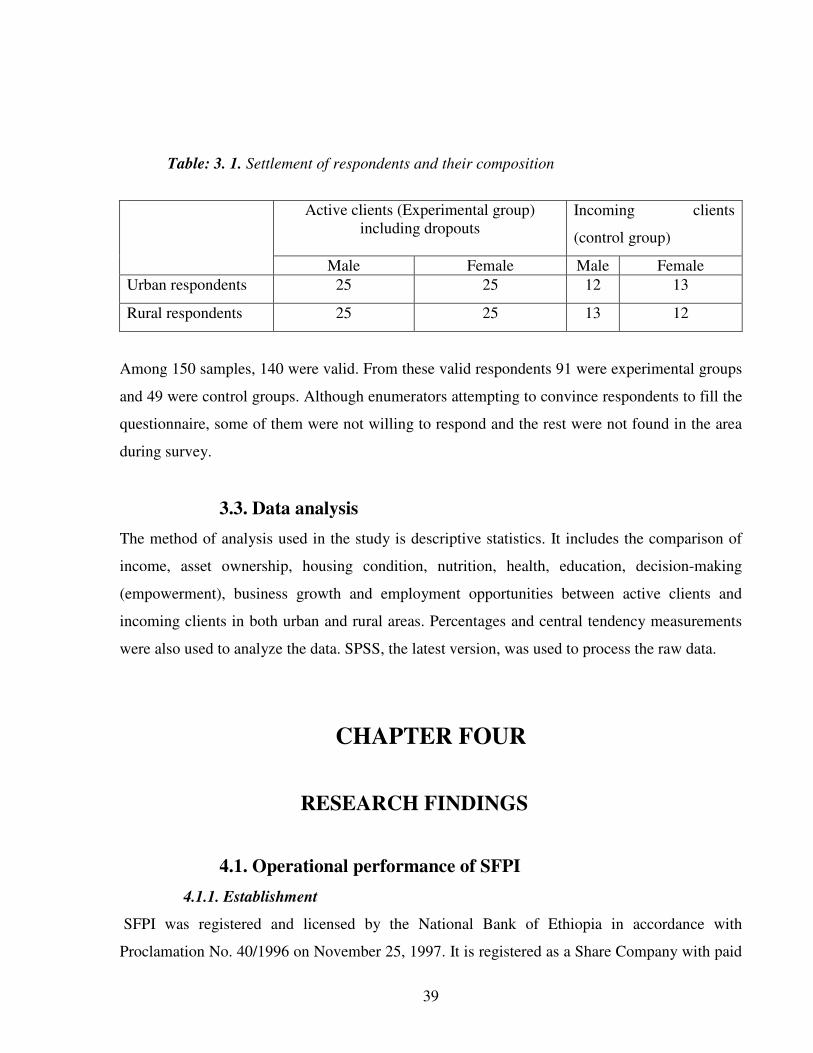
39
Table: 3. 1. Settlement of respondents and their composition
Active clients (Experimental group)
including dropouts
Incoming clients
(control group)
Male Female Male Female
Urban respondents 25 25 12 13
Rural respondents 25 25 13 12
Among 150 samples, 140 were valid. From these valid respondents 91 were experimental groups
and 49 were control groups. Although enumerators attempting to convince respondents to fill the
questionnaire, some of them were not willing to respond and the rest were not found in the area
during survey.
3.3. Data analysis
The method of analysis used in the study is descriptive statistics. It includes the comparison of
income, asset ownership, housing condition, nutrition, health, education, decision-making
(empowerment), business growth and employment opportunities between active clients and
incoming clients in both urban and rural areas. Percentages and central tendency measurements
were also used to analyze the data. SPSS, the latest version, was used to process the raw data.
CHAPTER FOUR
RESEARCH FINDINGS
4.1. Operational performance of SFPI
4.1.1. Establishment
SFPI was registered and licensed by the National Bank of Ethiopia in accordance with
Proclamation No. 40/1996 on November 25, 1997. It is registered as a Share Company with paid
40
up capital of Birr 400,000. It has started its operations in mid 1998. It has the mandate to operate
at federal level both in the urban and rural areas. The main objective of SFPI is to enhance the
socio-economic empowerment of the active poor people by providing financial and non-financial
services such as, credit, saving, training, advocacy, and technical services (SFPI, 2004).
4.1.2. Governance
Governance of an MFI is a system that links the shareholder to the board, the management, the
staff, clients and community (CGAP, 1997). Sound governance is fundamental in creating
efficient and sustainable microfinance institutions in Ethiopia (Wolday, 2003). The main
framework of governance of SFPI is derived from Proclamation No. 40/1996 and the directives
of NBE. The owners of SFPI include NGOs, private sector, financial sector, and government,
which are interested in delivering financial services to the poor. The governance structure is
composed of shareholders, board of directors, management, staff at all levels, and the clients.
The shareholders are Ethiopian National Association for Blinds, Projynist Ethiopia, Agri-service
Ethiopia, Addis Ababa Women Entrepreneurs' Association, Commercial Bank of Ethiopia,
Dashen Bank, and Hailu Wondafrash (SFPI, 2004).
The shareholders’ meeting (General Assembly) is the highest governing body in the institution.
Although many of MFIs in Ethiopia are established as private share companies, dividends are not
distributed to shareholders. Instead of distributed to shareholders the dividend is used for the
benefit of the target group (poor). Thus, the shareholders of SFPI are nominal shareholders.
The Board of Directors is elected by the General Assembly. They are accountable to the General
Assembly. The board is responsible for providing policy and strategic direction to the institution.
The Board appoints the General Manager that manages the institution on a day-to-day basis.
Different units and departments are structured under general manager; such as the monitoring
and evaluation unit, internal audit unit, legal unit, operations department, and administration and
finance department.
The operational department has four branches which are basic operational units in the structure;
such as branch managers, credit officers, accountant, cashier, guards and janitor. Three branches
are located in urban area and one branch is located in rural area. However, all branches have
rural and urban program outlet.
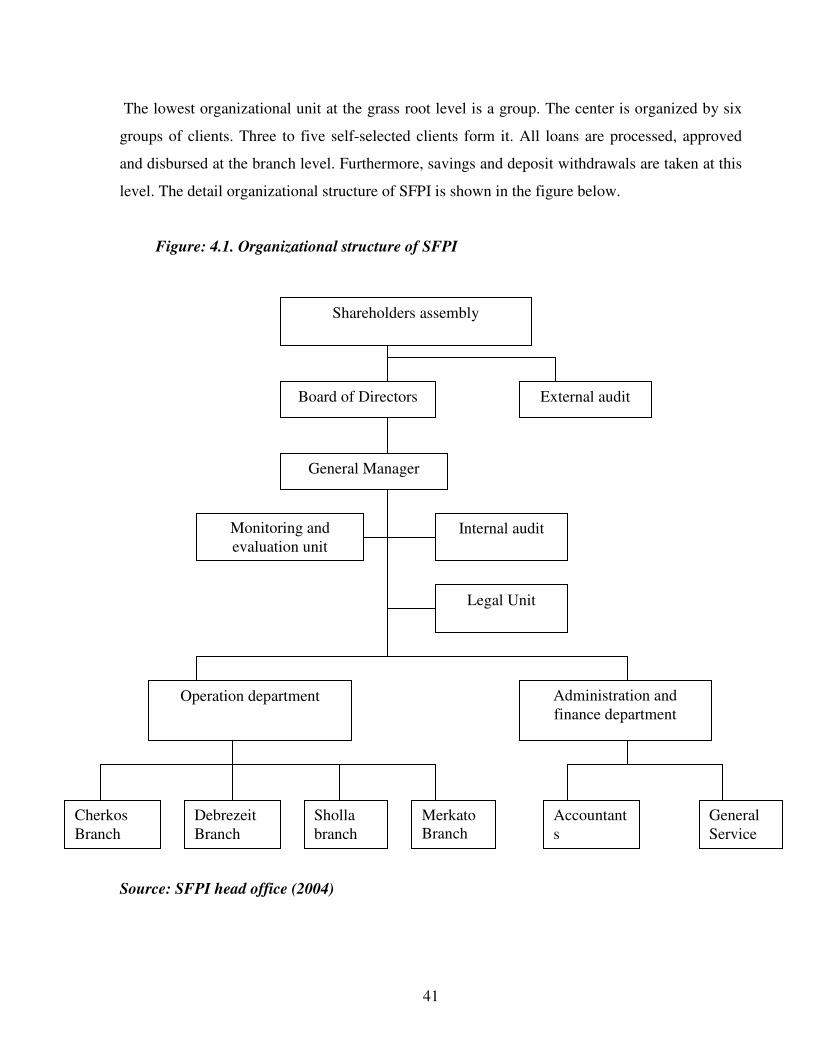
41
The lowest organizational unit at the grass root level is a group. The center is organized by six
groups of clients. Three to five self-selected clients form it. All loans are processed, approved
and disbursed at the branch level. Furthermore, savings and deposit withdrawals are taken at this
level. The detail organizational structure of SFPI is shown in the figure below.
Figure: 4.1. Organizational structure of SFPI
Source: SFPI head office (2004)
Shareholders assembly
Board of Directors External audit
General Manager
Monitoring and
evaluation unit
Internal audit
Legal Unit
Operation department Administration and
finance department
Cherkos
Branch
Debrezeit
Branch
Sholla
branch
Merkato
Branch
General
Service
Accountant
s
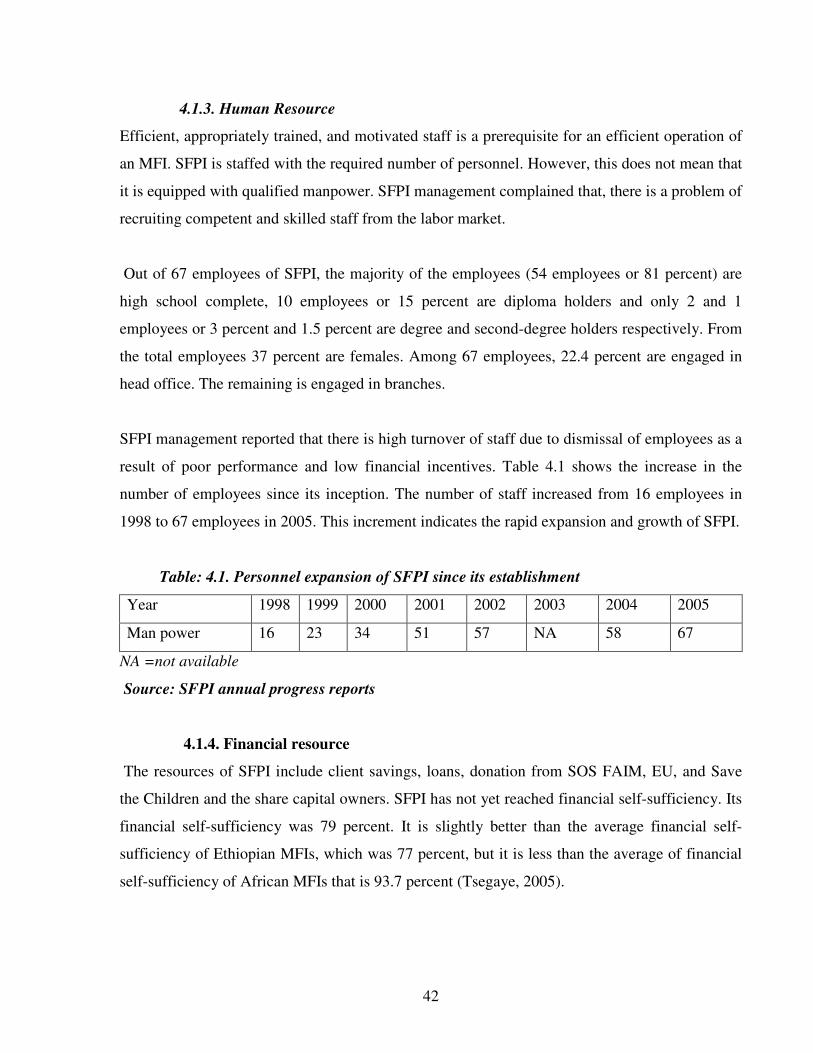
42
4.1.3. Human Resource
Efficient, appropriately trained, and motivated staff is a prerequisite for an efficient operation of
an MFI. SFPI is staffed with the required number of personnel. However, this does not mean that
it is equipped with qualified manpower. SFPI management complained that, there is a problem of
recruiting competent and skilled staff from the labor market.
Out of 67 employees of SFPI, the majority of the employees (54 employees or 81 percent) are
high school complete, 10 employees or 15 percent are diploma holders and only 2 and 1
employees or 3 percent and 1.5 percent are degree and second-degree holders respectively. From
the total employees 37 percent are females. Among 67 employees, 22.4 percent are engaged in
head office. The remaining is engaged in branches.
SFPI management reported that there is high turnover of staff due to dismissal of employees as a
result of poor performance and low financial incentives. Table 4.1 shows the increase in the
number of employees since its inception. The number of staff increased from 16 employees in
1998 to 67 employees in 2005. This increment indicates the rapid expansion and growth of SFPI.
Table: 4.1. Personnel expansion of SFPI since its establishment
Year 1998 1999 2000 2001 2002 2003 2004 2005
Man power 16 23 34 51 57 NA 58 67
NA =not available
Source: SFPI annual progress reports
4.1.4. Financial resource
The resources of SFPI include client savings, loans, donation from SOS FAIM, EU, and Save
the Children and the share capital owners. SFPI has not yet reached financial self-sufficiency. Its
financial self-sufficiency was 79 percent. It is slightly better than the average financial self-
sufficiency of Ethiopian MFIs, which was 77 percent, but it is less than the average of financial
self-sufficiency of African MFIs that is 93.7 percent (Tsegaye, 2005).
43
4.1.5. Service Delivery
4.1.5.1 Financial services
SFPI provides financial as well as non-financial services to the poor. The financial services
delivered by SFPI are lending and saving services. The target clients eligible for its services are
the active poor who are willing to engage in income generating activities of their own in rural
and urban areas of the country.
SFPI provides its services using mostly the group-based methodology. However, cooperative and
individual based lending methodologies are lately introduced in the system. Loan disbursements
are made at sub-braches or branches level. However, cash collections and savings mobilization
activities are carried out at the center levels.
The core unit of SFPI operation is the group. Each group contains three to five members and they
elect their own leader. This center has been serving as a core body of clients to make a
manageable and direct link with the institution. The center leader is the main contact person to
the credit officers. The groups are self-selected. They are expected to know each other, have
similar background, enjoy trust and develop confidence. Group members are jointly responsible
for the loan. They will take the risk if one of a group member fails to repay the loan. The group
lending methodology is basically the Grameen Bank approach with a minor adjustment to fit into
the local environment.
The cooperative based loan requires physical asset or capital as collateral. Similarly the
individual loan requires property or salary of permanent employees as collateral. Before taking
the loan, all clients are required to undertake a training or orientation for eight to ten hours
focusing on the lending methodologies, purpose of the loan, and responsibilities of members and
group leaders. The types of loan provide by SFPI are:
1. Term loans; which are mostly given to clients who are engaged in agriculture;
2. The installment loans; which are provided to clients who are engaged in micro and small-
scale enterprises service.
3. Consumption or individual loans; which are lately introduced loans for low salaried
employees.
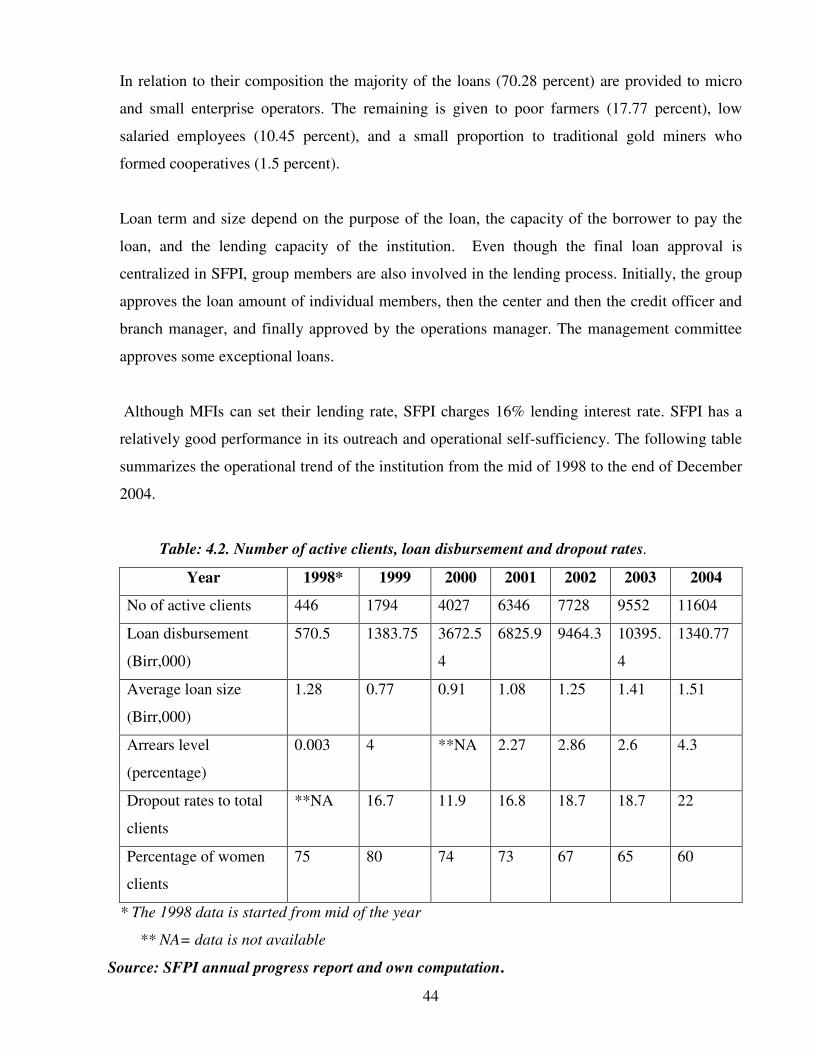
44
In relation to their composition the majority of the loans (70.28 percent) are provided to micro
and small enterprise operators. The remaining is given to poor farmers (17.77 percent), low
salaried employees (10.45 percent), and a small proportion to traditional gold miners who
formed cooperatives (1.5 percent).
Loan term and size depend on the purpose of the loan, the capacity of the borrower to pay the
loan, and the lending capacity of the institution. Even though the final loan approval is
centralized in SFPI, group members are also involved in the lending process. Initially, the group
approves the loan amount of individual members, then the center and then the credit officer and
branch manager, and finally approved by the operations manager. The management committee
approves some exceptional loans.
Although MFIs can set their lending rate, SFPI charges 16% lending interest rate. SFPI has a
relatively good performance in its outreach and operational self-sufficiency. The following table
summarizes the operational trend of the institution from the mid of 1998 to the end of December
2004.
Table: 4.2. Number of active clients, loan disbursement and dropout rates.
Year 1998* 1999 2000 2001 2002 2003 2004
No of active clients 446 1794 4027 6346 7728 9552 11604
Loan disbursement
(Birr,000)
570.5 1383.75 3672.5
4
6825.9 9464.3 10395.
4
1340.77
Average loan size
(Birr,000)
1.28 0.77 0.91 1.08 1.25 1.41 1.51
Arrears level
(percentage)
0.003 4 **NA 2.27 2.86 2.6 4.3
Dropout rates to total
clients
**NA 16.7 11.9 16.8 18.7 18.7 22
Percentage of women
clients
75 80 74 73 67 65 60
* The 1998 data is started from mid of the year
** NA= data is not available
Source: SFPI annual progress report and own computation.
45
Table 4.2 indicates that the number of active clients of SFPI grew from 446 in mid 1998 to
11,604 in December 2004. The proportion of female clients’ participation declined steadily from
year to year. Except the year 1999 (80 percent), the percentage of women participation declined
from 75 percent in 1998 to 60 percent in 2004. The percentage of women borrowers has declined
by 20 percent from the year 1999 to the year 2004. Women membership levels decline as go
further away from urban (market centers). As SFPI’s range of operation expanded further and
further into the rural areas, the proportion of women’s participation declined due to cultural
domination. Men considered as the only responsible persons in the household in their culture.
Therefore, most of the husbands didn’t allow women to participate SFPI’s program. Due to this
most participants of SFPI in rural area are men. The main objective of the institution was to
empower women in socio-economic status by providing financial services. However, the trend of
women participation is declining. Although it is relatively better, compared to the average
women participation in Ethiopian MFIs and African MFIs 50 percent and 65 percent respectively
in the year 2003, this is a real challenge, which needs to be addressed by SFPI. Awareness
creation is one of the means to reduce cultural domination and to bring women access to
financial services.
The loan disbursement increased from Birr 570,519 in the mid of 1998 to Birr 13,407,720 at the
end of 2004. The average loan size ranges from Birr 771 to birr 1,509. The trend of all variables
in table 4.2 shows that SFPI expands its outreach significantly. The institution has an
encouraging repayment rate (95.4 percent) in the year 2004. On the other hand, the arrears are
rising. Its portfolio at risk (30 days) was 6 percent in 2004. However, the institution is still within
the acceptable range of 0 percent to 10 percent (Gibbons, and Meehan, 2000) both in arrears and
portfolio at risk rate.
The dropout rate is high through out the period. The dropout rate from the total number of
clients raised from 11.9 percent in 2000 to 22 percent in 2004. The dropout rate is exceeded by 5
percent from the institution’s expectation (17%) in their 2004 annual plan. However, the dropout
rate increases at a decreasing rate. Some of the reasons for dropouts are fear of risk originated
from joint liability of the group, some dissatisfaction with institutions’ service delivery and the
need to withdraw all savings. The institution’s regulation does not allow clients to withdraw
compulsory savings unless they terminate the program.
46
Saving and saving mobilization is an integral part and the major objectives of SFPI, which is also
crucial for sustainability of SFPI's credit services and to meet the clients’ high demand. It is
critical for development of MSE and socio-economic progress and also a viable source of fund
for expansion of outreach (Itana et al. 2003).
SFPI has mainly two types of savings products. It offers voluntary saving facilities depending on
their willingness to save. SFPI trains clients to save voluntarily. To encourage voluntary saving,
SFPI categorized the voluntary saving in three levels: clients can save at individual level, at
group level (group of individuals), and at the center level. The second type of saving, in which
SFPI is offering, is compulsory saving. It is performed in the form of loan tax and regular saving.
Clients are forced to save before they take loans. Loan tax of 10 percent deducted from the total
amount of loan received and transferred to clients’ deposit account as part of the loan collateral.
Compulsory saving may have an advantage of developing saving culture among borrowers and
used as collateral for group loan.
SFPI’s manager reported that savings are used as one of the instruments for arrears settlement
.The mechanisms (steps) taken by the institution to settle the arrears are firstly, advising the
client to pay the arrears by the credit officer; if not, the savings are used to settle the arrears. If
this is not successful, the group members are asked to pay the leftover from their savings. If they
fail, the group members will not get the next loan unless they settled the arrears of the group. If
the above efforts are not successful, the last step will be taking the client to the court. The
manager suggested the application of the foreclosure law to be equally implemented for the
defaulters of MFIs.
Microfinance institutions are expected to make constant and increasing flow of resources to
finance the MSE operators and other clients’ access to full financial services. SFPI to become
financially self-sufficient, strong and sustainable saving mobilization is important. Table 4.3
shows the trend of saving mobilization from mid of 1998 to 2004.
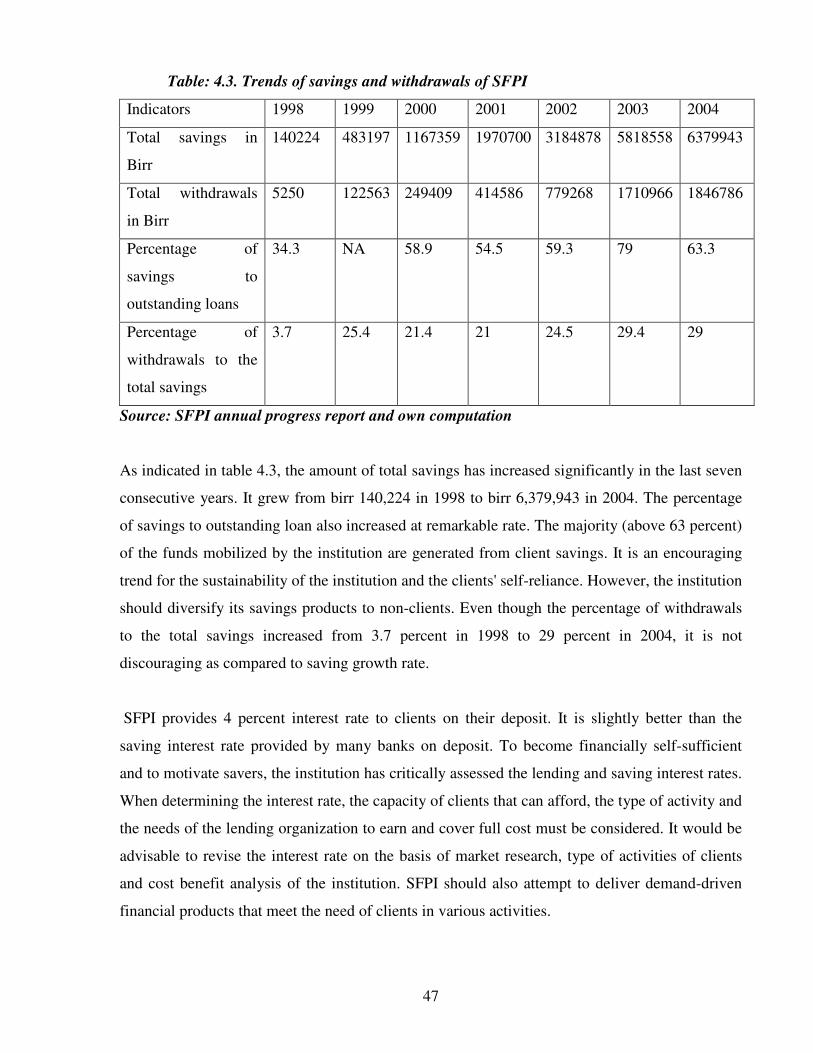
47
Table: 4.3. Trends of savings and withdrawals of SFPI
Indicators 1998 1999 2000 2001 2002 2003 2004
Total savings in
Birr
140224 483197 1167359 1970700 3184878 5818558 6379943
Total withdrawals
in Birr
5250 122563 249409 414586 779268 1710966 1846786
Percentage of
savings to
outstanding loans
34.3 NA 58.9 54.5 59.3 79 63.3
Percentage of
withdrawals to the
total savings
3.7 25.4 21.4 21 24.5 29.4 29
Source: SFPI annual progress report and own computation
As indicated in table 4.3, the amount of total savings has increased significantly in the last seven
consecutive years. It grew from birr 140,224 in 1998 to birr 6,379,943 in 2004. The percentage
of savings to outstanding loan also increased at remarkable rate. The majority (above 63 percent)
of the funds mobilized by the institution are generated from client savings. It is an encouraging
trend for the sustainability of the institution and the clients' self-reliance. However, the institution
should diversify its savings products to non-clients. Even though the percentage of withdrawals
to the total savings increased from 3.7 percent in 1998 to 29 percent in 2004, it is not
discouraging as compared to saving growth rate.
SFPI provides 4 percent interest rate to clients on their deposit. It is slightly better than the
saving interest rate provided by many banks on deposit. To become financially self-sufficient
and to motivate savers, the institution has critically assessed the lending and saving interest rates.
When determining the interest rate, the capacity of clients that can afford, the type of activity and
the needs of the lending organization to earn and cover full cost must be considered. It would be
advisable to revise the interest rate on the basis of market research, type of activities of clients
and cost benefit analysis of the institution. SFPI should also attempt to deliver demand-driven
financial products that meet the need of clients in various activities.
48
In general, SFPI has achieved extensive outreach. It is delivering financial services to the urban
and rural poor, which is encouraging trend. The repayment rate is high. Moreover, the number of
savers and the amount of saving mobilized has increased significantly. In spite of the above
success, SFPI reported that the institution faces several challenges. These include unfair
competition with some MFIs, shortage of loan fund, low capacity of staff, and lack of logistical
facilities especially vehicles which hinder the growth of the institution to achieve its objectives.
4.1.5.2. Non-Financial services
Apart from financial services, SFPI also provides non-financial services to its clients and non-
clients. The major non-financial services provided by SFPI are training, advocacy, orientation of
new clients, and experience sharing among clients.
Orientation is regularly provided for new clients of SFPI for about eight to ten hours before they
join the program about the service provided, criteria to be a client, methodologies, amount
provided, term of loan, and some other relevant information. Business development training
about marketing, record keeping, and pricing is delivered for every client on voluntary basis for
ten days. On -job training is delivered for the staff to build their capacity.
Advocacy and training is also delivered to staffs of other organizations. It is an encouraging step
to diversify its services and increase income-generating capacity of SFPI. Experience sharing is
carried out among clients. Model centers or branches are selected for visit and the program is
organized to clients to share their experience among themselves. This experience sharing service
is not limited to clients only. It goes beyond this. Staff members also have an opportunity to
share other microfinance institutions’ experience by attending workshops and visits. AEMFI also
provides experience-sharing forums by preparing workshops, panels, and publicizing bulletin,
occasional papers and other materials, and organizing experience sharing visits to MFIs.
4.2. Clients characteristics, loan and saving history, and loan usage
4.2.1. Demographic characteristics of respondents
The distribution of respondents in table 4.4 reveals that from the total 140 valid respondents 84
(60%) are active clients, 7 (5%) are ex-clients or dropouts, and 49 (35%) are incoming clients.
From the total samples more than 90% provided useful information. 42.2% of the sample (active
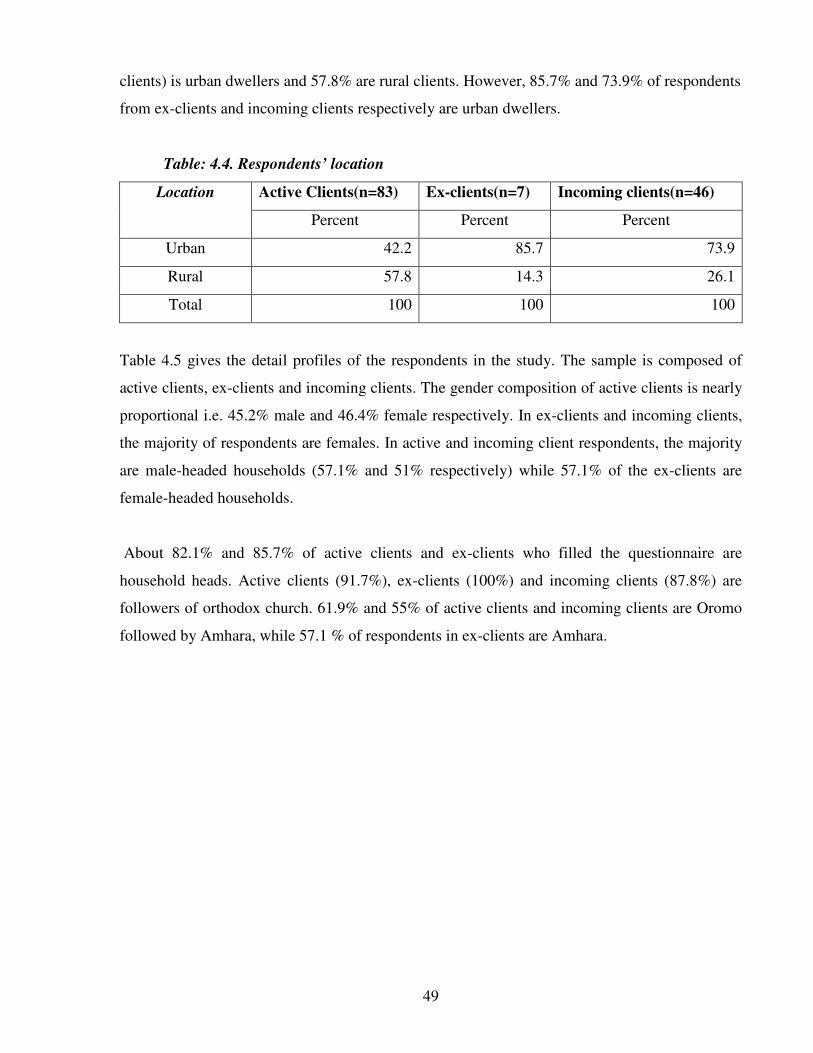
49
clients) is urban dwellers and 57.8% are rural clients. However, 85.7% and 73.9% of respondents
from ex-clients and incoming clients respectively are urban dwellers.
Table: 4.4. Respondents’ location
Active Clients(n=83) Ex-clients(n=7) Incoming clients(n=46) Location
Percent Percent Percent
Urban 42.2 85.7 73.9
Rural 57.8 14.3 26.1
Total 100 100 100
Table 4.5 gives the detail profiles of the respondents in the study. The sample is composed of
active clients, ex-clients and incoming clients. The gender composition of active clients is nearly
proportional i.e. 45.2% male and 46.4% female respectively. In ex-clients and incoming clients,
the majority of respondents are females. In active and incoming client respondents, the majority
are male-headed households (57.1% and 51% respectively) while 57.1% of the ex-clients are
female-headed households.
About 82.1% and 85.7% of active clients and ex-clients who filled the questionnaire are
household heads. Active clients (91.7%), ex-clients (100%) and incoming clients (87.8%) are
followers of orthodox church. 61.9% and 55% of active clients and incoming clients are Oromo
followed by Amhara, while 57.1 % of respondents in ex-clients are Amhara.
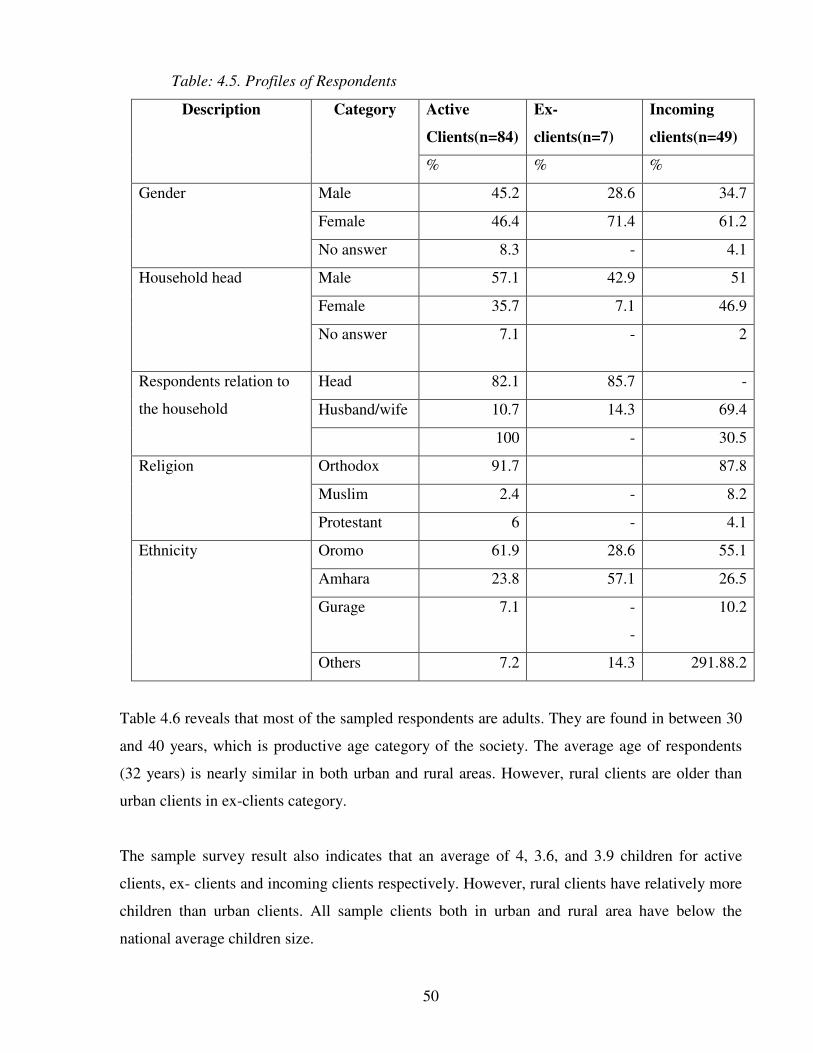
50
Table: 4.5. Profiles of Respondents
Active
Clients(n=84)
Ex-
clients(n=7)
Incoming
clients(n=49)
Description Category
% % %
Male 45.2 28.6 34.7
Female 46.4 71.4 61.2
Gender
No answer 8.3 - 4.1
Male 57.1 42.9 51
Female 35.7 7.1 46.9
Household head
No answer 7.1 - 2
Head 82.1 85.7 -
Husband/wife 10.7 14.3 69.4
Respondents relation to
the household
100 - 30.5
Orthodox 91.7 87.8
Muslim 2.4 - 8.2
Religion
Protestant 6 - 4.1
Oromo 61.9 28.6 55.1
Amhara 23.8 57.1 26.5
Gurage 7.1 -
-
10.2
Ethnicity
Others 7.2 14.3 291.88.2
Table 4.6 reveals that most of the sampled respondents are adults. They are found in between 30
and 40 years, which is productive age category of the society. The average age of respondents
(32 years) is nearly similar in both urban and rural areas. However, rural clients are older than
urban clients in ex-clients category.
The sample survey result also indicates that an average of 4, 3.6, and 3.9 children for active
clients, ex- clients and incoming clients respectively. However, rural clients have relatively more
children than urban clients. All sample clients both in urban and rural area have below the
national average children size.
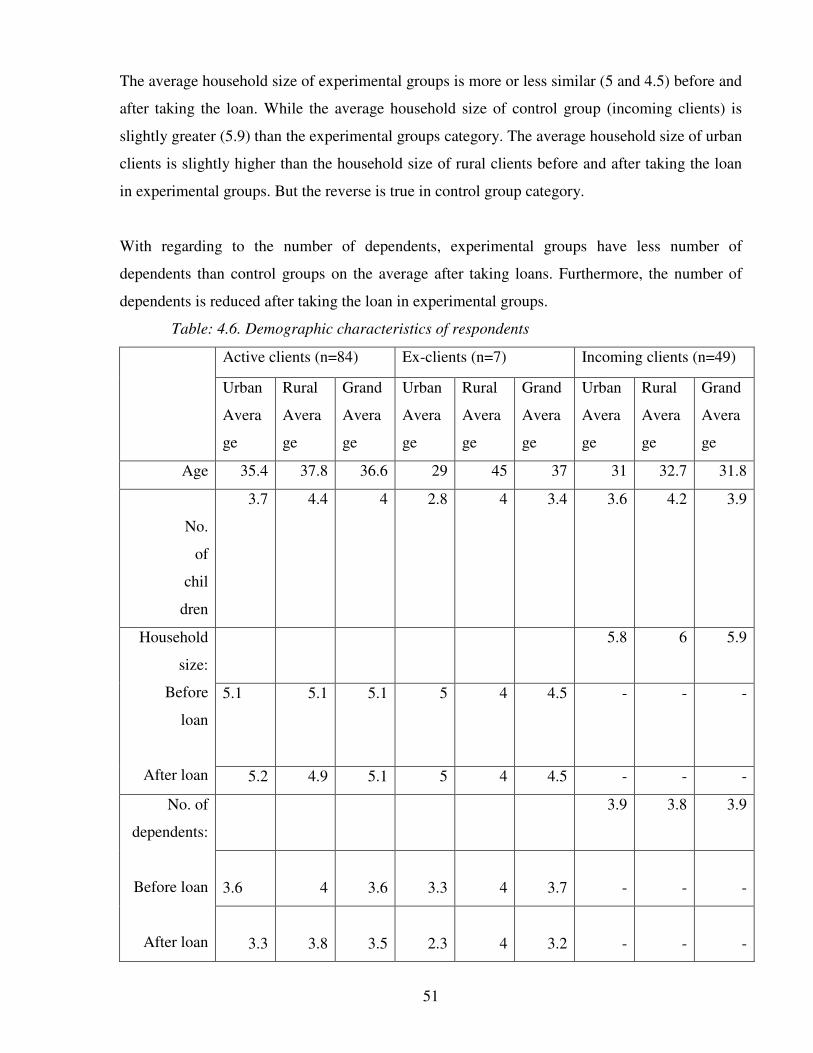
51
The average household size of experimental groups is more or less similar (5 and 4.5) before and
after taking the loan. While the average household size of control group (incoming clients) is
slightly greater (5.9) than the experimental groups category. The average household size of urban
clients is slightly higher than the household size of rural clients before and after taking the loan
in experimental groups. But the reverse is true in control group category.
With regarding to the number of dependents, experimental groups have less number of
dependents than control groups on the average after taking loans. Furthermore, the number of
dependents is reduced after taking the loan in experimental groups.
Table: 4.6. Demographic characteristics of respondents
Active clients (n=84) Ex-clients (n=7) Incoming clients (n=49)
Urban
Avera
ge
Rural
Avera
ge
Grand
Avera
ge
Urban
Avera
ge
Rural
Avera
ge
Grand
Avera
ge
Urban
Avera
ge
Rural
Avera
ge
Grand
Avera
ge
Age 35.4 37.8 36.6 29 45 37 31 32.7 31.8
No.
of
chil
dren
3.7 4.4 4 2.8 4 3.4 3.6 4.2 3.9
5.8 6 5.9
5.1
5.1 5.1 5 4 4.5 - - -
Household
size:
Before
loan
After loan 5.2 4.9 5.1 5 4 4.5 - - -
3.9 3.8 3.9
3.6
4
3.6
3.3
4
3.7
-
-
-
No. of
dependents:
Before loan
After loan
3.3
3.8
3.5
2.3
4
3.2
-
-
-
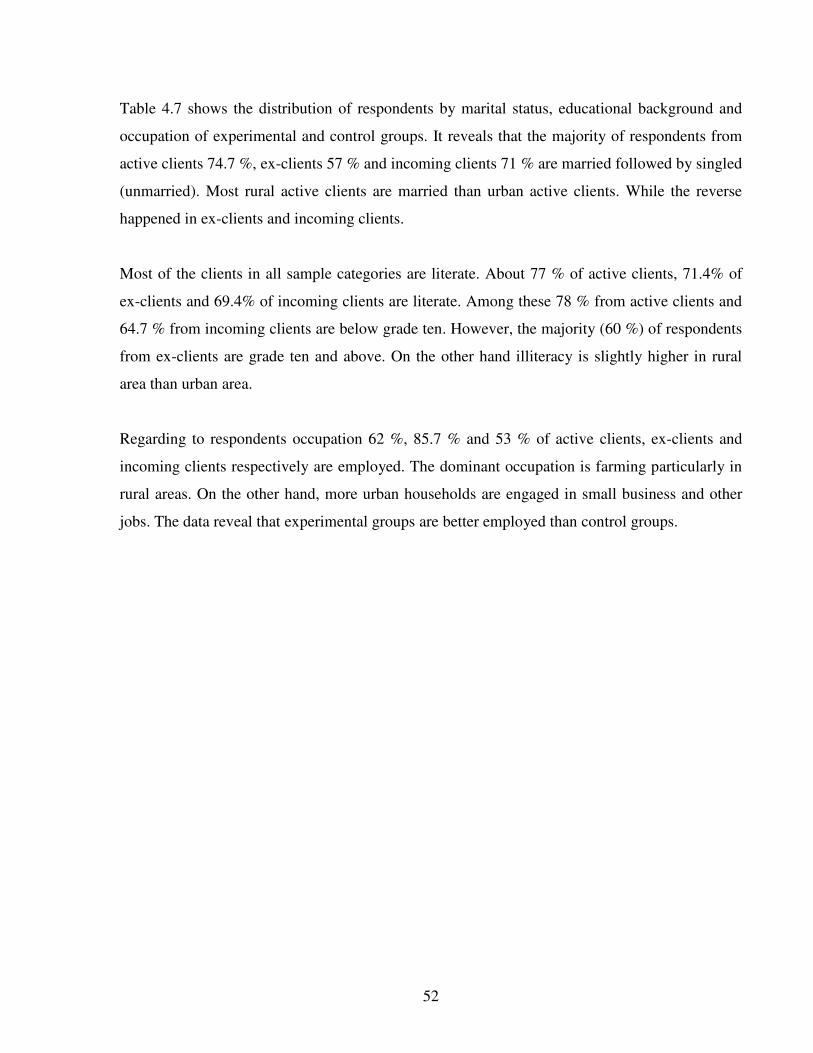
52
Table 4.7 shows the distribution of respondents by marital status, educational background and
occupation of experimental and control groups. It reveals that the majority of respondents from
active clients 74.7 %, ex-clients 57 % and incoming clients 71 % are married followed by singled
(unmarried). Most rural active clients are married than urban active clients. While the reverse
happened in ex-clients and incoming clients.
Most of the clients in all sample categories are literate. About 77 % of active clients, 71.4% of
ex-clients and 69.4% of incoming clients are literate. Among these 78 % from active clients and
64.7 % from incoming clients are below grade ten. However, the majority (60 %) of respondents
from ex-clients are grade ten and above. On the other hand illiteracy is slightly higher in rural
area than urban area.
Regarding to respondents occupation 62 %, 85.7 % and 53 % of active clients, ex-clients and
incoming clients respectively are employed. The dominant occupation is farming particularly in
rural areas. On the other hand, more urban households are engaged in small business and other
jobs. The data reveal that experimental groups are better employed than control groups.
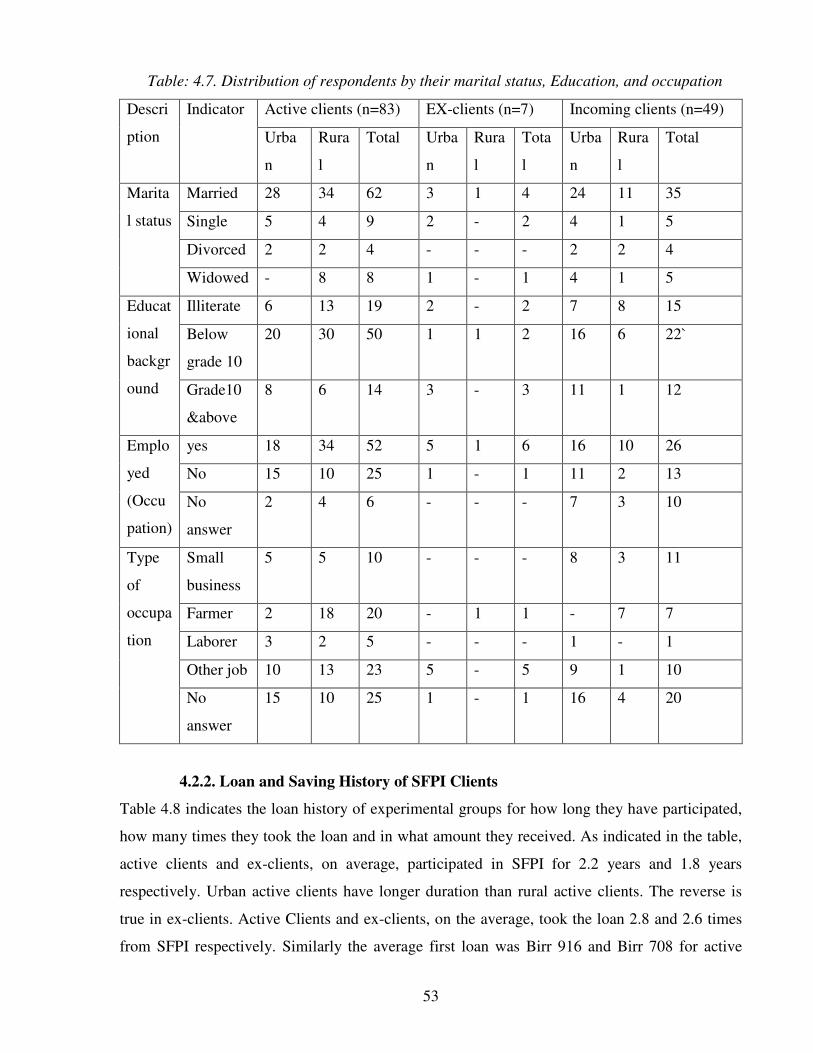
53
Table: 4.7. Distribution of respondents by their marital status, Education, and occupation
Active clients (n=83) EX-clients (n=7) Incoming clients (n=49) Descri
ption
Indicator
Urba
n
Rura
l
Total Urba
n
Rura
l
Tota
l
Urba
n
Rura
l
Total
Married 28 34 62 3 1 4 24 11 35
Single 5 4 9 2 - 2 4 1 5
Divorced 2 2 4 - - - 2 2 4
Marita
l status
Widowed - 8 8 1 - 1 4 1 5
Illiterate 6 13 19 2 - 2 7 8 15
Below
grade 10
20 30 50 1 1 2 16 6 22`
Educat
ional
backgr
ound Grade10
&above
8 6 14 3 - 3 11 1 12
yes 18 34 52 5 1 6 16 10 26
No 15 10 25 1 - 1 11 2 13
Emplo
yed
(Occu
pation)
No
answer
2 4 6 - - - 7 3 10
Small
business
5 5 10 - - - 8 3 11
Farmer 2 18 20 - 1 1 - 7 7
Laborer 3 2 5 - - - 1 - 1
Other job 10 13 23 5 - 5 9 1 10
Type
of
occupa
tion
No
answer
15 10 25 1 - 1 16 4 20
4.2.2. Loan and Saving History of SFPI Clients
Table 4.8 indicates the loan history of experimental groups for how long they have participated,
how many times they took the loan and in what amount they received. As indicated in the table,
active clients and ex-clients, on average, participated in SFPI for 2.2 years and 1.8 years
respectively. Urban active clients have longer duration than rural active clients. The reverse is
true in ex-clients. Active Clients and ex-clients, on the average, took the loan 2.8 and 2.6 times
from SFPI respectively. Similarly the average first loan was Birr 916 and Birr 708 for active
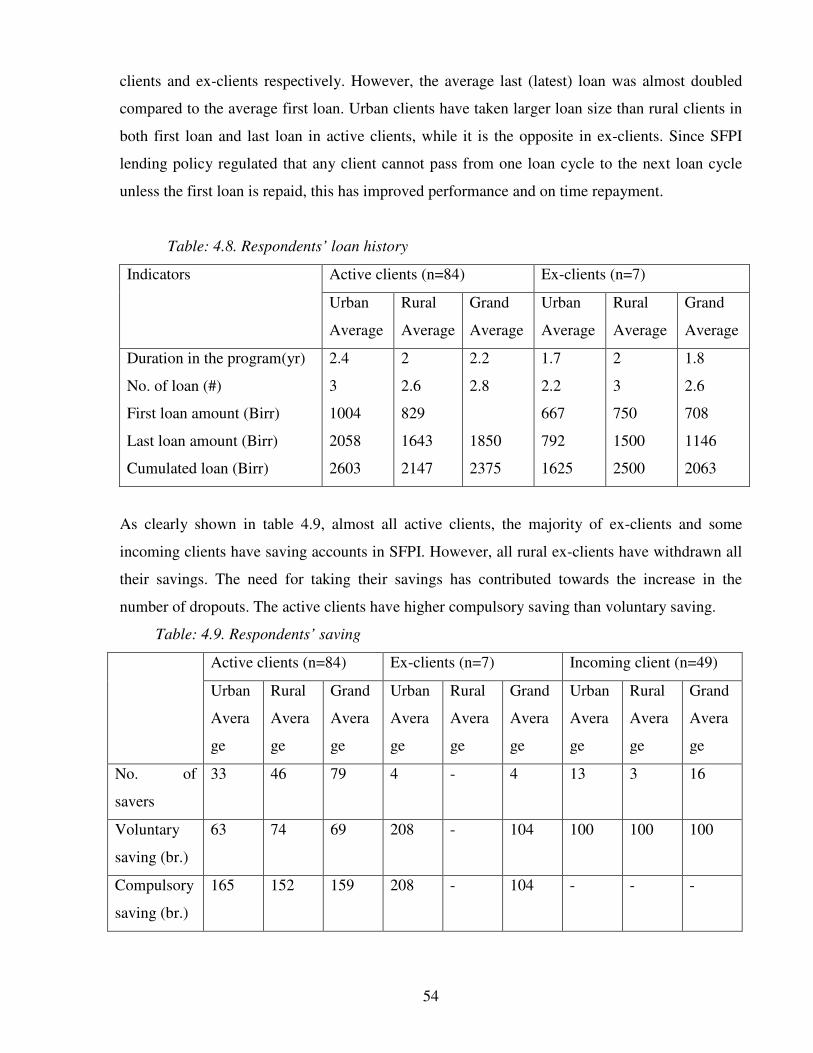
54
clients and ex-clients respectively. However, the average last (latest) loan was almost doubled
compared to the average first loan. Urban clients have taken larger loan size than rural clients in
both first loan and last loan in active clients, while it is the opposite in ex-clients. Since SFPI
lending policy regulated that any client cannot pass from one loan cycle to the next loan cycle
unless the first loan is repaid, this has improved performance and on time repayment.
Table: 4.8. Respondents’ loan history
Active clients (n=84) Ex-clients (n=7) Indicators
Urban
Average
Rural
Average
Grand
Average
Urban
Average
Rural
Average
Grand
Average
Duration in the program(yr)
No. of loan (#)
First loan amount (Birr)
Last loan amount (Birr)
Cumulated loan (Birr)
2.4
3
1004
2058
2603
2
2.6
829
1643
2147
2.2
2.8
1850
2375
1.7
2.2
667
792
1625
2
3
750
1500
2500
1.8
2.6
708
1146
2063
As clearly shown in table 4.9, almost all active clients, the majority of ex-clients and some
incoming clients have saving accounts in SFPI. However, all rural ex-clients have withdrawn all
their savings. The need for taking their savings has contributed towards the increase in the
number of dropouts. The active clients have higher compulsory saving than voluntary saving.
Table: 4.9. Respondents’ saving
Active clients (n=84) Ex-clients (n=7) Incoming client (n=49)
Urban
Avera
ge
Rural
Avera
ge
Grand
Avera
ge
Urban
Avera
ge
Rural
Avera
ge
Grand
Avera
ge
Urban
Avera
ge
Rural
Avera
ge
Grand
Avera
ge
No. of
savers
33 46 79 4 - 4 13 3 16
Voluntary
saving (br.)
63 74 69 208 - 104 100 100 100
Compulsory
saving (br.)
165 152 159 208 - 104 - - -
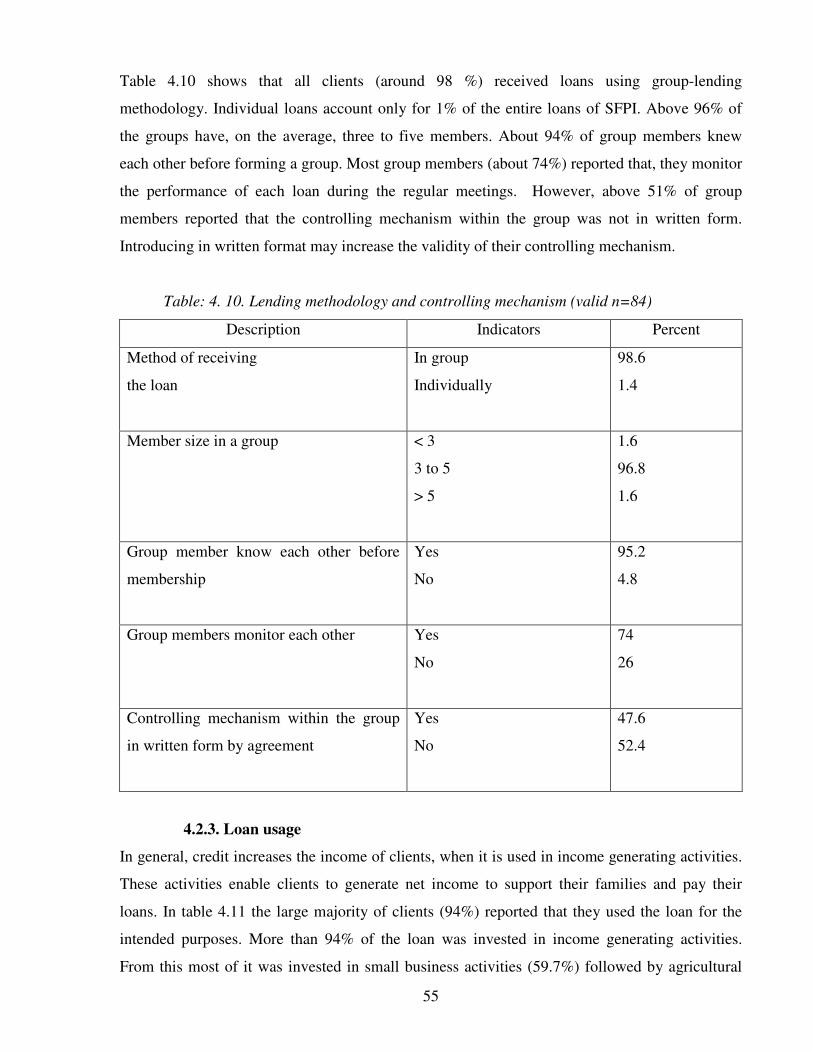
55
Table 4.10 shows that all clients (around 98 %) received loans using group-lending
methodology. Individual loans account only for 1% of the entire loans of SFPI. Above 96% of
the groups have, on the average, three to five members. About 94% of group members knew
each other before forming a group. Most group members (about 74%) reported that, they monitor
the performance of each loan during the regular meetings. However, above 51% of group
members reported that the controlling mechanism within the group was not in written form.
Introducing in written format may increase the validity of their controlling mechanism.
Table: 4. 10. Lending methodology and controlling mechanism (valid n=84)
Description Indicators Percent
Method of receiving
the loan
In group
Individually
98.6
1.4
Member size in a group < 3
3 to 5
> 5
1.6
96.8
1.6
Group member know each other before
membership
Yes
No
95.2
4.8
Group members monitor each other
Yes
No
74
26
Controlling mechanism within the group
in written form by agreement
Yes
No
47.6
52.4
4.2.3. Loan usage
In general, credit increases the income of clients, when it is used in income generating activities.
These activities enable clients to generate net income to support their families and pay their
loans. In table 4.11 the large majority of clients (94%) reported that they used the loan for the
intended purposes. More than 94% of the loan was invested in income generating activities.
From this most of it was invested in small business activities (59.7%) followed by agricultural
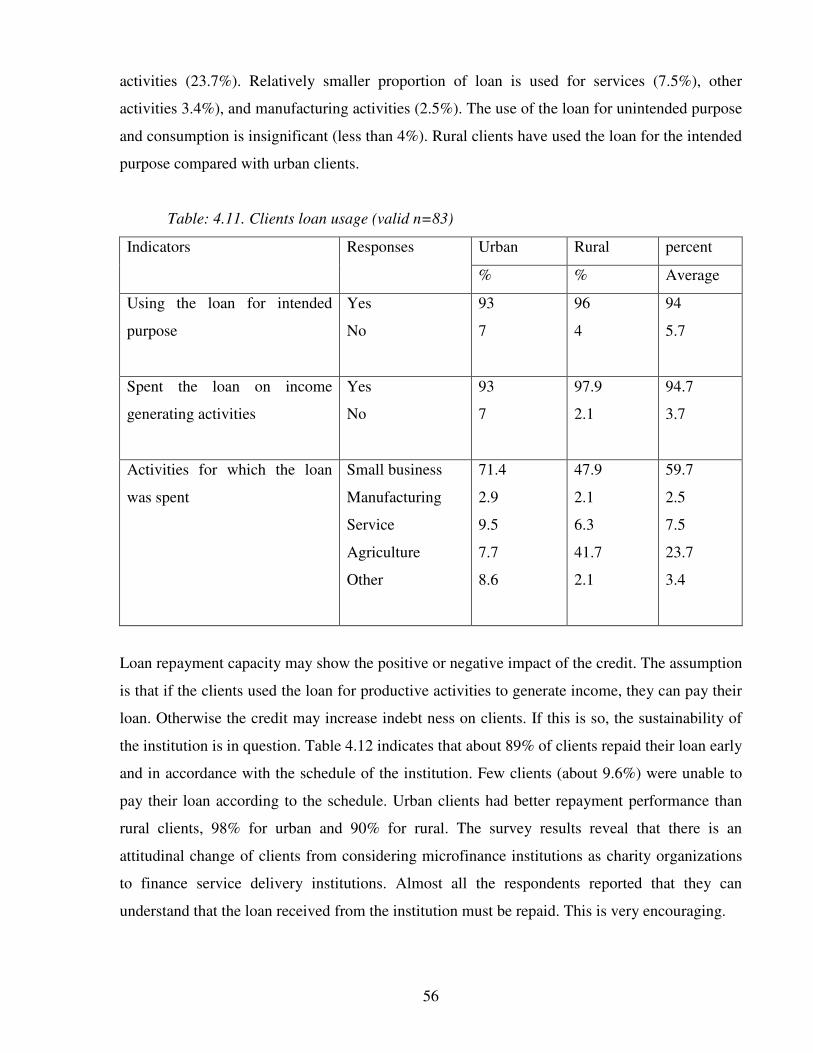
56
activities (23.7%). Relatively smaller proportion of loan is used for services (7.5%), other
activities 3.4%), and manufacturing activities (2.5%). The use of the loan for unintended purpose
and consumption is insignificant (less than 4%). Rural clients have used the loan for the intended
purpose compared with urban clients.
Table: 4.11. Clients loan usage (valid n=83)
Urban Rural percent Indicators Responses
% % Average
Using the loan for intended
purpose
Yes
No
93
7
96
4
94
5.7
Spent the loan on income
generating activities
Yes
No
93
7
97.9
2.1
94.7
3.7
Activities for which the loan
was spent
Small business
Manufacturing
Service
Agriculture
Other
71.4
2.9
9.5
7.7
8.6
47.9
2.1
6.3
41.7
2.1
59.7
2.5
7.5
23.7
3.4
Loan repayment capacity may show the positive or negative impact of the credit. The assumption
is that if the clients used the loan for productive activities to generate income, they can pay their
loan. Otherwise the credit may increase indebt ness on clients. If this is so, the sustainability of
the institution is in question. Table 4.12 indicates that about 89% of clients repaid their loan early
and in accordance with the schedule of the institution. Few clients (about 9.6%) were unable to
pay their loan according to the schedule. Urban clients had better repayment performance than
rural clients, 98% for urban and 90% for rural. The survey results reveal that there is an
attitudinal change of clients from considering microfinance institutions as charity organizations
to finance service delivery institutions. Almost all the respondents reported that they can
understand that the loan received from the institution must be repaid. This is very encouraging.
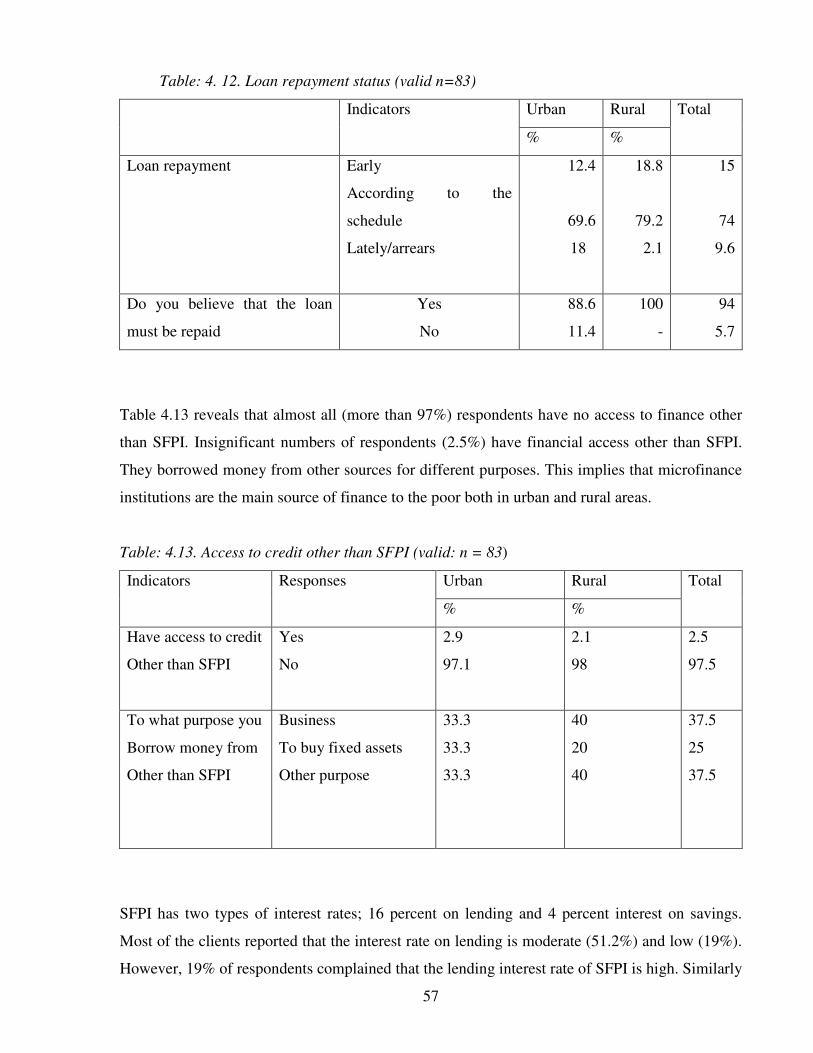
57
Table: 4. 12. Loan repayment status (valid n=83)
Urban Rural Indicators
% %
Total
Loan repayment Early
According to the
schedule
Lately/arrears
12.4
69.6
18
18.8
79.2
2.1
15
74
9.6
Do you believe that the loan
must be repaid
Yes
No
88.6
11.4
100
-
94
5.7
Table 4.13 reveals that almost all (more than 97%) respondents have no access to finance other
than SFPI. Insignificant numbers of respondents (2.5%) have financial access other than SFPI.
They borrowed money from other sources for different purposes. This implies that microfinance
institutions are the main source of finance to the poor both in urban and rural areas.
Table: 4.13. Access to credit other than SFPI (valid: n = 83)
Urban Rural Indicators Responses
% %
Total
Have access to credit
Other than SFPI
Yes
No
2.9
97.1
2.1
98
2.5
97.5
To what purpose you
Borrow money from
Other than SFPI
Business
To buy fixed assets
Other purpose
33.3
33.3
33.3
40
20
40
37.5
25
37.5
SFPI has two types of interest rates; 16 percent on lending and 4 percent interest on savings.
Most of the clients reported that the interest rate on lending is moderate (51.2%) and low (19%).
However, 19% of respondents complained that the lending interest rate of SFPI is high. Similarly
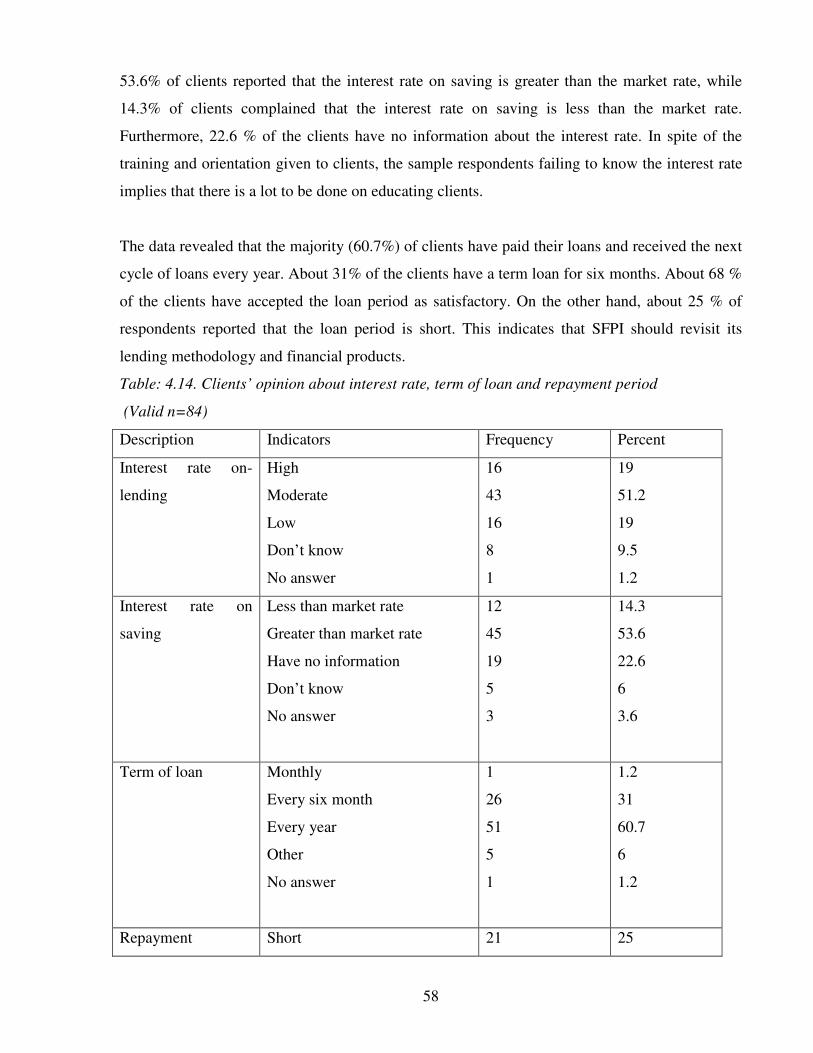
58
53.6% of clients reported that the interest rate on saving is greater than the market rate, while
14.3% of clients complained that the interest rate on saving is less than the market rate.
Furthermore, 22.6 % of the clients have no information about the interest rate. In spite of the
training and orientation given to clients, the sample respondents failing to know the interest rate
implies that there is a lot to be done on educating clients.
The data revealed that the majority (60.7%) of clients have paid their loans and received the next
cycle of loans every year. About 31% of the clients have a term loan for six months. About 68 %
of the clients have accepted the loan period as satisfactory. On the other hand, about 25 % of
respondents reported that the loan period is short. This indicates that SFPI should revisit its
lending methodology and financial products.
Table: 4.14. Clients’ opinion about interest rate, term of loan and repayment period
(Valid n=84)
Description Indicators Frequency Percent
Interest rate on-
lending
High
Moderate
Low
Don’t know
No answer
16
43
16
8
1
19
51.2
19
9.5
1.2
Interest rate on
saving
Less than market rate
Greater than market rate
Have no information
Don’t know
No answer
12
45
19
5
3
14.3
53.6
22.6
6
3.6
Term of loan Monthly
Every six month
Every year
Other
No answer
1
26
51
5
1
1.2
31
60.7
6
1.2
Repayment Short 21 25
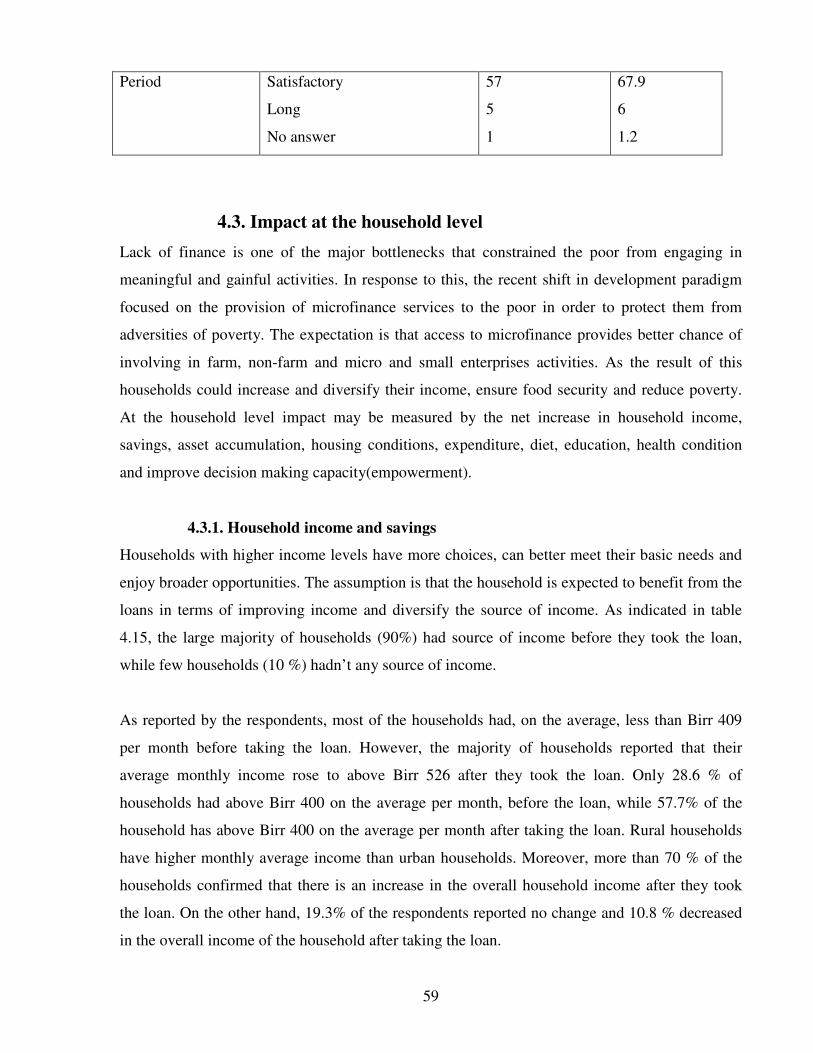
59
Period Satisfactory
Long
No answer
57
5
1
67.9
6
1.2
4.3. Impact at the household level
Lack of finance is one of the major bottlenecks that constrained the poor from engaging in
meaningful and gainful activities. In response to this, the recent shift in development paradigm
focused on the provision of microfinance services to the poor in order to protect them from
adversities of poverty. The expectation is that access to microfinance provides better chance of
involving in farm, non-farm and micro and small enterprises activities. As the result of this
households could increase and diversify their income, ensure food security and reduce poverty.
At the household level impact may be measured by the net increase in household income,
savings, asset accumulation, housing conditions, expenditure, diet, education, health condition
and improve decision making capacity(empowerment).
4.3.1. Household income and savings
Households with higher income levels have more choices, can better meet their basic needs and
enjoy broader opportunities. The assumption is that the household is expected to benefit from the
loans in terms of improving income and diversify the source of income. As indicated in table
4.15, the large majority of households (90%) had source of income before they took the loan,
while few households (10 %) hadn’t any source of income.
As reported by the respondents, most of the households had, on the average, less than Birr 409
per month before taking the loan. However, the majority of households reported that their
average monthly income rose to above Birr 526 after they took the loan. Only 28.6 % of
households had above Birr 400 on the average per month, before the loan, while 57.7% of the
household has above Birr 400 on the average per month after taking the loan. Rural households
have higher monthly average income than urban households. Moreover, more than 70 % of the
households confirmed that there is an increase in the overall household income after they took
the loan. On the other hand, 19.3% of the respondents reported no change and 10.8 % decreased
in the overall income of the household after taking the loan.
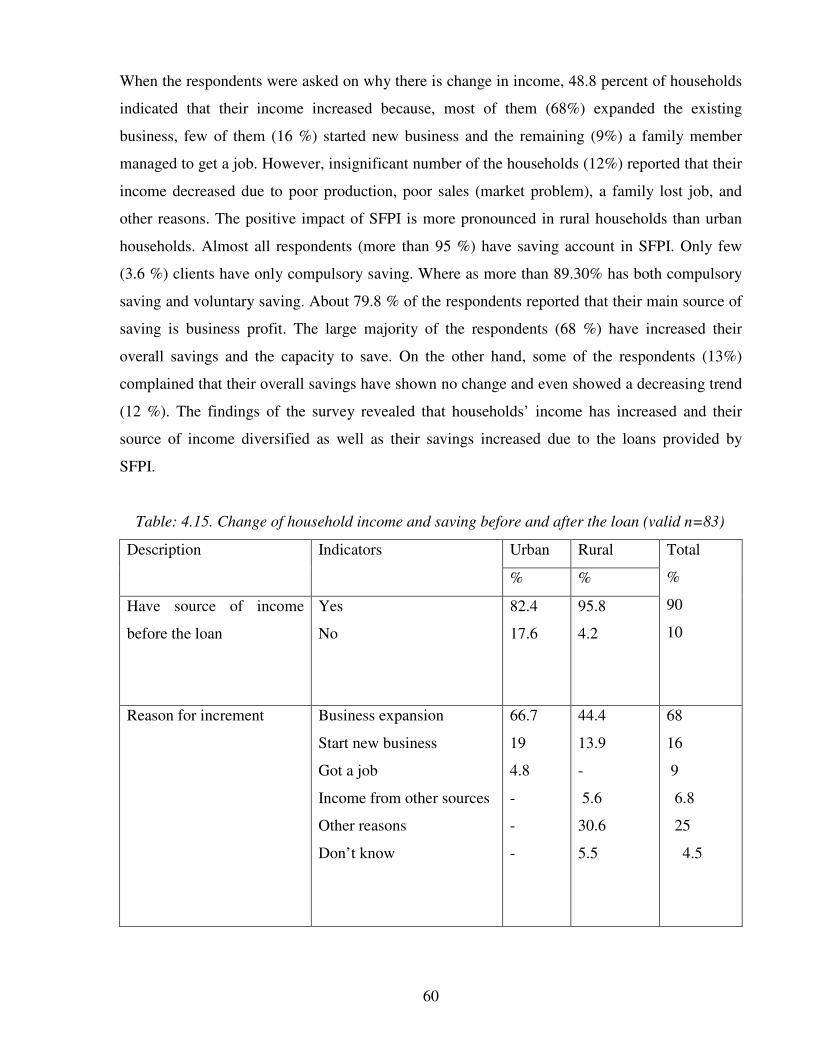
60
When the respondents were asked on why there is change in income, 48.8 percent of households
indicated that their income increased because, most of them (68%) expanded the existing
business, few of them (16 %) started new business and the remaining (9%) a family member
managed to get a job. However, insignificant number of the households (12%) reported that their
income decreased due to poor production, poor sales (market problem), a family lost job, and
other reasons. The positive impact of SFPI is more pronounced in rural households than urban
households. Almost all respondents (more than 95 %) have saving account in SFPI. Only few
(3.6 %) clients have only compulsory saving. Where as more than 89.30% has both compulsory
saving and voluntary saving. About 79.8 % of the respondents reported that their main source of
saving is business profit. The large majority of the respondents (68 %) have increased their
overall savings and the capacity to save. On the other hand, some of the respondents (13%)
complained that their overall savings have shown no change and even showed a decreasing trend
(12 %). The findings of the survey revealed that households’ income has increased and their
source of income diversified as well as their savings increased due to the loans provided by
SFPI.
Table: 4.15. Change of household income and saving before and after the loan (valid n=83)
Urban Rural Description Indicators
% %
Have source of income
before the loan
Yes
No
82.4
17.6
95.8
4.2
Total
%
90
10
Reason for increment Business expansion
Start new business
Got a job
Income from other sources
Other reasons
Don’t know
66.7
19
4.8
-
-
-
44.4
13.9
-
5.6
30.6
5.5
68
16
9
6.8
25
4.5
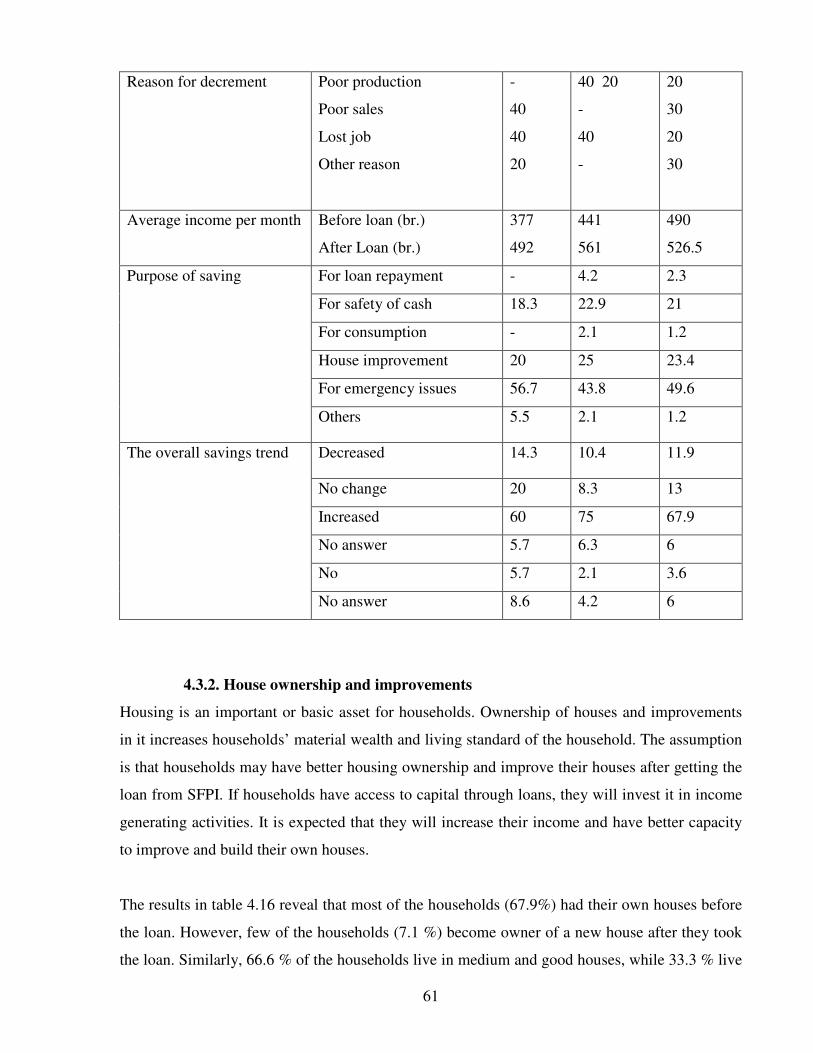
61
Reason for decrement Poor production
Poor sales
Lost job
Other reason
-
40
40
20
40 20
-
40
-
20
30
20
30
Average income per month Before loan (br.)
After Loan (br.)
377
492
441
561
490
526.5
For loan repayment - 4.2 2.3
For safety of cash 18.3 22.9 21
For consumption - 2.1 1.2
House improvement 20 25 23.4
For emergency issues 56.7 43.8 49.6
Purpose of saving
Others 5.5 2.1 1.2
Decreased 14.3 10.4 11.9
No change 20 8.3 13
Increased 60 75 67.9
No answer 5.7 6.3 6
No 5.7 2.1 3.6
The overall savings trend
No answer 8.6 4.2 6
4.3.2. House ownership and improvements
Housing is an important or basic asset for households. Ownership of houses and improvements
in it increases households’ material wealth and living standard of the household. The assumption
is that households may have better housing ownership and improve their houses after getting the
loan from SFPI. If households have access to capital through loans, they will invest it in income
generating activities. It is expected that they will increase their income and have better capacity
to improve and build their own houses.
The results in table 4.16 reveal that most of the households (67.9%) had their own houses before
the loan. However, few of the households (7.1 %) become owner of a new house after they took
the loan. Similarly, 66.6 % of the households live in medium and good houses, while 33.3 % live
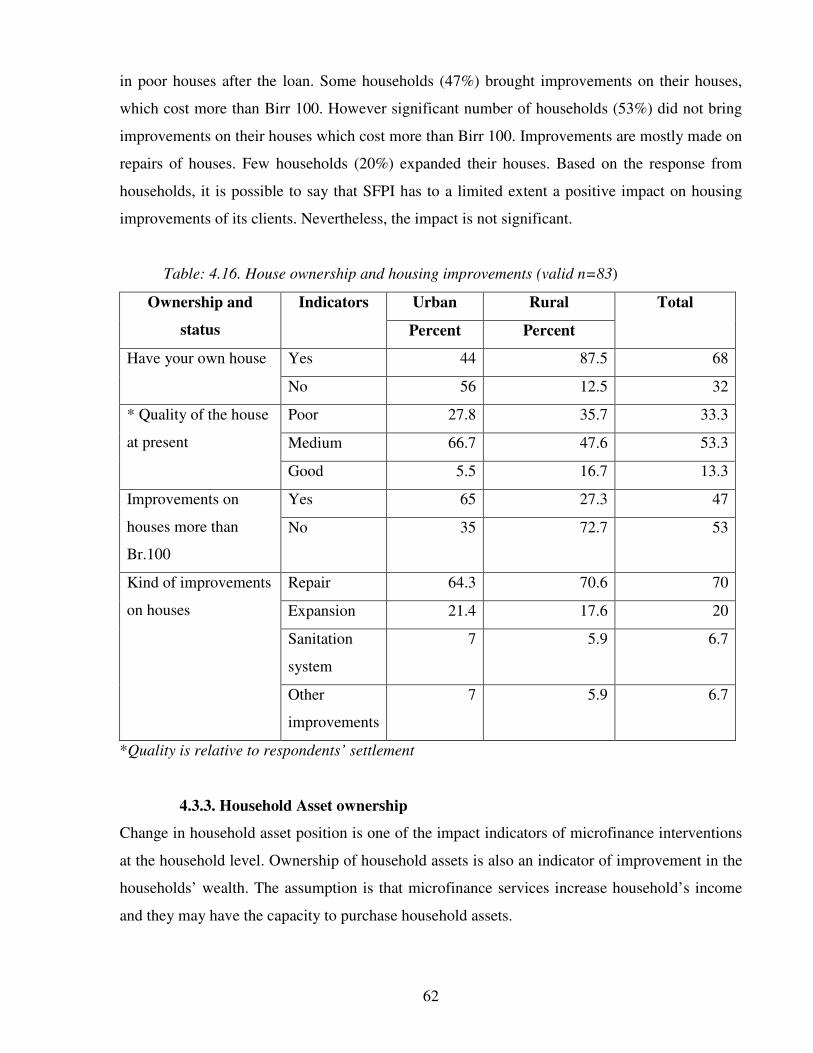
62
in poor houses after the loan. Some households (47%) brought improvements on their houses,
which cost more than Birr 100. However significant number of households (53%) did not bring
improvements on their houses which cost more than Birr 100. Improvements are mostly made on
repairs of houses. Few households (20%) expanded their houses. Based on the response from
households, it is possible to say that SFPI has to a limited extent a positive impact on housing
improvements of its clients. Nevertheless, the impact is not significant.
Table: 4.16. House ownership and housing improvements (valid n=83)
Urban Rural Ownership and
status
Indicators
Percent Percent
Total
Yes 44 87.5 68 Have your own house
No 56 12.5 32
Poor 27.8 35.7 33.3
Medium 66.7 47.6 53.3
* Quality of the house
at present
Good 5.5 16.7 13.3
Yes 65 27.3 47 Improvements on
houses more than
Br.100
No 35 72.7 53
Repair 64.3 70.6 70
Expansion 21.4 17.6 20
Sanitation
system
7 5.9 6.7
Kind of improvements
on houses
Other
improvements
7 5.9 6.7
*Quality is relative to respondents’ settlement
4.3.3. Household Asset ownership
Change in household asset position is one of the impact indicators of microfinance interventions
at the household level. Ownership of household assets is also an indicator of improvement in the
households’ wealth. The assumption is that microfinance services increase household’s income
and they may have the capacity to purchase household assets.
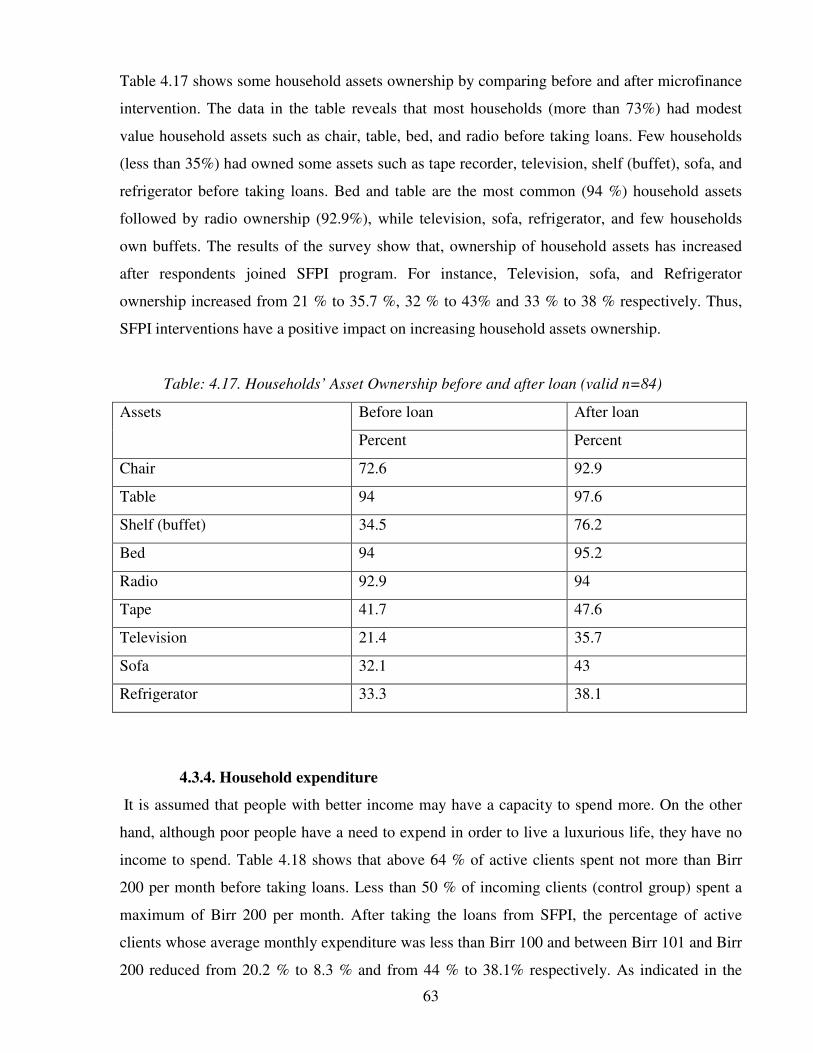
63
Table 4.17 shows some household assets ownership by comparing before and after microfinance
intervention. The data in the table reveals that most households (more than 73%) had modest
value household assets such as chair, table, bed, and radio before taking loans. Few households
(less than 35%) had owned some assets such as tape recorder, television, shelf (buffet), sofa, and
refrigerator before taking loans. Bed and table are the most common (94 %) household assets
followed by radio ownership (92.9%), while television, sofa, refrigerator, and few households
own buffets. The results of the survey show that, ownership of household assets has increased
after respondents joined SFPI program. For instance, Television, sofa, and Refrigerator
ownership increased from 21 % to 35.7 %, 32 % to 43% and 33 % to 38 % respectively. Thus,
SFPI interventions have a positive impact on increasing household assets ownership.
Table: 4.17. Households’ Asset Ownership before and after loan (valid n=84)
Before loan After loan Assets
Percent Percent
Chair 72.6 92.9
Table 94 97.6
Shelf (buffet) 34.5 76.2
Bed 94 95.2
Radio 92.9 94
Tape 41.7 47.6
Television 21.4 35.7
Sofa 32.1 43
Refrigerator 33.3 38.1
4.3.4. Household expenditure
It is assumed that people with better income may have a capacity to spend more. On the other
hand, although poor people have a need to expend in order to live a luxurious life, they have no
income to spend. Table 4.18 shows that above 64 % of active clients spent not more than Birr
200 per month before taking loans. Less than 50 % of incoming clients (control group) spent a
maximum of Birr 200 per month. After taking the loans from SFPI, the percentage of active
clients whose average monthly expenditure was less than Birr 100 and between Birr 101 and Birr
200 reduced from 20.2 % to 8.3 % and from 44 % to 38.1% respectively. As indicated in the
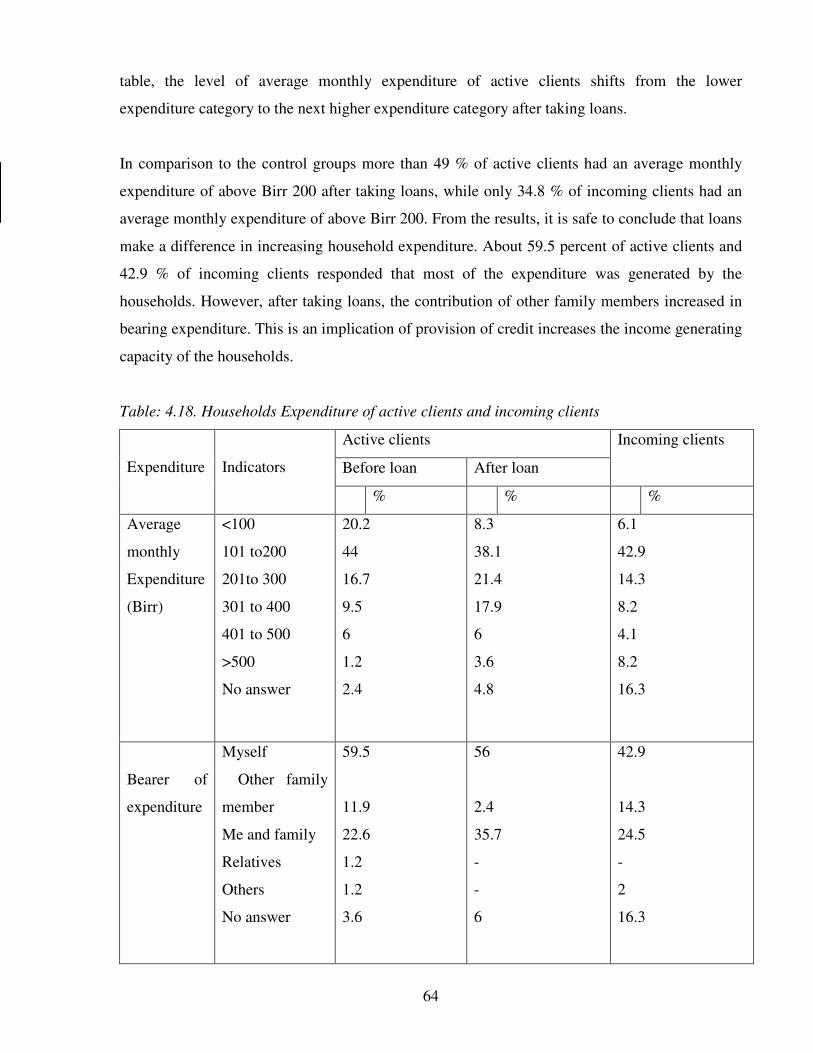
64
table, the level of average monthly expenditure of active clients shifts from the lower
expenditure category to the next higher expenditure category after taking loans.
In comparison to the control groups more than 49 % of active clients had an average monthly
expenditure of above Birr 200 after taking loans, while only 34.8 % of incoming clients had an
average monthly expenditure of above Birr 200. From the results, it is safe to conclude that loans
make a difference in increasing household expenditure. About 59.5 percent of active clients and
42.9 % of incoming clients responded that most of the expenditure was generated by the
households. However, after taking loans, the contribution of other family members increased in
bearing expenditure. This is an implication of provision of credit increases the income generating
capacity of the households.
Table: 4.18. Households Expenditure of active clients and incoming clients
Active clients
Before loan After loan
Incoming clients
Expenditure
Indicators
% % %
Average
monthly
Expenditure
(Birr)
<100
101 to200
201to 300
301 to 400
401 to 500
>500
No answer
20.2
44
16.7
9.5
6
1.2
2.4
8.3
38.1
21.4
17.9
6
3.6
4.8
6.1
42.9
14.3
8.2
4.1
8.2
16.3
Bearer of
expenditure
Myself
Other family
member
Me and family
Relatives
Others
No answer
59.5
11.9
22.6
1.2
1.2
3.6
56
2.4
35.7
-
-
6
42.9
14.3
24.5
-
2
16.3
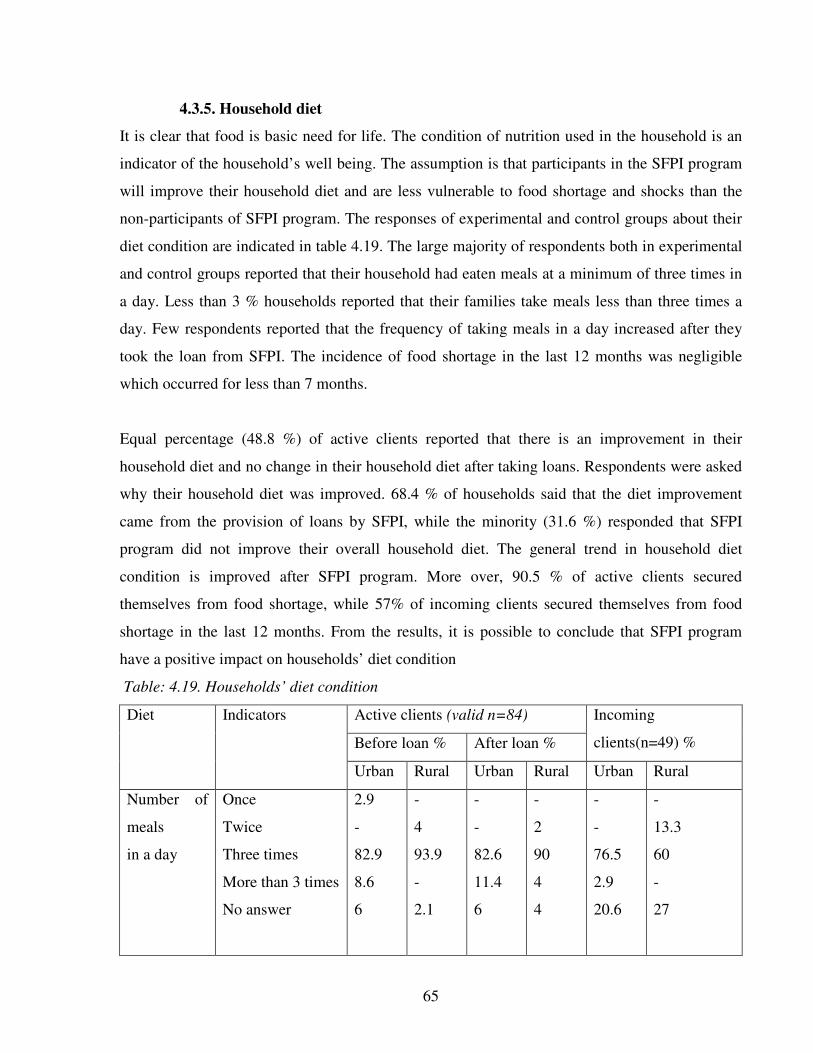
65
4.3.5. Household diet
It is clear that food is basic need for life. The condition of nutrition used in the household is an
indicator of the household’s well being. The assumption is that participants in the SFPI program
will improve their household diet and are less vulnerable to food shortage and shocks than the
non-participants of SFPI program. The responses of experimental and control groups about their
diet condition are indicated in table 4.19. The large majority of respondents both in experimental
and control groups reported that their household had eaten meals at a minimum of three times in
a day. Less than 3 % households reported that their families take meals less than three times a
day. Few respondents reported that the frequency of taking meals in a day increased after they
took the loan from SFPI. The incidence of food shortage in the last 12 months was negligible
which occurred for less than 7 months.
Equal percentage (48.8 %) of active clients reported that there is an improvement in their
household diet and no change in their household diet after taking loans. Respondents were asked
why their household diet was improved. 68.4 % of households said that the diet improvement
came from the provision of loans by SFPI, while the minority (31.6 %) responded that SFPI
program did not improve their overall household diet. The general trend in household diet
condition is improved after SFPI program. More over, 90.5 % of active clients secured
themselves from food shortage, while 57% of incoming clients secured themselves from food
shortage in the last 12 months. From the results, it is possible to conclude that SFPI program
have a positive impact on households’ diet condition
Table: 4.19. Households’ diet condition
Active clients (valid n=84)
Before loan % After loan %
Incoming
clients(n=49) %
Diet Indicators
Urban Rural Urban Rural Urban Rural
Number of
meals
in a day
Once
Twice
Three times
More than 3 times
No answer
2.9
-
82.9
8.6
6
-
4
93.9
-
2.1
-
-
82.6
11.4
6
-
2
90
4
4
-
-
76.5
2.9
20.6
-
13.3
60
-
27
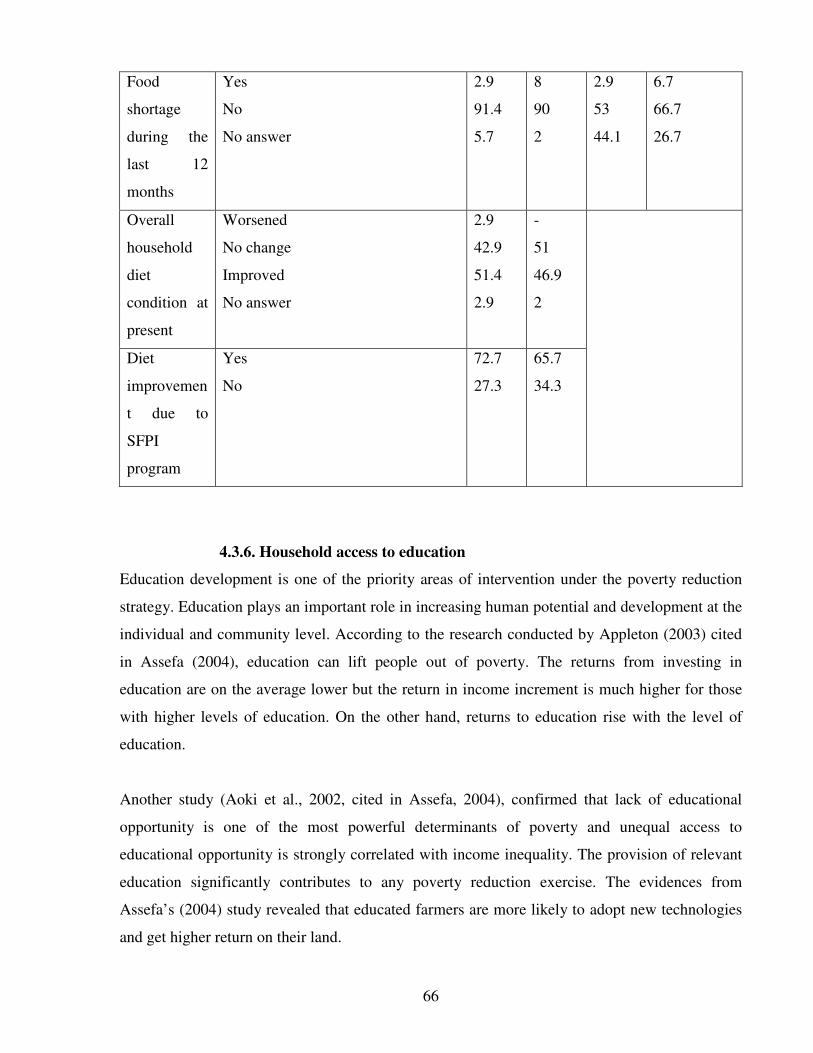
66
Food
shortage
during the
last 12
months
Yes
No
No answer
2.9
91.4
5.7
8
90
2
2.9
53
44.1
6.7
66.7
26.7
Overall
household
diet
condition at
present
Worsened
No change
Improved
No answer
2.9
42.9
51.4
2.9
-
51
46.9
2
Diet
improvemen
t due to
SFPI
program
Yes
No
72.7
27.3
65.7
34.3
4.3.6. Household access to education
Education development is one of the priority areas of intervention under the poverty reduction
strategy. Education plays an important role in increasing human potential and development at the
individual and community level. According to the research conducted by Appleton (2003) cited
in Assefa (2004), education can lift people out of poverty. The returns from investing in
education are on the average lower but the return in income increment is much higher for those
with higher levels of education. On the other hand, returns to education rise with the level of
education.
Another study (Aoki et al., 2002, cited in Assefa, 2004), confirmed that lack of educational
opportunity is one of the most powerful determinants of poverty and unequal access to
educational opportunity is strongly correlated with income inequality. The provision of relevant
education significantly contributes to any poverty reduction exercise. The evidences from
Assefa’s (2004) study revealed that educated farmers are more likely to adopt new technologies
and get higher return on their land.
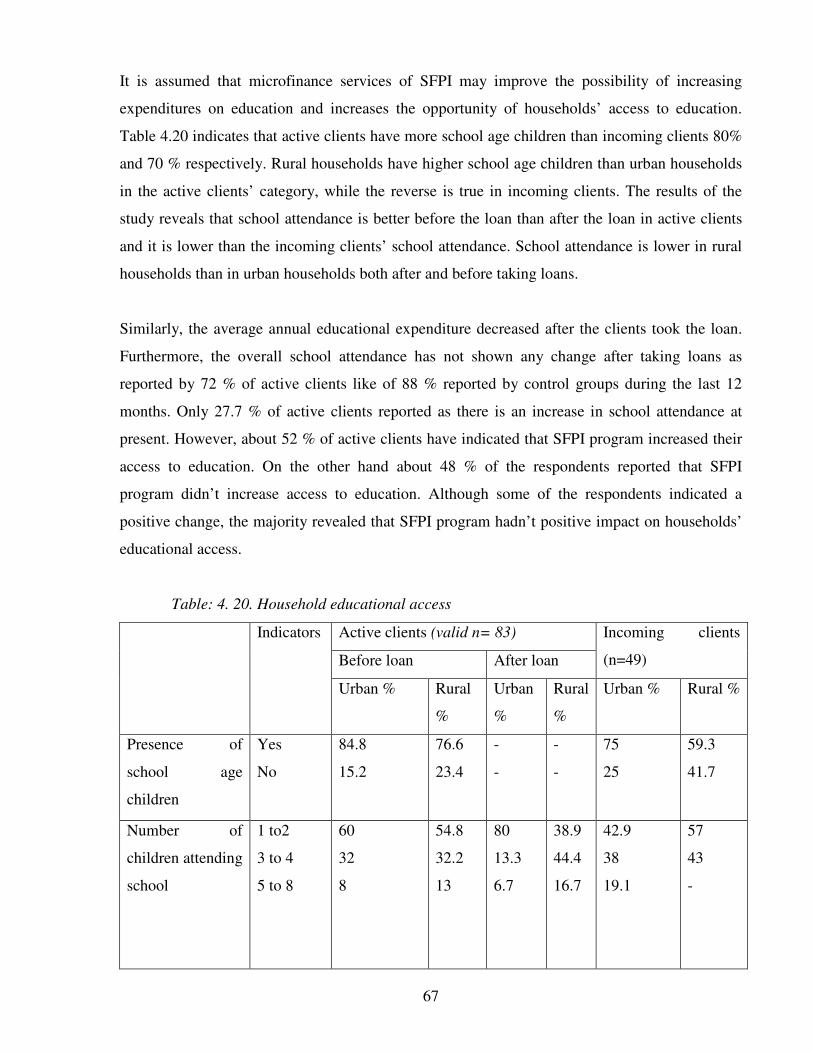
67
It is assumed that microfinance services of SFPI may improve the possibility of increasing
expenditures on education and increases the opportunity of households’ access to education.
Table 4.20 indicates that active clients have more school age children than incoming clients 80%
and 70 % respectively. Rural households have higher school age children than urban households
in the active clients’ category, while the reverse is true in incoming clients. The results of the
study reveals that school attendance is better before the loan than after the loan in active clients
and it is lower than the incoming clients’ school attendance. School attendance is lower in rural
households than in urban households both after and before taking loans.
Similarly, the average annual educational expenditure decreased after the clients took the loan.
Furthermore, the overall school attendance has not shown any change after taking loans as
reported by 72 % of active clients like of 88 % reported by control groups during the last 12
months. Only 27.7 % of active clients reported as there is an increase in school attendance at
present. However, about 52 % of active clients have indicated that SFPI program increased their
access to education. On the other hand about 48 % of the respondents reported that SFPI
program didn’t increase access to education. Although some of the respondents indicated a
positive change, the majority revealed that SFPI program hadn’t positive impact on households’
educational access.
Table: 4. 20. Household educational access
Active clients (valid n= 83)
Before loan After loan
Incoming clients
(n=49)
Indicators
Urban % Rural
%
Urban
%
Rural
%
Urban % Rural %
Presence of
school age
children
Yes
No
84.8
15.2
76.6
23.4
-
-
-
-
75
25
59.3
41.7
Number of
children attending
school
1 to2
3 to 4
5 to 8
60
32
8
54.8
32.2
13
80
13.3
6.7
38.9
44.4
16.7
42.9
38
19.1
57
43
-
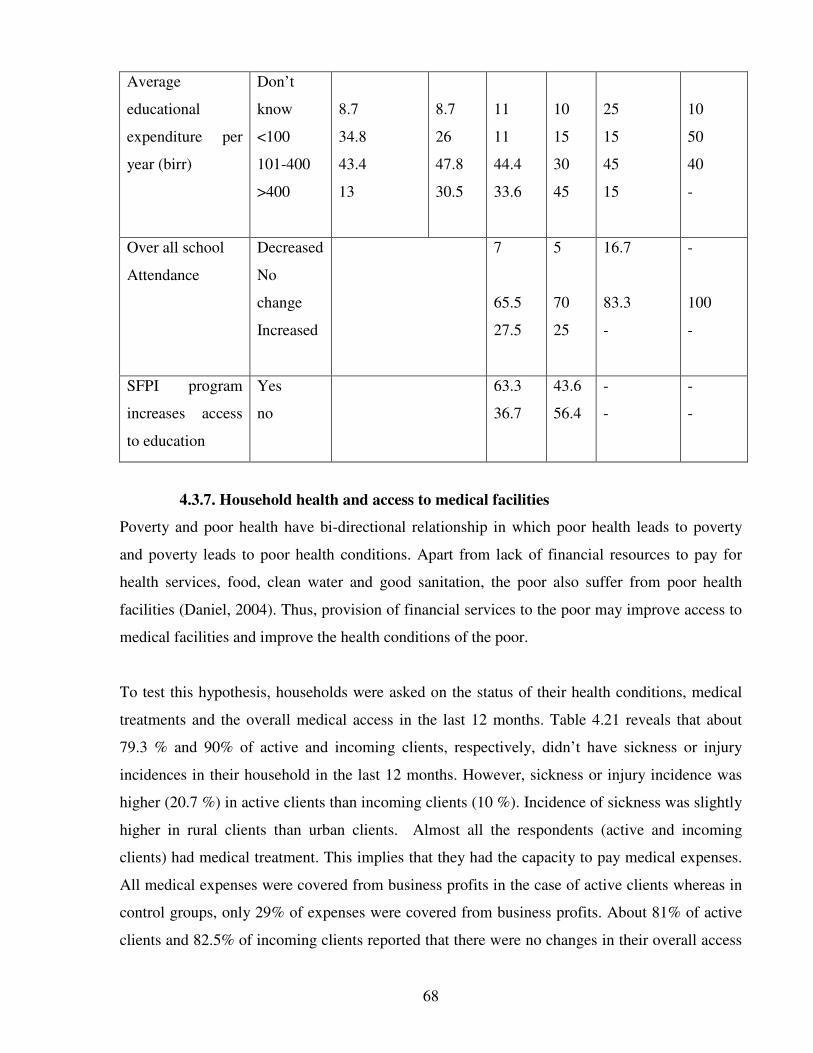
68
Average
educational
expenditure per
year (birr)
Don’t
know
<100
101-400
>400
8.7
34.8
43.4
13
8.7
26
47.8
30.5
11
11
44.4
33.6
10
15
30
45
25
15
45
15
10
50
40
-
Over all school
Attendance
Decreased
No
change
Increased
7
65.5
27.5
5
70
25
16.7
83.3
-
-
100
-
SFPI program
increases access
to education
Yes
no
63.3
36.7
43.6
56.4
-
-
-
-
4.3.7. Household health and access to medical facilities
Poverty and poor health have bi-directional relationship in which poor health leads to poverty
and poverty leads to poor health conditions. Apart from lack of financial resources to pay for
health services, food, clean water and good sanitation, the poor also suffer from poor health
facilities (Daniel, 2004). Thus, provision of financial services to the poor may improve access to
medical facilities and improve the health conditions of the poor.
To test this hypothesis, households were asked on the status of their health conditions, medical
treatments and the overall medical access in the last 12 months. Table 4.21 reveals that about
79.3 % and 90% of active and incoming clients, respectively, didn’t have sickness or injury
incidences in their household in the last 12 months. However, sickness or injury incidence was
higher (20.7 %) in active clients than incoming clients (10 %). Incidence of sickness was slightly
higher in rural clients than urban clients. Almost all the respondents (active and incoming
clients) had medical treatment. This implies that they had the capacity to pay medical expenses.
All medical expenses were covered from business profits in the case of active clients whereas in
control groups, only 29% of expenses were covered from business profits. About 81% of active
clients and 82.5% of incoming clients reported that there were no changes in their overall access
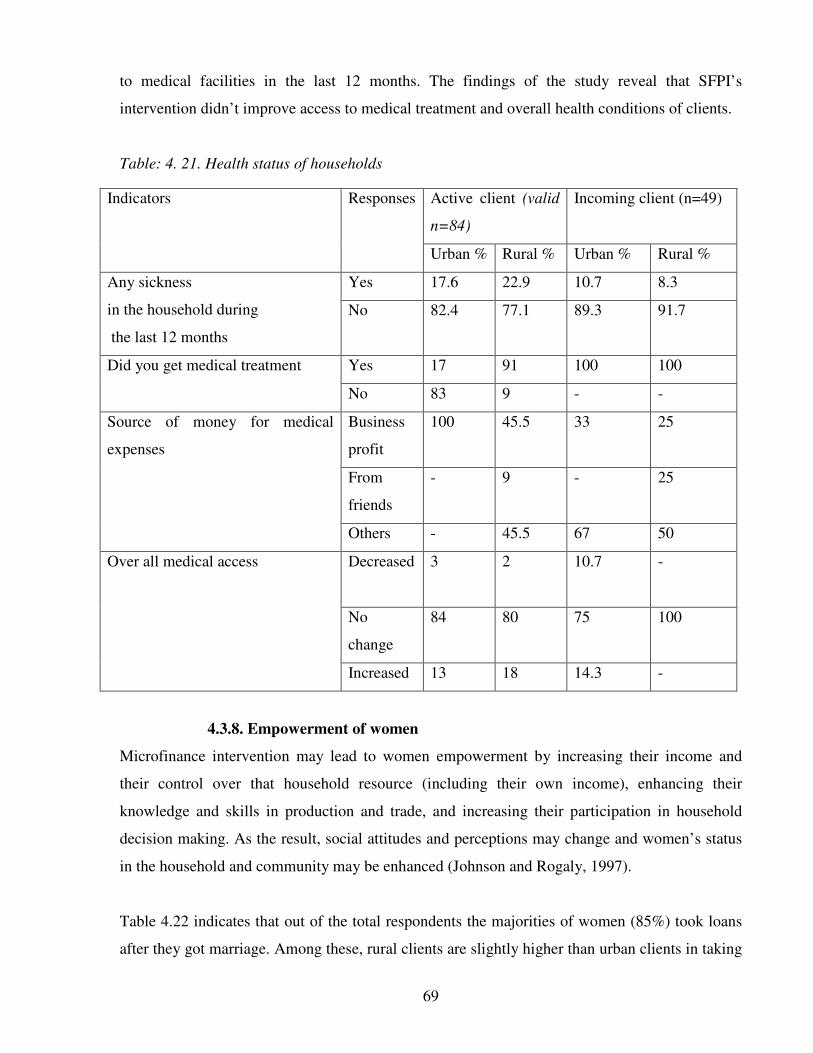
69
to medical facilities in the last 12 months. The findings of the study reveal that SFPI’s
intervention didn’t improve access to medical treatment and overall health conditions of clients.
Table: 4. 21. Health status of households
4.3.8. Empowerment of women
Microfinance intervention may lead to women empowerment by increasing their income and
their control over that household resource (including their own income), enhancing their
knowledge and skills in production and trade, and increasing their participation in household
decision making. As the result, social attitudes and perceptions may change and women’s status
in the household and community may be enhanced (Johnson and Rogaly, 1997).
Table 4.22 indicates that out of the total respondents the majorities of women (85%) took loans
after they got marriage. Among these, rural clients are slightly higher than urban clients in taking
Active client (valid
n=84)
Incoming client (n=49) Indicators Responses
Urban % Rural % Urban % Rural %
Yes 17.6 22.9 10.7 8.3 Any sickness
in the household during
the last 12 months
No 82.4 77.1 89.3 91.7
Yes 17 91 100 100 Did you get medical treatment
No 83 9 - -
Business
profit
100 45.5 33 25
From
friends
- 9 - 25
Source of money for medical
expenses
Others - 45.5 67 50
Decreased 3
2
10.7
-
No
change
84 80 75 100
Over all medical access
Increased 13 18 14.3 -
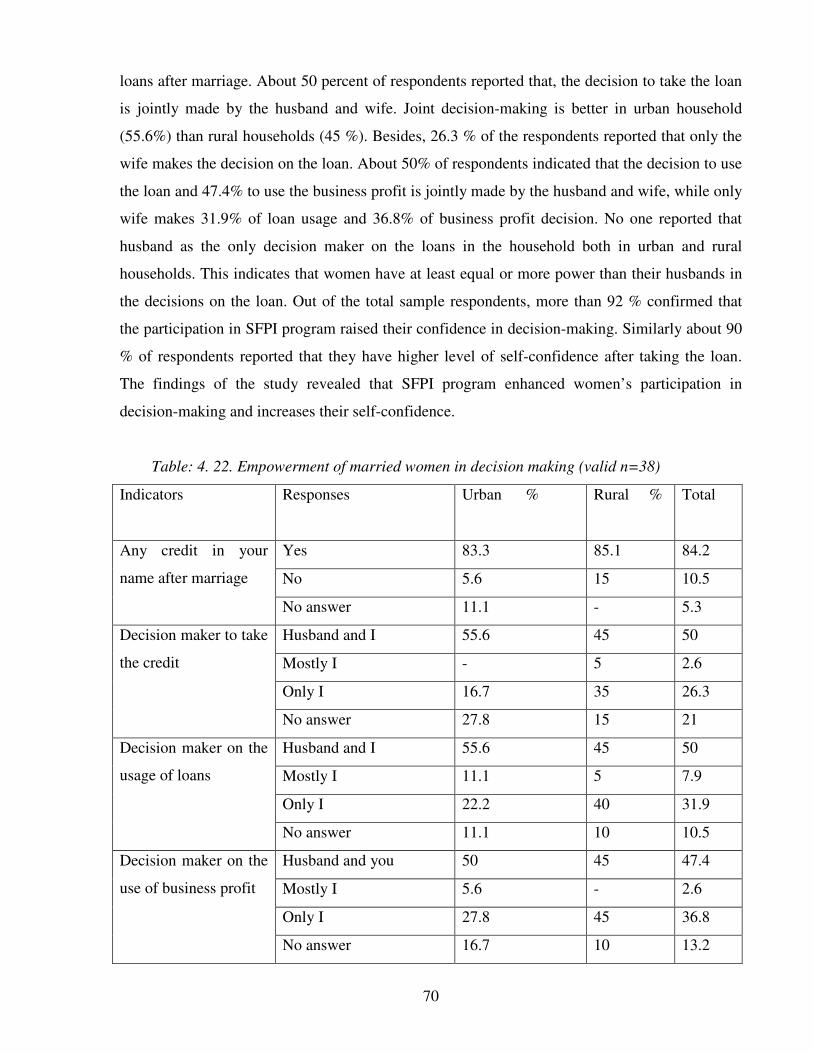
70
loans after marriage. About 50 percent of respondents reported that, the decision to take the loan
is jointly made by the husband and wife. Joint decision-making is better in urban household
(55.6%) than rural households (45 %). Besides, 26.3 % of the respondents reported that only the
wife makes the decision on the loan. About 50% of respondents indicated that the decision to use
the loan and 47.4% to use the business profit is jointly made by the husband and wife, while only
wife makes 31.9% of loan usage and 36.8% of business profit decision. No one reported that
husband as the only decision maker on the loans in the household both in urban and rural
households. This indicates that women have at least equal or more power than their husbands in
the decisions on the loan. Out of the total sample respondents, more than 92 % confirmed that
the participation in SFPI program raised their confidence in decision-making. Similarly about 90
% of respondents reported that they have higher level of self-confidence after taking the loan.
The findings of the study revealed that SFPI program enhanced women’s participation in
decision-making and increases their self-confidence.
Table: 4. 22. Empowerment of married women in decision making (valid n=38)
Indicators Responses Urban % Rural % Total
Yes 83.3 85.1 84.2
No 5.6 15 10.5
Any credit in your
name after marriage
No answer 11.1 - 5.3
Husband and I 55.6 45 50
Mostly I - 5 2.6
Only I 16.7 35 26.3
Decision maker to take
the credit
No answer 27.8 15 21
Husband and I 55.6 45 50
Mostly I 11.1 5 7.9
Only I 22.2 40 31.9
Decision maker on the
usage of loans
No answer 11.1 10 10.5
Husband and you 50 45 47.4
Mostly I 5.6 - 2.6
Only I 27.8 45 36.8
Decision maker on the
use of business profit
No answer 16.7 10 13.2
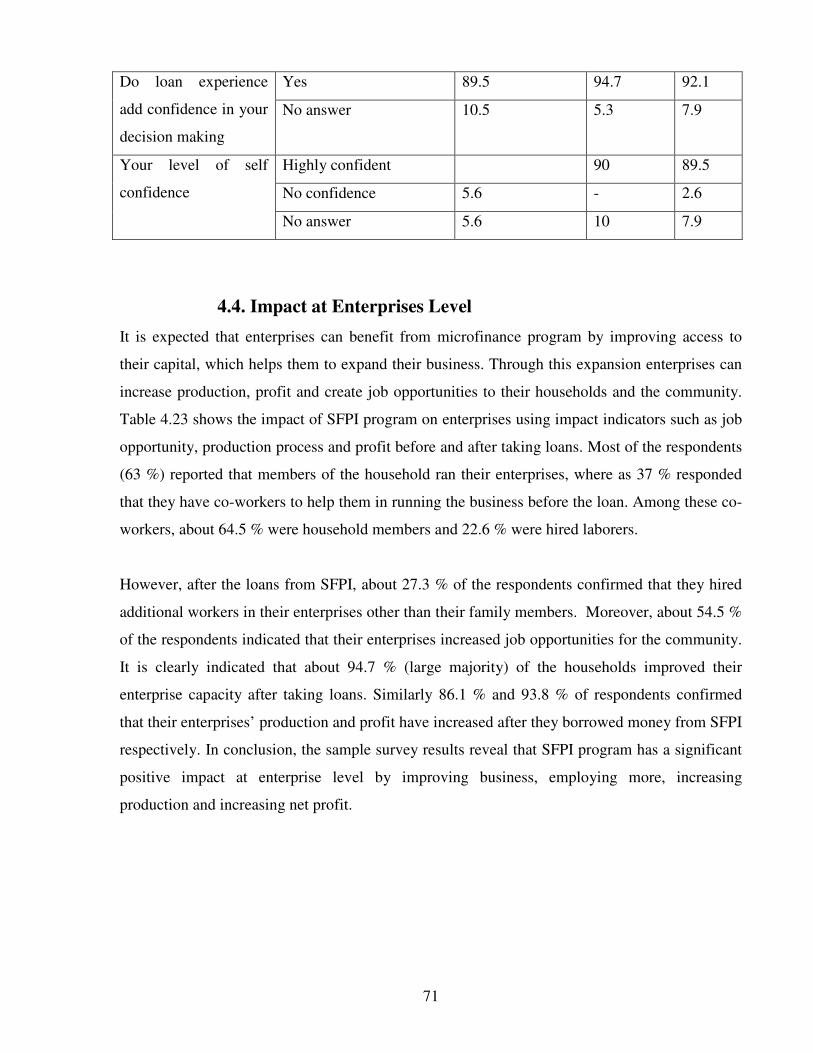
71
Yes 89.5 94.7 92.1 Do loan experience
add confidence in your
decision making
No answer 10.5 5.3 7.9
Highly confident 90 89.5
No confidence 5.6 - 2.6
Your level of self
confidence
No answer 5.6 10 7.9
4.4. Impact at Enterprises Level
It is expected that enterprises can benefit from microfinance program by improving access to
their capital, which helps them to expand their business. Through this expansion enterprises can
increase production, profit and create job opportunities to their households and the community.
Table 4.23 shows the impact of SFPI program on enterprises using impact indicators such as job
opportunity, production process and profit before and after taking loans. Most of the respondents
(63 %) reported that members of the household ran their enterprises, where as 37 % responded
that they have co-workers to help them in running the business before the loan. Among these co-
workers, about 64.5 % were household members and 22.6 % were hired laborers.
However, after the loans from SFPI, about 27.3 % of the respondents confirmed that they hired
additional workers in their enterprises other than their family members. Moreover, about 54.5 %
of the respondents indicated that their enterprises increased job opportunities for the community.
It is clearly indicated that about 94.7 % (large majority) of the households improved their
enterprise capacity after taking loans. Similarly 86.1 % and 93.8 % of respondents confirmed
that their enterprises’ production and profit have increased after they borrowed money from SFPI
respectively. In conclusion, the sample survey results reveal that SFPI program has a significant
positive impact at enterprise level by improving business, employing more, increasing
production and increasing net profit.
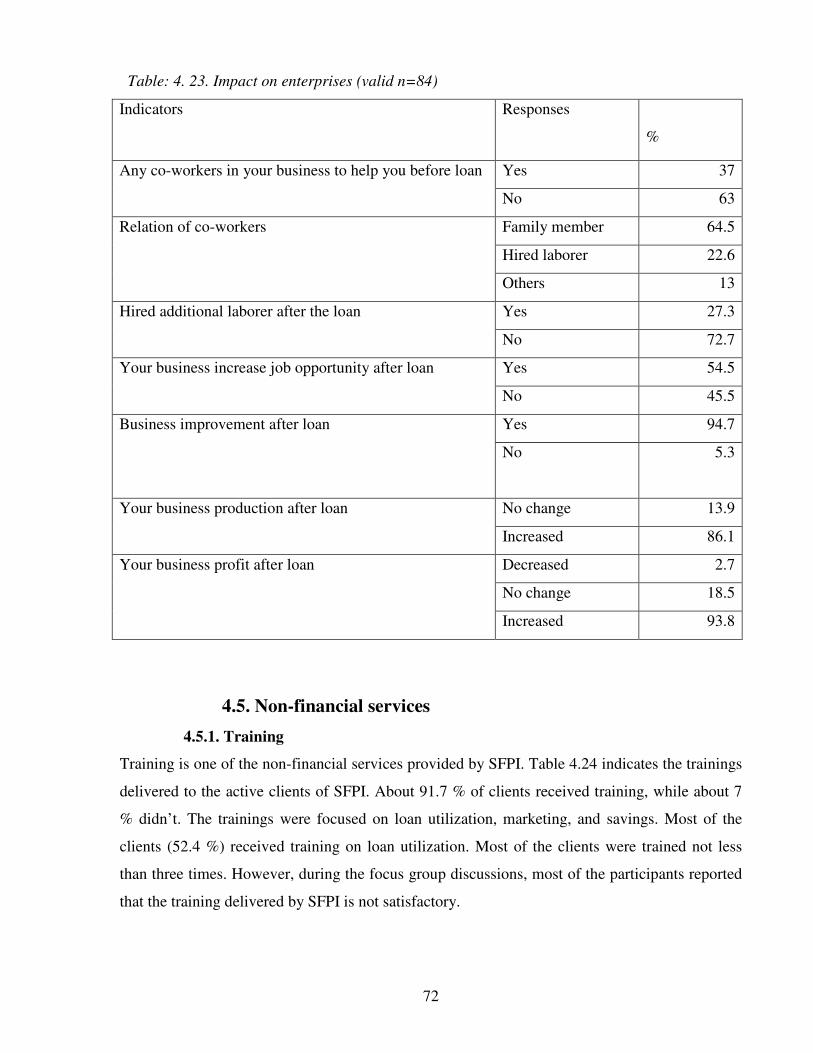
72
Table: 4. 23. Impact on enterprises (valid n=84)
Indicators Responses
%
Yes 37 Any co-workers in your business to help you before loan
No 63
Family member 64.5
Hired laborer 22.6
Relation of co-workers
Others 13
Yes 27.3 Hired additional laborer after the loan
No 72.7
Yes 54.5 Your business increase job opportunity after loan
No 45.5
Yes 94.7 Business improvement after loan
No 5.3
No change 13.9 Your business production after loan
Increased 86.1
Decreased 2.7
No change 18.5
Your business profit after loan
Increased 93.8
4.5. Non-financial services
4.5.1. Training
Training is one of the non-financial services provided by SFPI. Table 4.24 indicates the trainings
delivered to the active clients of SFPI. About 91.7 % of clients received training, while about 7
% didn’t. The trainings were focused on loan utilization, marketing, and savings. Most of the
clients (52.4 %) received training on loan utilization. Most of the clients were trained not less
than three times. However, during the focus group discussions, most of the participants reported
that the training delivered by SFPI is not satisfactory.
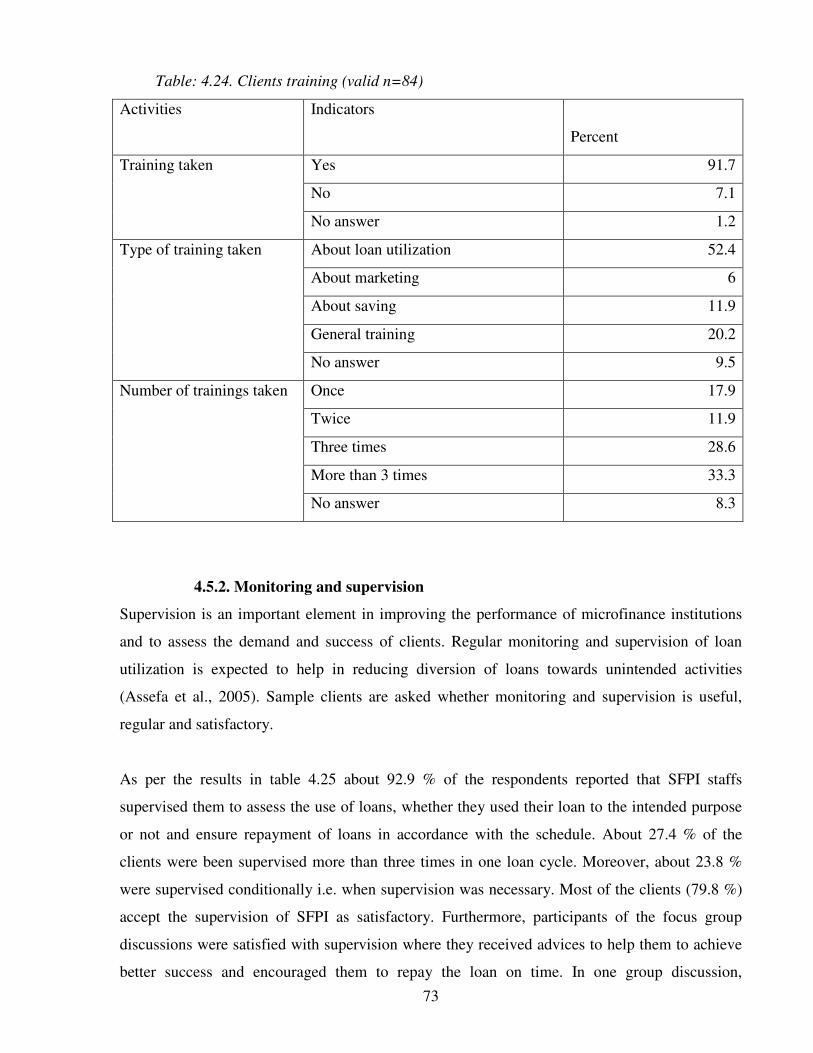
73
Table: 4.24. Clients training (valid n=84)
Activities Indicators
Percent
Yes 91.7
No 7.1
Training taken
No answer 1.2
About loan utilization 52.4
About marketing 6
About saving 11.9
General training 20.2
Type of training taken
No answer 9.5
Once 17.9
Twice 11.9
Three times 28.6
More than 3 times 33.3
Number of trainings taken
No answer 8.3
4.5.2. Monitoring and supervision
Supervision is an important element in improving the performance of microfinance institutions
and to assess the demand and success of clients. Regular monitoring and supervision of loan
utilization is expected to help in reducing diversion of loans towards unintended activities
(Assefa et al., 2005). Sample clients are asked whether monitoring and supervision is useful,
regular and satisfactory.
As per the results in table 4.25 about 92.9 % of the respondents reported that SFPI staffs
supervised them to assess the use of loans, whether they used their loan to the intended purpose
or not and ensure repayment of loans in accordance with the schedule. About 27.4 % of the
clients were been supervised more than three times in one loan cycle. Moreover, about 23.8 %
were supervised conditionally i.e. when supervision was necessary. Most of the clients (79.8 %)
accept the supervision of SFPI as satisfactory. Furthermore, participants of the focus group
discussions were satisfied with supervision where they received advices to help them to achieve
better success and encouraged them to repay the loan on time. In one group discussion,
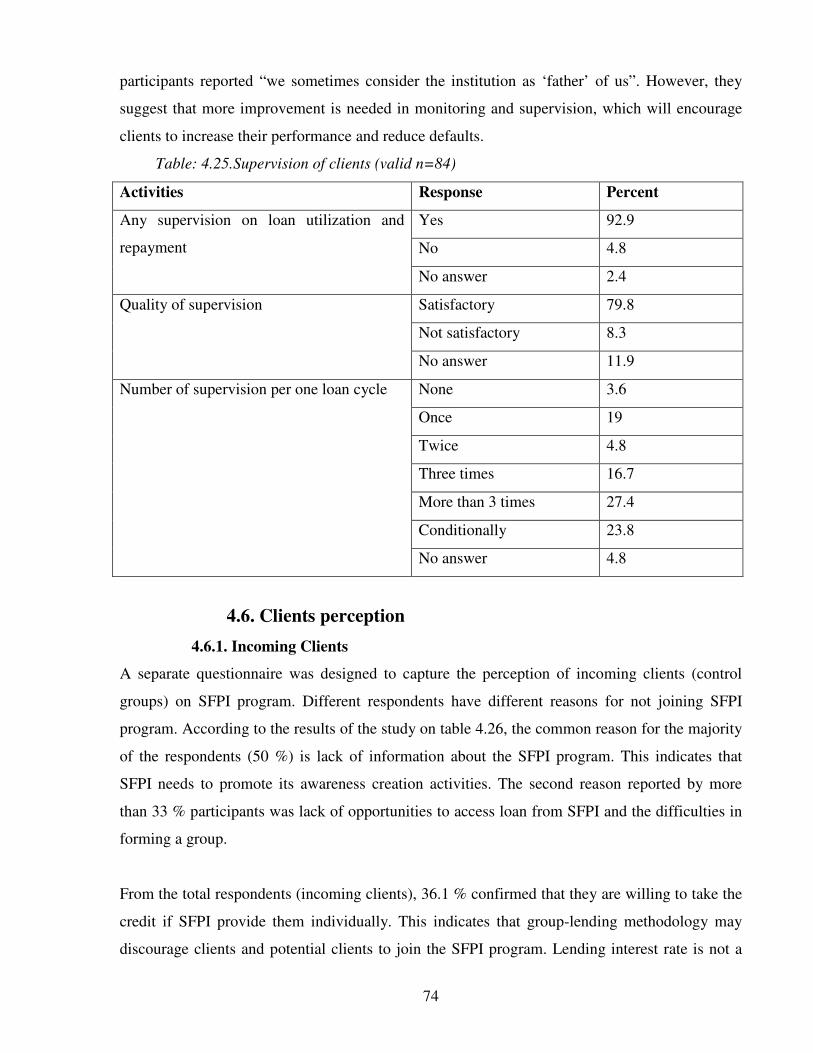
74
participants reported “we sometimes consider the institution as ‘father’ of us”. However, they
suggest that more improvement is needed in monitoring and supervision, which will encourage
clients to increase their performance and reduce defaults.
Table: 4.25.Supervision of clients (valid n=84)
Activities Response Percent
Yes 92.9
No 4.8
Any supervision on loan utilization and
repayment
No answer 2.4
Satisfactory 79.8
Not satisfactory 8.3
Quality of supervision
No answer 11.9
None 3.6
Once 19
Twice 4.8
Three times 16.7
More than 3 times 27.4
Conditionally 23.8
Number of supervision per one loan cycle
No answer 4.8
4.6. Clients perception
4.6.1. Incoming Clients
A separate questionnaire was designed to capture the perception of incoming clients (control
groups) on SFPI program. Different respondents have different reasons for not joining SFPI
program. According to the results of the study on table 4.26, the common reason for the majority
of the respondents (50 %) is lack of information about the SFPI program. This indicates that
SFPI needs to promote its awareness creation activities. The second reason reported by more
than 33 % participants was lack of opportunities to access loan from SFPI and the difficulties in
forming a group.
From the total respondents (incoming clients), 36.1 % confirmed that they are willing to take the
credit if SFPI provide them individually. This indicates that group-lending methodology may
discourage clients and potential clients to join the SFPI program. Lending interest rate is not a
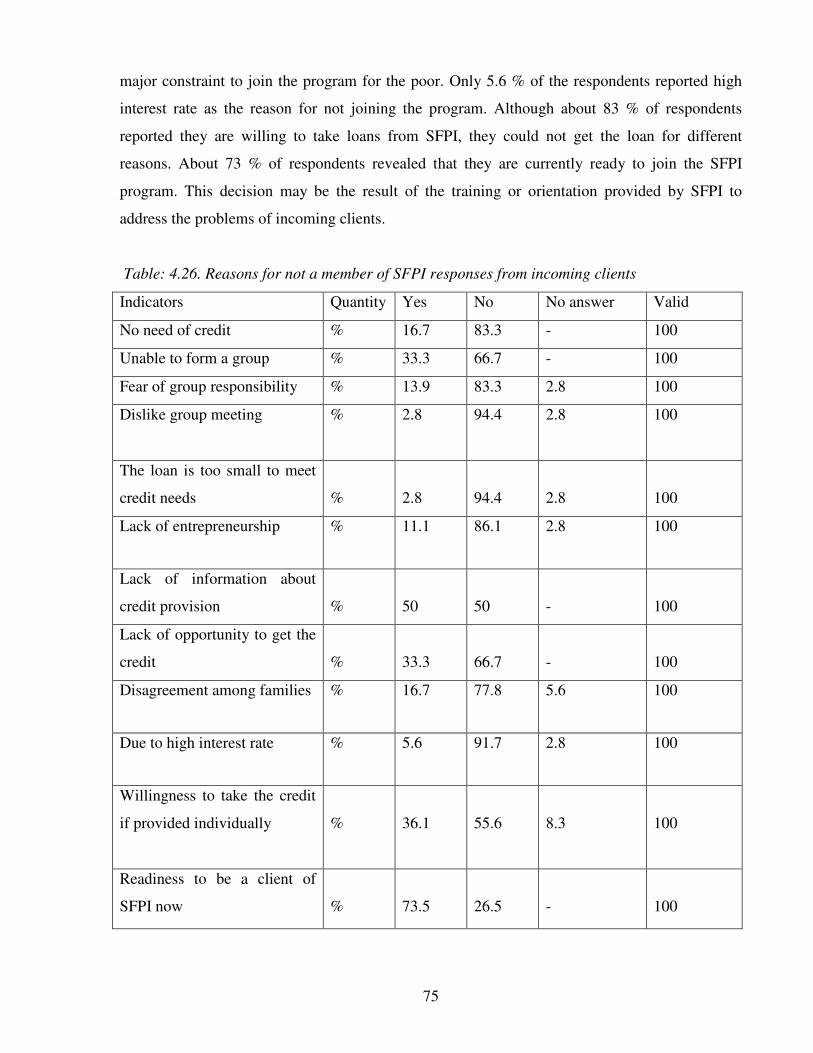
75
major constraint to join the program for the poor. Only 5.6 % of the respondents reported high
interest rate as the reason for not joining the program. Although about 83 % of respondents
reported they are willing to take loans from SFPI, they could not get the loan for different
reasons. About 73 % of respondents revealed that they are currently ready to join the SFPI
program. This decision may be the result of the training or orientation provided by SFPI to
address the problems of incoming clients.
Table: 4.26. Reasons for not a member of SFPI responses from incoming clients
Indicators Quantity Yes No No answer Valid
No need of credit % 16.7 83.3 - 100
Unable to form a group % 33.3 66.7 - 100
Fear of group responsibility % 13.9 83.3 2.8 100
Dislike group meeting %
2.8 94.4 2.8 100
The loan is too small to meet
credit needs
%
2.8
94.4
2.8
100
Lack of entrepreneurship % 11.1 86.1 2.8 100
Lack of information about
credit provision
%
50
50
-
100
Lack of opportunity to get the
credit
%
33.3
66.7
-
100
Disagreement among families % 16.7 77.8 5.6 100
Due to high interest rate % 5.6 91.7 2.8 100
Willingness to take the credit
if provided individually
%
36.1
55.6
8.3
100
Readiness to be a client of
SFPI now
%
73.5
26.5
-
100
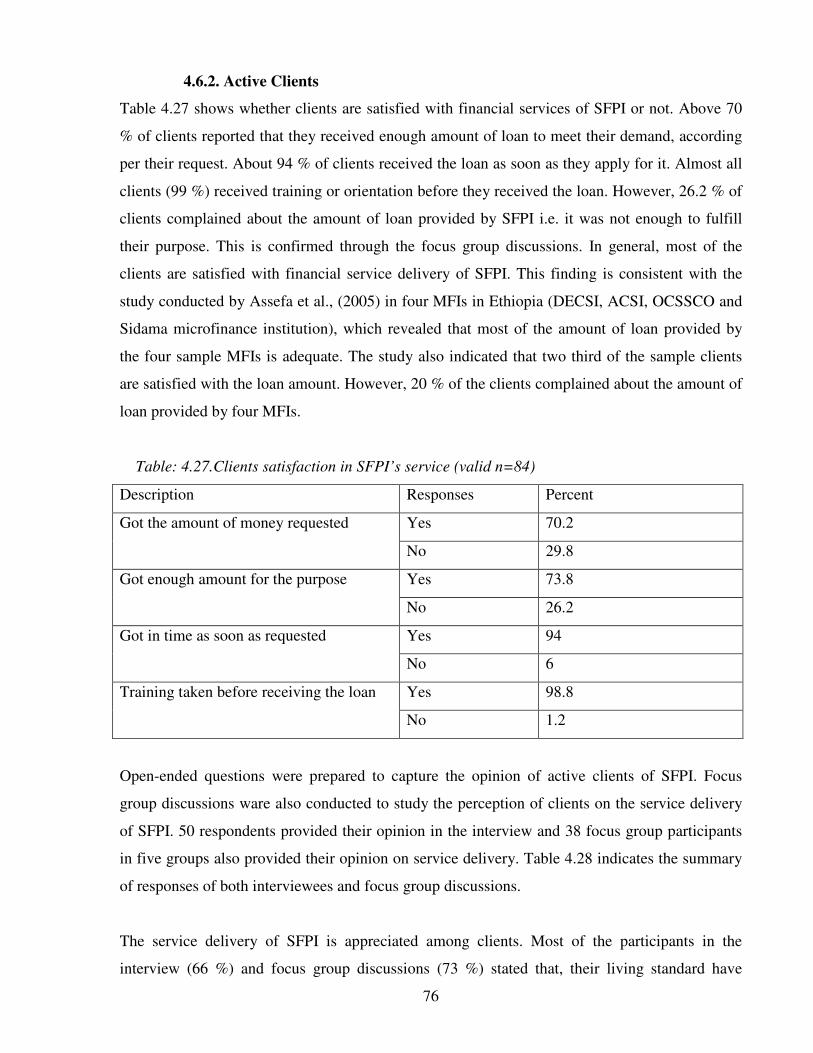
76
4.6.2. Active Clients
Table 4.27 shows whether clients are satisfied with financial services of SFPI or not. Above 70
% of clients reported that they received enough amount of loan to meet their demand, according
per their request. About 94 % of clients received the loan as soon as they apply for it. Almost all
clients (99 %) received training or orientation before they received the loan. However, 26.2 % of
clients complained about the amount of loan provided by SFPI i.e. it was not enough to fulfill
their purpose. This is confirmed through the focus group discussions. In general, most of the
clients are satisfied with financial service delivery of SFPI. This finding is consistent with the
study conducted by Assefa et al., (2005) in four MFIs in Ethiopia (DECSI, ACSI, OCSSCO and
Sidama microfinance institution), which revealed that most of the amount of loan provided by
the four sample MFIs is adequate. The study also indicated that two third of the sample clients
are satisfied with the loan amount. However, 20 % of the clients complained about the amount of
loan provided by four MFIs.
Table: 4.27.Clients satisfaction in SFPI’s service (valid n=84)
Description Responses Percent
Yes 70.2 Got the amount of money requested
No 29.8
Yes 73.8 Got enough amount for the purpose
No 26.2
Yes 94 Got in time as soon as requested
No 6
Yes 98.8 Training taken before receiving the loan
No 1.2
Open-ended questions were prepared to capture the opinion of active clients of SFPI. Focus
group discussions ware also conducted to study the perception of clients on the service delivery
of SFPI. 50 respondents provided their opinion in the interview and 38 focus group participants
in five groups also provided their opinion on service delivery. Table 4.28 indicates the summary
of responses of both interviewees and focus group discussions.
The service delivery of SFPI is appreciated among clients. Most of the participants in the
interview (66 %) and focus group discussions (73 %) stated that, their living standard have
77
improved as a result of SFPI program. The other appreciation of the participants is the savings
service of SFPI that promoted the saving habits of the clients. 56 % of interviewees and 35 % of
focus group participants shared this. About 52 % of interviewed clients and 92 % of focus group
participants liked the services of SFPI staff's handling and providing useful advices. They even
stated that “consider the staff as part of their families.” They also appreciated on the on lending
interest rate, training and advices, good working condition, lending without personal guarantee,
reduced the exploitation of money lenders, paying reasonable interest on deposit, and adequate
monitoring and supervision of SFPI.
On the other hand the sample clients indicated what they didn’t like in SFPI. From the total 50
interviewed clients 28 % and from 37 focus group participants 89.2 % expressed that they do not
like group collateral. Similarly 22 % and 73 % of interviewee and focus group participants
respectively reported that they dislike the shortness of loan period. Moreover, some clients
reported that the loan size is low to meet their needs. High lending interest rate is another
dissatisfaction reported by 18 % of interviewees and 35 % of participants of the group
discussion. Clients disliked the long time in disbursing loans, group and center savings,
inflexibility in withdrawing savings i.e. they cannot withdraw money whenever they want and
savings were not regularly recorded on time in the savers passbook.
Clients have also made some recommendations to improve SFPI services. One of the suggestions
of clients is increasing the loan period. The period should be flexible in accordance with the
working condition of the clients. The other improvement proposed by large majority of focus
group discussion participants (89.2 %) and interviewed (16 %) participants were the need of
promoting individual lending methodology. The clients recommended that SFPI should increase
the size of loan delivered to clients. They said that “The loans of SFPI make a difference in our
lives and we can expand our activities if we get enough loans to our purpose.” About 30 % of the
interviewed clients proposed that SFPI should reduce the lending interest rate.
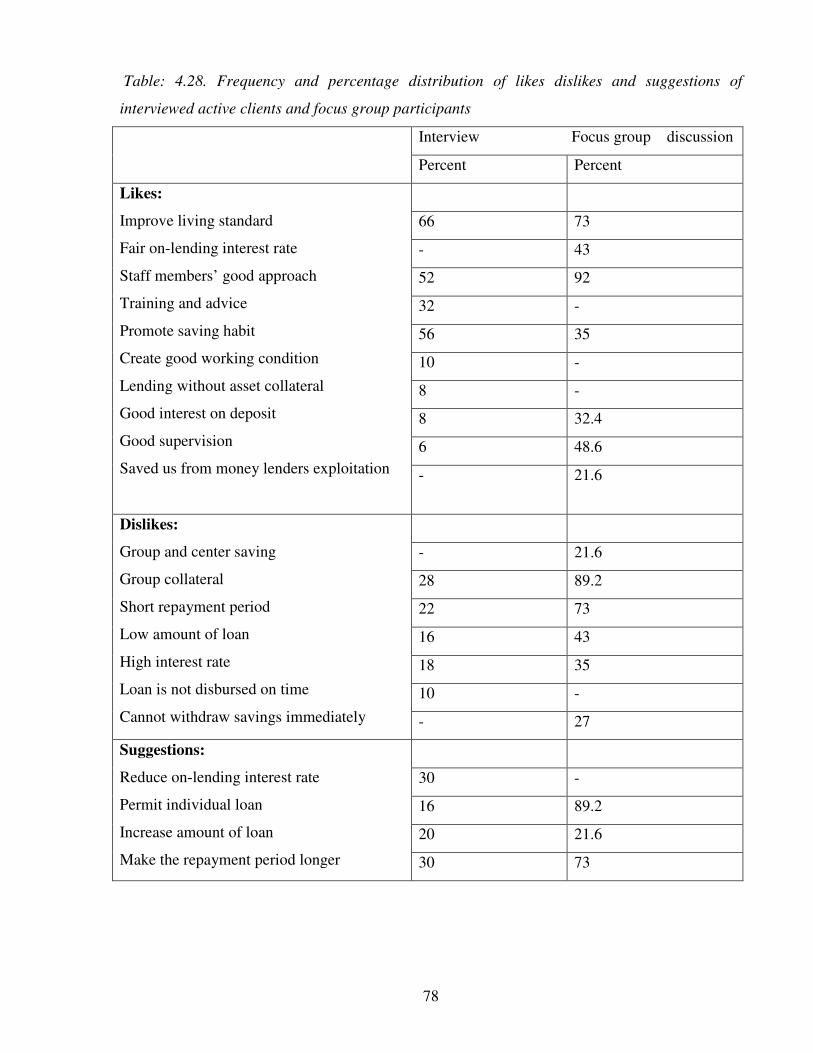
78
Table: 4.28. Frequency and percentage distribution of likes dislikes and suggestions of
interviewed active clients and focus group participants
Interview Focus group discussion
Percent Percent
66 73
- 43
52 92
32 -
56 35
10 -
8 -
8 32.4
6 48.6
Likes:
Improve living standard
Fair on-lending interest rate
Staff members’ good approach
Training and advice
Promote saving habit
Create good working condition
Lending without asset collateral
Good interest on deposit
Good supervision
Saved us from money lenders exploitation
- 21.6
- 21.6
28 89.2
22 73
16 43
18 35
10 -
Dislikes:
Group and center saving
Group collateral
Short repayment period
Low amount of loan
High interest rate
Loan is not disbursed on time
Cannot withdraw savings immediately - 27
30 -
16 89.2
20 21.6
Suggestions:
Reduce on-lending interest rate
Permit individual loan
Increase amount of loan
Make the repayment period longer 30 73
79
CHAPTER FIVE
CONCLUSION AND RECOMMENDATIONS
5.1. Conclusion
The government of Ethiopia believes that microfinance institutions are one of the instruments in
poverty reduction. It is expected that microfinance services create employment opportunities,
increasing income, enhancing empowerment and in aggregate improve the livelihood of the poor.
Accordingly, Proclamation No. 40/1996 was established in 1996 to promote microfinance
development in Ethiopia. Following this, many (twenty-six) microfinance institutions have been
emerging in remarkable manner in Ethiopia.
The main objective of all MFIs in Ethiopia is to provide financial as well as non-finical services
to the active poor people. Emphasis has been laid on the need that poor people have for a wide
range of financial services. So it is important to understand the rationale of microfinance
development features on the targeted groups (poor). On the other hand, assessing the impact of
microfinance intervention is essential to explore the ways in which financial services are able to
support livelihoods and promote them for savings accumulation for future use.
This study had the objective of assessing the impact of microfinance on poverty reduction,
focusing on a case study. It attempted to find out the impact of microfinance services provided
by SFPI at household and enterprise levels. The results of the study are summarized as follows
below.
SFPI has shown an encouraging growth in its operation and outreach. The number of active
clients, loan disbursement, and average loan size of SFPI has increased in a remarkable way
from year 1998 to 2004 and has an impressive loan repayment (95.4 %). However, the dropout
rate has shown an increasing trend. Moreover, the main target group of SFPI, that is women
clients’ participation, declined from 80 % in 1999 to 60 % in 2004. The reason for this is low
awareness of women for the purpose of microfinance services and domination of husbands over
their wives not to join SFPI program. Similarly the proportion of female in SFPI staff is lower
than male.
80
The study found out that SFPI intervention has improved households’ living conditions. The
findings revealed that the average monthly income of most households rose after they took loans
from SFPI. Similarly more than 65 % of households confirmed that the overall household
income increased due to SFPI program. However, the impact is more pronounced in rural
households than urban households. Furthermore, households made improvements in their houses
after they joined SFPI program. SFPI program has also raised the households’ asset ownership.
Ownership of assets in all interviewed clients has increased after the program. Even poor
households purchased television, sofa and refrigerator after taking loans from SFPI.
Microfinance provision enables the clients to generate income that could be spent on improved
facilities and improve the living condition of households. The average monthly expenditure of
active clients shifted from the lower category to the next higher category after joining SFPI
program. The average monthly expenditure of active clients was higher than the incoming
clients. Active clients have got more chance of improving their diet than incoming clients.
Almost half of active clients indicated that their diet condition have improved due to SFPI
interventions. About 91.7 % of active clients reduced shocks from food shortage compared to
61.2 % of incoming clients in the last 12 months. However, SFPI's intervention did not show a
positive impact on improving access to education and medical facilities.
SFPI program has a positive impact on enterprise expansion, increasing job opportunities of the
household members and the community, increase in production and net profit. More than half of
respondents confirmed that their enterprise expansion increased employment opportunities for
their families and the community. Large majority of respondents stated that their enterprise
capacity has improved due to SFPI interventions. Similarly more than 73 % of respondents
reported that their enterprises have been increased production and net profit after they have
received loans from SFPI.
Most of respondents indicated that their overall saving has been increased and developed their
saving habit. Furthermore, SFPI program enhances empowerment of women. Most respondents
expressed that they have equal power in households’ decision making. Decisions on the loan,
loan usage and business profit is taken jointly by the wife and the husband. About 92 % of
respondents reported that SFPI program has built their confidence in decision-making.
81
However, the findings on the impact of SFPI program on households’ access to education and
medical facilities didn’t consistent with the hypothesis developed in the study. Most findings of
this study are consistent with the hypotheses developed in the study. Thus, microfinance
intervention has a positive impact at the household and enterprise levels. This implies that
microfinance institutions have an important role in poverty reduction.
5.2. Recommendations
SFPI has a positive impact on poverty reduction. However, the following recommendations are
presented for further development of SFPI.
� The declining tendency of women clients' participation in SFPI shows inconsistency with
its objectives. It needs a critical assessment to find out the reasons and take corrective
measures.
� The investigation indicates that dropout rate in SFPI is increasing. Most dropout clients
stated that the main reasons for exiting from SFPI were personal problems and
dissatisfaction of SFPI service. Therefore, SFPI should investigate the main
dissatisfactions that lead to withdrawal of clients from SFPI program and take corrective
measures accordingly.
� The institution (SFPI) should give due attention to correct the dissatisfactions reported by
clients and take into account their recommendations.
� Training is important in all organizational levels of the institution. According to the
survey, most clients like the orientation and advice provided by SFPI staffs. However,
on-job training for clients is limited. So it is advisable to provide on-job training at the
grass root level and also close supervision is needed.
� Information is a critical factor for any sound decision making process. Incoming clients
stated that one of the common reasons for not joining SFPI program was lack of
information about SFPI. Thus, establishing advocacy and advertising mechanism helps
the institution to expand its outreach and give an opportunity for possible potential
beneficiaries.
� The institution (SFPI) has shown a remarkable growth in its operation. However, it is still
at the age of supply-driven. It needs a strong and continuous effort to shift from supply-
driven to demand-driven stage for its sustainability.
82
REFFERENCES
AEMFI (2003) Microfinance Development Review: Rural Financial Intermediation Program and
its role in strengthening the Rural Finance System in Ethiopia. Vol.3, No. 2: Addis
Ababa, Ethiopia.
_______ (2005) Microfinance Development Review in Wolday A. (ed). Vol.5, No.1: Addis
Ababa, Ethiopia.
AIMS Project (2000) Learning from Clients Assessment Tools for Microfinance Practitioners.
Washington D.C.
Asmelash (2003) The Impact of Microfinance in Ethiopia: The case of DECSI in Ganta-
Afeshum Woreda of Eastern Tigray. Master Thesis, Addis Ababa University: Addis
Ababa, Ethiopia.
Assefa A. (2004) New Pro-poor Policies and Budgeting in the Ethiopian Education Sector in
Tassew W. and Eberlie W. (eds). Department of Economics, Addis Ababa University:
Addis Ababa.
Assefa A.,Gebrehiwot A. and Mulat D.(2005) Rural Finance in Ethiopia: Assessment of the
Financial Products of Microfinance Intuitions. AEMFI, Occasional paper No.12:
Addis Ababa, Ethiopia.
Attimir O. (1982) The Extent of Poverty in Latin America: World Bank Staff Working Papers.
No .522. The World Bank: Washington D.C.
Bateman M. (2003) New Wave Microfinance Institutions in South-East Europe: Small Enterprise
Development. An International Journal of Microfinance and Business Development
in Tawney C. (ed), Vol.14, No.3: ITDG Publishing, London.
Borchgrevik A., Tassew W., Gebrehiwot A. and Weldeab T. (2005) Marginalized Groups, Credit
and Empowerment: The Case of Dedebit Credit and Savings Institution (DECSI) of
Tigray. Occasional paper No. 14, AEMFI: Addis Ababa, Ethiopia.
CGAP (1997) World Bank Project on Microfinance Program. World Bank: Washington D.C.
CSA (1997) Statistical Abstract. Government of the Federal Democratic Republic of Ethiopia:
Addis Ababa, Ethiopia.
CIA (2005) The World Fact Book: Ethiopian Population, Ethiopia.
83
Daba M. (2004) The Impact of Microfinance on Poverty Reduction: A Case Study of Oromia
Credit and Saving Share Company. A Paper Presented in the International Conference
on Microfinance Development in Ethiopia: Awassa, Ethiopia.
Daniel Z. (2004) Health Sector in Ethiopia’s PRSP in Tassew W. and Eberlli W. (eds).
Department of Economics, Addis Ababa University: Addis Ababa.
Degefe (2004) Trends in Financial Development of Nine Microfinance Institutions from 1999 to
2002. The Paper Presented in the Second International Workshop of RLDS, Addis
Ababa University: Addis Ababa, Ethiopia.
Federal Democratic Republic of Ethiopia (1996) Federal Negarit Gazeta: Proclamation No.
40/1996, Proclamation to provide for the Licensing and Supervision of the Business of
Micro Financing Institutions. Addis Ababa, Ethiopia.
Gebrehiwot A. (2002) Microfinance Institutions in Ethiopia: Issues of Portfolio Risk,
Institutional Arrangements and Governance, in Microfinance Theory, Policy and
Experience in Zaid N. et al. (eds). Mekelle University: Mekelle, Ethiopia.
_______ (2005) Microfinance Development in Ethiopia: Impact and Sustainability of
Microfinance Institutions. AEMFI: Addis Ababa, Ethiopia.
Getachew W. (2005) Specialized Financial and Promotional Institute Paper Presented for Save
the Children USA Partners’ Meeting, March 6-9th
: Morocco.
Getahun T. (1999) Poverty and Poverty Reduction in Ethiopia: In Aspects of Development
Issues in Ethiopia Proceedings of Workshop on the Twenty-Fifth Anniversary of the
Institute of Development Research in Tegegne G. et al. (ed), Institute of Development
Research Addis Ababa University: Addis Ababa, Ethiopia.
Gibbons D. and Meehan F. (2000) The Micro-credit Summit’s Challenge: Working Forwards
Institutional Financial Self-sufficiency While Maintaining a Commitment to Serving
the Poorest Families. CGAP: Washington D.C.
Haftu B. (2005) sustainability of NGOs and Networks: The Case of Association of Ethiopian
Microfinance Institutions in Gerbrehiot A. (ed), AEMFI: Addis Ababa, Ethiopia.
Haileselassie T. (2005) Financial Sustainability of Microfinance Institutions: A case study of
SFPI and PEACE in Gebrehiot A. (ed), AEMFI: Addis Ababa, Ethiopia.
Hailu W. (2005) Microfinance in Developing Countries: Concept and Practices. AEMFI: Addis
Ababa, Ethiopia.
Holcombe S. (1995) Managing to Empower: The Grameen Bank Experience of Poverty
Alleviation. University Press Limited, Dhaka and ZED Books: London.
84
Hulme D. and Mosley P. (1996) Finance against Poverty: Effective Institutions for Lending to
Small Farmers and Micro-enterprises in Developing Countries: Rutledge press,
London.
IFAD (2001) Rural Finance Intermediation Program: Appraisal Report, Vol. II, And Africa II
Division Program Department: Addis Ababa, Ethiopia.
Itana A., Tsehay T. and Eshetu E. (2003) Governance and Ownership Structure of MFIs in
Ethiopia. AEMFI Occasional Paper No. 8: Addis Ababa, Ethiopia.
Jimbed Consult PLC. (2001) Assessment of Impact of the Credit Operation of SFPI on its Target
Clients. SFPI: Addis Ababa, Ethiopia.
Johnson S. and Rogaly R. (1997) Microfinance and Poverty Reduction, Oxfam and
ACTIONAID: Oxfam print unit.
Khandker S. (1999) Fighting Poverty with Micro-credit: Experience in Bangladesh. The
University press Limited, Bangladesh.
Kumar A. (2005) Access to Financial Services in Brazil, The World Bank: Washington D.C.
Ledgerwood J. (1999) Sustainable Banking with the Poor: Microfinance Handbook, The
Institutional and Financial Perspective. The World Bank: Washington D.C.
Louise C. (2002) Macro-economic and Sectoral Approaches: A Source Book for Poverty
Reduction Strategies, Vol.2: The World Bank, Washington D.C.
Meehan F. (1999) Microfinance in Rural Development: The Impact of Credit Provision by the
Dedebit Savings and Credit Institution on Economic Activity and Household
Income in Tigray M.Sc. Thesis: Ethiopia.
MoFED (2002a) Sustainable Development and Poverty Reduction Program, Government of the
Federal Democratic Republic of Ethiopia: Addis Ababa, Ethiopia.
__________ (2002b) Poverty Profile of Ethiopia: Analysis and Comparison of Poverty.
Government of the Federal democratic Republic of Ethiopia: Addis Ababa,
Ethiopia.
Narayana S.L. (2005) Financial Systems Approach and Institutionalization of Micro-savings:
Trends, Experience and Policy Perspectives in Gerbrehiot A. (ed), AEMFI:
Addis Ababa.
Padma M. and Getachew A. (2005) Women Economic Empowerment and Microfinance: A
Review on Experiences of Awassa Women Clients in Gebrehiot A. (ed).
AEMFI: Addis Ababa, Ethiopia.
85
Rao J. N. and Bavaiah M.D. (2005) Impact of Microfinance on Household Income and
Employment: A Study of Andhra Pradesh State in India in Gebrehiot A. (ed),
AEMFI: Ethiopia.
Robinsons S. (2001) The Microfinance Revolution: Sustainable Finance for the Poor. Vol. I. The
World Bank: Washington D.C.
Ruben R. and Clercx L. (2003) Rural Finance, Poverty Alleviation and Sustainable Land use:
The Role of Credit and the Adoption of Agro-forestry Systems in Occidental
Hondura. Vol. 5, No. 2, Journal of Microfinance: Brigham Young University
Publications.
Rutherford S. (2003) Money Talks: Conversations with Poor Household in Bangladesh about
Managing Money. Vol. 5, No. 2 Journal of Microfinance: Brigham Young
University Publications.
SDPRP (2002) Sustainable Development and Poverty Reduction Program, Ministry of Finance
and Economic Development: Addis Ababa, Ethiopia.
SEEP Network (2000) Learning from Clients Assessment for Microfinance Practitioners (draft
Manual) USAID: Washington D.C.
SFPI (1998) SFPI Semi-annual Progress Report: Specialized Financial and Promotional Institute,
December 1998: Addis Ababa.
_________ (1999) Annual Progress Report, Specialized Financial and Promotional Institute,
December 1999: Addis Ababa.
__________ (2000) Annual Progress Report, Specialized Financial and Promotional Institute,
December 2000: Addis Ababa.
___________ (2001) Annual Progress Report, Specialized Financial and Promotional Institute,
December 2001: Addis Ababa.
___________ (2002) Annual Progress Report, Specialized Financial and Promotional Institute,
December 2002: Addis Ababa.
___________ (2003) Annual Progress Report, Specialized Financial and Promotional Institute,
December 2003: Addis Ababa.
___________ (2004) Annual Progress Report, Specialized Financial and Promotional Institute,
December 2004: Addis Ababa.
Simanowitz A. (2000) Clients Exit Surveys: A Tool for Understanding Client Dropout, Vol.2,
No.1, Journal of Microfinance: Brigham Young University Publications.
SUM (2002) Microfinance Distance Learning Course: United Nations, United States of America.
86
Tassew W. (2005) The Impact of Dedebit Credit and Savings Institution on Poverty Reduction
and Community Development in Gebrehiot A. (ed). AEMFI: Ethiopia.
_______ (2004) New Pro-poor Policies, Pre-PRSP Experiences and the 2003-04 Budget in
Relation to Agriculture and Food Security in Ethiopia. Department of Economics,
Addis Ababa University: Addis Ababa.
Tesfaye W.G. (2003) Finance and Development: Microfinance and Poverty Alleviation, The
African Economist Bi-Monthly Bulletin Vol.17, (19).
Todaro M.P. (1997) Economic Development, 6th
(edn.). Third Impression: New York.
Tsegaye A. (2005) Ethiopian Microfinance Institution’s Performance Analysis Report. Bulletin
1, AEMFI: Addis Ababa, Ethiopia.
Tsehay T. and Mengistu B. (2002) The Impact of Microfinance Services Among Poor Women in
Ethiopia. Association of Ethiopian Microfinance Institution Occasional Paper
No.6: Addis Ababa, Ethiopia.
UNDP (2003) Human Development Report 2003: Millennium Development Goals. New York:
Oxford University Press.
White H. (2002) Combining Quantitative and Qualitative Approaches in Poverty Analysis:
World Development 30(3).
Wolday A. (2000) Networking Microfinance Activities in Ethiopia: Challenges and Prospects.
AEMFI Proceeding of the Conference on Microfinance Development in Ethiopia:
Bahirdar.
________ (2001) Experience Sharing Visit of Ethiopian Microfinance Practitioners to
Bangladesh. Occasional Paper No.3, AEMFI: Addis Ababa.
_________ (2002) Product Development in the Ethiopian Microfinance Industry: Challenges and
Prospects. AEMFI,Occasional Paper No .4: Addis Ababa, Ethiopia.
___________ (2003) Microfinance in Ethiopia: Performance Challenges and Role in Poverty
Reduction. Association of Microfinance Institutions. Occasional paper No. 7,
AEMFI: Addis Ababa, Ethiopia.
___________ (2005) Prudential Regulation of the Microfinance Industry: Lessons from
Ethiopia. Occasional No. 15, AEMFI: Addis Ababa, Ethiopia.
World Bank (1990) World Development Report. New York: Washington D.C.
____________ (1991) World Development Report. New York: Washington D.C
____________ (2001) Partnership for Development. New York: Washington D.C.
87
____________ (2002) Poverty Reduction and The World Bank. New York: Washington D.C.
____________ (2003) Microfinance and Poverty Assessment Tool. The World Bank:
Washington D.C.
____________ (2004) Progress in the Fight against Poverty. The World Bank: Washington D.C
World Development Report (2000/20001) Attacking Poverty. World Bank: Washington D.C.
Yaron J. (1997) What Makes Rural Finance Institutions Successful? The World Bank Research
Observer. Vol.9 No.1: World Bank, Washington D.C.
88
Annex: 1
ADDIS ABABA UNIVERSITY
SCHOOL OF GRADUATE STUDIES
REGIONAL AND LOCAL DEVELOPMENT STUDIES (RLDS)
SURVEY ON THE IMPACT OF MICROF INANCE ON POVERTY REDUCTION: THE
CASE OF SPECIALIZED FINANCIAL AND PROMOTIONAL INSTITUTE (SFPI)
INTRODUCTION
My name is Abebe Tiruneh from Addis Ababa University Regional and Local Development Studies
Department. I am working a research entitled in the impact of Microfinance Institutions in reducing
poverty in Ethiopia
I am interviewing people here in order to find out about the Impact of microfinance Institutions on
poverty Reduction. The purpose of the study is to generate information necessary for the planning
of appropriate interventions and its outputs will be used to fill the information gap and inform
decision makers, planners, researchers and practitioners about the impact of microfinance
intervention on increasing the welfare of the individual, household, enterprises as well as the
community. Therefore your honest and genuine participation by responding to the questions is
highly appreciated.
Your answers are completely confidential. Your name will not be written on this form, and will
never be used in connection with any of the information you tell me. This survey will take 30
minutes to ask the questions. Would you be willing to participate?
Thank you for your cooperation.
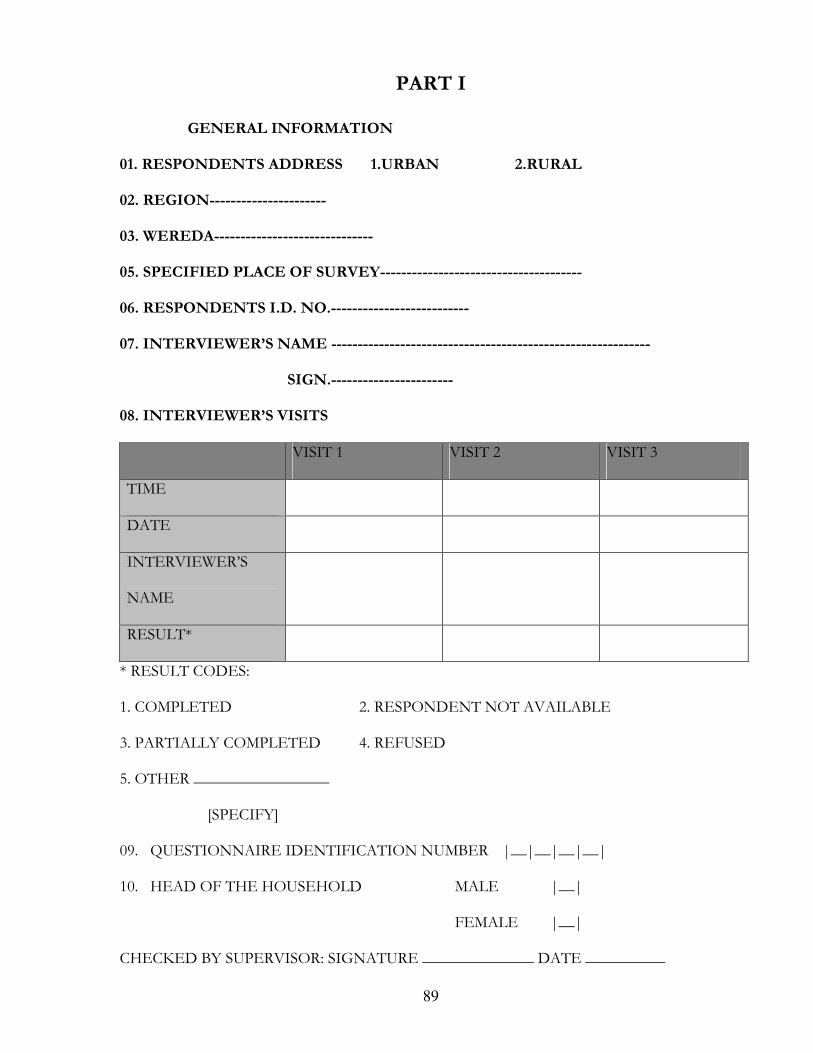
89
PART I
GENERAL INFORMATION
01. RESPONDENTS ADDRESS 1.URBAN 2.RURAL
02. REGION----------------------
03. WEREDA------------------------------
05. SPECIFIED PLACE OF SURVEY--------------------------------------
06. RESPONDENTS I.D. NO.--------------------------
07. INTERVIEWER’S NAME ------------------------------------------------------------
SIGN.-----------------------
08. INTERVIEWER’S VISITS
VISIT 1 VISIT 2 VISIT 3
TIME
DATE
INTERVIEWER’S
NAME
RESULT*
* RESULT CODES:
1. COMPLETED 2. RESPONDENT NOT AVAILABLE
3. PARTIALLY COMPLETED 4. REFUSED
5. OTHER _________________
[SPECIFY]
09. QUESTIONNAIRE IDENTIFICATION NUMBER |__|__|__|__|
10. HEAD OF THE HOUSEHOLD MALE |__|
FEMALE |__|
CHECKED BY SUPERVISOR: SIGNATURE ______________ DATE __________
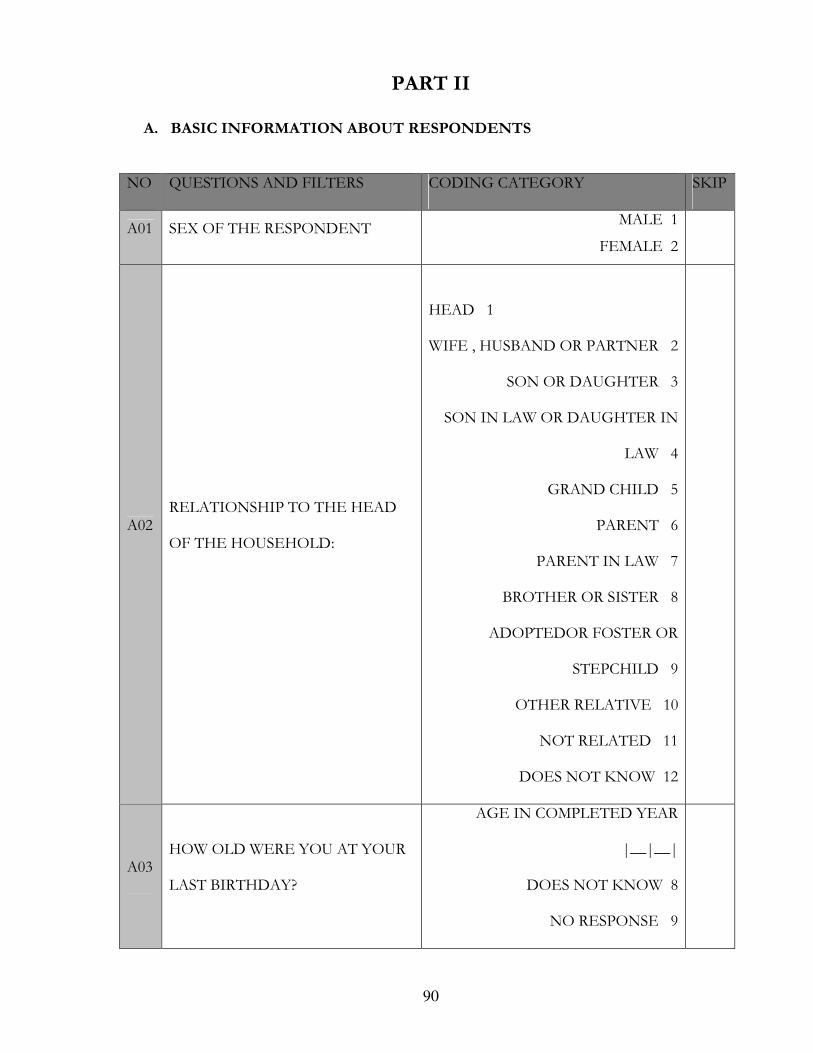
90
PART II
A. BASIC INFORMATION ABOUT RESPONDENTS
NO QUESTIONS AND FILTERS CODING CATEGORY SKIP
A01 SEX OF THE RESPONDENT MALE 1
FEMALE 2
A02 RELATIONSHIP TO THE HEAD
OF THE HOUSEHOLD:
HEAD 1
WIFE , HUSBAND OR PARTNER 2
SON OR DAUGHTER 3
SON IN LAW OR DAUGHTER IN
LAW 4
GRAND CHILD 5
PARENT 6
PARENT IN LAW 7
BROTHER OR SISTER 8
ADOPTEDOR FOSTER OR
STEPCHILD 9
OTHER RELATIVE 10
NOT RELATED 11
DOES NOT KNOW 12
A03 HOW OLD WERE YOU AT YOUR
LAST BIRTHDAY?
AGE IN COMPLETED YEAR
|__|__|
DOES NOT KNOW 8
NO RESPONSE 9
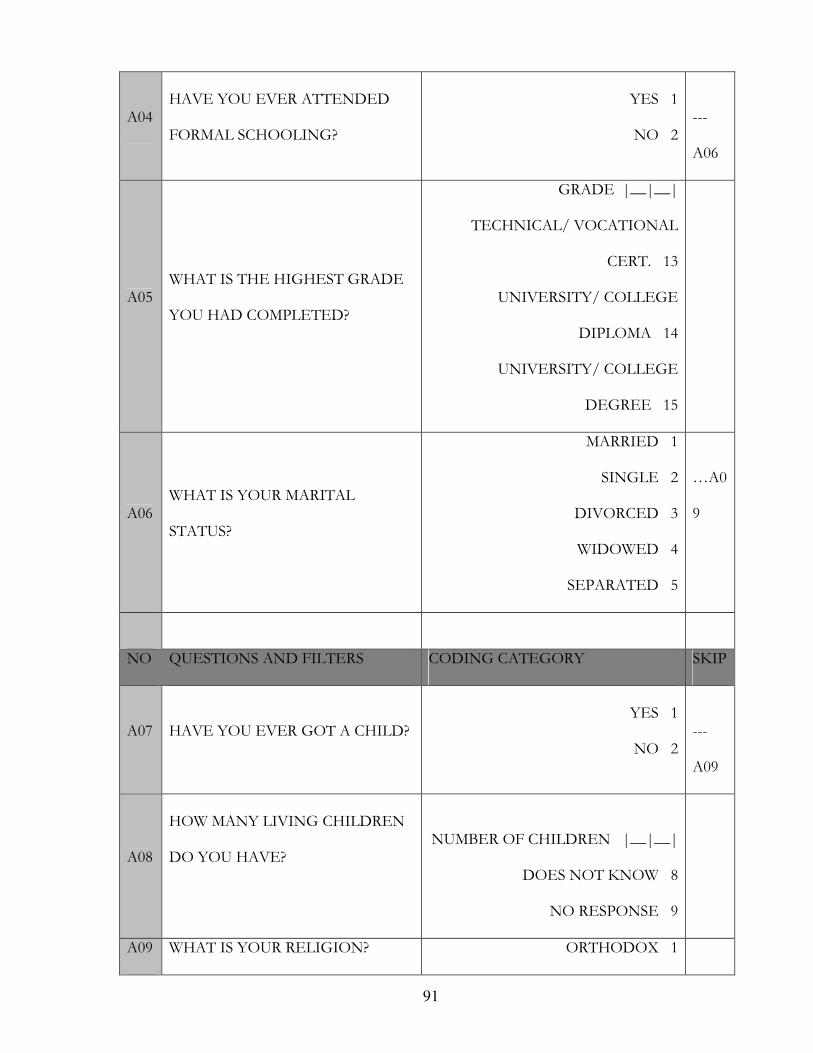
91
A04 HAVE YOU EVER ATTENDED
FORMAL SCHOOLING?
YES 1
NO 2
---
A06
A05 WHAT IS THE HIGHEST GRADE
YOU HAD COMPLETED?
GRADE |__|__|
TECHNICAL/ VOCATIONAL
CERT. 13
UNIVERSITY/ COLLEGE
DIPLOMA 14
UNIVERSITY/ COLLEGE
DEGREE 15
A06 WHAT IS YOUR MARITAL
STATUS?
MARRIED 1
SINGLE 2
DIVORCED 3
WIDOWED 4
SEPARATED 5
…A0
9
NO QUESTIONS AND FILTERS CODING CATEGORY SKIP
A07 HAVE YOU EVER GOT A CHILD? YES 1
NO 2
---
A09
A08
HOW MANY LIVING CHILDREN
DO YOU HAVE?
NUMBER OF CHILDREN |__|__|
DOES NOT KNOW 8
NO RESPONSE 9
A09 WHAT IS YOUR RELIGION? ORTHODOX 1
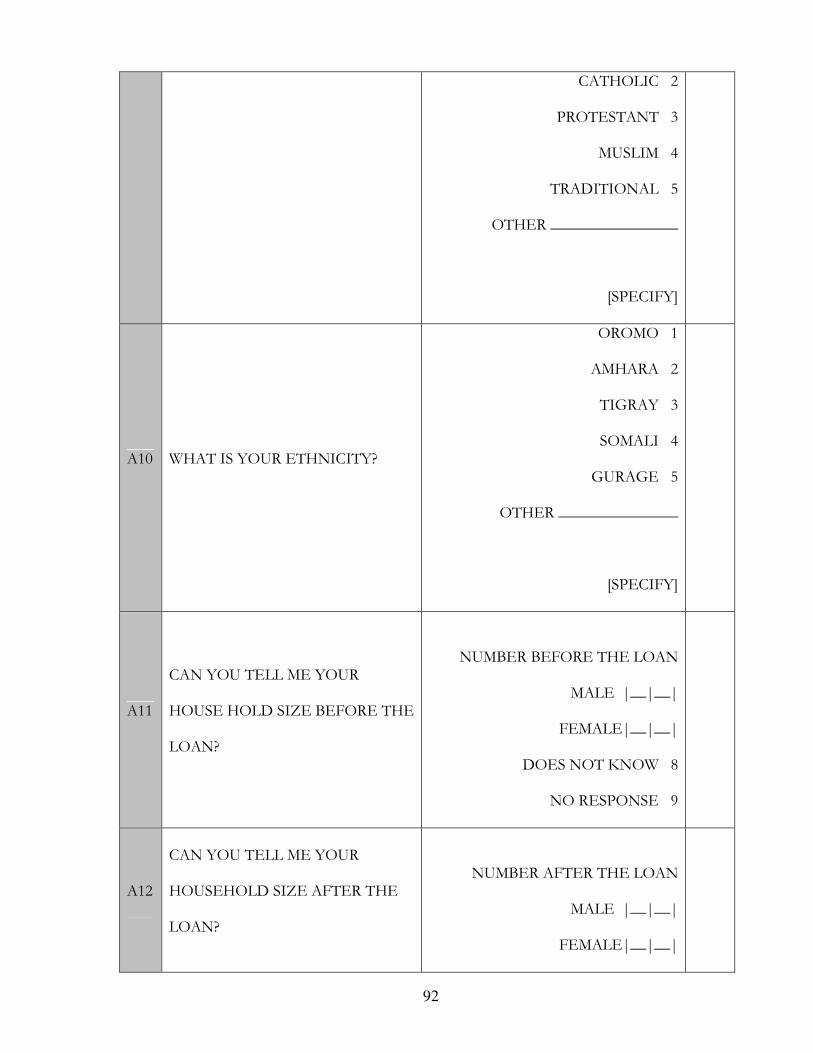
92
CATHOLIC 2
PROTESTANT 3
MUSLIM 4
TRADITIONAL 5
OTHER ________________
[SPECIFY]
A10 WHAT IS YOUR ETHNICITY?
OROMO 1
AMHARA 2
TIGRAY 3
SOMALI 4
GURAGE 5
OTHER _______________
[SPECIFY]
A11
CAN YOU TELL ME YOUR
HOUSE HOLD SIZE BEFORE THE
LOAN?
NUMBER BEFORE THE LOAN
MALE |__|__|
FEMALE|__|__|
DOES NOT KNOW 8
NO RESPONSE 9
A12
CAN YOU TELL ME YOUR
HOUSEHOLD SIZE AFTER THE
LOAN?
NUMBER AFTER THE LOAN
MALE |__|__|
FEMALE|__|__|
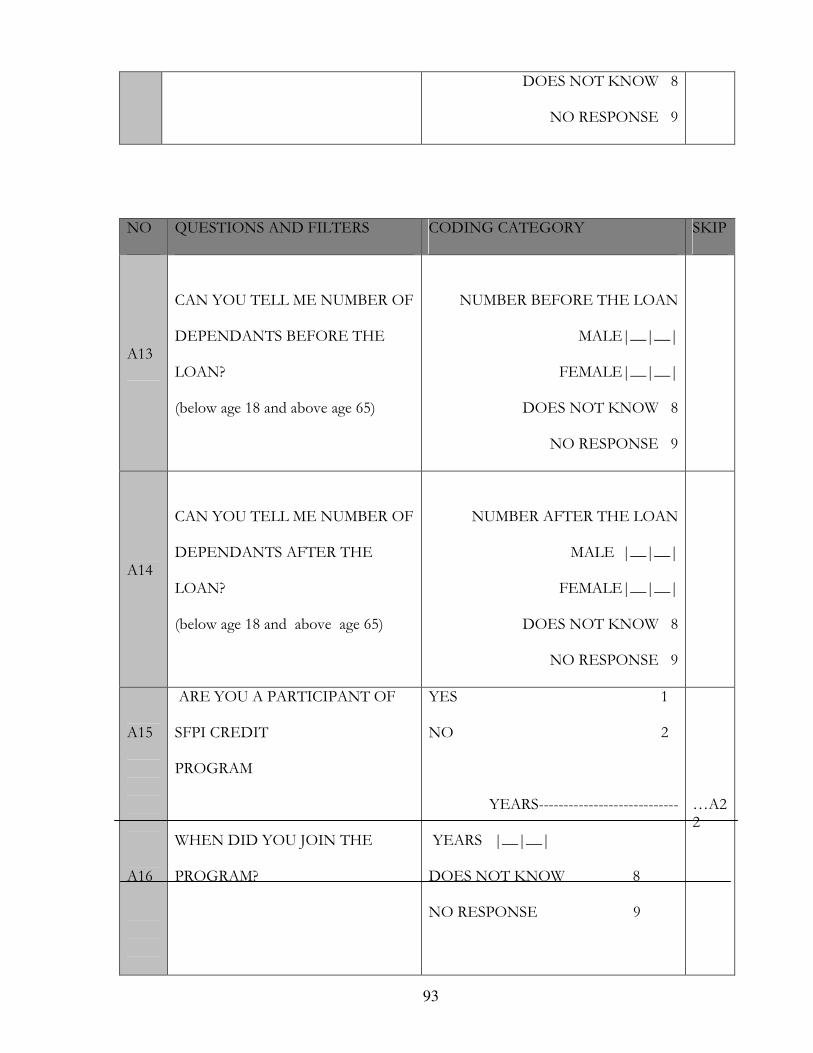
93
DOES NOT KNOW 8
NO RESPONSE 9
NO QUESTIONS AND FILTERS CODING CATEGORY SKIP
A13
CAN YOU TELL ME NUMBER OF
DEPENDANTS BEFORE THE
LOAN?
(below age 18 and above age 65)
NUMBER BEFORE THE LOAN
MALE|__|__|
FEMALE|__|__|
DOES NOT KNOW 8
NO RESPONSE 9
A14
CAN YOU TELL ME NUMBER OF
DEPENDANTS AFTER THE
LOAN?
(below age 18 and above age 65)
NUMBER AFTER THE LOAN
MALE |__|__|
FEMALE|__|__|
DOES NOT KNOW 8
NO RESPONSE 9
A15
A16
ARE YOU A PARTICIPANT OF
SFPI CREDIT
PROGRAM
WHEN DID YOU JOIN THE
PROGRAM?
YES 1
NO 2
YEARS----------------------------
YEARS |__|__|
DOES NOT KNOW 8
NO RESPONSE 9
…A22
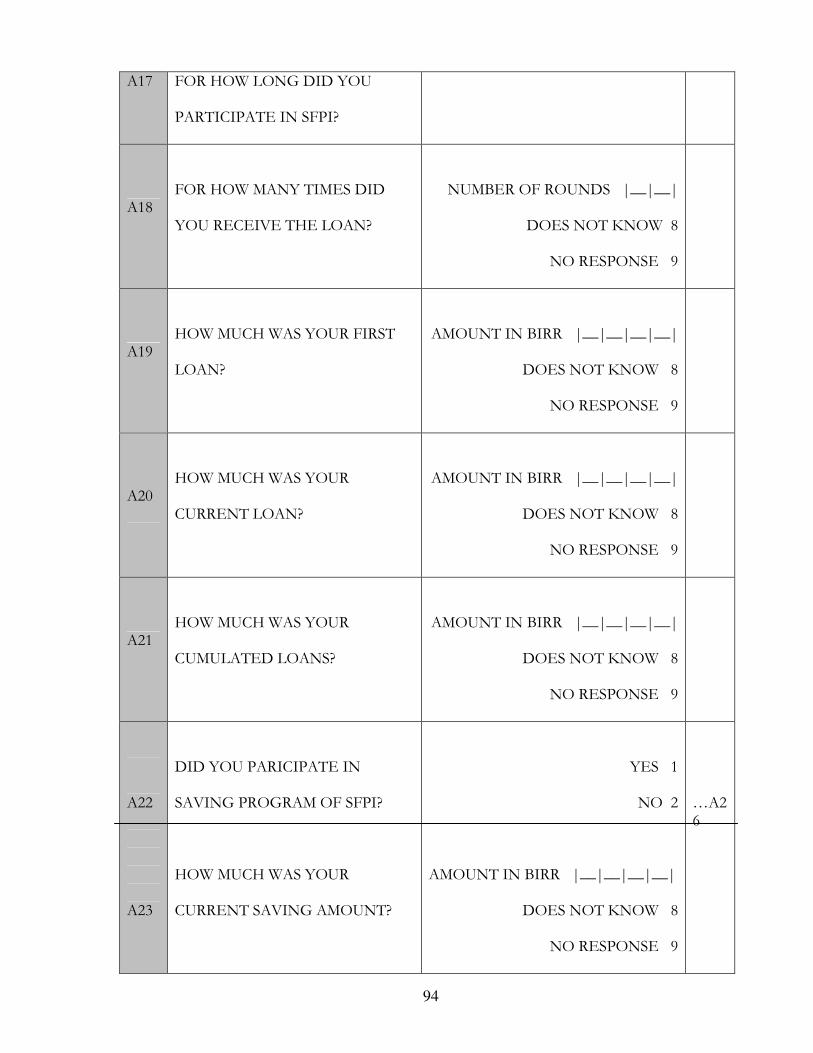
94
A17 FOR HOW LONG DID YOU
PARTICIPATE IN SFPI?
A18 FOR HOW MANY TIMES DID
YOU RECEIVE THE LOAN?
NUMBER OF ROUNDS |__|__|
DOES NOT KNOW 8
NO RESPONSE 9
A19 HOW MUCH WAS YOUR FIRST
LOAN?
AMOUNT IN BIRR |__|__|__|__|
DOES NOT KNOW 8
NO RESPONSE 9
A20 HOW MUCH WAS YOUR
CURRENT LOAN?
AMOUNT IN BIRR |__|__|__|__|
DOES NOT KNOW 8
NO RESPONSE 9
A21 HOW MUCH WAS YOUR
CUMULATED LOANS?
AMOUNT IN BIRR |__|__|__|__|
DOES NOT KNOW 8
NO RESPONSE 9
A22
A23
DID YOU PARICIPATE IN
SAVING PROGRAM OF SFPI?
HOW MUCH WAS YOUR
CURRENT SAVING AMOUNT?
YES 1
NO 2
AMOUNT IN BIRR |__|__|__|__|
DOES NOT KNOW 8
NO RESPONSE 9
…A26
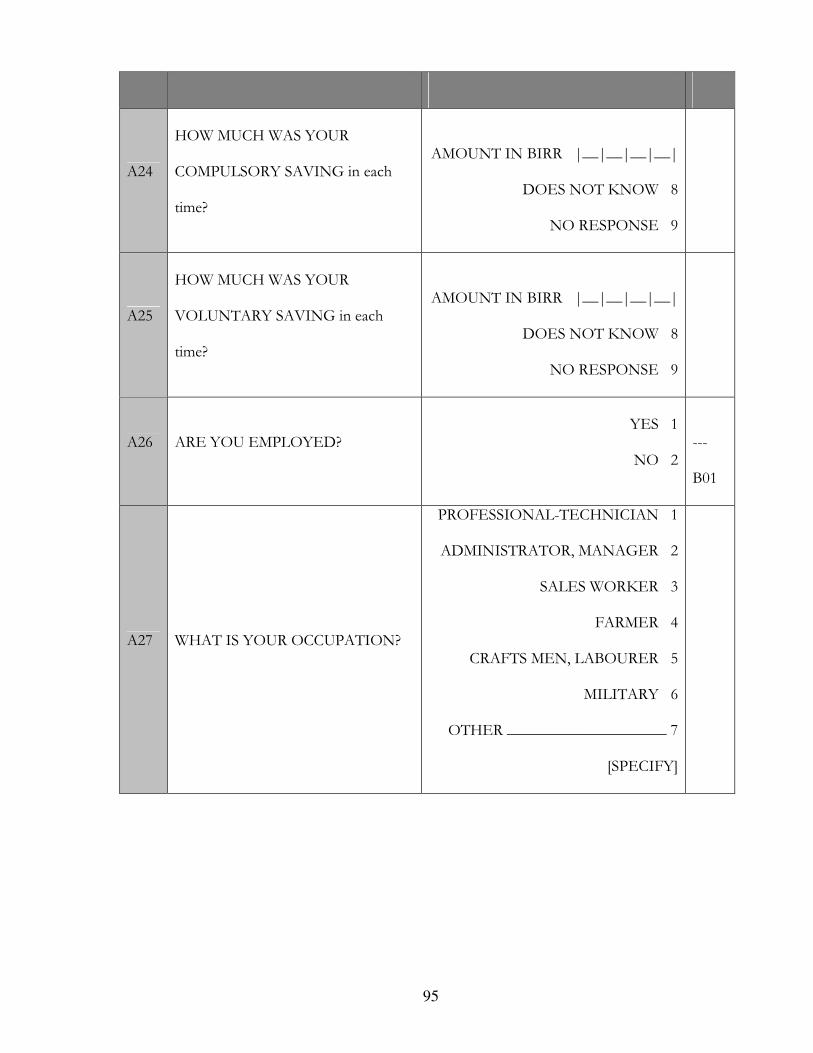
95
A24
HOW MUCH WAS YOUR
COMPULSORY SAVING in each
time?
AMOUNT IN BIRR |__|__|__|__|
DOES NOT KNOW 8
NO RESPONSE 9
A25
HOW MUCH WAS YOUR
VOLUNTARY SAVING in each
time?
AMOUNT IN BIRR |__|__|__|__|
DOES NOT KNOW 8
NO RESPONSE 9
A26 ARE YOU EMPLOYED? YES 1
NO 2
---
B01
A27 WHAT IS YOUR OCCUPATION?
PROFESSIONAL-TECHNICIAN 1
ADMINISTRATOR, MANAGER 2
SALES WORKER 3
FARMER 4
CRAFTS MEN, LABOURER 5
MILITARY 6
OTHER ____________________ 7
[SPECIFY]
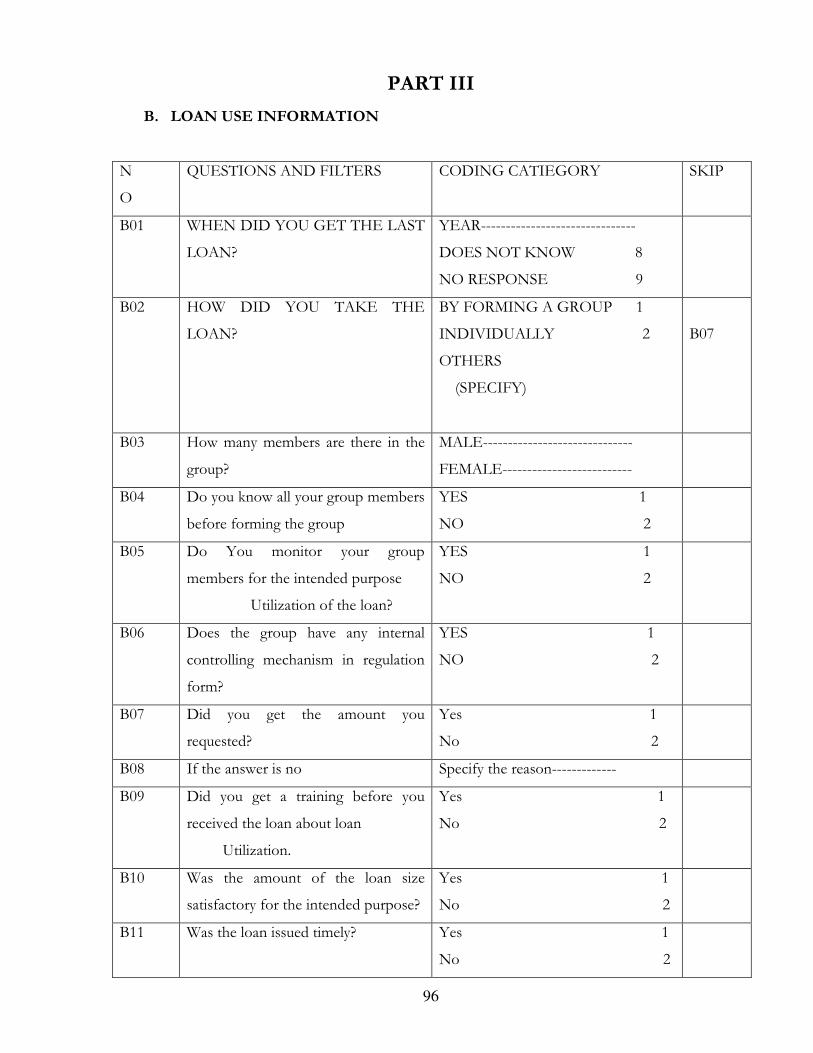
96
PART III
B. LOAN USE INFORMATION
N
O
QUESTIONS AND FILTERS CODING CATIEGORY SKIP
B01 WHEN DID YOU GET THE LAST
LOAN?
YEAR-------------------------------
DOES NOT KNOW 8
NO RESPONSE 9
B02 HOW DID YOU TAKE THE
LOAN?
BY FORMING A GROUP 1
INDIVIDUALLY 2
OTHERS
(SPECIFY)
B07
B03 How many members are there in the
group?
MALE------------------------------
FEMALE--------------------------
B04 Do you know all your group members
before forming the group
YES 1
NO 2
B05 Do You monitor your group
members for the intended purpose
Utilization of the loan?
YES 1
NO 2
B06 Does the group have any internal
controlling mechanism in regulation
form?
YES 1
NO 2
B07 Did you get the amount you
requested?
Yes 1
No 2
B08 If the answer is no Specify the reason-------------
B09 Did you get a training before you
received the loan about loan
Utilization.
Yes 1
No 2
B10 Was the amount of the loan size
satisfactory for the intended purpose?
Yes 1
No 2
B11 Was the loan issued timely? Yes 1
No 2
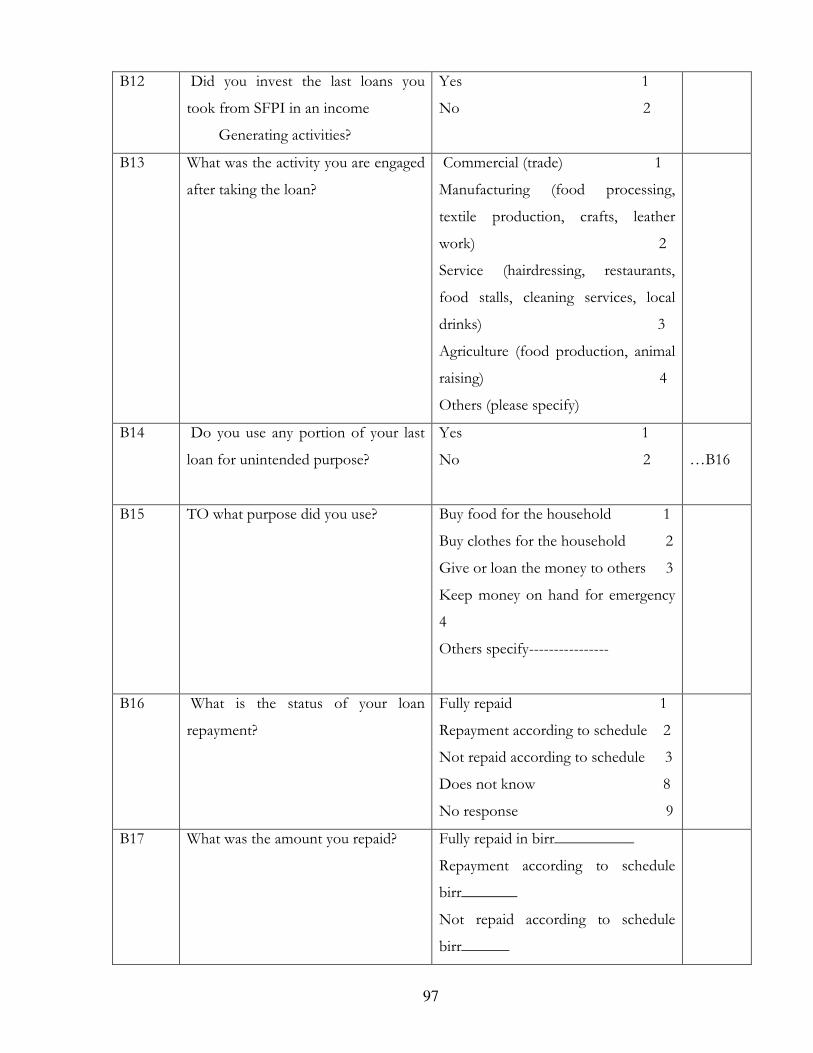
97
B12 Did you invest the last loans you
took from SFPI in an income
Generating activities?
Yes 1
No 2
B13 What was the activity you are engaged
after taking the loan?
Commercial (trade) 1
Manufacturing (food processing,
textile production, crafts, leather
work) 2
Service (hairdressing, restaurants,
food stalls, cleaning services, local
drinks) 3
Agriculture (food production, animal
raising) 4
Others (please specify)
B14 Do you use any portion of your last
loan for unintended purpose?
Yes 1
No 2
…B16
B15 TO what purpose did you use? Buy food for the household 1
Buy clothes for the household 2
Give or loan the money to others 3
Keep money on hand for emergency
4
Others specify----------------
B16 What is the status of your loan
repayment?
Fully repaid 1
Repayment according to schedule 2
Not repaid according to schedule 3
Does not know 8
No response 9
B17 What was the amount you repaid?
Fully repaid in birr__________
Repayment according to schedule
birr_______
Not repaid according to schedule
birr______
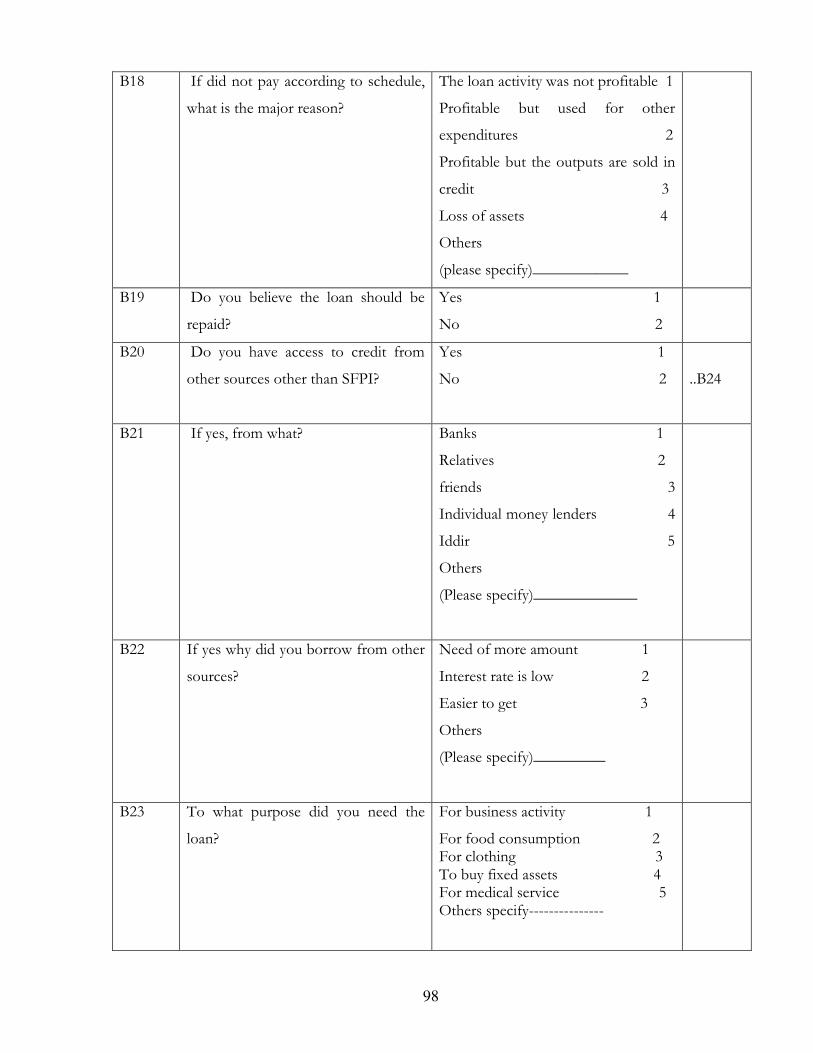
98
B18 If did not pay according to schedule,
what is the major reason?
The loan activity was not profitable 1
Profitable but used for other
expenditures 2
Profitable but the outputs are sold in
credit 3
Loss of assets 4
Others
(please specify)____________
B19 Do you believe the loan should be
repaid?
Yes 1
No 2
B20 Do you have access to credit from
other sources other than SFPI?
Yes 1
No 2
..B24
B21 If yes, from what? Banks 1
Relatives 2
friends 3
Individual money lenders 4
Iddir 5
Others
(Please specify)_____________
B22 If yes why did you borrow from other
sources?
Need of more amount 1
Interest rate is low 2
Easier to get 3
Others
(Please specify)_________
B23 To what purpose did you need the
loan?
For business activity 1
For food consumption 2 For clothing 3 To buy fixed assets 4 For medical service 5 Others specify---------------
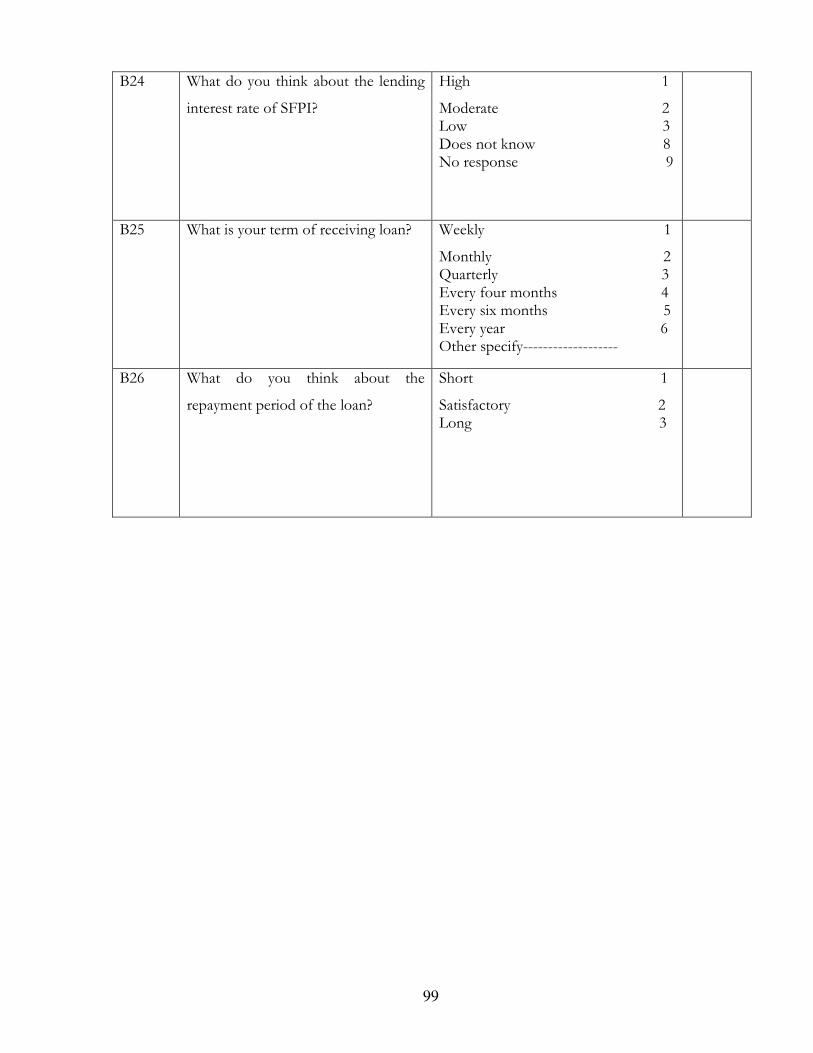
99
B24 What do you think about the lending
interest rate of SFPI?
High 1
Moderate 2 Low 3 Does not know 8 No response 9
B25 What is your term of receiving loan? Weekly 1
Monthly 2 Quarterly 3 Every four months 4 Every six months 5 Every year 6 Other specify-------------------
B26 What do you think about the
repayment period of the loan?
Short 1
Satisfactory 2 Long 3
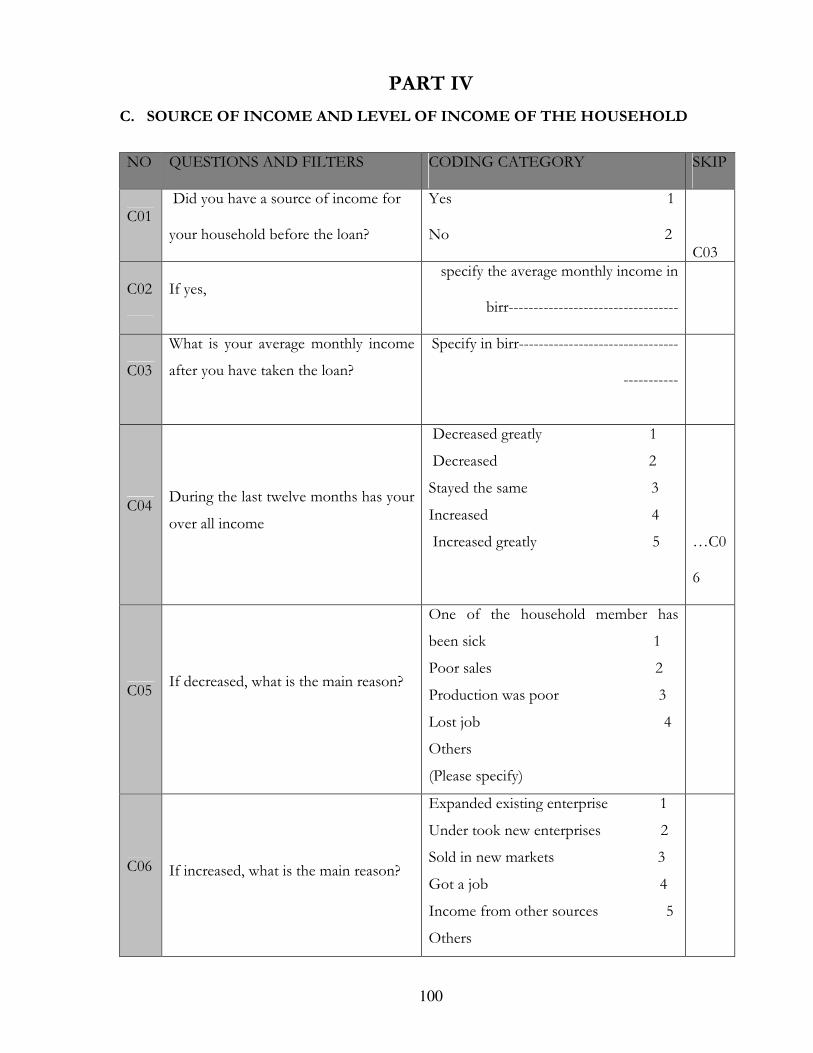
100
PART IV
C. SOURCE OF INCOME AND LEVEL OF INCOME OF THE HOUSEHOLD
NO QUESTIONS AND FILTERS CODING CATEGORY SKIP
C01 Did you have a source of income for
your household before the loan?
Yes 1
No 2
C03
C02 If yes, specify the average monthly income in
birr----------------------------------
C03
What is your average monthly income
after you have taken the loan?
Specify in birr--------------------------------
-----------
C04 During the last twelve months has your
over all income
Decreased greatly 1
Decreased 2
Stayed the same 3
Increased 4
Increased greatly 5
…C0
6
C05 If decreased, what is the main reason?
One of the household member has
been sick 1
Poor sales 2
Production was poor 3
Lost job 4
Others
(Please specify)
C06 If increased, what is the main reason?
Expanded existing enterprise 1
Under took new enterprises 2
Sold in new markets 3
Got a job 4
Income from other sources 5
Others
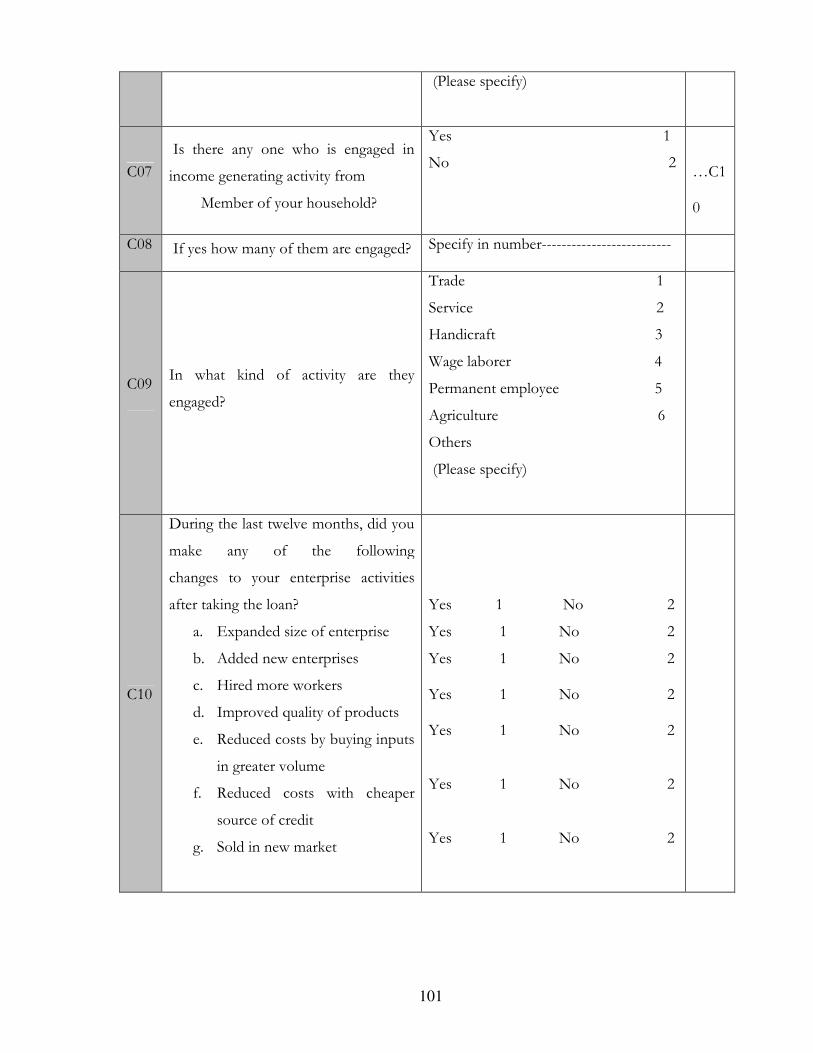
101
(Please specify)
C07 Is there any one who is engaged in
income generating activity from
Member of your household?
Yes 1
No 2
…C1
0
C08 If yes how many of them are engaged? Specify in number--------------------------
C09 In what kind of activity are they
engaged?
Trade 1
Service 2
Handicraft 3
Wage laborer 4
Permanent employee 5
Agriculture 6
Others
(Please specify)
C10
During the last twelve months, did you
make any of the following
changes to your enterprise activities
after taking the loan?
a. Expanded size of enterprise
b. Added new enterprises
c. Hired more workers
d. Improved quality of products
e. Reduced costs by buying inputs
in greater volume
f. Reduced costs with cheaper
source of credit
g. Sold in new market
Yes 1 No 2
Yes 1 No 2
Yes 1 No 2 Yes 1 No 2 Yes 1 No 2 Yes 1 No 2 Yes 1 No 2
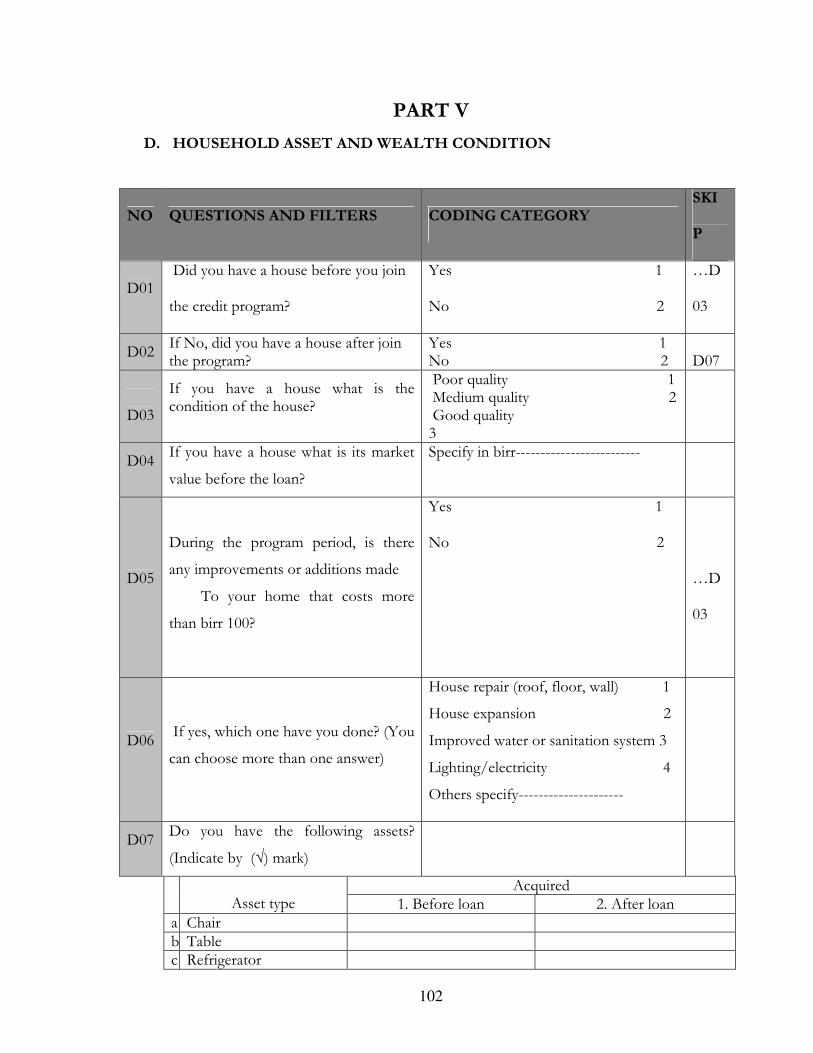
102
PART V
D. HOUSEHOLD ASSET AND WEALTH CONDITION
NO QUESTIONS AND FILTERS CODING CATEGORY SKI
P
D01 Did you have a house before you join
the credit program?
Yes 1
No 2
…D
03
D02 If No, did you have a house after join the program? Yes 1 No 2
D07
D03
If you have a house what is the condition of the house?
Poor quality 1 Medium quality 2 Good quality 3
D04 If you have a house what is its market
value before the loan?
Specify in birr-------------------------
D05
During the program period, is there
any improvements or additions made
To your home that costs more
than birr 100?
Yes 1
No 2
…D
03
D06 If yes, which one have you done? (You
can choose more than one answer)
House repair (roof, floor, wall) 1
House expansion 2
Improved water or sanitation system 3
Lighting/electricity 4
Others specify---------------------
D07 Do you have the following assets?
(Indicate by (√) mark)
Acquired Asset type 1. Before loan 2. After loan
a Chair b Table c Refrigerator
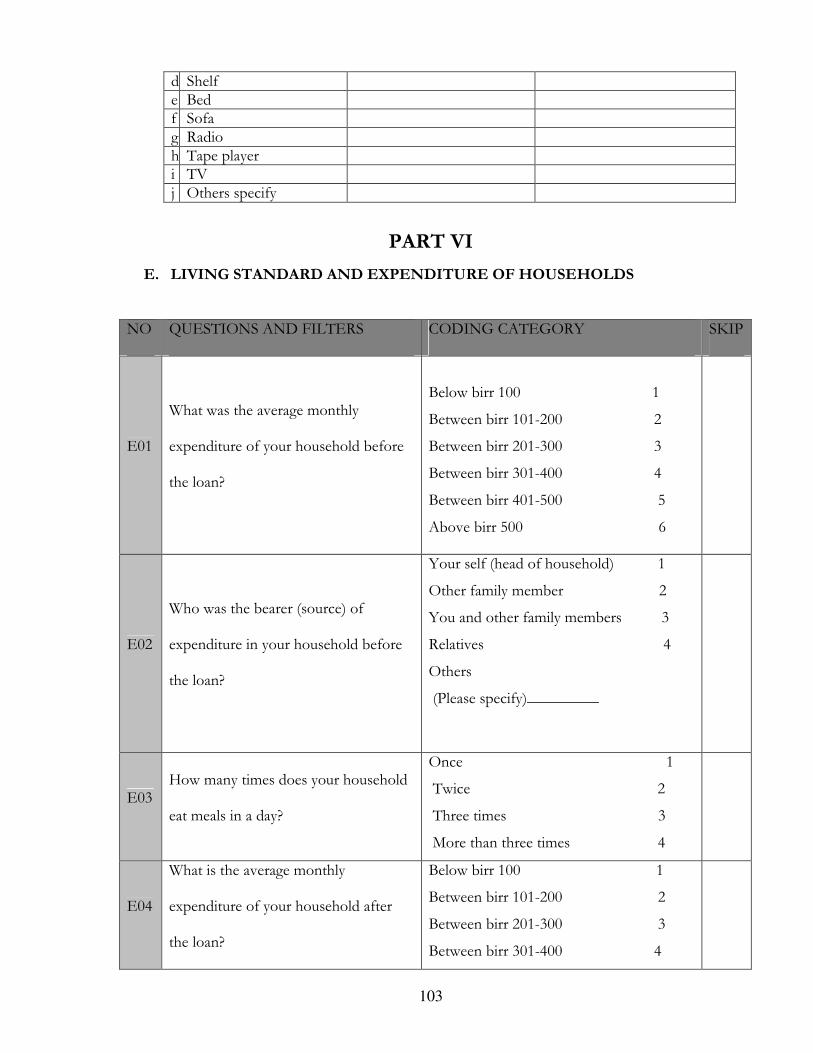
103
d Shelf e Bed f Sofa g Radio h Tape player i TV j Others specify
PART VI
E. LIVING STANDARD AND EXPENDITURE OF HOUSEHOLDS
NO QUESTIONS AND FILTERS CODING CATEGORY SKIP
E01
What was the average monthly
expenditure of your household before
the loan?
Below birr 100 1
Between birr 101-200 2
Between birr 201-300 3
Between birr 301-400 4
Between birr 401-500 5
Above birr 500 6
E02
Who was the bearer (source) of
expenditure in your household before
the loan?
Your self (head of household) 1
Other family member 2
You and other family members 3
Relatives 4
Others
(Please specify)_________
E03 How many times does your household
eat meals in a day?
Once 1
Twice 2
Three times 3
More than three times 4
E04
What is the average monthly
expenditure of your household after
the loan?
Below birr 100 1
Between birr 101-200 2
Between birr 201-300 3
Between birr 301-400 4
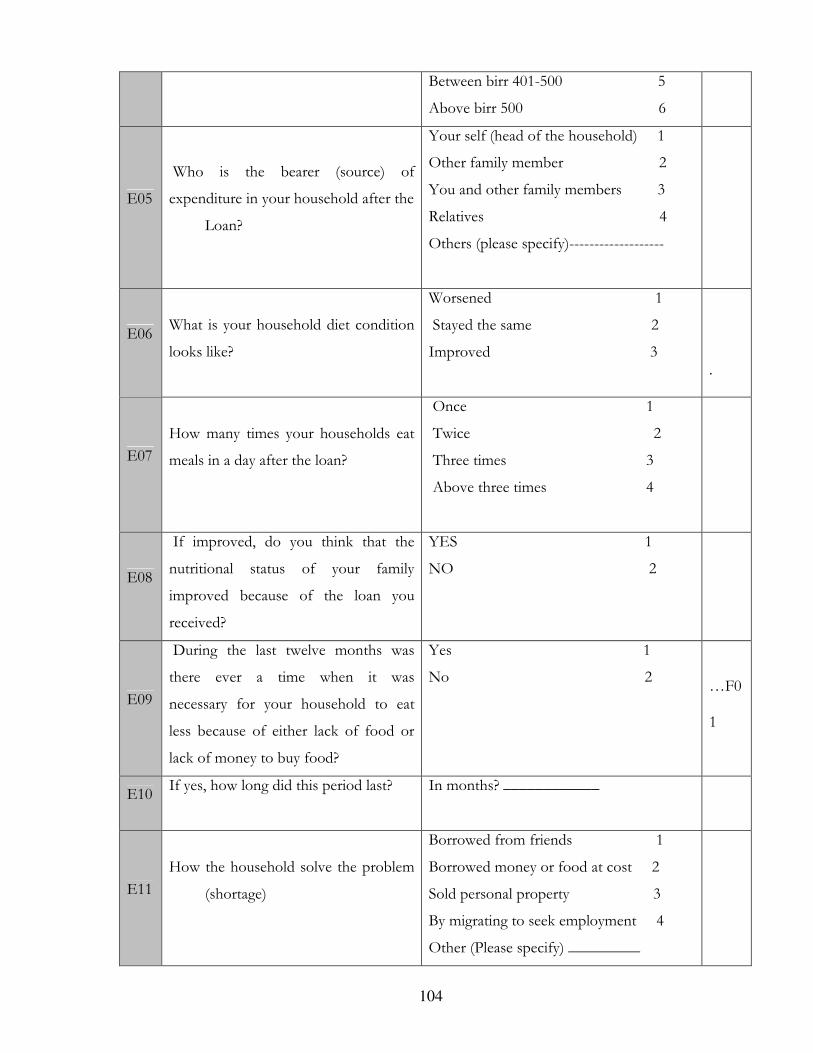
104
Between birr 401-500 5
Above birr 500 6
E05
Who is the bearer (source) of
expenditure in your household after the
Loan?
Your self (head of the household) 1
Other family member 2
You and other family members 3
Relatives 4
Others (please specify)-------------------
E06 What is your household diet condition
looks like?
Worsened 1
Stayed the same 2
Improved 3
.
E07 How many times your households eat
meals in a day after the loan?
Once 1
Twice 2
Three times 3
Above three times 4
E08
If improved, do you think that the
nutritional status of your family
improved because of the loan you
received?
YES 1
NO 2
E09
During the last twelve months was
there ever a time when it was
necessary for your household to eat
less because of either lack of food or
lack of money to buy food?
Yes 1
No 2
…F0
1
E10 If yes, how long did this period last?
In months? ____________
E11 How the household solve the problem
(shortage)
Borrowed from friends 1
Borrowed money or food at cost 2
Sold personal property 3
By migrating to seek employment 4
Other (Please specify) _________
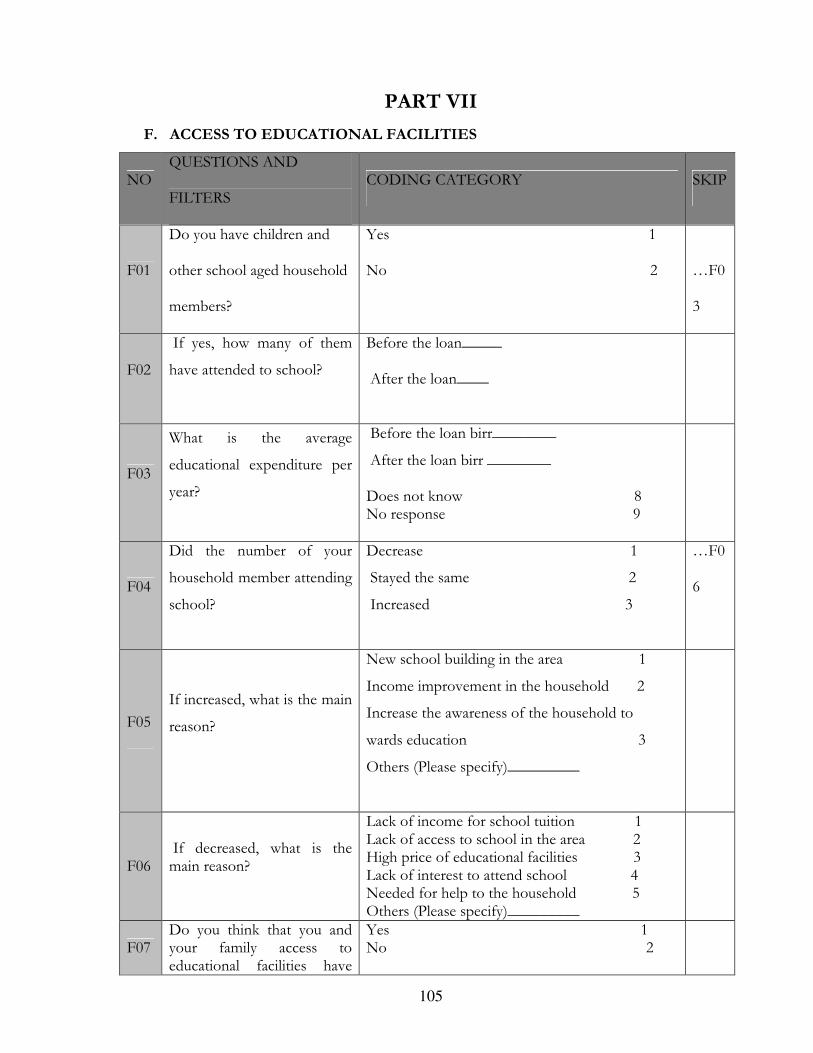
105
PART VII
F. ACCESS TO EDUCATIONAL FACILITIES
NO QUESTIONS AND
FILTERS CODING CATEGORY SKIP
F01
Do you have children and
other school aged household
members?
Yes 1
No 2
…F0
3
F02
If yes, how many of them
have attended to school?
Before the loan_____
After the loan____
F03
What is the average
educational expenditure per
year?
Before the loan birr________
After the loan birr ________
Does not know 8 No response 9
F04
Did the number of your
household member attending
school?
Decrease 1
Stayed the same 2
Increased 3
…F0
6
F05 If increased, what is the main
reason?
New school building in the area 1
Income improvement in the household 2
Increase the awareness of the household to
wards education 3
Others (Please specify)_________
F06 If decreased, what is the main reason?
Lack of income for school tuition 1 Lack of access to school in the area 2 High price of educational facilities 3 Lack of interest to attend school 4 Needed for help to the household 5 Others (Please specify)_________
F07 Do you think that you and your family access to educational facilities have
Yes 1 No 2
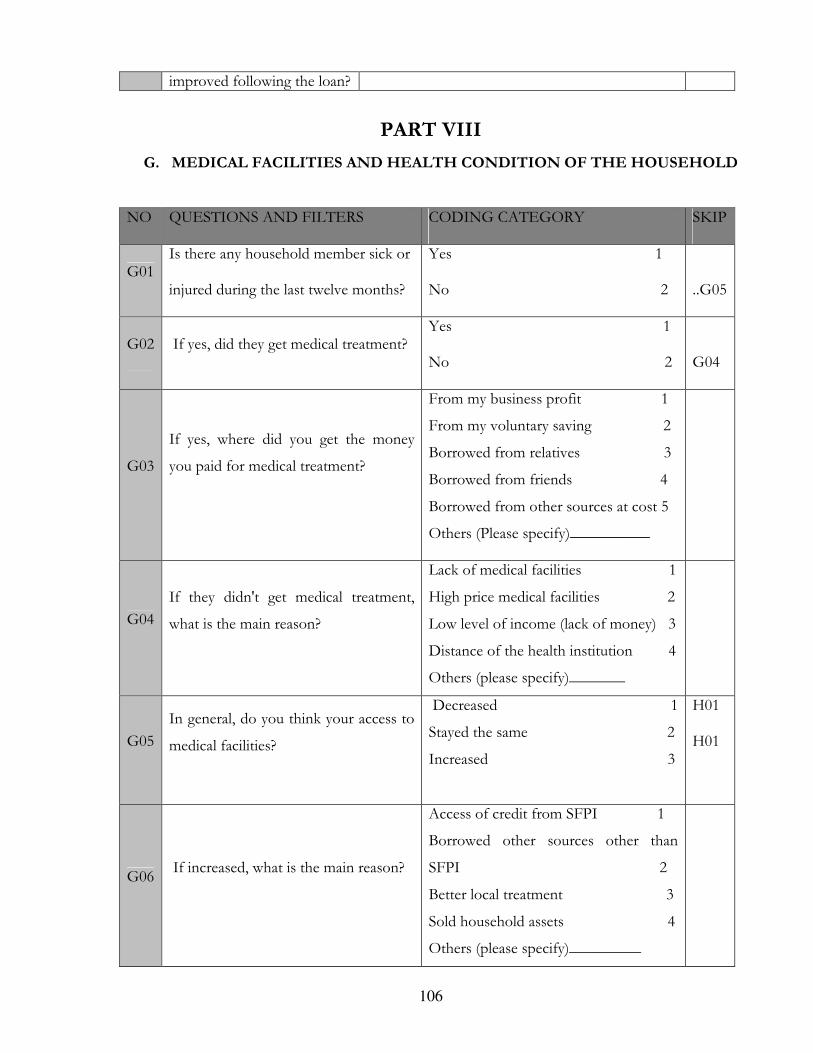
106
improved following the loan?
PART VIII
G. MEDICAL FACILITIES AND HEALTH CONDITION OF THE HOUSEHOLD
NO QUESTIONS AND FILTERS CODING CATEGORY SKIP
G01 Is there any household member sick or
injured during the last twelve months?
Yes 1
No 2
..G05
G02 If yes, did they get medical treatment? Yes 1
No 2
G04
G03
If yes, where did you get the money
you paid for medical treatment?
From my business profit 1
From my voluntary saving 2
Borrowed from relatives 3
Borrowed from friends 4
Borrowed from other sources at cost 5
Others (Please specify)__________
G04 If they didn't get medical treatment,
what is the main reason?
Lack of medical facilities 1
High price medical facilities 2
Low level of income (lack of money) 3
Distance of the health institution 4
Others (please specify)_______
G05 In general, do you think your access to
medical facilities?
Decreased 1
Stayed the same 2
Increased 3
H01
H01
G06 If increased, what is the main reason?
Access of credit from SFPI 1
Borrowed other sources other than
SFPI 2
Better local treatment 3
Sold household assets 4
Others (please specify)_________
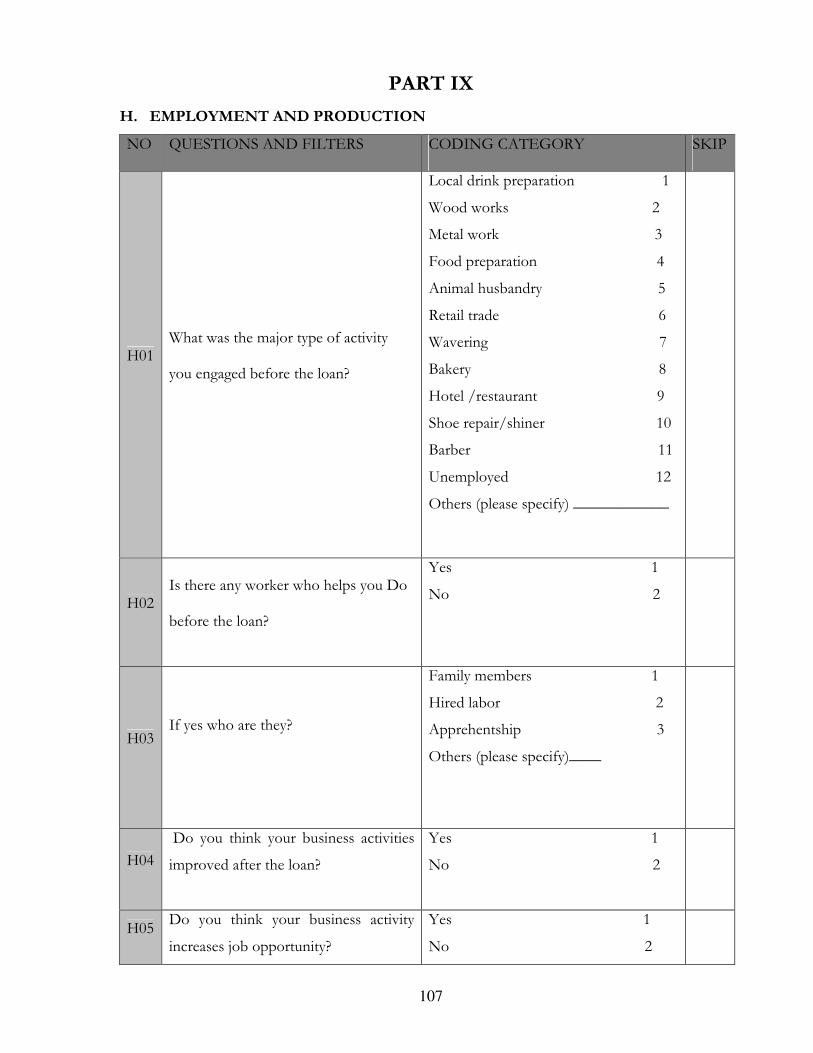
107
PART IX
H. EMPLOYMENT AND PRODUCTION
NO QUESTIONS AND FILTERS CODING CATEGORY SKIP
H01 What was the major type of activity
you engaged before the loan?
Local drink preparation 1
Wood works 2
Metal work 3
Food preparation 4
Animal husbandry 5
Retail trade 6
Wavering 7
Bakery 8
Hotel /restaurant 9
Shoe repair/shiner 10
Barber 11
Unemployed 12
Others (please specify) ____________
H02 Is there any worker who helps you Do
before the loan?
Yes 1
No 2
H03 If yes who are they?
Family members 1
Hired labor 2
Apprehentship 3
Others (please specify)____
H04 Do you think your business activities
improved after the loan?
Yes 1
No 2
H05 Do you think your business activity
increases job opportunity?
Yes 1
No 2
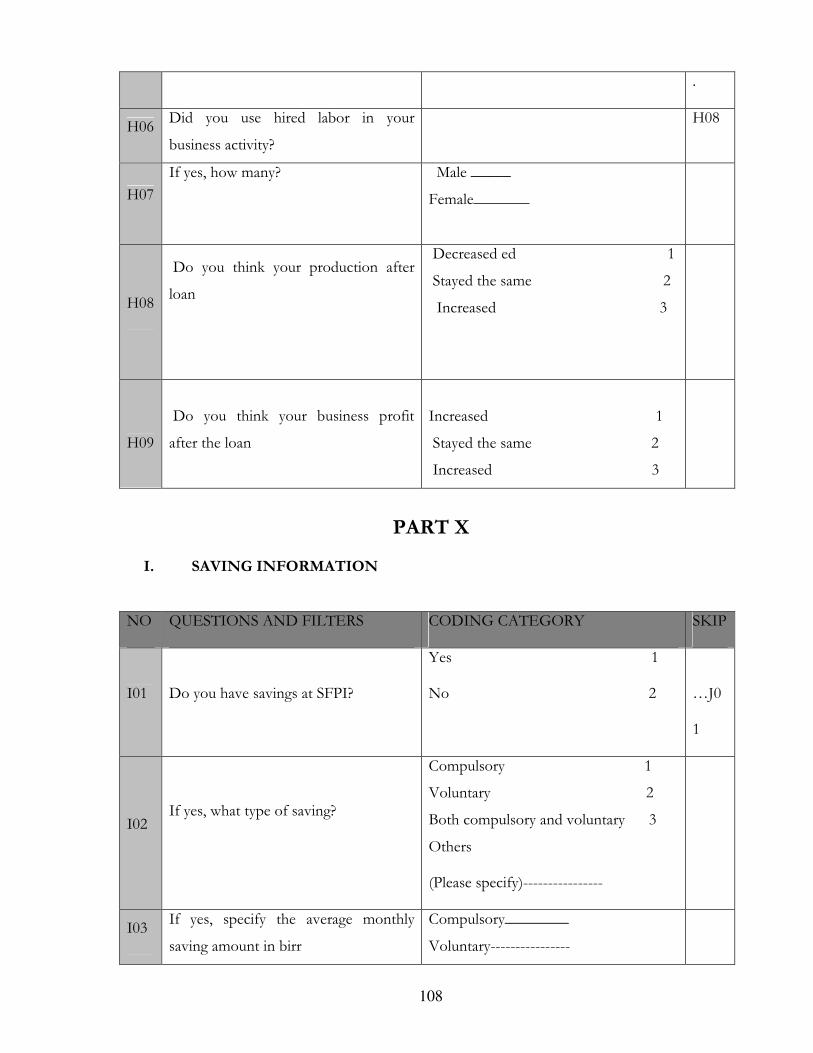
108
.
H06 Did you use hired labor in your
business activity?
H08
H07 If yes, how many?
Male _____
Female_______
H08
Do you think your production after
loan
Decreased ed 1
Stayed the same 2
Increased 3
H09
Do you think your business profit
after the loan
Increased 1
Stayed the same 2
Increased 3
PART X
I. SAVING INFORMATION
NO QUESTIONS AND FILTERS CODING CATEGORY SKIP
I01 Do you have savings at SFPI?
Yes 1
No 2
…J0
1
I02 If yes, what type of saving?
Compulsory 1
Voluntary 2
Both compulsory and voluntary 3
Others
(Please specify)----------------
I03 If yes, specify the average monthly
saving amount in birr
Compulsory________
Voluntary----------------
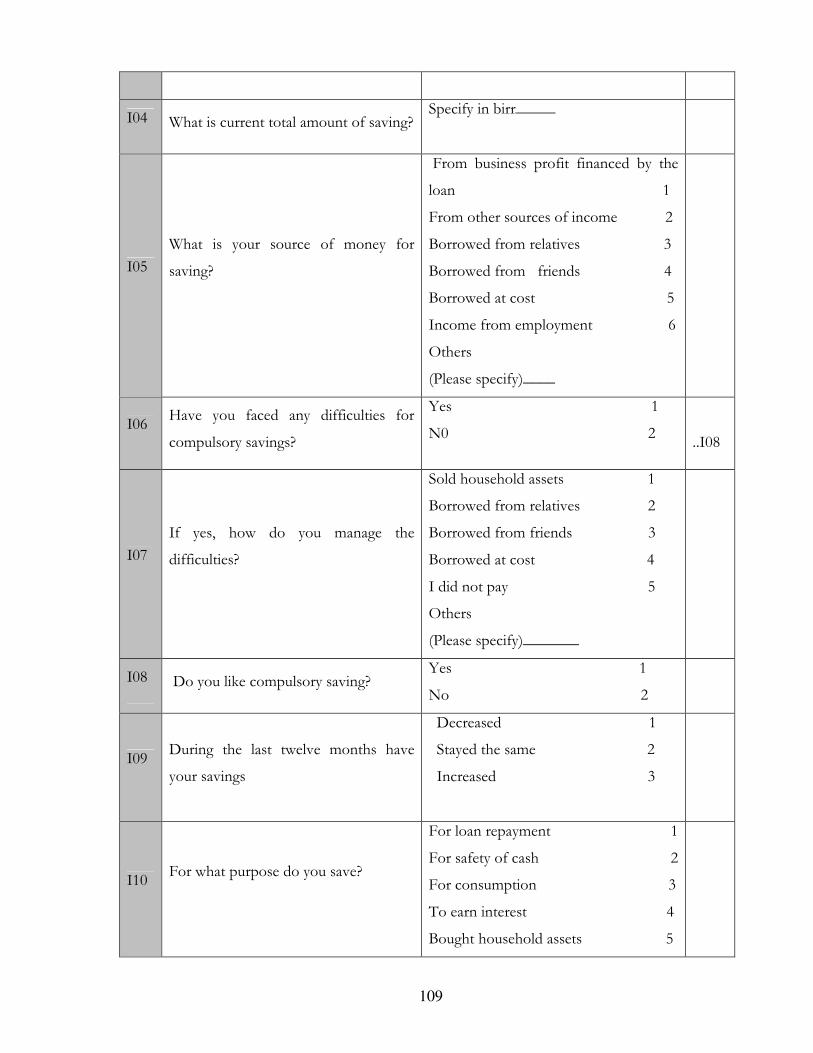
109
I04 What is current total amount of saving? Specify in birr_____
I05 What is your source of money for
saving?
From business profit financed by the
loan 1
From other sources of income 2
Borrowed from relatives 3
Borrowed from friends 4
Borrowed at cost 5
Income from employment 6
Others
(Please specify)____
I06 Have you faced any difficulties for
compulsory savings?
Yes 1
N0 2
..I08
I07 If yes, how do you manage the
difficulties?
Sold household assets 1
Borrowed from relatives 2
Borrowed from friends 3
Borrowed at cost 4
I did not pay 5
Others
(Please specify)_______
I08 Do you like compulsory saving? Yes 1
No 2
I09 During the last twelve months have
your savings
Decreased 1
Stayed the same 2
Increased 3
I10 For what purpose do you save?
For loan repayment 1
For safety of cash 2
For consumption 3
To earn interest 4
Bought household assets 5
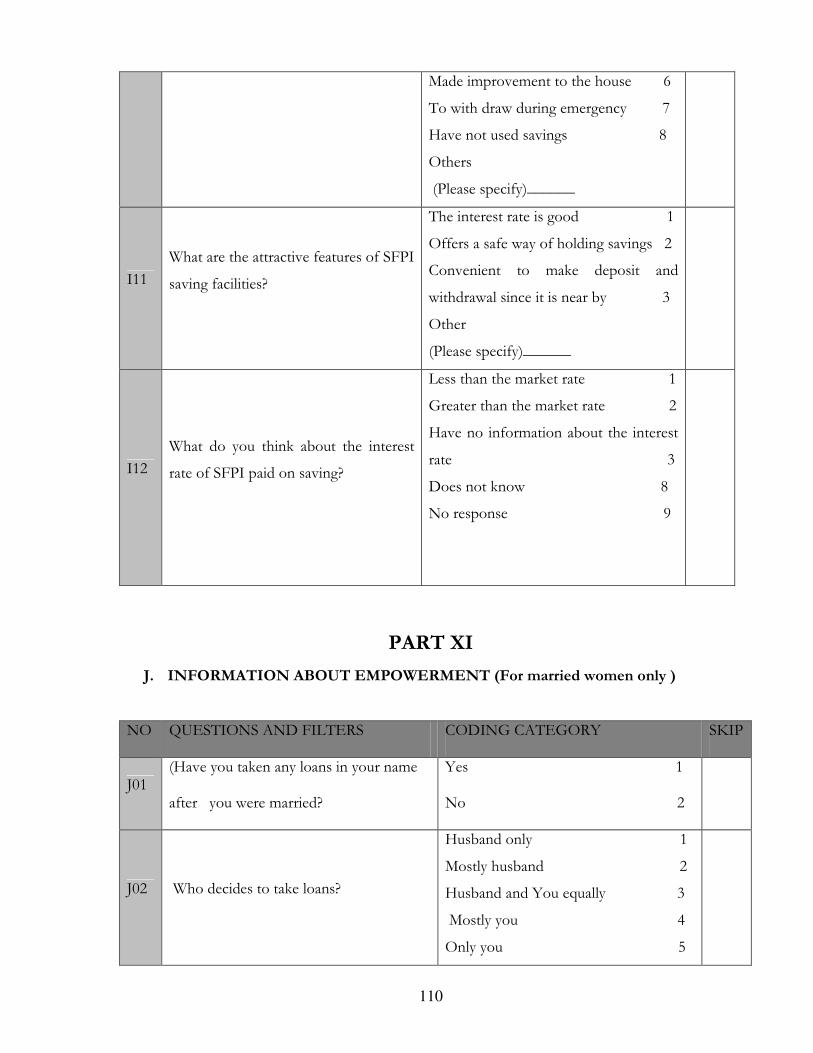
110
Made improvement to the house 6
To with draw during emergency 7
Have not used savings 8
Others
(Please specify)______
I11 What are the attractive features of SFPI
saving facilities?
The interest rate is good 1
Offers a safe way of holding savings 2
Convenient to make deposit and
withdrawal since it is near by 3
Other
(Please specify)______
I12 What do you think about the interest
rate of SFPI paid on saving?
Less than the market rate 1
Greater than the market rate 2
Have no information about the interest
rate 3
Does not know 8
No response 9
PART XI
J. INFORMATION ABOUT EMPOWERMENT (For married women only )
NO QUESTIONS AND FILTERS CODING CATEGORY SKIP
J01 (Have you taken any loans in your name
after you were married?
Yes 1
No 2
J02 Who decides to take loans?
Husband only 1
Mostly husband 2
Husband and You equally 3
Mostly you 4
Only you 5
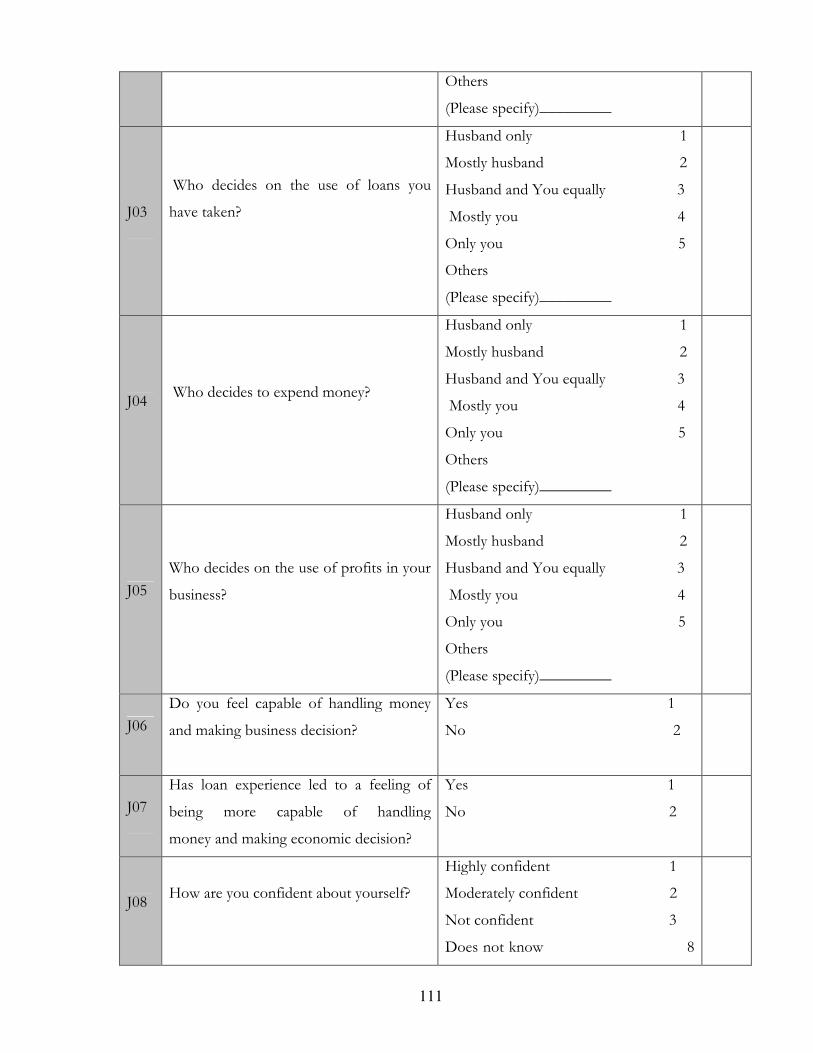
111
Others
(Please specify)_________
J03
Who decides on the use of loans you
have taken?
Husband only 1
Mostly husband 2
Husband and You equally 3
Mostly you 4
Only you 5
Others
(Please specify)_________
J04 Who decides to expend money?
Husband only 1
Mostly husband 2
Husband and You equally 3
Mostly you 4
Only you 5
Others
(Please specify)_________
J05 Who decides on the use of profits in your
business?
Husband only 1
Mostly husband 2
Husband and You equally 3
Mostly you 4
Only you 5
Others
(Please specify)_________
J06 Do you feel capable of handling money
and making business decision?
Yes 1
No 2
J07 Has loan experience led to a feeling of
being more capable of handling
money and making economic decision?
Yes 1
No 2
J08 How are you confident about yourself?
Highly confident 1
Moderately confident 2
Not confident 3
Does not know 8
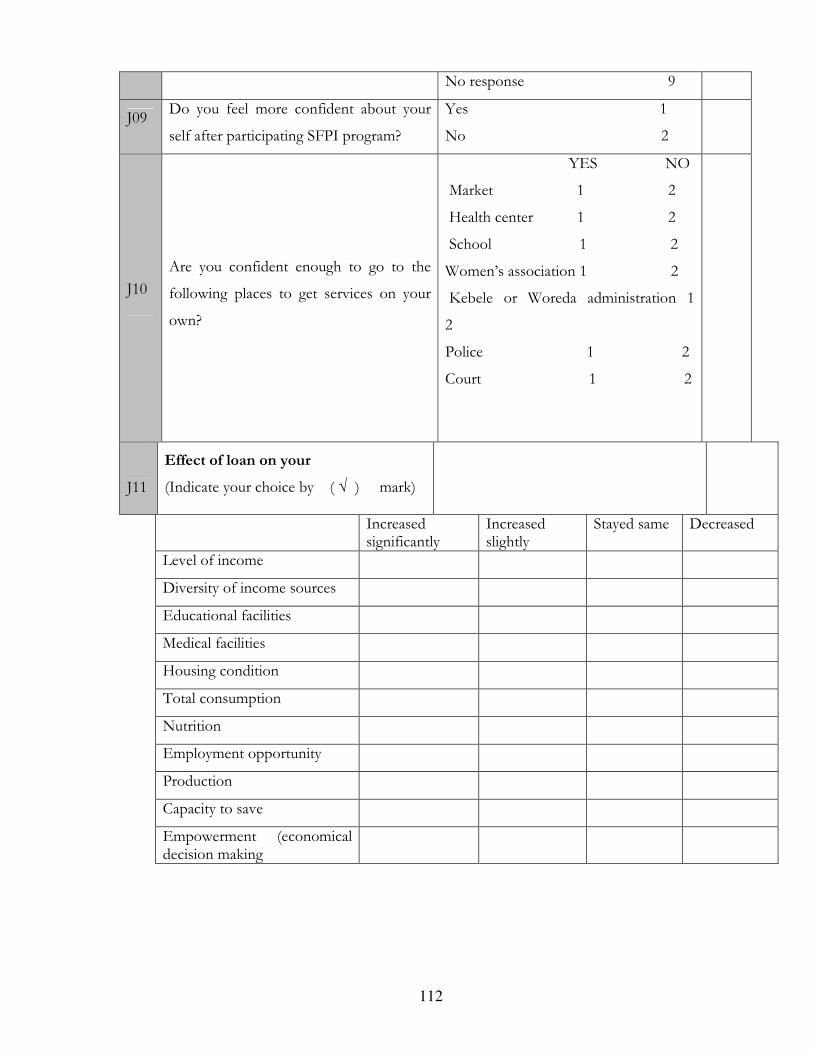
112
No response 9
J09 Do you feel more confident about your
self after participating SFPI program?
Yes 1
No 2
J10 Are you confident enough to go to the
following places to get services on your
own?
YES NO
Market 1 2
Health center 1 2
School 1 2
Women’s association 1 2
Kebele or Woreda administration 1
2
Police 1 2
Court 1 2
J11
Effect of loan on your
(Indicate your choice by ( √ ) mark)
Increased significantly
Increased slightly
Stayed same Decreased
Level of income
Diversity of income sources
Educational facilities
Medical facilities
Housing condition
Total consumption
Nutrition
Employment opportunity
Production
Capacity to save
Empowerment (economical decision making
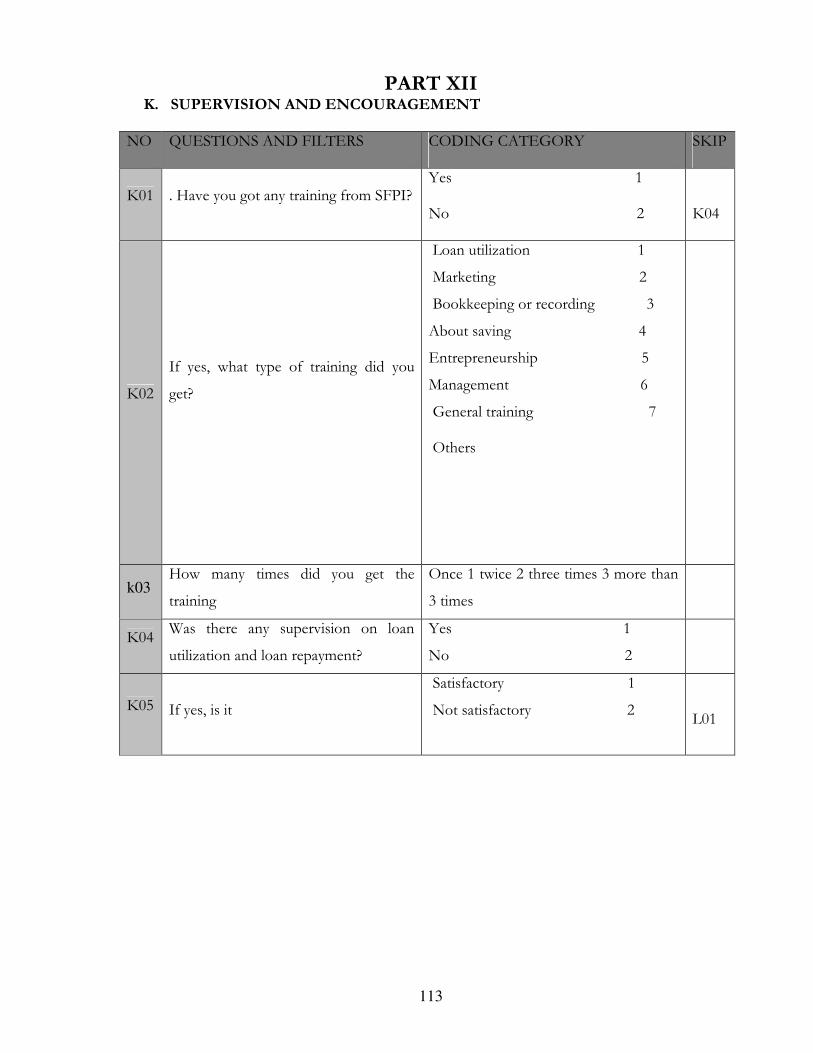
113
PART XII K. SUPERVISION AND ENCOURAGEMENT
NO QUESTIONS AND FILTERS CODING CATEGORY SKIP
K01 . Have you got any training from SFPI? Yes 1
No 2
K04
K02
If yes, what type of training did you
get?
Loan utilization 1
Marketing 2
Bookkeeping or recording 3
About saving 4
Entrepreneurship 5
Management 6
General training 7
Others
k03 How many times did you get the
training
Once 1 twice 2 three times 3 more than
3 times
K04 Was there any supervision on loan
utilization and loan repayment?
Yes 1
No 2
K05 If yes, is it
Satisfactory 1
Not satisfactory 2
L01
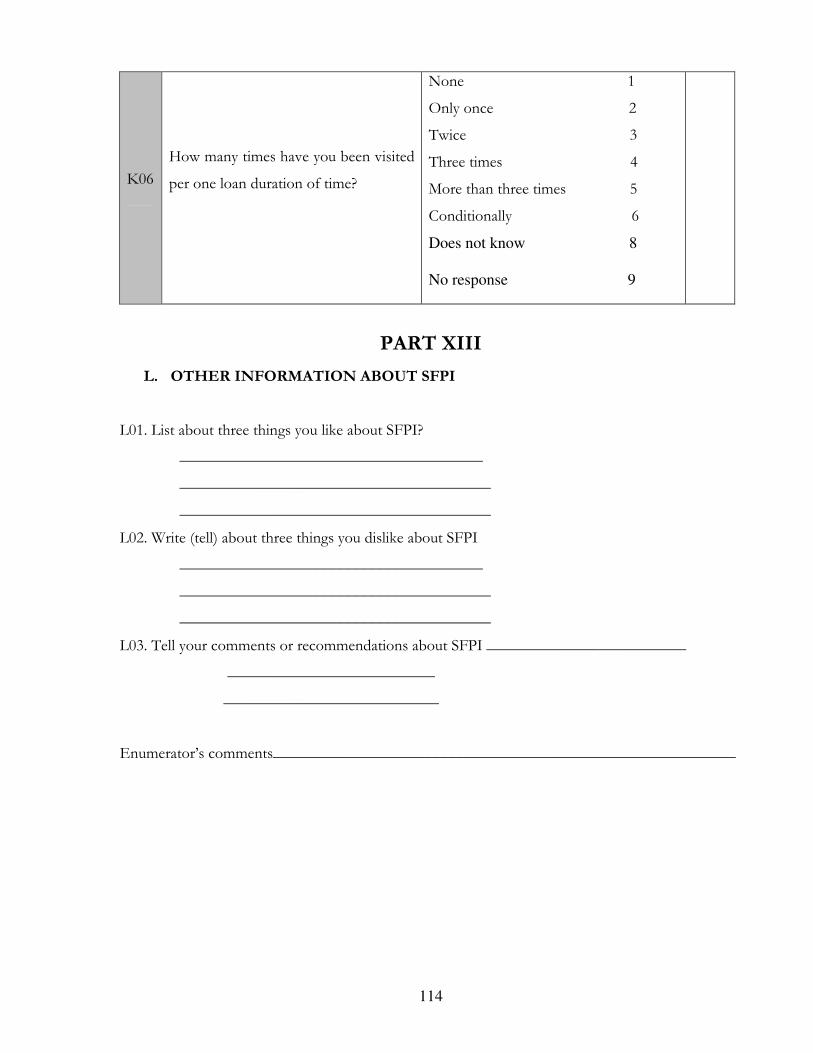
114
K06 How many times have you been visited
per one loan duration of time?
None 1
Only once 2
Twice 3
Three times 4
More than three times 5
Conditionally 6
Does not know 8
No response 9
PART XIII
L. OTHER INFORMATION ABOUT SFPI
L01. List about three things you like about SFPI?
______________________________________
_______________________________________
_______________________________________
L02. Write (tell) about three things you dislike about SFPI
______________________________________
_______________________________________
_______________________________________
L03. Tell your comments or recommendations about SFPI _________________________
__________________________
___________________________
Enumerator’s comments__________________________________________________________
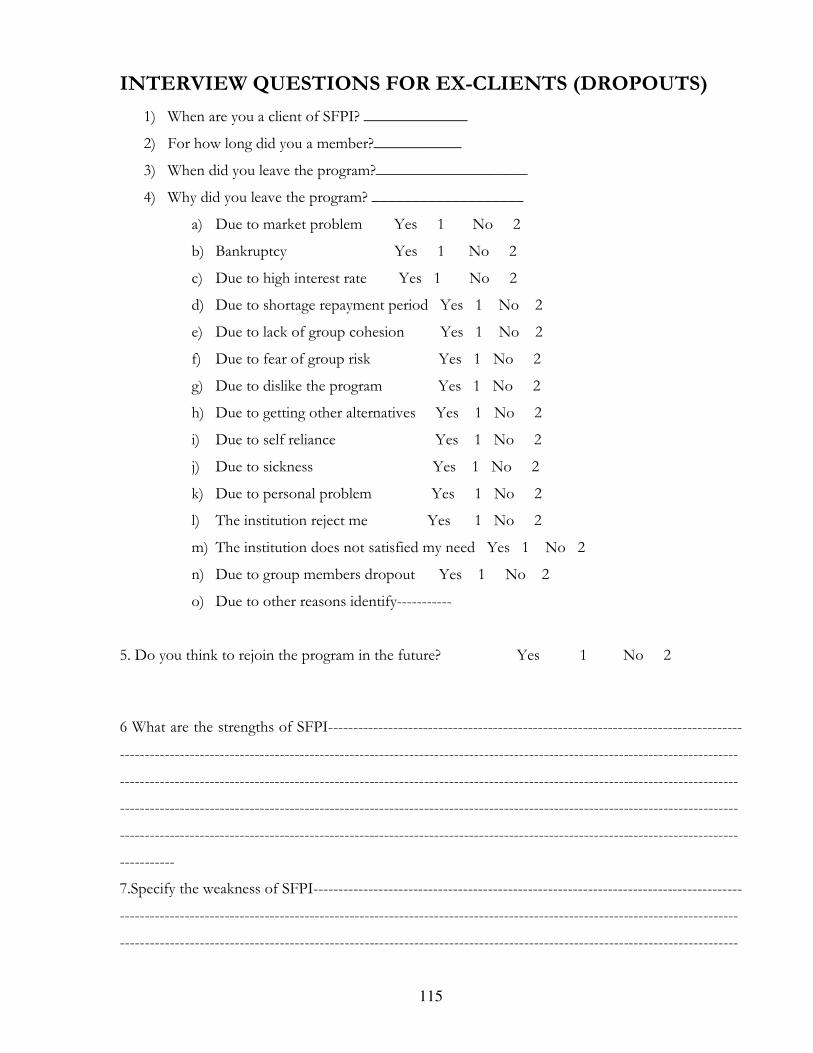
115
INTERVIEW QUESTIONS FOR EX-CLIENTS (DROPOUTS)
1) When are you a client of SFPI? _____________
2) For how long did you a member?___________
3) When did you leave the program?___________________
4) Why did you leave the program? ___________________
a) Due to market problem Yes 1 No 2
b) Bankruptcy Yes 1 No 2
c) Due to high interest rate Yes 1 No 2
d) Due to shortage repayment period Yes 1 No 2
e) Due to lack of group cohesion Yes 1 No 2
f) Due to fear of group risk Yes 1 No 2
g) Due to dislike the program Yes 1 No 2
h) Due to getting other alternatives Yes 1 No 2
i) Due to self reliance Yes 1 No 2
j) Due to sickness Yes 1 No 2
k) Due to personal problem Yes 1 No 2
l) The institution reject me Yes 1 No 2
m) The institution does not satisfied my need Yes 1 No 2
n) Due to group members dropout Yes 1 No 2
o) Due to other reasons identify-----------
5. Do you think to rejoin the program in the future? Yes 1 No 2
6 What are the strengths of SFPI-----------------------------------------------------------------------------------
----------------------------------------------------------------------------------------------------------------------------
----------------------------------------------------------------------------------------------------------------------------
----------------------------------------------------------------------------------------------------------------------------
----------------------------------------------------------------------------------------------------------------------------
-----------
7.Specify the weakness of SFPI--------------------------------------------------------------------------------------
----------------------------------------------------------------------------------------------------------------------------
----------------------------------------------------------------------------------------------------------------------------
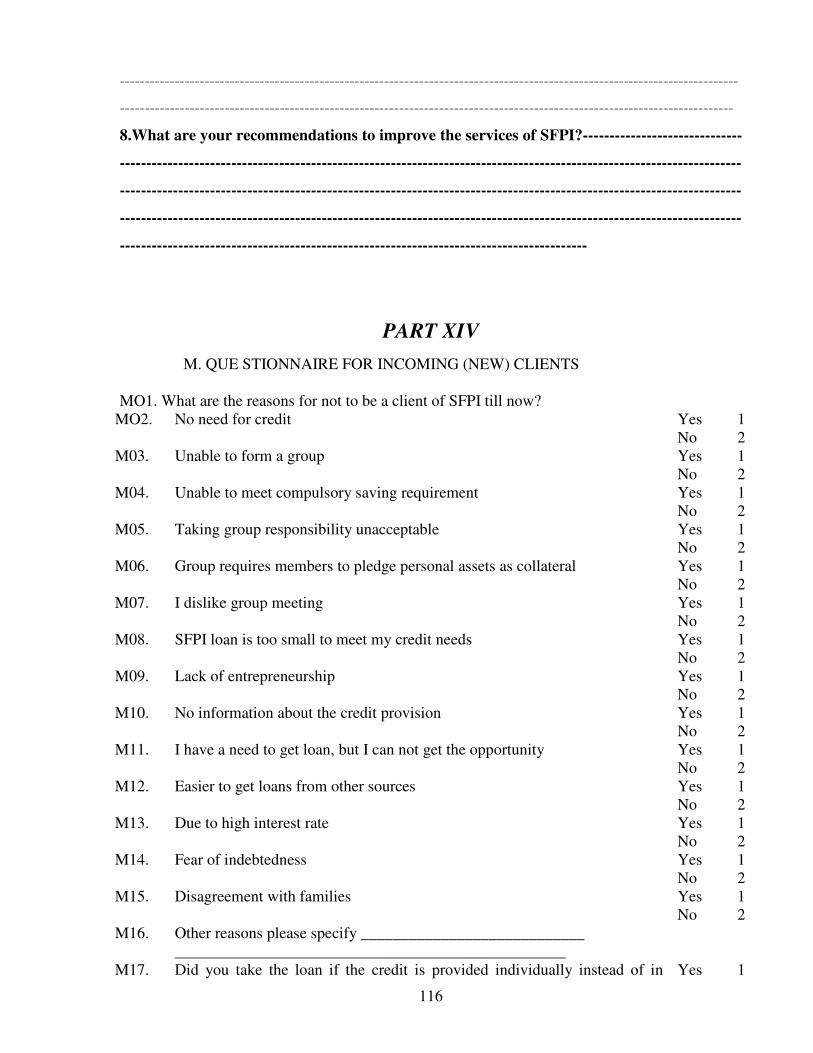
116
----------------------------------------------------------------------------------------------------------------------------
---------------------------------------------------------------------------------------------------------------------------
8.What are your recommendations to improve the services of SFPI?------------------------------
---------------------------------------------------------------------------------------------------------------------
---------------------------------------------------------------------------------------------------------------------
---------------------------------------------------------------------------------------------------------------------
----------------------------------------------------------------------------------------
PART XIV
M. QUE STIONNAIRE FOR INCOMING (NEW) CLIENTS
MO1. What are the reasons for not to be a client of SFPI till now?
MO2. No need for credit Yes 1
No 2
M03. Unable to form a group Yes 1
No 2
M04. Unable to meet compulsory saving requirement Yes 1
No 2
M05. Taking group responsibility unacceptable Yes 1
No 2
M06. Group requires members to pledge personal assets as collateral Yes 1
No 2
M07. I dislike group meeting Yes 1
No 2
M08. SFPI loan is too small to meet my credit needs Yes 1
No 2
M09. Lack of entrepreneurship Yes 1
No 2
M10. No information about the credit provision Yes 1
No 2
M11. I have a need to get loan, but I can not get the opportunity Yes 1
No 2
M12. Easier to get loans from other sources Yes 1
No 2
M13. Due to high interest rate Yes 1
No 2
M14. Fear of indebtedness Yes 1
No 2
M15. Disagreement with families Yes 1
No 2
M16. Other reasons please specify ____________________________
_________________________________________________
M17. Did you take the loan if the credit is provided individually instead of in Yes 1

117
group
No 2
M18. Are you ready to be a client of SFPI now? Yes 1
No 2
M19. If yes, specify the reasons _______________________________
___________________________________________________
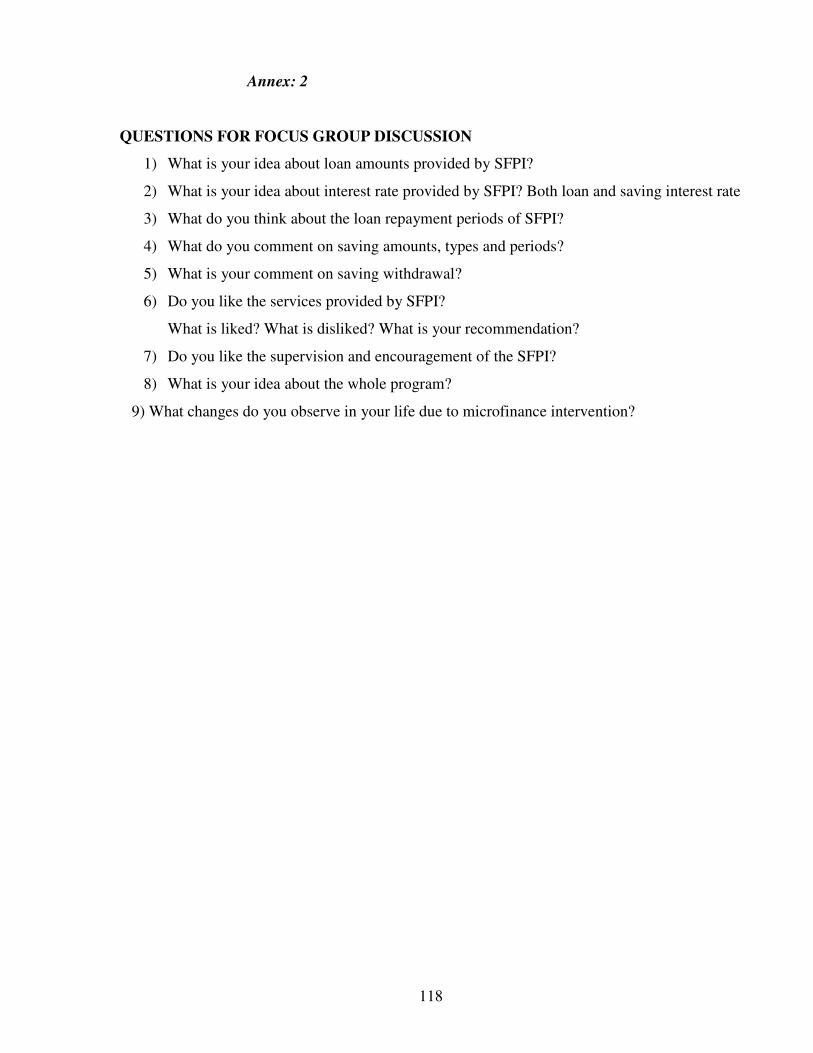
118
Annex: 2
QUESTIONS FOR FOCUS GROUP DISCUSSION
1) What is your idea about loan amounts provided by SFPI?
2) What is your idea about interest rate provided by SFPI? Both loan and saving interest rate
3) What do you think about the loan repayment periods of SFPI?
4) What do you comment on saving amounts, types and periods?
5) What is your comment on saving withdrawal?
6) Do you like the services provided by SFPI?
What is liked? What is disliked? What is your recommendation?
7) Do you like the supervision and encouragement of the SFPI?
8) What is your idea about the whole program?
9) What changes do you observe in your life due to microfinance intervention?

119
Annex: 3
Checklist for key informant interview for AEMFI officials
1. What is your opinion about the microfinance industry development?
2. What are the roles of microfinance institutions to reduce poverty in Ethiopia?
3. What are the opportunities for the development of the microfinance institutions in Ethiopia?
4. What are the challenges for the development of microfinance institutions in Ethiopia?
5. Is there any legal or policy gap in microfinance development?
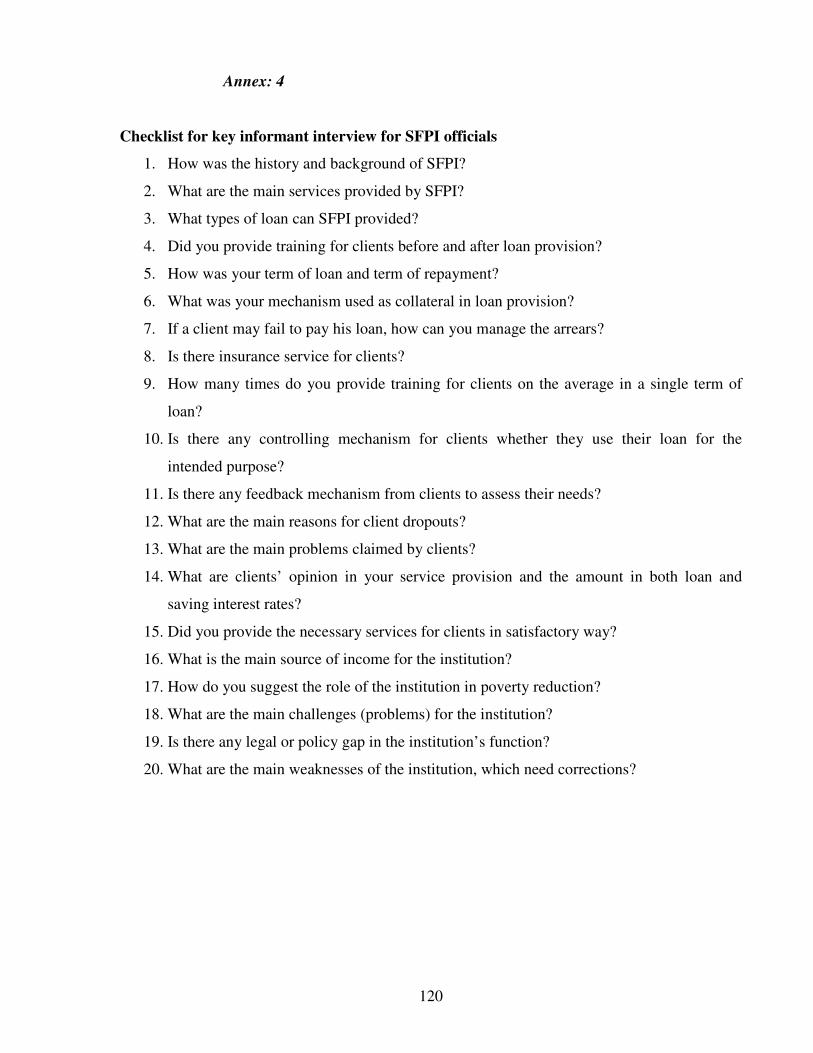
120
Annex: 4
Checklist for key informant interview for SFPI officials
1. How was the history and background of SFPI?
2. What are the main services provided by SFPI?
3. What types of loan can SFPI provided?
4. Did you provide training for clients before and after loan provision?
5. How was your term of loan and term of repayment?
6. What was your mechanism used as collateral in loan provision?
7. If a client may fail to pay his loan, how can you manage the arrears?
8. Is there insurance service for clients?
9. How many times do you provide training for clients on the average in a single term of
loan?
10. Is there any controlling mechanism for clients whether they use their loan for the
intended purpose?
11. Is there any feedback mechanism from clients to assess their needs?
12. What are the main reasons for client dropouts?
13. What are the main problems claimed by clients?
14. What are clients’ opinion in your service provision and the amount in both loan and
saving interest rates?
15. Did you provide the necessary services for clients in satisfactory way?
16. What is the main source of income for the institution?
17. How do you suggest the role of the institution in poverty reduction?
18. What are the main challenges (problems) for the institution?
19. Is there any legal or policy gap in the institution’s function?
20. What are the main weaknesses of the institution, which need corrections?
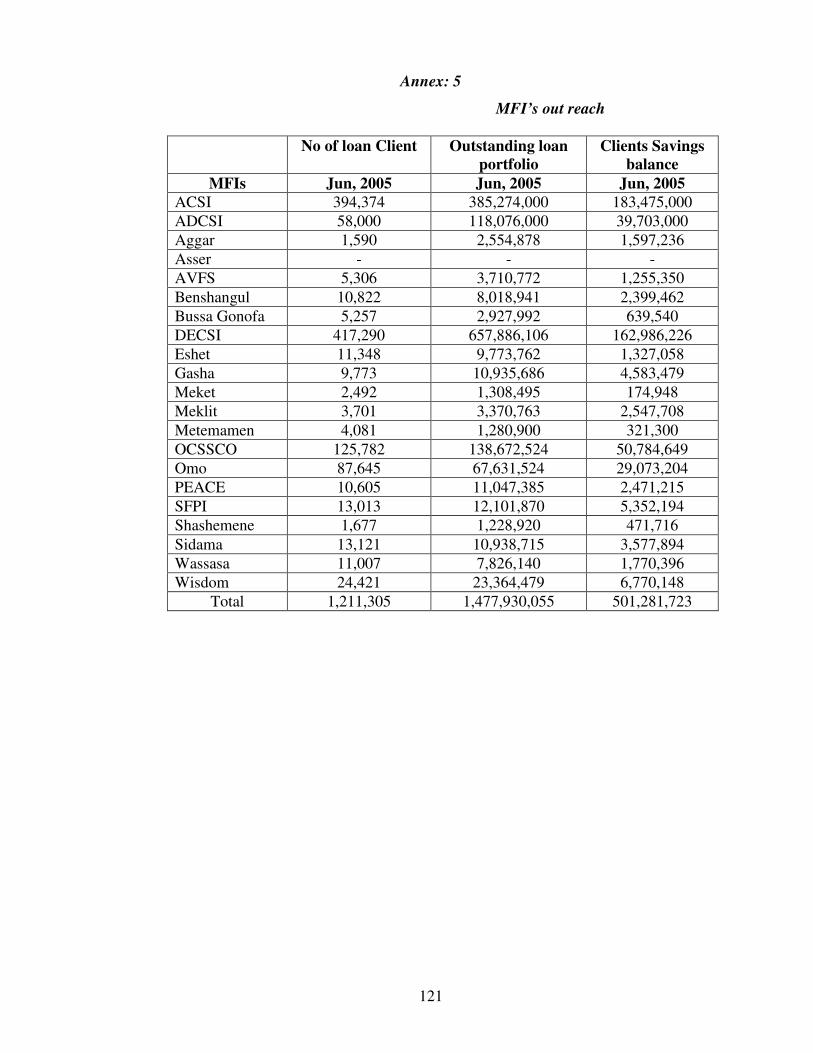
121
Annex: 5
MFI’s out reach
No of loan Client Outstanding loan
portfolio
Clients Savings
balance
MFIs Jun, 2005 Jun, 2005 Jun, 2005
ACSI 394,374 385,274,000 183,475,000
ADCSI 58,000 118,076,000 39,703,000
Aggar 1,590 2,554,878 1,597,236
Asser - - -
AVFS 5,306 3,710,772 1,255,350
Benshangul 10,822 8,018,941 2,399,462
Bussa Gonofa 5,257 2,927,992 639,540
DECSI 417,290 657,886,106 162,986,226
Eshet 11,348 9,773,762 1,327,058
Gasha 9,773 10,935,686 4,583,479
Meket 2,492 1,308,495 174,948
Meklit 3,701 3,370,763 2,547,708
Metemamen 4,081 1,280,900 321,300
OCSSCO 125,782 138,672,524 50,784,649
Omo 87,645 67,631,524 29,073,204
PEACE 10,605 11,047,385 2,471,215
SFPI 13,013 12,101,870 5,352,194
Shashemene 1,677 1,228,920 471,716
Sidama 13,121 10,938,715 3,577,894
Wassasa 11,007 7,826,140 1,770,396
Wisdom 24,421 23,364,479 6,770,148
Total 1,211,305 1,477,930,055 501,281,723
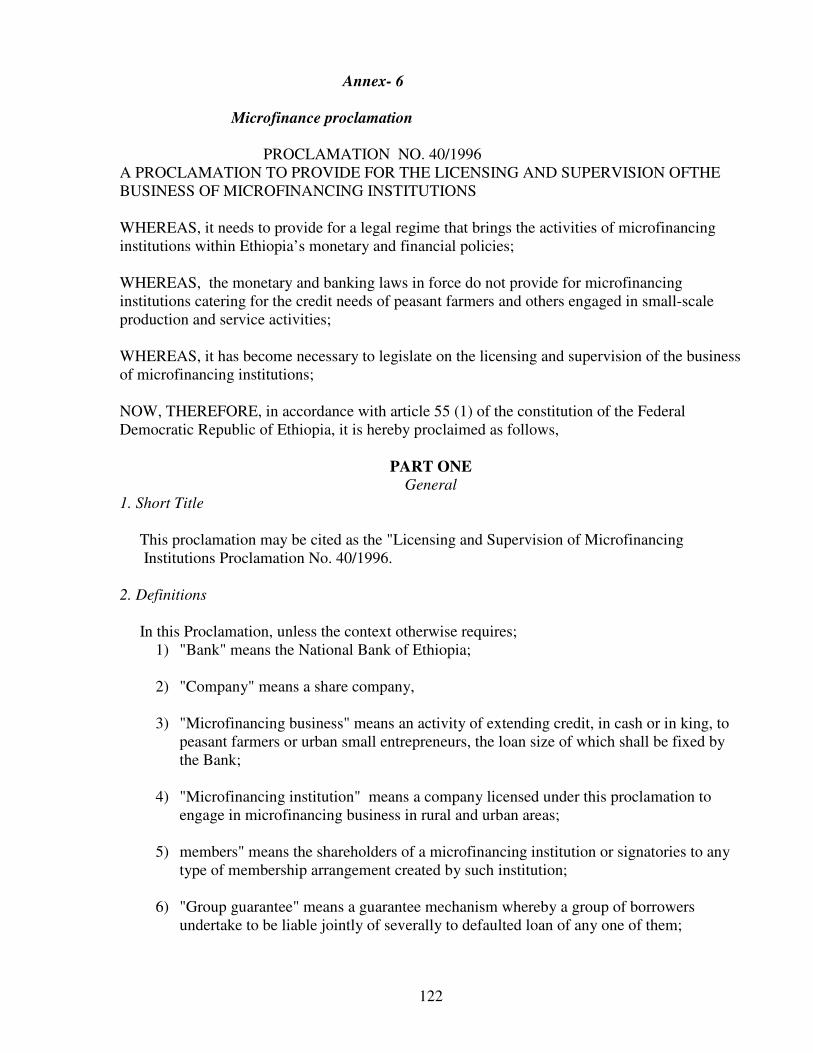
122
Annex- 6
Microfinance proclamation
PROCLAMATION NO. 40/1996
A PROCLAMATION TO PROVIDE FOR THE LICENSING AND SUPERVISION OFTHE
BUSINESS OF MICROFINANCING INSTITUTIONS
WHEREAS, it needs to provide for a legal regime that brings the activities of microfinancing
institutions within Ethiopia’s monetary and financial policies;
WHEREAS, the monetary and banking laws in force do not provide for microfinancing
institutions catering for the credit needs of peasant farmers and others engaged in small-scale
production and service activities;
WHEREAS, it has become necessary to legislate on the licensing and supervision of the business
of microfinancing institutions;
NOW, THEREFORE, in accordance with article 55 (1) of the constitution of the Federal
Democratic Republic of Ethiopia, it is hereby proclaimed as follows,
PART ONE
General
1. Short Title
This proclamation may be cited as the "Licensing and Supervision of Microfinancing
Institutions Proclamation No. 40/1996.
2. Definitions
In this Proclamation, unless the context otherwise requires;
1) "Bank" means the National Bank of Ethiopia;
2) "Company" means a share company,
3) "Microfinancing business" means an activity of extending credit, in cash or in king, to
peasant farmers or urban small entrepreneurs, the loan size of which shall be fixed by
the Bank;
4) "Microfinancing institution" means a company licensed under this proclamation to
engage in microfinancing business in rural and urban areas;
5) members" means the shareholders of a microfinancing institution or signatories to any
type of membership arrangement created by such institution;
6) "Group guarantee" means a guarantee mechanism whereby a group of borrowers
undertake to be liable jointly of severally to defaulted loan of any one of them;
123
7) "Savings" Means non-withdrawal mandatory or regular savings of members of a
microfinancing institution;
8) "Deposits" means any regular or irregular savings which may be withdrawn partially or
totally at any time by the account holder;
9) "Directors" means members of the board of a microfinancing institution
3. Purpose and Duty
1) The purpose of microfinancing institutions is granting credit, in cash or in kind, the
maximum amount of which shall be determined by the Bank.
2) Subject to conditions set under this Proclamation, a microfinancing institution may
carry out come or all of the following activities;
(a) Accepting savings as well as demand and time deposits;
(b) Drawing and accepting drafts payable within Ethiopia;
(c) Borrowing money for its business purposes against the security of its assets or
otherwise;
(d) Purchasing such income generating financial instruments as treasury bills;
(e) Acquiring, maintaining and transferring of any movable and immovable
property including premises for carrying out its business;
(f) providing counseling service to its clients;
(g) Encouraging income generating projects for urban and rural micro-operators;
(h) Rendering managerial, marketing, technical and administrative advice to
borrowers and assisting them to obtain services in those fields;
(i) Managing funds for microfinancing business; and
(j) Engaging in other activities customarily undertaken by microfinancing
institutions.
PART TWO
Licensing of Micro Financing Institutions
4. Conditions Required to Engage in Micro financing Business
1) To carry out microfinancing business, the following conditions shall be fulfilled;
(a) obtain a license from the Bank;
124
(b) be formed as a company;
(c) deposit with a bank the minimum initial capital required by the Bank; and
(d) that the directors and other officers meet requirements set by the Bank
2) The Council of Ministers may, upon recommendation by the Bank, exempt an
applicant from the requirements of any of the provisions of Sub- article (1) of this
article in order that other innovative financial intermediaries engage in
microfinancing business and for other causes consistent with the objective of this
proclamation.
5. Prescribing Additional Conditions
1) The Bank may issue directives at any time and prescribe additional conditions to be
complied with before a license is issued.
2) Where the Bank intends to change or vary the terms and conditions attached to a
license, it shall notify the concerned microfinancing institutions of such intentions
forty-five (45) days before the date it proposes to carry same into effect.
6. Application for License
1) An application for license to carry out microfinancing business shall contain the
following:
(a) The prospective place of operation (indicating that of the head office and
branches);
(b) The name, occupation, residence and nationality of the founders;
(c) Form of organization of the undertaking;
(d) Memorandum of association of the undertaking;
(e) proposed name of the undertaking;
(f) Biographical data on each of the founders, proposed directors and officers;
(g) The proportion of contribution in cash and in kind and the manner of valuation of
contribution in kind.
(h) The proposed transactions and operations of the undertaking as well as the
manner for carrying out same and
(i) such other relevant information as the bank may require;
2) An investigation fee, prescribed by the Bank, shall be paid at the time of
Submitting the application for license.
3) An applicant issued with a license shall commence operations within 12 (Twelve)
months from the date thereof.
4) No microfinancing institution shall, without the prior consent of the Bank, operate
outside the area for which it has been issued the license.
125
5) Every microfinancing institution shall pay such annual license renewal fee as the Bank
may prescribe.
7. Authorization of Commencement of Operation
Any microfinancing institution may, before commencing operations, be required to meet certain
conditions prescribed in a directive to be issued by the Bank.
8. Recovery of Monies and Securities Received by unlicensed undertakings
Where any unlicensed person undertakes activities carried out pursuant to this proclamation, and
holds monies or property obtained through such act, the Bank may apply to the Federal High
Court for orders in respect of the disposing of same; the High Court shall give orders for the
speedy and efficient return of such monies or property to the depositors or owners thereof.
9. Revocation of license
The license of a microfinancing institution may be revoked by the Bank for any of the following
reasons;
1) Where it fails to commence operations within a period of 12 (twelve) months following
the issuance of license;
2) where it ceases to carry on its activity;
3) where it is declared bankrupt or decided that it be liquidated;
4) where it is amalgamated with another microfinancing institution or bank without prior
written authorization of the Bank; or
5) Where confirmed that its registration was effected on the basis of false information.
10. Application for re-Registration
1) Where the savings mobilized by a microfinancing institution equals Birr 1,000,000
(One million Birr) it shall apply for re-registration.
2) Where application is made under sub-Article (1) of this Article, it may be required that
additional conditions prescribed by directives issued by the Bank be met.
11. Assistance
1) Where it deems it appropriate, the Bank shall extend technical assistance requested by
a micro financing institution while being organized or in the course of operations
2) Microfinancing institutions may obtain line of concessional credit or any assistance
from foreign sources for the purpose of on-lending or capitalization.
3) Any credit or assistance to be obtained under sub-Article (2) of this article shall require
the prior approval of the Ministry of Finance.
PART THREE
Financial Requirements and Limitations
12. Minimum Capital Requirement and Powers and Responsibilities on the bank
126
1) The minimum paid-up capital required to obtain license for microfinancing business
shall be determined by directives to be issued by the Bank
2) The Bank may issue directives governing the following;
(a) Limits on the maximum credit extended by microfinancing institutions to any
individual or group.
(b) The loan period and procedures;
(c) periodic reporting the accounting system and the keeping of books of
accounts;
(d) periodic surveys of loan and audits;
(e) Standards regarding accountability, structure, savings system and financial
performance;
(f) Setting of special interest rate applicable to microfinancing institutions.
3) The Bank shall have the responsibility to;
(a) encourage banks and other financing institutions to engage in micro financing
business or to expand their activities in same;
(b) offer or facilitate training for the personnel of microfinancing institutions;
(c) Promote and develop traditional savings institutions such as lqub in order that
the low-income section of society benefit most from them; and
(d) Promote investment in microfinancing business, especially in rural Ethiopia,
Pursuant to powers vested in it under the law;
13. Consolidation and Merger
Consolidation and merger of microfinancing institutions operating in adjacent areas shall be
encouraged and such incentives as the Bank deems appropriate shall be granted to them.
14. Opening of Branches
1) Every microfinancing institution shall notify its having opened a branch office, within
fifteen (15) days of the commencement of operation of such branch.
2) The Bank may set general guidelines of donations of opening and operating branch
offices by microfinancing institutions.
PART FOUR
General Conditions
15. Extending of Loan Services
Microfinancing institutions may extend loan to members as well as to non-members. However,
such credit schemes as operating under group guarantee shall exert themselves to bring
borrowers into membership of the institutions.
16. Minimum Operational prudence.
The minimum prudential framework of operation in respect of all microfinancing institutions
shall be in the manner and form to be prescribed by the Bank.
127
17. Prohibitions
Without the prior approval of the Bank no microfinancing institution may;
1) enter into an arrangement or agreement for the sale or disposal amalgamation or other
wise of its business or effect self restructuring;
2) transfer or otherwise dispose of the whole or any part of its property, whether inside or
outside Ethiopia, other than in the ordinary course of its business;
3) effect reduction of its capital or
4) amend its memorandum of association or alter the name under which it is licensed.
18. Circumstances Requiring Approval for Managerial Responsibility
The following shall not be allowed to manage microfinancing institutions without the prior
written approval of the Bank:
1) Persons declared bankrupt or who have made a compromise with their creditors,
whether in Ethiopia or elsewhere
2) Persons convicted of offences of breach of trust or fraud, whether in Ethiopia or
elsewhere.
19. Tax Exemption
The Ministry of Finance is hereby empowered to determine the period, manner and condition of
exemption of microfinancing institutions from income tax.
20. Special Responsibility
Every microfinancing institutions shall devise and execute a policy whereby the low-income
section of society, especially in rural areas, get access of credit and to this end it shall implement
such means of substituting group guarantee for property collateral requirement.
PART FIVE Miscellaneous provisions
21. Duty to Cooperate
Where so requested by the Bank, all concerned bodies shall have the duty of cooperate in the
implementation of this proclamation.
22. Audit
Accounts of microfinancing institutions shall be audited annually by an independent auditor
acceptable to the Bank prior to the payment of dividends to shareholders
23. Inapplicable Laws
Any law inconsistent with the provisions of this Proclamation shall not apply to matters provided
for under this Proclamation.
128
24. Other Applicable Law
With respect to matters not covered under this Proclamation, the Licensing and Supervision of
Banking Business Proclamation No. 84/ 1994 shall apply, mutatis mutandis.
25. Power to Issue Directives
The Bank may issue directives necessary for the proper implementation of this Proclamation.
26. Transitory Provisions
1) Undertakings engaged in microfinancing business, prior to the coming into force of
this Proclamation, may continue in their previous form until reorganized in
compliance with the provisions of this Proclamation.
2) The conditions and time limit of non-applicability of this Proclamation to such
undertakings shall be determined in directives to be issued by the Bank.
27. Effective Date
This Proclamation shall come into force as of the 5th
day of July, 1996.
Done at Addis Ababa, this 5th
day of July, 1996.
NEGASO GIDADA (DR.)
PRESIDENT OF THE FEDERAL DOMOCRATIC
REPUBLIC OF ETHIOPIA

129
Related Documents