IMPACT OF MICROFINANCE IN GRASSROOT DEVELOPMENT BY WELI, CHISONMA IBELEMA Being an Empirical Research Project Submitted To the INSTITUTE OF FINANCIAL AND INVESTMENT ANALYSTS, NIGERIA (IFIAN) In Partial Fulfillment of the Requirements for certification as an Associate Member of the CHATTERED INSTITUTE OF FINANCIAL AND INVESTMENT ANALYSTS, NIGERIA (CIFIAN) (C) WELI, Chisonma Ibelema 0

Welcome message from author
This document is posted to help you gain knowledge. Please leave a comment to let me know what you think about it! Share it to your friends and learn new things together.
Transcript
IMPACT OF MICROFINANCE IN GRASSROOT DEVELOPMENT
BYWELI, CHISONMA IBELEMA
Being an Empirical Research Project
Submitted To the
INSTITUTE OF FINANCIAL AND INVESTMENT ANALYSTS,
NIGERIA (IFIAN)
In Partial Fulfillment of the Requirements for
certification as an
Associate Member of the
CHATTERED INSTITUTE OF FINANCIAL AND INVESTMENT
ANALYSTS, NIGERIA (CIFIAN)
(C) WELI, Chisonma Ibelema0
All Rights Reserved
2014
INSTITUTE OF FINANCIAL AND INVESTMENT
ANALYSTS, NIGERIA (IFIAN)
Empirical Research Project on
“IMPACT OF MICROFINANCE IN GRASSROOTDEVELOPMENT”
BY
WELI, CHISONMA IBELEMA (MRS.)
1

CHATTERED INSTITUTE OF FINANCIAL AND
INVESTMENT ANALYSTS, NIGERIA (CIFIAN)
NOVEMBER, 2014.
CERTIFICATION
This is to certify that I, Weli Chisonma Ibelema, am
responsible for this work. That this work is my
original contribution to the body of knowledge, except
as specified in the acknowledgement and references. I
also declare that this entire project or any part of it
has not been submitted by me or any other person in any
institution for the award of any degree or
certification .
2

WELI, CHISONMA IBELEMA ______________________
_________
(STUDENT)
SIGNATURE DATE
DEDICATION
This work is dedicated to god Almighty who generously
gave me the strength, health and resources to
successfully accomplish this research amid competing
demands.
3

AKNOWLEDGEMENT
4

My sincere and profound gratitude first and foremost
goes to my Father- the Lord God almighty for His love
and mercies that have brought me thus far.
I also wish to acknowledge the efforts and
contributions of my lecturers in the cause of this
certification program to enable me acquire relevant
knowledge in this field.
My heartfelt gratitude goes to my wonderful family who
gave me all the support I needed in the course of this
program. I specially thank my loving husband- Ruwhuoma
for his support, encouragement and understanding. I
also appreciate our God given children- Oke and Izi;
and my entire household.
5

TABLE OF CONTENT
Title Page Declaration Certification Abstract Acknowledgement Table of Content List of TablesChapter One: Introduction
1.1. Background to the Study1.2. Statement of the problem1.3. Purpose of the study1.4. Research Questions1.5. Hypotheses1.6. Definition of terms1.7. Significance of the study1.8. Scope of the study1.9. Limitations to study1.10. Organization of the study
Chapter two: Literature Review
2.0. Introduction
Chapter three: Research Methodology
3.1. Research Design
3.2. Population of Study
6
3.3. Data collection
3.4. Operational Measures of Variables
3.5. Data analysis technique
3.6. Test of Hypothesis
Chapter four: Presentation and Analysis of Data
Chapter five: Discussion, Conclusion, and Recommendation
5.1. Discussion
5.2. Conclusion
5.3. Recommendations
Bibliography
Appendix
LIST OT TABLES
Table 2.1 Ownership of informal enterprises by sector in Nigeria
Table 2. 2. Participatory distribution of Sectors for which MFBs give account of Micro-credit
activities
Table 4.1: Descriptive statistics of percentage growth rate of Variables- Micro Finance
Banks (MFB) operations and Grass root development (1992-2013).
Table A. 1: MFB operations and Development indices
Table A.2: MFB operations and development indices cntd.
Table A. 3: Regression analysis: Beta coefficient
Table A. 4: Coefficient of Determination (R-Squared)
Table A. 5: Z-test at 5% level of significance- critical value
7
LIST OF FIGURES
Figure 2. 1 Ownership distribution of informal enterprises by sector in Nigeria
Figure 2.2: Ownership of informal enterprises by sector in Nigeria for which MFBs give account
of Micro-credit activities
Figure 4.1: Comparison of MFB average apportioning of credit to sectors and thesector’s aggregate productivity.
8
ABSTRACT
This study investigated the impact of micro finance operations on grassroot development, by analyzing its effect on factors that define the majorcharacteristic of the grass root which is poverty. It was identified fromliterature that low productivity and employment are the major causes ofpoverty, and all strategies that fail to address their increase cannot bringabout development at the grass roots. Based on this assumptions asrooted in the micro finance classical theory, this study raised eighteenhypothesis which were tested through multiple regression analysis. Data
9
was gathered from secondary sources of the Central Bank, World BankData base, and the National Bureau of statistics. Micro finance operationswas proxied by Micro finance Banks (MFB) Micro- credit, Micro- depositsand size of the industry; while grass root development was proxied by rateof employment and aggregate productivity in sectors where the grass rootis economically active. The results revealed that Micro- credit did not haveany significant impact on employment or any of the sectors’ productivity,but had the potential of increasing employment, and productivity inagriculture. Micro- savings was found to have a significant but negativeimpact on productivity in agriculture. The results also showed thatalthough it had no significant impact on the other sectors, yet it had thepotential to increase productivity in the manufacturing andtransport/commerce sectors of the economy. The size of the micro financeindustry had a significant and positive impact on employment rate; but anegative yet significant impact on productivity in the real estate/construction sector. The insignificant impact of micro finance operationsand its rather negative impact on most of the sectors which was contraryto our a-priori expectations could be explained by the prevalent problemsof funds diversion of MFB clients to consumption expenditures rather thaninvestment, which most often brings them into a debt trap, and most oftendeath of such enterprises. Therefore the study recommended that MFBsintroduce and priorities as part of its services, training and informativesessions to educate its clients on the potentials of funds being invested intobusinesses; priorities its functioning of monitoring and corporategovernance in cases of lending, and extend more of its credit facilities tothe agricultural sector. It also recommended that the government enhanceits provision of basic infrastructure to ease operational difficultiesencountered by these firms.
10
CHAPTER 1
INTRODUCTION
1.1. Background to the Study
In every society no matter how advanced, the system stratifies
different levels of power, resources, and status among
inhabitants; determining distribution pattern of these benefits
and control over the distribution process. At the bottom of the
distribution process lies those considered as the grass-root of
the society. According to Pilisuk, McAllister and Rothman (1996),
individuals with high socio-economic status, also considered as
the elite are better positioned to exploit both persons and
environments for their benefits, as they have greater share of
powers and control over resources. On the other hand, the grass-
root are those with less power and fewer resources; they are the
common or ordinary people, especially as contrasted with the
leadership; the society at a local level rather than at the
center of major political activity, and are mostly found in the
agricultural, rural, and sub-urban areas of a country
(Dictionaty.com, 2014). Pilisuk, McAllister and Rothman (1996),
described them as those who most often lack the most basic of
human necessities for housing, employment, food, health-care,
education, and a clean and safe environment. They are the
ordinary citizens and in particular the poor.
11
In developing countries like Nigeria, majority of their
population fall under this description in contrast with what
obtains in developed countries like America, where very few
persons fall into this category. Therefore, the challenge for
most developing countries has been the need to reduce the
percentage of persons that fall into this category through grass
root development. According to the US- ADF (1998), grassroots
development is promotion in people’s well-being and empowering of
persons and groups such that they can expand and make their own
choices and bring about change. It centers on poverty alleviation
and socio- economic empowerment of poor and vulnerable. Various
measures have been employed including reforms in government and
political structure (like, creation of districts and Local
Governments); introduction of several government policies and
programs like provision of public goods at the grass-root by the
various tiers of government and their parastatals, and
involvement of public-private partnership projects. According to
Amsden (2011) the problem has been that these remedies to reduce
poverty at the grass-root do not address the causes of poverty
which is unemployment. Grass-roots poverty alleviation measures
in Africa have been exclusively designed and targeted to make
job-seekers more capable (healthy, educated, mobile), although no
jobs are available. She further stated that poverty persists from
low productivity which gives room for lack of employment; and to
create employment requires capital investments to expand
entrepreneurial opportunities and increase productive jobs. Going
12
by Schumpeter’s theory, development can only be achieved when
financial institutions are present to act as catalysts in the
system. They function to provide financial resources through
intermediation in form of capital accumulation for innovative
entrepreneurs to invest, taking advantage of opportunities and
thereby creating a whole cycle of increased productivity and
employment which leads to development. Unfortunately, due to
peculiar characteristics of individuals and entrepreneurs at the
grass root, these ones have been faced with financial exclusion
from the formal financial sector. In a bid to provide these
desirable services to the grass roots, micro financing was
created formally and has evolved informally in other to boost the
productive capacity of these impoverished persons. Micro-finance
means small-scale transactions of credit and savings, and it
sometimes offers skill-based training to augment productivity or
organizational support and consciousness-raising training to
empower the poor (Khander, 2003). Therefore, it is to a large
extent, meant to meet the needs of the ‘active poor’- small,
medium, and micro-scale producers and businesses, and the
vulnerable populace like women. This expectation has drawn much
debate. Proponents insist that microfinance reduces poverty
through increased productivity, higher employment and higher
incomes; while critics argue that it rather drives poor
households into a debt trap as money from loans are often spent
on consumption instead of being used for productive investments,
and therefore does not improved income or standard of living -
13
health or education (Baidoo, 2014). Khander (2003) in same light
hypothesized that since micro finance supports mainly informal
activities that often have low market demand, aggregate poverty
impact of microfinance in an economy would be unsustainable, low
or non-existent in most developing countries. Most studies
investigating impact of micro financing on development have often
used survey designs that only showed their short run relationship
as they use cross-sectional survey, and therefore fail to measure
its sustainable impact where it exists. Posner, cited in Nicholas
(2011) found that microfinance success had been more of a case-
by-case truth than a universal one. Most studies on micro finance
impact have more often looked at the individual or small group
level (case-by –case), only a hand full have assessed if these
claimed successes at the grass roots have such desired impact at
the aggregate level. In Nigeria, micro financing has existed
informally for decades, but was formally introduced under the
regulation of the Central Bank from 1992. This study seeks to add
to the body of knowledge in finance by investigating the
aggregate impact micro finance may have on grass-root development
in Nigeria over time, considering the root causes of poverty
being low productivity and employment.
1.2. Statement of the problem
Over time, Nigeria like most developing countries has
struggled with the issues of extreme poverty at its grassroots.
Several steps have been taken in direction of poverty alleviation
14
and development, one of such is formal micro-financing. Micro
finance banking was adopted by the Nigerian government as one of
its ‘bottom-up’ approaches to development- targeting the
grassroots, as recommended by international bodies like the World
Bank and evident in aiding poverty reduction in places like
India. A Policy Regulatory and Supervisory Framework for micro
finance banking was introduced in 2005 by the Central Bank of
Nigeria (CBN) to further strengthen the potentials of the
industry and aid government in using them as a tool to effect
development. This policy was later revised in 2011, to target at
the recognition of existing informal financial institutions and
bringing them within the supervisory purview of the CBN creating
a platform for the regulation and supervision of microfinance
banks. Since its formal introduction into the Nigerian banking
systems debates have been on about its efficacy as a tool for
necessary sustainable development at the grassroots. As at this
year, 2014, the World Bank ranked Nigeria as third country with
the largest number of poor people, and advised on the need to
complement development efforts to enhance growth with policies
that allocate more resources to the extreme poor like transfer
(Omoh, 2014). Gong by the World Bank development Indicators
(2013), 70% of Nigerians still live below $2 per day and are
therefore poor; and this index rather increased by 2.4% between
2004 to 2010, even though the number of Micro finance banks
increased by 6.4% within the same period. Babajide in 2011 from
her grass root study as obtains in most studies claimed that
15
micro financing significantly impacted positively on the
individual entrepreneur’s development in Nigeria. Given these
facts, the core problem here concentrates on questioning the
efficacy of micro finance banking as a potent tool for effecting
sustainable grass root development in Nigeria, such that it
reflects on aggregate indices. This study investigates this
problem empirically.
1.3. Purpose of the study
The objective of this study is to estimate the aggregate
impact of micro-finance on grassroots development. Based on this
the specific purpose is:
a. To ascertain the effect of micro financing on
productivity in sectors where the grass root is economically
active.
b. To identify the effect of micro financing on
employment.
1.4. Research Questions
To achieve the set out general and specific objectives of this
study, this research intends to provide empirical answers to the
following questions:
16

1. In what ways has micro-financing increased
productivity in sectors where the grass root is economically
active?
2. In what ways has micro financing impacted on
employment?
1.5. Hypotheses
To provide answers to our research questions and achieve our
study objectives, this study raised 15 hypothesis for the first
research question, and 3 others for the research question above.
Therefore we hypothesize thus:
H01: Micro-credit has no significant impact on productivity in
the agricultural sector of Nigeria.
H02: Micro-savings has no significant impact on productivity
in the agricultural sector of Nigeria.
H03: Size of the micro-finance industry has no significant
relationship with productivity in the agricultural sector of
Nigeria.
H04: Micro-credit has no significant impact on productivity in
the mining sector of Nigeria.
H05: Micro-savings has no significant impact on productivity
in the mining sector of Nigeria.
H06: Size of the micro-finance industry has no significant
relationship with productivity in the mining sector of Nigeria.
17

H07: Micro-credit has no significant impact on productivity in
the manufacturing sector of Nigeria.
H08: Micro-savings has no significant impact on productivity
in the manufacturing sector of Nigeria.
H09: Size of the micro-finance industry has no significant
relationship with productivity in the manufacturing sector of
Nigeria.
H010: Micro-credit has no significant impact on productivity
in the Real Estate/ Construction sector of Nigeria.
H011: Micro-savings has no significant impact on productivity
in the Real Estate/ Construction sector of Nigeria.
H012: Size of the micro-finance industry has no significant
relationship with productivity in the Real Estate/ Construction
sector of Nigeria.
H013: Micro-credit has no significant impact on productivity
in the Transport/ Commerce sector of Nigeria.
H014: Micro-savings has no significant impact on productivity
in the Transport/ Commerce of Nigeria.
H015: Size of the micro-finance industry has no significant
relationship with productivity in the Transport/ Commerce sector
of Nigeria.
H016: There is no significant relationship between micro-
credit and employment in Nigeria.
18
H017: There is no significant relationship between micro-
deposits and employment in Nigeria.
H018: There is no significant relationship between size of the
micro finance industry and employment in Nigeria.
1.6. Definition of terms
Micro Finance: is a source of financial services for
entrepreneurs and small businesses lacking access to banking and
related services.
Micro- financing: is the act of providing financial services to
the poor who do not qualify for conventional bank services, like
savings and credit extension.
Micro- credit: this is that aspect of micro-financing that deals
with extending micro- debt funds (money available for a person to
borrow) to micro- finance institution customers, usually at a
cost (interest payment) for a specific time frame.
Productivity: refers to output of a sector, and in this case the
increase or decrease in the volume of output.
Employment: This is having and occupation for which the person
is paid, otherwise known as work or job engagement. This could be
self-employment (a person works solely on his business activities
to generate enough funds to pay himself), or being employed by
19
another person or organization and paid for services rendered to
them.
Income: refers to all financial inflows accruing to a unit
(individual or group). In this case, we are referring to all
financial receipts accruing to the household, which could be
reflected by its total expenditure or receipts.
Poverty: this is a state of not having enough money to take care
of basic needs such as food, clothing, and housing.
Aggregate development: collective or sum value of an economic
growth indices; in this case, at the national level.
1.7. Significance of the study
With the grassroots constituting approximately 70% of
Nigerian’s population (Poverty headcount ratio at $1.25 a day (%
of population), NBS, 2012), the results of this study will
educate the Nigerian government and populace (especially the
active poor) on the efficacy or irrelevance of micro-financing in
the economic development process. The findings would also
instruct policy makers on areas where micro-financing can impact
on grassroots development, and suggest policy/ strategy
adjustments such that aggregate developmental goals can be
achieved.
1.8. Scope of the study
20
This study is carried out in Nigeria, and therefore
geographically restricted to the area. The Central bank of
Nigeria only began to give specific account of Micro-finance
activities from 1992, and reliable records necessary to cover all
variables and give balanced data are available up to 2013 for
now; therefore this study covers a twenty- one year period of
1992 to 2009; and is geographically restricted to Nigeria. The
study is restricted to examine the relationship between micro-
finance operations and aggregate grassroots development indices
in Nigeria within this given time frame.
1.9. Limitations to study
Analyzing development could take several dimensions, but most
of the data that reflect development especially at the grass root
are either incomplete, irregular or not up to date in Nigeria,
therefore this study centered on two groups of indices, as these
were data that where readily available and up to date. Of the two
groups of indices, data on employment by sector was not included
in the study, as their computation at the national level begun in
2004, which falls short of our study period.
1.10. Organization of the study
To effectively carry out this study, this paper is divided
into 5 sections. Section one is the introduction. Section two of
this study is the literature review, which is made up of the
theoretical framework and review of empirical literature. The
21
former work discusses theories that relate to finance and
development; while the second part reviews findings from
empirical studies on the subject matter. The third part of the
study suggests the methodology used in the study, while the
fourth section presents our data for the study, analyzes it and
interprets the results of our tests. The final section, which is
five, discusses the findings of our study, draws conclusion and
makes recommendations accordingly.
CHAPTER 2
LITERATURE REVIEW
2.0 Introduction
The previous chapter introduced the study, by providing the
background to the study giving a conceptual framework of the
study, as well as the research questions and hypotheses. This
chapter goes on in its first part to review literature on
theories that attempt to explain the nature of relationship that
exists between finance and development. The second part of this
chapter reviews empirical literature on micro-financing and
development.
22

2.1. Theoretical Framework
Grass roots development: this refers to the development of the
common man who exists at the lowest class of the social ladder.
This class is often characterized by poverty and general
deficiencies in basic areas of life. Therefore factors or
strategies that would impact on poverty level actually define
grass root development. Development can be defined within the
contexts of human development, capital development, or
environmental development, whichever form it takes, it is desired
at the grass root. Several literature and studies have suggested
measures/ indicators of development at the grass roots. These
include:
a. Poverty level- Human development index; poverty
head count; etc.
b. Unemployment
c. Income level/ Socio-economic status
d. Productivity- start up, expansion or
sustainability of micro enterprises that exist in that class
e. Health
f. Education
g. Productivity, etc.
According to Baidoo (2014), development in any setting depends on
the nature and level of economic activities in that society, and
this is defined by the economically active entrepreneurs; in this
case the active poor. At the grass roots they are found to be
either self-employed or employees of production units. In
23
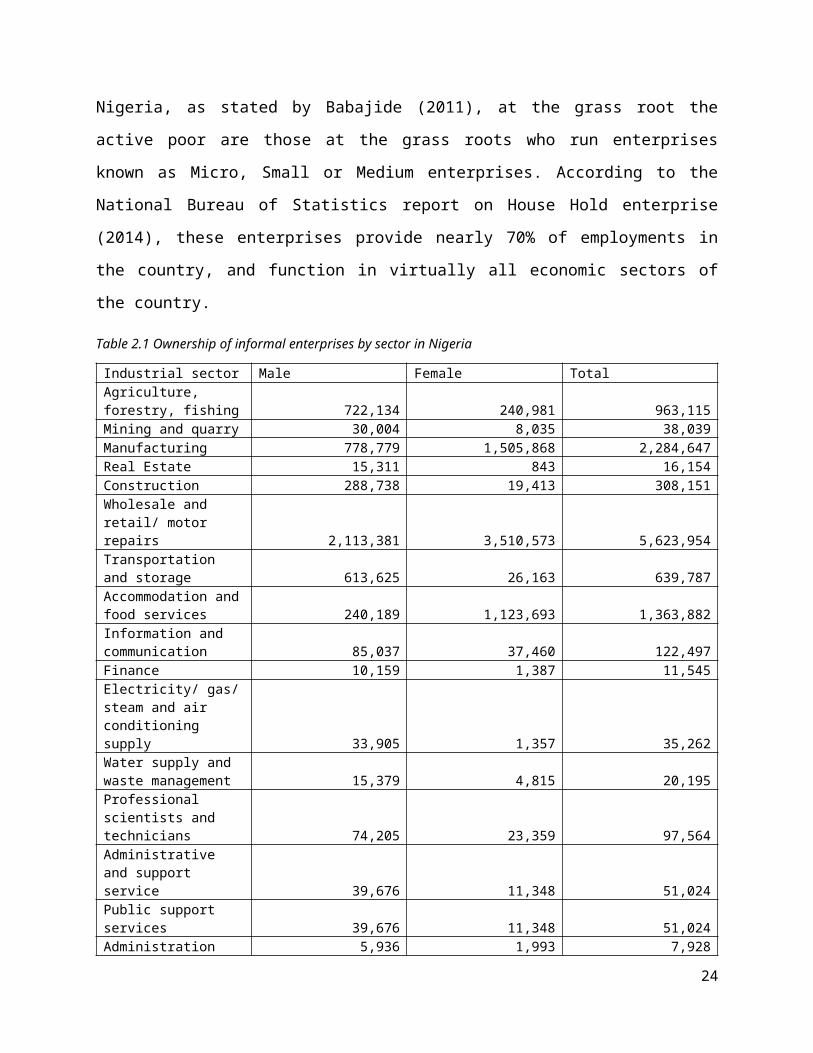
Nigeria, as stated by Babajide (2011), at the grass root the
active poor are those at the grass roots who run enterprises
known as Micro, Small or Medium enterprises. According to the
National Bureau of Statistics report on House Hold enterprise
(2014), these enterprises provide nearly 70% of employments in
the country, and function in virtually all economic sectors of
the country.
Table 2.1 Ownership of informal enterprises by sector in Nigeria
Industrial sector Male Female TotalAgriculture, forestry, fishing 722,134 240,981 963,115Mining and quarry 30,004 8,035 38,039Manufacturing 778,779 1,505,868 2,284,647Real Estate 15,311 843 16,154Construction 288,738 19,413 308,151Wholesale and retail/ motor repairs 2,113,381 3,510,573 5,623,954Transportation and storage 613,625 26,163 639,787Accommodation andfood services 240,189 1,123,693 1,363,882Information and communication 85,037 37,460 122,497Finance 10,159 1,387 11,545Electricity/ gas/steam and air conditioning supply 33,905 1,357 35,262Water supply and waste management 15,379 4,815 20,195Professional scientists and technicians 74,205 23,359 97,564Administrative and support service 39,676 11,348 51,024Public support services 39,676 11,348 51,024Administration 5,936 1,993 7,928
24
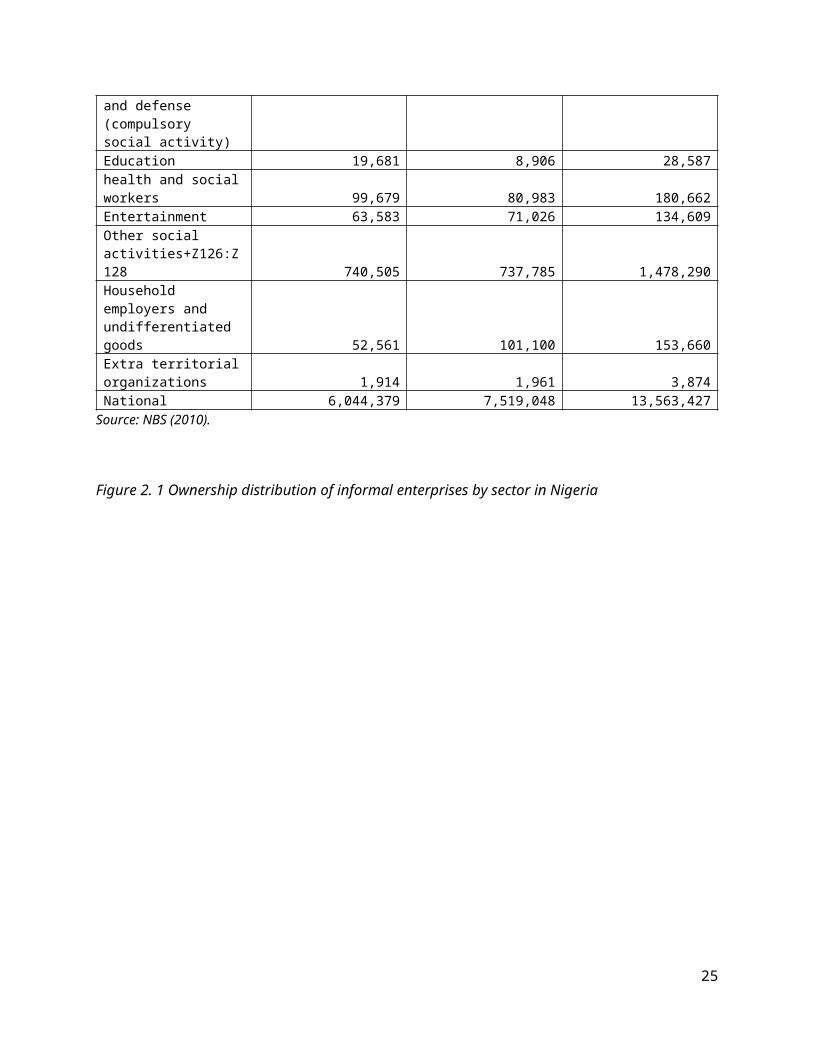
and defense (compulsory social activity)Education 19,681 8,906 28,587health and socialworkers 99,679 80,983 180,662Entertainment 63,583 71,026 134,609Other social activities+Z126:Z128 740,505 737,785 1,478,290Household employers and undifferentiated goods 52,561 101,100 153,660Extra territorialorganizations 1,914 1,961 3,874National 6,044,379 7,519,048 13,563,427
Source: NBS (2010).
Figure 2. 1 Ownership distribution of informal enterprises by sector in Nigeria
25
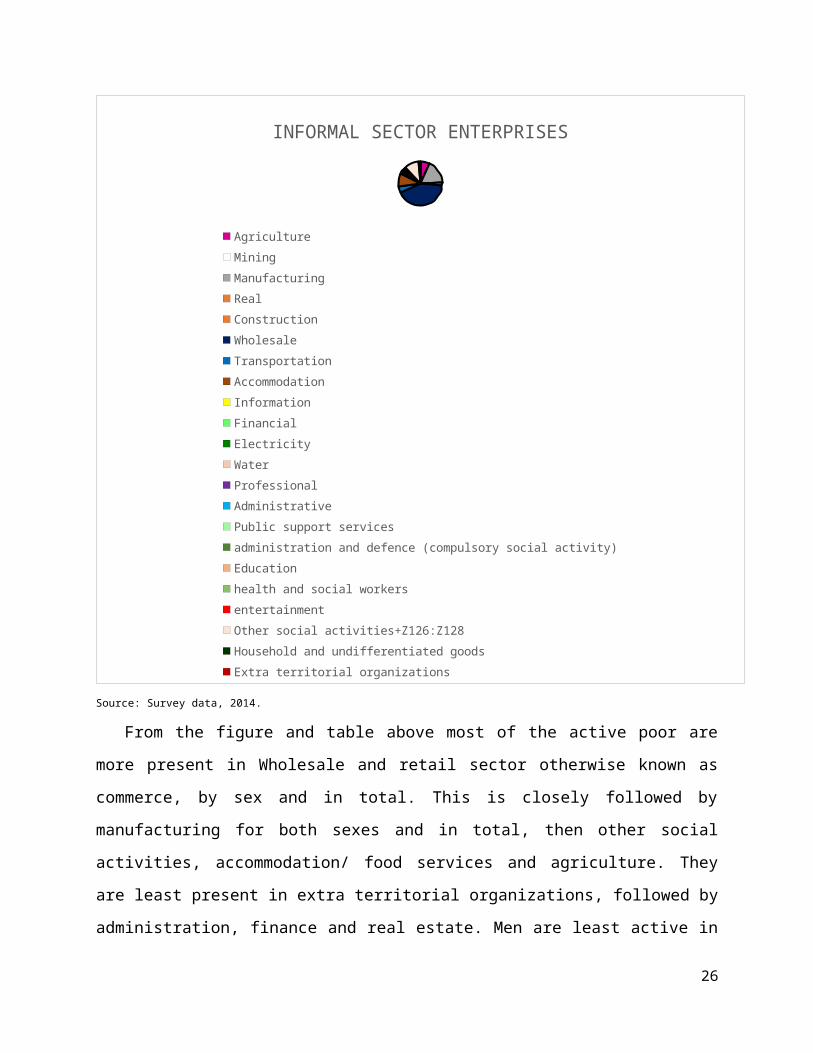
INFORMAL SECTOR ENTERPRISES
AgricultureMiningManufacturingRealConstructionWholesaleTransportationAccommodationInformationFinancialElectricityWaterProfessionalAdministrativePublic support servicesadministration and defence (compulsory social activity)Educationhealth and social workersentertainmentOther social activities+Z126:Z128Household and undifferentiated goodsExtra territorial organizations
Source: Survey data, 2014.
From the figure and table above most of the active poor are
more present in Wholesale and retail sector otherwise known as
commerce, by sex and in total. This is closely followed by
manufacturing for both sexes and in total, then other social
activities, accommodation/ food services and agriculture. They
are least present in extra territorial organizations, followed by
administration, finance and real estate. Men are least active in
26
extra territorial organizations; while women are least active in
the real estate sector. Nationally, more women than men make up
the population of the active poor, and this applies to 9 out of
the 23 sectors.
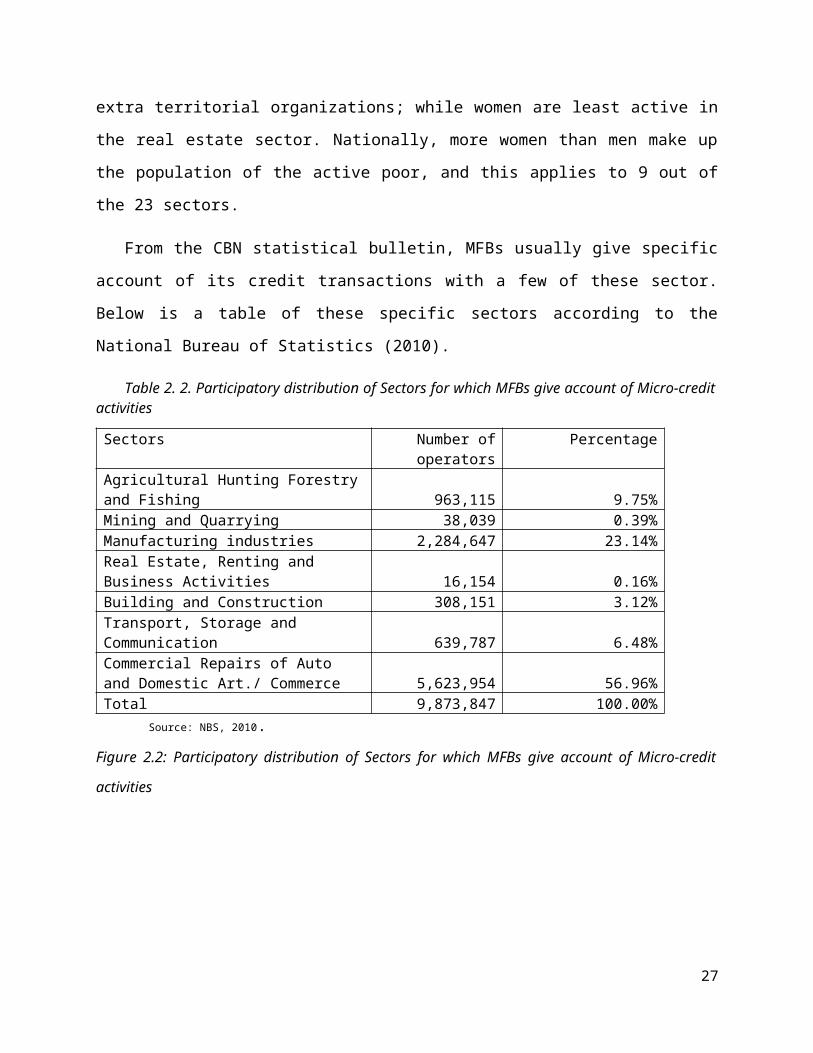
From the CBN statistical bulletin, MFBs usually give specific
account of its credit transactions with a few of these sector.
Below is a table of these specific sectors according to the
National Bureau of Statistics (2010).
Table 2. 2. Participatory distribution of Sectors for which MFBs give account of Micro-creditactivities
Sectors Number ofoperators
Percentage
Agricultural Hunting Forestryand Fishing 963,115 9.75%Mining and Quarrying 38,039 0.39%Manufacturing industries 2,284,647 23.14%Real Estate, Renting and Business Activities 16,154 0.16%Building and Construction 308,151 3.12%Transport, Storage and Communication 639,787 6.48%Commercial Repairs of Auto and Domestic Art./ Commerce 5,623,954 56.96%Total 9,873,847 100.00%
Source: NBS, 2010.Figure 2.2: Participatory distribution of Sectors for which MFBs give account of Micro-credit
activities
27
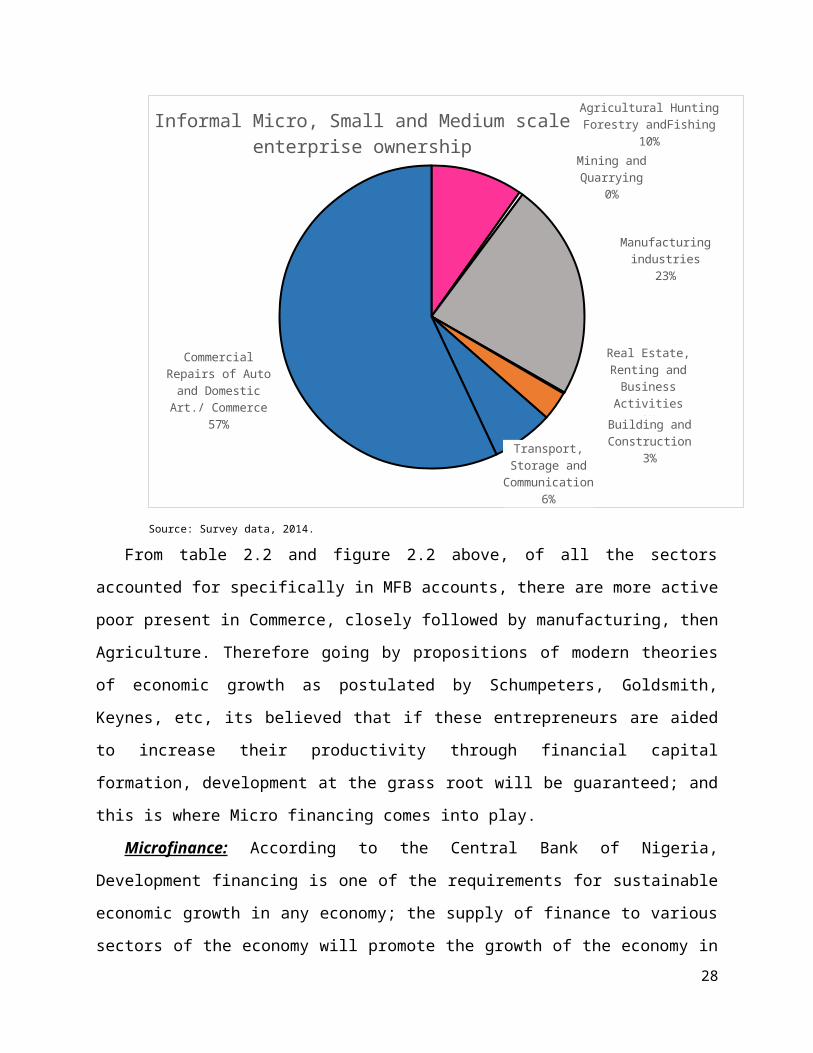
Agricultural Hunting Forestry andFishing
10%Mining and Quarrying
0%
Manufacturing industries
23%
Real Estate, Renting and Business Activities
0%Building and Construction
3%Transport, Storage and Communication
6%
Commercial Repairs of Auto and Domestic Art./ Commerce
57%
Informal Micro, Small and Medium scale enterprise ownership
Source: Survey data, 2014.
From table 2.2 and figure 2.2 above, of all the sectors
accounted for specifically in MFB accounts, there are more active
poor present in Commerce, closely followed by manufacturing, then
Agriculture. Therefore going by propositions of modern theories
of economic growth as postulated by Schumpeters, Goldsmith,
Keynes, etc, its believed that if these entrepreneurs are aided
to increase their productivity through financial capital
formation, development at the grass root will be guaranteed; and
this is where Micro financing comes into play.
Microfinance: According to the Central Bank of Nigeria,
Development financing is one of the requirements for sustainable
economic growth in any economy; the supply of finance to various
sectors of the economy will promote the growth of the economy in28
a holistic manner and this, will make development, welfare
improvement to proceed at a faster rate. This line of thought has
given rise to several institutions in the financial service
industry to meet requirement of provision of finance to all
necessary sectors to further economic growth; one of such
institutions is the Micro finance Institutions. Armendariz (2013)
defined micro finance institution (MFI), as a “formal” financial
institution delivering credit and other financial services to
poor individuals without collateral at lower than usurious
interest rates and majorly through group lending under joint
responsibility. Therefore, micro finance or financing as defined
by Baidoo (2014), is the provision of financial services such as
savings, loans and insurance to poor in both urban and rural
settings who are unable to obtain such services from the formal
financial sector. The Central Bank of Nigeria (CBN, 2005) defines
microfinance as the provision of financial services to the
economically active poor and low income households. In other
words, microfinance is the act of providing micro- savings,
credit, insurance and other financial developmental services to
those who have been excluded from the formal banking system, by
special financial institutions called- micro finance institutions
(MFIs).
In Nigeria, the Central Bank classified MFIs as specialized
development institutions, and launched a policy on it in 2005 to
address problems of financial inclusion- to increase access of
the poor and low income earners to factors of production. EFInA
29
(2010) study on Nigeria revealed that five years after the launch
of the Micro Finance policy, those served by formal financial
market (including formal MFIs) only increased marginally by 1.3%
in 2010. It was noted that this percentage increased by 22.7%
when those serviced by the informal sector were included, which
was desirable; yet 39.2 million adult population were still
financially excluded. Against this backdrop and the need to
enhance financial services delivery, the 2005 Microfinance Policy
Regulatory and Supervisory Framework for Nigeria was Revised in
April, 2011, by the CBN in exercise of the powers conferred on
the it by the provisions of the laws- CBN act 1991 and BOFIA
1991. The revision of the policy was targeted at recognizing
existing informal financial institutions and bringing them within
the supervisory purview of the CBN creating a platform for the
regulation and supervision of microfinance banks (MFBs) through
specially crafted Regulatory Guidelines (CBN, 2014). This review
has led an increase in the number of formal MFIs, therefore
increasing possibilities of access to financial service even in
remote areas.
The reason for the evolution, creation, and reforms of MFIs is
strongly based on empirical and theoretical positions on the role
of finance and its special institutions in economic development.
Most theories of economic development all agree to the fact that
development is a function of increase in productivity, which is
highly dependent on availability and efficient use of factors of
production, of which capital - finance is one. Going by this,
30
sourcing of financial resources is as important as sourcing for
other necessary factors of production; but the modern schools of
thought argue that finance is a necessary resource as it could to
a great extent determine procurement of other resources. Sourcing
of financial resources therefore makes financial institutions an
important player in development process as they create avenues
for capital accumulation- providing savings or credit extension.
They act as funnels in the system (neoclassical model), catalysts
(credit creation theory), puppets for directed development
(regulation theory), and have the ability to lead investment and
economic growth as they develop (liberalization theory).
Classical microfinance theory as explained by Dunford (2012)
is centered on change. The theory holds that micro finance
institutions are the key to poverty alleviation, because it
guarantees change in the status of the poor. This is because they
exist to provide an avenue for the poor to raise financial
capital either through savings or loans for investment purposes
in microenterprises. The essence is to either start or expand a
microenterprise, which will in turn yield enough net revenue to
repay the loan (capital and interest), and increase personal or
household income enough to raise their standard of living. A
major assumption of this theory is that, the poor utilizing micro
financing follow these steps:
Step 1: Save with or access loan from a micro finance
institution;
31
Step 2: Invest funds in viable micro enterprise;
Step 3: Yield major returns on investment.
This theory relies on development or poverty alleviation
through access to micro financial services of savings and credit
extension; actual use of these funds for investment purpose; and
management of resources generated. Dunford criticized this
classical theory of micro financing based on what obtains in
reality as relates to these three points. He claims that this
theory of change doesn’t apply to a whole lot of poor people. On
access to financial services, with reference to the Global
Financial index developed by the World Bank, he states that
measures and indices available only tell about the percentage of
global adult population with bank accounts and those currently
borrowing. This analysis, does not show if people who did not
report ‘actual use’ of financial services of savings and credit,
really had a choice to use or not use—a microfinance institution
may not have been locally available; or if it was purely based on
choice of self-exclusion. Banerjee and Duflos as cited by
Dunford, reported from a research in Andra Pradesh that, “Even in
Hyderabad, where there are several competing MFIs, the sign-up
rate for any microcredit loan among families who were eligible to
borrow was only 27 percent, and only 21 percent of those who had
a small business had taken a microcredit loan”. This showed that
most poor people may not take loans from or save with
microfinance providers (both formal and informal) even when they
32
can; therefore this theory does not apply to all poor because so
many choose not to participate even when they can. On use of
funds for investment, Dunford argues that of those who use a
microfinance provider to obtain a “usefully large sum” of money,
how many actually invest the money in a real business. According
to Baidoo (2014) studies have shown that most funds accessed from
micro finance institutions have been diverted to other
unproductive uses such as purchase of durable consumer goods or
consumption instead. This goes to defy the stance of this theory
that funds accessed from the MFIs are solely used for investment
purposes, as people may for several reasons decide not to invest
funds but consume them. This rather drives households into a debt
trap. Concerning management of the resources to generate
sufficient net revenue, Dunford argues that in most developing
countries there are a lot of factors that could interfere with
the process and hinder the realization of such returns even when
funds have been invested in a viable business. Onugu (2005)
stated that micro enterprises profitability and survival are
hindered by internal (such as poor management, low
entrepreneurial skill, unavailability of skilled manpower and
efficient technology, poor record keeping, etc.) and external
(economic conditions in the country, power supply,
infrastructures, government policies, market size/ weak demand
for product, uneven competition with importers, etc.) factors.
According to him, these major factors can stall any micro
enterprise form generating revenues expected and may even drive
33
the borrower into debt and further poverty where the business
fails. Therefore the stance of this theory on the certainty of
change through micro- financing is still under strong debate till
date.
Other schools of thought on micro financing have also risen
along lines justifying the existence of the Micro- finance
institution. Armendariz (2013), stated that Micro finance
institutions have two contending objectives- of survival and
welfare. From our definition, MFIs evolved originally to provide
financial services to the poor, and therefore have and objective
of alleviating poverty; on the other hand, like every other
enterprise they have an objective of survival/ self-
sustainability. Advocates of the Welfare/ Subsidized Credit
delivery approach to micro financing, argue that the main essence
of micro financing is poverty alleviation, and therefore suggest
that the core poor qualify for grants not loans. They assume the
poor are typically unable to lend and save, and therefore are in
need of subsidized credit services (Appah, John and Soreh, 2012).
They kick against MFIs over-emphasizing self-sustainability and
growth, as this objective can make an MFI profit-seeking rather
than welfare-seeking, which would mean introduction of higher
charges further excluding the extreme poor. They argue that,
Micro finance institutions often receive subsidies, donations and
grants from NGOs, government and profit-organizations for on-
lending to the poor. These gifts serve as a form of equity, and
as such these donor can be seen as investors; only that rather
34
than seek monetary returns, they prefer intrinsic returns
(Baidoo, 2014). Therefore the essence of the MFIs existence
should be centered on providing inexpensive financial services
and cheap loans to the poor- providing subsidized credit
services. On the other hand, the Institutional/ Commercial
sustainable Microfinance approach advocates for self-
sustainability, and argue that MFIs should be able to cover their
costs with its revenues. They hold the opinion that, the poor can
and do save and repay their loans to a market-oriented interest
rate, but need secure financial institutions for doing this
(Appah et al., 2012). They criticize the welfare approach as they
believe that MFIs, can easily attain self – sustainability and
make profits and therefore do not need gifts (donations, grants
or subsidies). In defense against the claims of the welfare
approach that their approach will discriminate providing services
to the extreme poor, they posit that competition among
microfinance entrepreneurs will prevent for-profit MFIs to charge
astronomical interest rates (Armendariz, 2013). They state that
self-sufficiency leads to long-term sustainability for
Microfinance Institutions, which will facilitate greater poverty
alleviation in the long-term (Baidoo, 2014). According to Baidoo,
from empirical evidence MFIs which proved self-sufficient tended
to loan borrowers who were either slightly above or slightly
below the poverty line in their respective countries; and this
defeats the aim of reaching and developing the extreme poor of
the society. Also, empirical evidence has shown based on growth
35
estimates that, heavily subsidized MFIs remain at its infancy
(Armendariz, 2013). According to her, far less than expected
households have benefit from their products; they have been found
to not necessarily serve the core poor; they provide exceedingly
small micro savings and insurance; and suffer from a potential
mismatch between what the MFI offers and what the potential
client would prefer. Therefore there have been suggestions that
microfinance should move away completely from the “dual
objective”; while others advocate a balance be struck between
both objectives to properly position the MFI to reach its goal of
service provision and sustainability.
EMPIRICAL LITERATURE
There have been several studies on the concept of micro-
financing as a strategy or tool for achieving development and
alleviating poverty globally, across countries, in a country,
state, district or settlements (like rural or urban areas). In
this section we discuss findings of such studies and attempt to
differentiate or associate these findings.
Most studies on the ‘discuss’ of micro financing are highly
concentrated in developing countries, especially in Asia and
Africa. Some studies have been carried out across countries or
even continents. Burne (2009) conducted a study empirically
comparing the impact of micro finance institutions on development
in some Asian and African countries. Data was gathered from
primary and secondary sources from Asia (6 MFIs in Cambodia and 3
36
in Philipines) and Africa (6 MFIS Ethiopia, and 5 in Uganda). The
study developed an econometric model to measure the relationship.
For development, he used average savings and loan balances per
clients as indicators; while the explanatory variables of micro
financing was proxied with size of the MFI (number of staff) and
experience (number of years in locality). The study results
revealed that micro finance had a significant positive
relationship with development; and that micro credit was the most
robust mechanism to boost development. He also found that MFI
size was irrelevant, but their level of experience positively
impacted on the amount of credit granted to the poor. Savings was
found to be the best estimator of development from the study. The
study also revealed that the number of personnel working with
microfinance institutions like in Uganda increased steadily over
time, and thus matched the development. There was found no
significant difference between marginal impact of microfinance
institutions based on geographical positioning between Asia and
Africa; but there was found an environment independent positive
impact of MFIs on development in low- income countries.
In Latin America and the Caribbeans, a study was carried out
by Nicholas (2011) to examine the effects of microfinance on
extreme poverty rates as defined by the poverty headcount ratio
at $2 a day and $1.25 a day, while controlling for structural
economic changes. His objective was to dispute critics who posit
that the costs of microfinance outweighs the benefits. They adopt
a panel-data analysis to capture effects over time and across
37
countries. The study spans over the time 1996 – 2008, and is
conducted in 17 countries from Latin America and the Caribbean
(Argentina, Bolivia, Brazil, Chile, Colombia, Costa Rica,
Dominican Republic, Ecuador, El Salvador, Guatemala, Honduras,
Mexico, Nicaragua, Panama, Paraguay, Peru, and Venezuela).
Secondary data was sourced from MIX Market which included total
borrowings, gross loan portfolio, number of active borrowers, and
the number of women borrowers for each of the countries listed
above. To control for other factors that may cause economic
growth, and thereby reduce the poverty head count ratios, the
study introduced to its model World Development Indicators: cost
to start a business (as a percent of GNI per capita), expenditure
on secondary education (as a percent of GDP per capita), female
labor participation rate (as a percent of the female population),
lending interest rate (as a percent), expenditure on research and
development (as a percent of GDP), time required to enforce a
contract (number of days) and the perception of crime as a
constraint to business (as a percent of managers surveyed). The
ordinary Least Square panel regression was the statistical tool
adopted for the study. The result findings did show that micro
finance had a statistically significant effect on reducing
poverty at both the $2 and $1.25 a day levels. It also revealed
that micro finance made a substantial contribution to decreasing
poverty when combined with other, more structural, contributors
to economic development. Coefficients of human capital variables
signaled a much larger effect on reducing poverty than the
38
different measures of microfinance. They conclude that as
microfinance continues to grow and reach more of the world’s
poor, it will give the poor the opportunity to take charge of
their own economic situation and work their way out of poverty.
For studies peculiar to an area or country, there are quite a
number. Khander (2003) studied impact of microfinance on poverty,
based on household survey data collected in 1991/92 and 1998/99
in Bangladesh. He hypothesized that micro finance had an
insignificant or non-existent impact on aggregate poverty
reduction since it mainly funds informal activities which have
low market demand. He used the panel survey method in other to
capture the long-term effect of the micro credit programs, since
they often take a long time to influence outcomes such as assets
or human capital investment- household or individual welfare. He
estimated the effects of micro-finance on consumption, poverty
and non-land assets for participants, non-participants, and an
average villager, assuming that micro-finance programs have
spillover (externality) effects. The study utilized secondary
data generated from a 2- period survey carried out by BIDS and
World Bank in 1991/92 and 1998/99 respectively; therefore the
study sample was restricted to households who formed the panel
during the two periods, 1638 households. His findings revealed
that micro financing programs contributed positively to raising
per capita consumption, mainly on non-food, as well as household
non-land asset. This he said increases the probability that the
program participants may be able to lift themselves out of
39
poverty. The findings also showed that micro-finance impacted
positively on welfare for all households, including non-
participants; which indicated that micro-finance programs were
helping the poor beyond income redistribution with contribution
to local income growth. The results showed that the micro finance
programs had spillover effects in local economies, thereby
increasing local village welfare, especially as it helped reduce
extreme poverty more than moderate poverty at the village level.
He also noted that the aggregate poverty reduction effects was
not quite substantial to have a large dent on national level
aggregate poverty. He recommended micro-finance should perhaps go
beyond the provision of financial services to finding ways to
improve the skills of its poor borrowers to improve their
productivity and income, so that MFIs can exhibit a stronger
impact on poverty reduction.
In Africa where nearly 100% of the countries are developing,
literature on micro financing seems to be more popular in
slightly advanced developing nations like South Africa, Kenya,
Nigeria, and Ghana. Some studies are area specific. In South
Africa, Sheraton (2004) carried out an analysis of the
effectiveness of microfinance with Western Cape as the case
study. The study focused on the investigating the extent to which
the UN/ OSCAL model of micro finance was being applied in South
Africa. Primary data was sourced from the views of community
members and groups (semi- formal lenders, savings clubs and
informal money lenders) collected through an interviewer-
40
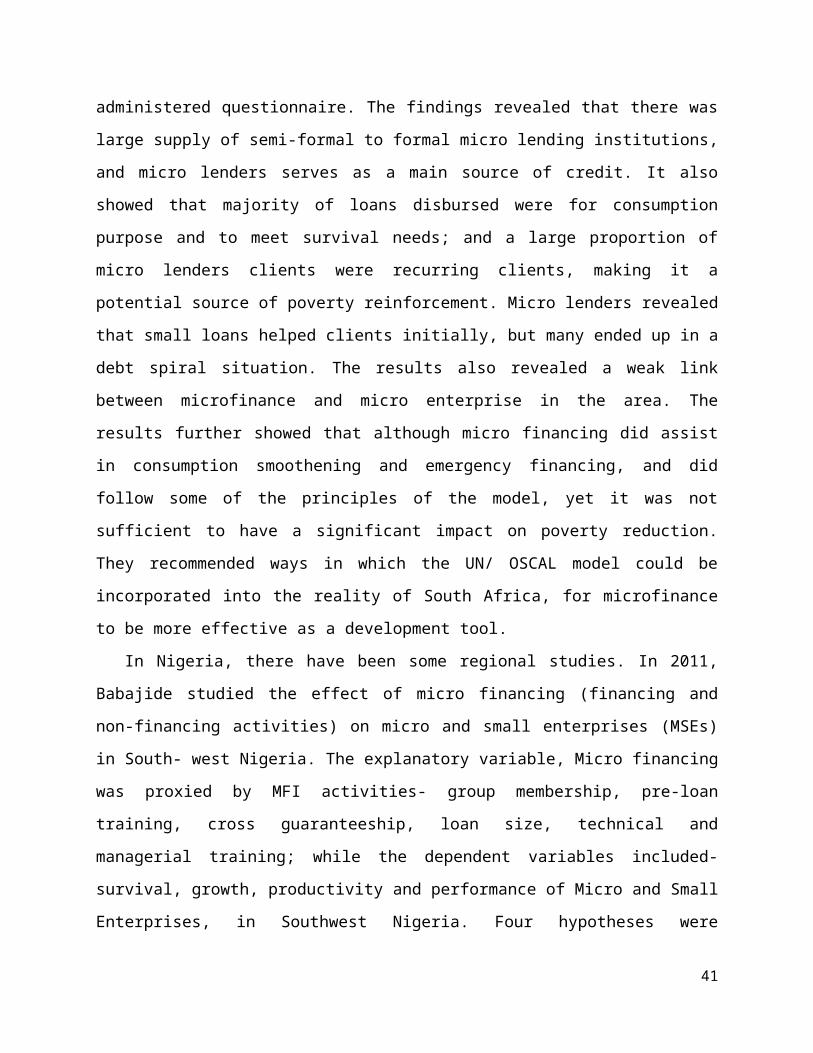
administered questionnaire. The findings revealed that there was
large supply of semi-formal to formal micro lending institutions,
and micro lenders serves as a main source of credit. It also
showed that majority of loans disbursed were for consumption
purpose and to meet survival needs; and a large proportion of
micro lenders clients were recurring clients, making it a
potential source of poverty reinforcement. Micro lenders revealed
that small loans helped clients initially, but many ended up in a
debt spiral situation. The results also revealed a weak link
between microfinance and micro enterprise in the area. The
results further showed that although micro financing did assist
in consumption smoothening and emergency financing, and did
follow some of the principles of the model, yet it was not
sufficient to have a significant impact on poverty reduction.
They recommended ways in which the UN/ OSCAL model could be
incorporated into the reality of South Africa, for microfinance
to be more effective as a development tool.
In Nigeria, there have been some regional studies. In 2011,
Babajide studied the effect of micro financing (financing and
non-financing activities) on micro and small enterprises (MSEs)
in South- west Nigeria. The explanatory variable, Micro financing
was proxied by MFI activities- group membership, pre-loan
training, cross guaranteeship, loan size, technical and
managerial training; while the dependent variables included-
survival, growth, productivity and performance of Micro and Small
Enterprises, in Southwest Nigeria. Four hypotheses were
41
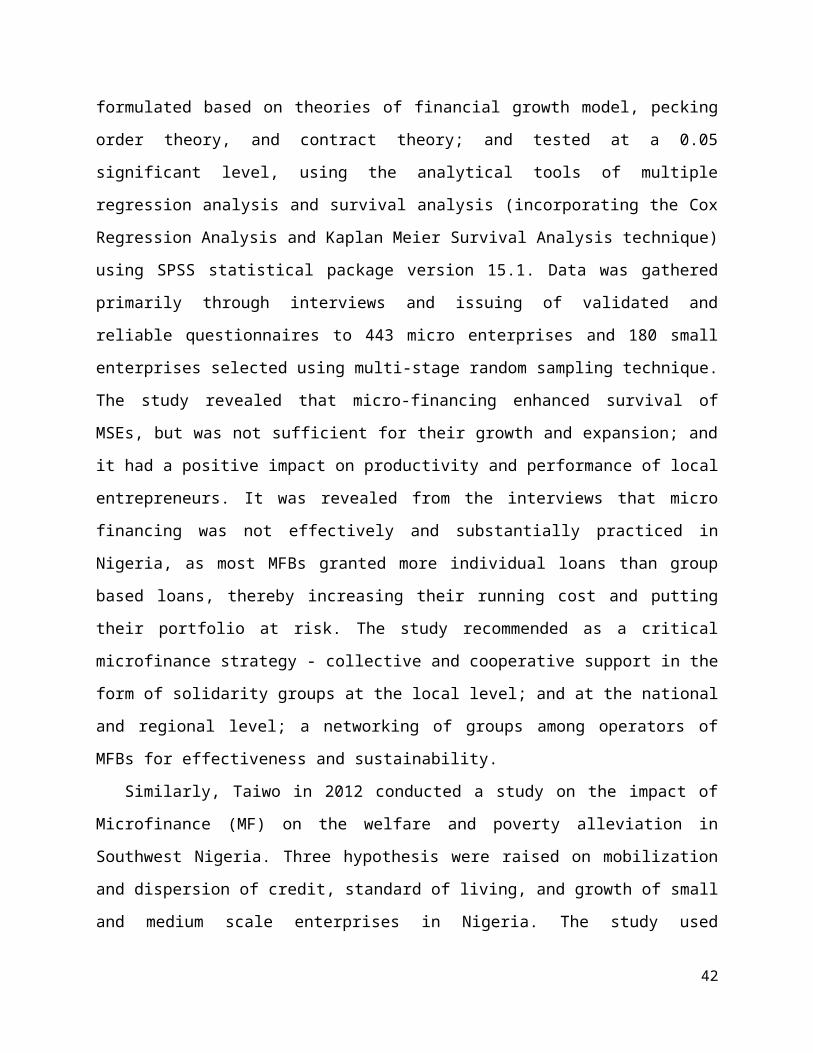
formulated based on theories of financial growth model, pecking
order theory, and contract theory; and tested at a 0.05
significant level, using the analytical tools of multiple
regression analysis and survival analysis (incorporating the Cox
Regression Analysis and Kaplan Meier Survival Analysis technique)
using SPSS statistical package version 15.1. Data was gathered
primarily through interviews and issuing of validated and
reliable questionnaires to 443 micro enterprises and 180 small
enterprises selected using multi-stage random sampling technique.
The study revealed that micro-financing enhanced survival of
MSEs, but was not sufficient for their growth and expansion; and
it had a positive impact on productivity and performance of local
entrepreneurs. It was revealed from the interviews that micro
financing was not effectively and substantially practiced in
Nigeria, as most MFBs granted more individual loans than group
based loans, thereby increasing their running cost and putting
their portfolio at risk. The study recommended as a critical
microfinance strategy - collective and cooperative support in the
form of solidarity groups at the local level; and at the national
and regional level; a networking of groups among operators of
MFBs for effectiveness and sustainability.
Similarly, Taiwo in 2012 conducted a study on the impact of
Microfinance (MF) on the welfare and poverty alleviation in
Southwest Nigeria. Three hypothesis were raised on mobilization
and dispersion of credit, standard of living, and growth of small
and medium scale enterprises in Nigeria. The study used
42
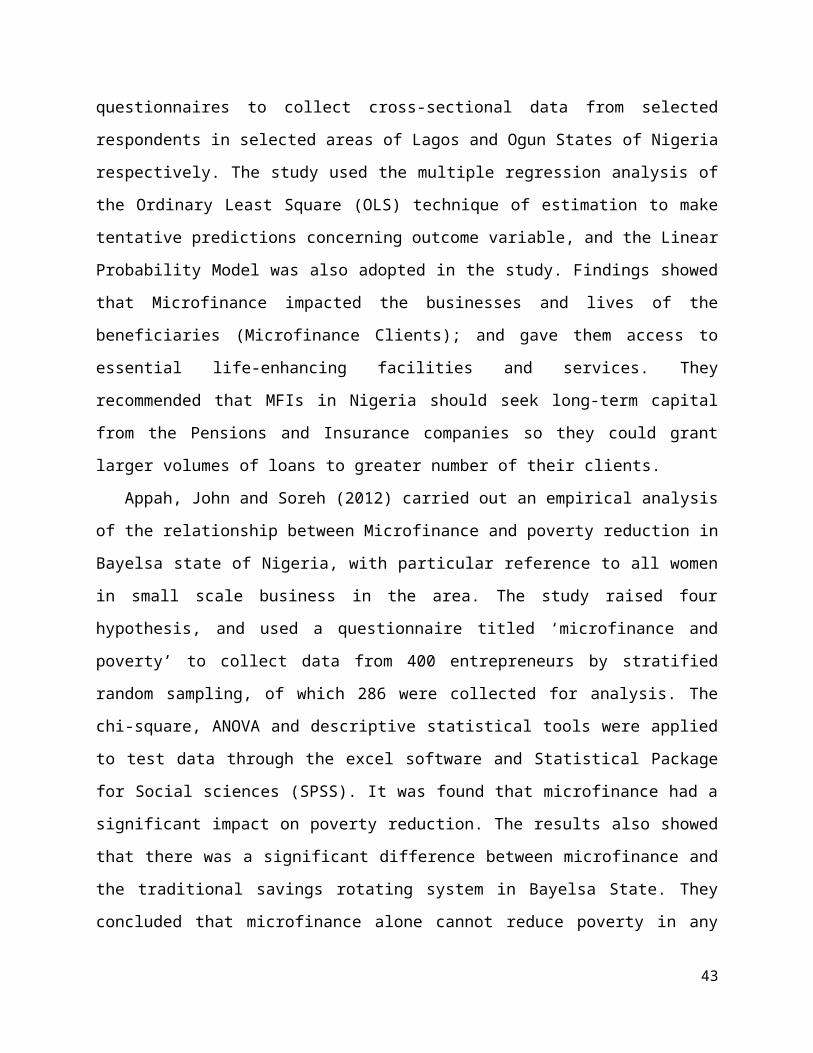
questionnaires to collect cross-sectional data from selected
respondents in selected areas of Lagos and Ogun States of Nigeria
respectively. The study used the multiple regression analysis of
the Ordinary Least Square (OLS) technique of estimation to make
tentative predictions concerning outcome variable, and the Linear
Probability Model was also adopted in the study. Findings showed
that Microfinance impacted the businesses and lives of the
beneficiaries (Microfinance Clients); and gave them access to
essential life-enhancing facilities and services. They
recommended that MFIs in Nigeria should seek long-term capital
from the Pensions and Insurance companies so they could grant
larger volumes of loans to greater number of their clients.
Appah, John and Soreh (2012) carried out an empirical analysis
of the relationship between Microfinance and poverty reduction in
Bayelsa state of Nigeria, with particular reference to all women
in small scale business in the area. The study raised four
hypothesis, and used a questionnaire titled ‘microfinance and
poverty’ to collect data from 400 entrepreneurs by stratified
random sampling, of which 286 were collected for analysis. The
chi-square, ANOVA and descriptive statistical tools were applied
to test data through the excel software and Statistical Package
for Social sciences (SPSS). It was found that microfinance had a
significant impact on poverty reduction. The results also showed
that there was a significant difference between microfinance and
the traditional savings rotating system in Bayelsa State. They
concluded that microfinance alone cannot reduce poverty in any
43
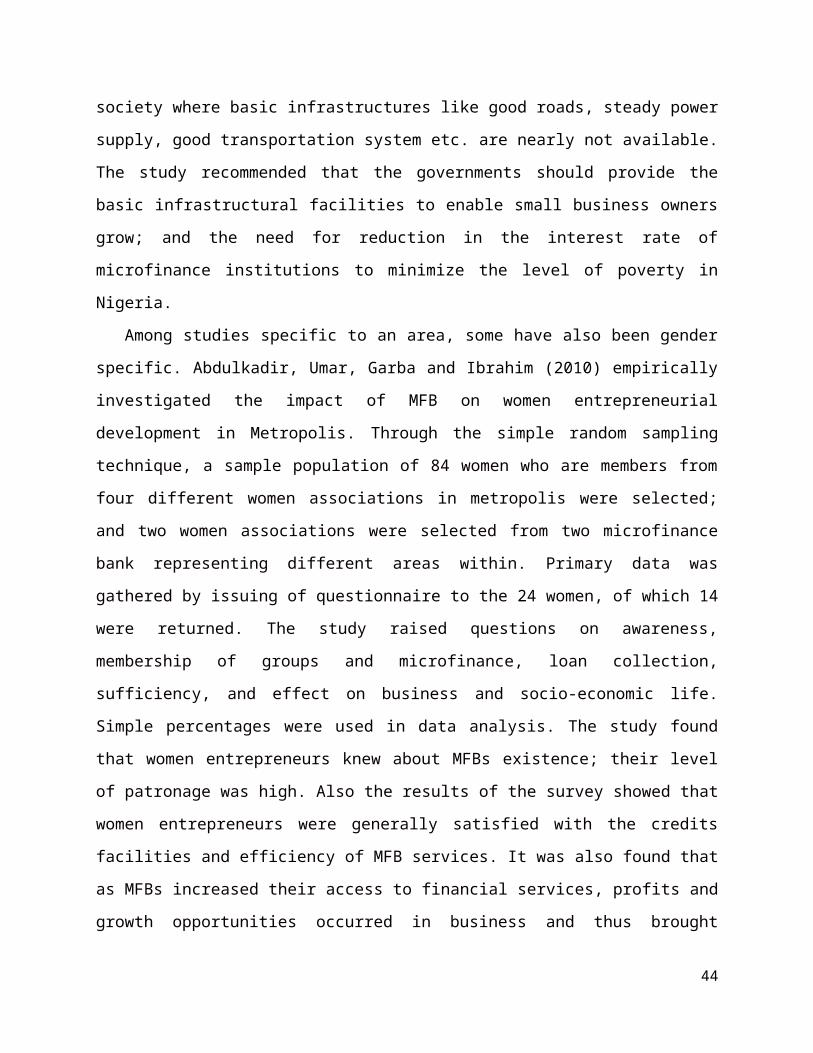
society where basic infrastructures like good roads, steady power
supply, good transportation system etc. are nearly not available.
The study recommended that the governments should provide the
basic infrastructural facilities to enable small business owners
grow; and the need for reduction in the interest rate of
microfinance institutions to minimize the level of poverty in
Nigeria.
Among studies specific to an area, some have also been gender
specific. Abdulkadir, Umar, Garba and Ibrahim (2010) empirically
investigated the impact of MFB on women entrepreneurial
development in Metropolis. Through the simple random sampling
technique, a sample population of 84 women who are members from
four different women associations in metropolis were selected;
and two women associations were selected from two microfinance
bank representing different areas within. Primary data was
gathered by issuing of questionnaire to the 24 women, of which 14
were returned. The study raised questions on awareness,
membership of groups and microfinance, loan collection,
sufficiency, and effect on business and socio-economic life.
Simple percentages were used in data analysis. The study found
that women entrepreneurs knew about MFBs existence; their level
of patronage was high. Also the results of the survey showed that
women entrepreneurs were generally satisfied with the credits
facilities and efficiency of MFB services. It was also found that
as MFBs increased their access to financial services, profits and
growth opportunities occurred in business and thus brought
44
positive changes in their socio-economic life. Also, MFBs
impacted positively in enhancing the socio-economic life of women
entrepreneurs. The study therefore, recommended that MFBs, should
come up with appropriate strategies to attract more investors and
women participation in entrepreneurial activities should also be
encourage for women self-reliance and financial sustainability in
the society.
In 2014, Alani and Sani studied the effect of microfinance
banks on rural dwellers in Kogi State of Nigeria. The study
sample constituted of 5 micro finance banks (MFBs) selected by
judgmental sampling. Data was generated through primary source of
interviews and handing out a total of 368 questionnaires to the
customers and staff of the selected banks. The Z – Test
statistical tool was used to test the 3 hypotheses formulated on
– savings mobilization and intermediation, provision of
affordable services, and provision of employment to the rural
dweller. Findings showed that establishment of microfinance banks
in the area, had a positive impact on the lives of the rural
dwellers, as MFBs mobilized savings for financial intermediation
and provided employment opportunities. They observed that due to
lack of training and exposure of the rural dwellers, the
potentials of MFBs for improving the economic potentials of the
active poor in the rural communities is not maximized. They
therefore recommended for training of rural dwellers on how best
to establish, manage, sustain and expand their businesses. They
also found that the CBN monetary policy rates affected the cost
45
of funds of the MFBs, and therefore recommended a reduction in
the rates.
In the same light, some researches have investigated the
relationship between micro financing activities and economic
development especially in terms of developing the active poor
enterprises at the grassroots. Baidoo (2014) carried out a study
on impact of micro finance on grass root development in Ghana,
Kumasi. The study raised 3 research questions on access, role and
cost of micro-credit in grass root business operation. Using
simple random sampling, 10 respondents were selected; and primary
data was gathered from them through questionnaires, interview and
observations. Data was analyzed with simple descriptive
statistics. The results showed that MFIs assisted the grass root
businesses in raising additional capital requirement for the
expansion and development of their businesses. The process of
accessing loan facilities from MFBs was found to be slow. The
results showed that the charges for financial service (interest
rate) discouraged borrowings. He recommended that, MFIs should
endeavor to enhance their managerial skills among other factors.
Lloyd and Robbins (2014) conducted a study in Nigeria, to
examine the impact of the CBN’s Microfinance policy on credit
accessibility and financial inclusion on micro entrepreneurs, low
income household, and the economically active poor, already being
denied access to formal financial services. They used secondary
data sourced majorly from the CBN, and presented in bar charts
and statistically tables; and analyzed with descriptive
46
statistics tools. The study results revealed that only 35% of the
economically active poor had access to financial services. The
study revealed that the preceding finding was as a result of high
cost of accessing funds (the transmission effect of CBNs high
monetary policy rate on bank lending rates), and uneven spread of
micro finance institutions among the 6 geopolitical zones. The
study therefore recommended a reduction in the CBN’s monetary
policy rates from 12% to 9% to reduce cost of funds from micro
finance banks which stood as high as 19%, to enhance financial
inclusiveness and accessibility for the poor. They also
recommended the establishment of more MFIs in areas where they
were lacking, especially in the Northern region.
From the foregoing, most of the studies on micro financing and
the role it plays, relates more to- poverty, micro enterprising,
women and rural dwellings, which shows it is targeted at the
grass roots where the poor and vulnerable are. Most of these
studies differed in terms of geographical location, tools for
gathering data and data analysis techniques. The major tools for
obtaining data observed so far include questionnaires and
interviews which look at the impact of the subject matter on
individual bases and in a few communal bases. There are hardly
any study looking at the aggregate impact of micro financing
which has been adjudged as a necessary tool for development given
its impact on individuals or communities involved in it.
Therefore this gap in literature is what this study seeks to
47

fill; by investigating the aggregate impact of micro financing on
indices of grass root development.
48
CHAPTER THREE
RESEARCH METHODOLOGY
3.0. Introduction
The first chapter of this study dealt with the background of
the study, statement of the problem of the study as well as
hypotheses raised from the objectives and research questions of
the study. The immediate preceding chapter discussed literature
related to the problem and variables of the study. This chapter
discusses the research procedures adopted for this study, namely-
research design, population for the study, instruments for data
collection and data analysis techniques.
3.1 Research design
To achieve the objectives of this study as identified in
chapter one, it is necessary to articulate a research design. A
research design is defined by Barridam (2001) as a frame work or
plan that guides the collection and analysis of data for the
study. It is a model of proof that allows the researcher to draw
inferences concerning causal relations among the variables under
investigation (Nachimas and Nachimas, cited in Baridam, 2001).
There are basically two types of research design (Baridam, 2001)
49
or study research patterns (Nwankwo, 2010) - experimental and
quasi-experimental. According to Baridam (2001), the major
difference between them is that in the experimental design/
study, all the elements of the design are largely under the
control of the researcher- these include research setting,
explanatory variables, study subjects and their assignment to
different groups. He states that in quasi-experimental design/
study, the various elements of the design are not under the
control of the researcher. Nwankwo (2010) defined quasi-
experimental study as “a study in which some threats to internal
and external validity cannot be properly controlled because of
unavoidable situations associated with the study”. According to
Baridam (2001) the quasi-experimental design is often used in
social and administrative science research because the
relationship between variables involved is not subject to
manipulation. The current study on “Micro finance and grass root
development” is of administrative sciences and the relationship
between the variables to be studied is not subject to
manipulation, therefore this study is quasi-experimental.
3.2 Population of Study
The population of this study is made up of the 825 micro
finance bank- clients and staff in Nigeria.
3.3 Data Collection
Data in administrative science research can be obtained
through- survey of existing documents; questionnaire method
50
(personal interviews, telephone interviews, or mail survey); and
observation method (Baridam, 2001). Existing documents according
to him, play a significant role in all types of research, and can
be found in raw or tabulated forms. In their raw form, they are
basic documents or records originally designed as administrative
documents and not research instruments; however, it is often
possible to prepare statistical tabulation from them (raw data)
that can serve as meaningful, valid and reliable data for a
study. According to Baridam (2001) and Osaat (2009), the
tabulated data can be used as the major source of data or as
supplementary data in a research study. Often, available
statistical data such as produced by the Office of Statistics,
Census board, Central Bank, or Government Ministries, refer to
socio-economic information on a large scale (about demographics-
sex, age, etc; income, expenditure patterns, etc.) which provide
information which would normally be difficult to obtain by the
researcher. Considering the nature of factors to be investigated
in this study, it would prove difficult or impossible for the
researcher to generate data that will adequately represent these
factors through the other data collection methods; therefore,
this study adopts the method of ‘Survey of existing documents’
(secondary data), to determine the relationship between the
variables.
3.4 Operational Measures of the Variables
The key operational variables involved in this study include:
51
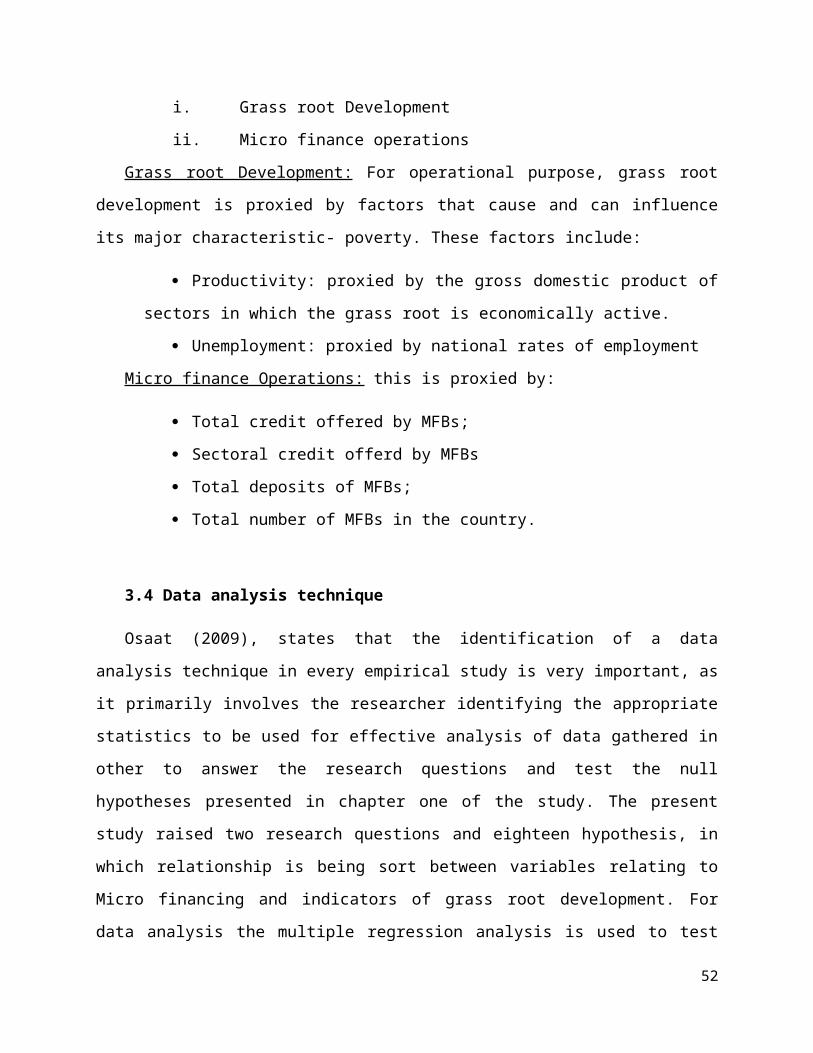
i. Grass root Development
ii. Micro finance operations
Grass root Development: For operational purpose, grass root
development is proxied by factors that cause and can influence
its major characteristic- poverty. These factors include:
Productivity: proxied by the gross domestic product of
sectors in which the grass root is economically active.
Unemployment: proxied by national rates of employment
Micro finance Operations: this is proxied by:
Total credit offered by MFBs;
Sectoral credit offerd by MFBs
Total deposits of MFBs;
Total number of MFBs in the country.
3.4 Data analysis technique
Osaat (2009), states that the identification of a data
analysis technique in every empirical study is very important, as
it primarily involves the researcher identifying the appropriate
statistics to be used for effective analysis of data gathered in
other to answer the research questions and test the null
hypotheses presented in chapter one of the study. The present
study raised two research questions and eighteen hypothesis, in
which relationship is being sort between variables relating to
Micro financing and indicators of grass root development. For
data analysis the multiple regression analysis is used to test
52
the hypothesis; and the coefficient of determination (r2) will
be used to measure the rate at which the dependent variable is
explained by independent variables. The analysis and model for
this study is therefore specified as follows:
Grass roots development = f (Micro finance operations)……………1
Considering the dimensions and measures of the variables, this
could otherwise be written as:
Productivity; employment = f (Micro-credit; micro-deposits;
Size of micro finance industry)
Model 1: for Hypothesis 1- 15
Productivity by sector (Agriculture, Mining, Manufacturing,
Real Estate, and Commerce) = f (Micro-credit to sector, micro-
deposits, Size of micro finance industry)
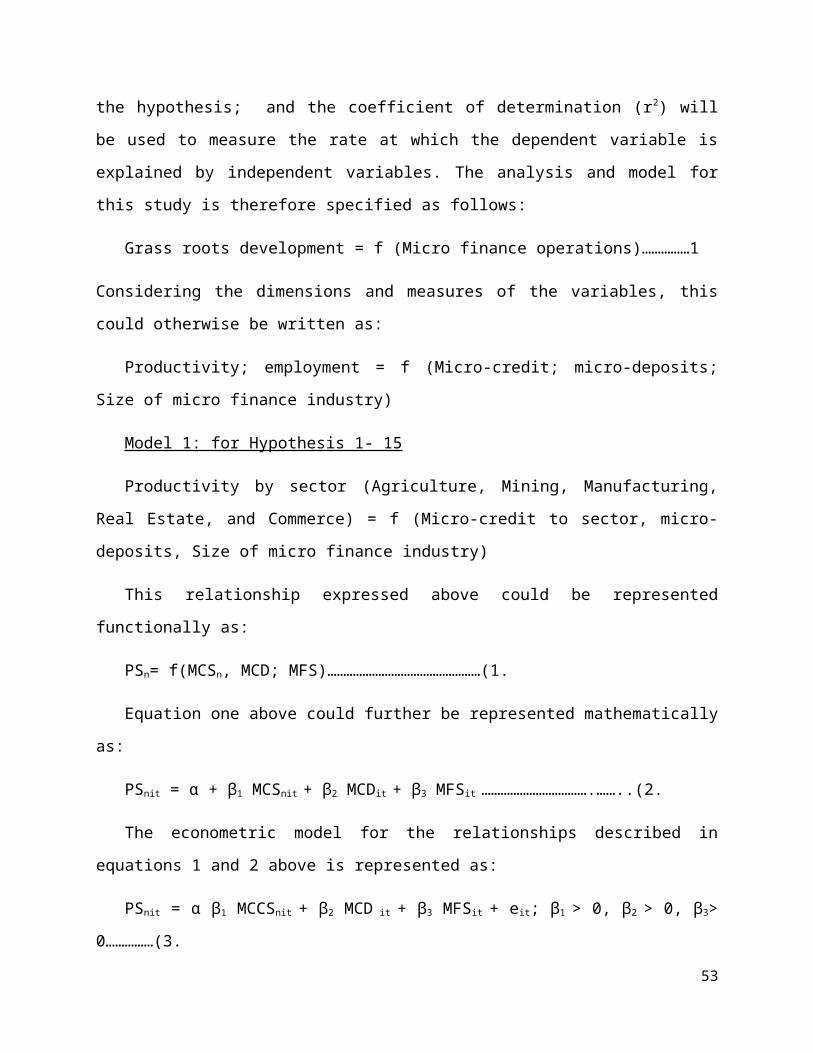
This relationship expressed above could be represented
functionally as:
PSn= f(MCSn, MCD; MFS)…………………………………………(1.
Equation one above could further be represented mathematically
as:
PSnit = α + β1 MCSnit + β2 MCDit + β3 MFSit …………………………….……..(2.
The econometric model for the relationships described in
equations 1 and 2 above is represented as:
PSnit = α β1 MCCSnit + β2 MCD it + β3 MFSit + eit; β1 > 0, β2 > 0, β3>
0……………(3.
53
Where:
PSnit = Productivity growth rate of the sector;
MCCSnit = Growth rate of Micro-credit allocated to the sector;
MCDit = Growth rate of Micro-deposits;
MFSit = Growth rate of number of micro finance banks- Size of
micro finance industry;
α = intercept;
β 1 = coefficient of the explanatory variable- MCCS
β2 = coefficient of the explanatory variable- MCD
β3 = coefficient of the explanatory variable- MFS
e = error term
n = Sectors under study which include – Agriculture, Mining,
Manufacturing, Real estate/ Construction, and Transport/
Commerce.
i = cross-sectional variable from 1,2, 3,…nth.
t = time series variable from 1, 2, 3...nth.
Apriori expectation β1 > 0, β2 > 0, β3> 0.
Model 2: for Hypothesis 16- 18
Employment = f (Micro-credit to sector, micro-savings, Size of
micro finance industry)
54
This relationship expressed above could be represented
functionally as:
E = f(MCC, MCD; MFS)…………………………………………(1.
Equation one above could further be represented mathematically
as:
Eit = α + β1 MCCit + β2 MCDit + β3 MFSit …………………………….……..(2.
The econometric model for the relationships described in
equations 1 and 2 above is represented as:
Eit = α β1 MCCit + β2 MCD it + β3 MFSit + eit; β1 > 0, β2 > 0, β3>
0……………(3.
Where:
Eit = Rate of Employment;
MCCit = Growth rate of total Micro-credit;
MCDit = Growth rate of Micro-deposits;
MFSit = Growth rate of number of micro finance banks- Size of
micro finance industry;
α = intercept;
β 1 = coefficient of the explanatory variable- MCC
β2 = coefficient of the explanatory variable- MCD
β3 = coefficient of the explanatory variable- MFS
e = error term
55
n = Sectors under study which include – Agriculture, Mining,
Manufacturing, Real estate/ Construction, and Transport/
Commerce.
i = cross-sectional variable from 1,2, 3,…nth.
t = time series variable from 1, 2, 3...nth.
Apriori expectation β1 > 0, β2 > 0, β3> 0.
Test of significance: To test for significance of relationships, the
Z-test will be adopted for this study in place of the t-test
because of the large sample size involved. According to Barridam
(2001), where the number of observations in a given test is above
25, the Z-test is applied to test the significance of the
relationship found; hence for each hypothesis, all the
appropriate data will be submitted into the Z-test formula. The
formula for this is:
Z= (r / 1) * r = (n-1)1/2
This study is conducted at a 5% level of significance.
Decision Rule: Going by the Z- test we reject the null
hypothesis and accept an alternative, if the calculated value is
greater than the critical tabulated value: Zc>Zt = significant
relationship. Since this study will uses a 95% confidence
56
interval; therefore the probability figure for the level of
significance of 0.05 is 1.64, which is our Zt. Therefore where
our Zc exceeds 1.64, the null hypothesis is rejected. This also
implies that if the Probability figure (Prob.) for our Zc exceeds
our 0.05 significance level, we reject the null hypothesis.
Therefore we state thus:
Reject null hypothesis when: Zc>Zt, or Prob. Value < significance value
CHAPTER 4
PRESENTATION AND ANALYSIS OF DATA
57
The previous chapter stated the research design, tools and
procedures this study adopts to achieve its stated objectives.
This section presents data gathered, and results generated from
tests and an analysis of the results. The results of the raw data
gathered, and modified data to suit our purpose of measurements
and results to the test conducted could be found in the appendix.
DESCRIPTIVE STATISTICS
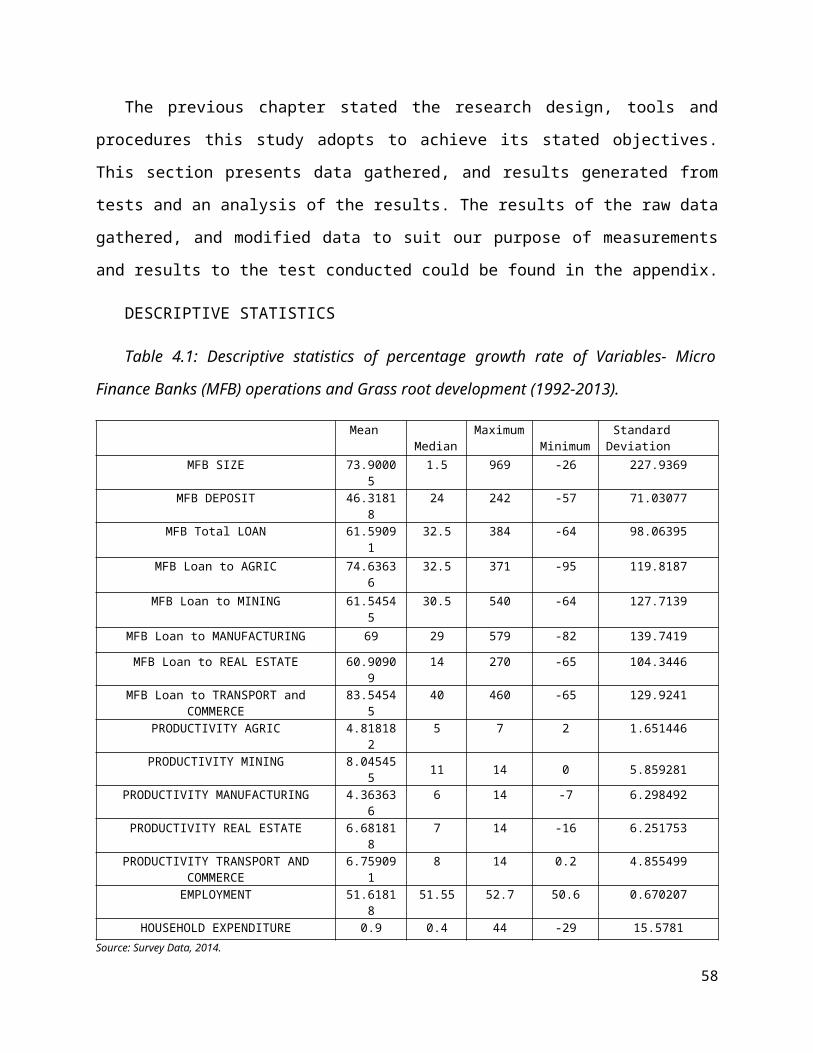
Table 4.1: Descriptive statistics of percentage growth rate of Variables- Micro
Finance Banks (MFB) operations and Grass root development (1992-2013).
Mean Median
Maximum Minimum
Standard Deviation
MFB SIZE 73.90005
1.5 969 -26 227.9369
MFB DEPOSIT 46.31818
24 242 -57 71.03077
MFB Total LOAN 61.59091
32.5 384 -64 98.06395
MFB Loan to AGRIC 74.63636
32.5 371 -95 119.8187
MFB Loan to MINING 61.54545
30.5 540 -64 127.7139
MFB Loan to MANUFACTURING 69 29 579 -82 139.7419
MFB Loan to REAL ESTATE 60.90909
14 270 -65 104.3446
MFB Loan to TRANSPORT andCOMMERCE
83.54545
40 460 -65 129.9241
PRODUCTIVITY AGRIC 4.818182
5 7 2 1.651446
PRODUCTIVITY MINING 8.045455 11 14 0 5.859281
PRODUCTIVITY MANUFACTURING 4.363636
6 14 -7 6.298492
PRODUCTIVITY REAL ESTATE 6.681818
7 14 -16 6.251753
PRODUCTIVITY TRANSPORT ANDCOMMERCE
6.759091
8 14 0.2 4.855499
EMPLOYMENT 51.61818
51.55 52.7 50.6 0.670207
HOUSEHOLD EXPENDITURE 0.9 0.4 44 -29 15.5781Source: Survey Data, 2014.
58
From the table above, MFB loans to Transport and Commerce
recorded the highest average growth rate of 83% within the
period, closely followed by MFB loan to Agriculture. House Hold
expenditure recorded the least average growth rate at 0.9%,
closely followed by Productivity in the Manufacturing sector out
of all our study variables. MFB size recorded the highest maximum
growth rate figure in the period among the variables. MFB size
recorded the most volatile growth rate of all the variable as
shown in its standard deviation figure; while employment rate
recorded the least deviations from its average.
Research Question 1: In what ways has micro financing increased
productivity in sectors where the grass root is economically active?
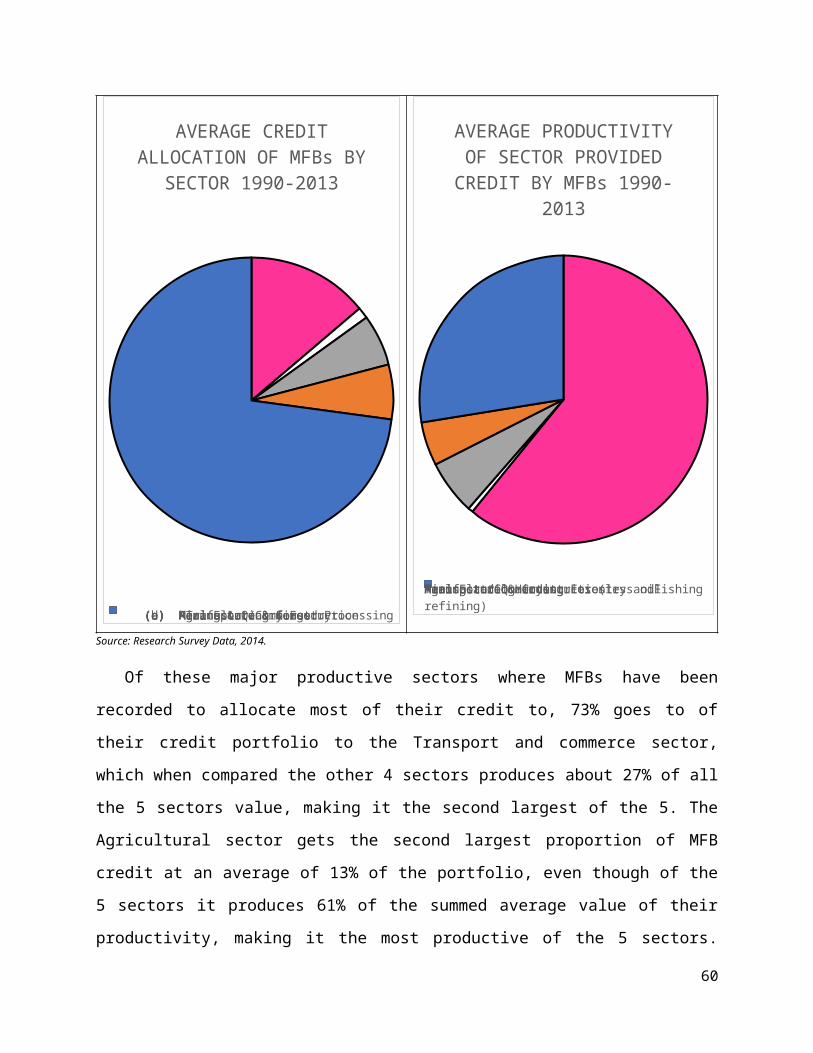
Figure 4.1: Comparison of MFB average apportioning of credit to sectors and thesector’s aggregate productivity.
59
AVERAGE CREDIT ALLOCATION OF MFBs BY
SECTOR 1990-2013
(a) Agriculture & forestry (b) Mining & Quarrying (c) Manufacturing & Food Processing (d) Real Estate & Construction (e) Transport/Commerce
AVERAGE PRODUCTIVITY OF SECTOR PROVIDED CREDIT BY MFBs 1990-
2013
Agricultural Hunting Forestry andFishingMining and QuarryingManufacturing industries (less oil refining)Real Estate & ConstructionTransport/Commerce
Source: Research Survey Data, 2014.
Of these major productive sectors where MFBs have been
recorded to allocate most of their credit to, 73% goes to of
their credit portfolio to the Transport and commerce sector,
which when compared the other 4 sectors produces about 27% of all
the 5 sectors value, making it the second largest of the 5. The
Agricultural sector gets the second largest proportion of MFB
credit at an average of 13% of the portfolio, even though of the
5 sectors it produces 61% of the summed average value of their
productivity, making it the most productive of the 5 sectors.
60
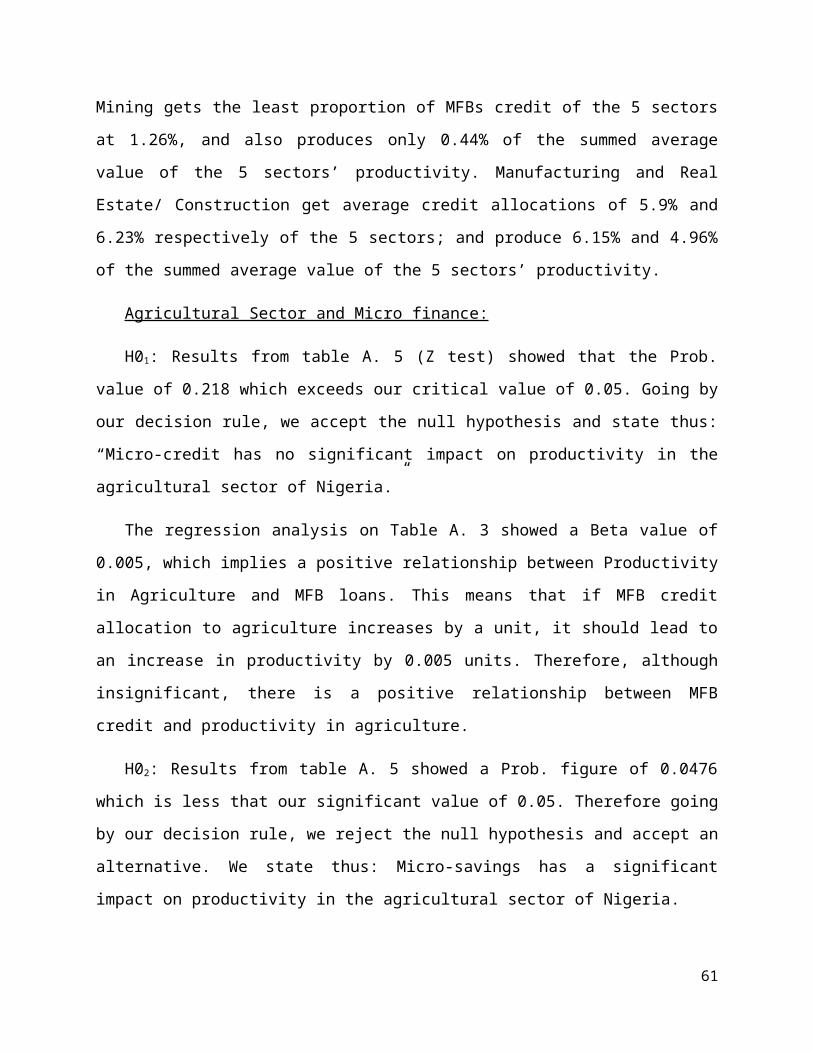
Mining gets the least proportion of MFBs credit of the 5 sectors
at 1.26%, and also produces only 0.44% of the summed average
value of the 5 sectors’ productivity. Manufacturing and Real
Estate/ Construction get average credit allocations of 5.9% and
6.23% respectively of the 5 sectors; and produce 6.15% and 4.96%
of the summed average value of the 5 sectors’ productivity.
Agricultural Sector and Micro finance:
H01: Results from table A. 5 (Z test) showed that the Prob.
value of 0.218 which exceeds our critical value of 0.05. Going by
our decision rule, we accept the null hypothesis and state thus:
“Micro-credit has no significant impact on productivity in the
agricultural sector of Nigeria.”
The regression analysis on Table A. 3 showed a Beta value of
0.005, which implies a positive relationship between Productivity
in Agriculture and MFB loans. This means that if MFB credit
allocation to agriculture increases by a unit, it should lead to
an increase in productivity by 0.005 units. Therefore, although
insignificant, there is a positive relationship between MFB
credit and productivity in agriculture.
H02: Results from table A. 5 showed a Prob. figure of 0.0476
which is less that our significant value of 0.05. Therefore going
by our decision rule, we reject the null hypothesis and accept an
alternative. We state thus: Micro-savings has a significant
impact on productivity in the agricultural sector of Nigeria.
61

Table A. 3 results reveal a negative Beta coefficient of -
0.014. This means a unit increase in savings could lead to a
decrease in Agricultural productivity by 0.014 units, implying an
inverse relationship. Therefore, there is a significant negative
relationship between MFB- savings and Productivity in
Agriculture.
H03: Our test of significance stands at 0.05, for which the
Prob. Figure for MFB size stood at 0.0811, which is above our
critical value. Therefore with respect to our decision rule we
accept the null hypothesis and state thus: “Size of the micro-
finance industry has no significant relationship with
productivity in the agricultural sector of Nigeria.”
Beta figure presented on table A. 3 showed -0.0027, which
depicts a negative relationship between agricultural productivity
and size of MFB industry. Hence, MFB size has a negative yet
insignificant impact on Productivity in Agricultural sector.
Table A. 4 (Coefficient of determination) showed that MFB
operations- size, credit, and savings- all together accounted for
only 0.17 variations in agricultural productivity in Nigeria
during the period under study.
Mining/ Quarrying and Micro financing:
H04: Table A. 5 showed that the calculated value for this
relationship was 0.4271 for MFB-credit, which is above our
critical value of 0.05, therefore we accept the null hypothesis
based on our decision rule. We therefor state: “Micro-credit has
62
no significant impact on productivity in the mining sector of
Nigeria.”
Regression analysis on Table A. 3 showed a Beta of -0.00089,
which implies am inverse relationship; such that a unit increase
in MFB credit to the sector should yield a decline in Mining
productivity by 0.0009 units. Hence MFB credit has a negative yet
non-significant relationship with Productivity in Mining.
H05: Our results show from Table A. 5 that the Prob. Value
stood at 0.5030 for MFB deposits, which is above our critical
value of 0.05, therefore we accept the null hypothesis based on
our decision rule. We therefor state: “Micro-savings has no
significant impact on productivity in the mining sector of
Nigeria”.
The Beta value as shown on Table A. 3 was -0.01346, which
implies am inverse relationship; such that a unit increase in MFB
deposits should yield a decline in mining productivity by 0.01346
units. Hence MFB savings has a negative yet non-significant
relationship with Productivity in Mining.
H06: Our test of significance stands at 0.05, for which the
Prob. Figure for MFB size stood at 0.3196, which is above our
critical value. Therefore with respect to our decision rule we
accept the null hypothesis and state thus: “Size of the micro-
finance industry has no significant relationship with
productivity in the mining sector of Nigeria.”
63

Beta figure presented on table A. 3 showed -0.0057, which
depicts a negative relationship between agricultural productivity
and size of MFB industry. Hence, MFB size has a negative yet
insignificant impact on Productivity in Agricultural sector.
The Coefficient of determination on Table A. 4, showed that
MFB operations- size, credit, and savings- all together accounted
for only 0.13 variations in mining productivity in Nigeria during
the period under study.
Manufacturing and Food Processing and Micro financing:
H07: Table A. 5 showed that the calculated value for this
relationship was 0.2315 for MFB-credit, which is above our
critical value of 0.05, therefore we accept the null hypothesis
based on our decision rule. We therefor state: “Micro-credit has
no significant impact on productivity in the manufacturing and
food processing sector of Nigeria.”
Regression analysis on Table A. 3 showed a Beta of -0.02446,
which implies am inverse relationship; such that a unit increase
in MFB credit to the sector should yield a decline in Mining
productivity by 0.024 units. Hence MFB credit has a negative yet
non-significant relationship with Productivity in Manufacturing
and food processing sector of Nigeria.
.H08: Results from table A. 5 (Z test) showed that the Prob.
value of 0.4336 for Micro-savings which exceeds our critical
value of 0.05. Going by our decision rule, we accept the null
64

hypothesis and state thus: “Micro-savings has no significant
impact on productivity in the manufacturing sector of Nigeria.”
The regression analysis on Table A. 3 showed a Beta value of
0.031, which implies a positive relationship between Productivity
in Agriculture and MFB loans. This means that if MFB credit
allocation to agriculture increases by a unit, it should lead to
an increase in productivity by 0.031 units. Therefore, although
insignificant, there is a positive relationship between MFB
credit and productivity in Manufacturing and food processing
sector of Nigeria.
.H09: Our value for test of significance stands at 0.05, for
which the Prob. figure for MFB size stood at 0.1595, which is
above our critical value. Therefore with respect to our decision
rule we accept the null hypothesis and state thus: “Size of the
micro-finance industry has no significant relationship with
productivity in the manufacturing sector of Nigeria.”
Beta figure presented on table A. 3 showed -0.0086, which
depicts a negative relationship between agricultural productivity
and size of MFB industry. Hence, MFB size has a negative yet
insignificant impact on Productivity in the manufacturing sector
of Nigeria.
Table A. 4 (Coefficient of determination) showed that MFB
operations- size, credit, and savings- all together accounted for
only 0.19 variations in agricultural productivity in Nigeria
during the period under study.
65
Real Estate/ Construction and Micro financing:
H010: The calculated value for this relationship as shown on
Table 7 was 0.51551 for MFB-credit, which is above our critical
value of 0.05, therefore we accept the null hypothesis based on
our decision rule. We therefor state: “Micro-credit has no
significant impact on productivity in the Real Estate/
Construction sector of Nigeria.”
Regression analysis on Table A. 3 showed a Beta of -0.0087,
which implies am inverse relationship; such that a unit increase
in MFB credit to the sector should yield a decline in Real
Estate/ Construction productivity by 0.0087 units. Hence MFB
credit has a negative yet non-significant relationship with
Productivity in Real Estate/ Construction sector of Nigeria.
H011: Results from table A. 5 (Z test) showed that the Prob.
value of 0.4985 for Micro-savings which exceeds our critical
value of 0.05. Going by our decision rule, we accept the null
hypothesis and state thus: “Micro-savings has no significant
impact on productivity in the Real Estate/ Construction sector of
Nigeria.”
The regression analysis on Table A. 3 showed a Beta value of -
0.1329, which implies a negative relationship between
Productivity in Real Estate/ Construction and MFB loans. This
means that if MFB credit allocation to agriculture increases by a
unit, it should lead to an increase in productivity by 0.13
units. Therefore, although insignificant, there is a negative
66

relationship between MFB credit and productivity in the Real
Estate/ Construction sector of Nigeria.
H012: Results from table A. 5 showed a Prob. figure of 0.047
which is less that our significant value of 0.05. Therefore going
by our decision rule, we reject the null hypothesis and accept an
alternative. We state thus: “Size of the micro-finance industry
has a significant relationship with productivity in the Real
Estate/ Construction sector of Nigeria’.
Table A.4 results reveal a negative Beta coefficient of -
0.016. This means a unit increase in savings could lead to a
decrease in Real Estate/ Construction productivity by 0.016
units, implying an inverse relationship. Therefore, there is a
significant negative relationship between MFB- savings and
Productivity in the Real Estate/ Construction sector of Nigeria.
Transport/ Commerce:
H013: The calculated value for this relationship as shown on
Table A. 5 was 0.3899 for MFB-credit, which is above our critical
value of 0.05, therefore we accept the null hypothesis based on
our decision rule. We therefor state: “Micro-credit has no
significant impact on productivity in the Transport/ Commerce
sector of Nigeria.”
Regression analysis on Table A. 3 showed a Beta of -0.0123,
which implies am inverse relationship; such that a unit increase
in MFB credit to the sector should yield a decline in Transport/
Commerce sector productivity by 0.0123 units. Hence MFB credit
67
has a negative and non-significant relationship with Productivity
in Transport/ Commerce sector of Nigeria.
H014: Results from table A. 5 (Z test) showed Prob. value of
0.5031, which exceeds our critical value of 0.05. Going by our
decision rule, we accept the null hypothesis and state thus:
“Micro-savings has no significant impact on productivity in the
Transport/ Commerce sector of Nigeria.”
The regression analysis on Table A. 3 showed a Beta value of
0.017, which implies a positive relationship between Productivity
in Transport/ Commerce sector and MFB-savings. This means that
when MFB deposits increases by a unit, it should lead to an
increase in productivity by 0.005 units. Therefore, although
insignificant, there is a positive relationship between MFB
savings and productivity in the Transport/ Commerce of Nigeria.
H015: Our value for test of significance stands at 0.05, for
which the Prob. figure for MFB size stood at 0.2884, which is
above our critical value. Therefore with respect to our decision
rule we accept the null hypothesis and state thus: “Size of the
micro-finance industry has no significant relationship with
productivity in the Transport/ Commerce sector of Nigeria.”
Beta figure presented on table A. 3 showed -0.005228, which
depicts a negative relationship between Transport/ Commerce
productivity and size of MFB industry. Hence, MFB size has a
negative yet insignificant impact on Productivity in the
Transport/ Commerce sector of Nigeria.
68
Table A. 4 (Coefficient of determination) showed that MFB
operations- size, credit, and savings- all together accounted for
only 0.095 variations in Transport/ Commerce productivity in
Nigeria during the period under study.
In response to our research question, MFB operations has
impacted on productivity in some sectors where the grass root is
economically active. MFBs have the potential of increasing
productivity in agriculture through its allocation of credit to
the sector. They also have the potential to increase productivity
in the Manufacturing and transport/ commerce sectors through
increasing deposits. They influences productivity in Agriculture
through growth in deposits and in Real estate and construction
through growth in the size of the MFB industry, but negatively.
Research Question 2: In what ways has micro financing impacted
on employment?
H016: Results from table A. 5 (Z test) showed that the Prob.
value of 0.3887 which exceeds our critical value of 0.05. Going
by our decision rule, we accept the null hypothesis and state
thus: “There is no significant relationship between micro-credit
and employment in Nigeria.”
The regression analysis on Table A. 3 showed a Beta value of
0.004, which implies a positive relationship between employment
rate and MFB loans. This means that if total MFB credit
allocation increases by a unit, it should lead to an increase in
employment by 0.004 units. Therefore, although insignificant,
69
there is a positive relationship between MFB credit and
employment in Nigeria.
.H017: Results from table A. 5 (Z test) showed that the Prob.
value of 0.4986 for Micro-savings which exceeds our critical
value of 0.05. Going by our decision rule, we accept the null
hypothesis and state thus: “There is no significant relationship
between micro-deposits and employment in Nigeria.”
The regression analysis on Table A. 3 showed a Beta value of -
0.00435, which implies a negative relationship between MFB loans
and employment rate. This means that if MFB deposits increases by
a unit, it should lead to an increase in employment by 0.004
units. Therefore, although insignificant, there is a negative
relationship between MFB savings and employment in Nigeria.
H018: Results from table A. 5 (Z test) showed that the Prob.
value of 0.05 which equals our critical value of 0.05. Going by
our decision rule, we reject the null hypothesis and state thus:
“There is a significant relationship between size of the micro
finance industry and employment in Nigeria.”
The regression analysis on Table A. 3 showed a Beta value of
0.001, which implies a positive relationship between size of the
micro finance industry and employment in Nigeria. This means that
if size of the micro finance industry increases by a unit, it
should lead to an increase in employment by 0.001 units.
Therefore, there is a positive and significant relationship
70
between size of the micro finance industry and employment in
Nigeria.
The coefficient of determination from Table A. 4 signified
that MFB operations- size, credit, and savings- all together
accounted for only 0.24 variations in rate of employment in
Nigeria.
Therefore, MFB operations impact on employment especially
through the size of the industry (number of MFBs in operation),
as expansion in the size of the industry increases employment
rate. Micro- credit lending activities also have the potential of
growing employment rate, but is yet to make significant.
71
CHAPTER FIVE
DISCUSSION, CONCLUSION, AND RECOMMENDATION
5.0. Introduction
His chapter discusses findings of the study on the possible
ways Micro finance can impact on grass root development. Based on
the findings, conclusions are drawn regarding the relationships
and recommendations made accordingly.
5. 1 Summary and Discussion of Findings
This study attempted to investigate channels through which micro
finance can impact grass root development, by identifying the
characteristics that require development attention in the grass
root and the very factors that define these characteristics and
have the potential to bring about desired development. The study
identified poverty as a major characteristic that could only be
addressed through economic development measures. From literature
it was pointed out that the major cause of poverty was low
productivity by the active poor and unemployment. Going by the
classical theory of micro finance, poverty can be alleviated
through micro financing directed at productivity for expansion,
creating employment and increasing household income. This study
therefore investigated the possibilities of micro finance
impacting on grass root development given the criticisms faced by
this theory. The study identified sectors of the economy in which
the grass root was predominantly active – Agriculture, Mining,
72
Manufacturing, Real estate/ Construction and transport/ Commerce.
The study proceeded to analyze the impact of micro finance
operations (Provision of credit, accepting savings and the
providing access to its services (size of the industry)) on
employment rates and the productivity of these sectors at an
aggregate level.
The study found that in the case of productivity by sector,
Micro finance through its micro- credit function could only
positively influence productivity in the agricultural sector, and
although its impact was insignificant, as was the case for all
other sectors. The positive relationship meets our Apriori
expectation and confirms Babajide’s (2012) findings of positive
impact on productivity and performance of local entrepreneurs who
were mostly into agriculture, but was not sufficient for MSE
growth and expansion. This result of Micro- credit insignificant
impact on all the sectors further confirms confirms Posner, cited
in Nicholas (2011) findings that micro- credit could positively
impact on development at the individual level, but due to the
small nature of the grass root enterprise markets, the impact of
the program would be insufficient to affect aggregate
development. Nicholas (2011), just like Appah, John and Soreh
(2012), found that micro financing only had statistically
significant effect on reducing poverty when combined with other
more structural contributors to economic development.
On the other hand the negative impact of Micro-credit on most
of the sectors was contrary to the findings of Abdulkadir, Umar,
73
Garba and Ibrahim (2010), but tallied with the findings of
Sheraton (2004), who stated that MFB loans rather yielded a
negative impact on development as a result of the funds granted
either being diverted to consumption expenditure or
mismanagement. She explained that majority of loans disbursed
were rather used for consumption purpose and to meet survival
needs and not investments. This therefore made micro- credit a
potential source of poverty reinforcement, with most clients
ending up in a debt spiral situations; therefore making
microfinance efforts not sufficient to have a significant impact
on poverty reduction. Baidoo (2014) explained that charges for
financial service (interest rate) discouraged borrowings in
Ghana, and made repayment more difficult, further leading to a
negative impact where repayment becomes impossible. Nicolas
(2011) also explained that lack of adequate infrastructure could
also deter performance of the entrepreneurs as costs may rise
above revenue, giving rise to firms struggling with debt
repayment issues, which could eventually lead to the demise of
the business, making the entrepreneur worse off. This is contrary
to our Apriori expectations and the assumptions of the classical
theory of micro-financing.
Findings also showed that MFB savings mobilization had the
potential of positively influencing productivity in Manufacturing
and transport/commerce sectors, although presently not to a
significant level. This implied that accumulations in savings
impacts on these two sectors most. This met our Apriori
74
expectation and tallies with the findings of Burne (2009), who
found savings to be the best estimator of development in his
study.
Micro-deposits/savings only had a significant impact on
productivity in agriculture, but negatively, this is contrary to
our Apriori expectation. Similarly, it was found to relate
negatively with productivity in mining, real estate and
construction. This could also imply that entrepreneurs in these
sectors depend less on savings, and would rather raise capital
from other sources than save with MFBs.
The size of the micro finance industry had no significant
impact on productivity of any of the sectors. This tallies with
the findings of Burne (2009), who found that size of MFB industry
was irrelevant to development in the grass root enterprises.
Results also showed that size of the MFB industry rather had a
negative relationship with productivity of all the sectors. This
is contrary to our Apriori expectations, but confirms Lloyd and
Robbins (2014). He explained that the uneven spread of micro
finance institutions among the 6 geopolitical zones brought about
problems of access which correlated negatively with development
at the grass root.
The results showed that micro financing did not improve
productivity in most of the sectors where the grass root was
economically active. And this agrees with Alani and Sani (2014)
findings in Nigeria, for which he explained that from their
75
observations, due to lack of training and exposure of the rural
dwellers, the potentials of MFBs for improving the economic
potentials of the active poor in the rural communities was not
maximized.
For employment, only MFB industry growth had a significant and
positive relationship. This met our Apriori expectations and
agrees with the findings of Burne (2009) and Alani and Sani
(2014). They found that the number of personnel working with
microfinance institutions in the area of its establishment
increased steadily over time, and thus matched the development.
This would mean that as the number of MFBs increase, employment
opportunities are also created in the industry and other
industries associated with it.
Similarly, Micro- credit expansion had the potential of
positively influencing employment rates in Nigeria, although to
an insignificant level for now. This meets our Apriori
expectation, and corresponds with the findings of
Micro- savings rather had and negative yet insignificant
impact on employment rates. This could imply that when savings
increase, investments in sectors that generate employment may
decrees, therefore negatively impacting on rates of employment.
These findings suggest that micro-credit is preferred to micro-
savings as a source of funds for investment in employment
generating businesses. As Andari and Neri (2007) argue that
credit rather than savings is a better source of investments.
76
5. 2. Conclusion
- Aggregate poverty reduction effects of micro financing has
not been quite substantial to have a large dent on national
level aggregate poverty, and therefore grass root
development.
- Agricultural sector stands the better chance of bringing
about development through the use of micro-credits.
- Micro-credit has the potential to negatively impact on
development, especially where corporate governance,
monitoring, and lack of training by the MFBs prevail; and
where cost of loans (interest rates) are quite high.
- Micro savings serves as a source of positive growth in the
Transport/ Commerce and manufacturing sectors.
- Uneven geographical dispersion of micro finance banks in the
country, is a potential threat to the industry’s size
impacting positively on sectoral productivity.
- Expansion of the Micro finance industry is more favorable
for purposes of providing employment.
- Infrastructural underdevelopment could be an impediment to
micro finance positive contribution to development.
5.3. Recommendations
77
- MFBs should concentrate more on channeling a larger
proportion of its credit facilities to the agricultural
sector.
- CBN should consider reducing its monetary policy rate, as
this reflects on cost of Micro- credits.
- MFBs should extend their services provided to include
entrepreneurship training to educate entrepreneurs on how
best to manage and utilize funds to yield positive results
MFBs must priorities their functions f monitoring and
ensure business borrowers practice corporate governance, to
reduce chances of business failure due to funs
mismanagement or diversion.
- Establishment of MFBs should be guided to achieve a more
even spread, and give room for greater access to micro
financing.
- For purposes of creating more employment, establishment of
micro finance banks should be encouraged; and other
informal finance providers (who are smaller units) be
encouraged to grow up to the level of being a micro finance
bank, therefore creating more jobs and room for access to
micro- financing.
- Government and Non-governmental agencies should make more
efforts to provide basic infrastructures, necessary for
the smooth operation and survival of these grass root
enterprises.
78
5. 4 Suggestions for further studies
Given the limitations of these study, further research is
possible in cross country or cross continents comparison of
impact of micro finance on grass root development. Similarly,
studies can be carried out on the same topic, but include other
variables such as employment by sectors, growth rate of total
Micro, Small and medium enterprises in the country. Also the same
study can be carried out in other developing countries and states
were necessary data are easily accessible.
BIBLIOGRAPHY
Abdulkadir, F. I; Umar, S.; Bashir G. I. and Ibrahim S. H. (2010). The
Impact of Micro-finance Banks on Women Entrepreneurial
Development in Metropolis. Retrieved on 20/11/2014 from
http://article.sapub.org/10.5923.j.m2economics.20120103.01.html
Alani, G. O. and Sani, J. (2014). Effects of Microfinance Banks on the
Rural Dwellers in Kogi State, Nigeria. International Journal of
Public Administration and Management Research (IJPAMR), Vol. 2,
No 2:66-79. Retrieved on 20/11/2014 from
http://rcmss.com/2014/IJPAMR-VOl2-No2/Effects%20of%20Microfinance
%20Banks%20on%20the%20Rural%20Dwellers%20in%20Kogi%20State,
%20Nigeria.pdf
Amsden, A. H. (2012). Grass Roots War on Poverty. World Economic Review
Vol 1: 114-131, 2012. Retrieved on 20/11/2014 from
79
http://wer.worldeconomicsassociation.org/files/WER-Vol1-No1-
Article7-Amsden.pdf
Armendariz, B. (2013). Microfinance: Theory and Practice. Retrieved on
20/11/2014 from http://www.google.com.ng/url?
sa=t&rct=j&q=&esrc=s&source=web&cd=3&ved=0CEQQFjAC&url=http%3A%2F
%2Fisites.harvard.edu%2Ffs%2Fdocs%2Ficb.topic475042.files
%2FMicrofinanceLecture1.ppt&ei=bndyVODSDJWvabHbgYgO&usg=AFQjCNHNn
8I7fyVedAKZtw66gv8n0yTtjA
Andari B. A. and Neri M. C. (2007). Microcredit diaries: Assessing
microcredit impacts on grassroots development in Peru, Nicaragua
and Mexico. International- American Foundation (IAF) Projects-
Microcredit Evaluation. Inter- American Foundation Project-
Microcredit evaluation- CPS/FGV. Retrieved on 12/11/2014 from
http://www.cps.fgv.br/ibrecps/iaf2_website/IAF2_FGV_CPS_FINAL_REP
ORT_MicrocreditDiaries_sec.pdf
Appah, E.; John, M. S. and Soreh W. (2012). An Analysis of Microfinance
and Poverty Reduction in Bayelsa State of Nigeria. Kuwait Chapter
of Arabian Journal of Business and Management Review Vol. 1,
No.7; March.
Babajide A. A. (2009). “Effects of Microfinancing on Micro and Small
Enterprises in South – West Nigeria”. Being a Ph.D thesis
submitted in partial fulfilment of the requirements for the award
of Ph.D Banking and Finance of the Department of Banking and
Finance, College Of Development Studies, Covenant University,
Ota, Nigeria. Retreived 20/11/2014 http://www.google.com.ng/url?
sa=t&rct=j&q=&esrc=s&source=web&cd=9&ved=0CFgQFjAI&url=http%3A%2F
80
%2Feprints.covenantuniversity.edu.ng%2F693%2F2%2FPhd%2520thesis
%2520final%2520-%2520Abiola.doc&ei=9UduVKyiK4TgaK-
7guAN&usg=AFQjCNG5g3pOcJkn9BE4UN1A66wZR_cr_g
Baidoo T. W. (2014). Impact of micro-finance in grass root development.
Dissertation submitted in partial fulfillment of the requirement
of Chartered of Financial and Investment Analysts, at the
Chartered Institute of Financial and Investment Analysts, Ghana,
April.
https://www.academia.edu/8695333/Impact_of_micro_finance_on_grass
root_business.
Baridam, D. M. (2001). Research Methods in Administrative Sciences (3rd
ed.). Port Harcourt: Sherbrooke Associates.
Brune, A. (2009). An empirical study on the impact of micro finance
institutions on development. Being a Thesis for the award of a
Bachelor of Arts degree in Economics, Institute for Empirical
Research in Economics (IEW), University of Zurich.
Central Bank of Nigeria (2005), Microfinance, Regulatory & Supervisory
framework for Nigeria. Retrieved on 20/11/2014 from
http://www.cenbank.org/OUT/PUBLICATIONS/GUIDELINES/DFD/2006/MICRO
FINANCE%20POLICY.PDF’.
Central Bank of Nigeria, (2014). Micro Finance. Accessed on 20/11/2014.
http://www.cenbank.org/microfinance
DIctionaty.com (2014).
http://dictionary.reference.com/browse/grassroots
Dunford, C. (2012). The Evidence Project What We're Learning about
Microfinance and World Hunger: First Step in the Microfinance
81
Theory of Change: Take a Loan or Save – Do They? Retrieved on
23/11/2014 from
http://microfinanceandworldhunger.org/2012/06/first-step-in-the-
microfinance-theory-of-change-take-a-loan-or-save-do-they/
#sthash.e4NJGHli.dpuf
Enhancing Financial Innovation and Access. (2010) EFInA Access to
Financial Services in Nigeria 2010 Survey. Key Findings.
November. Retrieved on 20/11/2014 from
http://www.efina.org.ng/assets/Documents/EFInAAccess-to-
Financial-Services-in-Nigeria-2010-surveyKey-Findings.pdf?
phpMyAdmin=%2CWvBxPNpx0z2BcKe8h2UcHJI%2CXb
Khandker, S. R. (2003). Microfinance and Poverty: Evidence Using Panel
Data from Bangladesh. The World Bank Development Research Group
January 2003, Policy Research Working Paper 2945
Lloyd, J. E. and Igbani O. R. (2014). National Microfinance Policy and
Credit Accessibility by Micro, Small and Medium Entrepreneurs in
Nigeria. Journal of Good Governance and Sustainable Development
in Africa (JGGSDA), 2(2):18-30. Retrieved on 20/11/2014 from
http://www.google.com.ng/url?
sa=t&rct=j&q=&esrc=s&source=web&cd=7&ved=0CFIQFjAG&url=http%3A%2F
%2Frcmss.com%2F2014%2FJGGSDA-VOL2-No2%2FNATIONAL%2520MICROFINANCE
%2520POLICY%2520AND%2520CRDIT%2520ACCESSIBILITY%2520BY%2520MICRO
%2520SMALL%2520AND%2520MEDIUM%2520ENTERPRENEURS%2520IN
%2520NIGERIA.docx&ei=4odkVOv1H8Pbas_cgIgN&usg=AFQjCNFtLYaGuPUtJ_g
4CdHw6OCcrho-0w
82
National Bureau of Statistics (2010). Survey Report on Micro, Small and
Medium Enterprises (MSMEs) in Nigeria. 2010 National MSME
collaborative survey. Retrieved on 20/11/2014 from
http://www.google.com.ng/url?
sa=t&rct=j&q=&esrc=s&source=web&cd=1&ved=0CB4QFjAA&url=http%3A%2F
%2Fwww.nigerianstat.gov.ng%2Fpages%2Fdownload
%2F67&ei=pghyVJ_6IsnearvBgfAO&usg=AFQjCNF0iX6YEFcYkAoCJd2GugFkv_V
bZQ
National Bureau of Statistics (2012). Living Standards Measurement
Study – Integrated Surveys. Kristen Himelein Development Research
Group, World Bank. Retrieved on 20/11/2014 from
http://www.fao.org/fileadmin/templates/ess/documents/meetings_and
_workshops/Kigali_2012/Living_standards_measurement_study.pdf
Nicholas F. (2011). “Does Microfinance Reduce Poverty? A Study of Latin
America”. The UCLA Undergraduate Journal of Economics 2, No. 1z.
Nwankwo, O.C (2010). Practical Guide To Research Writing (Rev. 3rd
ed.). Port Harcourt: Golden Publishers Limited.
Omoh, (2014). Nigeria ranks third in world poverty. Accessed on
20/11/2014 on http://niajanews.org
Onugu, B. A. N. (2005). “Small and Medium Enterprises (SMEs) In
Nigeria: Problems And Prospects”. Unpublished Ph.D. Dissertation,
St. Clements University, British, West Indies .
Osaat, S. D. (2009).Groundwork of Educational Research Methodology and
Statistics. Port Harcourt: University of Port Harcourt Press.
83
Pilisuk, M., McAllister J. and Rothman A. (1996). Coming Together for
Action: The Challenge of Contemporary Grassroots Community
Organizing. Journal of Social Issues, Vol.52.No.1.1996, pp.15-37.
Retrieved on 20/11/2014 from
http://www.sonoma.edu/users/w/warmotha/psychclasses/490/spring01/
grassroots.html
Sheraton, M. (2004). “An Analysis of the Effectiveness of Microfinance:
A Case Study in the Western Cape”. Retrieved on 30/06/2013 from
http://etd.uwc.ac.za/bitstream/handle/11394/1899/Sheraton_MCOM_20
04.pdf?sequence=1
Taiwo J. N. (2012). The Impact Of Microfinance On Welfare And Poverty
Alleviation In Southwest Nigeria. A PhD Thesis Submitted in
Partial Fulfillment of the Requirements for the Award of PhD
(Banking and Finance), Covenant University, Ota.
U.S. Congress, Office of Technology Assessment (1998). “Grassroots
Development: The African Development Foundation” OTA-F-378
(Washington, DC: U.S. Government Printing Office, June 1988).
NTIS (1998). Grassroots Development: The African Development
Foundation June. Retrieved on 18/11/2014 from http://ota-
cdn.fas.org/reports/8818.pdf
World Bank (2003). World Bank Economic Review, 19(2), 263 – 286.
Retrieved on 20/11/2014 from
http://www-wds.worldbank.org/servlet/WDSContentServer/WDSP/IB/200
3/02/15/000094946_03013104041165/Rendered/PDF/multi0page.pdf
World Bank (2013). World Development Indicators. Accessed on 20/11/2014
http://data.worldbank.org/country/nigeria?display=default
84

APPENDIX
Table A. 1: MFB operations and Development indicesYEARS Community
Banks (Microfin
MFB deposits
MFB Loans&
Advances
Employment to populatio
85
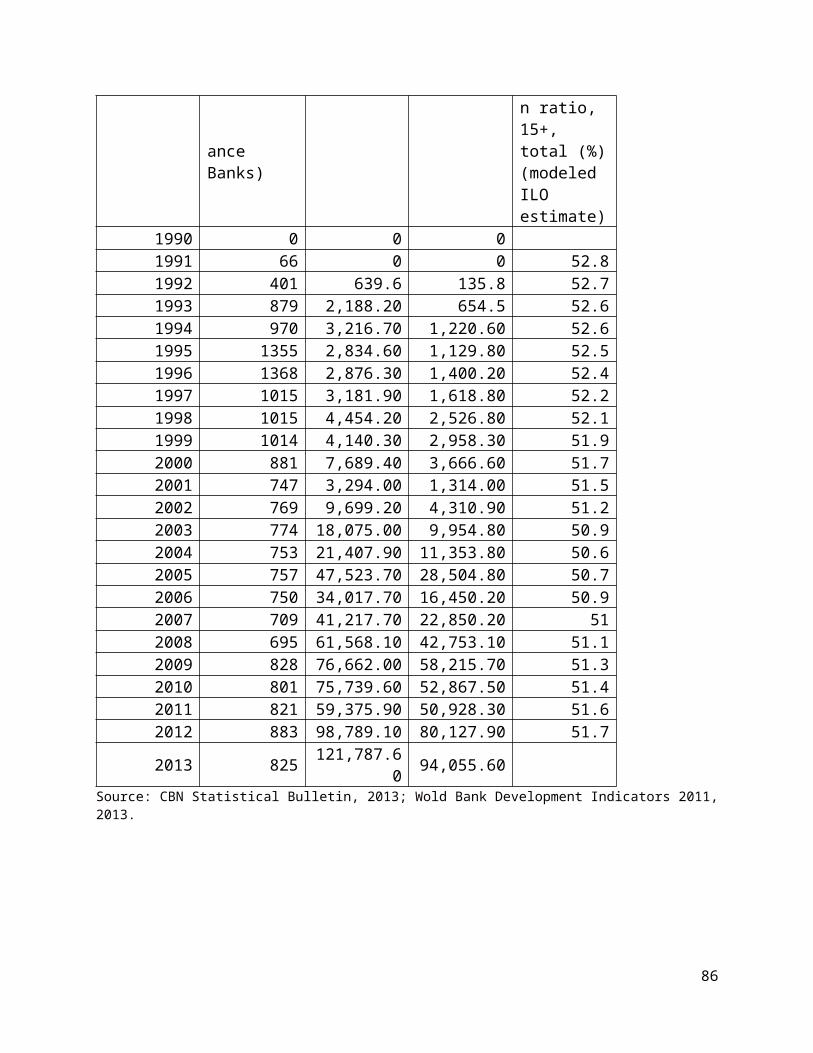
ance Banks)
n ratio, 15+, total (%)(modeled ILO estimate)
1990 0 0 0 1991 66 0 0 52.81992 401 639.6 135.8 52.71993 879 2,188.20 654.5 52.61994 970 3,216.70 1,220.60 52.61995 1355 2,834.60 1,129.80 52.51996 1368 2,876.30 1,400.20 52.41997 1015 3,181.90 1,618.80 52.21998 1015 4,454.20 2,526.80 52.11999 1014 4,140.30 2,958.30 51.92000 881 7,689.40 3,666.60 51.72001 747 3,294.00 1,314.00 51.52002 769 9,699.20 4,310.90 51.22003 774 18,075.00 9,954.80 50.92004 753 21,407.90 11,353.80 50.62005 757 47,523.70 28,504.80 50.72006 750 34,017.70 16,450.20 50.92007 709 41,217.70 22,850.20 512008 695 61,568.10 42,753.10 51.12009 828 76,662.00 58,215.70 51.32010 801 75,739.60 52,867.50 51.42011 821 59,375.90 50,928.30 51.62012 883 98,789.10 80,127.90 51.7
2013 825 121,787.60 94,055.60
Source: CBN Statistical Bulletin, 2013; Wold Bank Development Indicators 2011,2013.
86
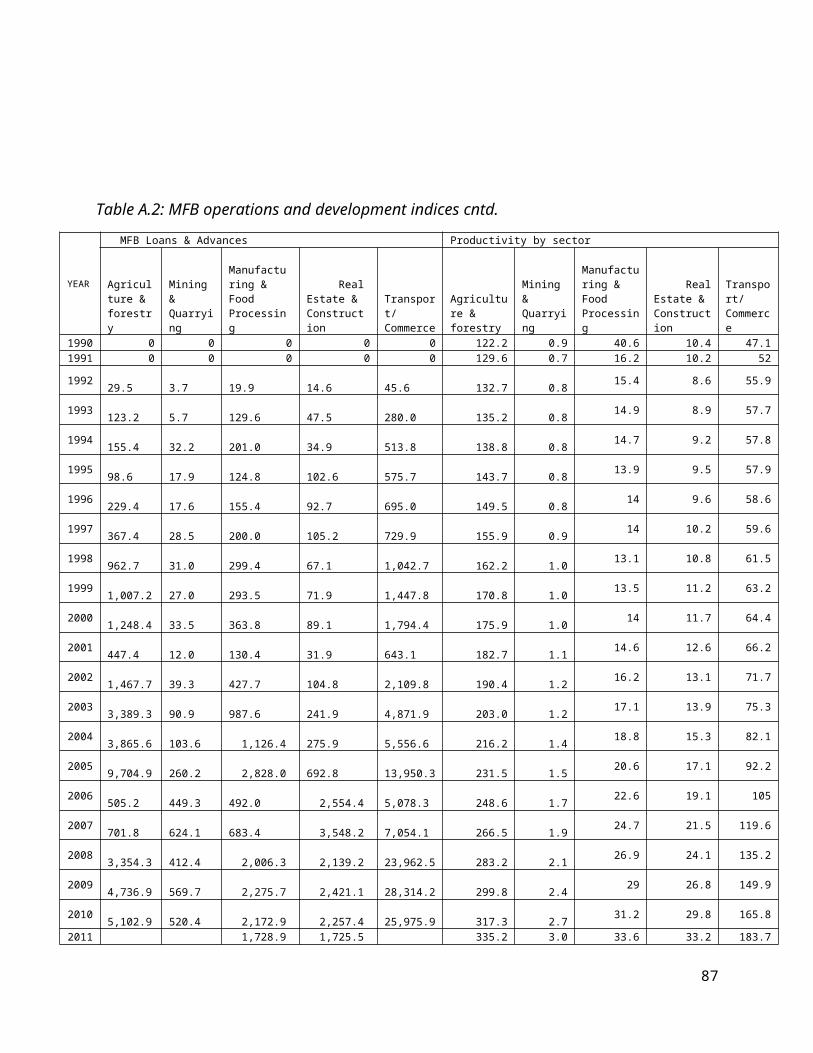
Table A.2: MFB operations and development indices cntd.
YEAR
MFB Loans & Advances Productivity by sector
Agriculture & forestry
Mining & Quarrying
Manufacturing & Food Processing
RealEstate & Construction
Transport/ Commerce
Agriculture & forestry
Mining & Quarrying
Manufacturing & Food Processing
RealEstate & Construction
Transport/ Commerce
1990 0 0 0 0 0 122.2 0.9 40.6 10.4 47.11991 0 0 0 0 0 129.6 0.7 16.2 10.2 52
1992 29.5
3.7
19.9
14.6
45.6 132.7 0.8 15.4 8.6 55.9
1993 123.2
5.7
129.6
47.5
280.0 135.2 0.8 14.9 8.9 57.7
1994 155.4
32.2
201.0
34.9
513.8 138.8 0.8 14.7 9.2 57.8
1995 98.6
17.9
124.8
102.6
575.7 143.7 0.8 13.9 9.5 57.9
1996 229.4
17.6
155.4
92.7
695.0 149.5 0.8 14 9.6 58.6
1997 367.4
28.5
200.0
105.2
729.9 155.9 0.9 14 10.2 59.6
1998 962.7
31.0
299.4
67.1
1,042.7 162.2 1.0 13.1 10.8 61.5
1999 1,007.2
27.0
293.5
71.9
1,447.8 170.8 1.0 13.5 11.2 63.2
2000 1,248.4
33.5
363.8
89.1
1,794.4 175.9 1.0 14 11.7 64.4
2001 447.4
12.0
130.4
31.9
643.1 182.7 1.1 14.6 12.6 66.2
2002 1,467.7
39.3
427.7
104.8
2,109.8 190.4 1.2 16.2 13.1 71.7
2003 3,389.3
90.9
987.6
241.9
4,871.9 203.0 1.2 17.1 13.9 75.3
2004 3,865.6
103.6 1,126.4
275.9
5,556.6 216.2 1.4 18.8 15.3 82.1
2005 9,704.9
260.2 2,828.0
692.8
13,950.3 231.5 1.5 20.6 17.1 92.2
2006 505.2
449.3
492.0 2,554.4
5,078.3 248.6 1.7 22.6 19.1 105
2007 701.8
624.1
683.4 3,548.2
7,054.1 266.5 1.9 24.7 21.5 119.6
2008 3,354.3
412.4 2,006.3 2,139.2
23,962.5 283.2 2.1 26.9 24.1 135.2
2009 4,736.9
569.7 2,275.7 2,421.1
28,314.2 299.8 2.4 29 26.8 149.9
2010 5,102.9
520.4 2,172.9 2,257.4
25,975.9 317.3 2.7 31.2 29.8 165.8
2011 1,728.9 1,725.5 335.2 3.0 33.6 33.2 183.7
87
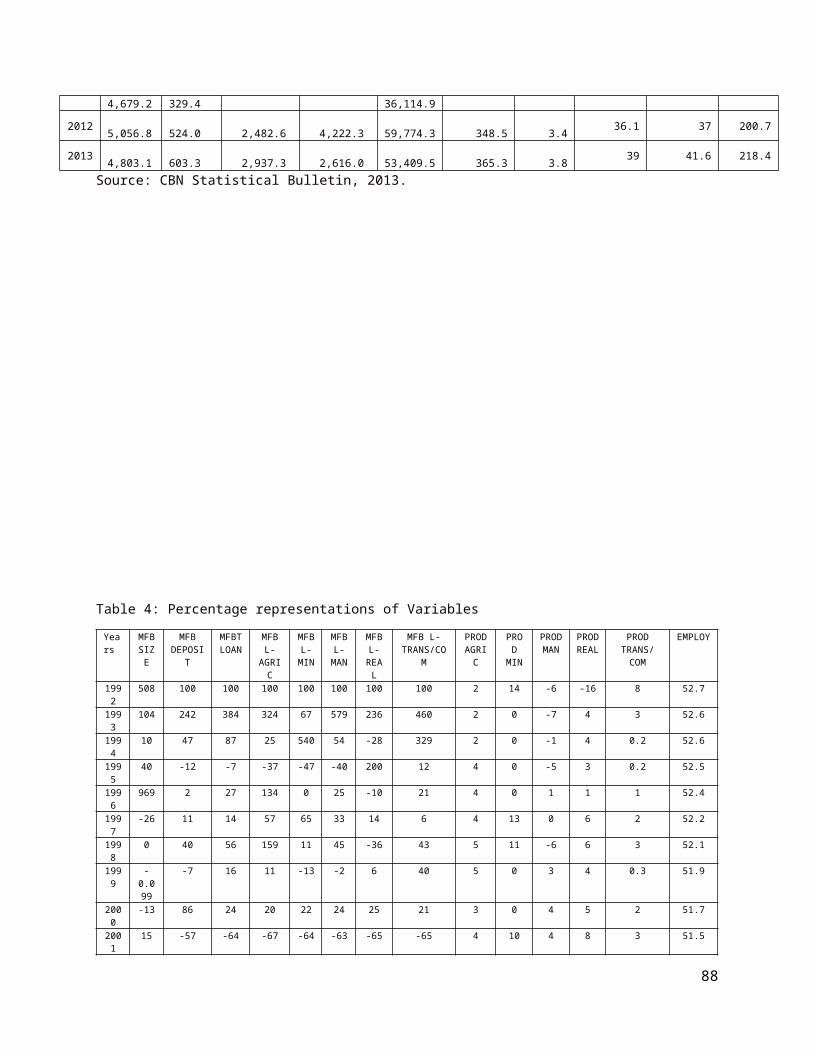
4,679.2 329.4 36,114.9
2012 5,056.8
524.0 2,482.6 4,222.3
59,774.3 348.5 3.4 36.1 37 200.7
2013 4,803.1
603.3 2,937.3 2,616.0
53,409.5 365.3 3.8 39 41.6 218.4
Source: CBN Statistical Bulletin, 2013.
Table 4: Percentage representations of VariablesYears
MFBSIZE
MFBDEPOSI
T
MFBTLOAN
MFBL-AGRIC
MFBL-MIN
MFBL-MAN
MFBL-REAL
MFB L-TRANS/CO
M
PRODAGRIC
PROD
MIN
PRODMAN
PRODREAL
PRODTRANS/COM
EMPLOY
1992
508 100 100 100 100 100 100 100 2 14 -6 -16 8 52.7
1993
104 242 384 324 67 579 236 460 2 0 -7 4 3 52.6
1994
10 47 87 25 540 54 -28 329 2 0 -1 4 0.2 52.6
1995
40 -12 -7 -37 -47 -40 200 12 4 0 -5 3 0.2 52.5
1996
969 2 27 134 0 25 -10 21 4 0 1 1 1 52.4
1997
-26 11 14 57 65 33 14 6 4 13 0 6 2 52.2
1998
0 40 56 159 11 45 -36 43 5 11 -6 6 3 52.1
1999
-0.099
-7 16 11 -13 -2 6 40 5 0 3 4 0.3 51.9
2000
-13 86 24 20 22 24 25 21 3 0 4 5 2 51.7
2001
15 -57 -64 -67 -64 -63 -65 -65 4 10 4 8 3 51.5
88
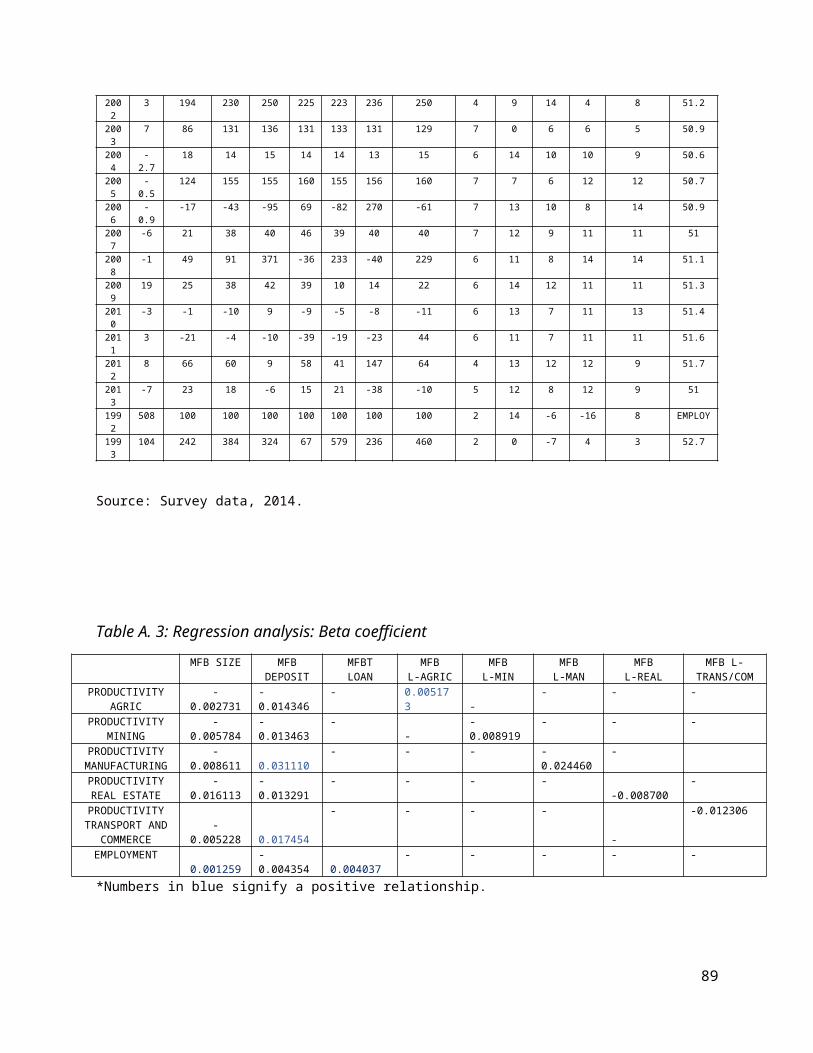
2002
3 194 230 250 225 223 236 250 4 9 14 4 8 51.2
2003
7 86 131 136 131 133 131 129 7 0 6 6 5 50.9
2004
-2.7
18 14 15 14 14 13 15 6 14 10 10 9 50.6
2005
-0.5
124 155 155 160 155 156 160 7 7 6 12 12 50.7
2006
-0.9
-17 -43 -95 69 -82 270 -61 7 13 10 8 14 50.9
2007
-6 21 38 40 46 39 40 40 7 12 9 11 11 51
2008
-1 49 91 371 -36 233 -40 229 6 11 8 14 14 51.1
2009
19 25 38 42 39 10 14 22 6 14 12 11 11 51.3
2010
-3 -1 -10 9 -9 -5 -8 -11 6 13 7 11 13 51.4
2011
3 -21 -4 -10 -39 -19 -23 44 6 11 7 11 11 51.6
2012
8 66 60 9 58 41 147 64 4 13 12 12 9 51.7
2013
-7 23 18 -6 15 21 -38 -10 5 12 8 12 9 51
1992
508 100 100 100 100 100 100 100 2 14 -6 -16 8 EMPLOY
1993
104 242 384 324 67 579 236 460 2 0 -7 4 3 52.7
Source: Survey data, 2014.
Table A. 3: Regression analysis: Beta coefficientMFB SIZE MFB
DEPOSITMFBTLOAN
MFBL-AGRIC
MFBL-MIN
MFBL-MAN
MFBL-REAL
MFB L-TRANS/COM
PRODUCTIVITYAGRIC
-0.002731
-0.014346
- 0.005173 -
- - -
PRODUCTIVITYMINING
-0.005784
-0.013463
--
-0.008919
- - -
PRODUCTIVITYMANUFACTURING
-0.008611 0.031110
- - - -0.024460
-
PRODUCTIVITYREAL ESTATE
-0.016113
-0.013291
- - - --0.008700
-
PRODUCTIVITYTRANSPORT AND
COMMERCE-
0.005228 0.017454
- - - -
-
-0.012306
EMPLOYMENT0.001259
-0.004354 0.004037
- - - - -
*Numbers in blue signify a positive relationship.
89
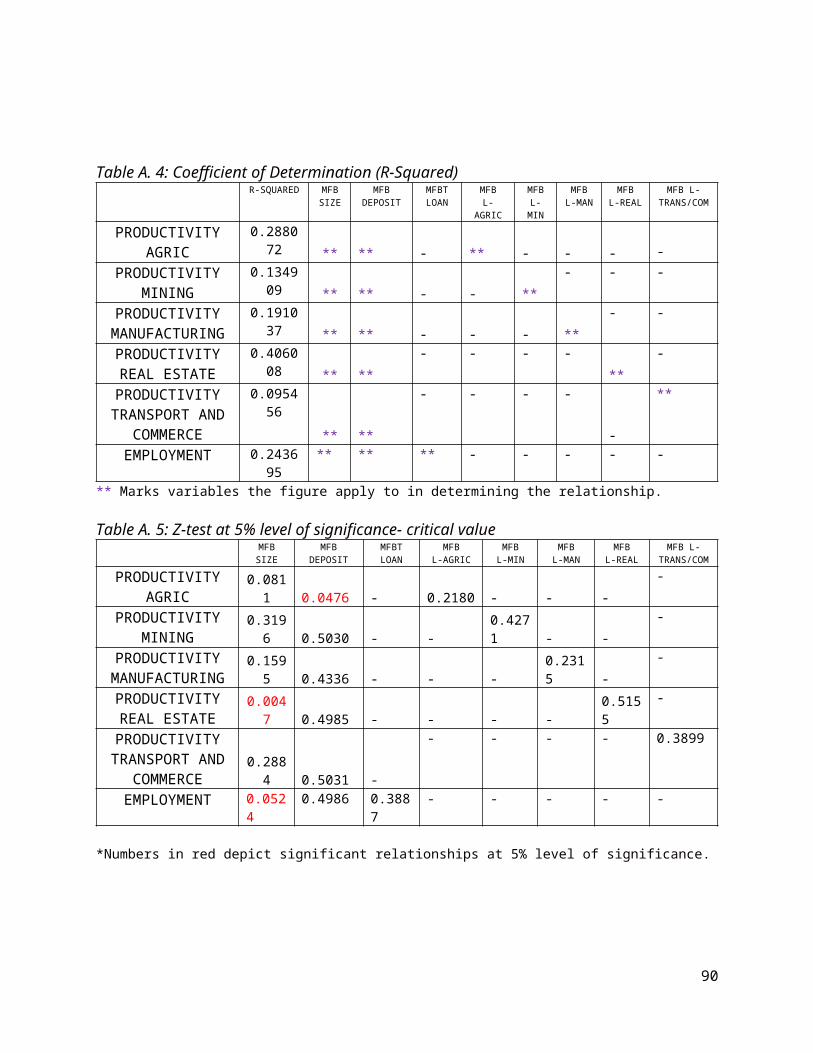
Table A. 4: Coefficient of Determination (R-Squared)R-SQUARED MFB
SIZEMFB
DEPOSITMFBTLOAN
MFBL-
AGRIC
MFBL-MIN
MFBL-MAN
MFBL-REAL
MFB L-TRANS/COM
PRODUCTIVITYAGRIC
0.288072 ** ** - ** - - - -
PRODUCTIVITYMINING
0.134909 ** ** - - **
- - -
PRODUCTIVITYMANUFACTURING
0.191037 ** ** - - - **
- -
PRODUCTIVITYREAL ESTATE
0.406008 ** **
- - - -**
-
PRODUCTIVITYTRANSPORT AND
COMMERCE
0.095456
** **
- - - -
-
**
EMPLOYMENT 0.243695
** ** ** - - - - -
** Marks variables the figure apply to in determining the relationship.
Table A. 5: Z-test at 5% level of significance- critical valueMFBSIZE
MFBDEPOSIT
MFBTLOAN
MFBL-AGRIC
MFBL-MIN
MFBL-MAN
MFBL-REAL
MFB L-TRANS/COM
PRODUCTIVITYAGRIC
0.0811 0.0476 - 0.2180 - - -
-
PRODUCTIVITYMINING
0.3196 0.5030 - -
0.4271 - -
-
PRODUCTIVITYMANUFACTURING
0.1595 0.4336 - - -
0.2315 -
-
PRODUCTIVITYREAL ESTATE
0.0047 0.4985 - - - -
0.5155
-
PRODUCTIVITYTRANSPORT AND
COMMERCE0.2884 0.5031 -
- - - - 0.3899
EMPLOYMENT 0.0524
0.4986 0.3887
- - - - -
*Numbers in red depict significant relationships at 5% level of significance.
90
Related Documents