Impact of mechanization on smallholder agricultural production: evidence from Ghana Frances Cossar Postdoctoral Research in Land Use and Food Security, University of Edinburgh [email protected] / @francossar Draft for Agricultural Economics Society Conference, April 2019 – do not cite Contributed Paper prepared for presentation at the 93rd Annual Conference of the Agricultural Economics Society, University of Warwick, England 15 – 17 April 2019 Abstract: Mechanization is accompanied by changes in the quantity and type of labour required for an activity. Agricultural mechanization is often touted by policy makers as reducing the drudgery associated with agricultural work and as increasing the productivity of the farming system, especially in contexts where traditional technologies appear to be stagnant. For good or for ill, mechanization is expected to replace labour in agriculture. This can either create unemployment, in a pessimistic scenario, or release labour for more productive work outside of the agriculture sector. However, little rigorous analysis has examined the impacts of agricultural mechanization on labour use in agriculture. This is partly due to the challenge of measuring these impacts in a well-identified setting. It can be difficult to attribute changes in production systems and household welfare to the use of mechanized technology, rather than to more general changes in agricultural conditions and associated infrastructures. This paper considers these claims and provides evidence of a more complex set of impacts. By reducing labour use in some activities and at certain points in the growing season, agricultural mechanization can actually increase demand for labour in other activities and at other seasons. In northern Ghana, tractor use allows for shortening the length of time required for land preparation, making it possible for farmers to grow maize in locations where the crop would otherwise be marginal at best. Because maize cultivation is relatively labour-using, compared to other agricultural activities, mechanization of land preparation leads to an increase in the overall demand for agricultural labour. In this context in Ghana, small- and medium-scale farmers access mechanized plowing technology via a service market, rather than through individual ownership of machines. This paper bases its causal identification on a government scheme that generated plausibly exogenous positive shocks to the supply of machinery services at the district level. Bearing in mind the methodological difficulties and limitations of the approach, evidence is presented of the short-term impact on a range of variables relating to the farming system and household welfare. Findings indicate that for these marginal users of agricultural machinery, mechanized plowing does not significantly reduce the labour used for land preparation, and in fact increases labour use for other operations. The area cultivated increases, with proportionate increases in maize cultivation and an increased proportion of land controlled by women. I propose that these results are consistent with tractor plowing alleviating a time constraint for farmers, which enables cultivation of more time- sensitive crops and increases the expected returns to subsequent production activities.

Welcome message from author
This document is posted to help you gain knowledge. Please leave a comment to let me know what you think about it! Share it to your friends and learn new things together.
Transcript

Impact of mechanization on smallholder agricultural production: evidence from Ghana Frances Cossar Postdoctoral Research in Land Use and Food Security, University of Edinburgh [email protected] / @francossar
Draft for Agricultural Economics Society Conference, April 2019 – do not cite
Contributed Paper prepared for presentation at the 93rd Annual Conference of the Agricultural Economics Society, University of Warwick, England
15 – 17 April 2019
Abstract:
Mechanization is accompanied by changes in the quantity and type of labour required for an activity. Agricultural mechanization is often touted by policy makers as reducing the drudgery associated with agricultural work and as increasing the productivity of the farming system, especially in contexts where traditional technologies appear to be stagnant. For good or for ill, mechanization is expected to replace labour in agriculture. This can either create unemployment, in a pessimistic scenario, or release labour for more productive work outside of the agriculture sector. However, little rigorous analysis has examined the impacts of agricultural mechanization on labour use in agriculture. This is partly due to the challenge of measuring these impacts in a well-identified setting. It can be difficult to attribute changes in production systems and household welfare to the use of mechanized technology, rather than to more general changes in agricultural conditions and associated infrastructures.
This paper considers these claims and provides evidence of a more complex set of impacts. By reducing labour use in some activities and at certain points in the growing season, agricultural mechanization can actually increase demand for labour in other activities and at other seasons. In northern Ghana, tractor use allows for shortening the length of time required for land preparation, making it possible for farmers to grow maize in locations where the crop would otherwise be marginal at best. Because maize cultivation is relatively labour-using, compared to other agricultural activities, mechanization of land preparation leads to an increase in the overall demand for agricultural labour.
In this context in Ghana, small- and medium-scale farmers access mechanized plowing technology via a service market, rather than through individual ownership of machines. This paper bases its causal identification on a government scheme that generated plausibly exogenous positive shocks to the supply of machinery services at the district level. Bearing in mind the methodological difficulties and limitations of the approach, evidence is presented of the short-term impact on a range of variables relating to the farming system and household welfare.
Findings indicate that for these marginal users of agricultural machinery, mechanized plowing does not significantly reduce the labour used for land preparation, and in fact increases labour use for other operations. The area cultivated increases, with proportionate increases in maize cultivation and an increased proportion of land controlled by women. I propose that these results are consistent with tractor plowing alleviating a time constraint for farmers, which enables cultivation of more time-sensitive crops and increases the expected returns to subsequent production activities.

F Cossar AES Conference 2019
I. Introduction
Agricultural mechanization is often considered in the context of large-scale commercial
farming, in the style of capital-intensive agricultural production systems of North America
and Europe. However, farmers in developing country contexts, where labour is still relatively
cheap, are using agricultural machinery, particularly in parts of Asia where small-scale
machinery has become widespread (de Groote et al. 2018; Mottaleb et al. 2017; Pingali
2007). In particular, farmers in the cereal-producing areas of northern Ghana have adopted
mechanization as part of their preferred set of agricultural technologies. This is in a context
where average farm sizes are less than 5 hectares. This observed trend raises theoretical and
empirical questions around the conditions under which mechanization of at least some
operations becomes profitable for small-scale farmers in sub-Saharan Africa, and the
implications of machinery use for other farming decisions regarding land, labour, and input
use.
Economic theories have tended to link agricultural mechanization to broader processes of
population growth and structural change. Boserup (1965) and Pingali et al. (1987) consider
farmer demand for mechanized technology to be a result of the agricultural intensification
process, which is fundamentally driven by agro-ecological conditions, population pressure,
and market demand. Hayami & Ruttan (1985) and Binswanger & Ruttan (1981) consider that
farmers will demand technology innovations that intensively use the relatively abundant
factor of production. For land preparation, mechanized technology will be demanded when
there is relative land abundance. The indivisibility of production factors, such as machinery
or draft animals, has led several to posit that in the presence of weak credit markets, high

F Cossar AES Conference 2019
transaction costs associated with rental markets will prohibit investment in mechanization (H
Binswanger & Rosenzweig, 1986). However, the availability of smaller and cheaper
machinery reduces this problem, and indeed their use has become prevalent in Asia (T. W.
Schultz, 1964; Mandal et al., 2017). Furthermore, evidence from northern Ghana
demonstrates that a strong rental market for machinery services has overcome the lumpiness
of investment in agricultural machinery.
The contribution of this paper is twofold. First, a broader theoretical framework is developed
which considers the effects of mechanization to be conditional upon the binding constraint –
either labour or time - which motivates its adoption. This paper then considers the empirical
impacts of mechanization on labour use, scale of production, productivity, and intra-
household gender differences in agricultural activities. The empirical results enable us to
understand the consequences of weaknesses in the service market. We will be able to identify
the impact for farmers if they miss out on getting tractor services within the season. This is
an important contribution for policy discussions regarding the modalities through which
farmers access agricultural machinery.
The paper is novel in identifying the specific effect of machinery use upon the agricultural
system, aside from other aspects of agricultural intensification. It considers a positive shock
to the supply of tractors, which in turn is assumed to increase the supply of tractor services.
This shock is used to identify the impact of tractor plowing on other farming decisions of the
household. This allows us to draw broader inferences about the ways in which mechanization
affects farm-level production and the wider farming system. At the farm level, we can
identify the associated changes in land and labour productivity, labour use per hectare,
F Cossar AES Conference 2019
cultivated area, and crop choice. We can also ask whether there are differential effects for
male and female farmers within the household. The paper focuses on the short-term impact
of increased machinery use on within-season farming decisions.
This paper proceeds as follows. Section II develops the theoretical argument regarding the
changes that would be expected due to increased mechanization use. Section III provides the
Ghanaian context of tractor use, the service market, and related government programs. This
is followed by detailed discussion of the methodological approach and data used, with its
strengths and weaknesses in Section IV. The results are then presented in Section V, followed
by a concluding discussion.
II. Theoretical impact of mechanization use
Several assumptions underpin the theoretical discussion which follows. Firstly, I assume that
farm households are utility maximizers with regards to agricultural production. Agricultural
produce may be consumed by the household or sold on the market, but the assumption is that
farmers make their decisions over production in order to optimize their utility from
agricultural production (Singh, Squire, & Strauss, 1986). Utility is not specifically defined,
nor is it limited to financial profit, but rather the point is that farm households seek to optimize
the returns to agriculture across inputs, particularly labour effort. Farmers’ choices regarding
the area cultivated for each crop, the type of technology to adopt, and the use of other inputs
are made at the start of the season, and are updated during the season in response to weather
and other conditions. Their ability to maximize is constrained by both their budget constraint,
and the availability of each of these inputs to production.

F Cossar AES Conference 2019
Secondly, I assume that not all input markets are complete, particularly the market for
machinery services. As discussed in the 3rd paper of this thesis, time constraints and transport
costs create a coordination problem in the service market which leads to the exclusion of
some farmers from accessing services, despite farmers being willing to pay at market prices.
Therefore, for farmers who do not own a tractor, there is uncertainty within the season
regarding whether they get access to tractor services or not.
Thirdly, farmers are assumed to make production decisions sequentially during the season,
rather than simultaneously at the start of the season. The also make such decisions
independent of other farmers. They are able to adjust their decisions over crops cultivated,
labour use, and other inputs in response to rainfall patterns at the start of the season, and
whether they have used tractor plowing services. Therefore, the use of tractor plowing in a
particular season is determined both by the farmer’s intention to adopt mechanized plowing
technology in general, and the success of the farmer in securing tractor services in that
particular season.. The subsequent farming decisions over crop choice, input and labour use
for weeding, pest control, fertilization, and harvesting, are dependent upon the technology
used for land preparation. For the purposes of this paper, the focus is on machinery use for
land preparation (plowing) as this is the only operation that is mechanized by a large
proportion of cereal-producing farmers in Ghana.
Farm households are the primary unit of analysis. This is the meaningful decision making
unit with regards to agricultural production. Agricultural land in Ghana is most frequently
allocated to the household head who may then allocate land to individual household members
(Lambrecht & Asare, 2016). Most agricultural land has been allocated to families and is
F Cossar AES Conference 2019
passed down through inheritance. I then make the assumption that family labour is used
across all plots, regardless of which household member may have control over the farming
activities on the plot. Underlying this approach is the assumption that household members
coordinate, share resources, and seek to maximize utility for the household as a unit, although
I do consider the potential effect of unequal bargaining power between men and women over
family and hired labour use (Singh, Squire, & Strauss, 1986; Alderman et al, 1995).
There are two main direct channels of impact which will be elaborated. The first is the direct
effect of reducing the labour required for land preparation. Much of this theoretical strand is
rooted in the work of Boserup (1965), Pingali et al. (1987), and Binswanger & Ruttan (1978),
which emphasized the relative cost of labour as a driver of mechnization. The second impact
is the increased chance of timely planting which comes with completing land preparation in
a shorter time than when using labour power for the same area. It is in this second impact
that this paper adds to the current theory regarding mechanization and its impacts. Others
have made reference to the higher returns to machinery use in tropical farming systems with
unpredictable rainfall patterns and a short planting window (Richards, 1985; Ruthenberg,
1980). This paper lays out the theoretical implications for farm production when this
timeliness constraint is alleviated through tractor plowing. From these initial immediate
impacts – reducing labour requirement, or enabling timely planting – the consequences for
subsequent decisions over agricultural production are considered.

F Cossar AES Conference 2019
a. Mechanization as a response to a labour constraint
The obvious direct consequence of tractor plowing should be a shift away from using labour-
intensive hand-hoeing for land preparation. Per hectare, less labour would be used for land
preparation. However, some labour may still be required to operate machinery and clear the
land of larger stumps and weeds. This is not trivial in Ghana’s farming system. Weed re-
growth between seasons is considerable and farmers often apply herbicide to kill weeds
before using the tractor to plow. If the primary constraint for farmers is securing adequate
labour for land preparation, the total effect would be to reduce labour use for this stage of
production, without any change to labour use per hectare for other operations.
The impact on total labour use for all operations depends on the farmers’ land constraint and
elasticity of demand for their output. Where there is elastic demand and land is available,
farmers will increase the total area cultivated with tractor plowing. If the scale of production
increases sufficiently and labour use per ha for other operations remains the same, then total
labour use may actually increase, even though labour use per hectare declines. However, the
total land available for farming is constrained, and moreover, the individual farmer is
constrained in accessing land due to non-market allocation mechanisms. Land allocation in
Ghana is governed by traditional tenure systems (or at least by a modern set of institutions
that have emerged from traditional tenure systems). Family land was allocated in previous
generations and this is the primary land which individual farmers access for agriculture. A
farmer can easily cultivate more family land, but access to virgin or communal land will
require either payment in formal market or negotiation with the local chief or farmers.
Therefore, the results may be ambiguous in showing whether the increased availability of
F Cossar AES Conference 2019
machinery does or does not lead to a farmer increasing her cultivated area, depending on the
ability to access more family land within the season. A lack of effect may be due to a binding
constraint on the availability of land.
I assume that family land can be accessed costlessly within the season, but other types of
land require negotiation and search costs. The extent to which access to land is a constraint
on the farming system will depend in part upon the local population density and urbanization.
In areas with high population density, farmers may want to cultivate more land (e.g. as a
result of accessing machinery services) but they are unable to, due to competition over land
from other farmers and for non-agricultural uses.
If tractor plowing is used to alleviate a labour constraint, there is not necessarily any impact
on the farmer’s yield or land productivity. The composition of crops would not necessarily
change, and in terms of agronomy, land is not necessarily more productive with tractor
plowing over hand-hoeing. However, increasing the cultivated land size is also associated
with decreasing returns to scale in the literature. The inverse farm-size productivity
relationship has been documented (Barrett et al., 2010). Farmers may need to increase total
labour use for weeding, harvesting, and processing beyond what labour is available in the
family. This creates decreasing returns due to the costs of supervision and lower effort of
non-family members. Farmers may instead choose to use more labour-saving chemicals such
as herbicide and pesticide as farm scale increases (Haggblade et al. 2017). Furthermore,
machinery use may lead farmers to start cultivating new plots which are of a lower soil quality
and require more effort to cultivate. These factors may all lead to finding that yield actually
decreases with machinery use, or chemical input use increases in order to maintain yield.

F Cossar AES Conference 2019
If securing labour for land preparation for women is more difficult than men, tractor use may
also lead to a change in the allocation of plots between male and female household members.
There is much diversity in the nature of female ownership and tenure over agricultural land
in SSA, as well as the participation of women in agricultural production (C. Doss, Meinzen-
Dick, Quisumbing, & Theis, 2018; Theis, Lefore, Meinzen-Dick, & Bryan, 2018). Land
preparation without machinery is a labourious activity which is often cited as work more
easily done by men. Furthermore, women may find it more difficult to secure labour due to
competition with men over family and hired labour. Therefore, the benefit of labour-saving
machinery may be greater for female-managed plots than for male-managed plots (Palacios-
Lopez, Christiaensen, & Kilic, 2017). If the labour requirement for land preparation were
preventing women from cultivating land themselves, the use of tractor plowing could
increase the area cultivated by women. Traditionally, women are less able to participate in
communal labour due to reproductive activities in the household, and household labour may
be prioritized for ‘main’ plots. Doss and Morris (2001) find that gender differences in
adoption of improved maize seed and chemical fertilizer are explained by differences in
access to land and labour inputs. In particular, female farmers find it more difficult to secure
male labour for land preparation. In this way, not only will increased availability of
machinery increase the total area cultivated by the household, but it might disproportionately
increase the land area that women are cultivating.
Women’s engagement in agriculture also includes their labour hours spent on their own plots
and the plots of other family members. Agricultural mechanization may affect the amount of
labour which women allocate to agricultural activities, whether on their own plots or those
F Cossar AES Conference 2019
of other household members. In some countries of SSA, there is greater female labour use
for food crops and for operations other than land preparation. However, this only holds for a
few countries and is not generalizable (Palacios-Lopez et al., 2017). The same authors find a
negative correlation between machinery access and the share of female labour use. They find
a gender difference in labour use due to machinery but not for other modern inputs such as
fertilizer. Therefore, it will be interesting to consider how the share of male and female labour
use is affected by machinery adoption, in addition to the management of cultivated plots.
b. Mechanization as a response to a time constraint
The second direct effect is for farmers to be more likely to be able to plant early, thanks to
the time-saving nature of mechanized plowing. This will increase a farmer’s expectations
over what yield can be achieved on a given plot. If the timing of planting were a constraint
on farmer’s optimization, then alleviating that constraint through tractor plowing will lead to
changes in the choice of crops, the allocation of labour and other inputs for subsequent
production activities, such as weeding, crop maintenance, harvesting, and post-harvest
processing. Therefore, tractor plowing will lead to higher expected and realized yields for
some crops, which in turn affects returns to the use of other inputs.
There is no agronomic reason for farmers to engage in different post-planting management
practices when they use mechanized plowing than when they prepare land by hand.
Consequently, there is no obvious reason to expect an increase in yield. However, machine
plowing may allow farmers to have seeds planted in time to take advantage of early rains.
And, because machine plowing lengthens the effective growing season, it may allow farmers

F Cossar AES Conference 2019
to alter their crop choices and therefore inputs in complex ways (see also: Ruthenberg 1980,
pp.105–106). For crops such as maize (in northern Ghana), there is a limited planting period
due to the longer growing period needed for maize and the volatile rain patterns. Maize
requires earlier planting and is more sensitive to the time of planting than traditional cereal
and root crops such as sorghum, millet, yam, and cassava (FAO & FEWSNET, 2017). Maize
is also a higher value and market-orientated crop. Therefore, farmers will increase their
cultivation of maize when tractor plowing is used (M. Kansanga et al., 2018). Maize
cultivation is also associated with higher use of fertilizers in order to achieve good yields in
northern Ghana. The use of tractor plowing therefore induces farmers to cultivate a crop
which has a higher potential return but is also more expensive and riskier to cultivate.
With higher expected yield due to timely planting and a shift to higher value crops, the
expected returns to carrying out crop maintenance activities such as weeding, fertilizer
application, and pest control will also increase. Farmers will then allocate more labour to
those activities. Subsequently, labour used to harvest and process the output will also increase
if crop maintenance activities increase the yield. If this hypothesis holds, we may in fact find
that labour use or chemical use for these operations increases due to tractor use for land
preparation. The underlying assumption here is that farmers, without tractor plowing, were
choosing an effort level which was a low-level optimum, due to the constraint of not planting
early.
Inasmuch as there are gendered differences in which crops are cultivated, and whose labour
is used for which crops, then alleviating the timing constraint the mechanization will have a
differential impact on male and female agricultural activities. The timing of planting for
F Cossar AES Conference 2019
maize is the same whether the plot is cultivated by a male or female household member. The
difference would come in whether the female household member were able to respond by
increasing labour use for weeding and harvesting on their plots, as easily as male household
members.
Summary of hypotheses
The two channels of theoretical impacts of machinery use which have been outlined result in
hypothesis which appear to contradict each other. The impacts of machinery use will depend
upon whether the primary constraint driving farmer’s adoption is a labour constraint or a time
constraint for land preparation. Obviously, these constraints are linked with each other but
the distinction is that the time constraint provides a motivation to use machinery which will
not necessarily be reflected in relative factor costs, as previous theories have posited. The
main difference between the two channels of impact is the change in labour use with tractor
plowing, the change in crops cultivated, and the impact on yield. This theory adds a new
mechanism to those considered by the theories of mechanization which have come before.
The work on Binswanger and Pingali, like Boserup and others, only considered land
abundance and factor scarcity as the predominant determinants of mechanization. The novel
contribution here is that I consider a time constraint which would have been missed by the
more general cross-country studies of the older theories. The timing constraint was
motivation for mechanization which previous theories did not consider, due to their focus on
relative factor costs. However, I argue in theory, and demonstrate in the following empirical
analysis, that the timing constraint is salient for farmers in Ghana.
F Cossar AES Conference 2019
III. Context of tractor plowing in Ghana
Apart from import data on agricultural machinery, there is little reliable information on the
total stock of tractors and other machinery either currently or over previous decades in Ghana.
Diao et al. (2012) show import data from Customs and Excise that indicates that 200-900
pieces of agricultural machinery were imported annually over the period of 2002-2012. This
is likely an over-estimate as the data may also include some construction machinery. Another
indication is administrative data from the Ministry of Food and Agriculture, which shows
that approximately 900 pieces of newly imported agricultural machinery have been
distributed since 2007 under their mechanization programs across the entire country. Whilst
there is no clear data on the number of functional pieces of equipment in use, these data on
government programs and imports indicate that there is a substantial stock of machinery in
the country.
Furthermore, there is evidence of high use of agricultural machinery amongst farmers, based
on recent household surveys. The 2009-10 Ghana Socioeconomic Panel Study Survey
provides data from a nationally representative survey of household agricultural production.
According to these data, 31% of farm households across Ghana were using agricultural
machinery for cultivation on at least one of their plots in 2009 (Table 1). Once this is broken
down by region, 88-95% of farm households in the three northern regions used tractors for
cultivation. The representativeness of this survey confirms that tractor use is not isolated to
a few large-scale farmers but mechanized land cultivation is now standard amongst farmers
of all scales in large parts of Ghana. The patterns are highly geographically concentrated.
F Cossar AES Conference 2019
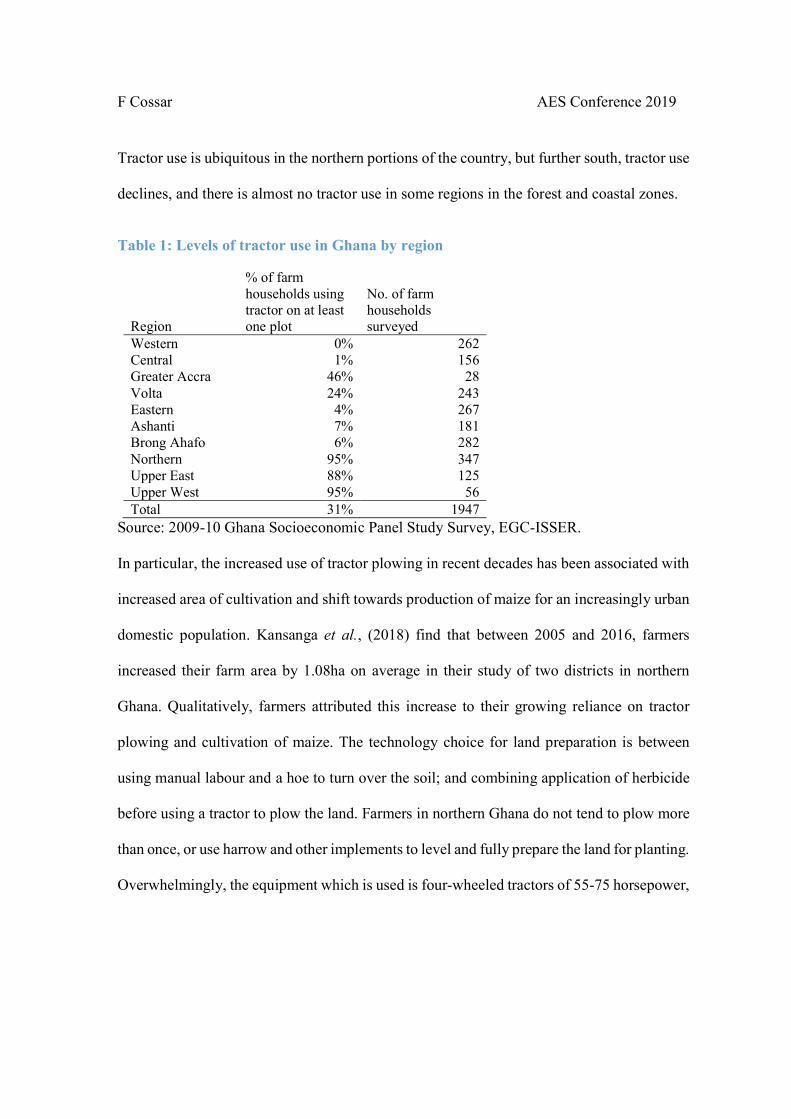
Tractor use is ubiquitous in the northern portions of the country, but further south, tractor use
declines, and there is almost no tractor use in some regions in the forest and coastal zones.
Table 1: Levels of tractor use in Ghana by region
Region
% of farm households using tractor on at least one plot
No. of farm households surveyed
Western 0% 262 Central 1% 156 Greater Accra 46% 28 Volta 24% 243 Eastern 4% 267 Ashanti 7% 181 Brong Ahafo 6% 282 Northern 95% 347 Upper East 88% 125 Upper West 95% 56 Total 31% 1947
Source: 2009-10 Ghana Socioeconomic Panel Study Survey, EGC-ISSER.
In particular, the increased use of tractor plowing in recent decades has been associated with
increased area of cultivation and shift towards production of maize for an increasingly urban
domestic population. Kansanga et al., (2018) find that between 2005 and 2016, farmers
increased their farm area by 1.08ha on average in their study of two districts in northern
Ghana. Qualitatively, farmers attributed this increase to their growing reliance on tractor
plowing and cultivation of maize. The technology choice for land preparation is between
using manual labour and a hoe to turn over the soil; and combining application of herbicide
before using a tractor to plow the land. Farmers in northern Ghana do not tend to plow more
than once, or use harrow and other implements to level and fully prepare the land for planting.
Overwhelmingly, the equipment which is used is four-wheeled tractors of 55-75 horsepower,

F Cossar AES Conference 2019
which pulls a disc-plow attachment. In some irrigated rice projects, walking power-tillers are
being used but they do not seem to be applied beyond those irrigated schemes.
The market for tractor plowing services is more thoroughly analyzed in the third paper of this
thesis; however a summary is provided here for context. Tractor owners provide services to
farmers of all scales. A rate of 45-60 Ghana cedis is paid per acre for a single plow of the
land (approximately £7-£10).1 Tractor owners are usually medium- or large-scale farmers
who have bought one or two tractors through the second-hand market. The owners often pay
an operator to drive the tractor, who is responsible for organizing service of customers, and
maintaining the equipment. The price the farmer pays includes the cost of fuel and the driver
to carry out the plowing. Most often, farmers do not operate the tractor themselves.
The government does not directly provide services to farmers for tractor plowing or engage
in the market for tractor services directly. However, the market for tractor equipment has
been impacted by government subsidizing the import of agricultural machinery since the
early 2000s. Several iterations of mechanization policy resulted in the government’s
Agricultural Mechanization Service Center scheme which took place in phases over 2007-
2010. The scheme involved the allocation of 5 or 7 tractors to a single entrepreneur in a
district. The machinery would be imported by the government and then sold to private
entrepreneurs under hire-purchase arrangements, with the intention that tractors and the
provided implements be used to provide services to other farmers. The government is not
1 Maize price for 100kg in 2008/09 was 54 GHC. Average yield for Northern Ghana was 1.15 MT per ha (Boadu, 2012). Therefore, from 1 ha of land, a farmer will earn approximately 620 GHC (approximately £100). The cost of tractor plowing is approximately 18% of revenue per ha.
F Cossar AES Conference 2019
involved in the tractor service market, in the organization or allocation of tractor services,
nor the ongoing maintenance of the subsidized machinery.
It has been estimated that in the context of Ghana, a tractor can plow up to 180 ha per year
in the north, and 240 ha per year in the south (N. Houssou et al., 2013). For the average
household farm size of 2.75 ha in the EGC/ISSER survey, this equates to an additional
capacity in each district to serve between 330 and 620 additional farm households. For the
northern districts in the survey, their population of households ranges from 15,000 to 28,000
per district. Thus, there is the potential for the scheme to enable an additional 2-4% of
households to access tractor plowing services. The only accurate information on the stock of
tractors in Ghana by district is from 2013 when a USAID and ACDI-VOCA project
conducted a census of tractors in northern Ghana. On average there were 81 tractors found
per district in the Northern Region. These figures should be taken as an upper limit on the
actual stock of tractors in 2009, as the census was carried out in 2013. With that in mind, a
conservative estimate would be that the government scheme increased the tractor stock by 6-
8% per district on average.2 The precise numbers do not matter for the analytical approach,
but illustrate that there is potential for a quantitatively meaningful effect of the government
scheme on the supply of tractor services.
2 These are just back-of-the-envelope estimates but should illustrate the potential for the government scheme to create a meaningful supply shock.
F Cossar AES Conference 2019
IV. Methodology
The methodological approach of this paper will seek to identify the average effect of a farmer
using tractor plowing (either through ownership or service provision) on productivity, scale
of production, labour use, and chemical input use. The effect on gender differences in control
over plots and labour use will also be considered. There are challenges in identifying such
effects in a single time period. A simple ordinary least squares approach would fail to account
for suspected endogeneity. The main reason for this suspicion is that any variable capturing
household tractor use may also be capturing other factors such as farmer ability, quality of
local extension services, market access, or agro-ecological potential which would all increase
the probability of a farmer using tractor-plowing, whilst also improving agricultural
productivity, relative factor costs, and access to technologies complementary to tractor-
plowing. For this reason, an instrumental variable approach will be used which allows for
causal inference in a non-experimental setting. The causal effect will only be identified for
those farmers whose machinery use changes in response to an exogenous supply shock, i.e.
those who ordinarily just miss out on tractor plowing due to weaknesses in the service market.
The effect that is estimated will only be for short-term within-season effects.
a. Data
The primary dataset which will capture farmer behavior is the 2009-10 Ghana
Socioeconomic Panel Study Survey that is a nationally representative survey of over 5,000
households in Ghana. The survey is a joint effort undertaken by the Institute of Statistical,
Social and Economic Research (ISSER) at the University of Ghana, and the Economic
F Cossar AES Conference 2019
Growth Centre (EGC) at Yale University.3 It was funded by the Economic Growth Center.
The survey includes approximately 2,800 households that responded to a detailed agricultural
module relating to the 2009 main season. The survey was administered over November 2009
– April 2010 and questions were asked of the last main season and the last minor season. Our
attention is on the last main season, which would have been May-October 2009. The data
currently available is a single cross-section. The survey used a two-stage sampling design
whereby 334 enumeration areas were selected in order to be representative of each of the 10
regions in Ghana. Within each enumeration area, 15 households were randomly selected.
Information on district locations for each sampled numeration area is provided, but the
sample is not stratified by district.
As mentioned above, an instrumental variable will be used to deal with suspected
endogeneity of tractor use and several of the outcome variables. The instrument relies upon
administrative data obtained from the Agricultural Engineering Services Directorate at the
Ministry of Food and Agriculture (Government of Ghana) which has the ongoing
responsibility to administer the mechanization policy and associated schemes. The data
provides information on each allocation of machines to private entrepreneurs as part of the
Agricultural Mechanization Service Centre scheme which was done in phases over 2007-
2010. Information is provided on the date of allocation, the number of machines which were
allocated, and the address of the enterprise receiving the machinery allocation. In addition to
3 Disclaimer: ISSER and the EGC are not responsible for the estimations reported by the analyst.

F Cossar AES Conference 2019
household survey data, information on population density, agro-ecological conditions,
welfare level, remoteness, and election results are used as controls.
b. Empirical model
The model which would ideally be estimated is the following. The unit of analysis is
households, denoted by i, which sit within districts, denoted j.
𝑦 = 𝛼 + 𝛽𝑇 + 𝛾𝑋 + 𝛿𝐶 + 𝜖 (1)
where,
𝑦 : vector of outcome variables for agricultural productivity, labour use, chemical use, and
the scale of production. More details on their measurement follows in this section.
𝑇 : dummy variable taking the value 1 for households which used machine plowing on at
least one plot
𝑋 : set of variables capturing household characteristics such as quality of housing, assets,
number of household members
𝐶 : set of district characteristics capturing population density, remoteness, welfare, length of
growing period, and election margins.
The covariates at household and district level go some way to control for endogeneity from
observables such as household wealth, local population density, and agro-ecological
conditions. The observables will affect whether a farmer uses tractor plowing, and also affect
outcomes such as productivity and labour use. For example, labour use for land preparation
F Cossar AES Conference 2019
will fall if tractor plowing is used, but equally it would be true that tractor plowing is more
likely to be used where there is a lack of labour available either due to small household size,
or lack of hired labour availability.
A pseudo-experiment is constructed using the government mechanization scheme as a
plausibly exogenous supply shock. The dummy variable indicating assignment to treatment
and control groups, 𝑍 , is then used as an instrument for 𝑇 , household tractor use. The
estimation strategy will use a Local Average Treatment Effect (LATE) approach to create an
appropriate counterfactual to estimate the effect of machinery use. The treatment effect –
tractor use – will be instrumented by the intention to treat – residing in a treated district.
The created treatment group is the set of farm households in those districts for which a
mechanization centre was established before the 2009 main season (up to March 2009). The
control group is farm households in districts which received AMSECs from July 2009
onwards. Figure A1 indicates the location of these districts. In total, 89 AMSECS were set
up between 2008 and 2010. The control districts are selected as those districts which
eventually received a mechanization centre, but not before the machines would be operational
for the 2009 main season; i.e. the difference between the districts is the timing of program
receipt. Those districts which were allocated AMSECS in the period April-June 2009 are
excluded as the exact timing of the arrivals of the tractors relative to the plowing season is
uncertain. Table 2 indicates the survey coverage in terms of districts and households, by
treatment and control group. A total of 662 surveyed households are included in the treatment
and control districts, with information on tractor use recorded for 422 of those households.

F Cossar AES Conference 2019
Table 2: Survey coverage, treatment, and control groups
No. of districts No. of farm households
Region All survey Treated Control All survey Treated Control
Western Region 10 0 1 465 0 23 Central Region 13 1 0 420 15 0 Greater Accra Region 4 1 1 585 20 7 Volta Region 14 1 2 495 36 76 Eastern Region 18 1 0 630 11 0 Ashanti Region 24 0 2 900 0 20 Brong Ahafo Region 19 3 1 510 32 15 Northern Region 18 3 4 584 74 118 Upper East Region 6 2 0 240 68 0 Upper West Region 5 4 0 180 147 0
131 16 11 5009 403 259
This empirical model follows the LATE theorem through which we can estimate the average
treatment effect for those farmers who respond to the treatment. To apply the LATE theorem,
an additional assumption of monotonicity is required. In this application, we need to
reasonably assume that there are no farmers who would have used tractor services, but are
not able to because the supply of tractor to the district has increased. This seems a reasonable
assumption in the context.
As with any instrumental variables approach, exogeneity of the instrument and its relevance
will need to be justified.
c. Exogeneity of district allocation for government program
If there had been a randomization of the order in which districts benefitted from the
government program, then we could be sure of the exogeneity of the instrument. As
documented in the literature, where this randomization is imperfect, covariates can be used
in order to satisfy the uncounfoundedness assumption (Angrist & Pischke, 2009; Imbens &
F Cossar AES Conference 2019
Wooldridge, 2009). The covariates must be variables which are unaffected by the treatment.
I will make the case that there is as-good-as random assignment of households into the treated
or control groups. What follows will explain (i) the assignment of districts to treatment and
control groups, and (ii) evidence of balance on key household and district variables.
Over 2008-2009-2010, the government distributed packages of 5-7 tractors and implements
to entrepreneurs under hire purchase arrangement, and with subsidized cost. The machinery
was imported new from India and Brazil. The distribution was phased, coinciding with each
round of imports. The documentation relating to the program indicates that allocation was
based on (i) having one mechanization centre per district, and (ii) that the entrepreneur
demonstrate ability to repay and operate a hiring business with the machines. From
interviews with government officials involved in the program, there is no indication that the
selection of districts between each phase was based on prioritizing areas with higher
agricultural potential, or with a deficiency in tractor stock. In fact, there was no record of the
stock of tractors by district in Ghana at that time. The order in which districts were allocated
was not formally randomized. The exact process of allocation is opaque, although it was not
officially correlated with the demographic, economic, or agricultural conditions of the
district. However, there may be political and other undocumented reasons for the phasing of
the government intervention that could well be correlated directly with machinery use.
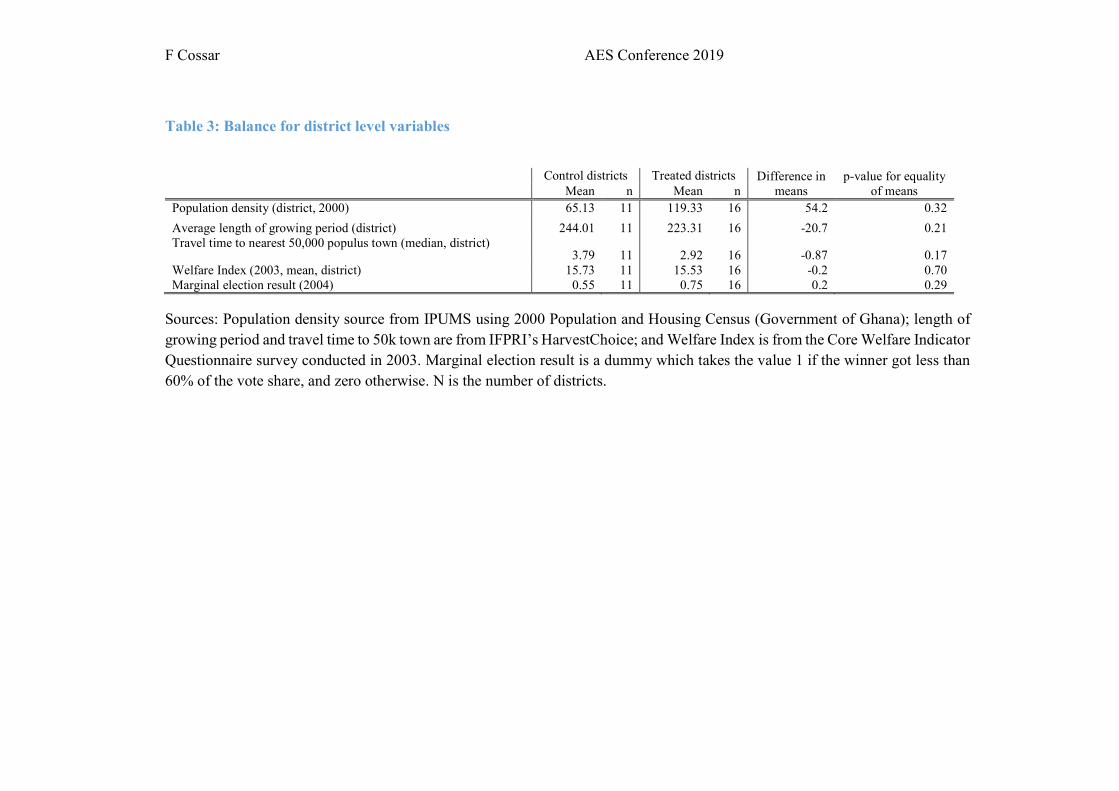
District-level factors which may violate the exclusion restriction are presented in Table 3.
Whilst there is no significant difference in the variables between treated and control districts,
the sample size is small which will under power statistical tests. The treatment districts do
seem to have higher population density, shorter growing periods and slightly shorter travel

F Cossar AES Conference 2019
time. The welfare index indicates that the districts are very similar in terms of average welfare
of the district. 75% of the treated districts had a marginal election result in 2004, whereas
55% of the control districts did. Given this variation, all these district variables will be
included as controls in the empirical models.
In addition to looking at the difference in means, these district variables are plotted by the
month in which government machinery was allocated to the district. Figure A 2 shows these
scatter plots, with the cutoff for before and after the main plowing season in May 2009. There
is little evidence of a systematic relationship between the timing of allocation and these
district level variables. The exception would be the travel time to nearest town variable
(denoted as tt50k). Both Figure A 2 and Table 3 show evidence that the slightly more remote
districts with longer travel times are more likely to receive the government allocation later.
Table 4 considers a range of variables which capture differences between households in the
treatment and control districts. A range of farm household characteristics are presented to
check that, without the intervention, the households in each group are as similar as possible.
Significant differences are found for the quality of housing and land. Households in the
treated districts are less likely to have better quality housing, evidenced by having a cement
floor in the main dwelling. By farmer-reported measures, plots in the treated districts less
likely to be described as heavy clay. There is no significant difference in land area owned by
households. Also interesting to note is that contact with agricultural extension agents is very
low in both groups.
F Cossar AES Conference 2019
The biggest concerns which would threaten this assumption would be (i) local government
capacity, or (ii) better infrastructure. If local governments with greater capacity for
implementing the scheme received the mechanization centre first, and that government
capacity is also enabling better agricultural extension services, then then estimated effects
for productivity and modern input use could be due to local government capacity rather than
household machinery use. Table 4 indicates that fewer than 5% of surveyed farmers in the
treated districts, and 8% of surveyed farmers in the control districts had been visited by an
extension agent in the last six months. It is unlikely that differences in the local agricultural
extension system are driving the estimated effects. The second concern would be that better
connected districts benefit from the scheme first because it is quicker and cheaper to get the
machinery to the district from Accra. Table 4 does shows that treated district are slightly
better connected that the control districts. Visual inspection of the fourth plot in Figure A 2
also suggests a relationship between the average travel time for the district and when the
program was implemented. The travel time variable is included as a covariate in all the
regression models to account for this, as are the other district level covariates.
F Cossar AES Conference 2019
Table 3: Balance for district level variables
Control districts Treated districts Difference in means
p-value for equality of means Mean n Mean n
Population density (district, 2000) 65.13 11 119.33 16 54.2 0.32
Average length of growing period (district) 244.01 11 223.31 16 -20.7 0.21 Travel time to nearest 50,000 populus town (median, district)
3.79 11 2.92 16 -0.87 0.17 Welfare Index (2003, mean, district) 15.73 11 15.53 16 -0.2 0.70 Marginal election result (2004) 0.55 11 0.75 16 0.2 0.29
Sources: Population density source from IPUMS using 2000 Population and Housing Census (Government of Ghana); length of growing period and travel time to 50k town are from IFPRI’s HarvestChoice; and Welfare Index is from the Core Welfare Indicator Questionnaire survey conducted in 2003. Marginal election result is a dummy which takes the value 1 if the winner got less than 60% of the vote share, and zero otherwise. N is the number of districts.

F Cossar AES Conference 2019
Table 4: Balance for household level variables
Control districts Treated districts
Difference in means
p-value for equality of
means Mean n Mean n
Female hh head 0.21 259 0.19 402 -0.02 0.54
Age of hh head 50.1 259 51.06 402 0.96 0.46
Education level of hh head 20.47 103 20.36 120 -0.11 0.88
Size of hh 5.09 259 4.85 402 -0.24 0.28
Urban area 0.13 259 0.07 402 -0.06 0.01
HH owns a motorbike 0.08 259 0.12 402 0.04 0.19
Hh head in-migrated less than 5 years ago 0.02 259 0.01 402 -0.01 0.48
Main dwelling has cement floor 0.31 259 0.14 402 -0.17 0.00
Land owned by hh (ha) 2.63 254 2.48 400 -0.15 0.50
% of land described as heavy clay 0.08 259 0.06 402 -0.02 0.09
% of land described as less wet than local community 0.12 259 0.08 402 -0.04 0.07
Contact with agricultural extension agent in last 12 months 0.08 259 0.05 402 -0.03 0.25
Sources: Data from EGC/ISSER Socioeconomic Panel Survey 2009/10. N is the number of households
F Cossar AES Conference 2019
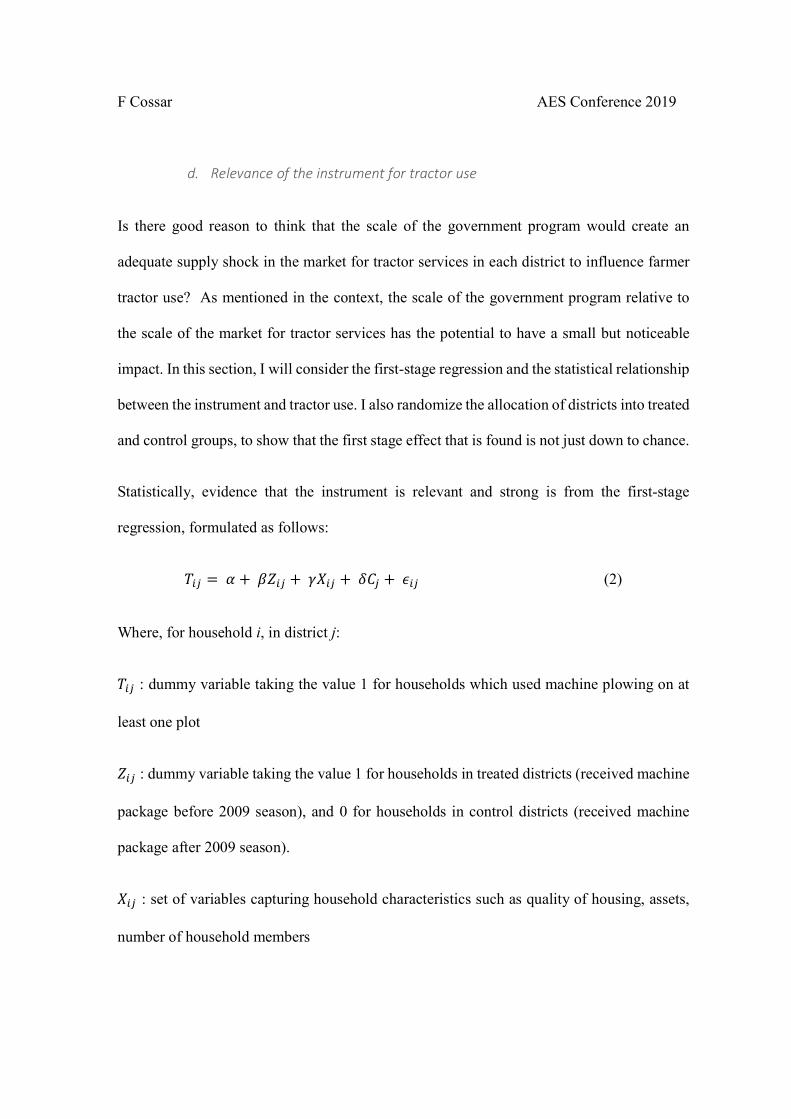
d. Relevance of the instrument for tractor use
Is there good reason to think that the scale of the government program would create an
adequate supply shock in the market for tractor services in each district to influence farmer
tractor use? As mentioned in the context, the scale of the government program relative to
the scale of the market for tractor services has the potential to have a small but noticeable
impact. In this section, I will consider the first-stage regression and the statistical relationship
between the instrument and tractor use. I also randomize the allocation of districts into treated
and control groups, to show that the first stage effect that is found is not just down to chance.
Statistically, evidence that the instrument is relevant and strong is from the first-stage
regression, formulated as follows:
𝑇 = 𝛼 + 𝛽𝑍 + 𝛾𝑋 + 𝛿𝐶 + 𝜖 (2)
Where, for household i, in district j:
𝑇 : dummy variable taking the value 1 for households which used machine plowing on at
least one plot
𝑍 : dummy variable taking the value 1 for households in treated districts (received machine
package before 2009 season), and 0 for households in control districts (received machine
package after 2009 season).
𝑋 : set of variables capturing household characteristics such as quality of housing, assets,
number of household members
F Cossar AES Conference 2019
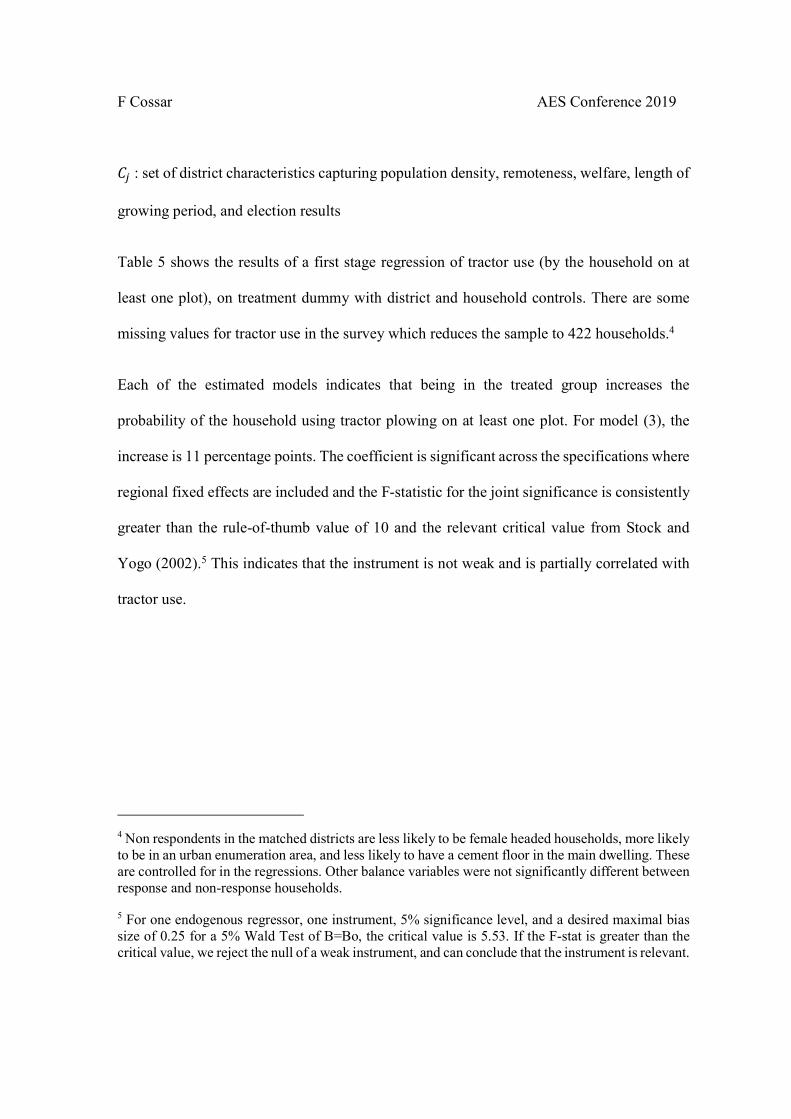
𝐶 : set of district characteristics capturing population density, remoteness, welfare, length of
growing period, and election results
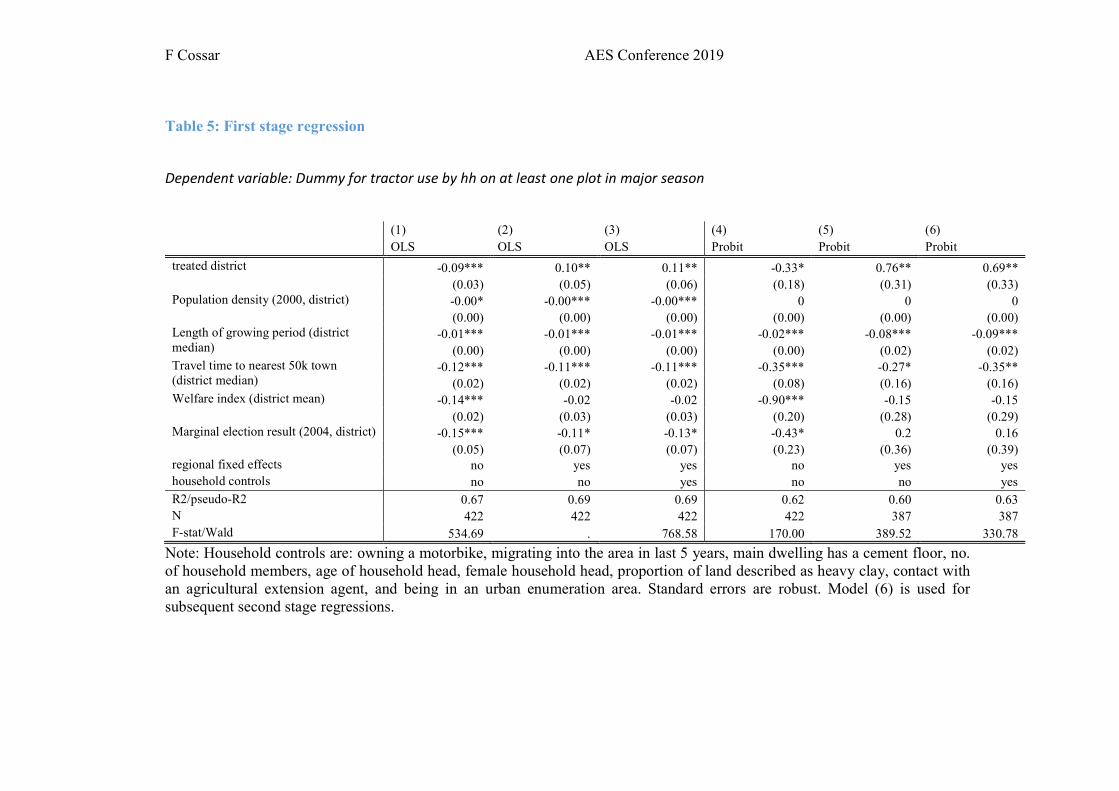
Table 5 shows the results of a first stage regression of tractor use (by the household on at
least one plot), on treatment dummy with district and household controls. There are some
missing values for tractor use in the survey which reduces the sample to 422 households.4
Each of the estimated models indicates that being in the treated group increases the
probability of the household using tractor plowing on at least one plot. For model (3), the
increase is 11 percentage points. The coefficient is significant across the specifications where
regional fixed effects are included and the F-statistic for the joint significance is consistently
greater than the rule-of-thumb value of 10 and the relevant critical value from Stock and
Yogo (2002).5 This indicates that the instrument is not weak and is partially correlated with
tractor use.
4 Non respondents in the matched districts are less likely to be female headed households, more likely to be in an urban enumeration area, and less likely to have a cement floor in the main dwelling. These are controlled for in the regressions. Other balance variables were not significantly different between response and non-response households.
5 For one endogenous regressor, one instrument, 5% significance level, and a desired maximal bias size of 0.25 for a 5% Wald Test of B=Bo, the critical value is 5.53. If the F-stat is greater than the critical value, we reject the null of a weak instrument, and can conclude that the instrument is relevant.
F Cossar AES Conference 2019
Table 5: First stage regression
Dependent variable: Dummy for tractor use by hh on at least one plot in major season
(1) (2) (3) (4) (5) (6)
OLS OLS OLS Probit Probit Probit
treated district -0.09*** 0.10** 0.11** -0.33* 0.76** 0.69** (0.03) (0.05) (0.06) (0.18) (0.31) (0.33)
Population density (2000, district) -0.00* -0.00*** -0.00*** 0 0 0 (0.00) (0.00) (0.00) (0.00) (0.00) (0.00)
Length of growing period (district median)
-0.01*** -0.01*** -0.01*** -0.02*** -0.08*** -0.09*** (0.00) (0.00) (0.00) (0.00) (0.02) (0.02)
Travel time to nearest 50k town (district median)
-0.12*** -0.11*** -0.11*** -0.35*** -0.27* -0.35** (0.02) (0.02) (0.02) (0.08) (0.16) (0.16)
Welfare index (district mean) -0.14*** -0.02 -0.02 -0.90*** -0.15 -0.15 (0.02) (0.03) (0.03) (0.20) (0.28) (0.29)
Marginal election result (2004, district) -0.15*** -0.11* -0.13* -0.43* 0.2 0.16 (0.05) (0.07) (0.07) (0.23) (0.36) (0.39)
regional fixed effects no yes yes no yes yes household controls no no yes no no yes R2/pseudo-R2 0.67 0.69 0.69 0.62 0.60 0.63 N 422 422 422 422 387 387 F-stat/Wald 534.69 . 768.58 170.00 389.52 330.78
Note: Household controls are: owning a motorbike, migrating into the area in last 5 years, main dwelling has a cement floor, no. of household members, age of household head, female household head, proportion of land described as heavy clay, contact with an agricultural extension agent, and being in an urban enumeration area. Standard errors are robust. Model (6) is used for subsequent second stage regressions.

F Cossar AES Conference 2019
e. Outcome variables
The purpose of this methodological approach is to understand the effect of tractor use on
farmers’ decision over other farm inputs, scale of production, and productivity. The variables
which will be used to represent these outcomes are described below, and their descriptive
statistics provided in Table 6. Productivity is considered in terms of the total value of
agricultural output, and the quantity of production for maize. Maize is the most commonly
grown crop and is also one which is particularly used with tractor plowing. Yield, or land
productivity, is the total maize harvest for the household, divided by the total labour days,
family or hired, used on all maize plots. Table 6 shows the average yield and output per
person day for the sample, for both maize and the value of all crops. These statistics are
consistent with estimates in the literature for maize yields in Ghana and elsewhere (Nin-Pratt
& McBride, 2014; Suri, 2011).
The EGC/ISSER survey used farmers’ self-reported plot sizes. To triangulate this
information, an example plot of land was measured in each village and the farmer asked to
compare their plot to this example plot. The variables I use are (i) total area cultivated by the
household for the 2009 main season (may be less than area owned), (ii) area cultivated with
maize as the main crop as a percentage of area cultivated, and (iii) the area of cultivated plots
which are held by female household members as a percentage of area cultivated. Work on
the measurement of farm sizes through farmers’ self-reporting or using GPS estimates have
found that smaller plots tend to be over-estimated by farmers. For the larger end of the size
distribution, there can be under-reporting of land size (Carletto et al., 2015). Land size for

F Cossar AES Conference 2019
smaller farmers may be over-estimated, and yield may be under-reported. These problems
with measurement of land area and output may hamper estimation of treatment effects on
these outcomes.

F Cossar AES Conference 2019
Table 6: Summary of tractor use and outcome variables
Observations Mean Std. Dev. Min Max
Tractor use (on at least one plot in main season) 422 0.61 0.49 0 1
Yield (maize only, in kg) 233 566.81 440.12 5.19 1976.80 Output per person day of labour (kg) 258 9.79 11.42 0 70.18 Value of output per ha (cedis) 418 116.22 286.41 0 1562.69 Value of output per person-day (cedis) 258 4.67 9.50 0 50.10 Area cultivated (ha) 407 2.54 2.70 0 24.28 Area cultivated - maize (%) 252 63.89 32.30 10 100.00 Area cultivated - female holder (%) 407 20.78 40.26 0 100.00 Herbicide use per ha (kg) 182 1.55 5.25 0 45.83 Insecticide use per ha (kg) 182 0.07 0.51 0 6.18 Fertilizer use per ha (inorganic, kg) 182 30.05 63.38 0 247.10 Labour use per ha (land preparation, days) 394 22.96 19.53 0 70.63 Labour use per ha (field management, days) 393 27.22 26.04 0 95.31 Labour use per ha (harvest, days) 383 19.18 15.92 0 55.60 Labour use per ha (post-harvest, days) 398 6.87 6.75 0 24.30 Labour use per ha (all operations, hours) 393 85.48 62.60 3.99 243.39 Labour share: family and exchange 412 73.66 30.82 0 100 Family labour share: female 392 40.15 28.66 0 100 Labour share: hired 412 26.34 30.82 0 100 Hired labour share: female 296 17.67 28.66 0 100
Note: Above variables are derived from the EGC/ISSER Socioeconomic Panel Survey 2009-10. Productivity and area variables were winsorized for high values at 0.5%. Chemical and labour use per ha were trimmed for extreme high values, and then winsorized for high and low values at 5%

F Cossar AES Conference 2019
The survey questionnaire relied upon recall information at the end of the season on the labour
use per plot. The questionnaire responses for labour hours by operation, by gender, and by
labour type were aggregated across plots to the household level. The reported units for labour
are person days equivalent.6 Labour type was combined into family labour which included
exchange labour (i.e. labour provided on reciprocal basis by neighbouring farm households),
and hired labour which included casual and permanent labour paid to work on the
household’s plots. There is evidence that this method of collecting labour data leads to over-
estimates of labour use (Arthi, Beegle, De Weerdt, & Palacios-López, 2018). However, this
bias is likely to exist for both the treatment and control groups. The share of labour by type,
and the share of each type which is provided by female labour is also derived. The mean total
labour use for the sample is high but consistent with Ruthenberg’s description of the labour
intensity of fallow farming systems in tropics (Ruthenberg, 1980, pp. 88–89).
Finally, measures of farm household use of herbicide, pesticide, and inorganic fertilizer per
hectare are derived. The questionnaire collected information on the total amount of each
chemical used per application and per plot. This was aggregated to give the total chemical
use across all plots, and then divided by total cultivated area. The unit of measurement and
conversion to kilograms is problematic. Many farmers provided the quantity used in terms
of ambiguous units (e.g. bucket or beer bottle). Reasonable conversion rates were chosen,
but the variables will remain imprecise.
6 Labour person days is calculated from the total number of hours spend working for all labourers. This total is then divided by 8 to give the number of person days (assumes 8-hour working day).

F Cossar AES Conference 2019
f. Method
The model will be estimated by two-stage least squares. The endogenous variable, 𝑇 , is a
dummy variable, therefore estimating the first stage using OLS would incorrectly assume a
linear model for a limited dependent variable. I use the fitted values from a probit regression
of (2), 𝑇 , as the instrument instead of 𝑍 directly (Wooldridge, 2010). Table 5 shows the
results for the OLS and Probit regression models for the first stage (2). The standard two-
stage least squares estimation procedure was then used with 𝑇 as the instrument for tractor
use, in order to estimate the treatment effect of tractor use on the outcome variables. It is the
local average treatment effect which is estimated, averaged across covariates (Angrist &
Pischke, 2009, pp. 175–181). The effect which is estimated is only for compliers, namely
those farm households which were induced to use tractor plowing due to the positive supply
shock, and would not have used tractor plowing without the government-induced supply
shock, all else equal.
Evidence on whether the instrument is sufficiently correlated with the endogenous variable
(tractor use) is provided for each model. The F statistic for the first stage of each model is
reported, and should be compared to the Stock & Yogo critical values for a weak
identification test, which is 5.53 in this case (Stock & Yogo, 2002). If there is only weak
correlation between the endogenous variable and its instrument, the standard errors for 2SLS
will be much larger than for OLS, therefore making it less likely to find significant treatment
effects. The p-value and confidence intervals for the coefficients in the main regression are
calculated with the assumption that the instrument is not weak. Anderson-Rubin (AR)

F Cossar AES Conference 2019
provide an alternative test statistic and p-value which are robust to whether the instrument is
weak or not. The p-value for this test statistic, with the null that the coefficient in tractor use
is zero, is reported in the tables of results. In most cases, the results of the AR test are
consistent with the conventional test.
Given the modelling procedure, heteroscedasticity in the residuals may be a concern. Where
there is heteroscedasticity, the conventional OLS standard errors will be under-estimated.
The p-value for the Pagan & Hall test statistic for heteroscedasticity is reported, for the null
hypothesis that the residuals are homoscedastic. Robust standard errors are more appropriate
where there is heteroscedasticity, although in some cases the conventional standard errors
maybe be larger (Abadie, Athey, Imbens, & Wooldridge, 2017; Angrist & Pischke, 2009).
Angrist and Pischke (2009) suggest using the larger of the estimated standard errors. A
further concern is that several of the covariates are aggregated at district level which reduces
the effective sample size. Therefore, conventional standard errors are reported in the main
results (Tables 7-11). Table 12 then provides results for the same model using robust standard
errors with adjustment for small samples, and bootstrapped standard errors.
V. Results
Given the potential limitations of the data and method, the regression results will be presented
with reference to alternative methods employed in the paper, to the qualitative understanding
gathered from discussions with farmers, and to findings from the broader literature. The
evidence from the main estimation results indicate that, for those farm households affected
by the supply shock, machinery use leads to (i) an increased area of cultivation with
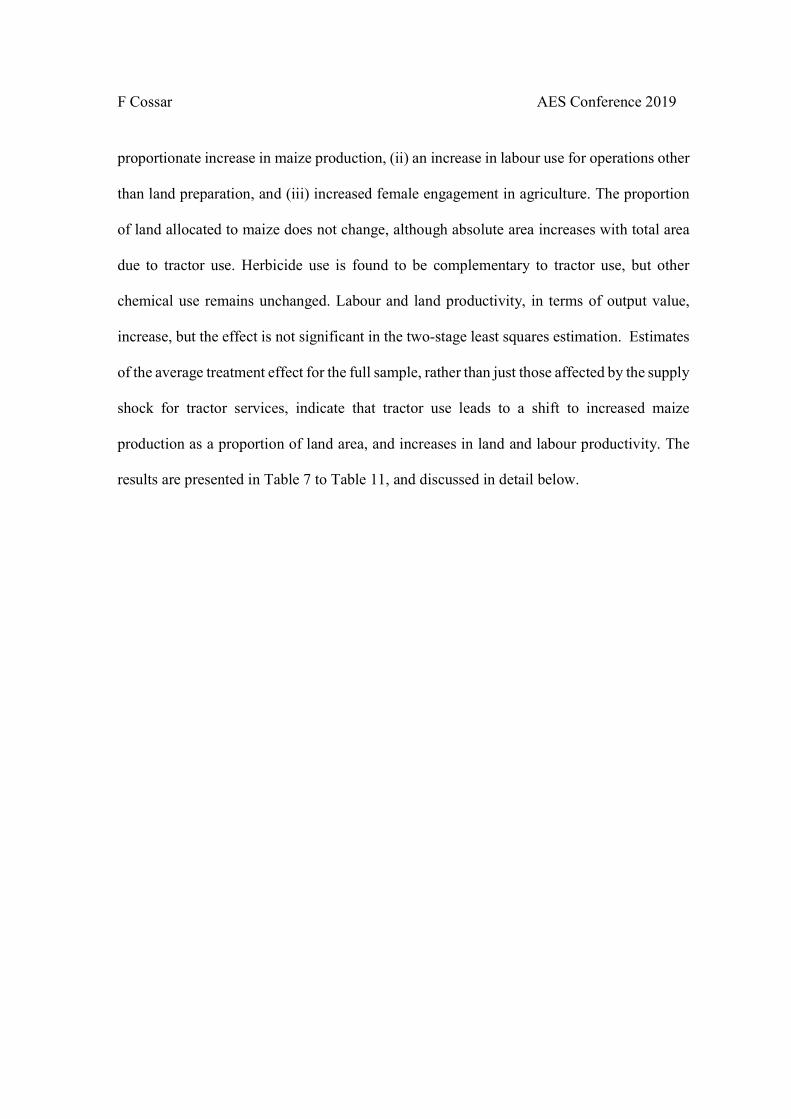
F Cossar AES Conference 2019
proportionate increase in maize production, (ii) an increase in labour use for operations other
than land preparation, and (iii) increased female engagement in agriculture. The proportion
of land allocated to maize does not change, although absolute area increases with total area
due to tractor use. Herbicide use is found to be complementary to tractor use, but other
chemical use remains unchanged. Labour and land productivity, in terms of output value,
increase, but the effect is not significant in the two-stage least squares estimation. Estimates
of the average treatment effect for the full sample, rather than just those affected by the supply
shock for tractor services, indicate that tractor use leads to a shift to increased maize
production as a proportion of land area, and increases in land and labour productivity. The
results are presented in Table 7 to Table 11, and discussed in detail below.

F Cossar AES Conference 2019
Table 7: Main results for productivity
Yield (maize, kg per ha) Labour productivity (maize,
kg per person day) Output value per ha (all crops,
cedis) Output value per person day
(all crops, cedis)
(1) (2) (3) (1) (2) (3) (1) (2) (3) (1) (2) (3)
OLS IV with
area control
IV with flood
control OLS
IV with area
control
IV with flood
control OLS
IV with area
control
IV with flood
control OLS
IV with area
control
IV with flood
control
Tractor use 41.77 -190.2 -182.6 1.85 -8.94 -9.66 -27.11 207.97 169.55 1.07 9.44 10.15
(116.01) (256.83) (271.11) (2.46) (9.08) (9.30) (44.58) (176.39) (184.22) (2.03) (7.48) (7.68)
Area owned by hh (ha) 13.8 0.31 -14.37** 0.24 (10.83) (0.27) (5.59) (0.22)
flood district (dummy) -78.32 -3.56 42.29 -0.67 (115.92) (2.82) (64.18) (2.33)
N 233 233 233 258 256 258 418 411 411 258 256 258 R2 adjusted 0.08 0.07 0.06 0.19 0.12 0.11 0.27 0.23 0.23 0.2 0.14 0.13 F-stat 2.03 1.98 1.92 3.92 3.49 3.49 7.87 7.59 7.36 4.13 3.78 3.71 F-stat (first stage excluded instruments) 48.85 44.64 18.52 17.96 26.94 24.81 18.52 17.96 Pagan & Hall's heteroscedasticity test (p-value) 1 1 0.75 0.97 0.01 0.21 0.98 1 Anderson-Rubin weak instrument F test (p-value) 0.48 0.52 0.33 0.3 0.24 0.36 0.21 0.19
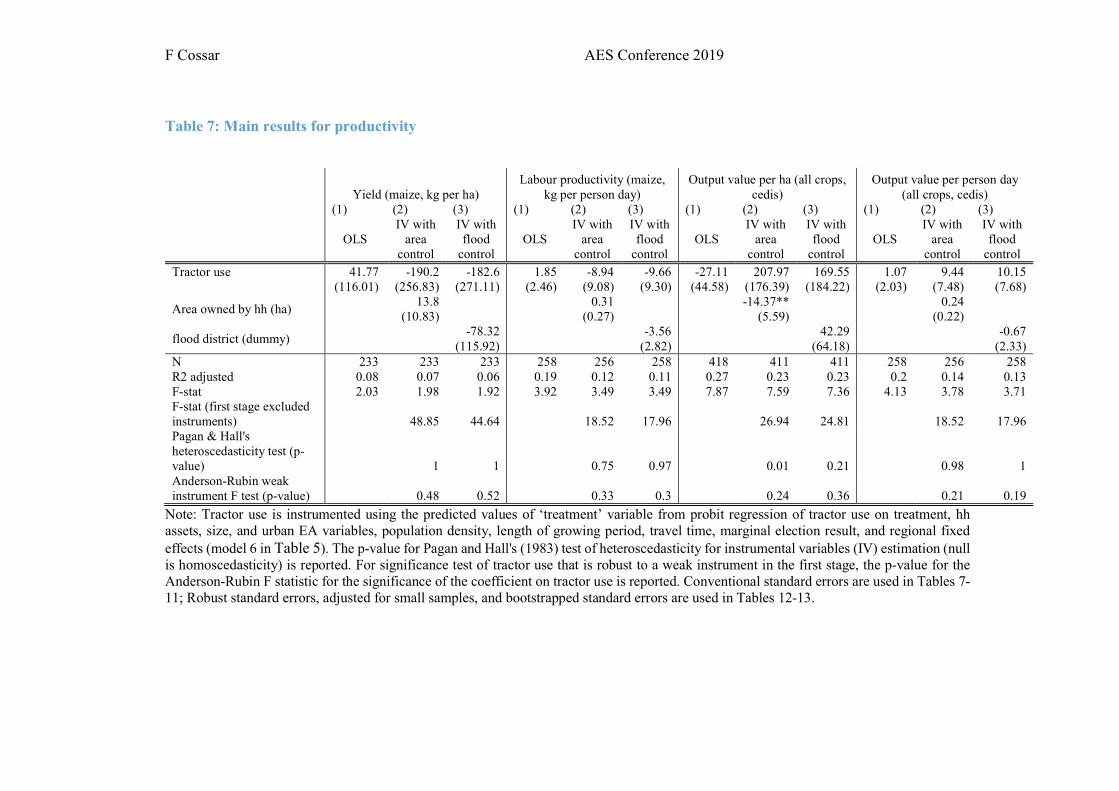
Note: Tractor use is instrumented using the predicted values of ‘treatment’ variable from probit regression of tractor use on treatment, hh assets, size, and urban EA variables, population density, length of growing period, travel time, marginal election result, and regional fixed effects (model 6 in Table 5). The p-value for Pagan and Hall's (1983) test of heteroscedasticity for instrumental variables (IV) estimation (null is homoscedasticity) is reported. For significance test of tractor use that is robust to a weak instrument in the first stage, the p-value for the Anderson-Rubin F statistic for the significance of the coefficient on tractor use is reported. Conventional standard errors are used in Tables 7-11; Robust standard errors, adjusted for small samples, and bootstrapped standard errors are used in Tables 12-13.
F Cossar AES Conference 2019
Table 8: Main results for scale of production
Area cultivated (total) Area cultivated (maize, %) Area cultivated (female
holder/cultivator, %)
(1) (2) (3) (1) (2) (3) (1) (2) (3)
OLS IV
(conventional SE)
IV with flood
control OLS
IV (conventional SE)
IV with flood
control OLS
IV (conventional SE)
IV with flood
control
Tractor use 0.53** 4.32** 4.94*** 12.70*** 9.78 16.82 2.16 26.76** 27.99**
(0.23) (1.70) (1.89) (4.37) (20.78) (21.82) (1.55) (11.97) (13.03) flood district (dummy) 1.17* 11.51* 2.31
(0.62) (6.06) (4.29)
N 407 400 400 252 252 252 407 400 400 R2 adjusted 0.38 0.23 0.19 0.51 0.5 0.51 0.86 0.82 0.82 F-stat 13.23 10.46 9.47 37.1 13.57 13.22 631.15 93.65 87.77 F-stat (first stage excluded instruments) 25.95 22.38 16.96 15.14 25.95 22.38 Pagan & Hall's heteroscedasticity test (p-value) 1 1 1 1 0.05 0.08 Anderson-Rubin weak instrument F test (p-value) 0.01 0 0.66 0.47 0.02 0.02

F Cossar AES Conference 2019
Table 9: Main results for labour use by operation (person days)
Land preparation Field management Harvest Post-Harvest
(1) (2) (3) (1) (2) (3) (1) (2) (3) (1) (2) (3)
OLS
IV (conventional SE)
IV with flood
control OLS
IV (conventional SE)
IV with flood
control OLS
IV (conventional SE)
IV with flood
control OLS
IV (conventional SE)
IV with flood
control
Tractor use -8.77** -8.72 -6.35 -0.32 39.28** 43.42** 0.97 33.92** 36.18** 1.71 10.92** 11.61**
(4.04) (12.79) (13.66) (5.32) (17.09) (18.55) (3.29) (13.72) (15.13) (1.27) (5.37) (5.88) flood district (dummy) 5.18 8.71 3.76 1.2
(4.79) (6.63) (4.53) (1.82)
N 394 387 387 393 391 391 383 376 376 398 391 391 R2 adjusted 0.07 0.07 0.07 0.15 -0.05 -0.09 0.13 -0.2 -0.25 0.07 -0.09 -0.12 F-stat 3.73 2.15 2.13 292.33 3.24 3.01 4.94 2.85 2.62 2.5 1.83 1.71 F-stat (first stage excluded instruments) 31.74 27.95 33.15 29.21 21.17 18.14 22.46 19.18 Pagan & Hall's heteroscedasticity test (p-value) 0.88 0.89 1.00 1.00 1.00 1.00 1 1 Anderson-Rubin weak instrument F test (p-value) 0.51 0.65 0.01 0.01 0.00 0.01 0.03 0.04
F Cossar AES Conference 2019
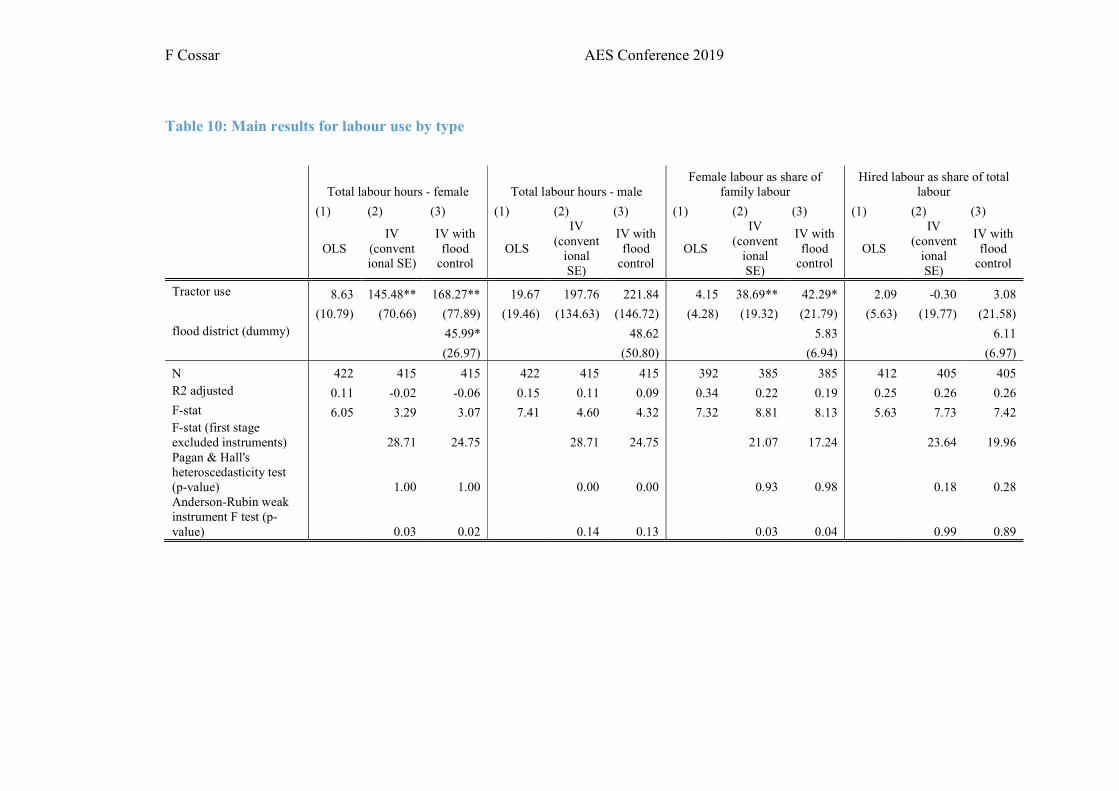
Table 10: Main results for labour use by type
Total labour hours - female Total labour hours - male Female labour as share of
family labour Hired labour as share of total
labour
(1) (2) (3) (1) (2) (3) (1) (2) (3) (1) (2) (3)
OLS IV
(conventional SE)
IV with flood
control OLS
IV (convent
ional SE)
IV with flood
control OLS
IV (convent
ional SE)
IV with flood
control OLS
IV (convent
ional SE)
IV with flood
control
Tractor use 8.63 145.48** 168.27** 19.67 197.76 221.84 4.15 38.69** 42.29* 2.09 -0.30 3.08
(10.79) (70.66) (77.89) (19.46) (134.63) (146.72) (4.28) (19.32) (21.79) (5.63) (19.77) (21.58) flood district (dummy) 45.99* 48.62 5.83 6.11
(26.97) (50.80) (6.94) (6.97)
N 422 415 415 422 415 415 392 385 385 412 405 405 R2 adjusted 0.11 -0.02 -0.06 0.15 0.11 0.09 0.34 0.22 0.19 0.25 0.26 0.26 F-stat 6.05 3.29 3.07 7.41 4.60 4.32 7.32 8.81 8.13 5.63 7.73 7.42 F-stat (first stage excluded instruments) 28.71 24.75 28.71 24.75 21.07 17.24 23.64 19.96 Pagan & Hall's heteroscedasticity test (p-value) 1.00 1.00 0.00 0.00 0.93 0.98 0.18 0.28 Anderson-Rubin weak instrument F test (p-value) 0.03 0.02 0.14 0.13 0.03 0.04 0.99 0.89

F Cossar AES Conference 2019
Table 11: Main results for chemical use (kg per ha)
Herbicide Pesticide Inorganic fertilizer
(1) (2) (3) (1) (2) (3) (1) (2) (3)
OLS
IV (convent
ional SE)
IV with flood
control OLS
IV (convent
ional SE)
IV with flood
control OLS
IV (convent
ional SE)
IV with flood
control
Tractor use -0.62 11.30* 11.15* -0.22* -0.24 -0.27 18.87 4.38 10.64
(2.51) (5.94) (5.95) (0.13) (0.51) (0.51) (19.25) (63.27) (63.54) flood district (dummy) -0.18 -0.04 7.48
(1.98) (0.17) (21.18)
N 182 181 181 182 181 181 182 181 181 R2 adjusted 0.12 -0.24 -0.24 0.02 0 -0.01 0.03 0.03 0.03 F-stat . 1.74 1.66 . 0.89 0.85 . 1.28 1.23 F-stat (first stage excluded instruments) 12.8 12.58 12.8 12.58 12.8 12.58 Pagan & Hall's heteroscedasticity test (p-value) 0.76 0.82 0 0.01 0.98 0.99 Anderson-Rubin weak instrument F test (p-value) 0.03 0.04 0.66 0.62 0.95 0.88

F Cossar AES Conference 2019
a. Main results
For the ordinary least squares estimates, the correlation between tractor plowing and
productivity outcomes is not significant (Table 7). Similarly, the instrumental variable
estimation does not show evidence of any significant relationship between tractor use by farm
households and their land or labour productivity. Even using the Anderson-Rubin test for
significance under weak instrument, none of the productivity outcomes are significantly
affected by tractor use. The lack of significance in these results is likely due to the relatively
small sample size, and the poor measurement of farm output, particularly when using a single
cross section to capture differences in yields across farmers. The impact of flooding across
Ghana in 2009 have likely caused considerable noise in the variables for agricultural output.
As discussed above, measurement error can lead to the underestimation of treatment effects
for yield. Given the year-specific weather shocks that can affect the resulting output from
agricultural production, the farmers’ decisions over use of land, fertilizer, and labour are
better indicators of the farmers’ response to increased use of machinery than productivity.
These decisions are made during the growing season and under more direct control of the
farmer. We are interested in how these within season farming decisions are affected by the
use of agricultural machinery.
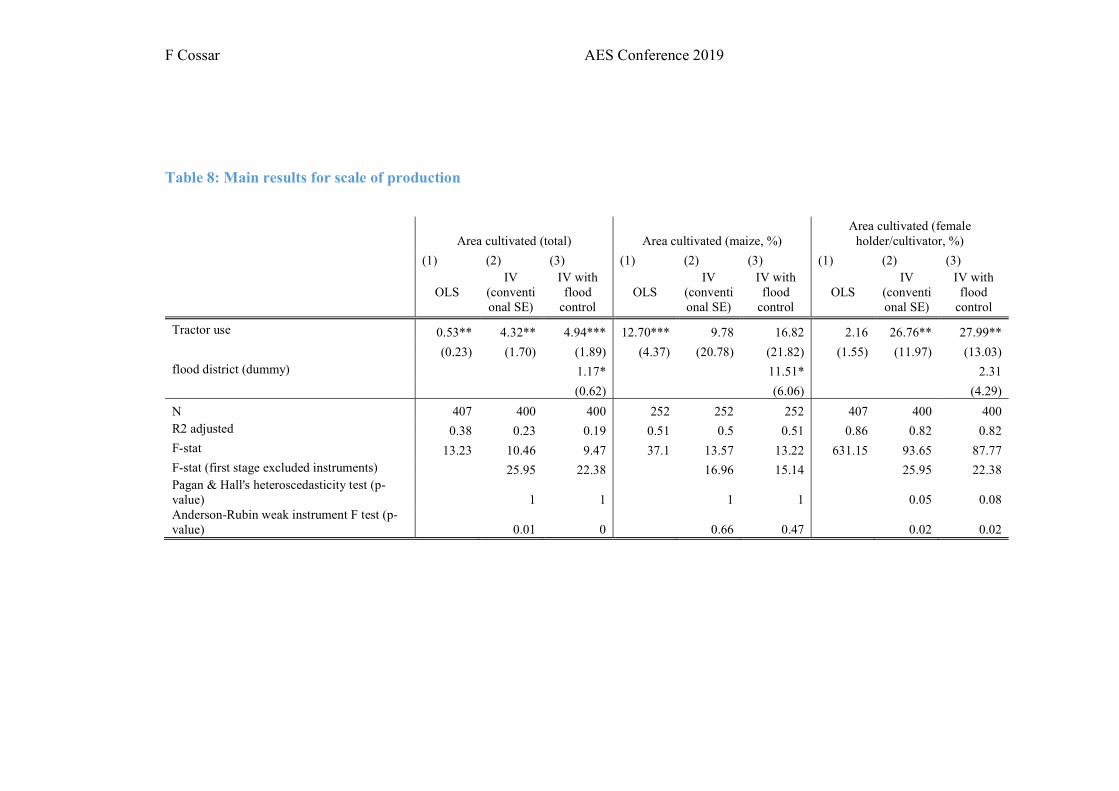
The OLS estimation indicates that the area cultivated and tractor use are positively correlated.
On average, farm households that used a tractor for plowing cultivated 0.53 ha more land
(Table 8). If the instrumental variable is identifying the causal impact of tractor use we can
further conclude that using tractor plowing causes a significant increase in cultivated land for

F Cossar AES Conference 2019
those just-excluded farm households, by 4-5 ha. The magnitude of this increase is quite large.
However, the magnitude of the impact is within the range of cultivated hectares for the
sample and not inconsistent with farmers responses during qualitative interviews in Yendi,
albeit it is at the upper end of what may be plausible. As discussed above, the measurement
of land sizes for smaller farms tends to be over-estimated in surveys like this. When standard
errors are adjusted for heteroscedasticity and small samples, the relationship remains
significant (Table 12). Cautiously, these results seem to support the conclusion that some of
the increased area cultivated by tractor-using farm households is due to the use of tractor
plowing at the start of the season.
Furthermore, the OLS results indicate that tractor-using farmers are associated with a greater
proportion of land being cultivated with maize, by approximately 13 percentage points.
However, the significance of this effect is lost when using the instrumental variable
estimation(Table 8, Table 12, & Table 13). The effect is positive, but it is not found to be
significant. The probable conclusion from this is that the correlation between maize
cultivation and tractor use is due to machinery is being used in areas which are more suitable
for maize cultivation, rather than tractor use in and of itself causing farmers to cultivate
maize.
The final panel of Table 8 indicates that for some farm households, women may be more
engaged in agricultural production due to tractor plowing. Focusing on those farm
households affected by the treatment, women, on average, have control over an additional 27
percentage points of the household’s land, due to the use of tractor plowing by the household.
However, the relationship is not significant under the OLS regression model, which indicates
F Cossar AES Conference 2019
that any causal relationship is only true for those just-excluded households. Control over
agricultural land is defined as the household member who is identified as the main holder or
cultivator of the plot. This causal relationship between tractor use and women’s engagement
in agriculture is consistent with qualitative discussions with farmers who repeatedly claimed
that women would farm more when they were able to access tractor services. The significance
of the quantitative result is also found when the standard errors are adjusted for
heteroscedasticity (Table 12). Overall, it seems that the total area of cultivation by a farm
household increases due to tractor use, with a proportional increase in maize production.
More of the increased area is controlled by women.
Table 9 provides somewhat surprising results for the effect of tractor use on labour use per
ha, which is particularly relevant to the theoretical discussion between a labour constraint
and a timing constraint motivating tractor plowing. With farmers responding to a labour
constraint with tractor use, we may expect that labour use for land preparation would
decrease, as machinery power replaces manual labour. Unfortunately, the first panel of Table
9 shows somewhat inconclusive results which is likely due to a relatively small sample size
for treatment and control villages. On average, tractor-using farm households use 9 fewer
person days of labour for land preparation, and this partial correlation is significant from the
OLS. However, this relationship is not significant under the IV model. Therefore, we cannot
conclude whether tractor plowing is causing a fall in labour use for land preparation. It may
be that labour-constrained farm households are more likely to use tractor-plowing. Tractor
use is associated with lower labour use for land preparation, but no conclusion can be made
as to whether this is driven by a shortage of labour, or tractor displacing labour.
F Cossar AES Conference 2019
The results for labour use in field management, harvesting, and post-harvest are surprising,
but should also be considered with caution (Table 9). If we consider the instrument to be
successful in identifying the effect of tractor plowing, then we have evidence that there is a
significant and positive increase in the days of labour used per hectare for these other
operations, due to tractor-plowing. This result holds under weak instruments, and robust
standard errors. However, caution arises due to the difference between the OLS and IV
results. For the OLS, the relationship is small in magnitude and not significantly different
from zero; for the IV regression, the magnitude of the coefficients is considerably larger. For
field management, the results suggest that the farm household uses approximately an
additional 40 person days per ha when using tractor plowing, compared to when just using
hand-hoeing. We can consider whether the results are consistent with the other results and
understandings of these farm households from qualitative work. A considerable increase in
labour use per hectare is consistent with the previous result of an increased area cultivated
due to tractor plowing, with a proportionate increase in maize cultivation. The per hectare
increase in labour use would come from expansion into lower-quality land which may require
more intensive weeding, or from early planting of maize which requires more application of
organic or inorganic fertilizer. This is consistent with the idea that farmers are responding to
a time constraint in using tractor plowing.
A plausible explanation of these empirical results would be that the risk of poorer yield due
to late planting has been reduced. Farmers are therefore investing more labour time into
cultivation because the expected yield is higher with tractor plowing. Field management will
include the labour required for weeding and application of fertilizer. Farmers are more

F Cossar AES Conference 2019
interested in carrying out these activities when they have been able to plow and plant early.
Farmers’ investment in subsequent activities is increased because a timing constraint at the
start of their agricultural production has been overcome through machinery plowing. The
important point here is that in this low-productivity labour-intensive farm-household system,
there is little evidence that tractor-plowing is leading to a transformation in labour-use
relative to land cultivated. In fact, tractor-plowing may be alleviating a timing constraint at
the start of the season, which increases the labour effort for field management, harvest, and
post-harvest operations.
Table 10 considers the impact on total labour days by gender, as well as the use of hired
labour of tractor plowing. Consistent with the increased labour use by hectare, the total labour
days for females increases significantly under the IV regression. There is a similar increase
for male labour, but the effect is not significant. The increase for men is greater, consistent
with the higher share of agricultural labour which is undertaken by men in the sample (see
Table 10). The effect of tractor use on the proportion of agricultural work undertaken by
female household members is positive and significant under the IV regression. This indicates
that tractor use leads to a greater increase in female labour time in agriculture, compared to
male family members. These findings can only be argued for the just-excluded farm
household; the OLS regression does not find a significant relationship between tractor use
and the type of labour use. However, the increased female labour use is consisted with the
earlier finding of women controlling a greater agricultural area due to tractor use. The final
panel of Table 10 shows that there is no conclusive effect of tractor use on the proportion of
work which is done by hired labour, compared to family labour. Given that on average 26%
F Cossar AES Conference 2019
of farm labour is hired workers, it is striking that both tractor-using and non-using household
are employing a similar proportion of hired workers.
As expected, tractor use leads to a significant increase in herbicide use per ha for the just-
excluded farm households (Table 11). These inputs are complementary as farmers use
herbicide to kill weeds before using the tractor to turn over the soil. The results for pesticide,
and inorganic fertilizer use per hectare are inconclusive. The survey responses to the
chemical module of the survey was low which has reduced the sample size and power of the
estimation for these outcome variables.

F Cossar AES Conference 2019
Table 12: IV estimation using robust standard errors adjusted for small sample bias, and bootstrapped standard errors
Labour days per ha
Output value per ha (all crops, cedis)
Output value per person day (all crops, cedis)
Area cultivated (ha)
Area cultivated - maize (%)
Area cultivated - female (%)
land preparation
field management harvest
post-harvest
Tractor use 149.24 10.51 4.32 9.78 26.76 -8.72 39.28 33.92 10.92 Robust small sample SE (147.42) (5.86)* (1.53)*** (16.54) (13.43)** (14.28) (20.53)* (17.78)* (6.33)* Bootstrap SE (151.94) (11.19) (1.88)** (28.75) (13.51)** (14.40) (19.40)** (17.55)* (8.02)
N 411 258 400 252 400 387 391 376 391 R2 adjusted 0.24 0.12 0.23 0.5 0.82 0.07 -0.05 -0.2 -0.09 F-stat 4.2 4.26 9.65 39.6 194.31 3.83 3.56 3.66 2.23 F-stat (first stage excluded instruments) 16.04 6.5 14.22 5.72 14.22 15.05 22.8 10.94 12.16 Pagan & Hall's heteroscedasticity test (p-value) 0.12 0.99 1 1 0.05 0.88 1 1 1 Anderson-Rubin weak instrument F test (p-value) 0.29 0.02 0 0.56 0.03 0.55 0.03 0.01 0.05
Total labour days Chemicals (kg/ha)
Female family
Male family
female labour share of family labour
hired share of total labour Herbicide Insecticide
Inorganic fertilizer
Tractor use 145.48 197.76 38.69 -0.3 11.3 -0.24 4.38 Robust small sample SE (70.84)** (116.02)* (23.29)* (19.42) (13.74) (0.34) (59.00) Bootstrap SE (114.82) (115.37)* (28.00) (27.61) (41.92) (0.67) (77.43)
N 415 415 385 405 181 181 181 R2 adjusted -0.02 0.11 0.22 0.26 -0.24 0 0.03 F-stat 4.23 6.34 6.25 5.87 0.87 0.33 1.29 F-stat (first stage excluded instruments) 16.15 16.15 11.71 12.86 3.76 3.76 3.76 Pagan & Hall's heteroscedasticity test (p-value) 1 0 0.93 0.18 0.76 0 0.98 Anderson-Rubin weak instrument F test (p-value) 0.02 0.07 0.06 0.99 0.22 0.47 0.94

F Cossar AES Conference 2019
Table 13: Treatment Effect Regression Model (two-step control function method)
Labour days per ha
Yield (kg/ha)
Labour productivity (kg/day)
Output per ha (USD)
Output per person day (USD)
Area cultivated (ha)
Area cultivated - maize (%)
Area cultivated - female (%)
land preparation
field management harvest
post-harvest
Tractor use -229.43 -9.59 140.63 6.54 3.17** 1.2 19.83** -11.39 25.80* 25.78**
11.66***
(225.70) (7.01) (147.88) (5.77) (1.34) (17.49) (9.63) (11.11) (14.30) (10.02) (4.36)
λ (inverse Mill ratio) 193.56 7.13* -98.99 -3.4 -1.55** 7 -10.35* 1.56 -15.54* -
14.44*** -5.79**
(137.46) (4.02) (83.01) (3.36) (0.74) (10.09) (5.34) (6.27) (7.96) (5.45) (2.39) N 233 258 418 258 407 252 407 394 393 383 398 Chi2 (joint significance) statistic 86.58 134.99 299.52 143.75 379.67 345.2 2497.74 159.79 201.71 181.6 165.69
Total labour days Chemicals (kg/ha)
Female Male
female labour share of family labour
hired share of total labour Herbicide Insecticide
Inorganic fertilizer
Tractor use 99.97* 135.2 31.76** 8.38 8.74** -0.71** -8.58 (58.60) (124.58) (15.33) (17.01) (3.67) (0.35) (42.59)
λ (inverse Mill ratio) -53.80* -68.05 -16.17* -3.66 -6.44*** 0.33 18.9
(32.70) (69.95) (8.52) (9.51) (2.17) (0.21) (26.65)
N 422 422 392 412 182 182 182 Chi2 (joint significance) statistic 202.55 222.48 328.26 293.63 114.8 95.66 96.77
Note: Where the estimated coefficient on λ is significantly different from zero, there is evidence of endogeneity therefore OLS estimates are inconsistent and these endogenous treatment effects should be used. Stata program etregress with two-step option used which estimates the first stage using probit model. See Wooldridge, (2010, sec. 21.4.2) for details on the method used for estimation.
F Cossar AES Conference 2019
b. Robustness checks
The first check is to understand how sensitive the key results are to the exclusion restriction
being violated i.e. that there is correlation between the assignment into treatment groups and
the outcome variables. Figure A 4 shows the union of confidence intervals for the treatment
effect under different levels of direct correlation between the instrument and the outcome.
These are shown for total area cultivated by the household, the proportion of cultivated area
allocated to maize production and controlled by female household members, labour use per ha
for land preparation and field management, and the total male labour person days. The main
results find a significant effect for the total area cultivated, the proportion of land controlled by
women, and labour use per ha for field management. The graphs in Figure A4 tell us that these
significant results hold for negative, zero, and a small positive direct correlation between the
instrument and these outcomes.
Using the control function approach (Table 13), the estimated average treatment effects are
consistent with the 2SLS estimation of the local average treatment effects. In fact, this
alternative method finds a significant and positive effect of tractor use on the proportion of
cultivated land allocated to maize production. For outcomes where the effect is significant and
the coefficient is notably different to the OLS estimates, we find there also to be evidence of
endogeneity (with significance of the inverse Mill ratio coefficient). This gives confidence that
the estimated coefficients which account for endogeneity are more accurate than simple OLS
estimation. Finally, propensity score matching allows for estimation of average treatment
effects for the whole sample and without relying upon the instrumental variable (Table A 1).
Because of this, the estimated effects will be different but are still illustrative of whether the
main results are specific to the estimation method. These estimates are likely to be biased due
to unobserved endogeneity which is not accounted for in the estimation method, therefore these
F Cossar AES Conference 2019
are more likely to be correlations rather than causations. Land and labour productivity increases
with tractor use. The scale of cultivation and maize production in particular is greater with
tractor use. As would be expected from conventional theory, reduced labour use per ha for land
preparation and field management is associated with tractor use. Interestingly, the
proportionately greater increase in female labour use is found by this method, as well in the
main results.
VI. Discussion
The majority of farmers in Ghana use mechanized technology through a market for tractor
services, rather than ownership. The consequence of this is that their decision or ability to use
tractor plowing is partly determined by the functioning of the service market. Each year the
farmer decides whether to seek tractor services, and engages with the weak service market to
secure those services – it is not a one-time switch in technology use which guarantees tractor
use each season. Therefore, focusing on the effect of tractor use for those farm households
which are just-excluded from the service market is important in understanding the constraints
on farm production. The treatment effects of tractor use which have been estimated are the
average effect for compliers, i.e. farmers who without government-induced increase in the
supply of services, would not have used machinery for plowing.
Much of these findings rely upon an instrumental variable which leads to a relatively small
sample size for treatment and control districts, and may be open doubt as to its exogeneity. A
key issue is whether the roll out of the government mechanization scheme was as-good-as
random, or whether the timing of allocations was indirectly prioritized to districts which are
more or less likely to use tractor plowing for other reasons. If the exogeneity of the instrument
is in fact violated, the results would be consistent with the government roll out being first to
areas (i) with larger farm sizes, (ii) where women more engaged in agriculture, and (iii) with
F Cossar AES Conference 2019
higher labour-intensity of cultivation. From consider the balance between the treatment and
control districts, there was some evidence that the first districts to receive the government
tractors had a shorter travel time to the nearest town (see Figure A2). These shortcomings
cannot be ignored, and more work using recently collected panel datasets would potentially
provide more confidence of the findings presented here.
However, the findings of this analysis are consistent with qualitative discussions with farmers.
Frequently farmers indicate that the scale of production is considerably increased when tractor
services are secured. Households also reported that women would farm more due to the use of
tractor plowing. It was clearly indicated from farmers that they choose to cultivate different
crops when tractor plowing is done. It is therefore not implausible that cultivating more maize
and other market-orientated crops would entail higher labour intensity of production.
Whilst the econometric results of this paper alone should be considered with caution, they are
not inconsistent with other findings of this thesis, and the wider literature. The increase in maize
production over recent decades has been strongly associated with increased use of
mechanization both qualitatively and in other quantitative studies (Nazaire Houssou &
Chapoto, 2015; Nin-Pratt & McBride, 2014). The results of this analysis are consistent with
this literature. I find evidence of farmers shifting their crop composition to cultivate more
maize, in proportion to the increase in cultivated land. The maize yield is not increased by
mechanization use, but the overall value of agricultural production increases. This increase can
be partly explained by the shift to cultivation of a higher value crop. Farmers’ decisions over
which crops to plant are affected by whether or not they are able to use tractor plowing. The
implication of this is that difficulty in accessing tractor services leads to a low-effort and low-
return production system. Maize is a crop with higher market value and is traded extensively,
F Cossar AES Conference 2019
locally and to supply urban centres. Tractor plowing enables some farmers to alter their
production decisions to support a higher-effort but higher-return farming system.
The theoretical argument of the paper has been to consider the impact of mechanization to be
conditional on the constraint on farmers’ production – either a binding labour or timing
constraint. Agricultural machinery is considered a labour-saving technology by much of the
literature (Pingali, 2007). Even when the distinction is made between power operations (i.e.
land preparation, and harvesting) and control operations (planting, and weeding),
mechanization of these operations is considered to lead to reduced labour use per ha. However,
the empirical findings of this paper appear to be inconsistent with this. Significant results are
found to show that there is no change to the labour use for land preparation, and potentially an
increase in labour use for other operations due to use of tractor plowing.
A coherent explanation for this observed pattern is the following. Without machinery, farmers
find it difficult to prepare their land in time to plant optimally. If planting is done late, the
expected yield will be lower and the returns to subsequent investments in labour and other
inputs for crop production are less. Therefore, when machinery is used and if therefore farmers
are more likely to plant early, then the expected yield increases and there is a crowding-in of
further investments in crop maintenance, harvest, and post-harvest activities. The implication
of this is that labour availability is not such a binding constraint since farmers can increase their
own and hired labour for other operations. Rather, it is the combination of critical timing of
land preparation and labour availability which make the benefits of machinery use so great
(Ruthenberg, 1980). Given these constraints for farmers in this context, mechanization of land
preparation is not labour-replacing, but rather increases the expected returns to labour.
Timely planting, thanks to tractor use, changes the expected returns for agricultural activities
within the household, and therefore affects the intra-household decisions over labour use,
F Cossar AES Conference 2019
which crops to cultivate, and which family members to take active control over which plots.
Women, who may have been more labour constrained than men, cultivate more when the
household uses machinery, although not necessarily of time-sensitive crops.
The gender dimension of mechanization has been little researched and it is by no means clear
whether increased commercialization of production, evidenced by mechanization, pushes
women out of agriculture, or whether the reduced drudgery associated with land preparation
may enable women to farm more. Furthermore, gender differences in the ability to access
family and hired labour, and other inputs, may well extend to engaging with the service market
for machinery. Theis et al., (2018) particularly demonstrate the importance of considering the
changes in intra-household decision making in light of technology adoption, with the costs and
benefits of technology adoption not borne equally by household members. The evidence is that
women have control over cultivation of a greater area when the farm household is using tractor
plowing on at least one plot. It is not clear whether the effect is due to women are using tractor
plowing on their own plots, or the use of tractors on other household plots frees up labour for
land preparation on female-controlled plots. Either way, the findings are consistent with
qualitative discussion with farmers who frequently indicated that the use of machinery has
enabled their wives and other female household members to farm more.
These results are specific to the instrument used. When a comparison is made between all
surveyed households using tractor plowing and not, labour use is found to decrease for land
preparation and field management, which is consistent with conventional theory which sees
tractor use as simply labour-replacing. However, when we focus on those households which
may struggle to access tractor services each year, the effects are more consistent with tractor
plowing alleviating a time constraint and actually crowding in labour use. For these farmers, it
may be that labour and machinery are complements, due to the timing constraint. They may be

F Cossar AES Conference 2019
operating at a lower equilibrium, which tractor use enables them to improve upon. When we
consider all farmers including larger-scale farmers and those who more consistently secure
tractor services each year, the effect of labour and machinery being substitutes is found (i.e.
when estimating treatment effects using propensity score matching).
The methodological approach of the paper prevents any conclusions being drawn regarding the
long term impacts of machinery use on agricultural production, household welfare, and the
wider farming system dynamics. The results are under conditions of effectively a fixed land
size for households and so cannot speak to debates over whether mechanization is leading to
expansion of agricultural land into pasture, virgin, or forest land, or to the reduction of
fallowing practices. Over the long term, mechanization could be facilitating a mining of soil
nutrients as farmers are able to increase production through land expansion, rather than
intensification and maintenance of soil nutrients.
Mano, Takahashi and Otsuka (2017) consider similar questions in the context of rice
intensification in Cote d’Ivoire. They find the uncertainty over access to tractor services
prevented intensification of production. Tractor use in land preparation enhanced the adoption
of input- and labour-intensive practices in subsequent farming activities, resulting in
complementarity between machinery and labour use. Takeshima, Houssou and Diao, (2018)
find that tractor ownership increases the returns to scale for maize production in northern
Ghana. This paper adds to this literature in focusing on the input decisions of tractor users.
There is consistent evidence across these papers to support the claim that tractor use, either
through ownership or rental market, is not so much associated with changes in labour use, but
increased return from the use of all inputs – labour, hybrid seeds, and chemicals.

F Cossar AES Conference 2019
VII. Conclusions
Overall, this analysis provides evidence that tractor use leads some farm households to increase
the area of cultivation, increase labour use for some operations, and to increase women’s
engagement in agricultural production. The implication of these findings is that the short time
window for land preparation in Ghana is motivating farmers’ use of tractor plowing. When
mechanized plowing is used which enables earlier planting, farmers change their production
decisions over which crop to plant and how much labour effort to invest in crop maintenance
and harvest. Furthermore, this difficulty over land preparation appears to particularly constrain
women’s engagement with farming. These effects of tractor use are more pronounced for farm
households who are just-excluded from the tractor service market. This departs from literature
which consider mechanization as labour-saving and a response to increasing labour costs. If
this were the case, we may expect to see more than just plowing being mechanized and total
labour use per hectare to at least remain constant. If it is a timeliness constraint which is
motivating mechanization use, it is by no means inevitable that mechanization of other
operations will immediately follow.
Several of these conclusions appear contradictory to theory and perceptions of machinery use.
It should be remembered that the estimated effects are for those farmers which responded to
the treatment, not those who were using machinery regardless of the interventions. The fact
that farmers in Ghana may be constrained in increasing their area of cultivation due to
population density and land institutions, does not appear to be a barrier to use of machinery for
land preparation. Furthermore, the farming systems observed in Ghana are still highly labour-
intensive, despite mechanization of land preparation. In fact, the evidence seems to suggest that
farmers invest more in inputs per ha when land preparation is mechanized. This therefore leads

F Cossar AES Conference 2019
to the conclusion that the impacts of mechanization which are observed, are a result of the time
constraint being alleviated by tractor plowing technology.
For policy, there are two key debates which these results contribute two. Machinery use in
Ghana does seem to be facilitating a shift in the gender division of responsibilities for
agricultural production. Further work to look at the long term impact of machinery use on both
control over agricultural production, and labour use in agriculture and non-agricultural
activities would provide more evidence. The effect on total labour use and area cultivated may
be unchanged, but the gendered composition seems to be impacted. A second debate this work
contributes to is that over climate change mitigation. The conclusion that mechanization in
Ghana may be as much of a response to time constraint as labour shortage could have
implications for understanding the risks and responses of farmers to climate change, if it is
leading to increased variability and unpredictability of rainfall patterns in this region. The use
of machinery may be one means of mitigation for farmers to reduce the time required to carry
out an activity, thereby reducing the risk of crop damage and lower yields due to rainfall
variation.

F Cossar AES Conference 2019
Bibliography
Abadie, A., Athey, S., Imbens, G., & Wooldridge, J. (2017). When Should You Adjust
Standard Errors for Clustering? (Working Paper Series No. 24003).
https://doi.org/10.3386/w24003
Alderman, H., Chiappori, P.-A., Haddad, L., Hoddinott, J., & Kanbur, R. (1995). Models of
the Household : Is It Time To Shift the Burden. The World Bank Research Observer,
10(I), 1–19. https://doi.org/https://doi.org/10.1093/wbro/10.1.1
André, P., & Mesplé-Somps, S. (2011). The Allocation of Public Goods and National
Elections in Ghana (MPRA Paper No. 29873). Retrieved from
http://siteresources.worldbank.org/DEC/Resources/84797-1257266550602/AndreP.pdf
Angrist, J. D., & Pischke, J.-S. (2009). Mostly Harmless Econometrics: an Empiricist’s
Companion. Princeton: Princeton University Press.
Arthi, V., Beegle, K., De Weerdt, J., & Palacios-López, A. (2018). Not your average job:
Measuring farm labour in Tanzania. Journal of Development Economics, 130, 160–172.
https://doi.org/10.1016/j.jdeveco.2017.10.005
Barrett, C. B., Bellemare, M. F., & Hou, J. Y. (2010). Reconsidering Conventional
Explanations of the Inverse Productivity-Size Relationship. World Development, 38(1),
88–97. https://doi.org/10.1016/j.worlddev.2009.06.002
Benin, S. (2015). Impact of Ghana’s agricultural mechanization services center program.
Agricultural Economics, 46(S1), 103–117. https://doi.org/10.1111/agec.12201
Binswanger, H. (1986). Agricultural Mechanization A Comparative Historical Perspective.
The World Bank Research Observer, 1(January), 27–56. Retrieved from
http://wbro.oxfordjournals.org/content/1/1/27.short
Binswanger, H. P., & Ruttan, V. W. (1978). Induced innovation : technology, institutions,
and development. Baltimore ; London: Johns Hopkins University Press.
Binswanger, H., & Rosenzweig, M. R. (1986). Behavioural and material determinants of
production relations in agriculture. The Journal of Developing Studies, 22(April), 503–
539. https://doi.org/10.1080/00220388608421994

F Cossar AES Conference 2019
Boadu, V. A. (2012). Maize Price Trends in Ghana (2007‐2011) (METSS‐Ghana Research
and Issue Paper Series No. 01–2012). Retrieved from
https://www.agmanager.info/sites/default/files/MaizeTrends_01-2012_Vincent.pdf
Boserup, E. (1965). The Conditions of Agricultural Growth: The Economics of Agrarian
Change Under Population Pressure. Earthscan.
Bossuroy, T. (2011). Ethnicity and Election Outcomes in Ghana. Institut de Recherche Pur
Le Développement Ducoment de Travail 2011-05, (2011–05).
Carletto, C., Gourlay, S., & Winters, P. (2015). From Guesstimates to GPStimates: Land
Area Measurement and Implications for Agricultural Analysis. Journal of African
Economies, 24(5), 593–628. https://doi.org/10.1093/jae/ejv011
Carletto, C., Savastano, S., & Zezza, A. (2013). Fact or artifact: The impact of measurement
errors on the farm size-productivity relationship. Journal of Development Economics,
103(1), 254–261. https://doi.org/10.1016/j.jdeveco.2013.03.004
Conley, T. G., Hansen, C. B., & Rossi, P. E. (2012). Plausibly Exogenous. The Review of
Economics and Statistics, 94(1), 260–272. Retrieved from
https://www.mitpressjournals.org/doi/pdf/10.1162/REST_a_00139
De Groote, H., Marangu, C., & Gitonga, Z. M. (2018). Trends in Agricultural Mechanization
in Kenya’s Maize Production Areas from 1992-2012. Agricultural Mechanization in
Asia, Africa and Latin America, 49(4), 2010–2013. Retrieved from
https://www.researchgate.net/publication/329034364
Desiere, S., & Jolliffe, D. (2018). Land productivity and plot size: Is measurement error
driving the inverse relationship? Journal of Development Economics, 130, 84–98.
https://doi.org/10.1016/J.JDEVECO.2017.10.002
Diao, X., Cossar, F., Houssou, N., & Kolavalli, S. (2014). Mechanization in Ghana:
Emerging demand, and the search for alternative supply models. Food Policy, 48, 168–
181. https://doi.org/10.1016/j.foodpol.2014.05.013
Doss, C., Kovarik, C., Peterman, A., Quisumbing, A., & van den Bold, M. (2015). Gender
inequalities in ownership and control of land in Africa: myth and reality. Agricultural
Economics, 46(3), 403–434. https://doi.org/10.1111/agec.12171

F Cossar AES Conference 2019
Doss, C., Meinzen-Dick, R., Quisumbing, A., & Theis, S. (2018). Women in agriculture:
Four myths. Global Food Security, 16, 69–74. https://doi.org/10.1016/j.gfs.2017.10.001
Doss, C. R., & Morris, M. L. (2000). How does gender affect the adoption of agricultural
innovations? Agricultural Economics, 25(1), 27–39. https://doi.org/10.1111/j.1574-
0862.2001.tb00233.x
FAO, & FEWSNET. (2017). FAO GIEWS Country Brief on Ghana. Retrieved May 3, 2018,
from http://www.fao.org/giews/countrybrief/country.jsp?code=GHA
Feder, G. (1985). The relation between farm size and farm productivity: The role of family
labour, supervision and credit constraints. Journal of Development Economics, 18, 297–
313.
Food and Agriculture Organization. (2017). GIEWS Country Brief Ghana. Retrieved from
http://www.fao.org/giews/countrybrief/country/GHA/pdf/GHA.pdf
Ghana Statistical Service. (2005). Core Welfare Indicator Questionnaire (CWIQ II)-2003,
v.2.0. Retrieved from http://www.statsghana.gov.gh/
Ghana Statistical Service. (2013). 2010 Population & Housing Census.
Ghana Statistical Service. (2014). Ghana Living Standards Survey Round 6: Main Report.
Retrieved from http://www.statsghana.gov.gh/docfiles/glss6/GLSS6_Main Report.pdf
Haggblade, S., Minten, B., Pray, C., Reardon, T., & Zilberman, D. (2017). The Herbicide
Revolution in Developing Countries: Patterns, Causes, and Implications. The European
Journal of Development Research, 29(3), 533–559. https://doi.org/10.1057/s41287-017-
0090-7
Haider, H., Smale, M., & Theriault, V. (2018). Intensification and intrahousehold decisions:
Fertilizer adoption in Burkina Faso. World Development, 105, 310–320.
https://doi.org/10.1016/j.worlddev.2017.11.012
HarvestChoice. (2015a). Length of Growing Period (mean, days, 1960-1995). International
Food Policy Research Institute and University of Minnesota.
HarvestChoice. (2015b). Population, Total (2012). International Food Policy Research
Institute and University of Minnesota.
F Cossar AES Conference 2019
HarvestChoice. (2015c). Travel time to nearest town over 50k (mean, hours, 2000).
International Food Policy Research Institute and University of Minnesota.
HarvestChoice, & International Food Policy Research Institute (IFPRI). (2016). Travel Time
to Markets in Africa South of the Sahara - IFPRI HarvestChoice Dataverse.
https://doi.org/doi:10.7910/DVN/YKDWJD
Hayami, Y., & Ruttan, V. W. (1985). Agricultural development: an international perspective.
Johns Hopkins University Press.
Houssou, N., Diao, X., Cossar, F., Kolavalli, S., Jimah, K., & Aboagye, P. O. (2013).
Agricultural Mechanization in Ghana: Is Specialized Agricultural Mechanization
Service Provision a Viable Business Model? American Journal of Agricultural
Economics, 95(5), 1237–1244. https://doi.org/10.1093/ajae/aat026
IIASA/FAO. (2012). Global Agro-ecological Zones (GAEZ v3.0). Laxenburg, Austria and
Rome, Italy. Retrieved from
http://pure.iiasa.ac.at/13290/1/GAEZ_Model_Documentation.pdf
Imbens, G. W., & Wooldridge, J. M. (2009). Recent Developments in the Econometrics of
Program Evaluation. Journal of Economic Literature, 47(1), 5–86.
https://doi.org/10.1257/jel.47.1.5
Kansanga, M., Andersen, P., Kpienbaareh, D., Mason-Renton, S., Atuoye, K., Sano, Y., …
Luginaah, I. (2018). Traditional agriculture in transition: examining the impacts of
agricultural modernization on smallholder farming in Ghana under the new Green
Revolution. International Journal of Sustainable Development & World Ecology, 1–14.
https://doi.org/10.1080/13504509.2018.1491429
Kansanga, M. M. (2017). Who you know and when you plough? Social capital and
agricultural mechanization under the new green revolution in Ghana. International
Journal of Agricultural Sustainability, 15(6), 708–723.
https://doi.org/10.1080/14735903.2017.1399515
Lambrecht, I., & Asare, S. (2016). The complexity of local tenure systems: A smallholders’
perspective on tenure in Ghana. Land Use Policy, 58, 251–263.
https://doi.org/10.1016/j.landusepol.2016.07.029

F Cossar AES Conference 2019
Mandal, M. A. S., Biggs, S. D., & Justice, S. E. (2017). Rural Mechanzation: A Driver in
Agricultural Change and Rural Development. Dhaka, Bangladesh: Institute for Inclusive
Finance and Development.
Mano, Y. Y., Takahashi, K., & Otsuka, K. (2017). Contract Farming, Farm Mechanization,
and Agricultural intensification: The Case of Rice Farming in Cote d’Ivoire (discussion
paper No. E54). Retrieved from http://hias.ad.hit-u.ac.jp/
Masters, W. A., Djurfeldt, A. A., De Haan, C., Hazell, P., Jayne, T., Jirström, M., & Reardon,
T. (2013). Urbanization and farm size in Asia and Africa: Implications for food security
and agricultural research. Global Food Security, 2, 156–165.
https://doi.org/10.1016/j.gfs.2013.07.002
Minnesota Population Center. (2015). Integrated Public Use Microdata Series, International:
Version 6.4 [dataset]. Minneapolis, MN.
https://doi.org/http://doi.org/10.18128/D020.V6.4.
Morris, M., Kelly, V. A., Kopicki, R. J., & Byerlee, D. (2007). Fertilizer Use in African
Agriculture: Lessons Learned and Good Practice Guidelines. Washington, DC: The
World Bank. https://doi.org/10.1596/978-0-8213-6880-0
Mottaleb, K. A., Rahut, D. B., Ali, A., Gérard, B., & Erenstein, O. (2017). Enhancing
Smallholder Access to Agricultural Machinery Services: Lessons from Bangladesh.
Journal of Development Studies, 53(9), 1502–1517.
https://doi.org/10.1080/00220388.2016.1257116
Nin-Pratt, A., & McBride, L. (2014). Agricultural intensification in Ghana: Evaluating the
optimist’s case for a Green Revolution. Food Policy, 48, 153–167.
https://doi.org/10.1016/J.FOODPOL.2014.05.004
OCHA. (2009). Ghana: Flood Affected Population (as of 29 Sep 2009) - Ghana. Reliefweb.
Retrieved from https://reliefweb.int/map/ghana/ghana-flood-affected-population-29-sep-
2009
Palacios-Lopez, A., Christiaensen, L., & Kilic, T. (2017). How much of the labour in African
agriculture is provided by women? Food Policy, 67, 52–63.
https://doi.org/10.1016/j.foodpol.2016.09.017
F Cossar AES Conference 2019
Pingali, P. (2007). Chapter 54 Agricultural Mechanization: Adoption Patterns and Economic
Impact. Handbook of Agricultural Economics. https://doi.org/10.1016/S1574-
0072(06)03054-4
Pingali, P., Bigot, Y., & Binswanger, H. P. (1987). Agricultural Mechanization and the
Evolution of Farming Systems in Sub-Saharan Africa. Washington DC: World Bank.
https://doi.org/10.2307/1242114
Platteau, J. (1994). Behind the market stage where real societies exist ‐ part I: The role of
Quisumbing, A. R., Payongayong, E., Aidoo, J. B., & Otsuka, K. (2001). Women’s Land
Rights in the Transition to Individualized Ownership: Implications for Tree-Resource
Management in Western Ghana. Economic Development & Cultural Change, 50(1),
157. https://doi.org/10.1086/340011
Richards, P. (1985). Indigenous agricultural revolution: ecology and food production in West
Africa. Hutchinson.
Ruthenberg, H. (1980). Farming systems in the tropics. Oxford University Press.
Savastano, S., & Scandizzo, P. L. (2017). Farm Size and Productivity: A “Direct-Inverse-
Direct” Relationship (Policy Research Working Papers No. 8127). The World Bank.
https://doi.org/10.1596/1813-9450-8127
Singh, I., Squire, L., & Strauss, J. (1986). Agricultural household models: extensions,
applications, and policy. Johns Hopkins University Press.
Stock, J. H., & Yogo, M. (2002). Testing for Weak Instruments in Linear IV Regression.
NBER Working Paper, 284. Retrieved from http://www.nber.org/papers/T0284
Takeshima, H., Houssou, N., & Diao, X. (2018). Effects of tractor ownership on returns-to-
scale in agriculture: Evidence from maize in Ghana. Food Policy.
https://doi.org/10.1016/j.foodpol.2018.04.001
Theis, S., Lefore, N., Meinzen-Dick, R., & Bryan, E. (2018). What happens after technology
adoption? Gendered aspects of small-scale irrigation technologies in Ethiopia, Ghana,
and Tanzania. Agriculture and Human Values. https://doi.org/10.1007/s10460-018-
9862-8

F Cossar AES Conference 2019
UN News. (2009). Floods affect 600,000 people across West Africa, UN reports. Retrieved
April 24, 2018, from https://news.un.org/en/story/2009/09/311712-floods-affect-
600000-people-across-west-africa-un-reports
Wooldridge, J. M. (2010). Econometric Analysis of Cross Section and Panel Data. MIT
Press: Cambridge, MA, USA. MIT Press. https://doi.org/10.1515/humr.2003.021

F Cossar AES Conference 2019
Appendix: Tables and Figures
Table A 1: Treatment effects estimation using propensity score matching only
Productivity Scale of production
Yield (kg/ha)
Labour productivity (kg/day)
Output value per ha (cedis)
Output value per person day (cedis)
Area cultivated (ha)
Area cultivated - maize (%)
Area cultivated - female (%)
Tractor use 145.65*** 8.06*** 11.88 3.05*** 0.78*** 22.20*** -4.14
(51.77) (0.93) (25.63) (1.14) (0.22) (2.35) (8.18)
N 233 256 418 256 407 252 407
Labour days per ha Total labour days
land preparation
field management harvest
post-harvest
Female family
Male family
female labour share of family labour
hired share of total labour
Tractor use -18.79* -6.15*** 0.67 -0.09 29.56* 14.75 4.84 -2.05
(10.23) (2.03) (2.52) (1.48) (15.46) (39.75) (2.98) (3.42)
N 394 393 383 398 418 418 388 408
Note: Propensity score is calculated from logit regression of tractor use on land area owned by household, motorbike ownership, inward migration in last 5 years, main dwelling has a cement floor, household size, urban EA, age of household head, female headed household, district population density in 2000, length of growing period (district mean), travel time to nearest 50,000 populous town (district mean), and welfare index from 2003 (district mean). The sample is restricted to households in districts which were allocated government machinery before and after 2009 to keep comparable samples, although the instrumental variable is not used in this estimation.

F Cossar AES Conference 2019
Figure A 1: Map of treated and control districts
Source: IPUMS 2010 district boundaries; MOFA administrative data on AMSEC program; UN OCHA information on 2009 floods.

F Cossar AES Conference 2019
Figure A 2: Scatter plots of district variables by date of government allocation
Note: Vertical dashed line indicates May 2009 which marks the end of the plowing season. Each scatter point represents the mean value of the district variable for district which received government allocation in that month.
0.2
.4.6
.81
ele
ctio
nmar
gin
_200
4
May08Oct08 Mar09Aug09 Jan10Date of allocation
01
002
003
004
00p
opde
ns_
2000
May08Oct08 Mar09Aug09 Jan10Date of allocation
150
200
250
300
lgpa
vg
May08Oct08 Mar09Aug09 Jan10Date of allocation
23
45
6tt
50k
May08Oct08 Mar09Aug09 Jan10Date of allocation
14
15
16
17
we
lfare
inde
x
May08Oct08 Mar09Aug09 Jan10Date of allocation
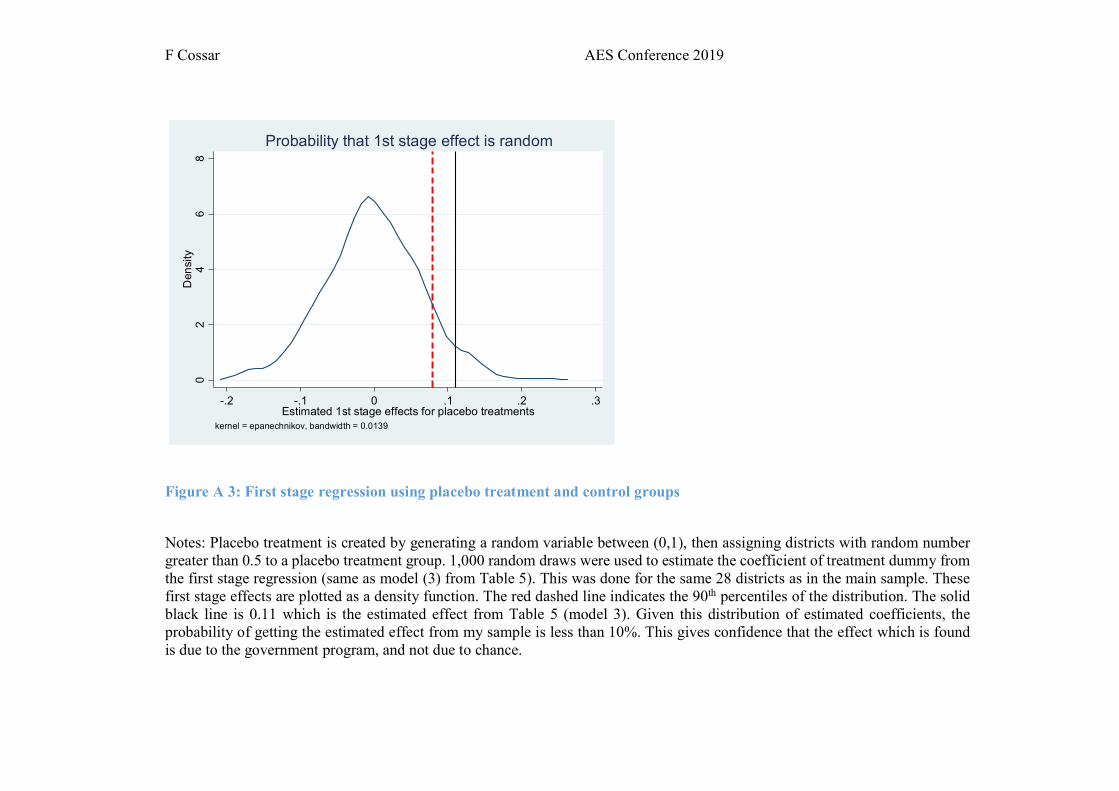
F Cossar AES Conference 2019
Figure A 3: First stage regression using placebo treatment and control groups
Notes: Placebo treatment is created by generating a random variable between (0,1), then assigning districts with random number greater than 0.5 to a placebo treatment group. 1,000 random draws were used to estimate the coefficient of treatment dummy from the first stage regression (same as model (3) from Table 5). This was done for the same 28 districts as in the main sample. These first stage effects are plotted as a density function. The red dashed line indicates the 90th percentiles of the distribution. The solid black line is 0.11 which is the estimated effect from Table 5 (model 3). Given this distribution of estimated coefficients, the probability of getting the estimated effect from my sample is less than 10%. This gives confidence that the effect which is found is due to the government program, and not due to chance.
02
46
8D
ensi
ty
-.2 -.1 0 .1 .2 .3Estimated 1st stage effects for placebo treatments
kernel = epanechnikov, bandwidth = 0.0139
Probability that 1st stage effect is random

F Cossar AES Conference 2019
Figure A 4: 90% Interval Estimates for treatment effect, with some endogeneity of instrument
Note: The figure represents the 90% confidence interval for the effect of tractor use on key outcome variables of interest (beta): area cultivated (ha), proportion of cultivated area with maize, proportion of cultivated area under female hh member control, labour person days per ha for land preparation and field management, and the total male labour person days for agricultural activities. The x-axis is different values of Gamma (𝛾), the potential values from the following model: 𝑦 = 𝛽𝑇 + 𝛾𝑍 + 𝛼𝑋 + 𝜀 where T is tractor use, Z is the instrument, and X are exogenous covariates. If the exclusion restriction is valid, then 𝛾 = 0. See Conley, Hansen and Rossi (2012) for details on the method. Graphs
-50
05
01
00b
eta
-50 0 50gamma
w_area_cult
-10
0-5
00
50
100
bet
a
-50 0 50gamma
area_maize_pc
-50
05
01
00b
eta
-50 0 50gamma
female_area_pc
-10
0-5
00
50
bet
a
-50 0 50gamma
w_lab_all_prep_ha-5
00
50
100
150
bet
a
-50 0 50gamma
w_lab_all_mnmgt_ha
-20
00
200
400
600
bet
a
-50 0 50gamma
lab_total_all_M

F Cossar AES Conference 2019
were generated using plausexog stata command, with the uci method and a specified range of values for 𝛾 between -50 and 50. The stata command was developed by Damian Clarke, University of Oxford.

F Cossar AES Conference 2019
Related Documents